Student Highlights -...
138
FACT BOOK 2006-07 STUDENT INFORMATION 9 Student Highlights Total headcount enrollment: 24,670 Five undergraduate programs with the largest number of students (excludes open option): Health & Exercise Science, Psychology, Construction Management, Biological Science and Art Five graduate programs with the largest number of students: Education & Human Resource Studies, Civil Engineering, Occupational Therapy, Chemistry and Computer Science Five home states for the largest number of nonresident students: California, Texas, Illinois, Minnesota, and Alaska Total new freshmen enrolled: 4,093 Total new transfer students: 1,367 Total new undergraduates enrolled: 5,460 College with the most new undergraduates: Liberal Arts with 640 Percent of transfer students previously enrolled in Colorado institutions: 60 Percent of students who are residents: 80 Percent of student population (excluding international students) who are ethnic minorities (self-reported): 12.6 Percent of undergraduate student population who are women: 52 Percent of undergraduate students who are 30 and over: 3 Although 18,801undergraduates were taking 12 or more credit hours and were considered full-time for financial aid purposes, only 10,939 undergraduates were taking 15 or more credit hours, which is the number required for graduation in four years. Percent of undergraduate student population who were enrolled part time: 8.3 Total student credit hour production for the academic year 2005-06: 635,705.6 Total student full-time equivalent (FTE) for the academic year 2005-06: 21,190.2 College with the highest average undergraduate term GPA for fall 2006: Business with 3.1 Number of degrees awarded in 2005-06: 5,780 Percentage of undergraduate classes with fewer than 20 students in fall 2005: 38 Percentage of undergraduate classes with more than 50 students in fall 2005: 17 Note: Student highlights are for fall term 2006 (unless otherwise noted).
Transcript of Student Highlights -...
Student Highlights
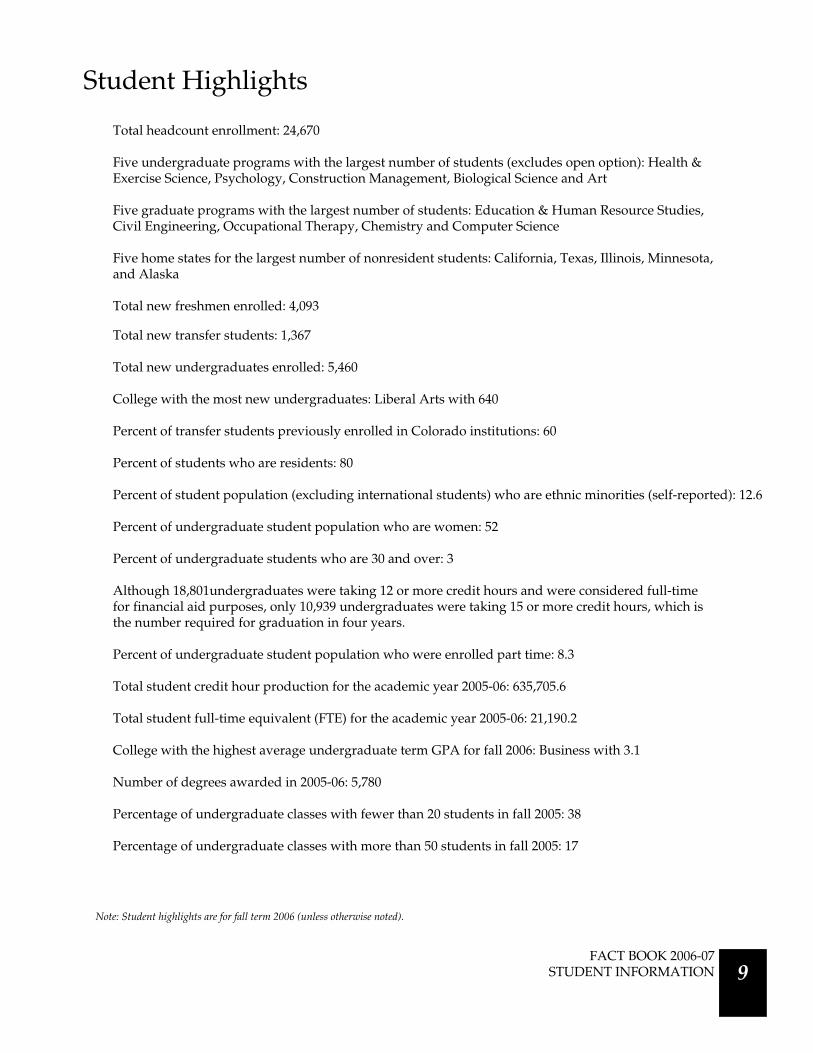
Total headcount enrollment: 24,670
Five undergraduate programs with the largest number of students (excludes open option): Health &Exercise Science, Psychology, Construction Management, Biological Science and Art
Five graduate programs with the largest number of students: Education & Human Resource Studies,Civil Engineering, Occupational Therapy, Chemistry and Computer Science
Five home states for the largest number of nonresident students: California, Texas, Illinois, Minnesota,and Alaska
Total new freshmen enrolled: 4,093
Total new transfer students: 1,367
Total new undergraduates enrolled: 5,460
College with the most new undergraduates: Liberal Arts with 640
Percent of transfer students previously enrolled in Colorado institutions: 60
Percent of students who are residents: 80
Percent of student population (excluding international students) who are ethnic minorities (self-reported): 12.6
Percent of undergraduate student population who are women: 52
Percent of undergraduate students who are 30 and over: 3
Although 18,801undergraduates were taking 12 or more credit hours and were considered full-timefor financial aid purposes, only 10,939 undergraduates were taking 15 or more credit hours, which isthe number required for graduation in four years.
Percent of undergraduate student population who were enrolled part time: 8.3
Total student credit hour production for the academic year 2005-06: 635,705.6
Total student full-time equivalent (FTE) for the academic year 2005-06: 21,190.2
College with the highest average undergraduate term GPA for fall 2006: Business with 3.1
Number of degrees awarded in 2005-06: 5,780
Percentage of undergraduate classes with fewer than 20 students in fall 2005: 38
Percentage of undergraduate classes with more than 50 students in fall 2005: 17
Note: Student highlights are for fall term 2006 (unless otherwise noted).
FACT BOOK 2006-07STUDENT INFORMATION 9

0 2,000 4,000 6,000
Warner College of Natural Resources
Agricultural Sciences
Veterinary Medicine & Biomedical Sciences
Engineering
Business
Intra-University
Natural Sciences
Applied Human Sciences
Liberal Arts
Professional Students
Graduate Students
Undergraduate Students
Student Majors
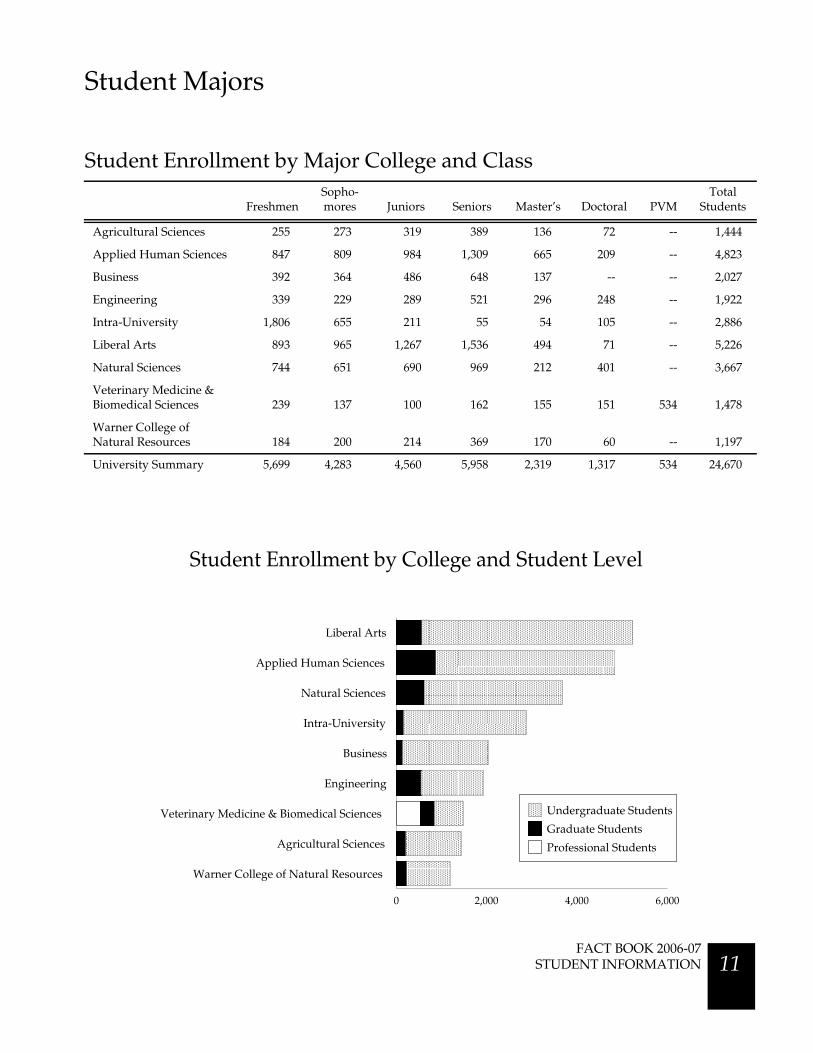
Student Enrollment by Major College and Class
FreshmenSopho-mores Juniors Seniors Master’s Doctoral PVM
TotalStudents
Agricultural Sciences 255 273 319 389 136 72 -- 1,444
Applied Human Sciences 847 809 984 1,309 665 209 -- 4,823
Business 392 364 486 648 137 -- -- 2,027
Engineering 339 229 289 521 296 248 -- 1,922
Intra-University 1,806 655 211 55 54 105 -- 2,886
Liberal Arts 893 965 1,267 1,536 494 71 -- 5,226
Natural Sciences 744 651 690 969 212 401 -- 3,667
Veterinary Medicine &Biomedical Sciences 239 137 100 162 155 151 534 1,478
Warner College ofNatural Resources 184 200 214 369 170 60 -- 1,197
University Summary 5,699 4,283 4,560 5,958 2,319 1,317 534 24,670
Student Enrollment by College and Student Level
FACT BOOK 2006-07STUDENT INFORMATION 11
Student Majors
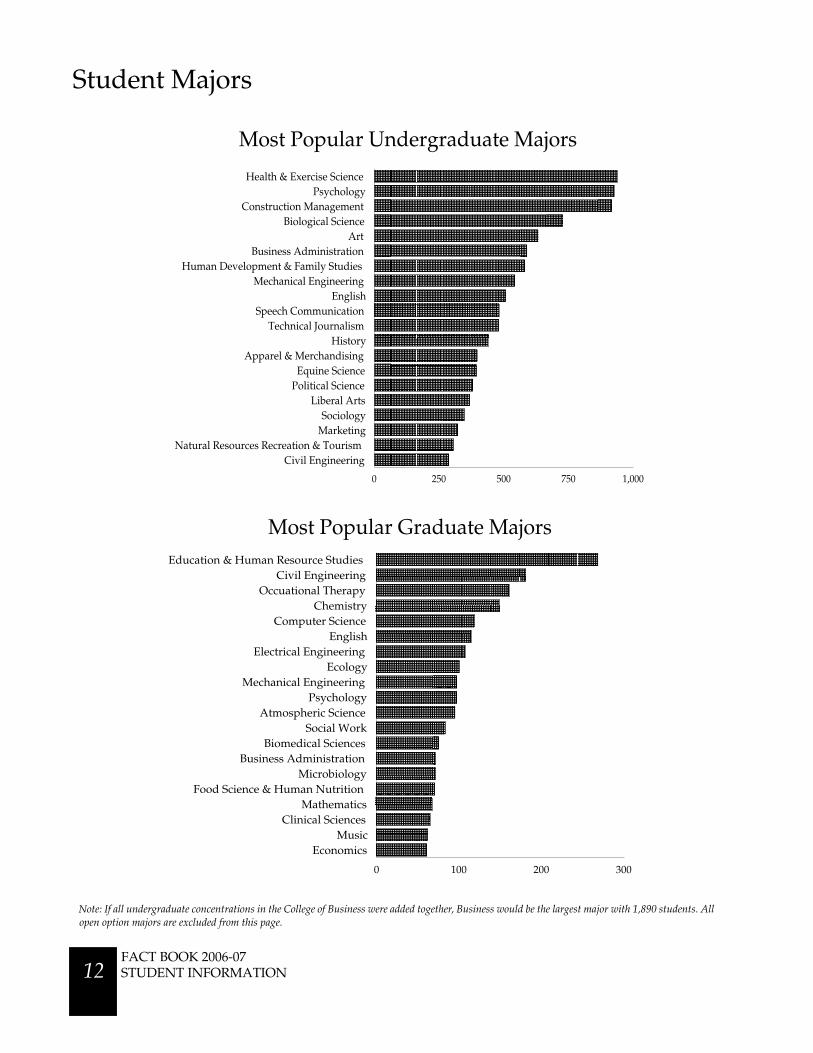
0 250 500 750 1,000
Civil EngineeringNatural Resources Recreation & Tourism
MarketingSociology
Liberal ArtsPolitical Science
Equine ScienceApparel & Merchandising
HistoryTechnical Journalism
Speech CommunicationEnglish
Mechanical EngineeringHuman Development & Family Studies
Business AdministrationArt
Biological ScienceConstruction Management
PsychologyHealth & Exercise Science
Most Popular Undergraduate Majors
0 100 200 300
EconomicsMusic
Clinical SciencesMathematics
Food Science & Human NutritionMicrobiology
Business AdministrationBiomedical Sciences
Social WorkAtmospheric Science
PsychologyMechanical Engineering
EcologyElectrical Engineering
EnglishComputer Science
ChemistryOccuational Therapy
Civil EngineeringEducation & Human Resource Studies
Most Popular Graduate Majors
Note: If all undergraduate concentrations in the College of Business were added together, Business would be the largest major with 1,890 students. Allopen option majors are excluded from this page.
FACT BOOK 2006-07STUDENT INFORMATION 12
Student Majors
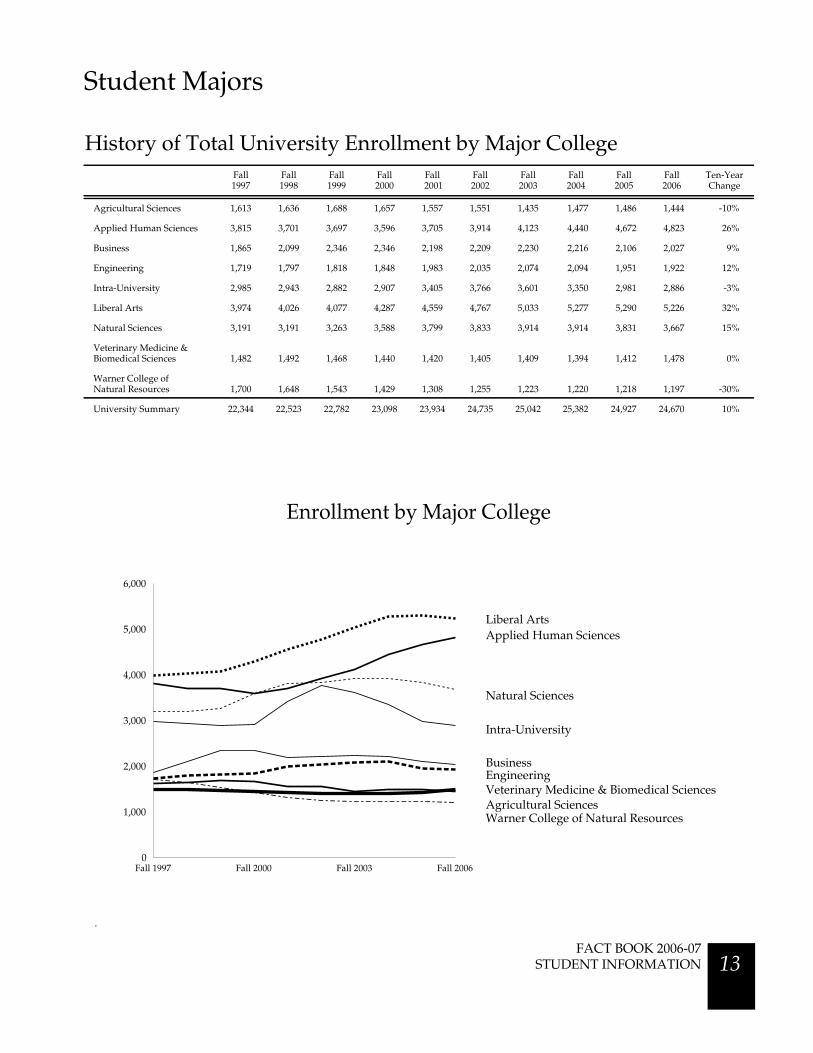
History of Total University Enrollment by Major CollegeFall1997
Fall1998
Fall1999
Fall2000
Fall 2001
Fall2002
Fall2003
Fall2004
Fall2005
Fall2006
Ten-YearChange
Agricultural Sciences 1,613 1,636 1,688 1,657 1,557 1,551 1,435 1,477 1,486 1,444 -10%
Applied Human Sciences 3,815 3,701 3,697 3,596 3,705 3,914 4,123 4,440 4,672 4,823 26%
Business 1,865 2,099 2,346 2,346 2,198 2,209 2,230 2,216 2,106 2,027 9%
Engineering 1,719 1,797 1,818 1,848 1,983 2,035 2,074 2,094 1,951 1,922 12%
Intra-University 2,985 2,943 2,882 2,907 3,405 3,766 3,601 3,350 2,981 2,886 -3%
Liberal Arts 3,974 4,026 4,077 4,287 4,559 4,767 5,033 5,277 5,290 5,226 32%
Natural Sciences 3,191 3,191 3,263 3,588 3,799 3,833 3,914 3,914 3,831 3,667 15%
Veterinary Medicine &Biomedical Sciences 1,482 1,492 1,468 1,440 1,420 1,405 1,409 1,394 1,412 1,478 0%
Warner College ofNatural Resources 1,700 1,648 1,543 1,429 1,308 1,255 1,223 1,220 1,218 1,197 -30%
University Summary 22,344 22,523 22,782 23,098 23,934 24,735 25,042 25,382 24,927 24,670 10%
Veterinary Medicine & Biomedical Sciences
Business
Natural Sciences
Liberal ArtsApplied Human Sciences
Agricultural Sciences
Intra-University
Engineering
.
Enrollment by Major College
Fall 1997 Fall 2000 Fall 2003 Fall 20060
1,000
2,000
3,000
4,000
5,000
6,000
Warner College of Natural Resources
FACT BOOK 2006-07STUDENT INFORMATION 13

Student Majors
History of Undergraduate Enrollment by Major CollegeFall1997
Fall1998
Fall1999
Fall2000
Fall2001
Fall2002
Fall2003
Fall2004
Fall2005
Fall2006
Ten-YearChange
Agricultural Sciences 1,393 1,413 1,455 1,406 1,331 1,324 1,202 1,247 1,267 1,236 -11%
Applied Human Sciences 3,201 3,113 3,025 2,896 2,987 3,129 3,267 3,525 3,790 3,949 23%
Business 1,599 1,782 2,070 2,120 2,007 2,031 2,047 2,062 1,962 1,890 18%
Engineering 1,193 1,292 1,324 1,374 1,474 1,497 1,470 1,515 1,405 1,378 16%
Intra-University 2,755 2,717 2,658 2,651 3,153 3,521 3,346 3,112 2,821 2,727 -1%
Liberal Arts 3,508 3,580 3,610 3,825 4,082 4,247 4,467 4,704 4,720 4,661 33%
Natural Sciences 2,702 2,686 2,754 3,042 3,247 3,276 3,321 3,352 3,236 3,054 13%
Veterinary Medicine &Biomedical Sciences 686 660 627 593 568 525 565 547 550 638 -7%
Warner College ofNatural Resources 1,414 1,364 1,277 1,168 1,050 1,018 993 985 969 967 -32%
University Summary 18,451 18,607 18,800 19,075 19,899 20,568 20,678 21,049 20,720 20,500 11%
Liberal Arts
Intra-University
Natural Sciences
Veterinary Medicine & Biomedical Sciences
EngineeringAgricultural Sciences
Business
Applied Human Sciences
Undergraduate Enrollment by Major College
Warner College of Natural Resources
Fall 1997 Fall 2000 Fall 2003 Fall 20060
1,000
2,000
3,000
4,000
5,000
FACT BOOK 2006-07STUDENT INFORMATION 14

Student Majors
History of Graduate Enrollment by Major CollegeFall1997
Fall1998
Fall1999
Fall2000
Fall2001
Fall2002
Fall2003
Fall2004
Fall2005
Fall2006
Ten-YearChange
Agricultural Sciences 220 223 233 251 226 227 233 230 219 208 -5%
Applied Human Sciences 614 588 672 700 718 785 856 915 882 874 42%
Business 266 317 276 226 191 178 183 154 144 137 -48%
Engineering 526 505 494 474 509 538 604 579 546 544 3%
Intra-University 230 226 224 256 252 245 255 238 160 159 -31%
Liberal Arts 466 446 467 462 477 520 566 573 570 565 21%
Natural Sciences 489 505 509 546 552 557 593 562 595 613 25%
Veterinary Medicine &Biomedical Sciences 264 286 311 318 324 343 317 309 325 306 16%
Warner College ofNatural Resources 286 284 266 261 258 237 230 235 249 230 -20%
University Summary 3,361 3,380 3,452 3,494 3,507 3,630 3,837 3,795 3,690 3,636 8%
Graduate Enrollment by Major College
Fall 1997 Fall 2000 Fall 2003 Fall 20060
200
400
600
800
1,000
Applied Human Sciences
Natural Sciences
EngineeringLiberal Arts
Intra-University
Warner College of Natural ResourcesAgricultural Sciences
Business
Veterinary Medicine & Biomedical Sciences
FACT BOOK 2006-07STUDENT INFORMATION 15
Fall 1997 Fall 2000 Fall 2003 Fall 20060
2,000
4,000
6,000
8,000
Student Majors
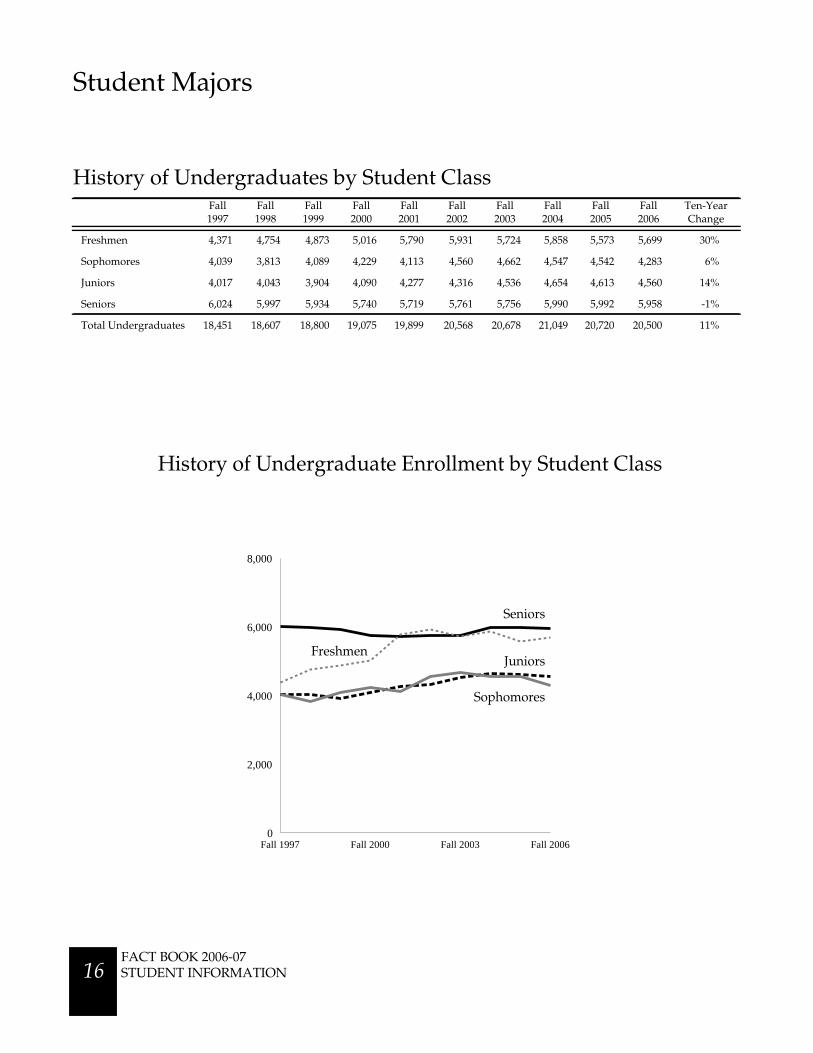
History of Undergraduates by Student ClassFall1997
Fall1998
Fall1999
Fall2000
Fall2001
Fall2002
Fall2003
Fall2004
Fall2005
Fall2006
Ten-YearChange
Freshmen 4,371 4,754 4,873 5,016 5,790 5,931 5,724 5,858 5,573 5,699 30%
Sophomores 4,039 3,813 4,089 4,229 4,113 4,560 4,662 4,547 4,542 4,283 6%
Juniors 4,017 4,043 3,904 4,090 4,277 4,316 4,536 4,654 4,613 4,560 14%
Seniors 6,024 5,997 5,934 5,740 5,719 5,761 5,756 5,990 5,992 5,958 -1%
Total Undergraduates 18,451 18,607 18,800 19,075 19,899 20,568 20,678 21,049 20,720 20,500 11%
History of Undergraduate Enrollment by Student Class
Seniors
FreshmenJuniors
Sophomores
FACT BOOK 2006-07STUDENT INFORMATION 16
Fall 1997 Fall 2000 Fall 2003 Fall 20060
1,000
2,000
3,000
Student Majors
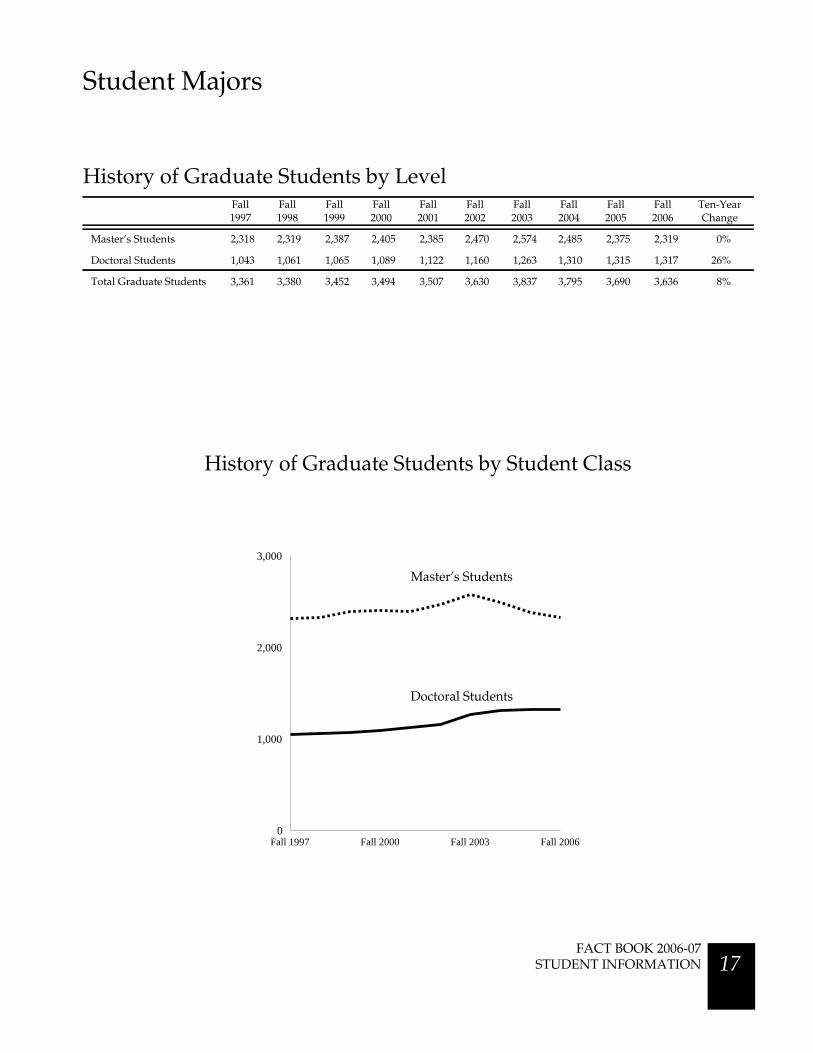
History of Graduate Students by LevelFall1997
Fall1998
Fall1999
Fall2000
Fall2001
Fall2002
Fall2003
Fall2004
Fall2005
Fall2006
Ten-YearChange
Master’s Students 2,318 2,319 2,387 2,405 2,385 2,470 2,574 2,485 2,375 2,319 0%
Doctoral Students 1,043 1,061 1,065 1,089 1,122 1,160 1,263 1,310 1,315 1,317 26%
Total Graduate Students 3,361 3,380 3,452 3,494 3,507 3,630 3,837 3,795 3,690 3,636 8%
History of Graduate Students by Student Class
Master’s Students
Doctoral Students
FACT BOOK 2006-07STUDENT INFORMATION 17
Student Majors
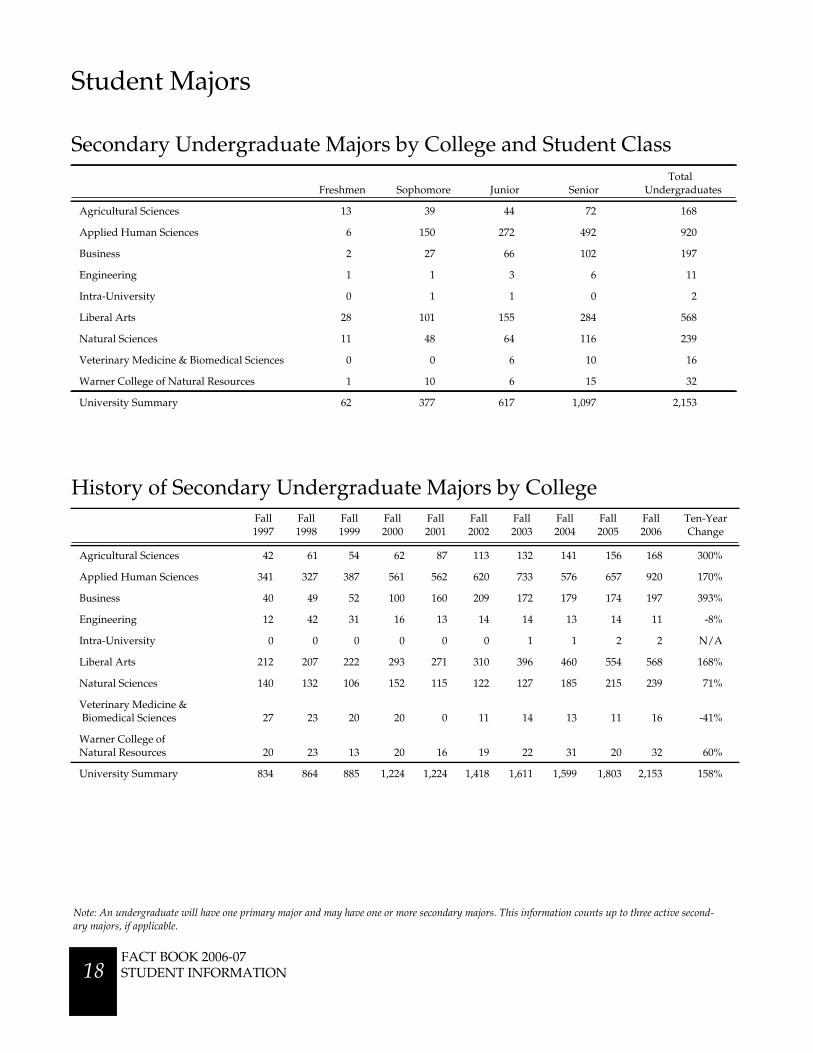
Secondary Undergraduate Majors by College and Student Class
History of Secondary Undergraduate Majors by College
Freshmen Sophomore Junior SeniorTotal
Undergraduates
Agricultural Sciences 13 39 44 72 168
Applied Human Sciences 6 150 272 492 920
Business 2 27 66 102 197
Engineering 1 1 3 6 11
Intra-University 0 1 1 0 2
Liberal Arts 28 101 155 284 568
Natural Sciences 11 48 64 116 239
Veterinary Medicine & Biomedical Sciences 0 0 6 10 16
Warner College of Natural Resources 1 10 6 15 32
University Summary 62 377 617 1,097 2,153
Fall1997
Fall1998
Fall1999
Fall2000
Fall2001
Fall2002
Fall2003
Fall2004
Fall2005
Fall2006
Ten-YearChange
Agricultural Sciences 42 61 54 62 87 113 132 141 156 168 300%
Applied Human Sciences 341 327 387 561 562 620 733 576 657 920 170%
Business 40 49 52 100 160 209 172 179 174 197 393%
Engineering 12 42 31 16 13 14 14 13 14 11 -8%
Intra-University 0 0 0 0 0 0 1 1 2 2 N/A
Liberal Arts 212 207 222 293 271 310 396 460 554 568 168%
Natural Sciences 140 132 106 152 115 122 127 185 215 239 71%
Veterinary Medicine & Biomedical Sciences 27 23 20 20 0 11 14 13 11 16 -41%
Warner College ofNatural Resources 20 23 13 20 16 19 22 31 20 32 60%
University Summary 834 864 885 1,224 1,224 1,418 1,611 1,599 1,803 2,153 158%
Note: An undergraduate will have one primary major and may have one or more secondary majors. This information counts up to three active second-ary majors, if applicable.
FACT BOOK 2006-07STUDENT INFORMATION 18

Student Majors
History of Student EnrollmentYear Enrollment Year Enrollment Year Enrollment Year Enrollment Year Enrollment Year Enrollment
1953 3,545 1963 8,460 1973 16,860 1983 18,295 1993 21,110 2003 25,042
1954 3,987 1964 10,185 1974 16,798 1984 18,094 1994 21,461 2004 25,382
1955 4,505 1965 11,848 1975 16,809 1985 18,084 1995 21,914 2005 24,947
1956 4,996 1966 12,701 1976 17,426 1986 18,381 1996 21,970 2006 24,670
1957 5,282 1967 14,565 1977 17,812 1987 19,192 1997 22,344
1958 5,593 1968 15,361 1978 18,223 1988 19,885 1998 22,523
1959 5,977 1969 16,252 1979 18,255 1989 20,149 1999 22,782
1960 6,131 1970 17,045 1980 18,083 1990 20,795 2000 23,098
1961 6,519 1971 17,608 1981 18,651 1991 20,967 2001 23,934
1962 7,304 1972 16,656 1982 18,909 1992 21,210 2002 24,735
1956 1966 1976 1986 1996 20060
4,000
8,000
12,000
16,000
20,000
24,000
28,000
Fifty-Year History of Enrollment
FACT BOOK 2006-07STUDENT INFORMATION 19

0 20,000 40,000 60,000
Oregon State University
Oklahoma State University
Washington State University
Iowa State University
North Carolina State University
University of Colorado, Boulder
Purdue University
University of Illinois, Urbana-Champaign
Texas A & M University
Michigan State University
Ohio State University
Professional Students
Graduate Students
Undergraduate Students
Student Majors
Colorado State University
Comparison of Peer InstitutionsStudents by Level - Fall Term 2005
FACT BOOK 2006-07STUDENT INFORMATION 20
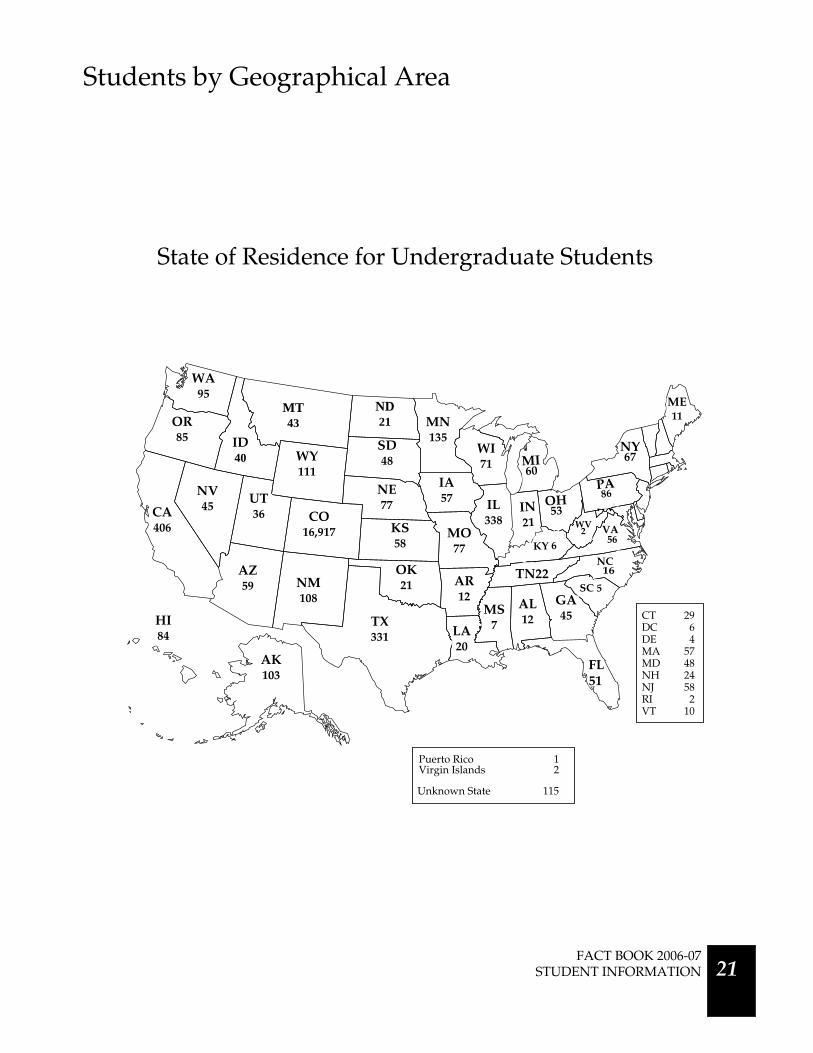
Students by Geographical Area
WV
TN3
ND21
MT43OR
85 ID40
CA406
NV45
SD48
AZ59
UT36
NM108
WY111
NE77
KS58
OK21
TX331
MN135
MO77
MS7
GA45
WI71
AR12
IL338CO
16,917
NY67
HI84
AK103
ME11
Puerto Rico 1Virgin Islands 2
CT 29DC 6DE 4MA 57MD 48NH 24NJ 58RI 2VT 10
Unknown State 115
LA20
State of Residence for Undergraduate Students
IA57
WA95
AL12
IN21
VA
MI60
OH53
56
NC16
PA86
SC 5
FL51
KY 6
WV2
TN22
FACT BOOK 2006-07 STUDENT INFORMATION 21

Students by Geographical Area
Adams 642 Fremont 58 Morgan 87Alamosa 24 Garfield 160 Otero 49Arapahoe 1,996 Gilpin 8 Ouray 5Archuleta 19 Grand 61 Park 33Baca 21 Gunnison 49 Phillips 22Bent 7 Hinsdale 1 Pitkin 29Boulder 1,091 Huerfano 11 Prowers 47Broomfield 156 Jackson 8 Pueblo 247Chaffee 48 Jefferson 2,143 Rio Blanco 22Cheyenne 15 Kiowa 2 Rio Grande 42Clear Creek 19 Kit Carson 38 Routt 105Conejos 15 Lake 12 Saguache 14Costilla 7 LaPlata 134 San Juan 3Crowley 7 Larimer 3,770 San Miguel 11Custer 15 Las Animas 26 Sedgwick 9Delta 75 Lincoln 27 Summit 77Denver 577 Logan 91 Teller 72Dolores 7 Mesa 283 Washington 24Douglas 1,165 Mineral 0 Weld 889Eagle 115 Moffat 40 Yuma 52Elbert 118 Montezuma 56El Paso 1,822 Montrose 109
0 1,000 2,000 3,000 4,000
Pueblo
Mesa
Denver
Adams
Weld
Boulder
Douglas
El Paso
Arapahoe
Jefferson
Larimer
Total = 16,917Not Reported: 30
Resident Undergraduates by Colorado County
Top Ten Colorado Counties of Residence for Resident Undergraduates
Note: County listed is county of residence upon entrance to CSU.
FACT BOOK 2006-07STUDENT INFORMATION 22

Students by Geographical Area
Twenty States with Highest Nonresident Undergraduate EnrollmentFall1997
Fall1998
Fall1999
Fall2000
Fall2001
Fall2002
Fall2003
Fall2004
Fall2005
Fall2006
Ten-YearChange
California 472 440 389 333 340 318 323 359 400 406 -14%
Illinois 314 293 338 329 344 347 342 369 338 338 8%
Texas 198 181 222 285 349 393 399 406 364 331 67%
Minnesota 122 112 126 110 99 117 113 122 131 135 11%
Wyoming 83 73 118 130 139 135 114 131 129 111 34%
New Mexico 159 146 150 143 161 171 170 156 124 108 -32%
Alaska 96 91 96 101 119 122 121 111 100 103 7%
Washington 52 48 75 68 86 86 82 108 92 95 83%
Pennsylvania 105 89 95 87 75 82 85 91 90 86 -18%
Oregon 52 51 65 73 80 85 93 102 92 85 63%
Hawaii 131 125 146 140 122 107 103 92 93 84 -36%
Nebraska 110 105 124 112 143 137 115 111 96 77 8%
Missouri 71 69 89 75 108 106 91 93 86 77 -30%
Wisconsin 74 68 73 98 99 99 84 71 63 71 -4%
New York 148 134 116 101 86 77 70 61 51 67 -55%
Michigan 66 61 73 82 82 100 92 67 66 60 -9%
Arizona 70 62 67 62 71 64 75 76 78 59 -16%
Kansas 54 44 65 79 76 73 74 72 64 58 7%
New Jersey 106 91 78 64 72 64 48 48 58 58 -45%
Iowa 54 58 73 64 88 77 74 67 54 57 6%
Massachusetts 77 61 71 54 56 66 61 64 58 57 -26%
Undergraduatesfrom 20 States withthe Largest Numberof Students
2,614 2,402 2,649 2,590 2,795 2,826 2,820 2,777 2,627 2,523 -3%
All UndergraduateNonresidents 3,712 3,671 3,682 3,667 3,853 3,860 3,720 3,673 3,479 3,358 -10%
Top 20 States as aPercent of TotalNonresidentUndergraduateEnrollment
70% 65% 72% 71% 73% 73% 76% 76% 76% 75% 5%
Note: International students are excluded from the all undergraduate nonresidents total.
FACT BOOK 2006-07 STUDENT INFORMATION 23

Students by Geographical Area
International Students by CountryUndergraduate Graduate Undergraduate Graduate Undergraduate Graduate
Albania 0 1 Iceland 0 1 Portugal 0 1
Argentina 0 7 India 10 93 Qatar 14 0
Australia 13 1 Indonesia 2 4 Romania 1 5
Azerbaijan 0 1 Iran 0 4 Russia 0 5
Bahrain 2 0 Ireland 0 1 Saudi Arabia 63 20
Belarus 0 1 Israel 0 2 Singapore 1 0
Belgium 1 0 Italy 0 4 Slovakia 0 1
Belize 0 3 Jamaica 0 1 South Africa 1 6
Bosnia-Herzegovina 0 1 Japan 15 20 South Korea 18 52
Botswana 0 1 Jordan 0 7 Spain 0 3
Brazil 4 7 Kazakhstan 6 6 Sri Lanka 1 0
Bulgaria 0 1 Kenya 0 1 Sweden 1 2
Burma-Myanmar 1 0 Kuwait 9 7 Switzerland 0 1
Cameroon 0 1 Macedonia 0 2 Taiwan 14 25
Canada 12 6 Malaysia 3 0 Tanzania 0 4
Chile 1 3 Mali 1 0 Thailand 2 21
China 10 90 Mexico 8 12 Turkey 1 9
Columbia 1 6 Mongolia 2 4 Uganda 0 1
Costa Rica 0 4 Morocco 2 1 Ukraine 0 2
Egypt 0 6 Mozambique 0 1 United Arab Emirates 8 0
El Salvador 0 1 Nepal 3 2 United Kingdom 11 4
Estonia 0 1 Netherlands 1 0 Venezuela 3 2
Ethiopia 1 0 N. Zealand 1 0 Vietnam 0 14
France 1 1 Nigeria 2 0 West Bank 0 1
Gaza Strip 0 1 Norway 3 0 Yemen/Sanaa 1 0
Germany 4 12 Oman 1 1 Zambia 1 0
Ghana 2 1 Pakistan 0 1 Unknown 1 0
Greece 0 1 Peru 1 1 Total 269 520
Guinea 1 0 Philippines 0 3
Hong Kong 2 2 Poland 1 2
Total International Students = 789 from 86 Countries
Note: Graduate international students includes 3 PVM students.
FACT BOOK 2006-07STUDENT INFORMATION 24
Students by Geographical Area
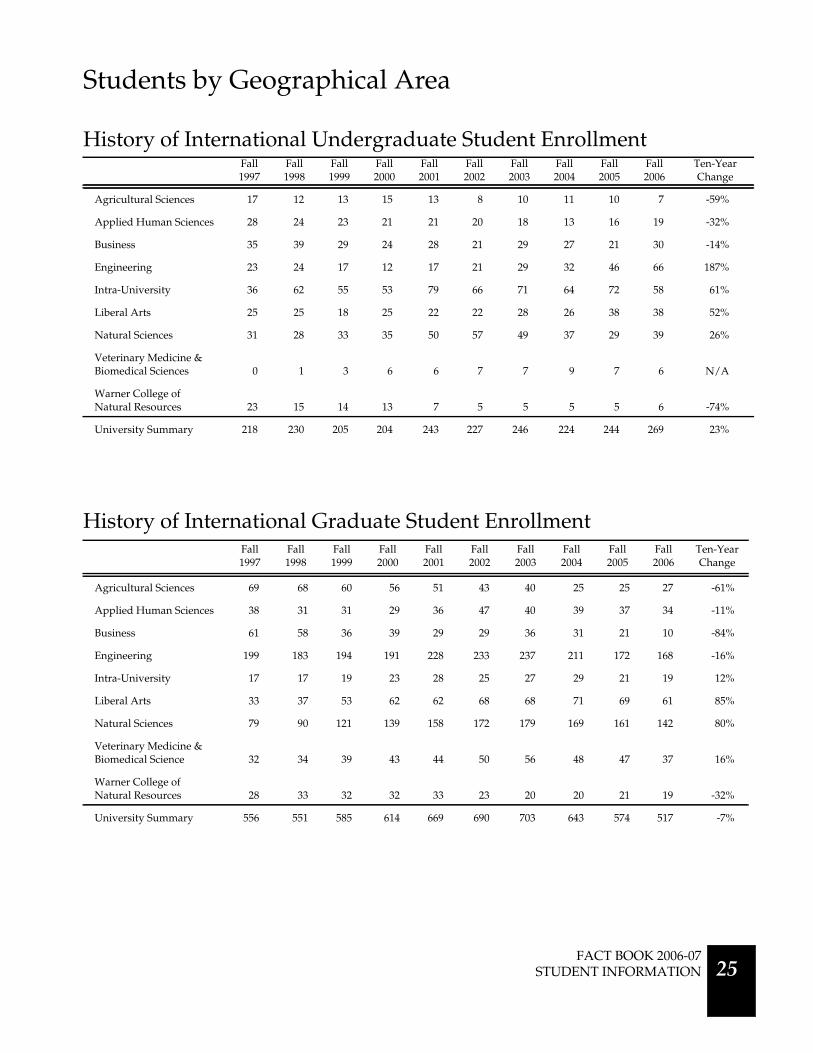
History of International Undergraduate Student Enrollment
History of International Graduate Student Enrollment
Fall1997
Fall1998
Fall1999
Fall2000
Fall2001
Fall2002
Fall2003
Fall2004
Fall2005
Fall2006
Ten-YearChange
Agricultural Sciences 17 12 13 15 13 8 10 11 10 7 -59%
Applied Human Sciences 28 24 23 21 21 20 18 13 16 19 -32%
Business 35 39 29 24 28 21 29 27 21 30 -14%
Engineering 23 24 17 12 17 21 29 32 46 66 187%
Intra-University 36 62 55 53 79 66 71 64 72 58 61%
Liberal Arts 25 25 18 25 22 22 28 26 38 38 52%
Natural Sciences 31 28 33 35 50 57 49 37 29 39 26%
Veterinary Medicine &Biomedical Sciences 0 1 3 6 6 7 7 9 7 6 N/A
Warner College ofNatural Resources 23 15 14 13 7 5 5 5 5 6 -74%
University Summary 218 230 205 204 243 227 246 224 244 269 23%
Fall1997
Fall1998
Fall1999
Fall2000
Fall2001
Fall2002
Fall2003
Fall2004
Fall2005
Fall2006
Ten-YearChange
Agricultural Sciences 69 68 60 56 51 43 40 25 25 27 -61%
Applied Human Sciences 38 31 31 29 36 47 40 39 37 34 -11%
Business 61 58 36 39 29 29 36 31 21 10 -84%
Engineering 199 183 194 191 228 233 237 211 172 168 -16%
Intra-University 17 17 19 23 28 25 27 29 21 19 12%
Liberal Arts 33 37 53 62 62 68 68 71 69 61 85%
Natural Sciences 79 90 121 139 158 172 179 169 161 142 80%
Veterinary Medicine &Biomedical Science 32 34 39 43 44 50 56 48 47 37 16%
Warner College ofNatural Resources 28 33 32 32 33 23 20 20 21 19 -32%
University Summary 556 551 585 614 669 690 703 643 574 517 -7%
FACT BOOK 2006-07 STUDENT INFORMATION 25

Students by Geographical Area
0% 2% 4% 6% 8% 10%
University of Illinois, Urbana-Champaign
University of Colorado, Boulder
Oregon State University
Washington State University
North Carolina State University
Michigan State University
Oklahoma State University
Ohio State University
Texas A & M University
Iowa State University
Colorado State University
0 50 100 150
United Kingdom
Kuwait
Germany
Canada
Mexico
Thailand
Japan
Taiwan
South Korea
Saudi Arabia
China
India
Undergraduate Students
Graduate Students
Top Ten Countries of Origin for International Students
Comparison of Peer InstitutionsInternational Students as a Percent of All Students
FACT BOOK 2006-07STUDENT INFORMATION 26
New Undergraduate Students
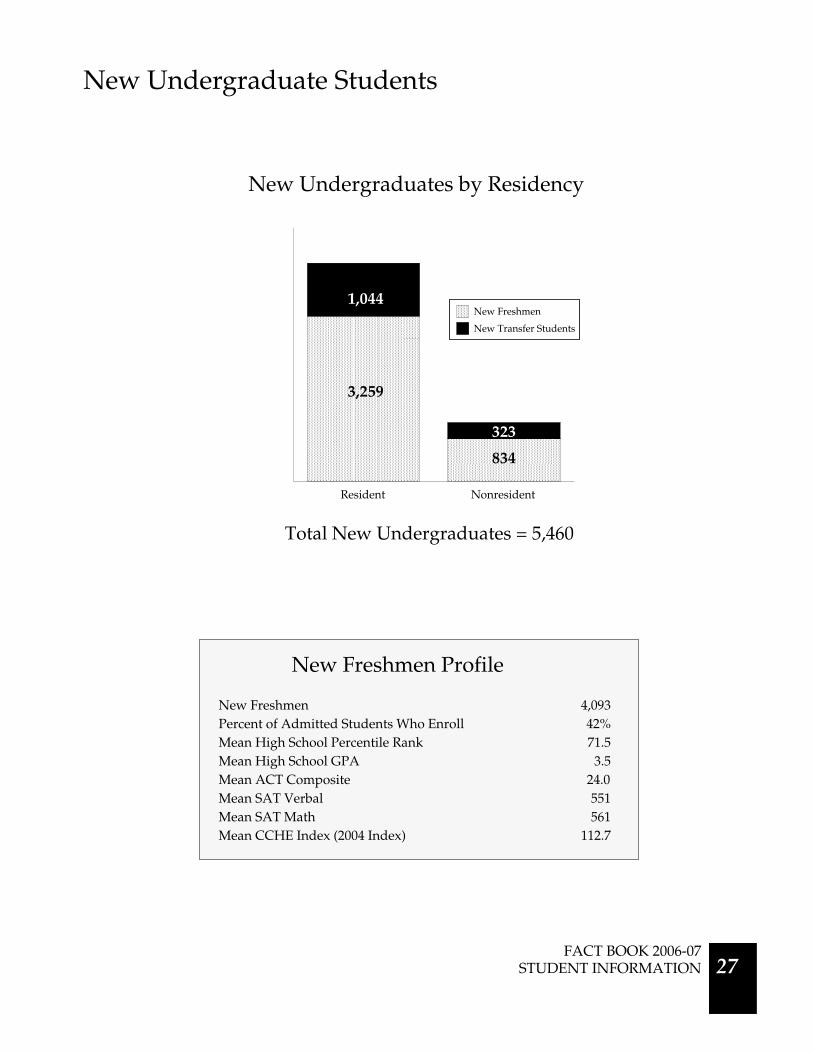
New Freshmen 4,093Percent of Admitted Students Who Enroll 42%Mean High School Percentile Rank 71.5Mean High School GPA 3.5Mean ACT Composite 24.0Mean SAT Verbal 551Mean SAT Math 561Mean CCHE Index (2004 Index) 112.7
New Freshmen Profile
Resident Nonresident0
1,000
2,000
3,000
4,000
5,000
New Freshmen
New Transfer Students
Total New Undergraduates = 5,460
New Undergraduates by Residency
3,259
1,044
834
323
FACT BOOK 2006-07STUDENT INFORMATION 27

New Undergraduate Students
History of First-Time Freshmen Enrollment
Fall 2001 Fall 2002 Fall 2003 Fall 2004 Fall 2005 Fall 2006Six-YearChange
Men 1,648 1,692 1,747 1,848 1,658 1,759 7%
Women 2,072 2,137 2,055 2,230 2,235 2,334 13%
Full-Time 3,637 3,760 3,745 4,023 3,840 4,010 10%
Part-Time 83 69 57 55 53 83 0%
Resident 2,806 2,907 2,950 3,212 3,156 3,259 16%
Nonresident 914 922 852 866 737 834 -9%
Minority 476 509 464 516 542 600 26%
Nonminority 3,244 3,320 3,338 3,562 3,351 3,493 8%
Total First-Time Freshmen 3,720 3,829 3,802 4,078 3,893 4,093 10%
35%
25%
10%
3%
27%
Non-ColoradoTwo-Year Institutions
10%
ColoradoFour-Year Institutions
25%
Non-Colorado
27%Four-Year InstitutionsColorado
Two-Year Institutions35%
Total Transfers = 1,367
Previous Institutions for Transfer Students
Unknown3%
FACT BOOK 2006-07STUDENT INFORMATION 28
New Undergraduate Students
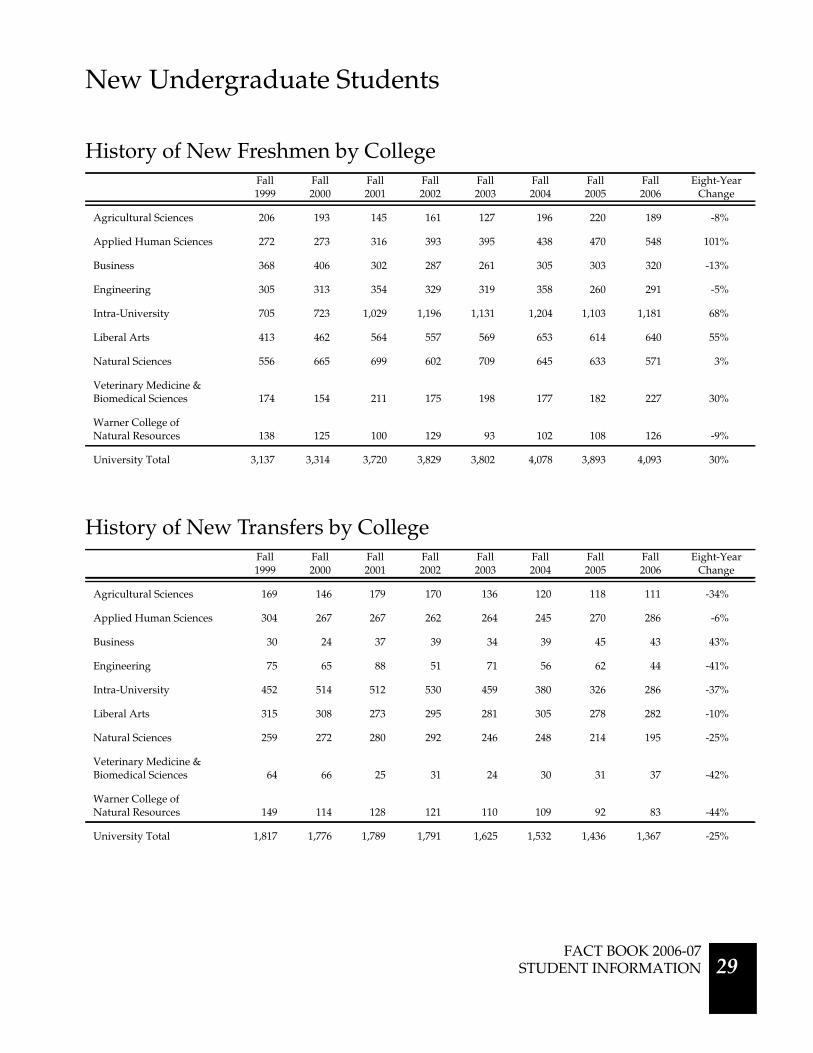
History of New Freshmen by College
History of New Transfers by College
Fall1999
Fall2000
Fall2001
Fall2002
Fall2003
Fall2004
Fall2005
Fall2006
Eight-YearChange
Agricultural Sciences 206 193 145 161 127 196 220 189 -8%
Applied Human Sciences 272 273 316 393 395 438 470 548 101%
Business 368 406 302 287 261 305 303 320 -13%
Engineering 305 313 354 329 319 358 260 291 -5%
Intra-University 705 723 1,029 1,196 1,131 1,204 1,103 1,181 68%
Liberal Arts 413 462 564 557 569 653 614 640 55%
Natural Sciences 556 665 699 602 709 645 633 571 3%
Veterinary Medicine &Biomedical Sciences 174 154 211 175 198 177 182 227 30%
Warner College ofNatural Resources 138 125 100 129 93 102 108 126 -9%
University Total 3,137 3,314 3,720 3,829 3,802 4,078 3,893 4,093 30%
Fall1999
Fall2000
Fall2001
Fall2002
Fall2003
Fall2004
Fall2005
Fall2006
Eight-YearChange
Agricultural Sciences 169 146 179 170 136 120 118 111 -34%
Applied Human Sciences 304 267 267 262 264 245 270 286 -6%
Business 30 24 37 39 34 39 45 43 43%
Engineering 75 65 88 51 71 56 62 44 -41%
Intra-University 452 514 512 530 459 380 326 286 -37%
Liberal Arts 315 308 273 295 281 305 278 282 -10%
Natural Sciences 259 272 280 292 246 248 214 195 -25%
Veterinary Medicine &Biomedical Sciences 64 66 25 31 24 30 31 37 -42%
Warner College ofNatural Resources 149 114 128 121 110 109 92 83 -44%
University Total 1,817 1,776 1,789 1,791 1,625 1,532 1,436 1,367 -25%
FACT BOOK 2006-07STUDENT INFORMATION 29

0 500 1,000 1,500
Warner College of Natural Resources
Veterinary Medicine & Biomedical Sciences
Agricultural Sciences
Engineering
Business
Natural Sciences
Applied Human Sciences
Liberal Arts
Intra-University
New Transfer Students
New Freshmen
New Undergraduate Students
Fall 1997 Fall 2000 Fall 2003 Fall 20060
2,000
4,000
6,000
New Freshmen
New Transfer Students
History of New Freshmen and Transfer Students
New Undergraduates by College
FACT BOOK 2006-07STUDENT INFORMATION 30
New Undergraduate Students
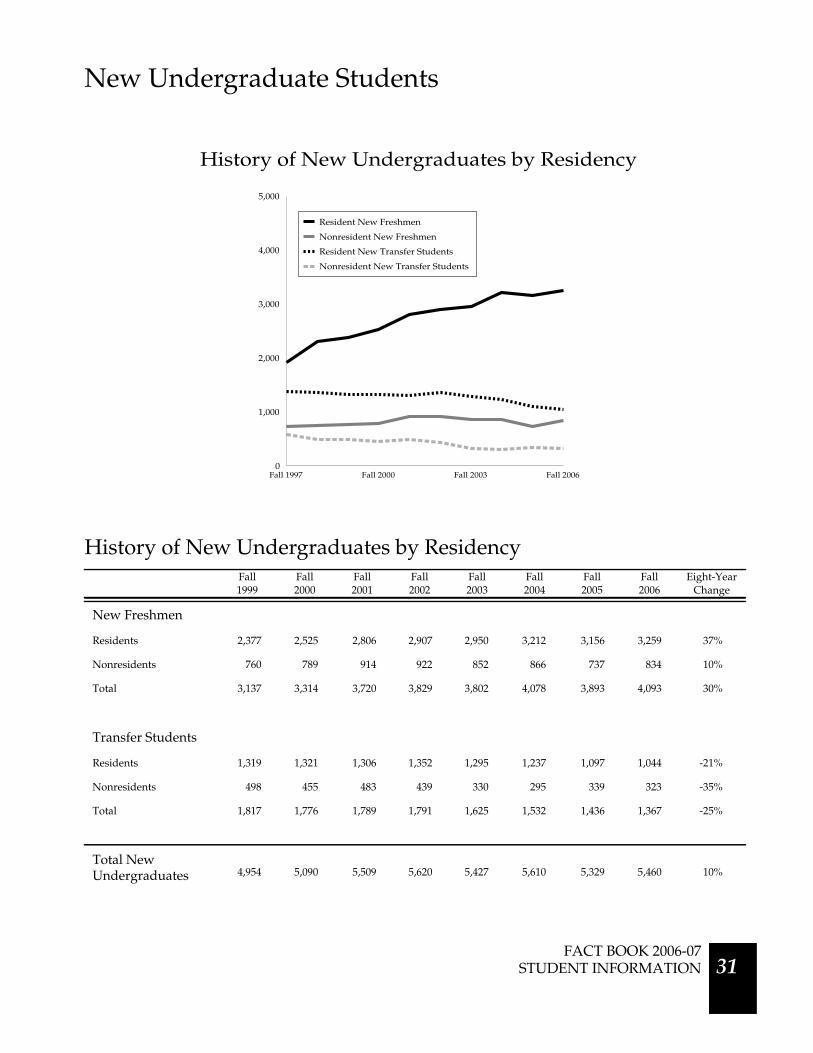
History of New Undergraduates by ResidencyFall1999
Fall2000
Fall2001
Fall2002
Fall2003
Fall2004
Fall2005
Fall2006
Eight-YearChange
New Freshmen
Residents 2,377 2,525 2,806 2,907 2,950 3,212 3,156 3,259 37%
Nonresidents 760 789 914 922 852 866 737 834 10%
Total 3,137 3,314 3,720 3,829 3,802 4,078 3,893 4,093 30%
Transfer Students
Residents 1,319 1,321 1,306 1,352 1,295 1,237 1,097 1,044 -21%
Nonresidents 498 455 483 439 330 295 339 323 -35%
Total 1,817 1,776 1,789 1,791 1,625 1,532 1,436 1,367 -25%
Total NewUndergraduates 4,954 5,090 5,509 5,620 5,427 5,610 5,329 5,460 10%
History of New Undergraduates by Residency
Fall 1997 Fall 2000 Fall 2003 Fall 20060
1,000
2,000
3,000
4,000
5,000
Resident New Freshmen
Nonresident New Freshmen
Resident New Transfer Students
Nonresident New Transfer Students
FACT BOOK 2006-07STUDENT INFORMATION 31
New Undergraduate Students
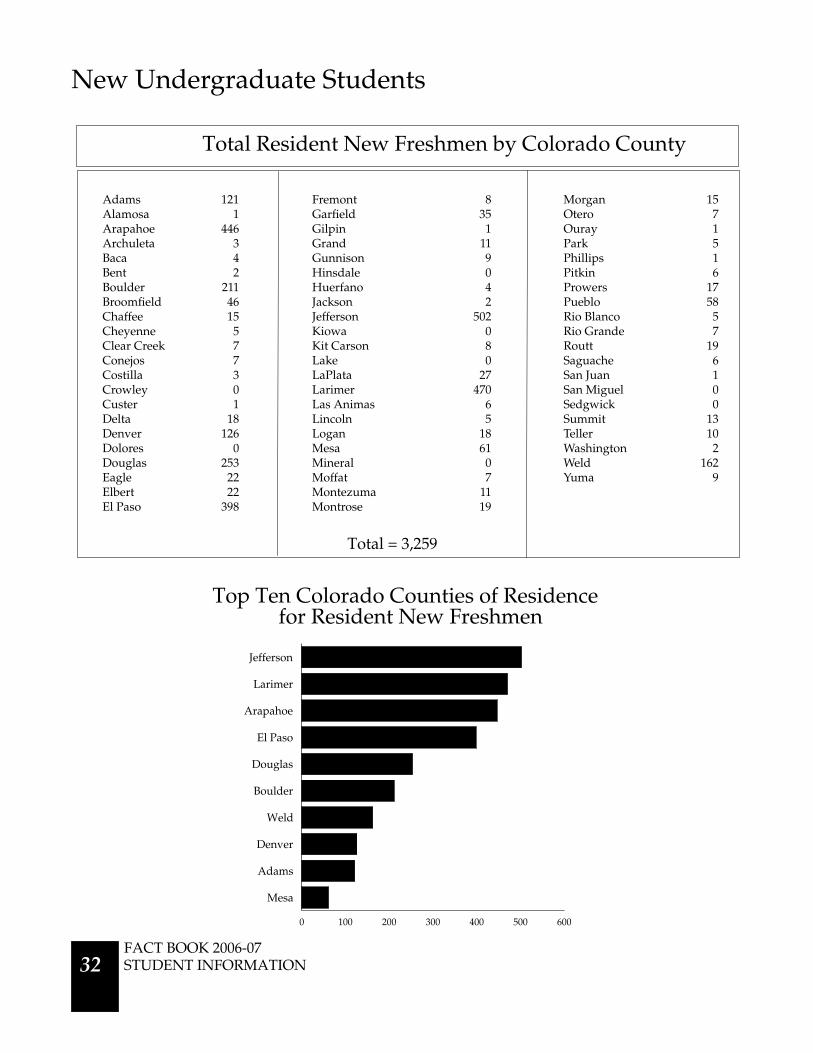
Adams 121 Fremont 8 Morgan 15Alamosa 1 Garfield 35 Otero 7Arapahoe 446 Gilpin 1 Ouray 1Archuleta 3 Grand 11 Park 5Baca 4 Gunnison 9 Phillips 1Bent 2 Hinsdale 0 Pitkin 6Boulder 211 Huerfano 4 Prowers 17Broomfield 46 Jackson 2 Pueblo 58Chaffee 15 Jefferson 502 Rio Blanco 5Cheyenne 5 Kiowa 0 Rio Grande 7Clear Creek 7 Kit Carson 8 Routt 19Conejos 7 Lake 0 Saguache 6Costilla 3 LaPlata 27 San Juan 1Crowley 0 Larimer 470 San Miguel 0Custer 1 Las Animas 6 Sedgwick 0Delta 18 Lincoln 5 Summit 13Denver 126 Logan 18 Teller 10Dolores 0 Mesa 61 Washington 2Douglas 253 Mineral 0 Weld 162Eagle 22 Moffat 7 Yuma 9Elbert 22 Montezuma 11El Paso 398 Montrose 19
0 100 200 300 400 500 600
Mesa
Adams
Denver
Weld
Boulder
Douglas
El Paso
Arapahoe
Larimer
Jefferson
Top Ten Colorado Counties of Residence for Resident New Freshmen
Total = 3,259
Total Resident New Freshmen by Colorado County
FACT BOOK 2006-07STUDENT INFORMATION 32

New Undergraduate Students
States with Highest Nonresident New Freshmen EnrollmentFall1997
Fall1998
Fall1999
Fall2000
Fall2001
Fall2002
Fall2003
Fall2004
Fall2005
Fall2006
Ten-YearChange
California 71 74 80 62 70 78 82 104 106 105 48%
Texas 52 50 65 91 111 104 97 88 70 90 73%
Illinois 47 61 53 57 69 70 73 80 64 67 43%
Minnesota 30 21 22 25 25 33 33 40 34 38 27%
Alaska 22 27 23 29 31 41 26 22 23 27 23%
Wisconsin 11 13 17 24 25 17 16 17 12 24 118%
Hawaii 34 31 33 23 24 31 31 18 29 23 -32%
New Mexico 36 38 24 32 48 48 37 31 17 22 -39%
Oregon 7 25 4 26 25 27 24 36 16 22 214%
Missouri 21 18 15 11 37 29 18 22 12 20 -5%
Maryland 11 13 8 5 8 10 13 8 7 19 73%
Arizona 16 10 15 14 20 13 23 24 16 16 0%
New York 6 17 14 17 10 12 13 11 8 16 167%
Wyoming 14 28 30 27 26 28 20 29 20 16 14%
Washington 12 18 18 13 28 23 19 34 22 15 25%
Total 390 444 421 456 557 564 525 564 456 520 33%
0 25 50 75 100 125
Washington
Wyoming
New York
Arizona
Maryland
Missouri
Oregon
New Mexico
Hawaii
Wisconsin
Alaska
Minnesota
Illinois
Texas
California
Top States of Residence for NonresidentNew Freshmen
FACT BOOK 2006-07STUDENT INFORMATION 33
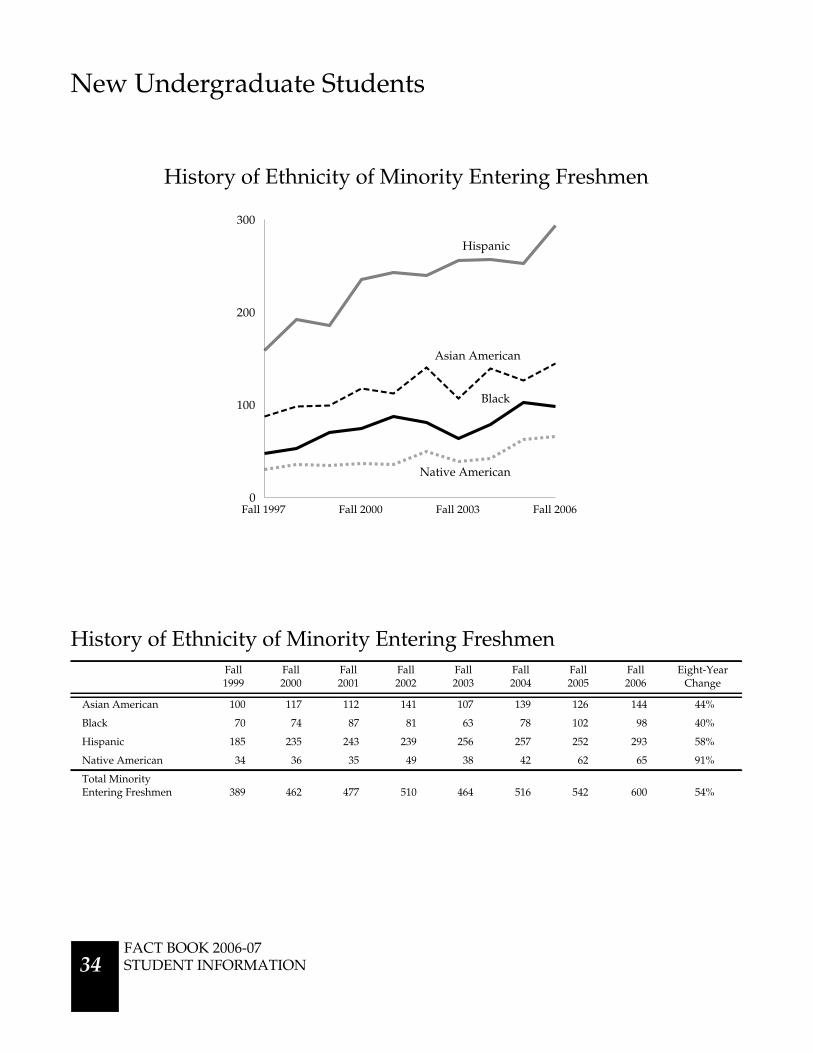
New Undergraduate Students
History of Ethnicity of Minority Entering FreshmenFall1999
Fall2000
Fall2001
Fall2002
Fall2003
Fall2004
Fall2005
Fall2006
Eight-YearChange
Asian American 100 117 112 141 107 139 126 144 44%
Black 70 74 87 81 63 78 102 98 40%
Hispanic 185 235 243 239 256 257 252 293 58%
Native American 34 36 35 49 38 42 62 65 91%
Total MinorityEntering Freshmen 389 462 477 510 464 516 542 600 54%
Fall 1997 Fall 2000 Fall 2003 Fall 20060
100
200
300
History of Ethnicity of Minority Entering Freshmen
Hispanic
Asian American
Black
Native American
FACT BOOK 2006-07STUDENT INFORMATION 34
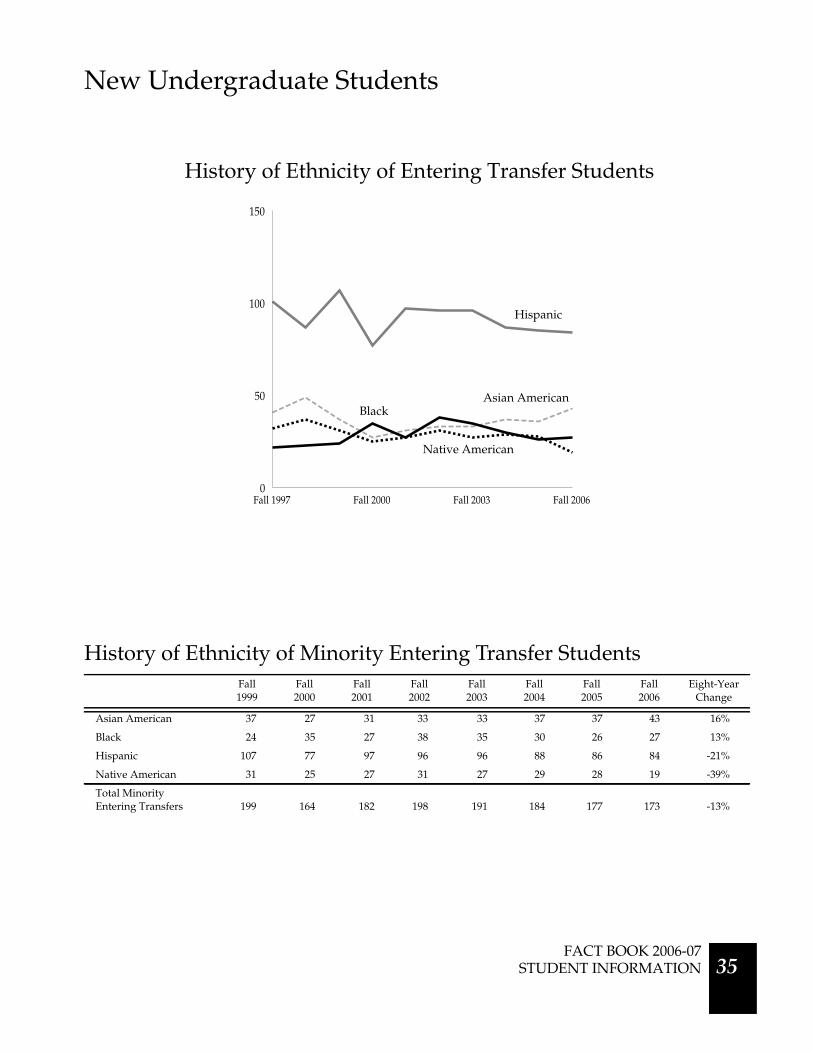
New Undergraduate Students
History of Ethnicity of Minority Entering Transfer StudentsFall1999
Fall2000
Fall2001
Fall2002
Fall2003
Fall2004
Fall2005
Fall2006
Eight-YearChange
Asian American 37 27 31 33 33 37 37 43 16%
Black 24 35 27 38 35 30 26 27 13%
Hispanic 107 77 97 96 96 88 86 84 -21%
Native American 31 25 27 31 27 29 28 19 -39%
Total MinorityEntering Transfers 199 164 182 198 191 184 177 173 -13%
Fall 1997 Fall 2000 Fall 2003 Fall 20060
50
100
150
Hispanic
Asian AmericanBlack
Native American
History of Ethnicity of Entering Transfer Students
FACT BOOK 2006-07STUDENT INFORMATION 35

New Undergraduate Students
Fall Term CCHE Index
1997 109.2
1998 109.5
1999 109.5
2000 109.7
2001 109.8
2002 109.5
2003 109.7
2004 110.2 Old Index
2004 114.2 New Index
2005 112.5
2006 112.7
FA96 FA98 FA00 FA02 FA04 FA06
105
110
115
120
1996 Index
2004 Index
Average CCHE Index for New Freshmen
Note: The CCHE Index is an admissions standard developed by the Colorado Commission on Higher Education, which is based on high school workand test scores. The Colorado Commission on Higher Education re-centered the CCHE Index in Fall 2004.
FACT BOOK 2006-07STUDENT INFORMATION 36

New Undergraduate Students
FA97 FA99 FA01 FA03 FA04* FA04** FA05 FA060%
20%
40%
60%
80%
100%<90
90-95
96-100
101-124
125+
CCHE Index for New Freshmen
FA97 FA00 FA03 FA060
2,000
4,000
6,000
8,000
10,000
12,000
1996 Index
2004 Index
Students Admitted with a CCHE Indexof 101 or Higher
Note: * = 1996 Index - ** = 2004 Index
FACT BOOK 2006-07STUDENT INFORMATION 37

New Undergraduate Students
FA96 FA98 FA00 FA02 FA04 FA060
200
400
600
800
1,000
1996 Index
2004 Index
FA96 FA98 FA00 FA02 FA04 FA0690
92
94
96
98
100
1996 Index
2004 Index
Note: Window enrolls are students with less than a 101 index. Regular enrolls are students with an index of 101 or higher.
FA96 FA98 FA00 FA02 FA04 FA060
20
40
60
1996 Index
2004 Index
Index Less Than 90Index Higher Than 125
New Freshmen By CCHE Index
Average Index for New Freshmen in the Window
FACT BOOK 2006-07STUDENT INFORMATION 38

FA96 FA98 FA00 FA02 FA04 FA060%
10%
20%
30%
40%1996 Index
2004 Index
FA96 FA98 FA00 FA02 FA04 FA060%
5%
10%
15%
20%
1996 Index
2004 Index
New Undergraduate Students
Note: Window enrolls are students with less than a 101 index. Regular enrolls are students with an index of 101 or higher.
Percent of Regular New Freshmen Who are Ethnic Minorities
Percent of Window New Freshmen Who are Ethnic Minorities
FACT BOOK 2006-07STUDENT INFORMATION 39
New Undergraduate Students
YearCSU Resident
New FreshmenPercent Change
from Previous YearColorado High School
GraduatesPercent Change
from Previous Year
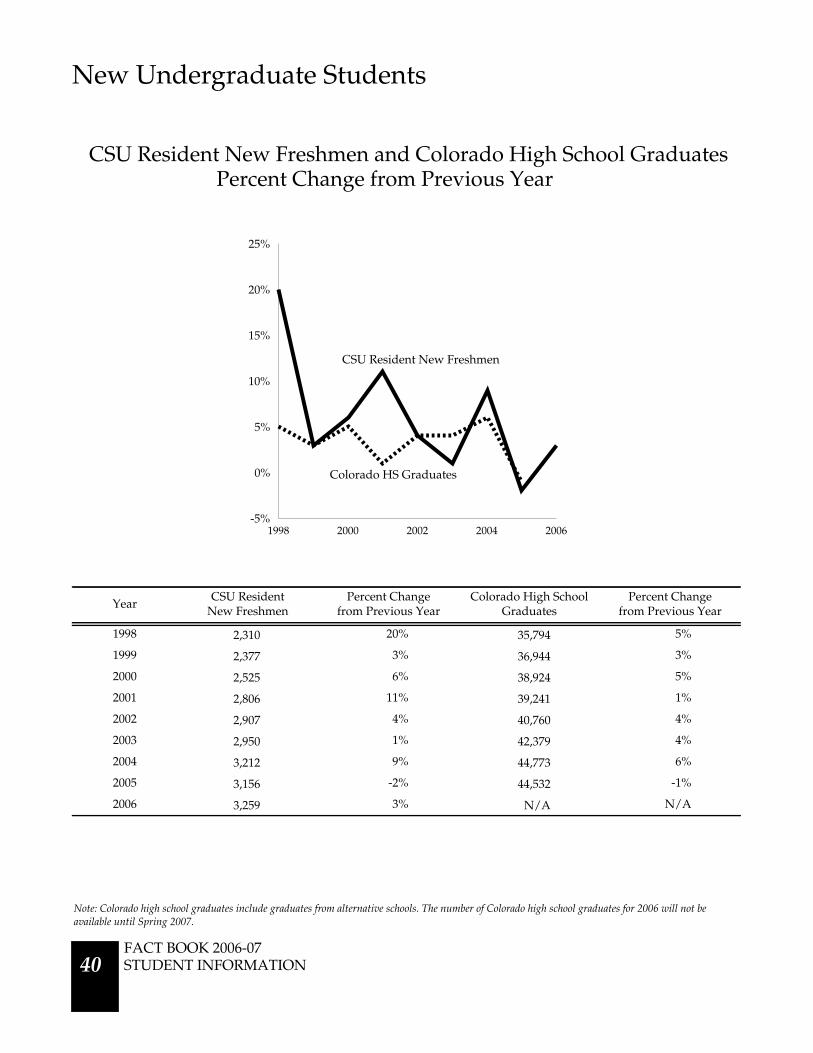
1998 2,310 20% 35,794 5%
1999 2,377 3% 36,944 3%
2000 2,525 6% 38,924 5%
2001 2,806 11% 39,241 1%
2002 2,907 4% 40,760 4%
2003 2,950 1% 42,379 4%
2004 3,212 9% 44,773 6%
2005 3,156 -2% 44,532 -1%
2006 3,259 3% N/A N/A
1998 2000 2002 2004 2006-5%
0%
5%
10%
15%
20%
25%
CSU Resident New Freshmen and Colorado High School GraduatesPercent Change from Previous Year
CSU Resident New Freshmen
Colorado HS Graduates
Note: Colorado high school graduates include graduates from alternative schools. The number of Colorado high school graduates for 2006 will not beavailable until Spring 2007.
FACT BOOK 2006-07STUDENT INFORMATION 40

New Undergraduate Students
American College TestingComposite Scores
Fall 1997 Fall 2000 Fall 2003 Fall 200620.0
22.0
24.0
26.0
28.0
Resident
Nonresident
Combined
Fall 1997 Fall 2000 Fall 2003 Fall 2006450
500
550
600
650
Resident
Nonresident
Combined
Fall 1997 Fall 2000 Fall 2003 Fall 2006450
500
550
600
650
Resident
Nonresident
Combined
Average ScholasticAptitude Test: Verbal
Fall 1997 Fall 2000 Fall 2003 Fall 20063.0
3.2
3.4
3.6
3.8
Resident
Nonresident
Combined
Average High School GPA
Average ScholasticAptitude Test: Math
New Freshmen
FACT BOOK 2006-07STUDENT INFORMATION 41
New Undergraduate Students
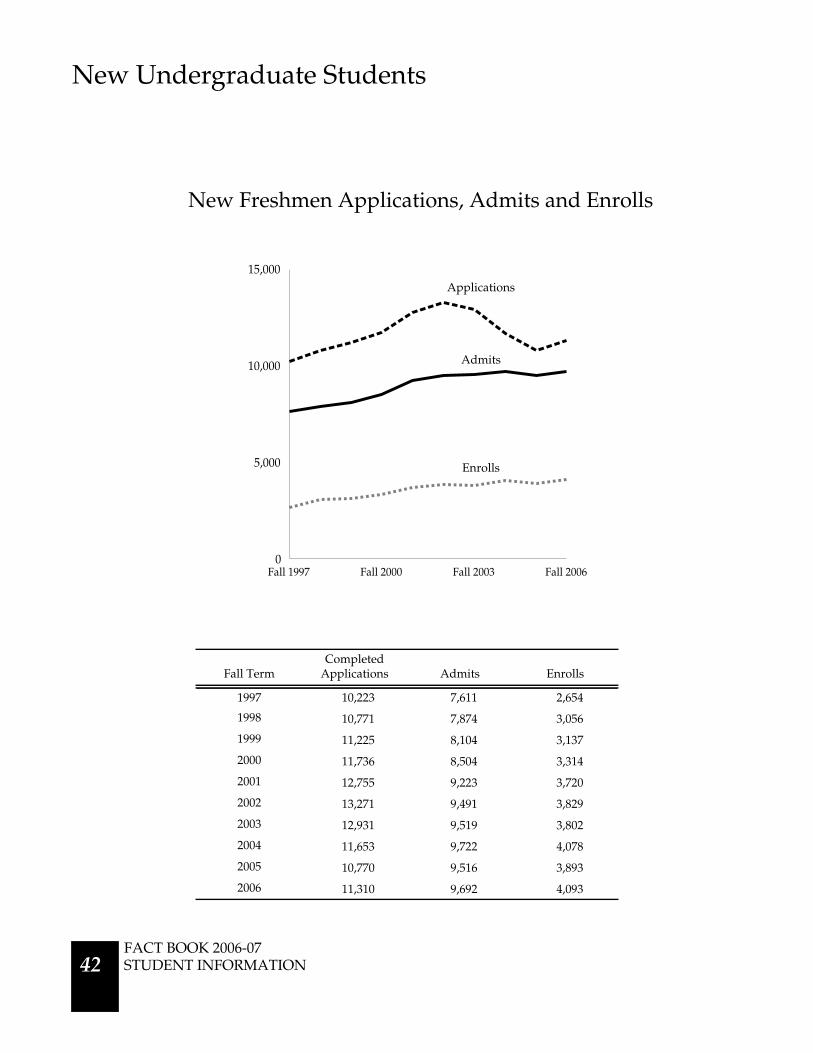
Fall TermCompleted
Applications Admits Enrolls
1997 10,223 7,611 2,654
1998 10,771 7,874 3,056
1999 11,225 8,104 3,137
2000 11,736 8,504 3,314
2001 12,755 9,223 3,720
2002 13,271 9,491 3,829
2003 12,931 9,519 3,802
2004 11,653 9,722 4,078
2005 10,770 9,516 3,893
2006 11,310 9,692 4,093
Fall 1997 Fall 2000 Fall 2003 Fall 20060
5,000
10,000
15,000
New Freshmen Applications, Admits and Enrolls
Applications
Admits
Enrolls
FACT BOOK 2006-07STUDENT INFORMATION 42
New Undergraduate Students
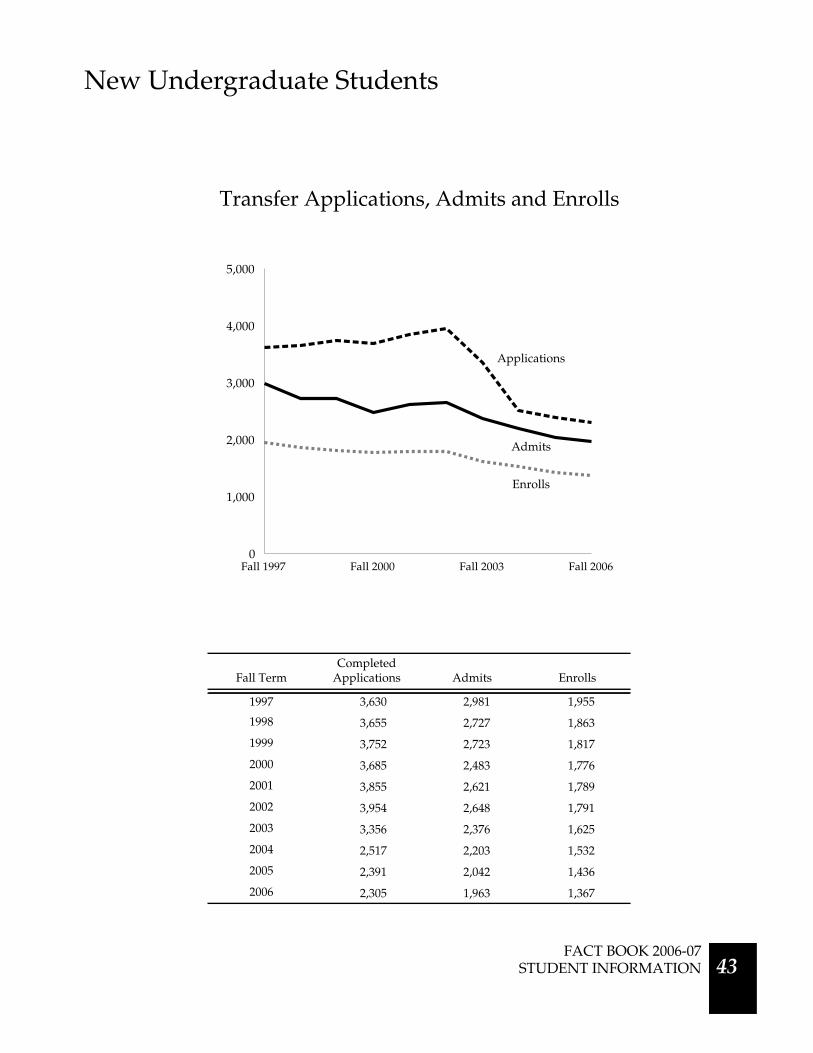
Fall TermCompleted
Applications Admits Enrolls
1997 3,630 2,981 1,955
1998 3,655 2,727 1,863
1999 3,752 2,723 1,817
2000 3,685 2,483 1,776
2001 3,855 2,621 1,789
2002 3,954 2,648 1,791
2003 3,356 2,376 1,625
2004 2,517 2,203 1,532
2005 2,391 2,042 1,436
2006 2,305 1,963 1,367
Transfer Applications, Admits and Enrolls
Fall 1997 Fall 2000 Fall 2003 Fall 20060
1,000
2,000
3,000
4,000
5,000
Applications
Admits
Enrolls
FACT BOOK 2006-07STUDENT INFORMATION 43
New Undergraduate Students
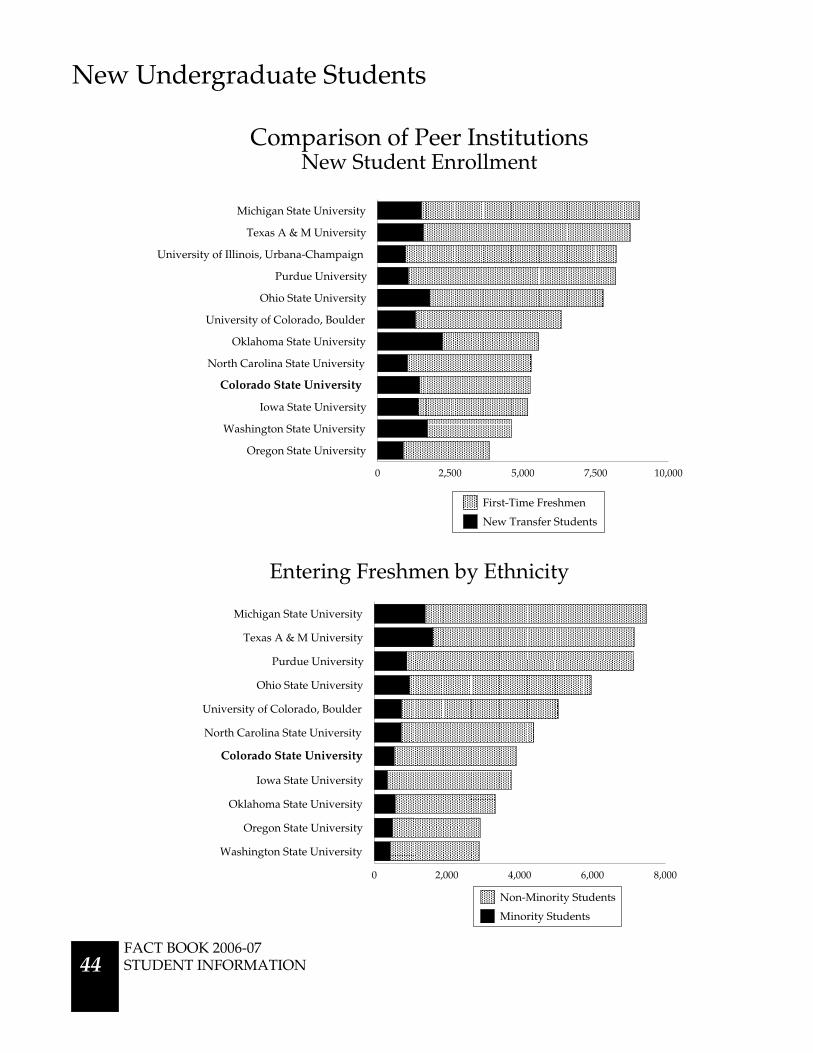
Entering Freshmen by Ethnicity
0 2,500 5,000 7,500 10,000
Oregon State University
Washington State University
Iowa State University
North Carolina State University
Oklahoma State University
University of Colorado, Boulder
Ohio State University
Purdue University
University of Illinois, Urbana-Champaign
Texas A & M University
Michigan State University
New Transfer Students
First-Time Freshmen
New Student EnrollmentComparison of Peer Institutions
Colorado State University
0 2,000 4,000 6,000 8,000
Washington State University
Oregon State University
Oklahoma State University
Iowa State University
North Carolina State University
University of Colorado, Boulder
Ohio State University
Purdue University
Texas A & M University
Michigan State University
Minority Students
Non-Minority Students
Colorado State University
FACT BOOK 2006-07STUDENT INFORMATION 44
New Undergraduate Students
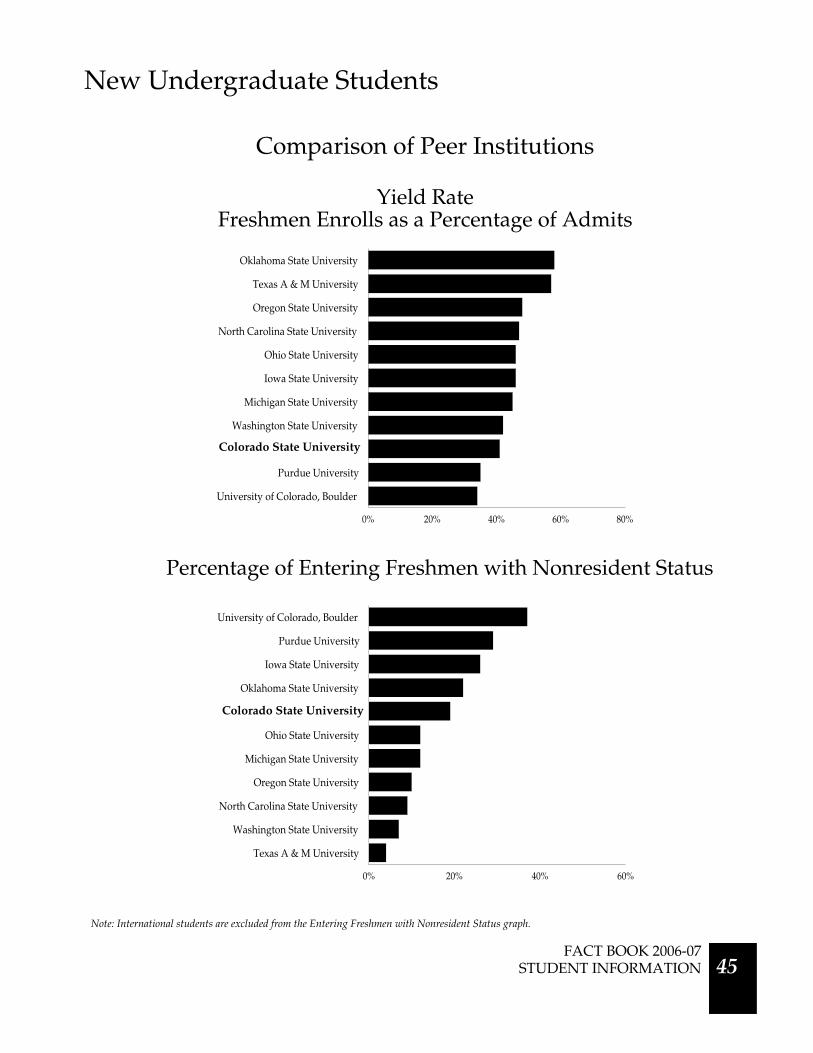
Comparison of Peer Institutions
0% 20% 40% 60% 80%
University of Colorado, Boulder
Purdue University
Washington State University
Michigan State University
Iowa State University
Ohio State University
North Carolina State University
Oregon State University
Texas A & M University
Oklahoma State University
Yield RateFreshmen Enrolls as a Percentage of Admits
Colorado State University
0% 20% 40% 60%
Texas A & M University
Washington State University
North Carolina State University
Oregon State University
Michigan State University
Ohio State University
Oklahoma State University
Iowa State University
Purdue University
University of Colorado, Boulder
Colorado State University
Percentage of Entering Freshmen with Nonresident Status
Note: International students are excluded from the Entering Freshmen with Nonresident Status graph.
FACT BOOK 2006-07STUDENT INFORMATION 45

New Undergraduate Students
SAT and ACT Test Scores - 25th and 75th PercentileSAT Verbal SAT Math ACT Composite ACT English ACT Math
Colorado State University 500 - 600 510 - 610 22 - 26 21 - 26 21 - 26
Iowa State University 530 - 650 550 - 690 22 - 27 21 - 27 22 - 28
Michigan State University 490 - 620 515 - 650 22 - 27 21 - 27 21 - 27
North Carolina State University 530 - 630 570 - 660 22 - 27 21 - 27 24 - 28
Oklahoma State University 480 - 590 500 - 610 22 - 27 21 - 27 20 - 26
Oregon State University 470 - 590 490 - 610 20 - 26 19 - 26 19 - 27
Texas A & M 520 - 640 550 - 660 23 - 28 21 - 28 22 - 28
University of Colorado, Boulder 530 - 630 550 - 650 23 - 28 22 - 28 23 - 28
University of Georgia 560 - 660 570 - 660 24 - 28 23 - 29 24 - 28
University of Nebraska, Lincoln 510 - 640 530 - 660 22 - 28 21 - 28 21 - 28
Comparison of Peer Institutions
Percent of Entering Freshmenin Top Tenth of High School Graduating Class
Note: SAT and ACT scores are reported for first-time, first-year (freshmen) students enrolled in Fall 2005 who submitted test scores to the institutionwhere they enrolled.
0% 20% 40% 60%
Oregon State University
University of Colorado, Boulder
Iowa State University
Michigan State University
Oklahoma State University
Purdue University
North Carolina State University
Washington State University
Ohio State University
Texas A & M University
Colorado State University
FACT BOOK 2006-07STUDENT INFORMATION 46

New Graduate Students(Includes Readmitted Graduate Students)
New Graduate Students by Gender and LevelMaster’s Level Doctoral Level Total
Men Women Men Women Students
Agricultural Sciences 12 22 3 4 41
Applied Human Sciences 51 144 9 13 217
Business 39 23 -- -- 62
Engineering 56 19 25 7 107
Intra-University 9 6 11 6 32
Liberal Arts 58 96 6 3 163
Natural Sciences 34 30 56 33 153
Veterinary Medicine & Biomedical Sciences 25 35 7 12 79
Warner College of Natural Resources 26 17 2 1 46
University Summary 310 392 119 79 900
New Master’s StudentsPercent of Admitted Students Who Enroll 45%Mean GRE Verbal Score 511.8Mean GRE Quantitative Score 624.1Mean GRE Analytical Score 4.5
New Doctoral StudentsPercent of Admitted Students Who Enroll 50%Mean GRE Verbal Score 494.8Mean GRE Quantitative Score 679.4Mean GRE Analytical Score 4.2
New Graduate Student Profile
FACT BOOK 2006-07STUDENT INFORMATION 47

New Graduate Students(Includes Readmitted Graduate Students)
New Graduate Students by Residency and LevelMaster’s Level Doctoral Level Total
Resident Nonresident Resident Nonresident Students
Agricultural Sciences 24 10 0 7 41
Applied Human Sciences 128 67 18 4 217
Business 50 12 -- -- 62
Engineering 31 44 5 27 107
Intra-University 9 6 7 10 32
Liberal Arts 85 69 2 7 163
Natural Sciences 29 35 23 66 153
Veterinary Medicine & Biomedical Sciences 38 22 6 13 79
Warner College of Natural Resources 24 19 0 3 46
University Summary 418 284 61 137 900
0 100 200 300
Intra-University
Agricultural Sciences
Warner College of Natural Resources
Business
Veterinary Medicine & Biomedical Sciences
Engineering
Natural Sciences
Liberal Arts
Applied Human Sciences
Doctoral Students
Master’s Students
New Graduate Students by College
FACT BOOK 2006-07STUDENT INFORMATION 48

New Graduate Students(Includes Readmitted Graduate Students)
Master’s Level Doctoral Level Total
Fall Term Resident Nonresident Total Resident Nonresident Total Students
1997 436 364 800 99 147 246 1,046
1998 373 314 687 52 131 183 870
1999 403 375 778 56 137 193 971
2000 384 362 746 41 152 193 939
2001 368 373 741 45 143 188 929
2002 466 331 797 59 115 174 971
2003 455 332 787 70 139 209 996
2004 453 286 739 61 134 195 934
2005 405 354 759 69 130 199 958
2006 418 284 702 61 137 198 900
Fall 1997 Fall 2000 Fall 2003 Fall 20060
200
400
600
800
History of New Graduate Students by Residency
Resident Students
Nonresident Students
FACT BOOK 2006-07STUDENT INFORMATION 49

New Graduate Students(Includes Readmitted Graduate Students)
Fall TermCompleted
Applications Admits Enrolls
1997 3,917 1,897 808
1998 3,538 1,803 691
1999 3,738 1,971 784
2000 3,562 1,878 754
2001 3,529 1,849 751
2002 3,553 1,830 799
2003 3,570 1,754 790
2004 3,006 1,561 743
2005 2,752 1,489 763
2006 3,070 1,576 706
Fall 1997 Fall 2000 Fall 2003 Fall 20060
1,000
2,000
3,000
4,000Applications
Admits
Enrolls
History of Master’s Applications, Admits and Enrolls
FACT BOOK 2006-07STUDENT INFORMATION 50
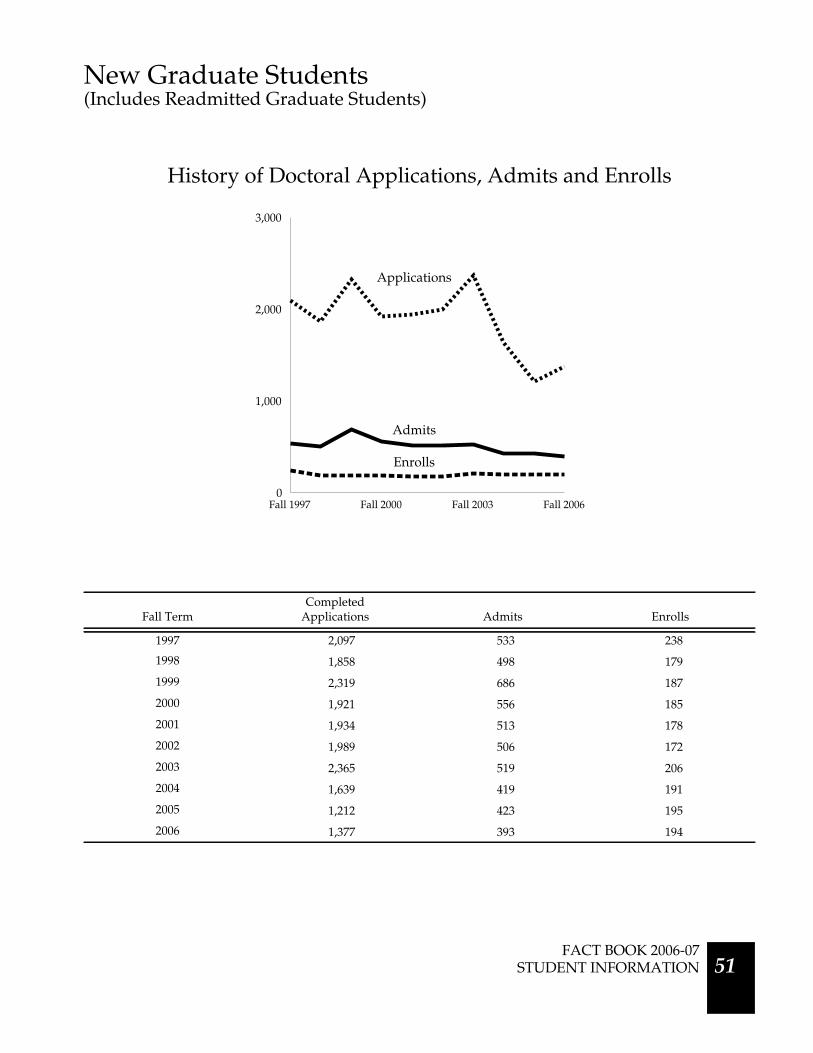
New Graduate Students(Includes Readmitted Graduate Students)
Fall TermCompleted
Applications Admits Enrolls
1997 2,097 533 238
1998 1,858 498 179
1999 2,319 686 187
2000 1,921 556 185
2001 1,934 513 178
2002 1,989 506 172
2003 2,365 519 206
2004 1,639 419 191
2005 1,212 423 195
2006 1,377 393 194
Fall 1997 Fall 2000 Fall 2003 Fall 20060
1,000
2,000
3,000
Applications
Admits
Enrolls
History of Doctoral Applications, Admits and Enrolls
FACT BOOK 2006-07STUDENT INFORMATION 51
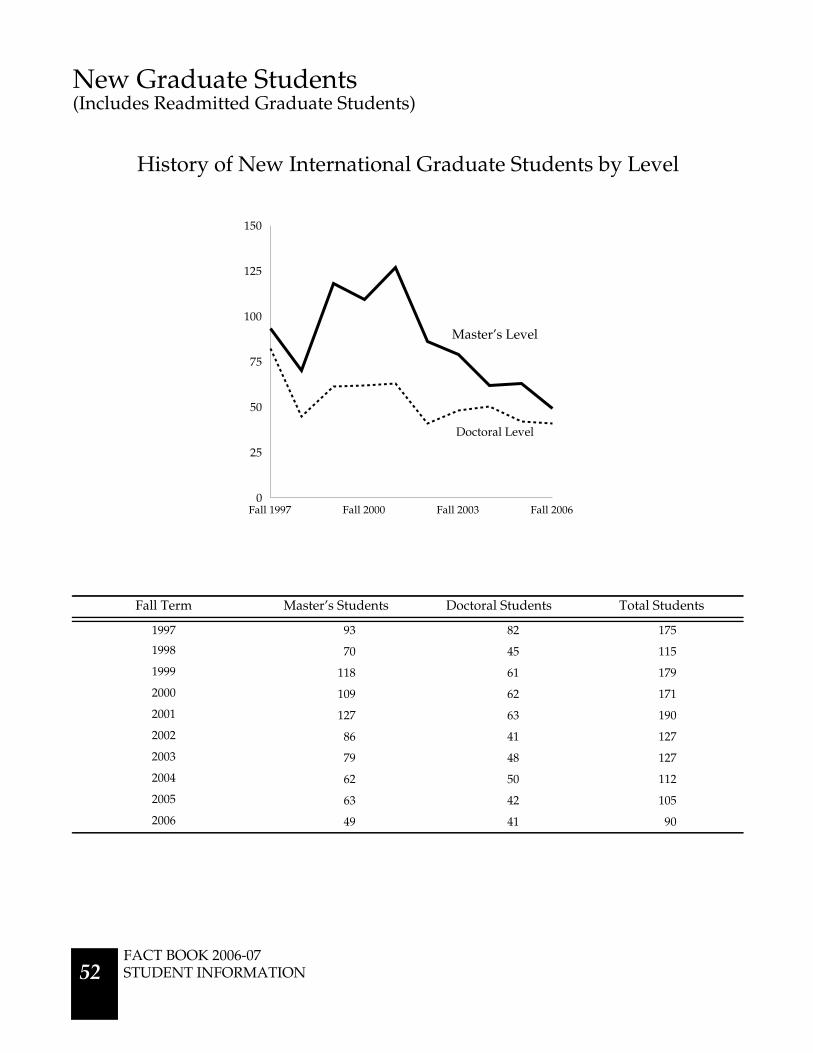
New Graduate Students(Includes Readmitted Graduate Students)
Fall Term Master’s Students Doctoral Students Total Students
1997 93 82 175
1998 70 45 115
1999 118 61 179
2000 109 62 171
2001 127 63 190
2002 86 41 127
2003 79 48 127
2004 62 50 112
2005 63 42 105
2006 49 41 90
Fall 1997 Fall 2000 Fall 2003 Fall 20060
25
50
75
100
125
150
History of New International Graduate Students by Level
Master’s Level
Doctoral Level
FACT BOOK 2006-07STUDENT INFORMATION 52
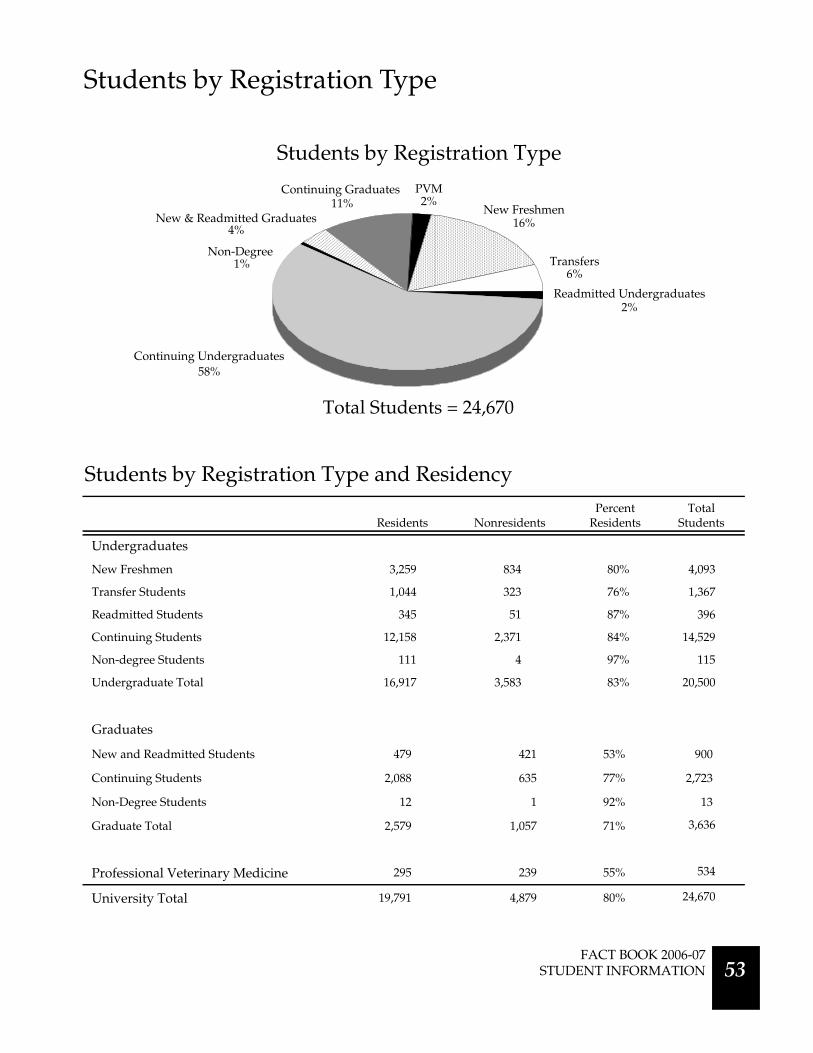
Students by Registration Type
Students by Registration Type and Residency
Residents NonresidentsPercent
ResidentsTotal
Students
Undergraduates
New Freshmen 3,259 834 80% 4,093
Transfer Students 1,044 323 76% 1,367
Readmitted Students 345 51 87% 396
Continuing Students 12,158 2,371 84% 14,529
Non-degree Students 111 4 97% 115
Undergraduate Total 16,917 3,583 83% 20,500
Graduates
New and Readmitted Students 479 421 53% 900
Continuing Students 2,088 635 77% 2,723
Non-Degree Students 12 1 92% 13
Graduate Total 2,579 1,057 71% 3,636
Professional Veterinary Medicine 295 239 55% 534
University Total 19,791 4,879 80% 24,670
17%
6%
2%
59%
1%
4%
11% 2%
Continuing Undergraduates58%
1%
New Freshmen16%
Non-Degree
Continuing Graduates11%
PVM2%
Students by Registration Type
Total Students = 24,670
New & Readmitted Graduates4%
Transfers6%
Readmitted Undergraduates2%
FACT BOOK 2006-07 STUDENT INFORMATION 53

Students by Registration Type
Undergraduate Registration Type by College
History of Undergraduates by Registration Type
NewFreshmen Transfers Readmits Continuing Non-Degree
TotalStudents
Agricultural Sciences 189 111 33 903 0 1,236
Applied Human Sciences 548 286 72 3,001 42 3,949
Business 320 43 9 1,518 0 1,890
Engineering 291 44 23 1,020 0 1,378
Intra-University 1,181 286 53 1,136 71 2,727
Liberal Arts 640 282 111 3,627 1 4,661
Natural Sciences 571 195 65 2,222 1 3,054
Veterinary Medicine &Biomedical Sciences 227 37 4 370 0 638
Warner College ofNatural Resources 126 83 26 732 0 967
University Total 4,093 1,367 396 14,529 115 20,500
Fall1998
Fall1999
Fall2000
Fall2001
Fall2002
Fall2003
Fall2004
Fall2005
Fall2006
Nine-YearChange
New Freshmen 3,056 3,137 3,314 3,720 3,829 3,802 4,078 3,893 4,093 34%
Transfers 1,863 1,817 1,776 1,789 1,791 1,625 1,532 1,436 1,367 -27%
Readmits 438 449 412 466 516 474 453 464 396 -10%
Continuing 12,927 13,080 13,315 13,559 14,122 14,567 14,810 14,791 14,529 12%
Non-Degree 323 316 258 365 310 210 176 136 115 -64%
Total 18,607 18,800 19,075 19,899 20,568 20,678 21,049 20,720 20,500 10%
FACT BOOK 2006-07STUDENT INFORMATION 54

Students by Residency
Undergraduate Students by Residency and College
Graduate Students by Residency and College
ResidentUndergraduate Students
NonresidentUndergraduate Students
Percent of StudentsWho are Residents
Agricultural Sciences 859 337 69%
Applied Human Sciences 3,322 627 84%
Business 1,617 273 86%
Engineering 1,094 284 79%
Intra-University 2,343 384 86%
Liberal Arts 3,961 700 85%
Natural Sciences 2,545 509 83%
Veterinary Medicine &Biomedical Sciences 494 144 77%
Warner College ofNatural Resources 682 285 71%
University Total 16,917 3,583 83%
ResidentGraduate Students
NonresidentGraduate Students
Percent of StudentsWho are Residents
Agricultural Sciences 149 59 72%
Applied Human Sciences 729 145 83%
Business 110 27 80%
Engineering 294 250 54%
Intra-University 117 42 74%
Liberal Arts 416 149 74%
Natural Sciences 369 244 60%
Veterinary Medicine &Biomedical Sciences 224 82 73%
Warner College ofNatural Resources 171 59 74%
University Total 2,579 1,057 71%
FACT BOOK 2006-07 STUDENT INFORMATION 55

Students by Residency
23%18%
19%
26%
9%
4%
1%
Residents
9%Master’s
Doctorate4%
ProfessionalVet Med
1%
Freshmen23%
Sophomores18%
Seniors26%
Total = 19,791
Juniors19%
23%15%
16%
19% 12%
10%
5%
Nonresidents
12%Master’s
Doctoral10%
ProfessionalVet Med
5%
Freshmen23%
Sophomores15%
Seniors19%
Juniors16%
Total = 4,879
Residency by Student Level
FACT BOOK 2006-07STUDENT INFORMATION 56

Students by Residency
History of Undergraduate Enrollment by Residency
History of Graduate Enrollment by Residency
Residents Nonresidents
Number Percent Number Percent
Fall 1997 14,521 79% 3,930 21%
Fall 1998 14,747 79% 3,860 21%
Fall 1999 14,951 80% 3,849 20%
Fall 2000 15,246 80% 3,829 20%
Fall 2001 15,864 80% 4,035 20%
Fall 2002 16,524 80% 4,044 20%
Fall 2003 16,760 81% 3,918 19%
Fall 2004 17,195 82% 3,854 18%
Fall 2005 17,057 82% 3,663 18%
Fall 2006 16,917 83% 3,583 17%
Residents Nonresidents
Number Percent Number Percent
Fall 1997 2,283 68% 1,078 32%
Fall 1998 2,282 68% 1,098 32%
Fall 1999 2,318 67% 1,134 33%
Fall 2000 2,323 67% 1,171 33%
Fall 2001 2,334 67% 1,173 33%
Fall 2002 2,426 67% 1,204 33%
Fall 2003 2,576 67% 1,261 33%
Fall 2004 2,645 70% 1,150 30%
Fall 2005 2,533 69% 1,157 31%
Fall 2006 2,579 71% 1,057 29%
Note: PVM is excluded from graduate enrollment.
FACT BOOK 2006-07 STUDENT INFORMATION 57

Students by Residency
0% 20% 40% 60% 80% 100%
Texas A & M University
North Carolina State University
Ohio State University
Michigan State University
Oregon State University
Oklahoma State University
Iowa State University
Purdue University
University of Colorado, Boulder
Nonresident Students
Resident Students
Undergraduates by ResidencyComparison of Peer Institutions
Colorado State University
FACT BOOK 2006-07STUDENT INFORMATION 58

Students by Ethnic Origin
Ethnicity by Student ClassAsian
American Black HispanicNative
AmericanMinority
Total WhiteInter-
national Other Total
Freshmen 191 163 417 93 864 4,586 99 150 5,699
Sophomores 139 86 261 62 548 3,552 31 152 4,283
Juniors 145 84 282 75 586 3,723 70 181 4,560
Seniors 163 91 305 85 644 5,006 69 239 5,958
Undergraduate Total 638 424 1,265 315 2,642 16,867 269 722 20,500
Master’s 57 23 98 26 204 1,719 201 195 2,319
Doctoral 34 24 37 14 109 782 316 110 1,317
Graduate Total 91 47 135 40 313 2,501 517 305 3,636
Professional Vet Med 26 3 28 4 61 379 3 91 534
University Summary 755 474 1,428 359 3,016 19,747 789 1,118 24,670
87%
13%
0
20
40
60
80
100
Native American
Black
Hispanic
Non-Minority Students87.4%
12%
Asian American25%
16%
47%
Minority Students12.6%
Students by Ethnic Origin
Total Students = 23,881(Excludes International Students)
Note: The "Other" category includes students who do not wish to report their ethnicity in addition to those who do not fall into one of the other categories.Ethnicity is self-reported.
FACT BOOK 2006-07STUDENT INFORMATION 59
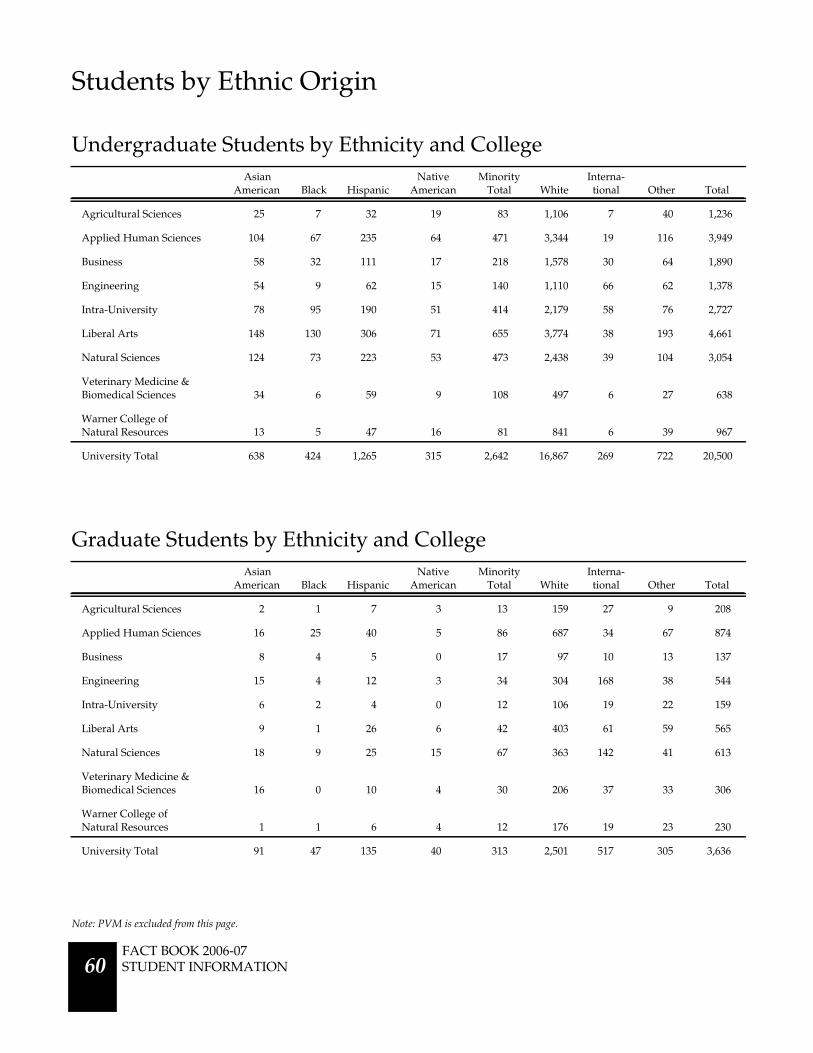
Students by Ethnic Origin
Undergraduate Students by Ethnicity and College
Graduate Students by Ethnicity and College
AsianAmerican Black Hispanic
NativeAmerican
MinorityTotal White
Interna-tional Other Total
Agricultural Sciences 25 7 32 19 83 1,106 7 40 1,236
Applied Human Sciences 104 67 235 64 471 3,344 19 116 3,949
Business 58 32 111 17 218 1,578 30 64 1,890
Engineering 54 9 62 15 140 1,110 66 62 1,378
Intra-University 78 95 190 51 414 2,179 58 76 2,727
Liberal Arts 148 130 306 71 655 3,774 38 193 4,661
Natural Sciences 124 73 223 53 473 2,438 39 104 3,054
Veterinary Medicine &Biomedical Sciences 34 6 59 9 108 497 6 27 638
Warner College ofNatural Resources 13 5 47 16 81 841 6 39 967
University Total 638 424 1,265 315 2,642 16,867 269 722 20,500
AsianAmerican Black Hispanic
NativeAmerican
MinorityTotal White
Interna-tional Other Total
Agricultural Sciences 2 1 7 3 13 159 27 9 208
Applied Human Sciences 16 25 40 5 86 687 34 67 874
Business 8 4 5 0 17 97 10 13 137
Engineering 15 4 12 3 34 304 168 38 544
Intra-University 6 2 4 0 12 106 19 22 159
Liberal Arts 9 1 26 6 42 403 61 59 565
Natural Sciences 18 9 25 15 67 363 142 41 613
Veterinary Medicine &Biomedical Sciences 16 0 10 4 30 206 37 33 306
Warner College ofNatural Resources 1 1 6 4 12 176 19 23 230
University Total 91 47 135 40 313 2,501 517 305 3,636
Note: PVM is excluded from this page.
FACT BOOK 2006-07STUDENT INFORMATION 60

Students by Ethnic Origin
History of Students by Ethnicity
Ethnic Minority Undergraduate Studentsas a Percent of Total Undergraduate Enrollment
Fall Term Minority Students Non-Minority Students
1991 9.2% 90.8%
1992 9.4% 90.6%
1993 9.9% 90.1%
1994 10.4% 89.6%
1995 10.6% 89.4%
1996 10.7% 89.3%
1997 10.8% 89.2%
1998 10.9% 89.1%
1999 11.2% 88.8%
2000 11.5% 88.5%
2001 11.5% 88.5%
2002 11.8% 88.2%
2003 11.8% 88.2%
2004 11.7% 88.3%
2005 12.2% 87.8%
2006 12.6% 87.4%
Fall 1998 Fall 1999 Fall 2000 Fall 2001 Fall 2002 Fall 2003 Fall 2004 Fall 2005 Fall 2006
Agricultural Sciences 9.4% 9.2% 8.3% 8.0% 7.0% 7.2% 7.4% 7.4% 6.8%
Applied Human Sciences 10.0% 10.1% 10.7% 11.1% 10.8% 11.9% 11.8% 12.0% 12.0%
Business 11.6% 10.9% 11.3% 10.0% 10.2% 10.3% 9.9% 10.7% 11.7%
Engineering 11.5% 11.2% 10.5% 9.5% 9.7% 9.1% 9.8% 9.8% 10.7%
Intra-University 12.2% 14.0% 13.0% 14.1% 14.8% 14.4% 14.3% 14.7% 15.5%
Liberal Arts 11.1% 11.8% 12.7% 12.1% 12.7% 13.2% 13.3% 13.9% 14.2%
Natural Sciences 13.5% 13.3% 13.4% 13.9% 13.6% 14.2% 13.8% 15.2% 15.7%
Veterinary Medicine &Biomedical Sciences 13.2% 14.3% 15.0% 14.1% 18.1% 15.9% 16.5% 14.9% 17.1%
Warner College ofNatural Resources 7.6% 8.0% 8.9% 7.7% 6.9% 6.9% 7.0% 7.8% 8.4%
University Summary 11.2% 11.5% 11.8% 11.5% 12.0% 12.2% 12.1% 12.6% 13.1%
Undergraduates
.
Note: International students are excluded from the base population.
FACT BOOK 2006-07STUDENT INFORMATION 61
Fall 1998 Fall 2000 Fall 2002 Fall 2004 Fall 20060
300
600
900
1,200
1,500
Students by Ethnic Origin
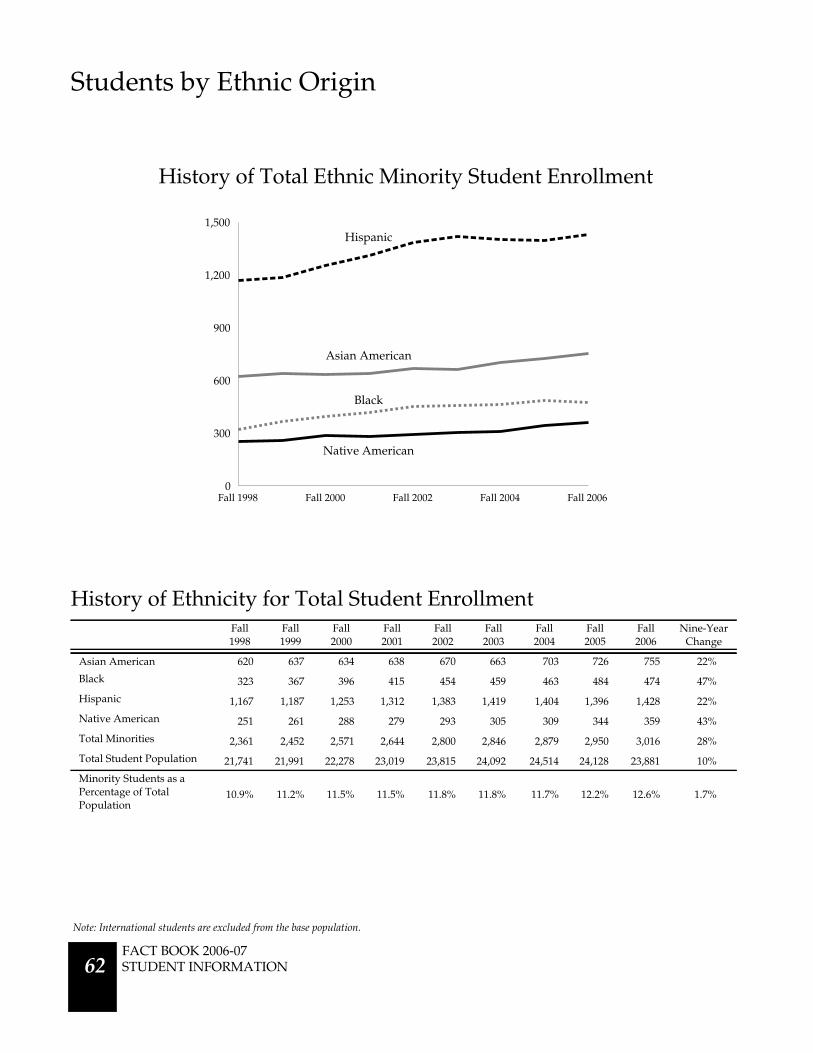
History of Ethnicity for Total Student EnrollmentFall1998
Fall1999
Fall2000
Fall2001
Fall2002
Fall2003
Fall2004
Fall2005
Fall2006
Nine-YearChange
Asian American 620 637 634 638 670 663 703 726 755 22%
Black 323 367 396 415 454 459 463 484 474 47%
Hispanic 1,167 1,187 1,253 1,312 1,383 1,419 1,404 1,396 1,428 22%
Native American 251 261 288 279 293 305 309 344 359 43%
Total Minorities 2,361 2,452 2,571 2,644 2,800 2,846 2,879 2,950 3,016 28%
Total Student Population 21,741 21,991 22,278 23,019 23,815 24,092 24,514 24,128 23,881 10%
Minority Students as aPercentage of TotalPopulation
10.9% 11.2% 11.5% 11.5% 11.8% 11.8% 11.7% 12.2% 12.6% 1.7%
History of Total Ethnic Minority Student Enrollment
Hispanic
Asian American
Black
Native American
Note: International students are excluded from the base population.
FACT BOOK 2006-07STUDENT INFORMATION 62
Students by Ethnic Origin
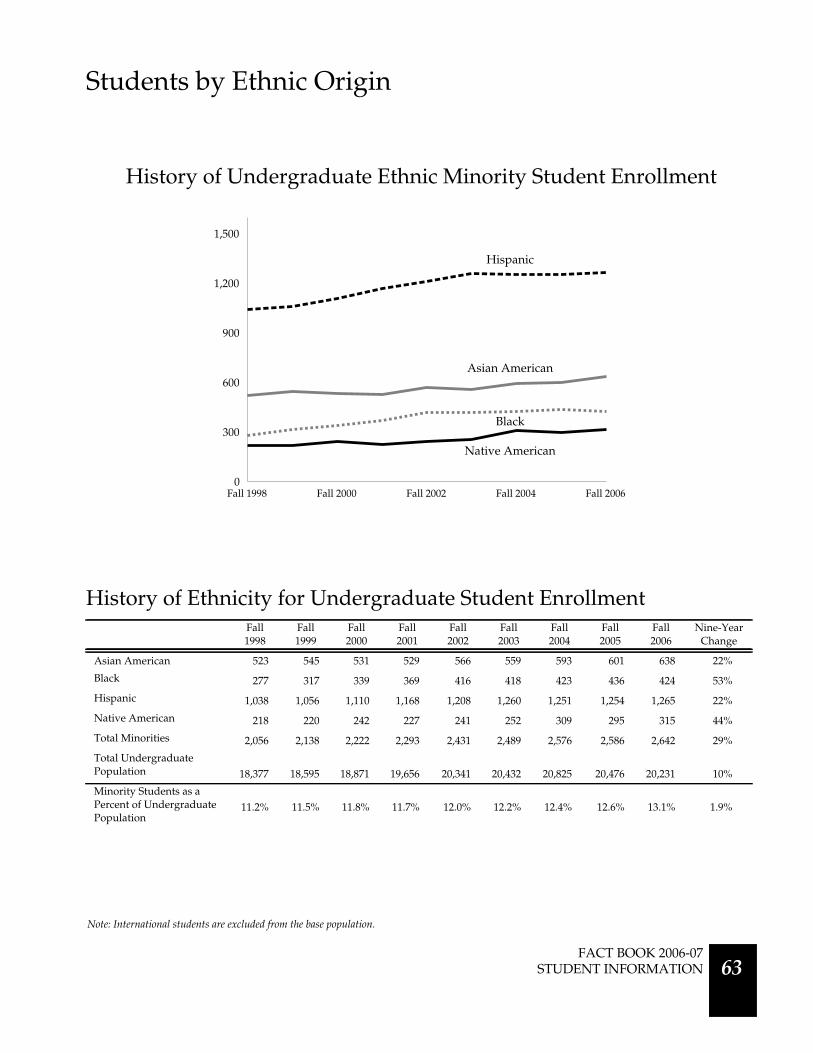
History of Ethnicity for Undergraduate Student EnrollmentFall1998
Fall1999
Fall2000
Fall2001
Fall2002
Fall2003
Fall2004
Fall2005
Fall2006
Nine-YearChange
Asian American 523 545 531 529 566 559 593 601 638 22%
Black 277 317 339 369 416 418 423 436 424 53%
Hispanic 1,038 1,056 1,110 1,168 1,208 1,260 1,251 1,254 1,265 22%
Native American 218 220 242 227 241 252 309 295 315 44%
Total Minorities 2,056 2,138 2,222 2,293 2,431 2,489 2,576 2,586 2,642 29%
Total UndergraduatePopulation 18,377 18,595 18,871 19,656 20,341 20,432 20,825 20,476 20,231 10%
Minority Students as aPercent of UndergraduatePopulation
11.2% 11.5% 11.8% 11.7% 12.0% 12.2% 12.4% 12.6% 13.1% 1.9%
Fall 1998 Fall 2000 Fall 2002 Fall 2004 Fall 20060
300
600
900
1,200
1,500
Hispanic
Black
Native American
Asian American
Note: International students are excluded from the base population.
History of Undergraduate Ethnic Minority Student Enrollment
FACT BOOK 2006-07STUDENT INFORMATION 63

Fall 1998 Fall 2000 Fall 2002 Fall 2004 Fall 20060
50
100
150
Students by Ethnic Origin
History of Ethnicity for Graduate Student EnrollmentFall1998
Fall1999
Fall2000
Fall2001
Fall2002
Fall2003
Fall2004
Fall2005
Fall2006
Nine-YearChange
Asian American 75 74 82 85 80 75 81 95 91 21%
Black 42 46 52 41 35 39 39 46 47 12%
Hispanic 96 97 104 108 141 127 125 115 135 41%
Native American 24 35 38 41 44 41 38 41 40 67%
Total Minority 237 252 276 275 300 282 283 297 313 32%
Total Graduate Population 2,829 2,867 2,880 2,838 2,940 3,134 3,152 3,116 3,119 10%
Minority Students as aPercent of TotalPopulation
8.4% 8.8% 9.6% 9.7% 10.2% 9.0% 9.0% 9.5% 10.0% 1.6%
Hispanic
Black
Native American
Asian American
Note: International students are excluded from the base population.
History of Graduate Ethnic Minority Student Enrollment
FACT BOOK 2006-07STUDENT INFORMATION 64

Students by Ethnic Origin
0% 5% 10% 15% 20% 25%
Iowa State University
Washington State University
Oregon State University
University of Colorado, Boulder
Ohio State University
Oklahoma State University
North Carolina State University
Michigan State University
Texas A & M University
University of Illinois, Urbana-Champaign
Colorado State University
Ethnic Minorities as a Percent of Student PopulationComparison of Peer Institutions
FACT BOOK 2006-07STUDENT INFORMATION 65
Students by Ethnic Origin
0% 5% 10% 15%
Oklahoma State University
Iowa State University
Texas A & M University
North Carolina State University
Ohio State University
Michigan State University
Washington State University
University of Colorado, Boulder
Oregon State University
University of Illinois, Urbana-Champaign
0% 5% 10% 15%
Iowa State University
North Carolina State University
Oklahoma State University
Ohio State University
Michigan State University
Oregon State Univeristy
Washington State University
University of Illinois, Urbana-Champaign
University of Colorado, Boulder
Texas A & M University
0% 5% 10% 15%
University of Illinois, Urbana-Champaign
Iowa State University
Ohio State University
Texas A & M University
North Carolina State University
Michigan State University
University of Colorado, Boulder
Washington State University
Oregon State University
Oklahoma State University
0% 5% 10% 15%
Oregon State University
University of Colorado, Boulder
Washington State University
Texas A & M University
Iowa State University
Oklahoma State University
University of Illinois, Urbana-Champaign
Ohio State University
Michigan State University
North Carolina State University
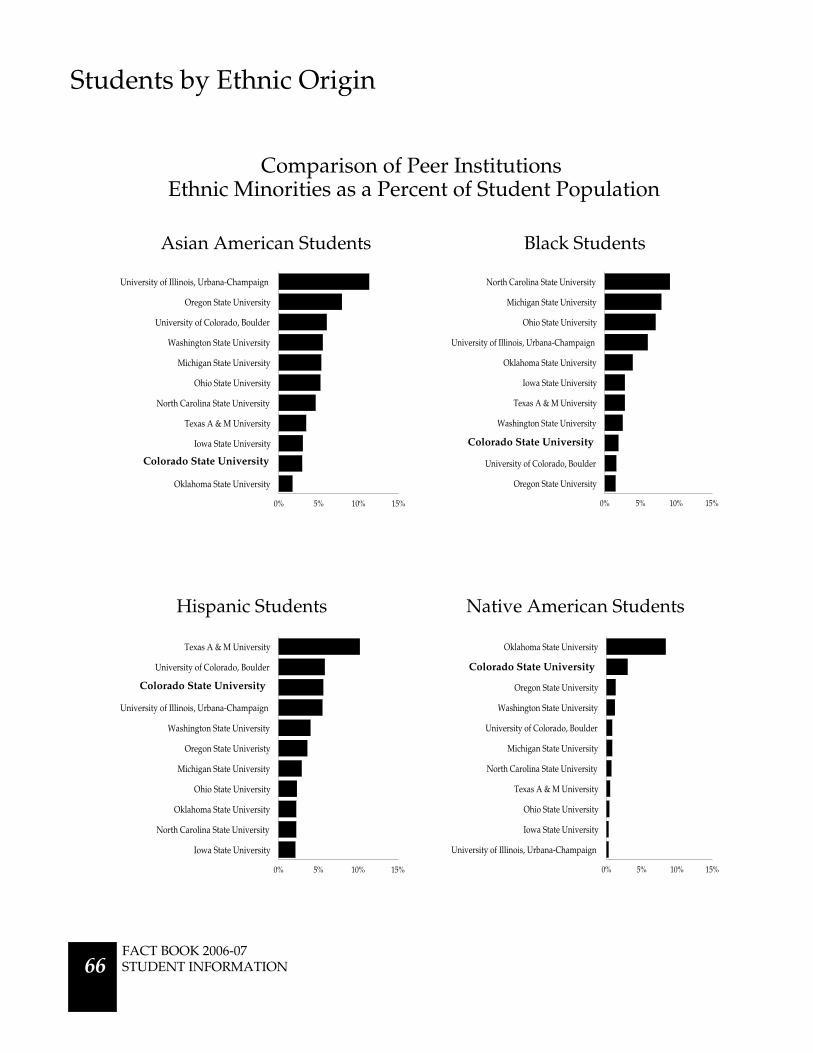
Native American Students
Asian American Students
Hispanic Students
Black Students
Colorado State University
Colorado State University
Colorado State University
Colorado State University
Comparison of Peer InstitutionsEthnic Minorities as a Percent of Student Population
FACT BOOK 2006-07STUDENT INFORMATION 66

Students by Gender
Undergraduate Students by Gender and CollegeMen Percent Men Women Percent Women Total Undergraduates
Agricultural Sciences 487 39% 749 61% 1,236
Applied Human Sciences 1,444 37% 2,505 63% 3,949
Business 1,040 55% 850 45% 1,890
Engineering 1,160 84% 218 16% 1,378
Intra-University 1,579 58% 1,148 42% 2,727
Liberal Arts 2,089 45% 2,572 55% 4,661
Natural Sciences 1,236 40% 1,818 60% 3,054
Veterinary Medicine &Biomedical Sciences 180 28% 458 72% 638
Warner College ofNatural Resources 628 65% 339 35% 967
University Summary 9,843 48% 10,657 52% 20,500
Undergraduate Students by Gender and College
0% 20% 40% 60% 80% 100%
Engineering
Warner College of Natural Resources
Intra-University
Business
Liberal Arts
Natural Sciences
Agricultural Sciences
Applied Human Sciences
Veterinary Medicine & Biomedical Sciences Women Men
FACT BOOK 2006-07STUDENT INFORMATION 67

0% 20% 40% 60% 80% 100%
Engineering
Business
Natural Sciences
Warner College of Natural Resources
Agricultural Sciences
Intra-University
Liberal Arts
Veterinary Medicine & Biomedical Sciences
Applied Human Sciences
Students by Gender
Graduate Students by Gender and CollegeMen Percent Men Women Percent Women Total Graduates
Agricultural Sciences 103 50% 105 50% 208
Applied Human Sciences 258 30% 616 70% 874
Business 87 64% 50 36% 137
Engineering 411 76% 133 24% 544
Intra-University 75 47% 84 53% 159
Liberal Arts 236 42% 329 58% 565
Natural Sciences 367 60% 246 40% 613
Veterinary Medicine &Biomedical Sciences 126 41% 180 59% 306
Warner College ofNatural Resources 132 57% 98 43% 230
University Summary 1,795 49% 1,841 51% 3,636
Graduate Students by Gender and College
Women Men
FACT BOOK 2006-07STUDENT INFORMATION 68

Students by Gender
History of Students by GenderUndergraduate Students Graduate Students
Fall Term Men Women Percent Women Men Women Percent Women
1997 9,113 9,338 50.6% 1,754 1,607 47.8%
1998 9,000 9,607 51.6% 1,755 1,625 48.1%
1999 9,091 9,709 51.6% 1,757 1,695 49.1%
2000 9,103 9,972 52.3% 1,763 1,731 49.5%
2001 9,476 10,423 52.4% 1,748 1,759 50.2%
2002 9,930 10,638 51.7% 1,836 1,794 49.4%
2003 10,110 10,568 51.1% 1,963 1,874 48.8%
2004 10,316 10,733 51.0% 1,881 1,914 50.4%
2005 10,028 10,692 51.6% 1,804 1,886 51.1%
2006 9,843 10,657 52.0% 1,795 1,841 50.6%
Fall 1997 Fall 2000 Fall 2003 Fall 20060
2,000
4,000
6,000
8,000
10,000
12,000
14,000
Fall 1997 Fall 2000 Fall 2003 Fall 20060
500
1,000
1,500
2,000
2,500
Fall 1997 Fall 2000 Fall 2003 Fall 20060
100
200
300
400
500
Undergraduate Students Graduate Students
ProfessionalVeterinary Medicine Students
Students by Gender
Women
Men Men
Women
Women
Men
FACT BOOK 2006-07STUDENT INFORMATION 69
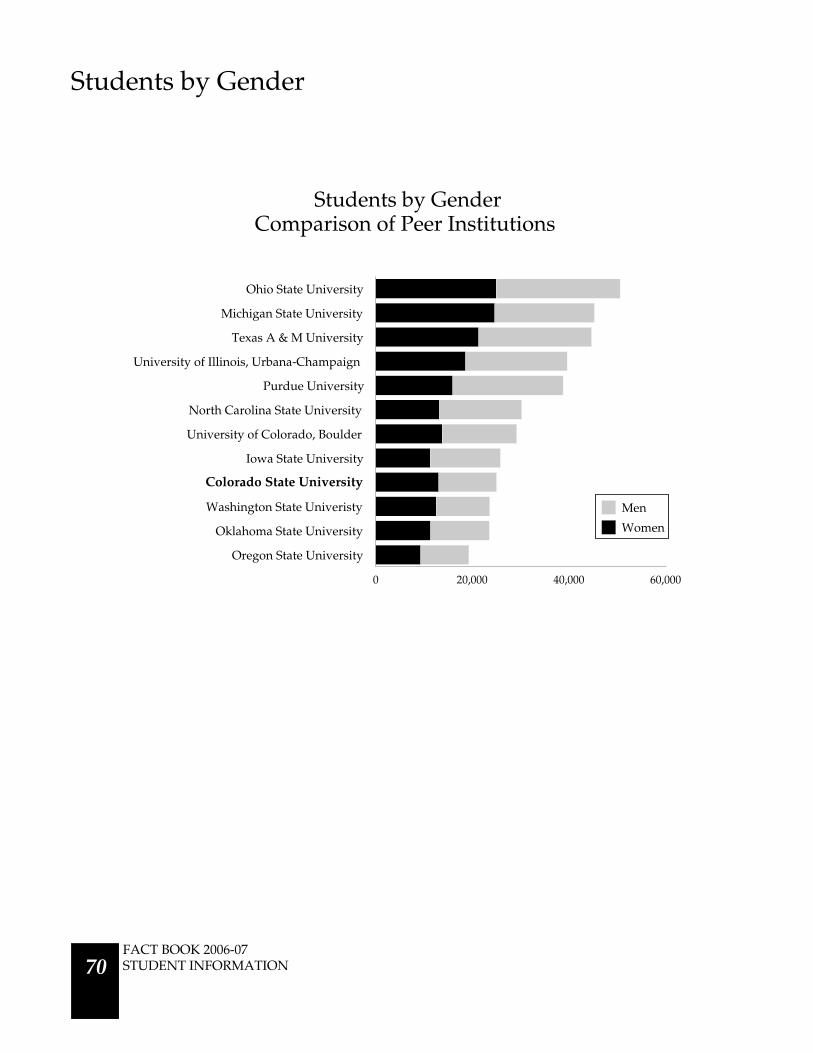
0 20,000 40,000 60,000
Oregon State University
Oklahoma State University
Washington State Univeristy
Iowa State University
University of Colorado, Boulder
North Carolina State University
Purdue University
University of Illinois, Urbana-Champaign
Texas A & M University
Michigan State University
Ohio State University
Women
Men
Students by Gender
Comparison of Peer InstitutionsStudents by Gender
Colorado State University
FACT BOOK 2006-07STUDENT INFORMATION 70
FACT BOOK 2006-07 STUDENT INFORMATION 71
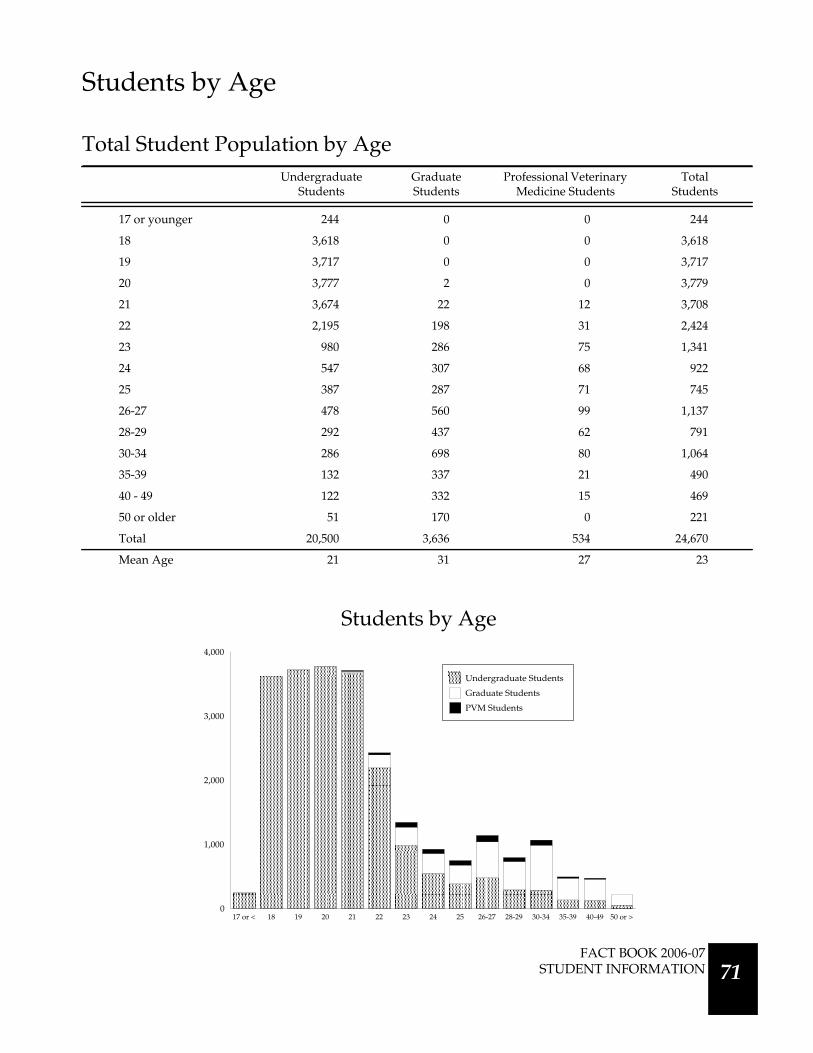
Students by Age
Total Student Population by AgeUndergraduate
StudentsGraduateStudents
Professional VeterinaryMedicine Students
TotalStudents
17 or younger 244 0 0 244
18 3,618 0 0 3,618
19 3,717 0 0 3,717
20 3,777 2 0 3,779
21 3,674 22 12 3,708
22 2,195 198 31 2,424
23 980 286 75 1,341
24 547 307 68 922
25 387 287 71 745
26-27 478 560 99 1,137
28-29 292 437 62 791
30-34 286 698 80 1,064
35-39 132 337 21 490
40 - 49 122 332 15 469
50 or older 51 170 0 221
Total 20,500 3,636 534 24,670
Mean Age 21 31 27 23
17 or < 18 19 20 21 22 23 24 25 26-27 28-29 30-34 35-39 40-49 50 or >0
1,000
2,000
3,000
4,000
Undergraduate Students
Graduate Students
PVM Students
Students by Age

FACT BOOK 2006-07STUDENT INFORMATION 72
Students by Age
History of Undergraduate Enrollment by AgeFall1999
Fall2000
Fall2001
Fall2002
Fall2003
Fall2004
Fall2005
Fall2006
Eight-YearChange
17 or < 214 189 199 224 239 220 220 244 14%
18 2,860 2,955 3,300 3,364 3,381 3,608 3,476 3,618 27%
19 3,289 3,473 3,594 3,936 3,803 3,845 3,874 3,717 13%
20 3,045 3,439 3,581 3,612 3,846 3,710 3,777 3,777 24%
21 3,176 2,992 3,366 3,478 3,518 3,758 3,585 3,674 16%
22 2,061 2,171 2,052 2,290 2,285 2,310 2,402 2,195 7%
23 996 1,019 1,024 965 1,048 1,079 1,014 980 -2%
24 673 577 594 558 568 583 596 547 -19%
25 446 436 419 425 378 425 376 387 -13%
26-27 620 553 567 565 505 520 498 478 -23%
28-29 382 349 318 335 354 317 276 292 -24%
30-34 452 427 410 383 358 337 325 286 -37%
35-39 242 205 200 175 149 128 125 132 -45%
40-49 278 231 220 199 182 150 125 122 -56%
50 or older 56 49 50 53 59 59 51 51 -9%
Not Reported 10 10 5 6 5 0 0 0 -100%
Total 18,800 19,075 19,899 20,568 20,678 21,049 20,720 20,500 9%
Fall 1998 Fall 2000 Fall 2002 Fall 2004 Fall 20060
5,000
10,000
15,000
19 to 21
22 to 24
18 or younger
28 or older
25 to 27
Undergraduate Enrollment by Age
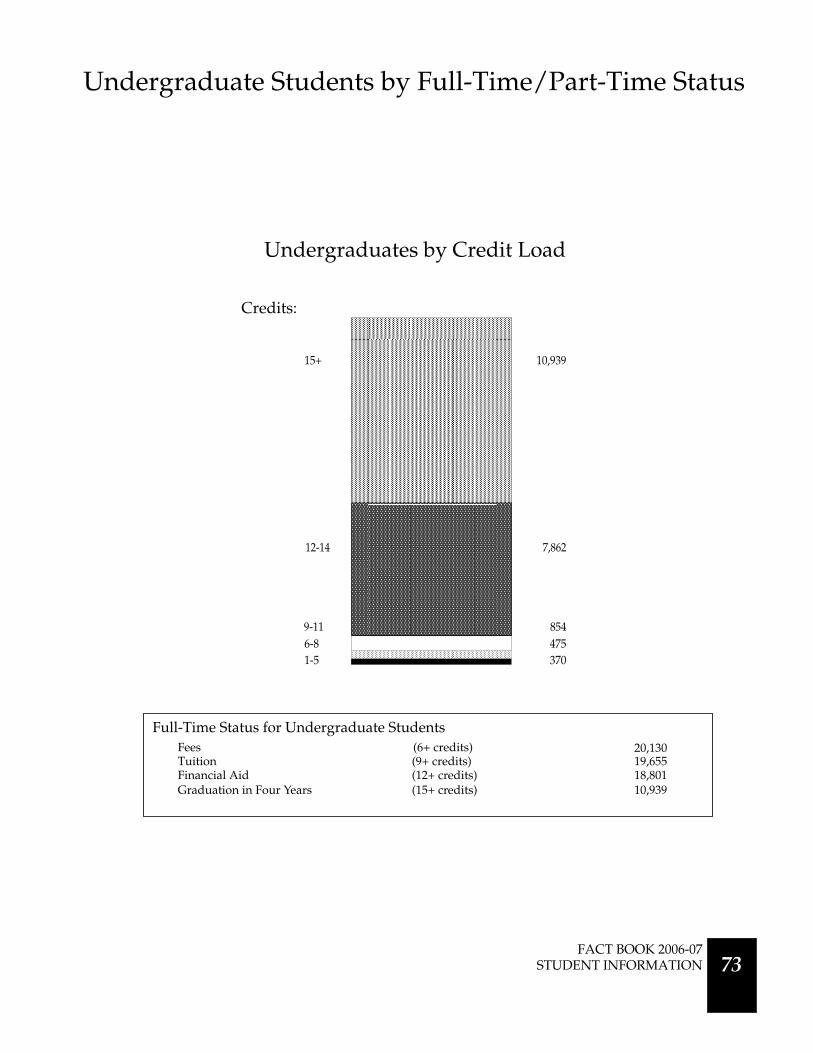
Undergraduate Students by Full-Time/Part-Time Status
Full-Time Status for Undergraduate StudentsFeesTuitionFinancial AidGraduation in Four Years
(6+ credits)(9+ credits)(12+ credits)(15+ credits)
20,13019,65518,80110,939
0
5,000
10,000
15,000
20,000
25,000
Credits:
15+
7,86212-14
8549-114756-8
3701-5
10,939
Undergraduates by Credit Load
FACT BOOK 2006-07STUDENT INFORMATION 73

Undergraduate Students by Full-Time/Part-Time Status
Enrolled for1-5 Credits
Enrolled for6 - 8 Credits
Enrolled for9-11 Credits
Enrolled for12-14 Credits
Enrolled for 15or More Credits
TotalStudents
Agricultural Sciences 14 24 51 445 702 1,236
Applied Human Sciences 65 119 181 1,542 2,042 3,949
Business 10 22 59 563 1,236 1,890
Engineering 27 43 63 534 711 1,378
Intra-University 75 50 87 1,316 1,199 2,727
Liberal Arts 90 107 201 1,620 2,643 4,661
Natural Sciences 53 72 143 1,212 1,574 3,054
Veterinary Medicine &Biomedical Sciences 13 10 14 222 379 638
Warner College ofNatural Resources 23 28 55 408 453 967
University Summary 370 475 854 7,862 10,939 20,500
Undergraduates by Credit Load
0% 25% 50% 75% 100%
Intra-University
Warner College of Natural Resources
Applied Human Sciences
Natural Sciences
Engineering
Liberal Arts
Agricultural Sciences
Veterinary Medicine & Biomedical Sciences
Business
15 or More Credits
12-14 Credits
9-11 Credits
6-8 Credits
1-5 Credits
FACT BOOK 2006-07STUDENT INFORMATION 74
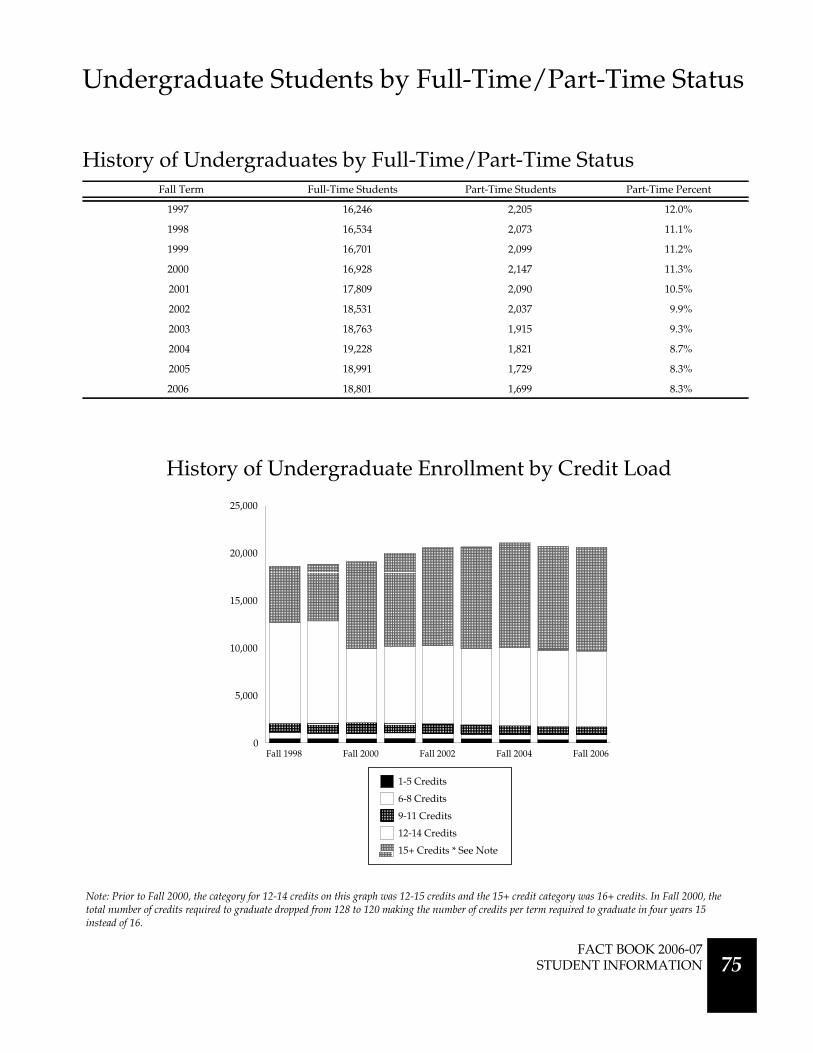
Undergraduate Students by Full-Time/Part-Time Status
History of Undergraduates by Full-Time/Part-Time StatusFall Term Full-Time Students Part-Time Students Part-Time Percent
1997 16,246 2,205 12.0%
1998 16,534 2,073 11.1%
1999 16,701 2,099 11.2%
2000 16,928 2,147 11.3%
2001 17,809 2,090 10.5%
2002 18,531 2,037 9.9%
2003 18,763 1,915 9.3%
2004 19,228 1,821 8.7%
2005 18,991 1,729 8.3%
2006 18,801 1,699 8.3%
Note: Prior to Fall 2000, the category for 12-14 credits on this graph was 12-15 credits and the 15+ credit category was 16+ credits. In Fall 2000, thetotal number of credits required to graduate dropped from 128 to 120 making the number of credits per term required to graduate in four years 15instead of 16.
History of Undergraduate Enrollment by Credit Load
Fall 1998 Fall 2000 Fall 2002 Fall 2004 Fall 20060
5,000
10,000
15,000
20,000
25,000
1-5 Credits
6-8 Credits
9-11 Credits
12-14 Credits
15+ Credits * See Note
FACT BOOK 2006-07STUDENT INFORMATION 75

Undergraduate Students by Full-Time/Part-Time Status
0% 20% 40% 60% 80% 100%
Purdue University
Iowa State University
North Carolina State University
University of Colorado, Boulder
Texas A & M University
Ohio State University
Michigan State University
Oklahoma State University
Oregon State University
Washington State University
Part-Time Students
Full-Time Students
Colorado State University
Comparison of Peer InstitutionsUndergraduates by Full-Time/Part-Time Status
FACT BOOK 2006-07STUDENT INFORMATION 76
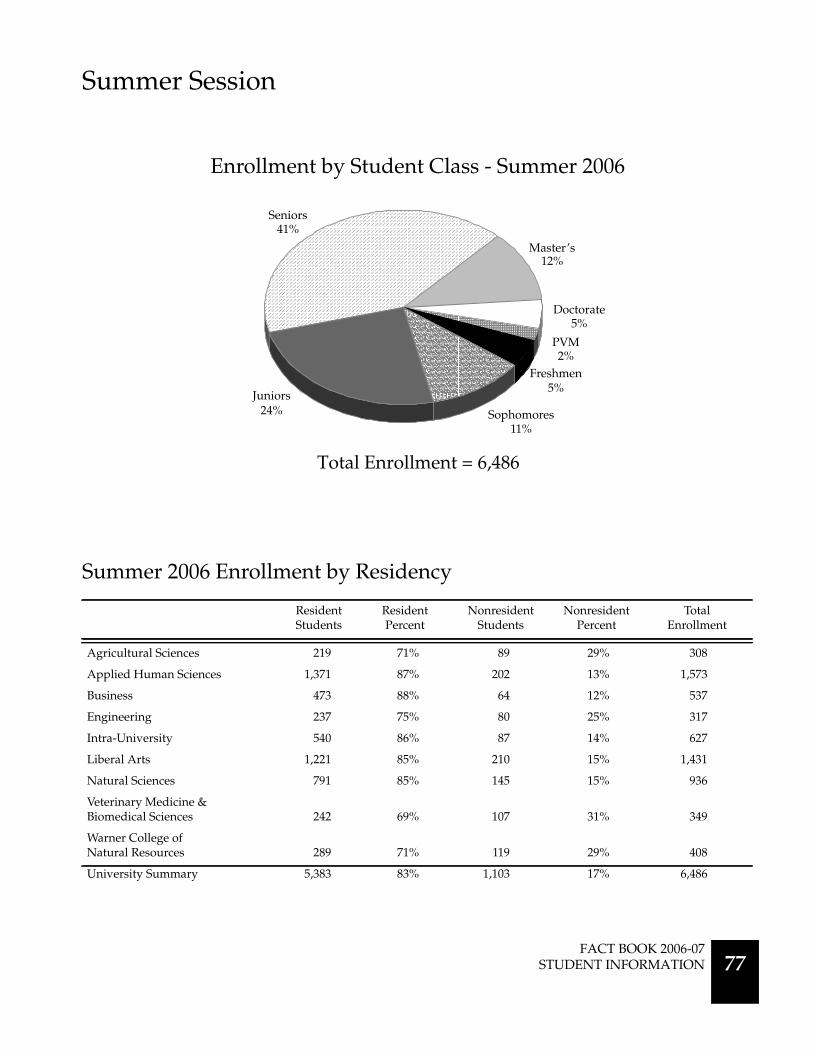
Summer Session
Summer 2006 Enrollment by Residency
ResidentStudents
ResidentPercent
NonresidentStudents
NonresidentPercent
TotalEnrollment
Agricultural Sciences 219 71% 89 29% 308
Applied Human Sciences 1,371 87% 202 13% 1,573
Business 473 88% 64 12% 537
Engineering 237 75% 80 25% 317
Intra-University 540 86% 87 14% 627
Liberal Arts 1,221 85% 210 15% 1,431
Natural Sciences 791 85% 145 15% 936
Veterinary Medicine &Biomedical Sciences 242 69% 107 31% 349
Warner College ofNatural Resources 289 71% 119 29% 408
University Summary 5,383 83% 1,103 17% 6,486
5%
11%24%
41%
12%
5%
2%
Enrollment by Student Class - Summer 2006
Freshmen5%
Sophomores11%
Juniors24%
Seniors41%
Master’s12%
Doctorate5%
PVM2%
Total Enrollment = 6,486
FACT BOOK 2006-07 STUDENT INFORMATION 77
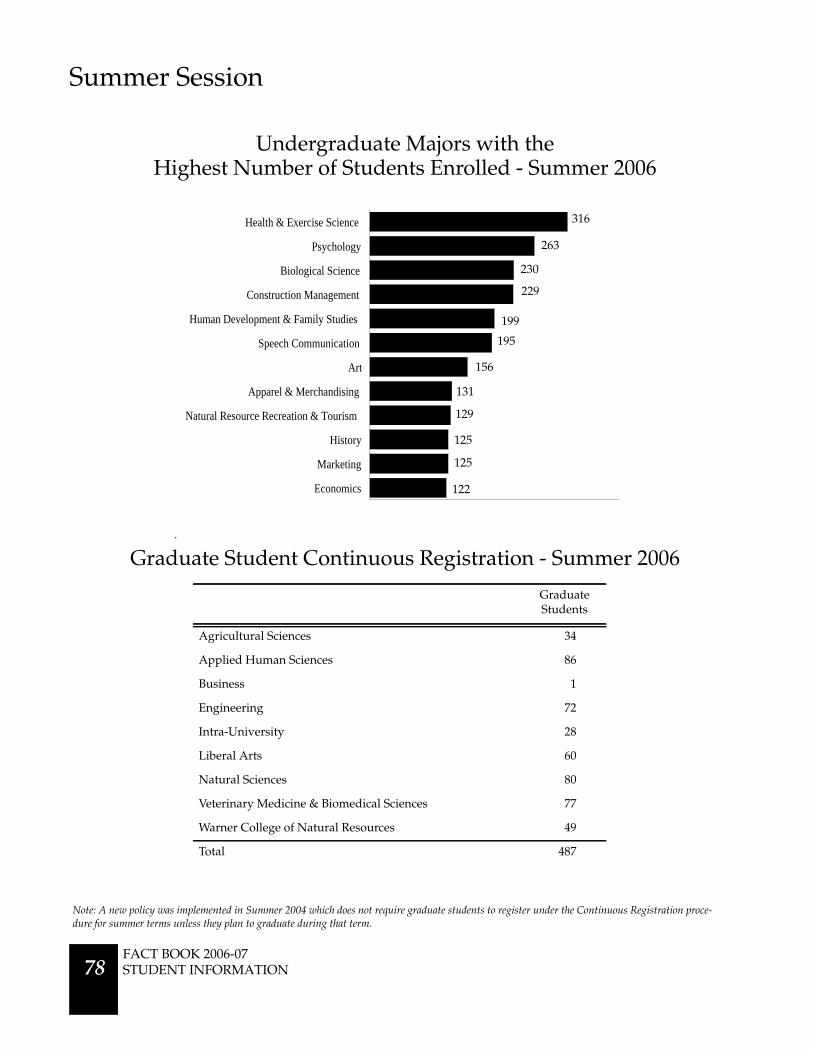
0 100 200 300 400
Economics
Marketing
History
Natural Resource Recreation & Tourism
Apparel & Merchandising
Art
Speech Communication
Human Development & Family Studies
Construction Management
Biological Science
Psychology
Health & Exercise Science
Summer Session
GraduateStudents
Agricultural Sciences 34
Applied Human Sciences 86
Business 1
Engineering 72
Intra-University 28
Liberal Arts 60
Natural Sciences 80
Veterinary Medicine & Biomedical Sciences 77
Warner College of Natural Resources 49
Total 487
.
Graduate Student Continuous Registration - Summer 2006
Undergraduate Majors with theHighest Number of Students Enrolled - Summer 2006
316
263
230
229
199
195
156
131
129
125
125
122
Note: A new policy was implemented in Summer 2004 which does not require graduate students to register under the Continuous Registration proce-dure for summer terms unless they plan to graduate during that term.
131
FACT BOOK 2006-07STUDENT INFORMATION 78
Summer Session
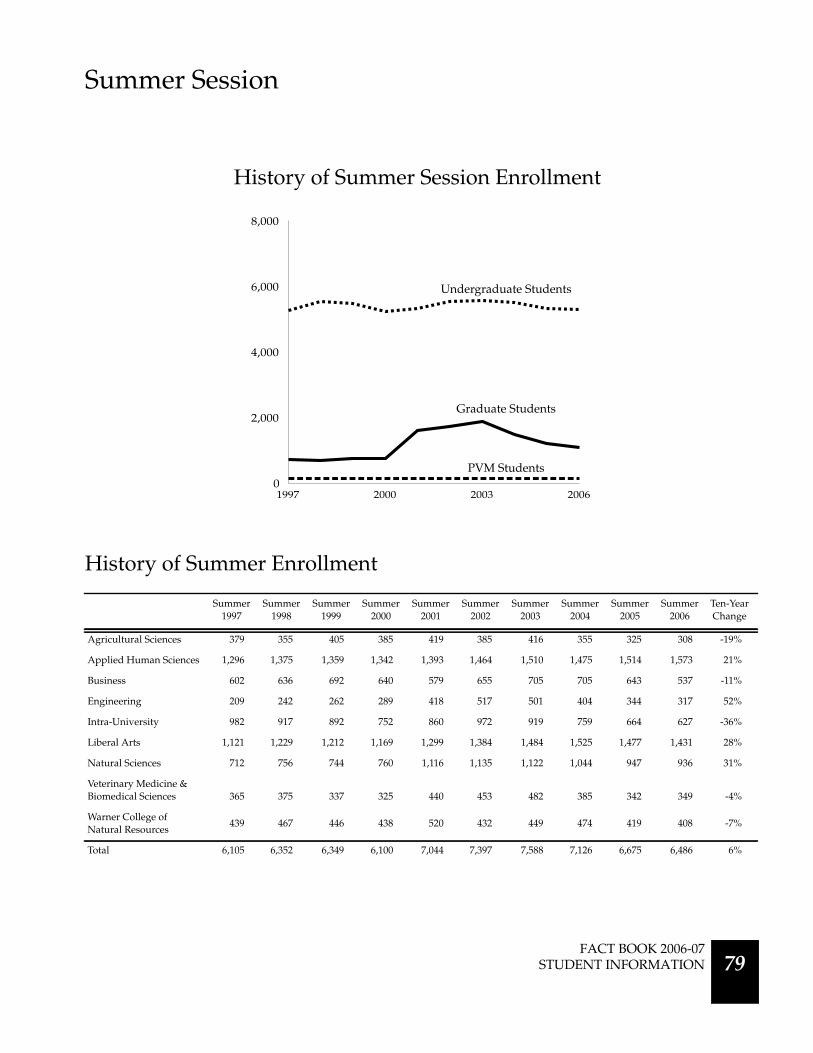
History of Summer Enrollment
Summer1997
Summer1998
Summer1999
Summer2000
Summer2001
Summer2002
Summer2003
Summer2004
Summer2005
Summer2006
Ten-YearChange
Agricultural Sciences 379 355 405 385 419 385 416 355 325 308 -19%
Applied Human Sciences 1,296 1,375 1,359 1,342 1,393 1,464 1,510 1,475 1,514 1,573 21%
Business 602 636 692 640 579 655 705 705 643 537 -11%
Engineering 209 242 262 289 418 517 501 404 344 317 52%
Intra-University 982 917 892 752 860 972 919 759 664 627 -36%
Liberal Arts 1,121 1,229 1,212 1,169 1,299 1,384 1,484 1,525 1,477 1,431 28%
Natural Sciences 712 756 744 760 1,116 1,135 1,122 1,044 947 936 31%
Veterinary Medicine &Biomedical Sciences 365 375 337 325 440 453 482 385 342 349 -4%
Warner College ofNatural Resources
439 467 446 438 520 432 449 474 419 408 -7%
Total 6,105 6,352 6,349 6,100 7,044 7,397 7,588 7,126 6,675 6,486 6%
1997 2000 2003 20060
2,000
4,000
6,000
8,000
History of Summer Session Enrollment
Undergraduate Students
Graduate Students
PVM Students
FACT BOOK 2006-07 STUDENT INFORMATION 79
Summer Session
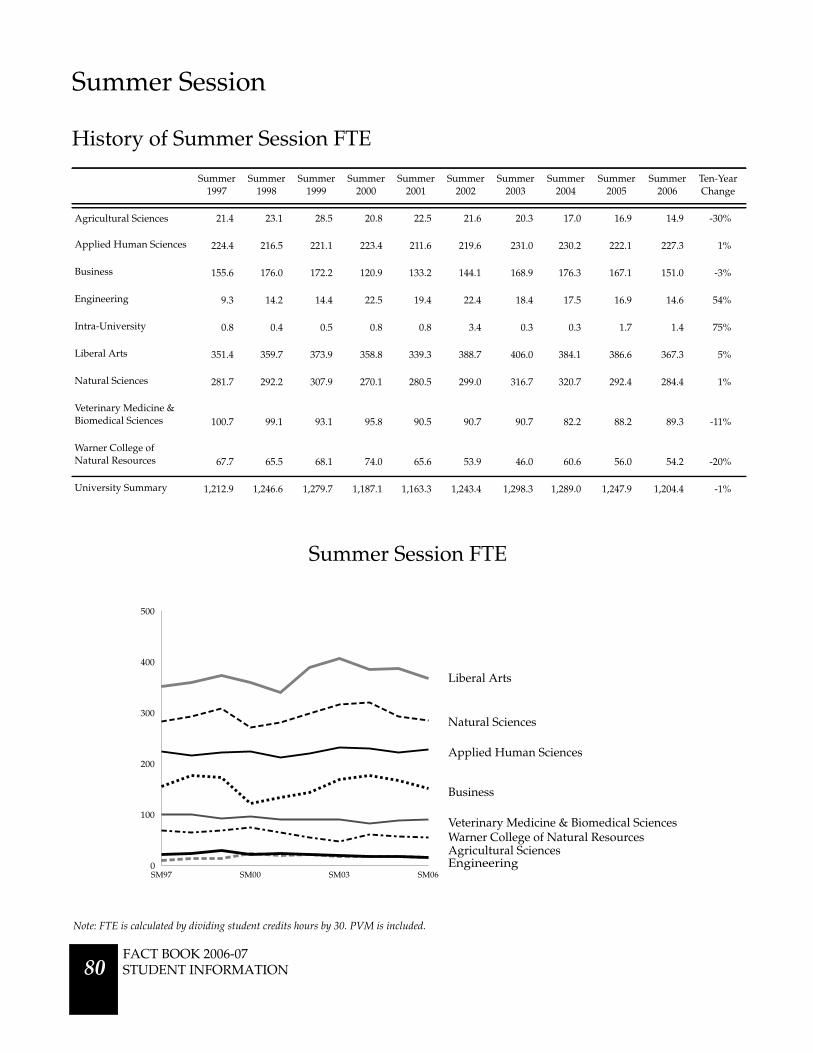
History of Summer Session FTE
Summer1997
Summer1998
Summer1999
Summer2000
Summer2001
Summer2002
Summer2003
Summer2004
Summer2005
Summer2006
Ten-YearChange
Agricultural Sciences 21.4 23.1 28.5 20.8 22.5 21.6 20.3 17.0 16.9 14.9 -30%
Applied Human Sciences 224.4 216.5 221.1 223.4 211.6 219.6 231.0 230.2 222.1 227.3 1%
Business 155.6 176.0 172.2 120.9 133.2 144.1 168.9 176.3 167.1 151.0 -3%
Engineering 9.3 14.2 14.4 22.5 19.4 22.4 18.4 17.5 16.9 14.6 54%
Intra-University 0.8 0.4 0.5 0.8 0.8 3.4 0.3 0.3 1.7 1.4 75%
Liberal Arts 351.4 359.7 373.9 358.8 339.3 388.7 406.0 384.1 386.6 367.3 5%
Natural Sciences 281.7 292.2 307.9 270.1 280.5 299.0 316.7 320.7 292.4 284.4 1%
Veterinary Medicine &Biomedical Sciences 100.7 99.1 93.1 95.8 90.5 90.7 90.7 82.2 88.2 89.3 -11%
Warner College ofNatural Resources 67.7 65.5 68.1 74.0 65.6 53.9 46.0 60.6 56.0 54.2 -20%
University Summary 1,212.9 1,246.6 1,279.7 1,187.1 1,163.3 1,243.4 1,298.3 1,289.0 1,247.9 1,204.4 -1%
SM97 SM00 SM03 SM060
100
200
300
400
500
Liberal Arts
Natural Sciences
Applied Human Sciences
Business
Veterinary Medicine & Biomedical SciencesWarner College of Natural Resources
EngineeringAgricultural Sciences
Summer Session FTE
Note: FTE is calculated by dividing student credits hours by 30. PVM is included.
FACT BOOK 2006-07STUDENT INFORMATION 80

Student Credit Hour Production
Student Credit Hours by College and Course Level - Academic Year 2005-06
LowerLevel
UpperLevel
Master’sLevel
DoctoralLevel
ProfessionalVet Med Total
Agricultural Sciences 12,607.7 14,014.3 1,935.1 755.4 -- 29,312.4
Applied Human Sciences 34,497.0 42,478.0 12,005.7 1,842.0 -- 90,822.7
Business 13,796.0 31,400.0 1,990.0 0.0 -- 47,186.0
Engineering 6,008.0 14,513.0 5,259.6 2,140.6 -- 27,941.1
Intra-University 2,665.5 2,219.0 12.8 5.0 -- 4,902.3
Liberal Arts 140,221.9 62,616.3 6,335.5 521.0 -- 209,694.6
Natural Sciences 106,116.0 37,201.5 6,486.8 3,651.1 -- 153,455.3
Veterinary Medicine &Biomedical Sciences 6,350.0 16,125.0 3,041.3 2,950.3 21,178.4 49,645.0
Warner College ofNatural Resources 8,079.0 11,848.0 2,381.4 457.7 -- 22,766.1
University Total 330,341.0 232,415.1 39,448.2 12,323.0 21,178.4 635,705.6
8%
24%4%
7%
4%
33% 14%
1%
5%
Liberal Arts33%
Engineering4%
Agricultural Sciences5%
Warner College of Natural Resources4%
Veterinary Medicine &
8%Business7%
Natural Sciences24%
Percentage of Student Credit Hours by College
Applied Human Sciences14%
Note: Course credit reassignment is included.
Total Student Credit Hours = 635,705.6
Intra-University1%
Biomedical Sciences
FACT BOOK 2006-07STUDENT INFORMATION 81

Student Credit Hour Production
Average Credit Hour Load - Fall 2006
All Undergraduate Students New Freshmen
Agricultural Sciences 14.7 15.0
Applied Human Sciences 14.1 14.5
Business 14.4 14.6
Engineering 14.1 14.3
Intra-University 13.6 14.0
Liberal Arts 14.1 14.8
Natural Sciences 14.2 14.6
Veterinary Medicine & Biomedical Sciences 14.5 14.9
Warner College of Natural Resources 13.9 14.2
University Average 14.1 14.5
13.0 14.0 15.0 16.0
Intra-University
Warner College of Natural Resources
Engineering
Applied Human Sciences
Business
Natural Sciences
Liberal Arts
Veterinary Medicine & Biomedical Sciences
Agricultural Sciences
All Undergraduate Students
New Freshmen
Average Credit Load by College
FACT BOOK 2006-07STUDENT INFORMATION 82
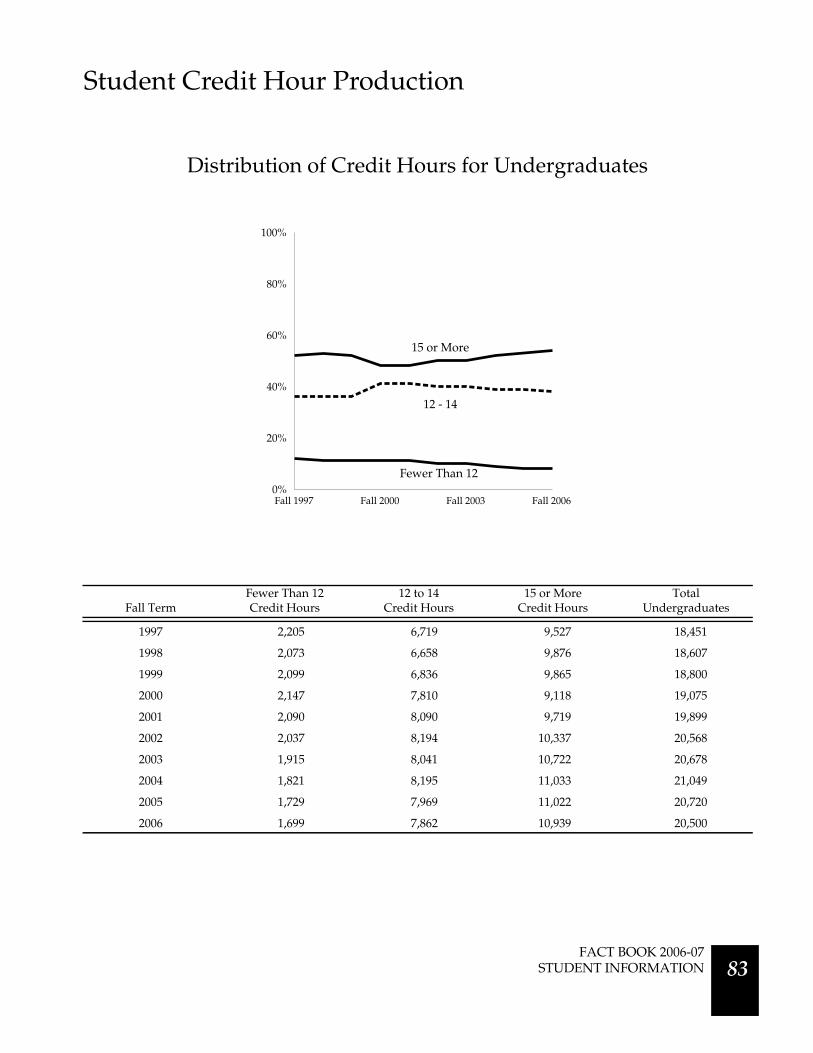
Student Credit Hour Production
Fall TermFewer Than 12Credit Hours
12 to 14Credit Hours
15 or MoreCredit Hours
TotalUndergraduates
1997 2,205 6,719 9,527 18,451
1998 2,073 6,658 9,876 18,607
1999 2,099 6,836 9,865 18,800
2000 2,147 7,810 9,118 19,075
2001 2,090 8,090 9,719 19,899
2002 2,037 8,194 10,337 20,568
2003 1,915 8,041 10,722 20,678
2004 1,821 8,195 11,033 21,049
2005 1,729 7,969 11,022 20,720
2006 1,699 7,862 10,939 20,500
Fall 1997 Fall 2000 Fall 2003 Fall 20060%
20%
40%
60%
80%
100%
Distribution of Credit Hours for Undergraduates
15 or More
12 - 14
Fewer Than 12
FACT BOOK 2006-07STUDENT INFORMATION 83
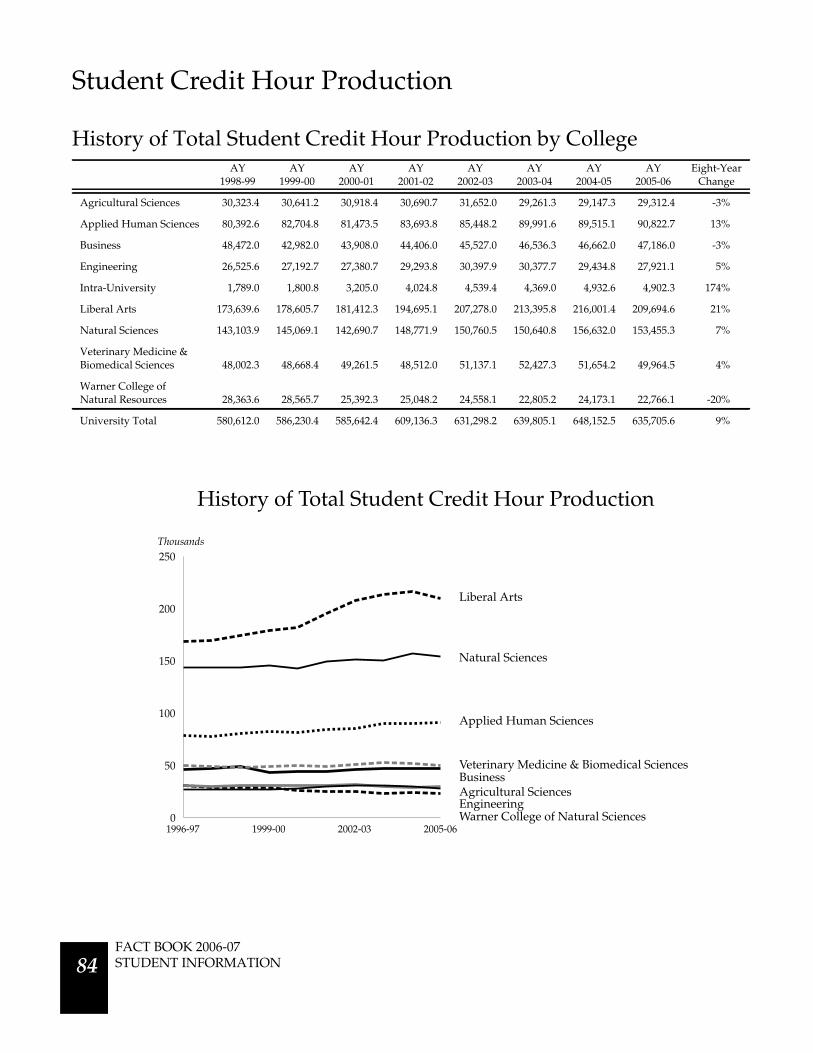
Student Credit Hour Production
History of Total Student Credit Hour Production by CollegeAY
1998-99AY
1999-00AY
2000-01AY
2001-02AY
2002-03AY
2003-04AY
2004-05AY
2005-06Eight-Year
Change
Agricultural Sciences 30,323.4 30,641.2 30,918.4 30,690.7 31,652.0 29,261.3 29,147.3 29,312.4 -3%
Applied Human Sciences 80,392.6 82,704.8 81,473.5 83,693.8 85,448.2 89,991.6 89,515.1 90,822.7 13%
Business 48,472.0 42,982.0 43,908.0 44,406.0 45,527.0 46,536.3 46,662.0 47,186.0 -3%
Engineering 26,525.6 27,192.7 27,380.7 29,293.8 30,397.9 30,377.7 29,434.8 27,921.1 5%
Intra-University 1,789.0 1,800.8 3,205.0 4,024.8 4,539.4 4,369.0 4,932.6 4,902.3 174%
Liberal Arts 173,639.6 178,605.7 181,412.3 194,695.1 207,278.0 213,395.8 216,001.4 209,694.6 21%
Natural Sciences 143,103.9 145,069.1 142,690.7 148,771.9 150,760.5 150,640.8 156,632.0 153,455.3 7%
Veterinary Medicine &Biomedical Sciences 48,002.3 48,668.4 49,261.5 48,512.0 51,137.1 52,427.3 51,654.2 49,964.5 4%
Warner College ofNatural Resources 28,363.6 28,565.7 25,392.3 25,048.2 24,558.1 22,805.2 24,173.1 22,766.1 -20%
University Total 580,612.0 586,230.4 585,642.4 609,136.3 631,298.2 639,805.1 648,152.5 635,705.6 9%
1996-97 1999-00 2002-03 2005-060
50
100
150
200
250
History of Total Student Credit Hour Production
Liberal Arts
Natural Sciences
Applied Human Sciences
Veterinary Medicine & Biomedical SciencesBusinessAgricultural SciencesEngineeringWarner College of Natural Sciences
Thousands
FACT BOOK 2006-07STUDENT INFORMATION 84

Student Credit Hour Production
History of Undergraduate Student Credit Hour Production by CollegeAY
1998-99AY
1999-00AY
2000-01AY
2001-02AY
2002-03AY
2003-04AY
2004-05AY
2005-06Eight-Year
Change
Agricultural Sciences 27,406.1 27,698.8 28,321.0 28,106.5 28,756.3 26,199.8 26,514.8 26,621.9 -3%
Applied Human Sciences 70,703.5 72,228.3 71,159.9 72,494.3 72,831.3 75,259.6 75,162.1 76,975.0 9%
Business 44,001.0 38,719.0 40,231.0 41,834.0 43,013.0 44,345.0 44,351.0 45,196.0 3%
Engineering 20,331.4 20,527.2 20,706.9 22,253.6 22,499.1 22.544.0 21,319.0 20,521.0 1%
Intra-University 1,720.9 1,755.0 3,147.0 3,754.0 4,182.0 4,344.0 4,879.8 4,884.5 184%
Liberal Arts 167,747.1 172,492.0 175,217.5 188,166.5 200,285.5 206,082.8 209,134.0 202,838.1 21%
Natural Sciences 133,379.6 135,467.7 132,611.9 138,719.2 140,665.9 140,291.0 146,812.5 143,317.5 7%
Veterinary Medicine &Biomedical Sciences 21,934.0 22,091.9 21,807.5 20,995.5 22,717.8 24,748.8 23,866.3 22,475.0 2%
Warner College ofNatural Resources 24,531.4 24,964.2 21,843.6 22,082.6 21,802.1 19,786.1 21,218.6 19,927.0 -19%
University Total 511,755.0 515,944.1 515,046.2 538,406.2 556,752.9 563,601.1 573,258.0 562,756.1 10%
1996-97 1999-00 2002-03 2005-060
50
100
150
200
250
History of Undergraduate Student Credit Hour Production
Liberal Arts
Natural Sciences
Applied Human Sciences
BusinessAgricultural SciencesVeterinary Medicine & Biomedical SciencesEngineeringWarner College of Natural Resources
Thousands
FACT BOOK 2006-07STUDENT INFORMATION 85

Student Credit Hour Production
History of Total Graduate Credit Hour Production by CollegeAY
1998-99AY
1999-00AY
2000-01AY
2001-02AY
2002-03AY
2003-04AY
2004-05AY
2005-06Eight-Year
Change
Agricultural Sciences 2,917.3 2,942.4 2,597.4 2,584.2 2,895.8 3,061.5 2,632.6 2,690.5 -8%
Applied Human Sciences 9,689.1 10,476.6 10,313.6 11,199.5 12,616.9 14,732.0 14,353.0 13,847.7 43%
Business 4,471.0 4,263.0 3,677.0 2,572.0 2,514.0 2,191.3 2,311.0 1,990.0 -55%
Engineering 6,194.2 6,665.5 6,673.8 7,040.3 7,898.8 7,833.7 8,115.8 7,400.1 19%
Intra-University 68.1 45.6 58.1 270.8 357.3 25.0 52.8 17.8 -74%
Liberal Arts 5,892.5 6,113.6 6,194.7 6,528.7 6,992.6 7,313.0 6,867.4 6,856.5 16%
Natural Sciences 9,724.3 9,601.5 10,078.8 10,052.7 10,094.5 10,349.8 9,819.5 10,137.8 4%
Veterinary Medicine &Biomedical Sciences 5,583.3 6,149.6 6,655.9 6,727.3 7,218.2 6,721.5 6,474.6 5,991.6 7%
Warner College ofNatural Resources 3,832.2 3,601.5 3,548.8 2,956.0 2,756.0 3,019.1 2,954.5 2,839.1 -26%
University Total 48,372.0 49,859.3 49,798.1 49,941.1 53,344.1 55,247.0 53,581.3 51,771.1 7%
1996-97 1999-00 2002-03 2005-060
5,000
10,000
15,000
History of Graduate Student Credit Hour Production
Applied Human Sciences
Natural Sciences
EngineeringLiberal ArtsVeterinary Medicine & Biomedical Sciences
Warner College of Natural ResourcesAgricultural SciencesBusiness
FACT BOOK 2006-07STUDENT INFORMATION 86
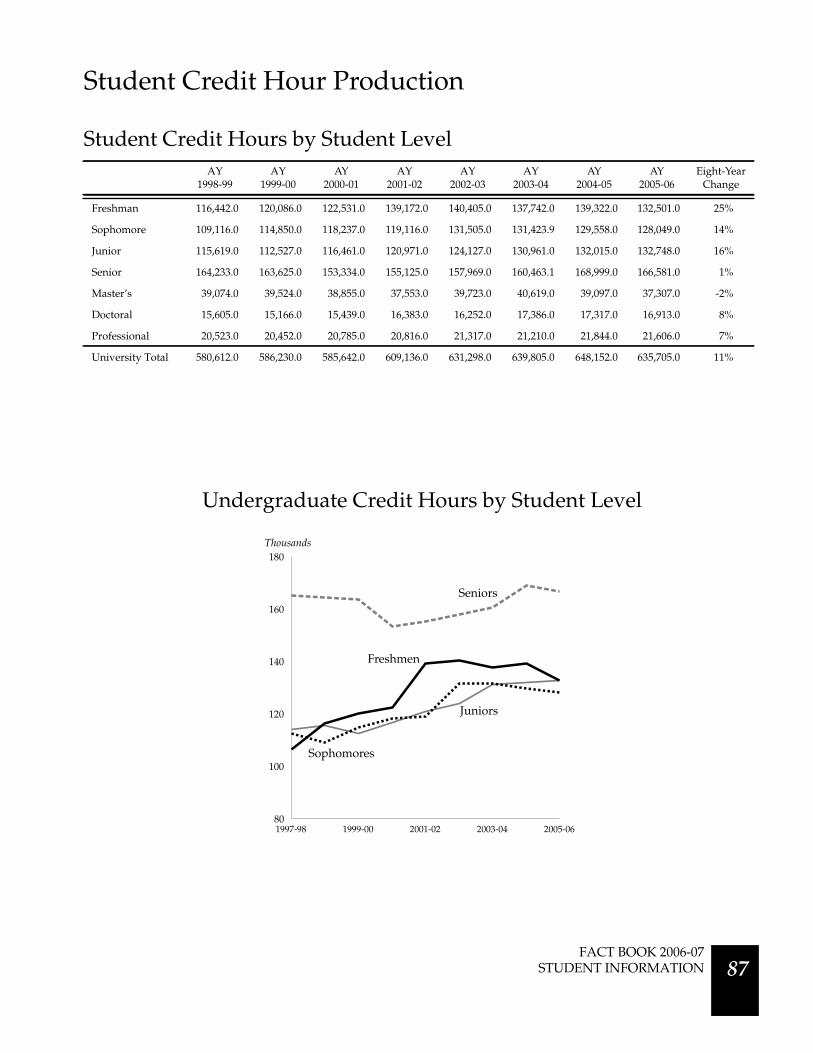
Student Credit Hour Production
Student Credit Hours by Student LevelAY
1998-99AY
1999-00AY
2000-01AY
2001-02AY
2002-03AY
2003-04AY
2004-05AY
2005-06Eight-Year
Change
Freshman 116,442.0 120,086.0 122,531.0 139,172.0 140,405.0 137,742.0 139,322.0 132,501.0 25%
Sophomore 109,116.0 114,850.0 118,237.0 119,116.0 131,505.0 131,423.9 129,558.0 128,049.0 14%
Junior 115,619.0 112,527.0 116,461.0 120,971.0 124,127.0 130,961.0 132,015.0 132,748.0 16%
Senior 164,233.0 163,625.0 153,334.0 155,125.0 157,969.0 160,463.1 168,999.0 166,581.0 1%
Master’s 39,074.0 39,524.0 38,855.0 37,553.0 39,723.0 40,619.0 39,097.0 37,307.0 -2%
Doctoral 15,605.0 15,166.0 15,439.0 16,383.0 16,252.0 17,386.0 17,317.0 16,913.0 8%
Professional 20,523.0 20,452.0 20,785.0 20,816.0 21,317.0 21,210.0 21,844.0 21,606.0 7%
University Total 580,612.0 586,230.0 585,642.0 609,136.0 631,298.0 639,805.0 648,152.0 635,705.0 11%
1997-98 1999-00 2001-02 2003-04 2005-0680
100
120
140
160
180
Undergraduate Credit Hours by Student Level
Thousands
Seniors
Freshmen
Juniors
Sophomores
FACT BOOK 2006-07STUDENT INFORMATION 87

Student Credit Hour Production
Change in Student Credit Hours from Previous Year
Total Credit HoursTotal Change from
Previous YearPercent Change from
Previous Year
AY 1996-97 575,651.6 3,394.5 0.6%
AY 1997-98 571,890.2 -3,761.4 -0.7%
AY 1998-99 580,612.0 8,721.8 1.5%
AY 1999-00 586,230.4 5,618.4 1.0%
AY 2000-01 585,756.0 -474.4 -0.1%
AY 2001-02 609,136.3 23,380.3 4.0%
AY 2002-03 631,298.2 22,161.9 3.6%
AY 2003-04 639,805.0 8,506.8 1.3%
AY 2004-05 648,152.0 8,347.0 1.3%
AY 2005-06 635,705.6 -12,446.4 -1.9%
1996-97 1999-00 2002-03 2005-06-6%
-4%
-2%
0%
2%
4%
6%
Percentage Change in Student Credit Hoursfrom Previous Year
FACT BOOK 2006-07STUDENT INFORMATION 88

0 2,000 4,000 6,000 8,000
Warner College of Natural Resources
Engineering
Agricultural Sciences
Business
Veterinary Medicine & Biomedical Sciences
Applied Human Sciences
Natural Sciences
Liberal Arts
PVM FTE
Graduate FTE
Undergraduate FTE
Student FTE Production
FTE by College and Course Level - Academic-Year 2005-06
LowerLevel
UpperLevel
Master’sLevel
DoctoralLevel
ProfessionalVet Med
TotalFTE
Agricultural Sciences 420.3 467.1 64.5 25.2 -- 977.1
Applied Human Sciences 1,149.9 1,415.9 400.2 61.4 -- 3,027.4
Business 459.9 1,046.7 66.3 0.0 -- 1,572.9
Engineering 200.3 483.8 175.3 71.4 -- 930.7
Intra-University 88.8 74.0 0.4 0.2 -- 163.4
Liberal Arts 4,674.1 2,087.2 211.2 17.4 -- 6,989.8
Natural Sciences 3,537.2 1,240.0 216.2 121.7 -- 5,115.2
Veterinary Medicine &Biomedical Sciences 211.7 537.5 101.4 98.3 705.9 1,654.8
Warner College ofNatural Resources 269.3 394.9 79.4 15.3 -- 758.9
University Total 11,011.4 7,747.2 1,314.9 410.8 705.9 21,190.2
Note: FTE (Full-Time Equivalent) students are calculated by dividing student credit hours generated by 30. Course credit reassignment is included.
Course Level FTE by College
FACT BOOK 2006-07 STUDENT INFORMATION 89
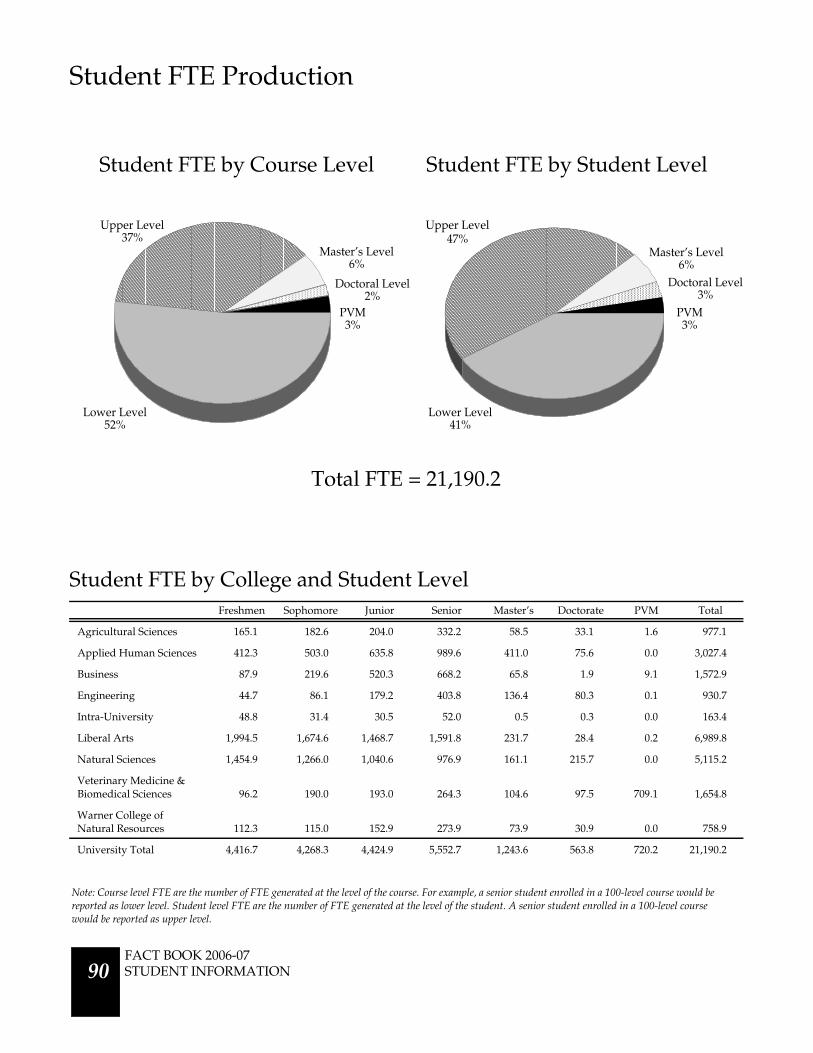
Student FTE Production
Student FTE by College and Student LevelFreshmen Sophomore Junior Senior Master’s Doctorate PVM Total
Agricultural Sciences 165.1 182.6 204.0 332.2 58.5 33.1 1.6 977.1
Applied Human Sciences 412.3 503.0 635.8 989.6 411.0 75.6 0.0 3,027.4
Business 87.9 219.6 520.3 668.2 65.8 1.9 9.1 1,572.9
Engineering 44.7 86.1 179.2 403.8 136.4 80.3 0.1 930.7
Intra-University 48.8 31.4 30.5 52.0 0.5 0.3 0.0 163.4
Liberal Arts 1,994.5 1,674.6 1,468.7 1,591.8 231.7 28.4 0.2 6,989.8
Natural Sciences 1,454.9 1,266.0 1,040.6 976.9 161.1 215.7 0.0 5,115.2
Veterinary Medicine &Biomedical Sciences 96.2 190.0 193.0 264.3 104.6 97.5 709.1 1,654.8
Warner College ofNatural Resources 112.3 115.0 152.9 273.9 73.9 30.9 0.0 758.9
University Total 4,416.7 4,268.3 4,424.9 5,552.7 1,243.6 563.8 720.2 21,190.2
52%
37%
6%
2%
3%PVM3%
Lower Level52%
Master’s Level6%
Doctoral Level2%
Student FTE by Course Level Student FTE by Student Level
41%
47%
6%
3%
3%PVM3%
Lower Level41%
Master’s Level6%
Doctoral Level3%
Upper Level37%
Upper Level47%
Note: Course level FTE are the number of FTE generated at the level of the course. For example, a senior student enrolled in a 100-level course would bereported as lower level. Student level FTE are the number of FTE generated at the level of the student. A senior student enrolled in a 100-level coursewould be reported as upper level.
Total FTE = 21,190.2
FACT BOOK 2006-07STUDENT INFORMATION 90
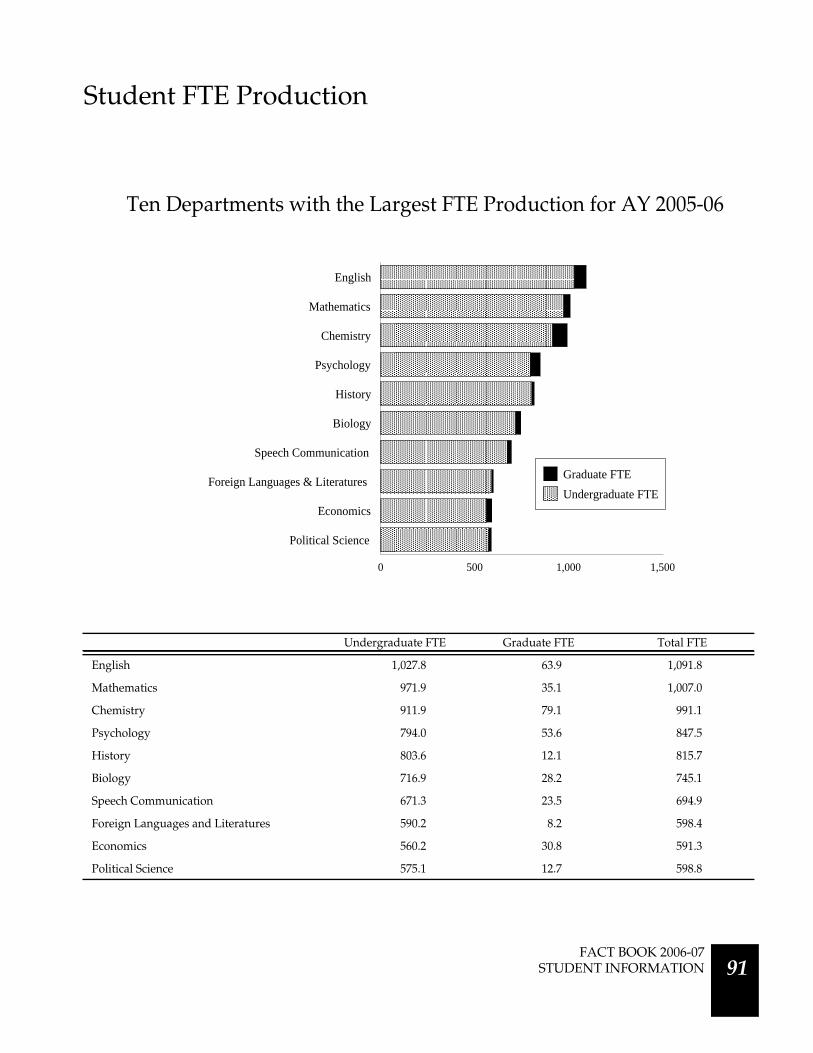
Student FTE Production
Undergraduate FTE Graduate FTE Total FTE
English 1,027.8 63.9 1,091.8
Mathematics 971.9 35.1 1,007.0
Chemistry 911.9 79.1 991.1
Psychology 794.0 53.6 847.5
History 803.6 12.1 815.7
Biology 716.9 28.2 745.1
Speech Communication 671.3 23.5 694.9
Foreign Languages and Literatures 590.2 8.2 598.4
Economics 560.2 30.8 591.3
Political Science 575.1 12.7 598.8
0 500 1,000 1,500
Political Science
Economics
Foreign Languages & Literatures
Speech Communication
Biology
History
Psychology
Chemistry
Mathematics
English
Undergraduate FTE
Graduate FTE
Ten Departments with the Largest FTE Production for AY 2005-06
FACT BOOK 2006-07 STUDENT INFORMATION 91

1996-97 1999-00 2002-03 2005-060
3,000
6,000
9,000
12,000
15,000
18,000
Student FTE Production
History of Student FTE by Residency and Student LevelAY
1998-99AY
1999-00AY
2000-01AY
2001-02AY
2002-03AY
2003-04AY
2004-05AY
2005-06Eight-Year
Change
Undergraduate Resident 13,279.4 13,489.8 13,524.6 14,120.2 14,734.8 15,065.4 15,429.7 15,291.6 15%
Undergraduate Nonresident 3,567.6 3,546.5 3,494.2 3,692.6 3,732.1 3,620.9 3,566.7 3,371.1 -6%
Graduate Resident 1,172.4 1,158.0 1,140.9 1,136.0 1,212.5 1,291.7 1,304.8 1,233.3 5%
Graduate Nonresident 653.3 667.7 670.1 662.9 657.4 650.3 593.4 588.3 -10%
Prof Vet Med Resident 355.3 374.1 395.0 391.3 399.1 393.8 402.4 390.3 10%
Prof Vet Med Nonresident 325.7 304.9 300.4 301.5 307.4 304.7 308.0 315.6 -3%
Total Resident 14,807.1 15,021.9 15,060.5 15,647.5 16,346.4 16,750.9 17,137.0 16,915.2 14%
Total Nonresident 4,546.6 4,519.1 4,464.7 4,657.0 4,696.9 4,575.9 4,468.1 4,275.0 -6%
Total 19,353.7 19,541.0 19,525.2 20,304.5 21,043.3 21,326.8 21,605.1 21,190.2 9%
Fall StudentsResident FTE
Nonresident FTE
History of Student FTE by Residency
FACT BOOK 2006-07STUDENT INFORMATION 92

Student FTE Production
Total Student FTE by CollegeAY
1998-99AY
1999-00AY
2000-01AY
2001-02AY
2002-03AY
2003-04AY
2004-05AY
2005-06Eight-Year
Change
Agricultural Sciences 1,010.8 1,021.4 1,030.6 1,023.0 1,055.1 975.4 971.6 977.1 -3%
Applied Human Sciences 2,679.8 2,756.8 2,715.8 2,789.6 2,848.3 2,999.7 2,983.8 3,027.4 13%
Business 1,615.7 1,432.7 1,463.6 1,480.1 1,517.6 1,551.2 1,555.4 1,572.9 -3%
Engineering 884.2 906.4 912.7 976.4 1,013.3 1,012.6 981.2 930.7 5%
Intra-University 59.6 60.0 106.8 134.2 151.3 145.6 164.4 163.4 174%
Liberal Arts 5,788.0 5,953.5 6,047.1 6,490.0 6,909.3 7,113.2 7,200.0 6,989.8 21%
Natural Sciences 4,770.1 4,835.6 4,756.4 4,959.1 5,025.3 5,021.4 5,221.1 5,115.2 7%
Veterinary Medicine &Biomedical Sciences 1,600.0 1,622.3 1,642.1 1,617.1 1,704.6 1,747.6 1,721.8 1,654.8 3%
Warner College ofNatural Resources 945.5 952.2 846.4 835.0 818.6 760.2 805.8 758.9 -20%
University Total 19,353.7 19,541.0 19,521.4 20,304.5 21,043.3 21,326.8 21,605.1 21,190.2 9%
1996-97 1999-00 2002-03 2005-060
2,000
4,000
6,000
8,000
Liberal Arts
Natural Sciences
Applied Human Sciences
BusinessVeterinary Medicine & Biomedical Sciences
Warner College of Natural ResourcesEngineeringAgricultural Sciences
Student FTE History by College
FACT BOOK 2006-07 STUDENT INFORMATION 93

Student FTE Production
Undergraduate Student FTE by CollegeAY
1998-99AY
1999-00AY
2000-01AY
2001-02AY
2002-03AY
2003-04AY
2004-05AY
2005-06Eight-Year
Change
Agricultural Sciences 913.5 923.3 944.0 936.9 958.5 873.3 883.8 887.4 -3%
Applied Human Sciences 2,356.8 2,407.6 2,372.0 2,416.5 2,427.7 2,508.7 2,505.4 2,565.8 9%
Business 1,466.7 1,290.6 1,341.0 1,394.5 1,433.8 1,478.2 1,478.4 1,506.5 3%
Engineering 677.7 684.2 690.2 741.8 750.0 751.5 710.6 684.0 1%
Intra-University 57.4 58.5 104.9 125.1 139.4 144.8 162.7 162.8 184%
Liberal Arts 5,591.6 5,749.7 5,840.6 6,272.2 6,676.2 6,869.4 6,971.1 6,761.3 21%
Natural Sciences 4,446.0 4,515.6 4,420.4 4,624.0 4,688.9 4,676.4 4,893.8 4,777.3 7%
Veterinary Medicine &Biomedical Sciences 731.1 736.4 726.9 699.9 757.3 825.0 795.5 749.2 2%
Warner College ofNatural Resources 817.7 832.1 728.1 736.1 726.7 659.5 707.3 664.2 -19%
University Total 17,058.5 17,198.1 17,168.2 17,946.9 18,558.4 18,786.7 19,108.6 18,758.5 10%
1996-97 1999-00 2002-03 2005-060
2,000
4,000
6,000
8,000
Undergraduate Student FTE History by College
Liberal Arts
Natural Sciences
Applied Human Sciences
Business
Veterinary Medicine & Biomedical Sciences
Warner College of Natural ResourcesEngineering
Agricultural Sciences
FACT BOOK 2006-07STUDENT INFORMATION 94

Student FTE Production
Graduate Student FTE by CollegeAY
1998-99AY
1999-00AY
2000-01AY
2001-02AY
2002-03AY
2003-04AY
2004-05AY
2005-06Eight-Year
Change
Agricultural Sciences 97.2 98.1 86.6 86.1 96.5 102.1 87.8 89.7 -8%
Applied Human Sciences 323.0 349.2 343.8 373.3 420.6 491.1 478.4 461.6 43%
Business 149.0 142.1 122.6 85.7 83.8 73.0 77.0 66.3 -55%
Engineering 206.5 222.2 222.5 234.7 263.3 261.1 270.5 246.7 19%
Intra-University 2.3 1.5 1.9 9.0 11.9 0.8 1.8 0.6 -74%
Liberal Arts 196.4 203.8 206.5 217.6 233.1 243.8 228.9 228.6 16%
Natural Sciences 324.1 320.1 336.0 335.1 336.5 345.0 327.3 338.0 4%
Veterinary Medicine &Biomedical Sciences 186.1 205.0 221.9 224.2 240.6 224.1 215.8 199.7 7%
Warner College ofNatural Resources 127.7 120.1 118.3 98.9 91.9 100.6 98.5 94.6 -26%
University Total 1,612.4 1,662.0 1,659.9 1,664.7 1,778.1 1,851.6 1,786.0 1,725.7 7%
1996-97 1999-00 2002-03 2005-060
100
200
300
400
500
Liberal Arts
Natural Sciences
Applied Human Sciences
Business
Veterinary Medicine & Biomedical Sciences
Warner College of Natural Resources
Engineering
Agricultural Sciences
Graduate Student FTE History by College
Note: PVM is excluded from this page.
FACT BOOK 2006-07 STUDENT INFORMATION 95
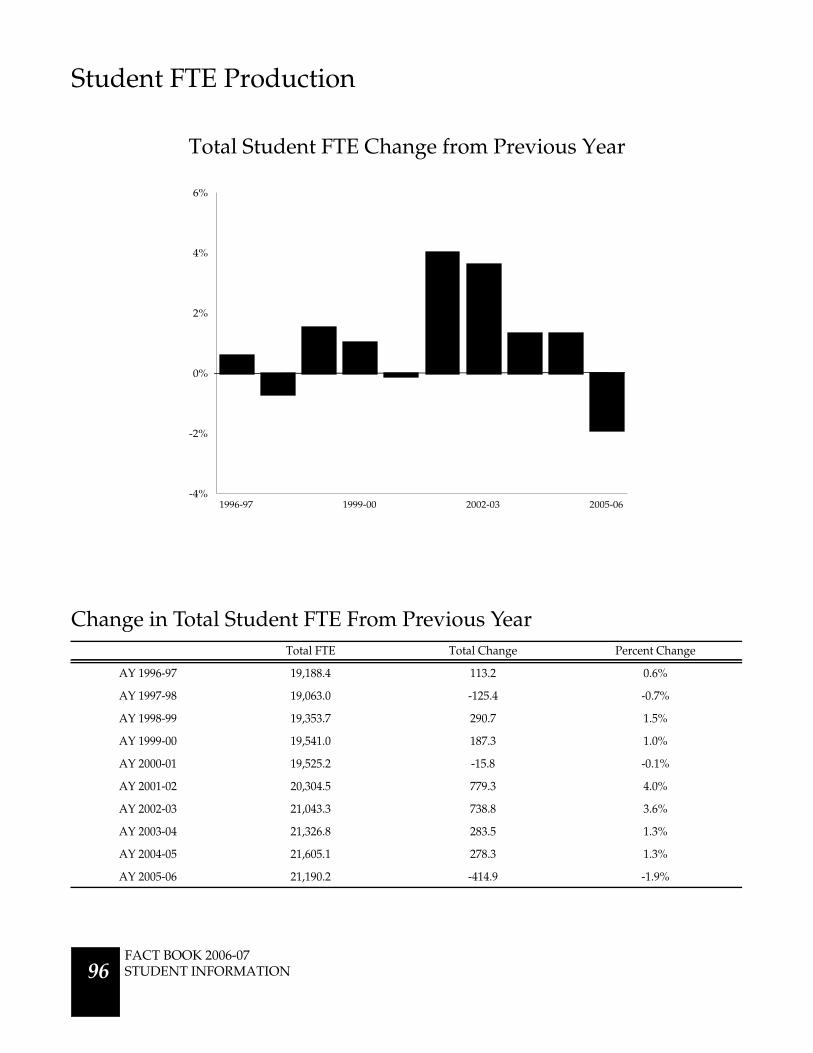
Student FTE Production
Change in Total Student FTE From Previous YearTotal FTE Total Change Percent Change
AY 1996-97 19,188.4 113.2 0.6%
AY 1997-98 19,063.0 -125.4 -0.7%
AY 1998-99 19,353.7 290.7 1.5%
AY 1999-00 19,541.0 187.3 1.0%
AY 2000-01 19,525.2 -15.8 -0.1%
AY 2001-02 20,304.5 779.3 4.0%
AY 2002-03 21,043.3 738.8 3.6%
AY 2003-04 21,326.8 283.5 1.3%
AY 2004-05 21,605.1 278.3 1.3%
AY 2005-06 21,190.2 -414.9 -1.9%
1996-97 1999-00 2002-03 2005-06-4%
-2%
0%
2%
4%
6%
Total Student FTE Change from Previous Year
FACT BOOK 2006-07STUDENT INFORMATION 96

Student FTE Production
Total Student FTE by Student LevelAY
1998-99AY
1999-00AY
2000-01AY
2001-02AY
2002-03AY
2003-04AY
2004-05AY
2005-06Eight-Year
Change
Freshmen 3,881.4 4,002.9 4,084.4 4,639.1 4,680.2 4,591.4 4,644.1 4,416.7 14%
Sophomore 3,637.2 3,828.3 3,941.2 3,970.5 4,383.5 4,380.8 4,318.6 4,268.3 17%
Junior 3,854.0 3,750.9 3,882.0 4,032.4 4,137.6 4,365.4 4,400.5 4,424.9 15%
Senior 5,474.4 5,454.2 5,111.1 5,170.8 5,265.6 5,348.8 5,633.3 5,552.7 1%
Master’s 1,302.5 1,317.5 1,295.2 1,251.8 1,324.1 1,354.0 1,303.2 1,243.6 -5%
Doctorate 520.2 505.5 514.6 546.1 541.7 579.5 577.2 563.8 8%
Professional 684.1 681.7 692.8 693.9 710.6 707.0 728.1 720.2 5%
University Total 19,353.7 19,541.0 19,521.4 20,304.5 21,043.3 21,326.8 21,605.1 21,190.2 9%
1997-98 1999-00 2001-02 2003-04 2005-062,000
3,000
4,000
5,000
6,000
Seniors
Freshmen
Juniors
Sophomores
Student FTE by Undergraduate Student Levels
FACT BOOK 2006-07 STUDENT INFORMATION 97
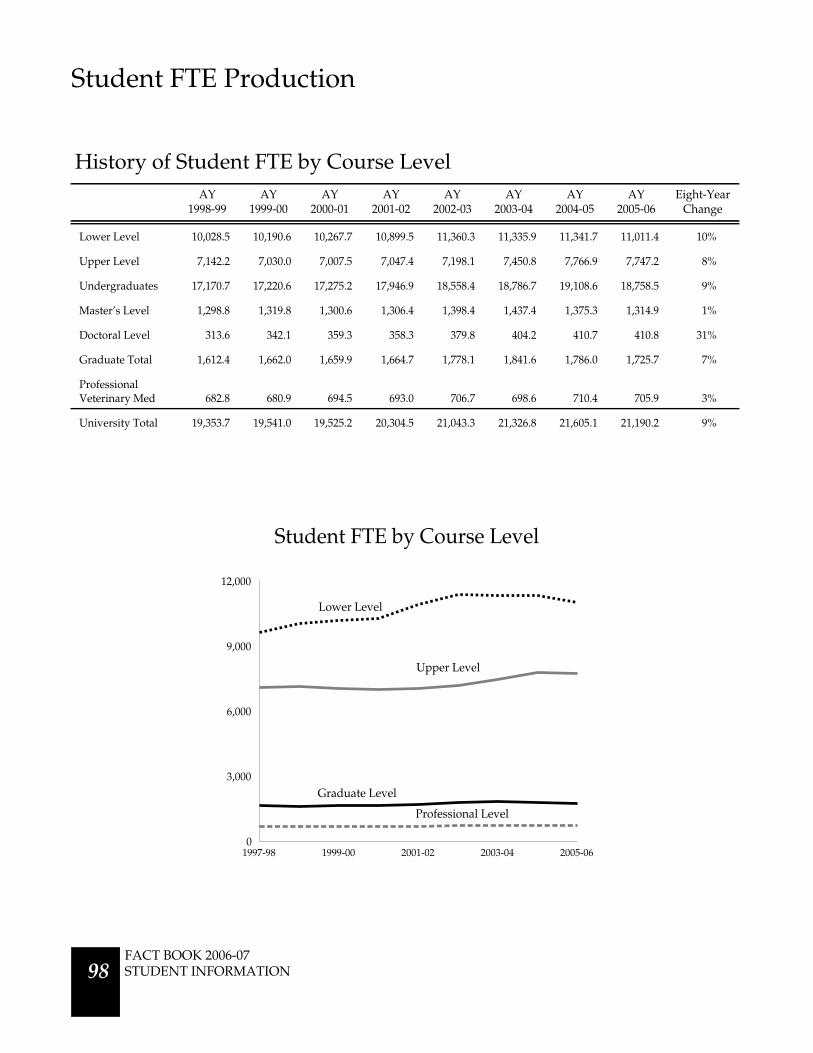
1997-98 1999-00 2001-02 2003-04 2005-060
3,000
6,000
9,000
12,000
Student FTE Production
History of Student FTE by Course LevelAY
1998-99AY
1999-00AY
2000-01AY
2001-02AY
2002-03AY
2003-04AY
2004-05AY
2005-06Eight-Year
Change
Lower Level 10,028.5 10,190.6 10,267.7 10,899.5 11,360.3 11,335.9 11,341.7 11,011.4 10%
Upper Level 7,142.2 7,030.0 7,007.5 7,047.4 7,198.1 7,450.8 7,766.9 7,747.2 8%
Undergraduates 17,170.7 17,220.6 17,275.2 17,946.9 18,558.4 18,786.7 19,108.6 18,758.5 9%
Master’s Level 1,298.8 1,319.8 1,300.6 1,306.4 1,398.4 1,437.4 1,375.3 1,314.9 1%
Doctoral Level 313.6 342.1 359.3 358.3 379.8 404.2 410.7 410.8 31%
Graduate Total 1,612.4 1,662.0 1,659.9 1,664.7 1,778.1 1,841.6 1,786.0 1,725.7 7%
ProfessionalVeterinary Med 682.8 680.9 694.5 693.0 706.7 698.6 710.4 705.9 3%
University Total 19,353.7 19,541.0 19,525.2 20,304.5 21,043.3 21,326.8 21,605.1 21,190.2 9%
Student FTE by Course Level
Lower Level
Upper Level
Graduate Level
Professional Level
FACT BOOK 2006-07STUDENT INFORMATION 98

Student FTE Production
Fall Headcount Academic Year FTE
1996-97 21,970 19,188
1997-98 22,344 19,063
1998-99 22,523 19,354
1999-00 22,782 19,541
2000-01 23,098 19,521
2001-02 23,934 20,305
2002-03 24,735 21,043
2003-04 25,042 21,327
2004-05 25,382 21,605
2005-06 24,847 21,190
1996-97 1999-00 2002-03 2005-0610,000
15,000
20,000
25,000
30,000
Academic-Year FTE and Fall Headcount Comparison
AYFTE
Fall Headcount
FACT BOOK 2006-07 STUDENT INFORMATION 99
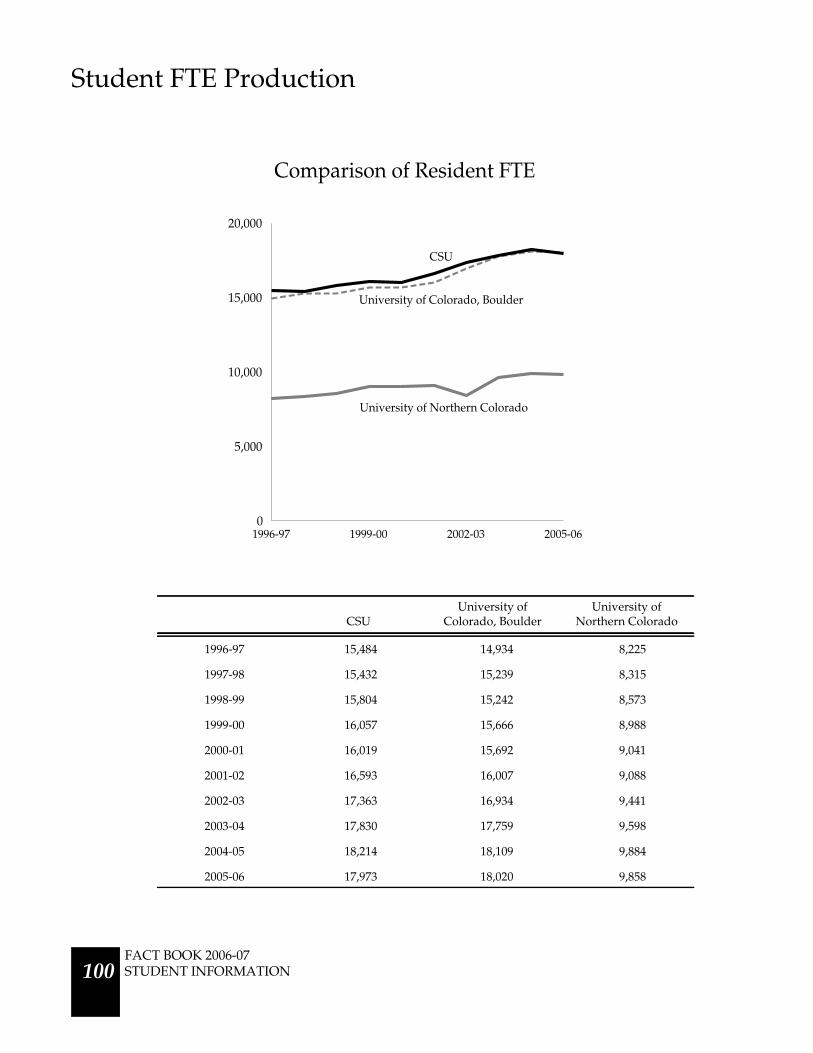
Student FTE Production
CSUUniversity of
Colorado, BoulderUniversity of
Northern Colorado
1996-97 15,484 14,934 8,225
1997-98 15,432 15,239 8,315
1998-99 15,804 15,242 8,573
1999-00 16,057 15,666 8,988
2000-01 16,019 15,692 9,041
2001-02 16,593 16,007 9,088
2002-03 17,363 16,934 9,441
2003-04 17,830 17,759 9,598
2004-05 18,214 18,109 9,884
2005-06 17,973 18,020 9,858
1996-97 1999-00 2002-03 2005-060
5,000
10,000
15,000
20,000
Comparison of Resident FTE
University of Colorado, Boulder
CSU
University of Northern Colorado
FACT BOOK 2006-07STUDENT INFORMATION 100

Service Load Summary
Percentage of Student CreditHours Taken by College Majors
Percentage of Student Credit HoursTaken by Majors
Outside the College
Agricultural Sciences 75% 25%
Applied Human Sciences 73% 27%
Business 73% 27%
Engineering 90% 10%
Intra-University 26% 74%
Liberal Arts 52% 48%
Natural Sciences 40% 60%
Veterinary Medicine & Biomedical Sciences 66% 34%
Warner College of Natural Resources 62% 38%
University Summary 57% 43%
Percentage of Student Credits Hours Taken
0% 20% 40% 60% 80% 100%
Engineering
Agricultural Sciences
Business
Applied Human Sciences
Veterinary Medicine & Biomedical Sciences
Warner College of Natural Resources
Liberal Arts
Natural Sciences Service Major
Note: Service equals the percentage of student credit hours taught to students outside the major college and major indicates the percentage of studentcredit hours taught to students within the major college. PVM is included. Student credit hours are for the academic year 2005-06.
by Major and Service
FACT BOOK 2006-07 STUDENT INFORMATION 101

Service Load Summary
Student Credit HoursTaken by
College Majors
Student Credit HoursTaken by Majors
Outside the CollegeTotal StudentCredit Hours
Agricultural Sciences 20,083 6,794 26,877
Applied Human Sciences 66,029 24,399 90,428
Business 34,347 12,760 47,107
Engineering 25,134 2,713 27,847
Intra-University 2,626 7,559 10,185
Liberal Arts 107,861 100,766 208,627
Natural Sciences 62,738 93,655 156,393
Veterinary Medicine & Biomedical Sciences 30,685 16,066 46,751
Warner College of Natural Resources 13,298 8,192 21,490
University Summary 362,801 272,904 635,705
Student Credit Hours by Major and Service
0 50,000 100,000 150,000 200,000 250,000
Warner College of Natural Resources
Agricultural Sciences
Engineering
Veterinary Medicine & Biomedical Sciences
Business
Applied Human Sciences
Natural Sciences
Liberal Arts
Service
Major
FACT BOOK 2006-07STUDENT INFORMATION 102

Service Load Summary
History of Percentage of Student Credit Hours Generated by College Majors
AY1998-99
AY1999-00
AY2000-01
AY2001-02
AY2002-03
AY2003-04
AY2004-05
AY2005-06
Agricultural Sciences 80% 81% 78% 76% 75% 74% 74% 75%
Applied Human Sciences 69% 68% 69% 67% 68% 68% 70% 73%
Business 71% 82% 80% 78% 76% 76% 78% 73%
Engineering 89% 89% 90% 90% 90% 90% 90% 90%
Intra-University 30% 33% 40% 41% 30% 26% 28% 26%
Liberal Arts 47% 47% 48% 48% 48% 49% 50% 52%
Natural Sciences 36% 37% 40% 41% 41% 41% 40% 40%
Veterinary Medicine &Biomedical Sciences 67% 68% 68% 68% 66% 65% 65% 66%
Warner College ofNatural Resources 66% 62% 63% 59% 58% 60% 63% 62%
University Summary 55% 56% 57% 56% 56% 56% 56% 57%
1997-98 1999-00 2001-02 2003-04 2005-060%
25%
50%
75%
100%
Percentage of Student Credit Hours Generatedby College Majors
Veterinary Medicine & Biomedical Sciences
Natural Sciences
Liberal Arts
Warner College of Natural Resources
Applied Human SciencesAgricultural Sciences
Business
Engineering
FACT BOOK 2006-07 STUDENT INFORMATION 103
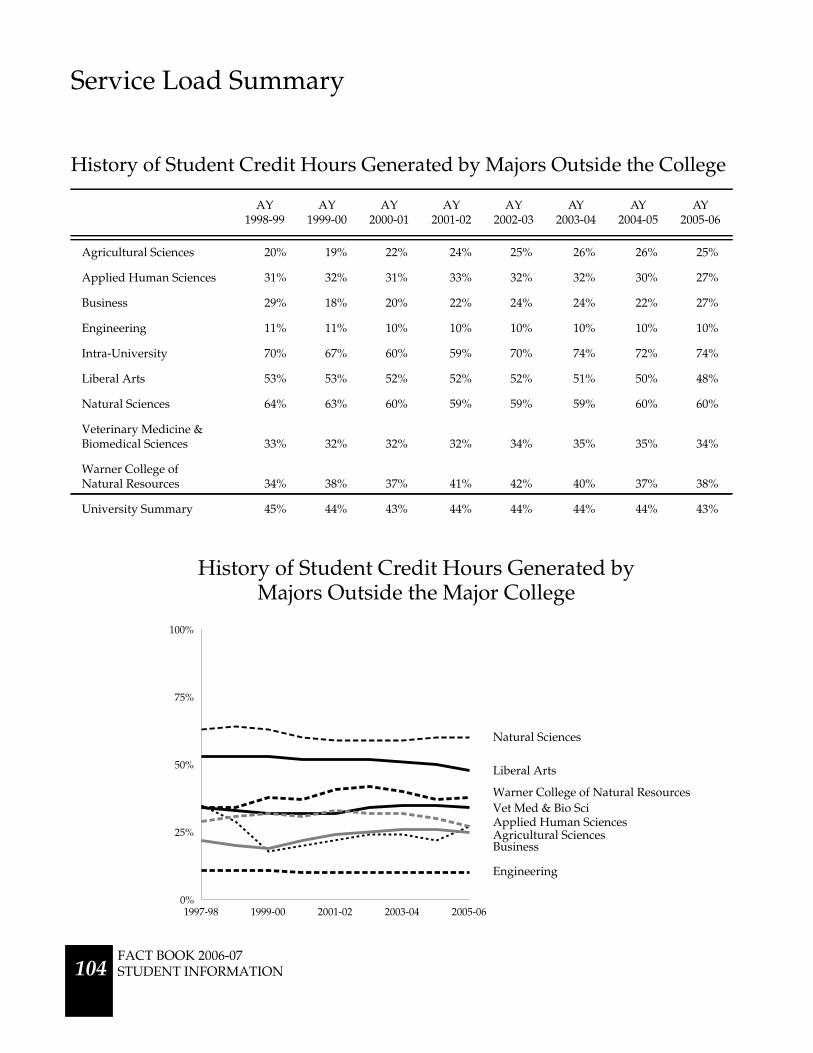
Service Load Summary
History of Student Credit Hours Generated by Majors Outside the College
AY1998-99
AY1999-00
AY2000-01
AY2001-02
AY2002-03
AY2003-04
AY2004-05
AY2005-06
Agricultural Sciences 20% 19% 22% 24% 25% 26% 26% 25%
Applied Human Sciences 31% 32% 31% 33% 32% 32% 30% 27%
Business 29% 18% 20% 22% 24% 24% 22% 27%
Engineering 11% 11% 10% 10% 10% 10% 10% 10%
Intra-University 70% 67% 60% 59% 70% 74% 72% 74%
Liberal Arts 53% 53% 52% 52% 52% 51% 50% 48%
Natural Sciences 64% 63% 60% 59% 59% 59% 60% 60%
Veterinary Medicine &Biomedical Sciences 33% 32% 32% 32% 34% 35% 35% 34%
Warner College ofNatural Resources 34% 38% 37% 41% 42% 40% 37% 38%
University Summary 45% 44% 43% 44% 44% 44% 44% 43%
1997-98 1999-00 2001-02 2003-04 2005-060%
25%
50%
75%
100%
History of Student Credit Hours Generated byMajors Outside the Major College
Vet Med & Bio Sci
Natural Sciences
Liberal Arts
Warner College of Natural Resources
Applied Human SciencesAgricultural SciencesBusiness
Engineering
FACT BOOK 2006-07STUDENT INFORMATION 104
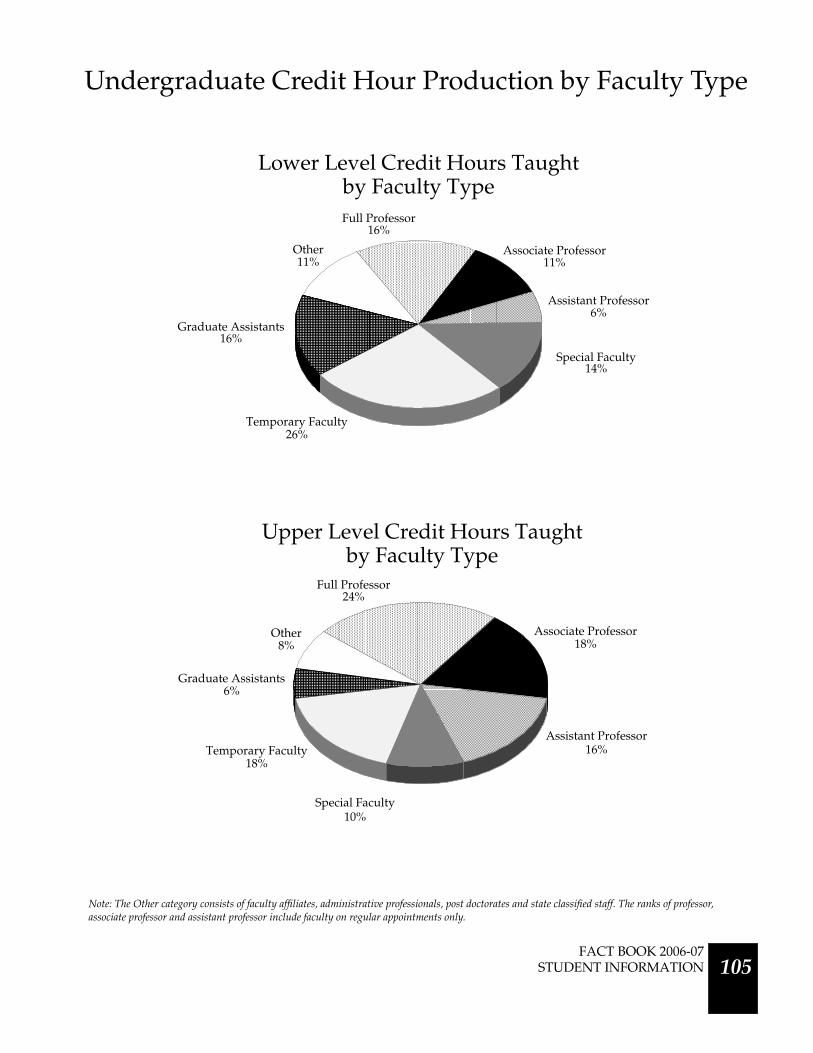
24%
18%
17%
10%
18%
6%
8%
16%
11%
6%
14%
26%
16%
11%
Undergraduate Credit Hour Production by Faculty Type
Note: The Other category consists of faculty affiliates, administrative professionals, post doctorates and state classified staff. The ranks of professor,associate professor and assistant professor include faculty on regular appointments only.
Graduate Assistants16%
Other11%
Associate Professor11%
Assistant Professor6%
Full Professor16%
by Faculty TypeLower Level Credit Hours Taught
Temporary Faculty26%
by Faculty TypeUpper Level Credit Hours Taught
Graduate Assistants6%
Other8%
Associate Professor18%
Assistant Professor16%
Full Professor24%
Special Faculty10%
Special Faculty14%
Temporary Faculty18%
FACT BOOK 2006-07 STUDENT INFORMATION 105

Undergraduate Credit Hour Production by Faculty Type
Percentage of Undergraduate Credit Hours Taught by Faculty Type
ProfessorAssociateProfessor
AssistantProfessor
SpecialFaculty
TemporaryFaculty
GraduateAssistant Other
Agricultural Sciences 42% 22% 12% 13% 2% 0% 9%
Applied Human Sciences 14% 16% 11% 10% 22% 12% 15%
Business 19% 13% 11% 23% 32% 1% 1%
Engineering 34% 18% 8% 3% 17% 12% 8%
Liberal Arts 15% 11% 12% 11% 38% 8% 5%
Natural Sciences 22% 12% 8% 13% 8% 24% 13%
Veterinary Medicine &Biomedical Sciences 26% 33% 5% 16% 1% 4% 15%
Warner College ofNatural Resources 30% 14% 20% 15% 12% 1% 8%
University Summary 19% 14% 10% 13% 23% 12% 9%
Ag Sci AHS Bus Eng Liberal Arts Natural Sci Vet Med & Bio Nat Res0%
20%
40%
60%
80%
100%
Tenure-Track Faculty
Special Faculty
Temporary Faculty
Graduate Assistants
Other
AG AHS BUS ENG LA WCNRNS VM
Credit Hours Taught by College and Faculty Type
FACT BOOK 2006-07STUDENT INFORMATION 106

Undergraduate Credit Hour Production by Faculty Type
History of Undergraduate Credit Hours Taught by Tenure-Track FacultyAY
1998-99AY
1999-00AY
2000-01AY
2001-02AY
2002-03AY
2003-04AY
2004-05AY
2005-06
Agricultural Sciences 74% 78% 77% 81% 78% 85% 80% 76%
Applied Human Sciences 50% 54% 50% 48% 45% 43% 42% 41%
Business 50% 51% 48% 60% 56% 59% 50% 43%
Engineering 86% 87% 91% 89% 75% 77% 76% 60%
Liberal Arts 46% 45% 46% 44% 42% 42% 40% 38%
Natural Sciences 46% 50% 48% 44% 42% 44% 41% 41%
Veterinary Medicine &Biomedical Sciences 60% 60% 56% 57% 53% 48% 56% 64%
Warner College ofNatural Resources 81% 72% 71% 65% 61% 65% 68% 64%
University Summary 52% 53% 51% 51% 47% 48% 47% 58%
1997-98 1999-00 2001-02 2003-04 2005-060%
20%
40%
60%
80%
100%
History of Undergraduate Credit HoursTaught by Tenure-Track Faculty
Engineering
Agricultural Sciences
Warner College of Natural ResourcesVeterinary Medicine & Biomedical Sciences
Applied Human SciencesBusiness
Natural SciencesLiberal Arts
FACT BOOK 2006-07 STUDENT INFORMATION 107
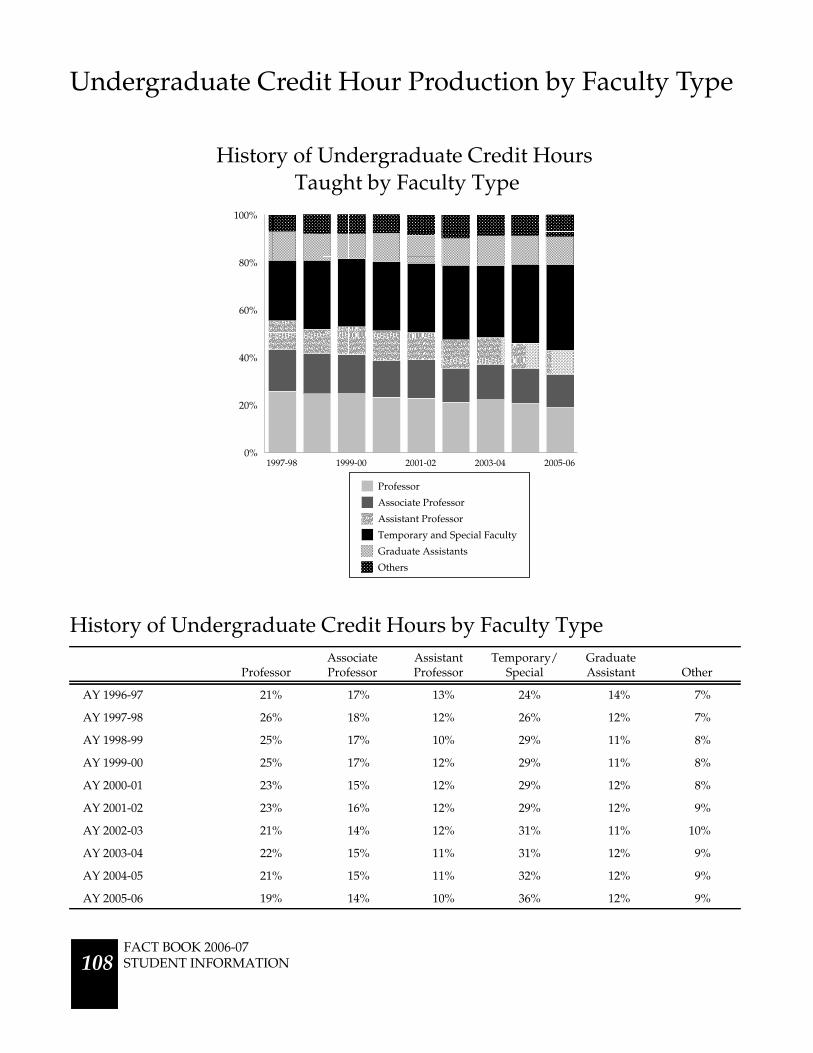
1997-98 1999-00 2001-02 2003-04 2005-060%
20%
40%
60%
80%
100%
Professor
Associate Professor
Assistant Professor
Temporary and Special Faculty
Graduate Assistants
Others
Undergraduate Credit Hour Production by Faculty Type
History of Undergraduate Credit Hours by Faculty Type
ProfessorAssociateProfessor
AssistantProfessor
Temporary/Special
GraduateAssistant Other
AY 1996-97 21% 17% 13% 24% 14% 7%
AY 1997-98 26% 18% 12% 26% 12% 7%
AY 1998-99 25% 17% 10% 29% 11% 8%
AY 1999-00 25% 17% 12% 29% 11% 8%
AY 2000-01 23% 15% 12% 29% 12% 8%
AY 2001-02 23% 16% 12% 29% 12% 9%
AY 2002-03 21% 14% 12% 31% 11% 10%
AY 2003-04 22% 15% 11% 31% 12% 9%
AY 2004-05 21% 15% 11% 32% 12% 9%
AY 2005-06 19% 14% 10% 36% 12% 9%
Taught by Faculty TypeHistory of Undergraduate Credit Hours
FACT BOOK 2006-07STUDENT INFORMATION 108

Persistence of New Freshmen
Note: Persistence figures include students who have graduated and those still enrolled at the end of each study period (five years after their entry term,including summer). Students who have been dismissed, but are still enrolled in classes through Continuing Education are not counted as persisters.
1989 1991 1993 1995 1997 1999 20010%
20%
40%
60%
80%
100%Graduated
Still Enrolled
Persistence Class of 2001 - 64.7%Graduation after Five Years - 58.0%
Still Enrolled - 6.7%
Year Entered:Graduated By: 1994 1998 2002 20061996 2000 2004
FACT BOOK 2006-07STUDENT INFORMATION 109

Persistence of New Freshmen
1988 1991 1993 1995 1997 1999 20010%
20%
40%
60%
80%
100%
Note: A student has graduated if he or she receives a bachelor’s degree after four or five calendar years. The last summer session after the four- or five-year period is included for determining graduation rates.
Graduation Class of 2001 - 58.0%After Four Years - 35.0%After Five Years - 23.0%
Year Entered:Graduated By: 1994 1998 2002 20061996 2000 2004
Graduated in Four Years
Graduated in Five Years
FACT BOOK 2006-07STUDENT INFORMATION 110
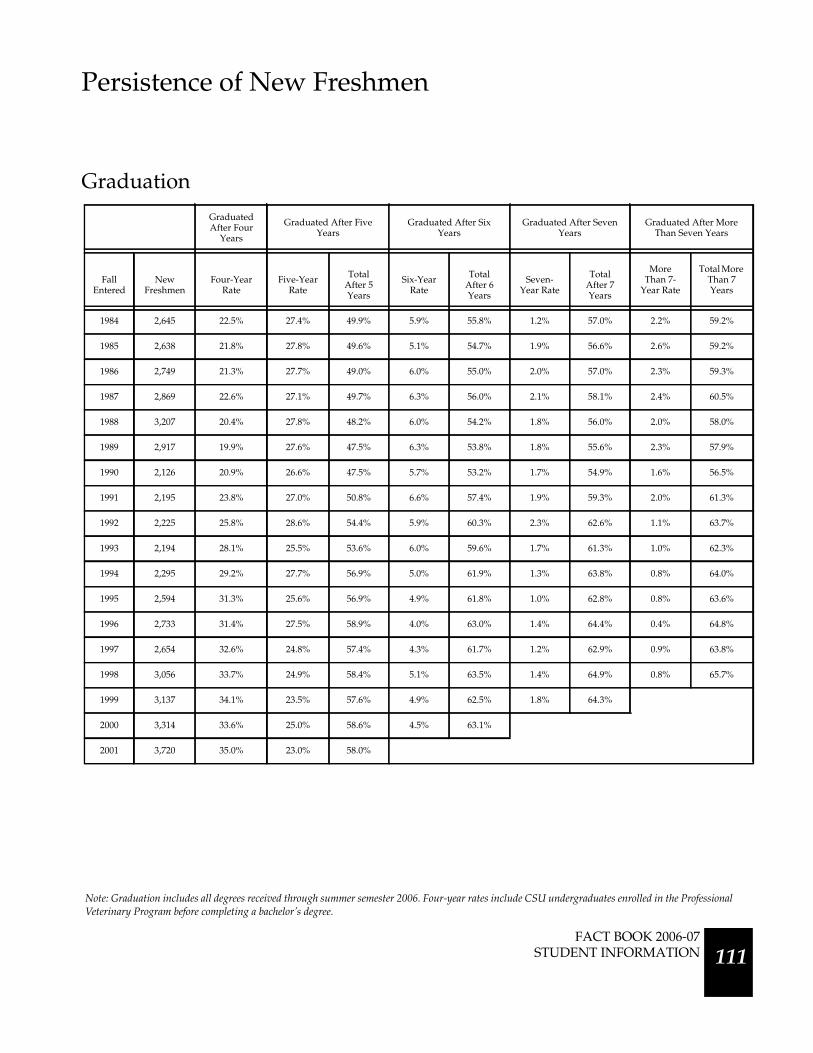
Persistence of New Freshmen
GraduationGraduatedAfter Four
Years
Graduated After FiveYears
Graduated After SixYears
Graduated After SevenYears
Graduated After MoreThan Seven Years
FallEntered
NewFreshmen
Four-YearRate
Five-YearRate
TotalAfter 5Years
Six-YearRate
TotalAfter 6Years
Seven-Year Rate
TotalAfter 7Years
MoreThan 7-
Year Rate
Total MoreThan 7Years
1984 2,645 22.5% 27.4% 49.9% 5.9% 55.8% 1.2% 57.0% 2.2% 59.2%
1985 2,638 21.8% 27.8% 49.6% 5.1% 54.7% 1.9% 56.6% 2.6% 59.2%
1986 2,749 21.3% 27.7% 49.0% 6.0% 55.0% 2.0% 57.0% 2.3% 59.3%
1987 2,869 22.6% 27.1% 49.7% 6.3% 56.0% 2.1% 58.1% 2.4% 60.5%
1988 3,207 20.4% 27.8% 48.2% 6.0% 54.2% 1.8% 56.0% 2.0% 58.0%
1989 2,917 19.9% 27.6% 47.5% 6.3% 53.8% 1.8% 55.6% 2.3% 57.9%
1990 2,126 20.9% 26.6% 47.5% 5.7% 53.2% 1.7% 54.9% 1.6% 56.5%
1991 2,195 23.8% 27.0% 50.8% 6.6% 57.4% 1.9% 59.3% 2.0% 61.3%
1992 2,225 25.8% 28.6% 54.4% 5.9% 60.3% 2.3% 62.6% 1.1% 63.7%
1993 2,194 28.1% 25.5% 53.6% 6.0% 59.6% 1.7% 61.3% 1.0% 62.3%
1994 2,295 29.2% 27.7% 56.9% 5.0% 61.9% 1.3% 63.8% 0.8% 64.0%
1995 2,594 31.3% 25.6% 56.9% 4.9% 61.8% 1.0% 62.8% 0.8% 63.6%
1996 2,733 31.4% 27.5% 58.9% 4.0% 63.0% 1.4% 64.4% 0.4% 64.8%
1997 2,654 32.6% 24.8% 57.4% 4.3% 61.7% 1.2% 62.9% 0.9% 63.8%
1998 3,056 33.7% 24.9% 58.4% 5.1% 63.5% 1.4% 64.9% 0.8% 65.7%
1999 3,137 34.1% 23.5% 57.6% 4.9% 62.5% 1.8% 64.3%
2000 3,314 33.6% 25.0% 58.6% 4.5% 63.1%
2001 3,720 35.0% 23.0% 58.0%
Note: Graduation includes all degrees received through summer semester 2006. Four-year rates include CSU undergraduates enrolled in the ProfessionalVeterinary Program before completing a bachelor’s degree.
FACT BOOK 2006-07STUDENT INFORMATION 111

Persistence of New Freshmen
Persistence by Semester
EnteredFall
NewFreshmen
Percent Returned:
NextSpring
2ndFall Spring
3rdFall Spring
4thFall Spring
5thFall Spring
6thFall
1990 2,126 94% 80% 72% 64% 62% 60% 60% 59% 58% 56%
1991 2,195 94% 80% 73% 68% 65% 64% 63% 62% 61% 60%
1992 2,225 95% 83% 77% 70% 67% 66% 66% 65% 64% 63%
1993 2,194 95% 81% 74% 67% 64% 64% 64% 63% 62% 61%
1994 2,295 94% 83% 76% 69% 66% 66% 66% 65% 64% 64%
1995 2,594 94% 82% 75% 70% 67% 66% 66% 66% 65% 63%
1996 2,733 94% 82% 76% 70% 67% 67% 67% 65% 65% 65%
1997 2,654 93% 81% 75% 69% 66% 65% 66% 64% 64% 64%
1998 3,056 94% 82% 76% 70% 66% 67% 67% 66% 66% 65%
1999 3,137 94% 82% 76% 70% 66% 67% 67% 65% 65% 64%
2000 3,314 94% 81% 75% 69% 66% 67% 66% 66% 65% 66%
2001 3,720 94% 82% 77% 71% 66% 68% 68% 67% 66%
2002 3,829 93% 82% 77% 69% 66% 67% 67%
2003 3,802 94% 83% 77% 71% 68%
2004 4,078 94% 82% 76%
2005 3,893 94% 82%
Note: The persistence rates reflect the number of students graduated and/or enrolled each semester as a percentage of the original entering class. Forexample, tenth semester persistence includes those who graduated AND those who have not yet completed a degree but are still enrolled. The columnsin bold indicate persistence at the end of the first and second years, i.e., those who returned for their second and third years.
FACT BOOK 2006-07STUDENT INFORMATION 112

1989 1991 1993 1995 1997 1999 20010%
25%
50%
75%
100%
Persistence of New Freshmen
Class of 2001Residents - 67%
Nonresidents - 58%
Year Entered:Graduated by: 1994 1996 1998 2000 2002 2004 2006
Nonresidents
Residents
Persistence by Residency
FACT BOOK 2006-07STUDENT INFORMATION 113
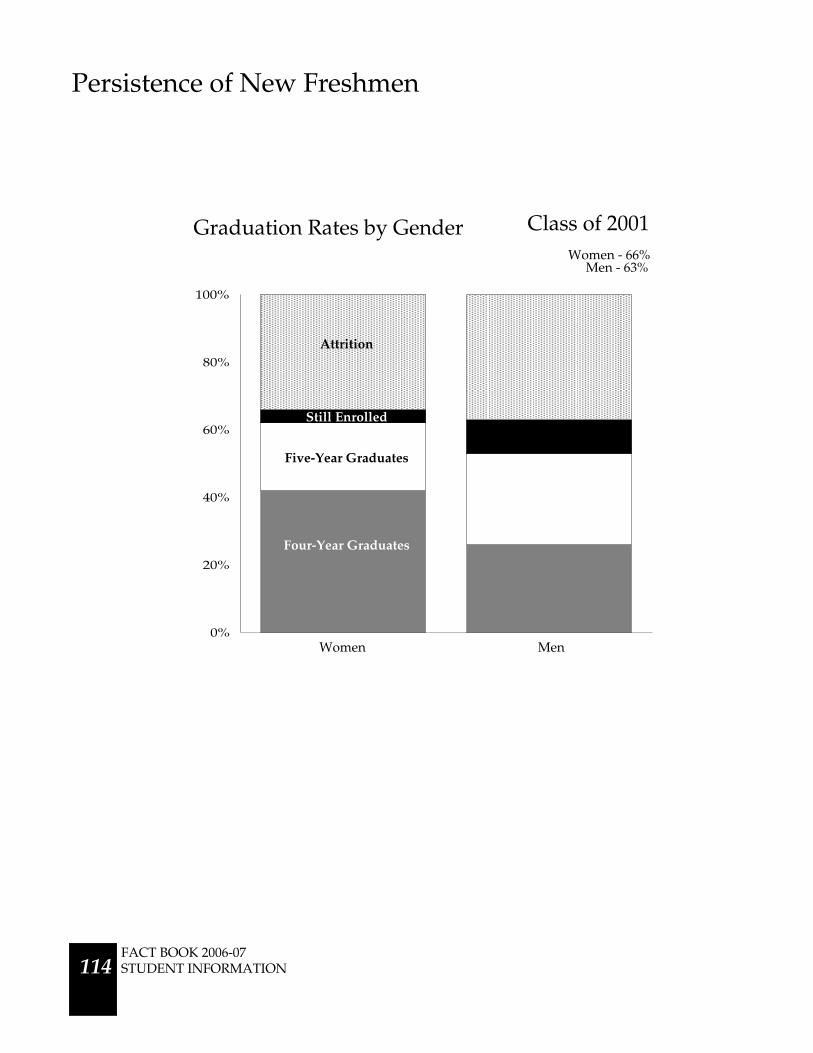
Persistence of New Freshmen
0%
20%
40%
60%
80%
100%
Women Men
Five-Year Graduates
Four-Year Graduates
Attrition
Class of 2001
Still Enrolled
Graduation Rates by GenderWomen - 66%
Men - 63%
FACT BOOK 2006-07STUDENT INFORMATION 114

Persistence of New Freshmen
1989 1991 1993 1995 1997 1999 20010%
25%
50%
75%
100%
Minority Students
Non-Minority Students
Class of 2001 Non-Minority - 65%
Minority - 60%
Persistence by Ethnicity
Year Entered:Graduated by: 1994 1996 1998 2000 2002 2004 2006
Note: Ethnicity is self-reported. Students indicating their ethnicity as Other or International have been included in the non-minority population.
FACT BOOK 2006-07STUDENT INFORMATION 115
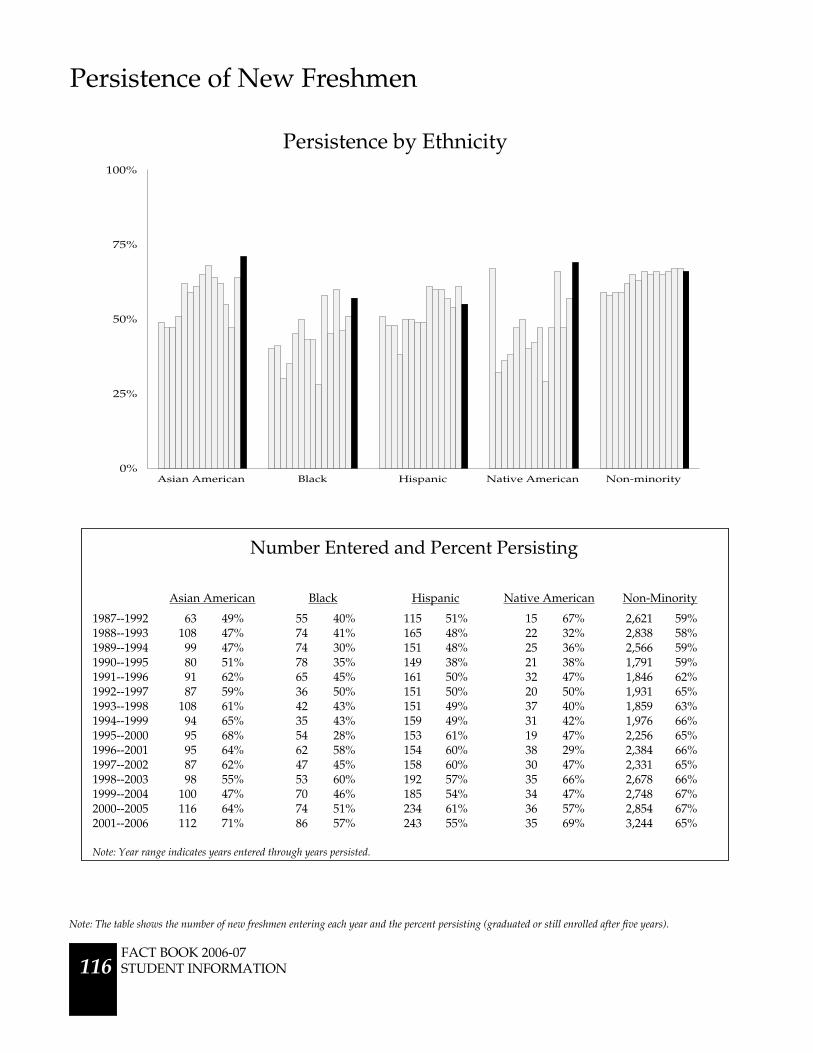
Persistence of New Freshmen
Number Entered and Percent Persisting
Asian American Black Hispanic Native American Non-Minority
1987--1992 63 49% 55 40% 115 51% 15 67% 2,621 59%1988--1993 108 47% 74 41% 165 48% 22 32% 2,838 58%1989--1994 99 47% 74 30% 151 48% 25 36% 2,566 59%1990--1995 80 51% 78 35% 149 38% 21 38% 1,791 59%1991--1996 91 62% 65 45% 161 50% 32 47% 1,846 62%1992--1997 87 59% 36 50% 151 50% 20 50% 1,931 65%1993--1998 108 61% 42 43% 151 49% 37 40% 1,859 63%1994--1999 94 65% 35 43% 159 49% 31 42% 1,976 66%1995--2000 95 68% 54 28% 153 61% 19 47% 2,256 65%1996--2001 95 64% 62 58% 154 60% 38 29% 2,384 66%1997--2002 87 62% 47 45% 158 60% 30 47% 2,331 65%1998--2003 98 55% 53 60% 192 57% 35 66% 2,678 66%1999--2004 100 47% 70 46% 185 54% 34 47% 2,748 67%2000--2005 116 64% 74 51% 234 61% 36 57% 2,854 67%2001--2006 112 71% 86 57% 243 55% 35 69% 3,244 65%
Note: Year range indicates years entered through years persisted.
Asian American Black Hispanic Native American Non-minority0%
25%
50%
75%
100%
Persistence by Ethnicity
Note: The table shows the number of new freshmen entering each year and the percent persisting (graduated or still enrolled after five years).
FACT BOOK 2006-07STUDENT INFORMATION 116
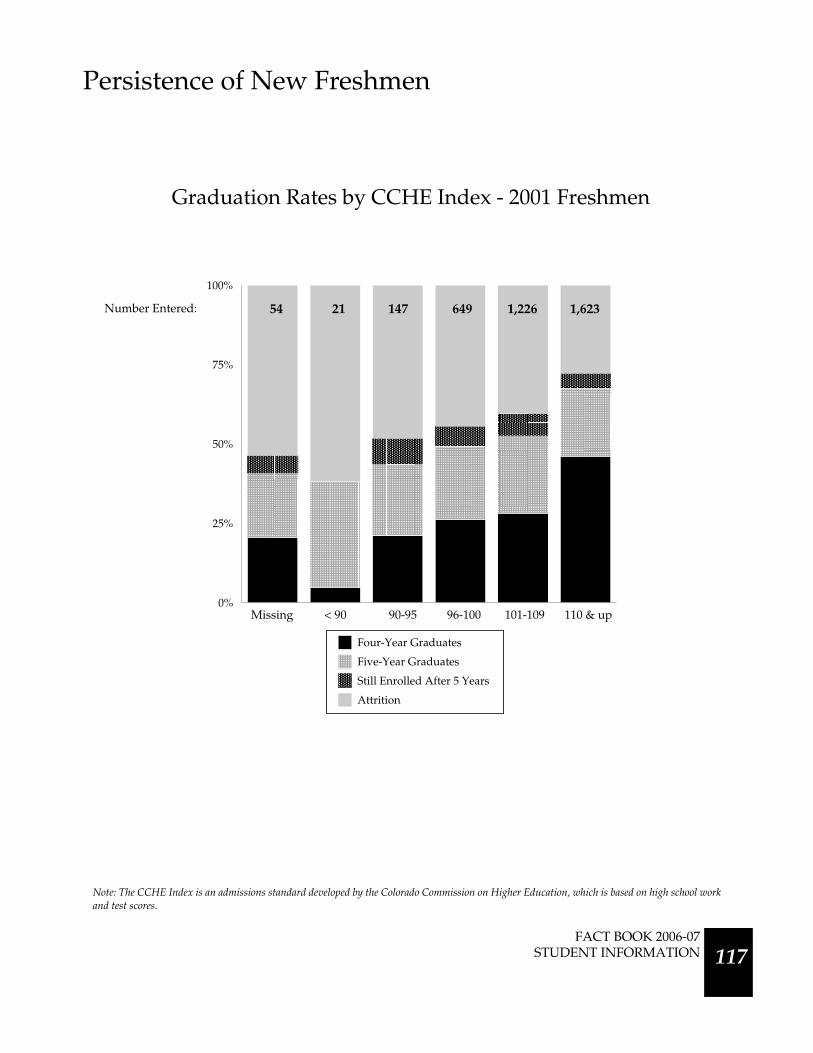
Missing < 90 90-95 96-100 101-109 110 & up0%
25%
50%
75%
100%
Four-Year Graduates
Five-Year Graduates
Still Enrolled After 5 Years
Attrition
Persistence of New Freshmen
Graduation Rates by CCHE Index - 2001 Freshmen
Missing < 90 90-95 96-100 101-109 110 & up
Note: The CCHE Index is an admissions standard developed by the Colorado Commission on Higher Education, which is based on high school workand test scores.
Number Entered: 54 21 147 649 1,226 1,623
FACT BOOK 2006-07STUDENT INFORMATION 117

Persistence of New Freshmen
Comparison of Peer Institutions
0% 25% 50% 75% 100%
Oklahoma State University
Oregon State University
University of Colorado, Boulder
Washington State University
Iowa State University
Purdue University
Ohio State University
Texas A & M University
North Carolina State University
Michigan State University
University of California, Davis
University of Illinois, Urbana-Champaign
Colorado State University
Average Percentage of Entering Freshmen Returningfor Sophomore Year (2001-2004)
0% 25% 50% 75% 100%
Oklahoma State University
Oregon State University
Washington State University
University of Colorado, Boulder
Purdue University
Ohio State University
Iowa State University
North Carolina State University
Michigan State University
Texas A & M University
University of California, Davis
University of Illinois, Urbana-Champaign
Average Percentage of Students Entering in Fall1996-1999 and Graduating in Six Years
Colorado State University
Source: Peer comparison data from U.S. News and World Report, 2007 edition
FACT BOOK 2006-07STUDENT INFORMATION 118

Undergraduate Grade Point Average
Regression of First-Year CSU Grade Point Average and CCHE Index for Fall 2005 Entering Freshmen
Residents
Nonresidents
Note: Includes grade point average for Fall 2005 and Spring 2006.
CCHE Index
CCHE Index
FACT BOOK 2006-07STUDENT INFORMATION 119

Undergraduate Grade Point Average
Fall 2005 GPA
Agricultural Sciences 2.95
Applied Human Sciences 2.96
Business 3.10
Engineering 2.84
Intra-University 2.56
Liberal Arts 2.95
Natural Sciences 2.85
Veterinary Medicine & Biomedical Sciences 2.90
Warner College of Natural Resources 2.81
University Average 2.88
2.0 2.5 3.0 3.5 4.0
Intra-University
Warner College of Natural Resources
Engineering
Natural Sciences
Veterinary Medicine & Biomedical Sciences
Liberal Arts
Agricultural Sciences
Applied Human Sciences
Business
Fall 2005 Undergraduate Term GPA by College
University Average
FACT BOOK 2006-07STUDENT INFORMATION 120
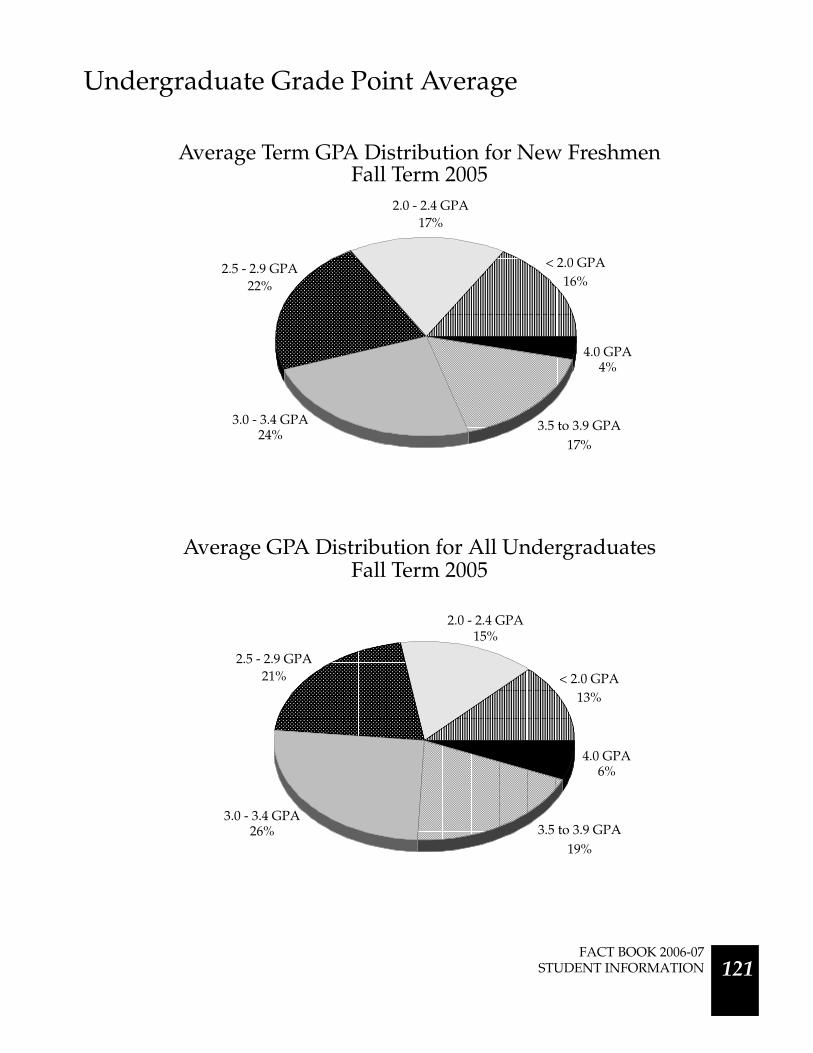
Undergraduate Grade Point Average
4%
17%
24%
22%
17%
16%
Average Term GPA Distribution for New Freshmen
4.0 GPA
3.5 to 3.9 GPA3.0 - 3.4 GPA
4%
17%24%
2.5 - 2.9 GPA22%
2.0 - 2.4 GPA17%
< 2.0 GPA16%
6%
19%
26%
21%
15%
13%
Average GPA Distribution for All Undergraduates
4.0 GPA
3.5 to 3.9 GPA3.0 - 3.4 GPA
6%
19%26%
2.5 - 2.9 GPA21%
2.0 - 2.4 GPA15%
< 2.0 GPA13%
Fall Term 2005
Fall Term 2005
FACT BOOK 2006-07STUDENT INFORMATION 121
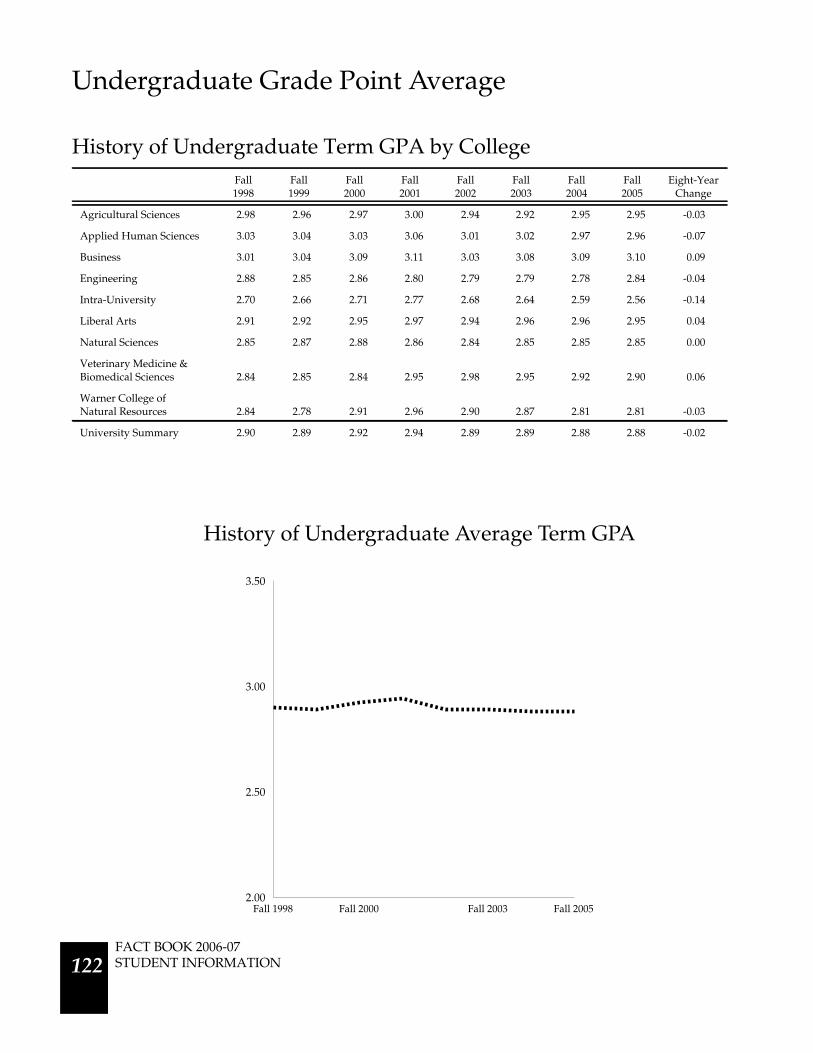
Undergraduate Grade Point Average
History of Undergraduate Term GPA by CollegeFall1998
Fall1999
Fall2000
Fall2001
Fall2002
Fall2003
Fall2004
Fall2005
Eight-YearChange
Agricultural Sciences 2.98 2.96 2.97 3.00 2.94 2.92 2.95 2.95 -0.03
Applied Human Sciences 3.03 3.04 3.03 3.06 3.01 3.02 2.97 2.96 -0.07
Business 3.01 3.04 3.09 3.11 3.03 3.08 3.09 3.10 0.09
Engineering 2.88 2.85 2.86 2.80 2.79 2.79 2.78 2.84 -0.04
Intra-University 2.70 2.66 2.71 2.77 2.68 2.64 2.59 2.56 -0.14
Liberal Arts 2.91 2.92 2.95 2.97 2.94 2.96 2.96 2.95 0.04
Natural Sciences 2.85 2.87 2.88 2.86 2.84 2.85 2.85 2.85 0.00
Veterinary Medicine &Biomedical Sciences 2.84 2.85 2.84 2.95 2.98 2.95 2.92 2.90 0.06
Warner College ofNatural Resources 2.84 2.78 2.91 2.96 2.90 2.87 2.81 2.81 -0.03
University Summary 2.90 2.89 2.92 2.94 2.89 2.89 2.88 2.88 -0.02
Fall 1998 Fall 2000 Fall 2003 Fall 20052.00
2.50
3.00
3.50
History of Undergraduate Average Term GPA
FACT BOOK 2006-07STUDENT INFORMATION 122
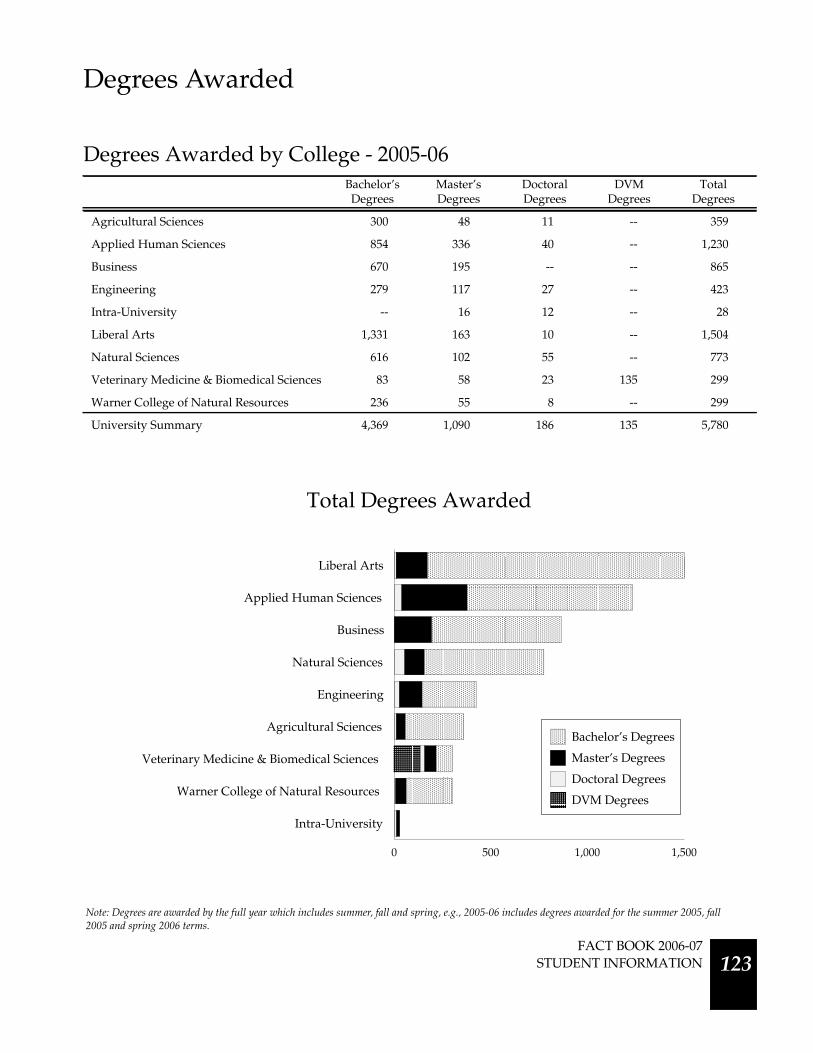
Degrees Awarded
Degrees Awarded by College - 2005-06Bachelor’sDegrees
Master’sDegrees
DoctoralDegrees
DVMDegrees
TotalDegrees
Agricultural Sciences 300 48 11 -- 359
Applied Human Sciences 854 336 40 -- 1,230
Business 670 195 -- -- 865
Engineering 279 117 27 -- 423
Intra-University -- 16 12 -- 28
Liberal Arts 1,331 163 10 -- 1,504
Natural Sciences 616 102 55 -- 773
Veterinary Medicine & Biomedical Sciences 83 58 23 135 299
Warner College of Natural Resources 236 55 8 -- 299
University Summary 4,369 1,090 186 135 5,780
Total Degrees Awarded
Note: Degrees are awarded by the full year which includes summer, fall and spring, e.g., 2005-06 includes degrees awarded for the summer 2005, fall2005 and spring 2006 terms.
0 500 1,000 1,500
Intra-University
Warner College of Natural Resources
Veterinary Medicine & Biomedical Sciences
Agricultural Sciences
Engineering
Natural Sciences
Business
Applied Human Sciences
Liberal Arts
DVM Degrees
Doctoral Degrees
Master’s Degrees
Bachelor’s Degrees
FACT BOOK 2006-07STUDENT INFORMATION 123
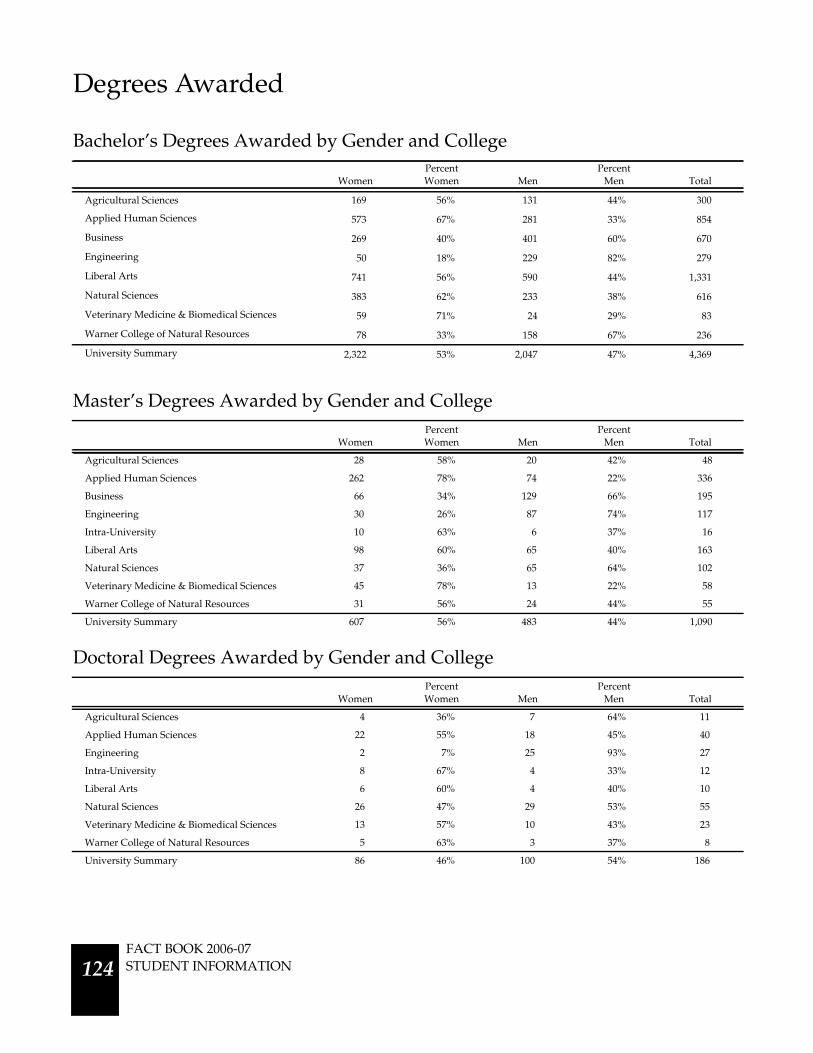
Degrees Awarded
Bachelor’s Degrees Awarded by Gender and College
Master’s Degrees Awarded by Gender and College
Doctoral Degrees Awarded by Gender and College
WomenPercentWomen Men
PercentMen Total
Agricultural Sciences 169 56% 131 44% 300
Applied Human Sciences 573 67% 281 33% 854
Business 269 40% 401 60% 670
Engineering 50 18% 229 82% 279
Liberal Arts 741 56% 590 44% 1,331
Natural Sciences 383 62% 233 38% 616
Veterinary Medicine & Biomedical Sciences 59 71% 24 29% 83
Warner College of Natural Resources 78 33% 158 67% 236
University Summary 2,322 53% 2,047 47% 4,369
WomenPercentWomen Men
PercentMen Total
Agricultural Sciences 28 58% 20 42% 48
Applied Human Sciences 262 78% 74 22% 336
Business 66 34% 129 66% 195
Engineering 30 26% 87 74% 117
Intra-University 10 63% 6 37% 16
Liberal Arts 98 60% 65 40% 163
Natural Sciences 37 36% 65 64% 102
Veterinary Medicine & Biomedical Sciences 45 78% 13 22% 58
Warner College of Natural Resources 31 56% 24 44% 55
University Summary 607 56% 483 44% 1,090
WomenPercentWomen Men
PercentMen Total
Agricultural Sciences 4 36% 7 64% 11
Applied Human Sciences 22 55% 18 45% 40
Engineering 2 7% 25 93% 27
Intra-University 8 67% 4 33% 12
Liberal Arts 6 60% 4 40% 10
Natural Sciences 26 47% 29 53% 55
Veterinary Medicine & Biomedical Sciences 13 57% 10 43% 23
Warner College of Natural Resources 5 63% 3 37% 8
University Summary 86 46% 100 54% 186
FACT BOOK 2006-07STUDENT INFORMATION 124

Degrees Awarded
Bachelor’s Degrees Awarded by Ethnicity and College
Master’s Degrees Awarded by Ethnicity and College
Doctoral Degrees Awarded by Ethnicity and College
AsianAmerican Black Hispanic
NativeAmerican
Non-Minority Total
Agricultural Sciences 4 2 10 5 279 300
Applied Human Sciences 19 20 49 10 756 854
Business 11 8 36 12 603 670
Engineering 9 0 11 1 258 279
Liberal Arts 29 48 87 21 1,146 1,331
Natural Sciences 29 14 38 6 529 616
Veterinary Medicine & Biomedical Sciences 8 2 4 0 69 83
Warner College of Natural Resources 4 0 9 2 221 236
University Summary 113 94 244 57 3,861 4,369
AsianAmerican Black Hispanic
NativeAmerican
Non-Minority Total
Agricultural Sciences 0 0 2 0 46 48
Applied Human Sciences 6 9 13 4 304 336
Business 10 7 5 2 171 195
Engineering 1 1 2 0 113 117
Intra-University 0 0 1 0 15 16
Liberal Arts 0 4 6 2 151 163
Natural Sciences 0 0 2 2 98 102
Veterinary Medicine & Biomedical Sciences 0 0 0 0 58 58
Warner College of Natural Resources 0 0 1 1 53 55
University Summary 17 21 32 11 1,009 1,090
AsianAmerican Black Hispanic
NativeAmerican
Non-Minority Total
Agricultural Sciences 0 0 1 0 10 11
Applied Human Sciences 1 3 2 1 33 40
Engineering 0 0 1 0 26 27
Intra-University 0 0 0 0 12 12
Liberal Arts 0 0 1 0 9 10
Natural Sciences 2 0 1 0 52 55
Veterinary Medicine & Biomedical Sciences 0 0 0 0 23 23
Warner College of Natural Resources 0 0 0 0 8 8
University Summary 3 3 6 1 173 186
Note: Non-minority numbers include international and white students in additional to students who did not report their ethnicity.
FACT BOOK 2006-07STUDENT INFORMATION 125
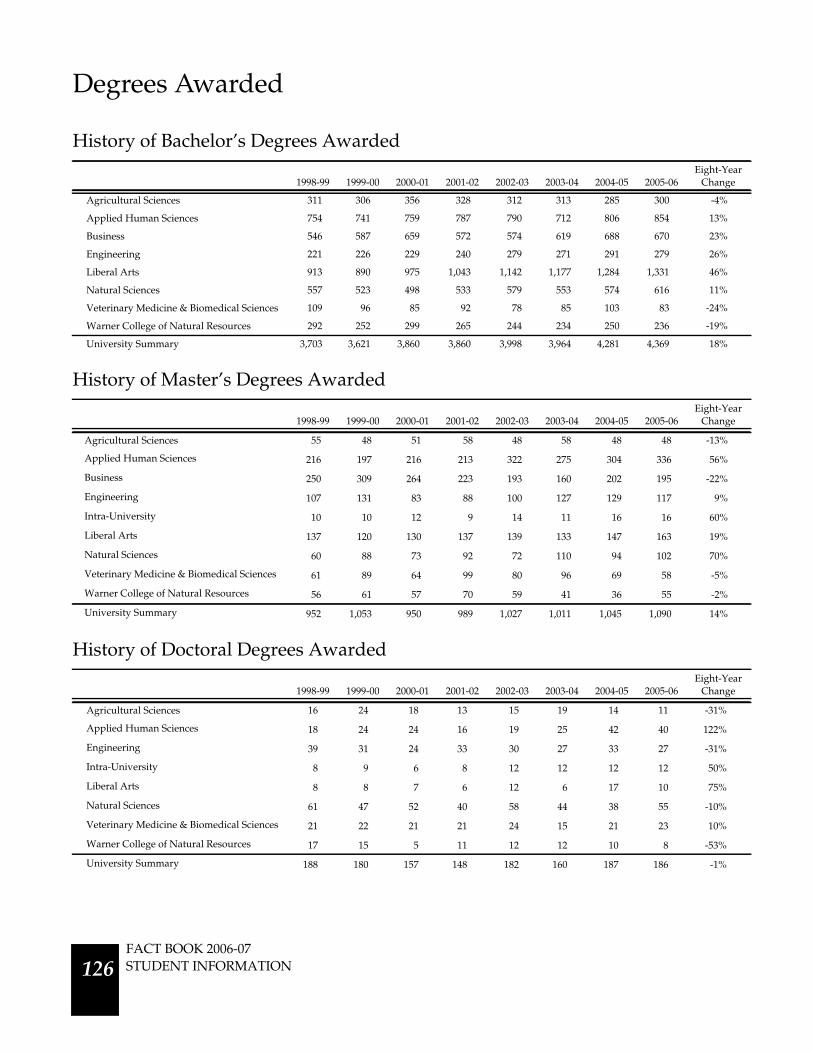
Degrees Awarded
History of Bachelor’s Degrees Awarded
History of Master’s Degrees Awarded
History of Doctoral Degrees Awarded
1998-99 1999-00 2000-01 2001-02 2002-03 2003-04 2004-05 2005-06Eight-Year
Change
Agricultural Sciences 311 306 356 328 312 313 285 300 -4%
Applied Human Sciences 754 741 759 787 790 712 806 854 13%
Business 546 587 659 572 574 619 688 670 23%
Engineering 221 226 229 240 279 271 291 279 26%
Liberal Arts 913 890 975 1,043 1,142 1,177 1,284 1,331 46%
Natural Sciences 557 523 498 533 579 553 574 616 11%
Veterinary Medicine & Biomedical Sciences 109 96 85 92 78 85 103 83 -24%
Warner College of Natural Resources 292 252 299 265 244 234 250 236 -19%
University Summary 3,703 3,621 3,860 3,860 3,998 3,964 4,281 4,369 18%
1998-99 1999-00 2000-01 2001-02 2002-03 2003-04 2004-05 2005-06Eight-Year
Change
Agricultural Sciences 55 48 51 58 48 58 48 48 -13%
Applied Human Sciences 216 197 216 213 322 275 304 336 56%
Business 250 309 264 223 193 160 202 195 -22%
Engineering 107 131 83 88 100 127 129 117 9%
Intra-University 10 10 12 9 14 11 16 16 60%
Liberal Arts 137 120 130 137 139 133 147 163 19%
Natural Sciences 60 88 73 92 72 110 94 102 70%
Veterinary Medicine & Biomedical Sciences 61 89 64 99 80 96 69 58 -5%
Warner College of Natural Resources 56 61 57 70 59 41 36 55 -2%
University Summary 952 1,053 950 989 1,027 1,011 1,045 1,090 14%
1998-99 1999-00 2000-01 2001-02 2002-03 2003-04 2004-05 2005-06Eight-Year
Change
Agricultural Sciences 16 24 18 13 15 19 14 11 -31%
Applied Human Sciences 18 24 24 16 19 25 42 40 122%
Engineering 39 31 24 33 30 27 33 27 -31%
Intra-University 8 9 6 8 12 12 12 12 50%
Liberal Arts 8 8 7 6 12 6 17 10 75%
Natural Sciences 61 47 52 40 58 44 38 55 -10%
Veterinary Medicine & Biomedical Sciences 21 22 21 21 24 15 21 23 10%
Warner College of Natural Resources 17 15 5 11 12 12 10 8 -53%
University Summary 188 180 157 148 182 160 187 186 -1%
FACT BOOK 2006-07STUDENT INFORMATION 126

Degrees Awarded
History of DVM Degrees Awarded by Gender
History of DVM Degrees Awarded by Ethnicity
1997-98 1998-99 1999-00 2000-01 2001-02 2002-03 2003-04 2004-05 2005-06Nine-Year
Change
Men 35 40 36 30 36 36 35 34 30 -14%
Women 89 102 93 101 88 96 91 104 105 18%
Total 124 142 129 131 124 132 126 138 135 9%
1997-98 1998-99 1999-00 2000-01 2001-02 2002-03 2003-04 2004-05 2005-06Nine-Year
Change
Asian American 7 10 2 3 9 3 3 9 9 29%
Black 0 0 1 0 2 1 2 0 0 0%
Hispanic 8 11 4 9 10 9 10 7 6 -25%
Native American 3 3 0 2 4 1 1 4 3 0%
Non-Minority 106 118 122 117 99 118 110 118 117 10%
Total 124 142 129 131 124 132 126 138 135 9%
1996-97 1999-00 2002-03 2005-060
1,000
2,000
3,000
4,000
5,000
History of Degrees Awarded
Bachelor’s Degrees
Master’s Degrees
Doctoral Degrees
FACT BOOK 2006-07STUDENT INFORMATION 127
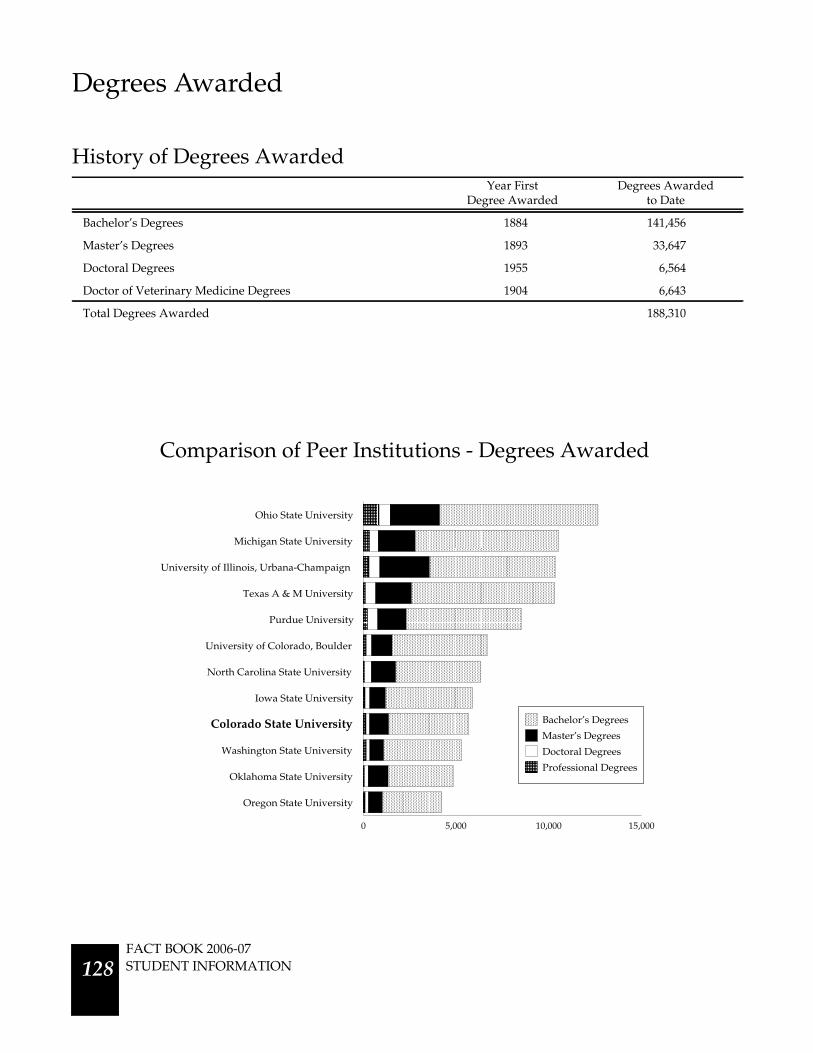
Degrees Awarded
History of Degrees AwardedYear First
Degree AwardedDegrees Awarded
to Date
Bachelor’s Degrees 1884 141,456
Master’s Degrees 1893 33,647
Doctoral Degrees 1955 6,564
Doctor of Veterinary Medicine Degrees 1904 6,643
Total Degrees Awarded 188,310
0 5,000 10,000 15,000
Oregon State University
Oklahoma State University
Washington State University
Iowa State University
North Carolina State University
University of Colorado, Boulder
Purdue University
Texas A & M University
University of Illinois, Urbana-Champaign
Michigan State University
Ohio State University
Professional Degrees
Doctoral Degrees
Master’s Degrees
Bachelor’s Degrees
Comparison of Peer Institutions - Degrees Awarded
Colorado State University
FACT BOOK 2006-07STUDENT INFORMATION 128
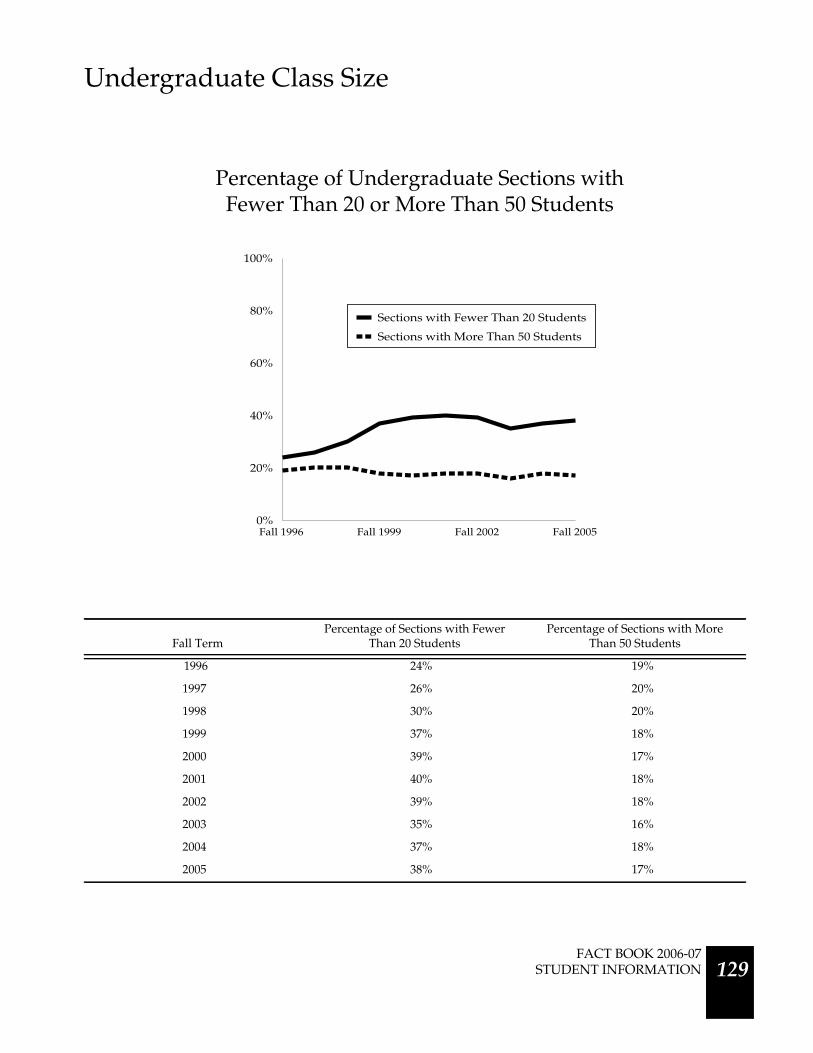
Undergraduate Class Size
Fall TermPercentage of Sections with Fewer
Than 20 StudentsPercentage of Sections with More
Than 50 Students
1996 24% 19%
1997 26% 20%
1998 30% 20%
1999 37% 18%
2000 39% 17%
2001 40% 18%
2002 39% 18%
2003 35% 16%
2004 37% 18%
2005 38% 17%
Fewer Than 20 or More Than 50 StudentsPercentage of Undergraduate Sections with
Fall 1996 Fall 1999 Fall 2002 Fall 20050%
20%
40%
60%
80%
100%
Sections with Fewer Than 20 Students
Sections with More Than 50 Students
FACT BOOK 2006-07 STUDENT INFORMATION 129
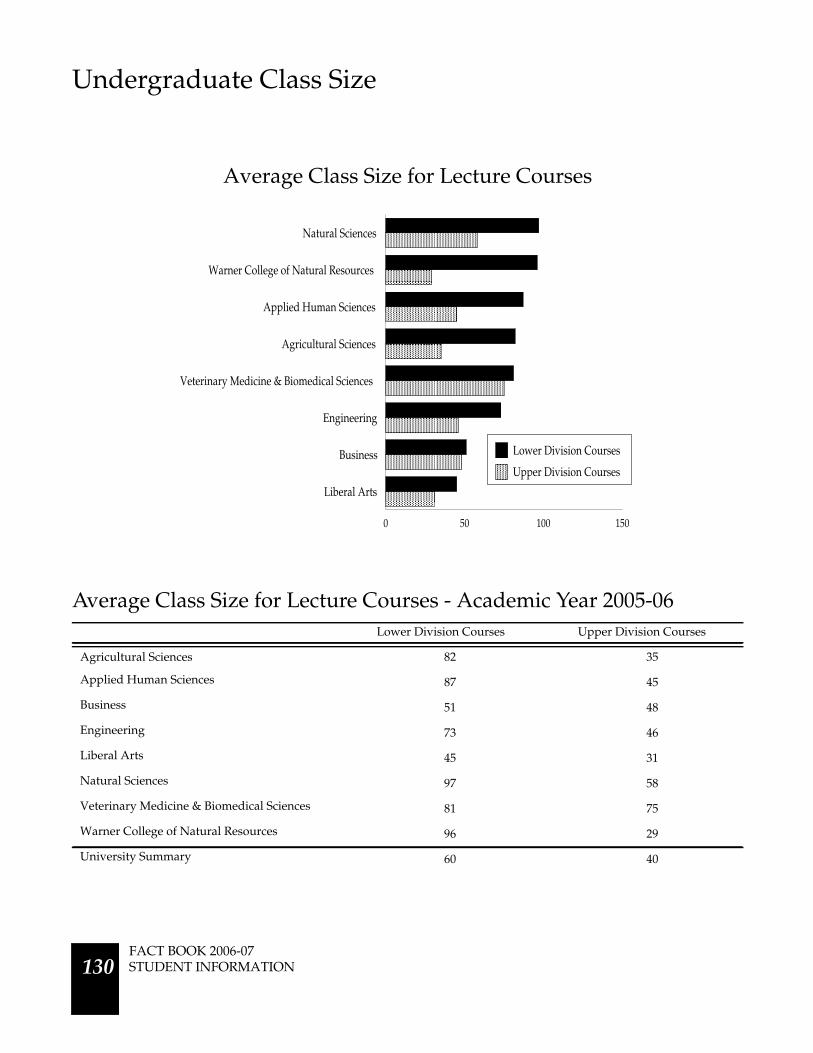
Undergraduate Class Size
Average Class Size for Lecture Courses - Academic Year 2005-06Lower Division Courses Upper Division Courses
Agricultural Sciences 82 35
Applied Human Sciences 87 45
Business 51 48
Engineering 73 46
Liberal Arts 45 31
Natural Sciences 97 58
Veterinary Medicine & Biomedical Sciences 81 75
Warner College of Natural Resources 96 29
University Summary 60 40
0 50 100 150
Liberal Arts
Business
Engineering
Veterinary Medicine & Biomedical Sciences
Agricultural Sciences
Applied Human Sciences
Warner College of Natural Resources
Natural Sciences
Upper Division Courses
Lower Division Courses
Average Class Size for Lecture Courses
FACT BOOK 2006-07STUDENT INFORMATION 130

Undergraduate Class Size
Largest Lecture Courses by College - Academic Year 2005-06Lower Division Courses Upper Division Courses
Agricultural Sciences 220 179
Applied Human Sciences 263 121
Business 206 349
Engineering 206 149
Liberal Arts 367 126
Natural Sciences 382 218
Veterinary Medicine & Biomedical Sciences 163 306
Warner College of Natural Resources 267 115
University Summary 382 349
0 100 200 300 400 500
Veterinary Medicine & Biomedical Sciences
Engineering
Business
Agricultural Sciences
Applied Human Sciences
Warner College of Natural Resources
Liberal Arts
Natural Sciences
Upper Division Courses
Lower Division Courses
Largest Lecture Courses by College and Level
FACT BOOK 2006-07 STUDENT INFORMATION 131
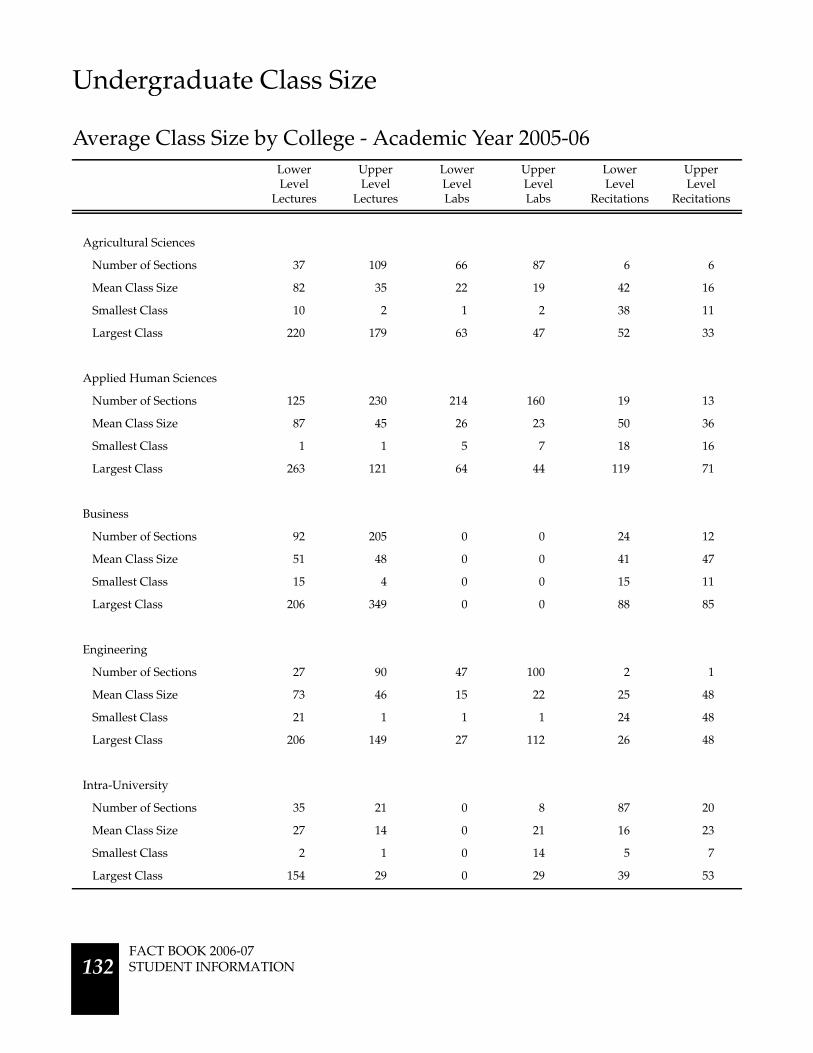
Undergraduate Class Size
Average Class Size by College - Academic Year 2005-06LowerLevel
Lectures
UpperLevel
Lectures
LowerLevelLabs
UpperLevelLabs
LowerLevel
Recitations
UpperLevel
Recitations
Agricultural Sciences
Number of Sections 37 109 66 87 6 6
Mean Class Size 82 35 22 19 42 16
Smallest Class 10 2 1 2 38 11
Largest Class 220 179 63 47 52 33
Applied Human Sciences
Number of Sections 125 230 214 160 19 13
Mean Class Size 87 45 26 23 50 36
Smallest Class 1 1 5 7 18 16
Largest Class 263 121 64 44 119 71
Business
Number of Sections 92 205 0 0 24 12
Mean Class Size 51 48 0 0 41 47
Smallest Class 15 4 0 0 15 11
Largest Class 206 349 0 0 88 85
Engineering
Number of Sections 27 90 47 100 2 1
Mean Class Size 73 46 15 22 25 48
Smallest Class 21 1 1 1 24 48
Largest Class 206 149 27 112 26 48
Intra-University
Number of Sections 35 21 0 8 87 20
Mean Class Size 27 14 0 21 16 23
Smallest Class 2 1 0 14 5 7
Largest Class 154 29 0 29 39 53
FACT BOOK 2006-07STUDENT INFORMATION 132

Undergraduate Class Size
Average Class Size by College - Academic Year 2005-06LowerLevel
Lectures
UpperLevel
Lectures
LowerLevelLabs
UpperLevelLabs
LowerLevel
Recitations
UpperLevel
Recitations
Liberal Arts
Number of Sections 966 588 176 175 50 26
Mean Class Size 45 31 18 14 55 21
Smallest Class 1 1 2 1 7 1
Largest Class 367 126 216 70 73 55
Natural Sciences
Number of Sections 286 179 568 175 175 10
Mean Class Size 97 58 24 17 32 33
Smallest Class 2 1 2 1 1 2
Largest Class 382 218 94 81 76 60
Veterinary Medicine & Biomedical Sciences
Number of Sections 18 49 1 32 17 11
Mean Class Size 81 75 24 38 30 70
Smallest Class 3 3 24 3 10 12
Largest Class 163 306 24 101 39 101
Warner College of Natural Resources
Number of Sections 26 119 43 72 0 9
Mean Class Size 96 29 14 20 0 21
Smallest Class 4 4 1 3 0 11
Largest Class 267 115 29 115 0 46
University Summary
Number of Sections 1,612 1,590 1,115 809 380 108
Mean Class Size 60 40 22 20 33 32
Smallest Class 1 1 1 1 1 1
Largest Class 382 349 216 115 119 101
FACT BOOK 2006-07 STUDENT INFORMATION 133

Undergraduate Class Size
History of Average Class Size
Peer Comparison - Class Sections with Undergraduates Enrolled
AY1997-98
AY1998-99
AY1999-00
AY2000-01
AY2001-02
AY2002-03
AY2003-04
AY2004-05
AY2005-06
Nine-YearChange
Lecture
Lower Level 61 57 57 58 62 63 62 64 60 -2%
Upper Level 39 39 38 39 41 41 41 41 40 3%
Laboratory
Lower Level 24 24 23 24 23 23 23 23 22 -8%
Upper Level 20 19 18 19 19 19 19 19 20 0%
Recitation
Lower Level 34 36 34 27 27 29 33 36 33 -3%
Upper Level 27 31 29 28 29 30 31 34 32 19%
Percentage of Classes with FewerThan 20 Students
Percentage of Classes with 50 orMore Students
University of Colorado, Boulder 47% 15%
Ohio State University 43% 17%
Oregon State University 42% 18%
Washington State University 40% 17%
Colorado State University 38% 17%
Iowa State University 36% 17%
Purdue University 33% 19%
North Carolina State University 31% 15%
Oklahoma State University 28% 16%
Michigan State University 21% 24%
Texas A & M University 20% 25%
FACT BOOK 2006-07STUDENT INFORMATION 134

0.0 10.0 20.0 30.0 40.0
Veterinary Medicine & Biomedical Sciences
Liberal Arts
Agricultural Sciences
Warner College of Natural Resources
Natural Sciences
Engineering
Business
Applied Human Sciences
1996-97 1999-00 2002-03 2005-0610.0
12.0
14.0
16.0
18.0
20.0
Student to Faculty Ratio
History of University Student to Faculty Ratio
Note: PVM students are excluded. The student to faculty ratio is calculated by dividing the number of full-time faculty plus one-third of the part-timefaculty by the number of full-time majors plus one-third of the part-time majors.
Student to Faculty Ratio by College
FACT BOOK 2006-07 STUDENT INFORMATION 135
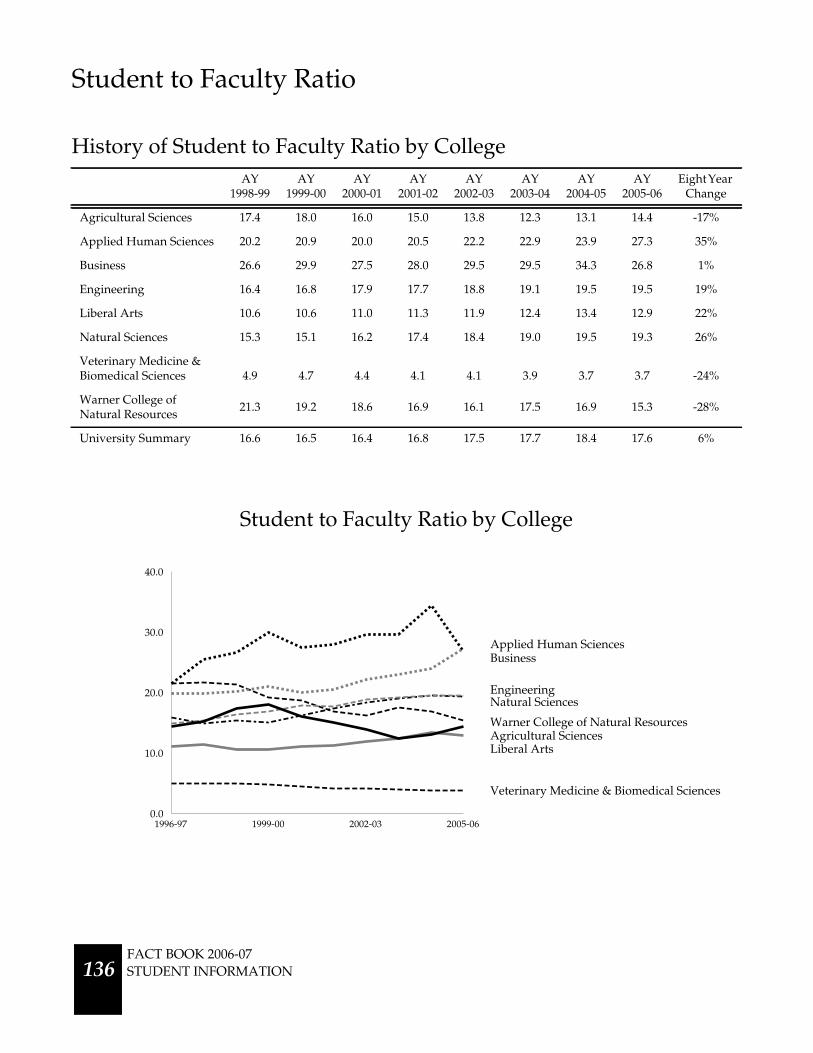
Student to Faculty Ratio
History of Student to Faculty Ratio by CollegeAY
1998-99AY
1999-00AY
2000-01AY
2001-02AY
2002-03AY
2003-04AY
2004-05AY
2005-06EightYear
Change
Agricultural Sciences 17.4 18.0 16.0 15.0 13.8 12.3 13.1 14.4 -17%
Applied Human Sciences 20.2 20.9 20.0 20.5 22.2 22.9 23.9 27.3 35%
Business 26.6 29.9 27.5 28.0 29.5 29.5 34.3 26.8 1%
Engineering 16.4 16.8 17.9 17.7 18.8 19.1 19.5 19.5 19%
Liberal Arts 10.6 10.6 11.0 11.3 11.9 12.4 13.4 12.9 22%
Natural Sciences 15.3 15.1 16.2 17.4 18.4 19.0 19.5 19.3 26%
Veterinary Medicine &Biomedical Sciences 4.9 4.7 4.4 4.1 4.1 3.9 3.7 3.7 -24%
Warner College ofNatural Resources
21.3 19.2 18.6 16.9 16.1 17.5 16.9 15.3 -28%
University Summary 16.6 16.5 16.4 16.8 17.5 17.7 18.4 17.6 6%
1996-97 1999-00 2002-03 2005-060.0
10.0
20.0
30.0
40.0
BusinessApplied Human Sciences
Warner College of Natural Resources
Engineering
Agricultural Sciences
Natural Sciences
Liberal Arts
Veterinary Medicine & Biomedical Sciences
Student to Faculty Ratio by College
FACT BOOK 2006-07STUDENT INFORMATION 136

University Honors Program
Profile of Honors Program StudentsTotal Number Percent
By College
Agricultural Sciences 63 8%
Applied Human Sciences 71 9%
Business 80 10%
Engineering 87 10%
Intra-University 8 1%
Liberal Arts 173 21%
Natural Sciences 231 29%
Veterinary Medicine & Biomedical Sciences 64 8%
Warner College of Natural Resources 33 4%
Total 810 100%
By Gender
Men 247 30%
Women 563 70%
Total 810 100%
By Ethnicity
Asian American 25 3%
Black 1 0%
Hispanic 36 4%
Native American 5 1%
White 710 88%
Other 33 4%
Total 810 100%
By Residency
Resident 547 68%
Nonresident 263 32%
Total 810 100%
University Honors Program
Small classes taught by CSU’s finest professorsTwo curricular tracks that provide enriched educational experiences for high ability students in all majorsUniversity Honors Scholars, Track 1, satisfies most AUCC core requirements with four Honors seminars
Discipline Honors Scholars, Track 2, satisfies most Honors requirements with upper division Honors classes in the majorOffers an opportunity to live in the Honors Living Learning Community
FACT BOOK 2006-07 STUDENT INFORMATION 137
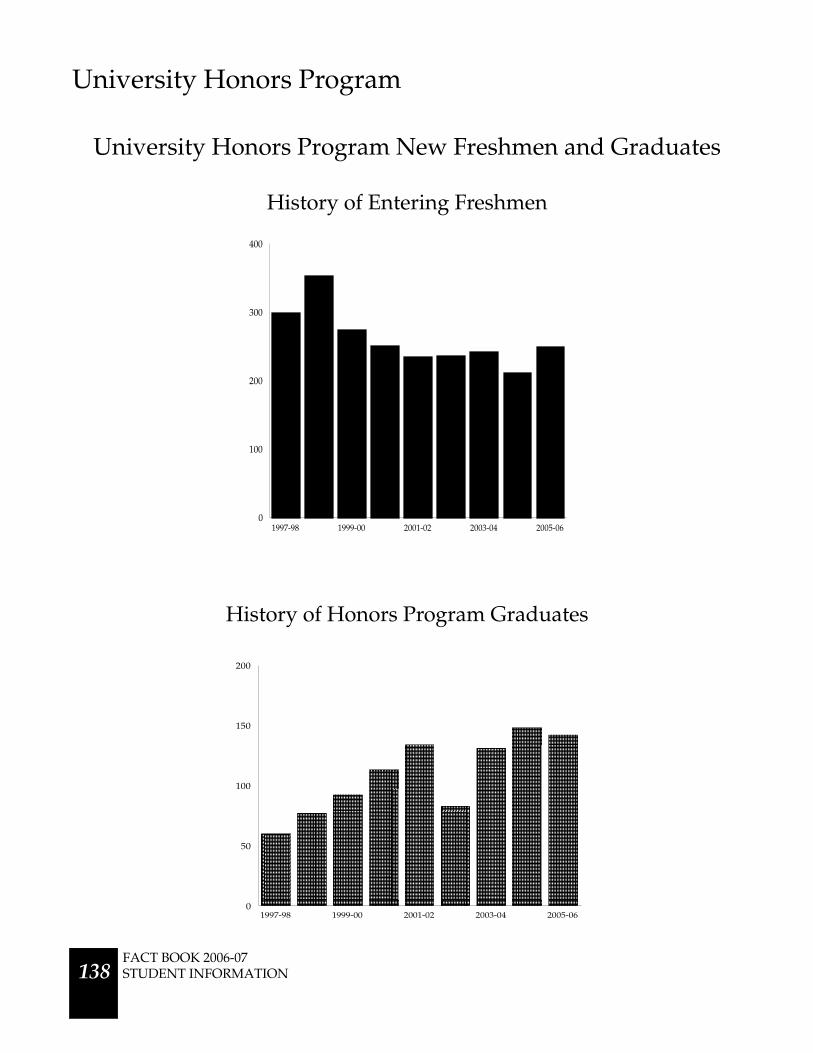
University Honors Program
1997-98 1999-00 2001-02 2003-04 2005-060
100
200
300
400
1997-98 1999-00 2001-02 2003-04 2005-060
50
100
150
200
History of Honors Program Graduates
University Honors Program New Freshmen and Graduates
History of Entering Freshmen
FACT BOOK 2006-07STUDENT INFORMATION 138

Graduate Student Continuous Registration
Graduate StudentContinuous Registration
Agricultural Sciences 54
Applied Human Sciences 128
Business 29
Engineering 171
Intra-University 30
Liberal Arts 140
Natural Sciences 64
Veterinary Medicine & Biomedical Sciences 55
Warner College of Natural Resources 64
University Summary 735
Note: A policy implemented in the fall of 1997 requires graduate students who are not formally enrolled for course credits to register under ContinuousRegistration. This change resulted in a large increase in the university headcount. Continuous Registration generates no credit hours; therefore, there isno corresponding change in FTE.
Continuous Registration by College
0 50 100 150 200
Business
Intra-University
Agricultural Sciences
Veterinary Medicine & Biomedical Sciences
Warner College of Natural Resources
Natural Sciences
Applied Human Sciences
Liberal Arts
Engineering
FACT BOOK 2006-07 STUDENT INFORMATION
139
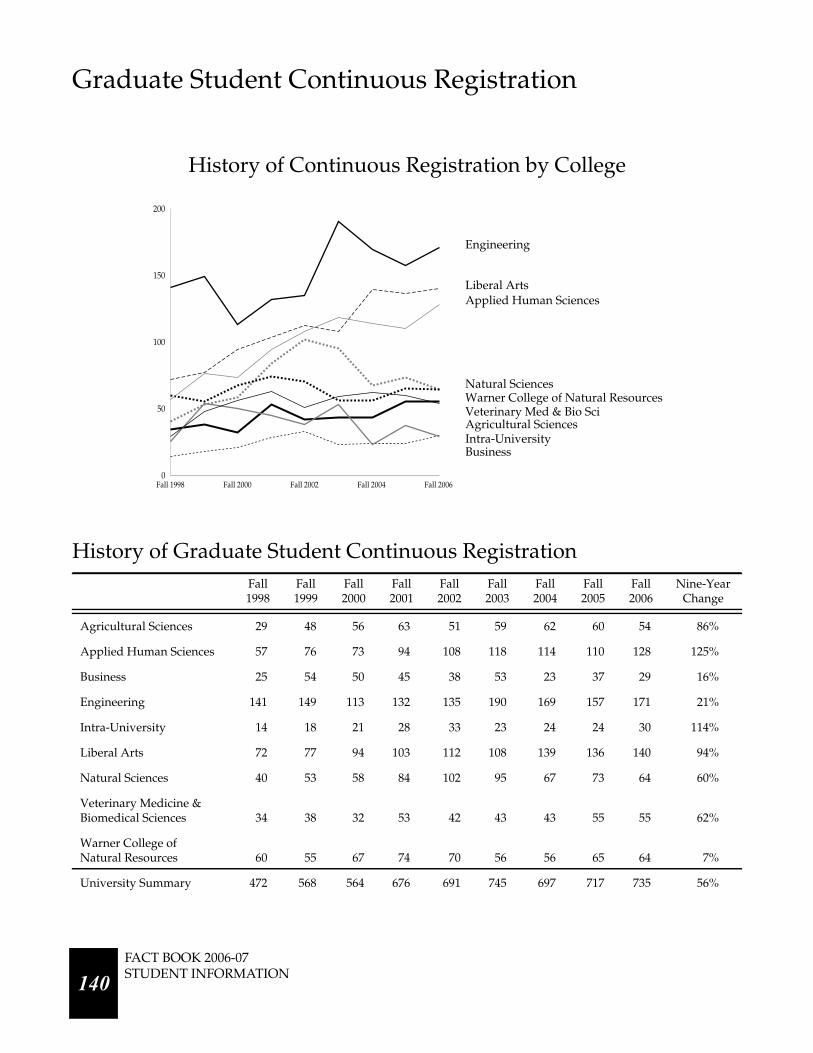
Graduate Student Continuous Registration
History of Graduate Student Continuous RegistrationFall1998
Fall1999
Fall2000
Fall2001
Fall2002
Fall2003
Fall2004
Fall2005
Fall2006
Nine-YearChange
Agricultural Sciences 29 48 56 63 51 59 62 60 54 86%
Applied Human Sciences 57 76 73 94 108 118 114 110 128 125%
Business 25 54 50 45 38 53 23 37 29 16%
Engineering 141 149 113 132 135 190 169 157 171 21%
Intra-University 14 18 21 28 33 23 24 24 30 114%
Liberal Arts 72 77 94 103 112 108 139 136 140 94%
Natural Sciences 40 53 58 84 102 95 67 73 64 60%
Veterinary Medicine &Biomedical Sciences 34 38 32 53 42 43 43 55 55 62%
Warner College ofNatural Resources 60 55 67 74 70 56 56 65 64 7%
University Summary 472 568 564 676 691 745 697 717 735 56%
Fall 1998 Fall 2000 Fall 2002 Fall 2004 Fall 20060
50
100
150
200
History of Continuous Registration by College
Engineering
Liberal ArtsApplied Human Sciences
Natural SciencesWarner College of Natural Resources
Agricultural SciencesVeterinary Med & Bio Sci
BusinessIntra-University
FACT BOOK 2006-07STUDENT INFORMATION
140

4%
16%17%
32%
11%
20%
Education Abroad Programs
Program Participants Percent by Program
CSU College Sponsored 119 20%
CSU Exchange 27 4%
CSU Short Course/Summer 95 16%
CSU Field Study 103 17%
Other Semester/Year 197 32%
Other Short Course/Summer 69 11%
Total 610 100%
Education Abroad Participants by Program Type
CSU College Sponsored20%
CSU Short Course/Summer16%
CSU Field Study17%
Other Semester/Year32%
Other Short Course/Summer11%
Total Students = 610
Note: The CSU Field Study is offered for no credit.
CSU Exchange4%
FACT BOOK 2006-07 STUDENT INFORMATION 141
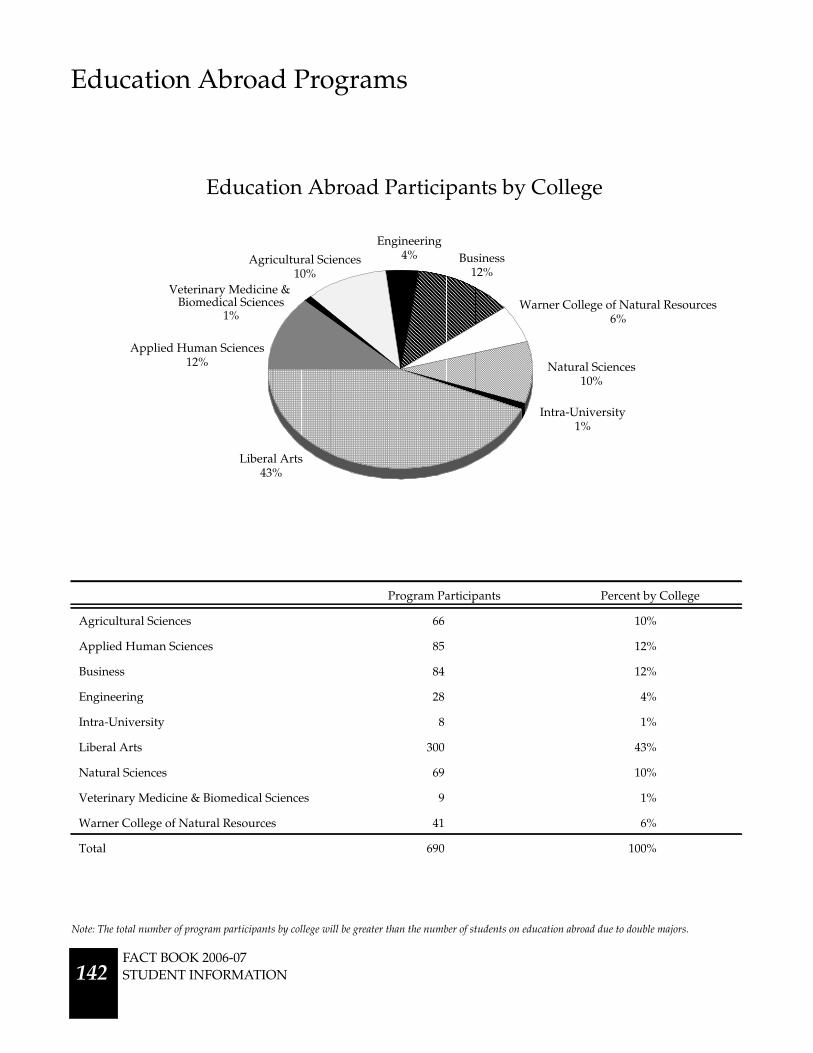
Education Abroad Programs
Program Participants Percent by College
Agricultural Sciences 66 10%
Applied Human Sciences 85 12%
Business 84 12%
Engineering 28 4%
Intra-University 8 1%
Liberal Arts 300 43%
Natural Sciences 69 10%
Veterinary Medicine & Biomedical Sciences 9 1%
Warner College of Natural Resources 41 6%
Total 690 100%
Education Abroad Participants by College
Note: The total number of program participants by college will be greater than the number of students on education abroad due to double majors.
1%
43%
12%
1%
10%4%
12%
6%
10%
Applied Human Sciences12%
Veterinary Medicine &
1%Warner College of Natural Resources
6%
Intra-University1%
Natural Sciences10%
Biomedical Sciences
Business12%
Agricultural Sciences10%
Liberal Arts43%
Engineering4%
FACT BOOK 2006-07STUDENT INFORMATION142

Education Abroad Programs
Education Abroad by Country
Africa and the Middle East Latin America & the CaribbeanCyprus 2 Argentina 7
Kenya 4 Bahamas 9
Madagascar 1 Belize 1
Senegal 1 Chile 9
South Africa 2 Costa Rica 15
Turkey 3 Dominican Republic 6
United Arab Emirates 1 Ecuador 8
Total Africa and the Middle East 14 El Salvador 8
Guatemala 15
Asia Mexico 7
India 2 Multiple Countries (Argentina/Chile) 1
Japan 14 Panama 18
Multiple Countries (Korea/China) 10 Total Latin America & the Caribbean 104
People’s Republic of China 2
Vietnam 1
Total Asia 29 North AmericaCanada 1
Europe Total North America 1
Austria 1
Czech Republic 25 OceaniaDenmark 2 Australia 97
France 21 New Zealand 27
Germany 21 Total Oceania 124
Greece 1
Hungary 3 OtherIreland 9 Multiple Countries - Semester at Sea 17
Italy 68 Total Other 17
Netherlands 1
Norway 1 Total Students 610Spain 92
Multiple Countries 16
United Kingdom 60
Total Europe 321
FACT BOOK 2006-07 STUDENT INFORMATION 143
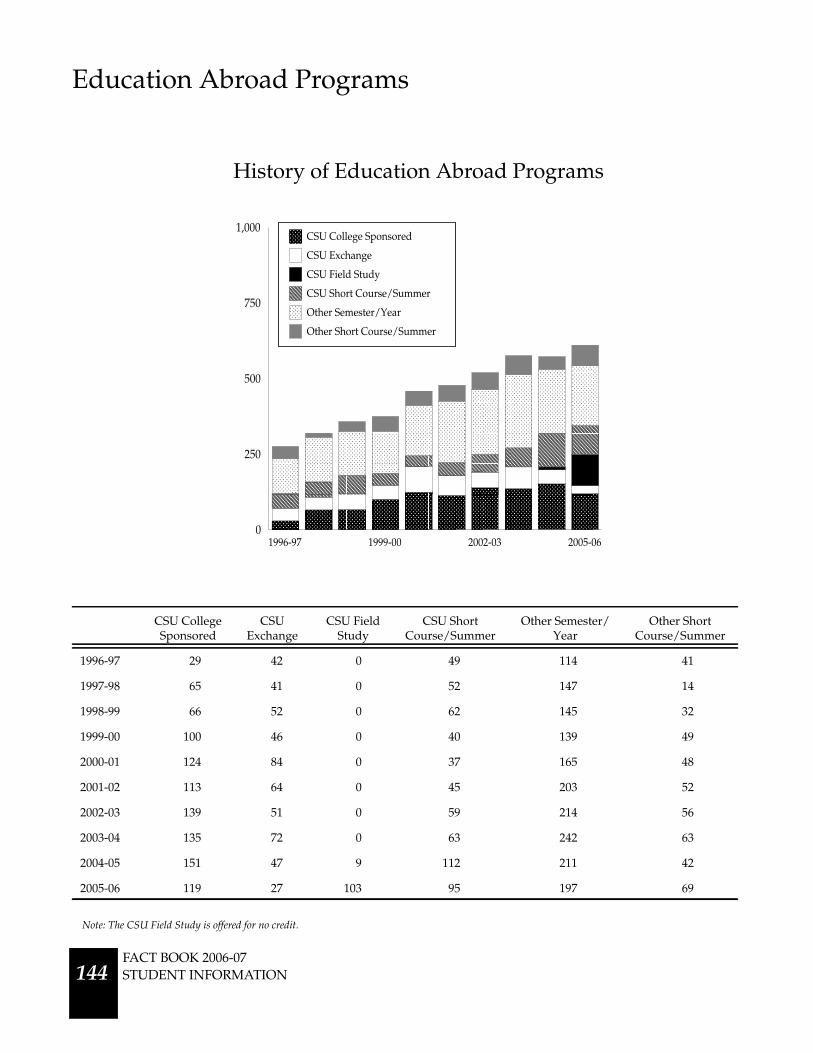
Education Abroad Programs
CSU CollegeSponsored
CSUExchange
CSU FieldStudy
CSU ShortCourse/Summer
Other Semester/Year
Other ShortCourse/Summer
1996-97 29 42 0 49 114 41
1997-98 65 41 0 52 147 14
1998-99 66 52 0 62 145 32
1999-00 100 46 0 40 139 49
2000-01 124 84 0 37 165 48
2001-02 113 64 0 45 203 52
2002-03 139 51 0 59 214 56
2003-04 135 72 0 63 242 63
2004-05 151 47 9 112 211 42
2005-06 119 27 103 95 197 69
1996-97 1999-00 2002-03 2005-060
250
500
750
1,000CSU College Sponsored
CSU Exchange
CSU Field Study
CSU Short Course/Summer
Other Semester/Year
Other Short Course/Summer
History of Education Abroad Programs
Note: The CSU Field Study is offered for no credit.
FACT BOOK 2006-07STUDENT INFORMATION144

Other Student Enrollment
Fall Term Enrollment
1998 59
1999 63
2000 39
2001 48
2002 48
2003 48
2004 36
2005 36
2006 39
Fall 1998 Fall 2000 Fall 2002 Fall 2004 Fall 20060
20
40
60
80
High School Students Enrolled at CSU
Note: A policy change in fall of 2000 required high school students to pay up front for classes taken at CSU.
FACT BOOK 2006-07 STUDENT INFORMATION 145

Other Student Enrollment
Fall Term Enrollment
1997 6.9%
1998 7.8%
1999 9.0%
2000 9.4%
2001 9.3%
2002 8.3%
2003 7.4%
2004 6.3%
2005 5.6%
2006 5.5%
Total University EnrollmentEnrollment in Technology Programs as a Percentage of
Fall 1997 Fall 2000 Fall 2003 Fall 20060%
5%
10%
15%
Note: Technology enrollment includes students with a major in Computer Science, Electrical & Computer Engineering, Computer Information Sys-tems and Technical Journalism.
FACT BOOK 2006-07STUDENT INFORMATION 146


![4.자본적지출 [ 경영부 소관 ]. 자본적지출.pdf · ·쇼파 1인용 408천원*3개 = 1,224 ·쇼파 3인용 715천원*1개 = 715 ·응접탁자 360천원*1개 = 360 행정전산장비](https://static.fdocuments.net/doc/165x107/5f5244f32bca3863526152a7/4eoe-ee-oee-eoepdf-oeoe-1-408oe3eoe.jpg)