Student Fact Book Fall 2007 - Wright
145
Student Fact Book Fall 2007 Thirty-First Annual Edition Office of Budget Planning and Resource Analysis
Transcript of Student Fact Book Fall 2007 - Wright

Student Fact Book Fall 2007
Thirty-First Annual Edition
Office of Budget Planning and Resource Analysis

Office of Budget Planning and Resource Analysis
Keith Ralston, Associate Vice President, 224A University Hall, x2408E-mail: [email protected]
Pat Bleidorn, Administrative Specialist, 224 University Hall, x2408E-mail: [email protected]
Kary Brigger, Data Analyst III, Institutional Research, 201G University Hall, x2738E-mail: [email protected]
Barbara Bullock, Director, Institutional Research, 220 University Hall, x3759E-mail: [email protected]
Judy Cathcart, Systems Reporting Specialist II, Institutional Research, 201G University Hall, x2308E-mail: [email protected]
Lura Clapper, Director, Risk Management & Insurance, 226 University Hall, x3908E-mail: [email protected]
Mike Coons, Emergency Management Administrator, Risk Management & Insurance, 228 University Hall, x3440E-mail: [email protected]
Sheri Coyle, Business Manager, Budget, 215 University Hall, x2490E-mail: [email protected]
Caye Elmore, Director, Budget, 218 University Hall, x2314E-mail: [email protected]
Sheila Hull, Systems Reporting Specialist II, Institutional Research, 212 University Hall, x2376E-mail: [email protected]
Danna Lawhorn, Budget Analyst II, Budget, 213 University Hall, x4297E-mail: [email protected]
Kitt Lurie, Data Analyst IV, Institutional Research, 232 University Hall, x2334E-mail: [email protected]
Cindy Norbut, Budget Analyst II, Budget, 215 University Hall, x3635E-mail: [email protected]
Doris Osborne, Budget Analyst II, Budget, 230 University Hall, x2338E-mail: [email protected]
Maggie Ratep-Schankin, Budget Analyst IV, Budget, 214 University Hall, x2729E-mail: [email protected]
Jacqueline Robinson, Budget Analyst IV, Budget, 216 University Hall, x3507E-mail: [email protected]
Craig This, Data Analyst III, Institutional Research, 213 University Hall, x4296E-mail: [email protected]
Tiffany Wellinghoff, Data Analyst III, Institutional Research, 201G University Hall, x3208E-mail: [email protected]
Graduate Assistant: Mary HammakerStudent Assistants: Mara Rindler, Courtney Bruno

Table of Contents
Student Populations...................................................................................................................................... 1-3
Student Headcount Enrollment.................................................................................................................... 4
Credit Hour Enrollment................................................................................................................................. 5-6
Degree Seeking/Non-Degree Seeking Headcount Enrollment.................................................................. 7-8
Student Headcount Enrollment by College................................................................................................. 9-17
Financial Aid.................................................................................................................................................. 18
Full-Time/Part-Time Student Headcount Enrollment................................................................................. 19-20
Undergraduate Students by Major............................................................................................................... 21-27
Graduate and Professional Students by Major........................................................................................... 28-30
Student Headcount Enrollment by Ohio County........................................................................................ 31-32
Ohio Counties: Tier Groups...................................................................................................................…… 33
Student Headcount Enrollment by State..................................................................................................... 34
International Students................................................................................................................................... 35-37
Students Living in Campus Housing........................................................................................................... 38
Age of Students............................................................................................................................................. 39-40
Undergraduate Grade Point Averages......................................................................................................... 41-42
New Degree Seeking Freshmen Students................................................................................................... 43-52
High School Origin.................................................................................................................................. 43
Intended Area of Study........................................................................................................................... 44-45
SAT Scores.............................................................................................................................................. 46
ACT Scores.............................................................................................................................................. 47-48
Class Rank and High School GPA......................................................................................................... 49-50
Headcount Enrollment by Ohio County................................................................................................ 51-52
Retention and Graduation Rates.................................................................................................................. 53-54
Transfer Students.......................................................................................................................................... 55-56
Degrees Awarded ......................................................................................................................................... 57-61

Table of Contents cont'd.
Headcount Enrollment by Ethnicity............................................................................................................. M1-M4
Undergraduate Headcount Enrollment by College..................................................................................... M5-M9
Graduate/Professional Headcount Enrollment by College........................................................................ M10-M12
Undergraduate Students by Major............................................................................................................... M13-M16
Graduate and Professional Students by Major........................................................................................... M17-M19
Full-Time/Part-Time Student Headcount Enrollment................................................................................. M20
Undergraduate Student Headcount Enrollment by Ohio County.............................................................. M21
Graduate Student Headcount Enrollment by Ohio County....................................................................... M22
Student Headcount Enrollment by State..................................................................................................... M23
Students Living in Campus Housing........................................................................................................... M24
Mean Cumulative Undergraduate Grade Point Average............................................................................ M25-M26
Age of Students............................................................................................................................................. M27
New Degree Seeking Freshmen Students................................................................................................... M28-M35
High School Origin...........................................................................................................................…… M28
Intended Area of Study........................................................................................................................... M29-M31
High School Rank and GPA................................................................................................................... M32
SAT Scores.................................................................................................................................... M33
Composite ACT Scores.......................................................................................................................... M34
Ohio County of Residence..................................................................................................................... M35
Retention and Graduation Rates.................................................................................................................. M36-M37
Transfer Students...........................................................................................................................………… M38-M41
Degrees Awarded.......................................................................................................................……………… M42-M44
Minority Students

Table of Contents cont'd.
Lake Campus Longitudinal Data.................................................................................................................. LC1-LC2
All Students Headcount Enrollment............................................................................................................ L1
Degree Seeking/Non-Degree Seeking Students......................................................................................... L1-L2
Full-Time/Part-Time, Full-Time Equivalent.................................................................................................. L3
Entrance Status............................................................................................................................................. L4
Degree Seeking Student Headcount Enrollment By College.................................................................... L5
Students by College...................................................................................................................................... L6
Undergraduate Majors................................................................................................................................... L7-L13
Raj Soin College of Business................................................................................................................. L7
College of Education & Human Services.............................................................................................. L8-L9
College of Engineering and Computer Science................................................................................... L10
College of Liberal Arts............................................................................................................................ L11-L12
College of Nursing & Health................................................................................................................... L12
College of Science and Mathematics.................................................................................................... L13
Master's Degree Majors................................................................................................................................. L14-L15
Student Headcount Enrollment in Doctoral and Professional Programs................................................ L16
Area of Study of New Degree Seeking Freshmen Students...................................................................... L16
Minority Students.......................................................................................................................................... L17
International Students................................................................................................................................... L17
Mean Age........................................................................................................................................................ L17
Housing Vs. Commuter Students................................................................................................................. L17
Undergraduate Mean Grade Point Average................................................................................................ L18-L19
Average Credit Hour Loads.......................................................................................................................... L20
New Freshmen Mean ACT & SAT Scores.................................................................................................... L20
New Freshmen High School Origin.............................................................................................................. L21-L22
Transfer Students.......................................................................................................................................... L23-L25
Degrees Awarded.......................................................................................................................................... L26
Headcount Enrollment 1964-2007................................................................................................................ L27-L28
Full Time Equivalent Enrollment 1982-2007................................................................................................ L29-L30
Longitudinal Information

Student PopulationsAll Students
*Attended Fall 2006, Winter, Spring or Summer Quarter 2007**Attended Prior to Fall Quarter 2006
60
77
124
240
254
298
505
514
525
536
605
845
870
933
1,026
1,258
1,634
1,694
1,834
2,290
2,347
2,355
2,564
2,741
2,810
3,108
5,304
7,354
11,511
16,043
16,151
16,913
13,304
12,938
3,609
9,559
5,062
4,328
3,965
3,810
- 5,000 10,000 15,000 20,000
Native American Students
Special Graduate Students
School of Professional Psy.
Hispanic Students
Ph.D. Students
Non-Degree Masters
Readmitted Students**
School of Medicine
Asian Students
Professional Students
International Students
Lake Campus
Non-Degree Students
College of Nursing & Health
Transfer Students
College of Egr & CS
College of Science & Math
Raj Soin College of Business
African American Students
Sophomores
College of Education & H.S.
Juniors
College of Liberal Arts
Students in Housing
Degree Seeking Masters
Master's Students
Part-Time Students
New Students
Seniors
Freshmen
Univ. College Students
25+ Years of Age
Male Students
Female Students
Continuing Students*
Undergraduates
Full-Time Students
Degree Seeking Students
Main Campus
Total

Student PopulationsUndergraduate Students
*Attended Fall 2006, Winter, Spring or Summer Quarter 2007**Attended Prior to Fall Quarter 2006
53
128
140
191
307
317
495
678
716
734
1,026
1,203
1,275
1,289
1,559
2,007
2,260
2,290
2,355
2,478
2,681
2,782
4,328
5,062
5,762
7,176
10,931
12,279
12,443
12,938
3,965
8,823
- 5,000 10,000 15,000
Native American Students
Associate Degree Programs
International Students
Hispanic Students
Readmitted Students**
Asian Students
Non-Degree Students
College of Egr & CS
Lake Campus
College of Nursing & Health
Transfer Students
Raj Soin College of Business
College of Education & H.S.
College of Science & Math
African American Students
Part-Time Students
College of Liberal Arts
Sophomores
Juniors
25+ Years of Age
Students in Housing
New Students
Seniors
Freshmen
Univ. College Students
Male Students
Female Students
Continuing Students*
Full-Time Students
Main Campus
Degree Seeking Students
Total

Student PopulationsGraduate/Professional Students
*Attended Fall 2006, Winter, Spring or Summer Quarter 2007**Any Grad student that had been at WSU previously; non-degree Grad students who are now degree Grad students, or any Grad student out for more than 4 quarters
7
49
60
77
124
198
199
208
254
275
298
304
345
465
491
514
536
2,373
2,383
2,688
3,108
3,600
3,975
2,810
1,592
1,602
2,826
1,072
1,028
580
- 1,000 2,000 3,000 4,000 5,000
Native American Students
Hispanic Students
Students in Housing
Special Graduate Students
School of Professional Psy.
Readmitted Students**
College of Nursing & Health
Asian Students
Ph.D. Students
African American Students
Non-Degree Masters
College of Liberal Arts
College of Science & Math
International Students
Raj Soin College of Business
School of Medicine
Professional Students
College of Egr & CS
New Students
College of Education & H.S.
Male Students
Part-Time Students
Full-Time Students
Female Students
Continuing Students*
Degree Seeking Masters
25+ Years of Age
Master's Students
Degree Seeking Students
Total

Student Headcount Enrollment*
Undergraduate Students
Continuing A Readmitted B New C Transfer D TotalMen Women Total Men Women Total Men Women Total Men Women Total Men Women Total
Freshman Full Time 498 507 1,005 10 12 22 1,087 1,418 2,505 108 104 212 1,703 2,041 3,744 Part Time 97 111 208 9 19 28 107 145 252 39 57 96 252 332 584 Total 595 618 1,213 19 31 50 1,194 1,563 2,757 147 161 308 1,955 2,373 4,328
Sophomore Full Time 793 944 1,737 11 23 34 8 10 18 128 136 264 940 1,113 2,053 Part Time 80 94 174 9 13 22 1 0 1 18 22 40 108 129 237 Total 873 1,038 1,911 20 36 56 9 10 19 146 158 304 1,048 1,242 2,290
Junior Full Time 792 1,002 1,794 29 25 54 1 4 5 91 118 209 913 1,149 2,062 Part Time 89 114 203 14 11 25 0 0 0 20 45 65 123 170 293 Total 881 1,116 1,997 43 36 79 1 4 5 111 163 274 1,036 1,319 2,355
Senior Full Time 1,262 1,675 2,937 23 33 56 0 0 0 35 44 79 1,320 1,752 3,072 Part Time 355 410 765 28 38 66 1 0 1 19 42 61 403 490 893 Total 1,617 2,085 3,702 51 71 122 1 0 1 54 86 140 1,723 2,242 3,965
Total Full Time 3,345 4,128 7,473 73 93 166 1,096 1,432 2,528 362 402 764 4,876 6,055 10,931 Part Time 621 729 1,350 60 81 141 109 145 254 96 166 262 886 1,121 2,007 Total UG 3,966 4,857 8,823 133 174 307 1,205 1,577 2,782 458 568 1,026 5,762 7,176 12,938
Graduate Students
Continuing A Readmitted B New E Special D TotalMen Women Total Men Women Total Men Women Total Men Women Total Men Women Total
Master's Full Time 427 571 998 32 48 80 251 295 546 710 914 1,624 Part Time 349 734 1,083 30 76 106 122 173 295 501 983 1,484 Total 776 1,305 2,081 62 124 186 373 468 841 1,211 1,897 3,108
Special Grad Full Time 0 0 0 0 11 11 0 11 11 Part Time 2 14 16 6 44 50 8 58 66 Total 2 14 16 6 55 61 8 69 77
Professional Full Time 151 242 393 0 1 1 56 82 138 207 325 532 Part Time 1 3 4 0 0 0 0 0 0 1 3 4 Total 152 245 397 0 1 1 56 82 138 208 328 536
Doctoral Full Time 110 56 166 9 2 11 14 15 29 133 73 206 Part Time 28 16 44 0 0 0 4 0 4 32 16 48 Total 138 72 210 9 2 11 18 15 33 165 89 254
Total Full Time 688 869 1,557 41 51 92 321 392 713 0 11 11 1,050 1,323 2,373 Part Time 378 753 1,131 30 76 106 128 187 315 6 44 50 542 1,060 1,602 Total GR 1,066 1,622 2,688 71 127 198 449 579 1,028 6 55 61 1,592 2,383 3,975
GRAND TOTALContinuing A Readmitted B New C/E Transfer/Special D Total
Men Women Total Men Women Total Men Women Total Men Women Total Men Women Total Full Time 4,033 4,997 9,030 114 144 258 1,417 1,824 3,241 362 413 775 5,926 7,378 13,304 Part Time 999 1,482 2,481 90 157 247 237 332 569 102 210 312 1,428 2,181 3,609 Total 5,032 6,479 11,511 204 301 505 1,654 2,156 3,810 464 623 1,087 7,354 9,559 16,913
* Includes degree and non-degree students for all campuses D Transfers: First time enrollment at WSU - attended another college or universityA attended Fall 2006, Winter, Spring, or Summer 2007 Special Grads: Graduate students onlyB attended prior to Fall 2006 E First time enrollment as a graduate /professional student at WSU C First time enrollment at WSU -did not attend any other college or university - includes students who attended WSU as undergraduates and also transients - includes PSEO students and transients Source: ODS

Main Campus Lake Campus University Total*
No. of HoursNo. of
Students PercentageNo. of
Students PercentageNo. of
Students Percentage0.0*-3.0 121 1.0% 27 3.8% 148 1.1%3.5-6.0 637 5.2% 89 12.4% 726 5.6%6.5-9.0 837 6.8% 98 13.7% 929 7.2%9.5-11.5 187 1.5% 17 2.4% 204 1.6%
12.0-15.0 5,660 46.1% 327 45.7% 5,960 46.1%15.5-18.0 4,298 35.0% 131 18.3% 4,414 34.1%Over 18.0 539 4.4% 27 3.8% 557 4.3%
No. of Hours
No. of Students Percentage
No. of Students Percentage
No. of Students Percentage
No. of Students Percentage
0.0*-3.0 293 9.5% 13 10.1% 33 13.0% 1 0.2%3.5-6.0 1,109 36.0% 36 27.9% 13 5.1% 3 0.6%6.5-9.0 866 28.1% 59 45.7% 12 4.7% 2 0.4%
9.5-11.5 87 2.8% 1 0.8% 6 2.4% 3 0.6%12.0-15.0 587 19.0% 15 11.6% 155 61.0% 82 15.3%15.5-18.0 132 4.3% 5 3.9% 34 13.4% 426 79.5%Over 18.0 8 0.3% 0 0.0% 1 0.4% 19 3.5%
No. of HoursNo. of
Students Percentage
Cumulative No. of
StudentsCumulative Percentage
0.0*-3.0 488 2.9% 488 2.9%3.5-6.0 1,887 11.2% 2,375 14.0%6.5-9.0 1,857 11.0% 4,232 25.0%
9.5-11.5 300 1.8% 4,532 26.8%12.0-15.0 6,790 40.1% 11,322 66.9%15.5-18.0 5,006 29.6% 16,328 96.5%Over 18.0 585 3.5% 16,913 100.0%
*Unduplicated Headcount
All Students*
Masters - Lake
Graduate/Professional Students
Number of Credit Hours by Student Level
Undergraduate Students
Masters - Main Doctoral Professional

Main Campus Lake Campus Total University
Student Credit HoursUndergraduate 167,852 7,902 175,754Masters 22,827 796 23,623Doctoral 2,783 2,783Professional 9,189 9,189Total 202,651 8,698 211,349
Full-Time Equivalency (FTE)*Undergraduate 11,190.13 526.80 11,716.93Masters 1,521.80 53.07 1,574.87Doctoral 185.53 185.53Professional 612.60 612.60Total 13,510.07 579.87 14,089.93
Avg Credit Hour Load: Full-TimeUndergraduate 14.88 13.47 14.89Masters 10.62 7.69 10.65Doctoral 13.03 13.03Professional 17.24 17.24Total 14.42 12.67 14.43
Avg Credit Hour Load: Part-TimeUndergraduate 6.53 5.94 6.48Masters 4.01 3.92 4.01Doctoral 2.04 2.04Professional 4.25 4.25Total 5.33 5.57 5.36
Avg Credit Hour Load: TotalUndergraduate 13.67 11.04 13.58Masters 7.41 6.17 7.42Doctoral 10.96 10.96Professional 17.14 17.14Total 12.55 10.29 12.50
*FTE=Student Credit Hours Divided by 15
Student Credit Hours and Full-Time Equivalency By Student Level

Undergraduate by Campus Total Freshman 2,385 215 1,029 27 3,656 Sophomore 17 294 1,799 48 2,158 Junior 5 262 1,933 69 2,269 Senior 0 128 3,592 109 3,829Main Campus 2,407 899 8,353 253 11,912
Lake Campus 141 36 382 29 588
Undergraduate Subtotal**** 2,547 933 8,682 281 12,443
Graduate by Campus Master's 665 1,907 143 2,715 Doctoral 33 210 11 254 Professional 138 397 1 536Main Campus 836 2,514 155 3,505
Lake Campus 32 79 9 120
Graduate Subtotal**** 866 2,573 161 3,600
University Total**** 3,413 933 11,255 442 16,043* UG New: Includes direct and not direct from high school students
** Attended Fall 2006, Winter, Spring or Summer 2007
*** Attended prior to Fall Quarter 2006
Total****
Raj Soin College of Business 1,194 12 459 35 1,694College of Education and Human Services 1,177 124 1,006 75 2,343College of Engineering and Computer Science 678 1 580 1,258College of Liberal Arts 2,251 12 279 2,539School of Medicine 514 514College of Nursing & Health 719 16 199 933School of Professional Psychology 124 124College of Science and Mathematics 1,280 13 344 10 1,634University College 4,606 286 4,876Associate Degree 7 124 128Total 11,912 588 3,505 120 16,043
Lake Main
New*
LakeGraduate/ProfessionalUndergraduate
Main
Degree Seeking Students By College
Readmitted***Transfer Continuing**
Degree Seeking Students
Entrance Status By Classification
****Unduplicated Headcount

Undergraduate by Campus Total Freshman 134 70 88 12 304 Sophomore 1 2 3 2 8 Junior 3 2 2 7 Senior 1 7 34 6 48Main Campus 136 82 127 22 367
Lake Campus 99 11 14 4 128
Undergraduate Subtotal**** 235 93 141 26 495
Graduate by Campus Master's 141 114 35 290 Special 16 61 77Main Campus 157 114 35 61 367
Lake Campus 5 2 2 9
Graduate Subtotal**** 162 115 37 61 375
University Total**** 397 93 256 63 61 870* UG New Includes Direct and Not Direct from HS Students, Transient Students and HS Post Secondary; GR New Includes New and Transient Students** Attended Fall 2006, Winter, Spring or Summer 2007*** Attended prior to Fall Quarter 2006
Total****
Continuing Education 274 35 309College of Education and Human Services 4 4College of Liberal Arts 25 25School of Graduate Studies 338 9 346University College 93 93 186Total 367 128 367 9 870
Readmitted***Transfer Continuing** Special
Non-Degree Seeking StudentsEntrance Status By Classification
Non-Degree Seeking Students By College
Lake Main
New*
LakeGraduate/ProfessionalUndergraduate
Main
****Unduplicated Headcount

Men Women Total Men Women Total Men Women TotalFreshman Full Time 22 19 41 1 0 1 23 19 42 Part Time 0 2 2 0 0 0 2 2 Total 22 21 43 1 0 1 23 21 44
Sophomore Full Time 92 78 170 1 3 4 92 80 172 Part Time 6 7 13 0 1 1 6 8 14 Total 98 85 183 1 4 5 98 88 186
Junior Full Time 167 124 291 2 3 5 169 126 295 Part Time 16 12 28 0 0 0 16 12 28 Total 183 136 319 2 3 5 185 138 323
Senior Full Time 307 209 516 0 1 1 307 210 517 Part Time 77 56 133 0 0 0 77 56 133 Total 384 265 649 0 1 1 384 266 650
Total Full Time 588 430 1,018 4 7 11 591 435 1,026 Part Time 99 77 176 0 1 1 99 78 177 Total 687 507 1,194 4 8 12 690 513 1,203
Men Women Total Men Women Total Men Women TotalFreshman Full Time 6 23 29 1 3 4 7 26 33 Part Time 10 6 16 0 1 1 10 7 17 Total 16 29 45 1 4 5 17 33 50
Sophomore Full Time 18 74 92 2 4 6 20 78 98 Part Time 4 6 10 2 0 2 6 6 12 Total 22 80 102 4 4 8 26 84 110
Junior Full Time 88 159 247 7 17 24 95 173 268 Part Time 17 35 52 1 2 3 18 37 55 Total 105 194 299 8 19 27 113 210 323
Senior Full Time 180 404 584 17 49 66 190 438 628 Part Time 56 91 147 3 15 18 59 105 164 Total 236 495 731 20 64 84 249 543 792
Total Full Time 292 660 952 27 73 100 312 715 1,027 Part Time 87 138 225 6 18 24 93 155 248 Total 379 798 1,177 33 91 124 405 870 1,275
LakeMain University Total*
Main Lake
UndergraduatesHeadcount Enrollment by College
Raj Soin College of Business
College of Education and Human Services
University Total*
* Unduplicated Headcount

Men Women Total Men Women Total Men Women TotalFreshman Full Time 85 14 99 0 0 0 85 14 99 Part Time 1 0 1 0 0 0 1 0 1 Total 86 14 100 0 0 0 86 14 100
Sophomore Full Time 79 12 91 0 0 0 79 12 91 Part Time 7 0 7 0 0 0 7 0 7 Total 86 12 98 0 0 0 86 12 98
Junior Full Time 110 24 134 0 0 0 110 24 134 Part Time 9 2 11 0 0 0 9 2 11 Total 119 26 145 0 0 0 119 26 145
Senior Full Time 215 38 253 0 0 0 215 38 253 Part Time 74 8 82 0 1 1 74 8 82 Total 289 46 335 0 1 1 289 46 335
Total Full Time 489 88 577 0 0 0 489 88 577 Part Time 91 10 101 0 1 1 91 10 101 Total 580 98 678 0 1 1 580 98 678
Men Women Total Men Women Total Men Women TotalFreshman Full Time 89 95 184 0 0 0 89 95 184 Part Time 5 7 12 0 0 0 5 7 12 Total 94 102 196 0 0 0 94 102 196
Sophomore Full Time 177 202 379 1 2 3 178 204 382 Part Time 17 14 31 0 0 0 17 14 31 Total 194 216 410 1 2 3 195 218 413
Junior Full Time 277 358 635 4 1 5 279 359 638 Part Time 19 32 51 0 0 0 19 32 51 Total 296 390 686 4 1 5 298 391 689
Senior Full Time 335 450 785 1 2 3 335 452 787 Part Time 69 105 174 1 0 1 70 105 175 Total 404 555 959 2 2 4 405 557 962
Total Full Time 878 1,105 1,983 6 5 11 881 1,110 1,991 Part Time 110 158 268 1 0 1 111 158 269 Total 988 1,263 2,251 7 5 12 992 1,268 2,260
Lake
College of Liberal Arts
Main University Total*Lake
College of Engineering and Computer Science
Main University Total*
* Unduplicated Headcount

Men Women Total Men Women Total Men Women TotalFreshman Full Time 0 0 0 0 0 0 0 0 0 Part Time 0 3 3 0 0 0 0 3 3 Total 0 3 3 0 0 0 0 3 3
Sophomore Full Time 10 42 52 0 0 0 10 42 52 Part Time 1 3 4 0 1 1 1 4 5 Total 11 45 56 0 1 1 11 46 57
Junior Full Time 14 126 140 0 0 0 14 126 140 Part Time 4 23 27 0 6 6 4 29 33 Total 18 149 167 0 6 6 18 155 173
Senior Full Time 59 297 356 0 1 1 59 297 356 Part Time 24 113 137 0 8 8 24 121 145 Total 83 410 493 0 9 9 83 418 501
Total Full Time 83 465 548 0 1 1 83 465 548 Part Time 29 142 171 0 15 15 29 157 186 Total 112 607 719 0 16 16 112 622 734
Men Women Total Men Women Total Men Women TotalFreshman Full Time 38 71 109 0 1 1 38 72 110 Part Time 4 4 8 0 0 0 4 4 8 Total 42 75 117 0 1 1 42 76 118
Sophomore Full Time 90 150 240 1 1 2 91 150 241 Part Time 8 10 18 0 3 3 8 13 21 Total 98 160 258 1 4 5 99 163 262
Junior Full Time 121 179 300 0 3 3 121 181 302 Part Time 13 30 43 0 1 1 13 30 43 Total 134 209 343 0 4 4 134 211 345
Senior Full Time 182 267 449 0 2 2 182 268 450 Part Time 54 59 113 1 0 1 55 59 114 Total 236 326 562 1 2 3 237 327 564
Total Full Time 431 667 1,098 1 7 8 432 671 1,103 Part Time 79 103 182 1 4 5 80 106 186 Total 510 770 1,280 2 11 13 512 777 1,289
College of Science and Mathematics
Main University Total*Lake
College of Nursing and Health
Main University Total*Lake
* Unduplicated Headcount

Men Women Total Men Women Total Men Women TotalFreshman Full Time 1,355 1,671 3,026 79 97 176 1,433 1,768 3,201 Part Time 77 141 218 45 59 104 122 199 321 Total 1,432 1,812 3,244 124 156 280 1,555 1,967 3,522
Sophomore Full Time 442 490 932 24 32 56 462 519 981 Part Time 47 71 118 2 5 7 49 74 123 Total 489 561 1,050 26 37 63 511 593 1,104
Junior Full Time 112 137 249 12 12 24 121 148 269 Part Time 37 21 58 3 1 4 40 22 62 Total 149 158 307 15 13 28 161 170 331
Senior Full Time 26 39 65 2 3 5 28 41 69 Part Time 17 16 33 1 2 3 18 18 36 Total 43 55 98 3 5 8 46 59 105
Total Full Time 1,935 2,337 4,272 117 144 261 2,044 2,476 4,520 Part Time 178 249 427 51 67 118 229 313 542 Total 2,113 2,586 4,699 168 211 379 2,273 2,789 5,062
Men Women Total Men Women Total Men Women TotalFreshman Full Time 18 15 33 1 1 2 19 16 35 Part Time 90 88 178 14 17 31 104 105 209 Total 108 103 211 15 18 33 123 121 244
Sophomore Full Time 0 1 1 0 0 0 0 1 1 Part Time 5 2 7 2 0 2 7 2 9 Total 5 3 8 2 0 2 7 3 10
Junior Full Time 1 1 2 0 0 0 1 1 2 Part Time 2 3 5 0 0 0 2 3 5 Total 3 4 7 0 0 0 3 4 7
Senior Full Time 3 4 7 0 0 0 3 4 7 Part Time 26 15 41 0 0 0 26 15 41 Total 29 19 48 0 0 0 29 19 48
Total Full Time 22 21 43 1 1 2 23 22 45 Part Time 123 108 231 16 17 33 139 125 264 Total 145 129 274 17 18 35 162 147 309
**Students in the College of Continuing Education are all non-degree seeking students, but other non-degree seeking students are included in the other colleges
Continuing Education**
Main University Total*Lake
University College
Main University Total*Lake
* Unduplicated Headcount

Men Women Total Men Women Total Men Women TotalFreshman Full Time 0 1 1 9 30 39 9 31 40 Part Time 0 0 0 6 5 11 6 5 11 Total 0 1 1 15 35 50 15 36 51
Sophomore Full Time 0 1 1 8 27 35 8 27 35 Part Time 0 0 0 7 8 15 7 8 15 Total 0 1 1 15 35 50 15 35 50
Junior Full Time 1 2 3 2 10 12 3 11 14 Part Time 0 0 0 2 3 5 2 3 5 Total 1 2 3 4 13 17 5 14 19
Senior Full Time 0 1 1 1 4 5 1 4 5 Part Time 0 1 1 0 2 2 0 3 3 Total 0 2 2 1 6 7 1 7 8
Total Full Time 1 5 6 20 71 91 21 73 94 Part Time 0 1 1 15 18 33 15 19 34 Total 1 6 7 35 89 124 36 92 128
Men Women Total Men Women Total Men Women TotalFreshman Full Time 1,613 1,909 3,522 91 132 223 1,703 2,041 3,744 Part Time 187 251 438 65 82 147 252 332 584 Total 1,800 2,160 3,960 156 214 370 1,955 2,373 4,328
Sophomore Full Time 908 1,050 1,958 37 69 106 940 1,113 2,053 Part Time 95 113 208 13 18 31 108 129 237 Total 1,003 1,163 2,166 50 87 137 1,048 1,242 2,290
Junior Full Time 891 1,110 2,001 27 46 73 913 1,149 2,062 Part Time 117 158 275 6 13 19 123 170 293 Total 1,008 1,268 2,276 33 59 92 1,036 1,319 2,355
Senior Full Time 1,307 1,709 3,016 21 62 83 1,320 1,752 3,072 Part Time 397 464 861 6 28 34 403 490 893 Total 1,704 2,173 3,877 27 90 117 1,723 2,242 3,965
Total Full Time 4,719 5,778 10,497 176 309 485 4,876 6,055 10,931 Part Time 796 986 1,782 90 141 231 886 1,121 2,007 Total 5,515 6,764 12,279 266 450 716 5,762 7,176 12,938
Grand Totals
Main University Total*
Lake Campus Associate Degree
Main University Total*Lake
Lake
* Unduplicated Headcount
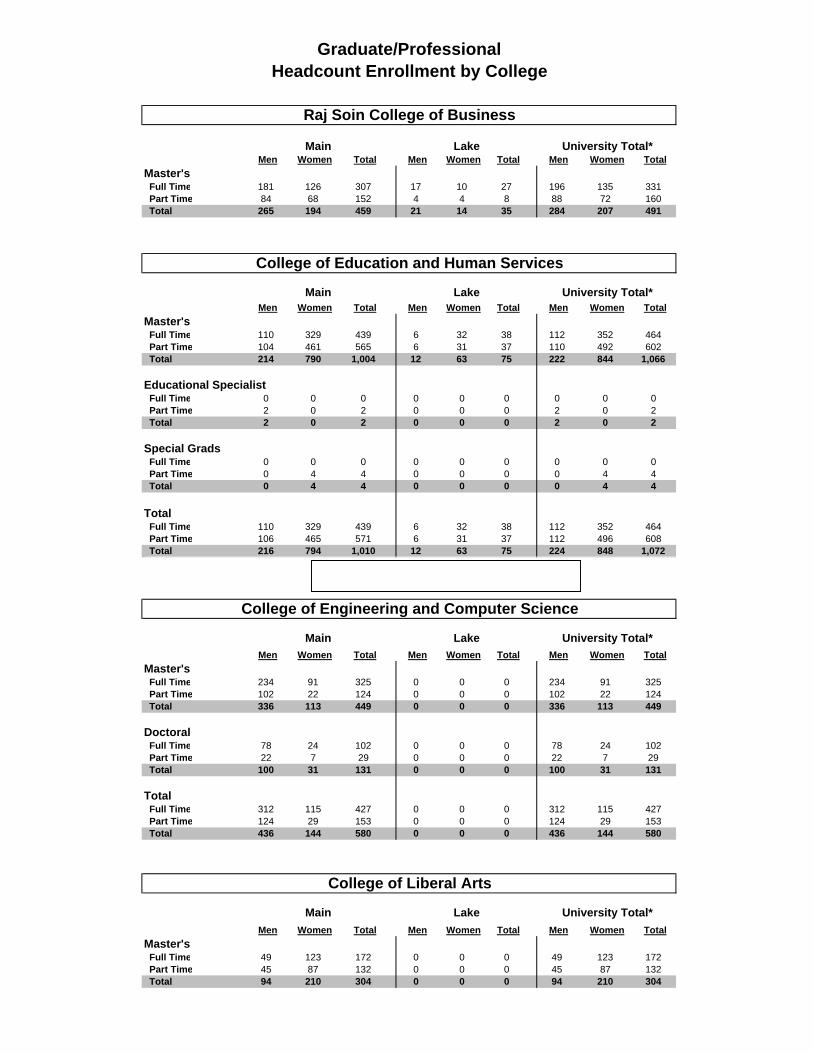
Men Women Total Men Women Total Men Women TotalMaster's Full Time 181 126 307 17 10 27 196 135 331 Part Time 84 68 152 4 4 8 88 72 160 Total 265 194 459 21 14 35 284 207 491
Men Women Total Men Women Total Men Women TotalMaster's Full Time 110 329 439 6 32 38 112 352 464 Part Time 104 461 565 6 31 37 110 492 602 Total 214 790 1,004 12 63 75 222 844 1,066
Educational Specialist Full Time 0 0 0 0 0 0 0 0 0 Part Time 2 0 2 0 0 0 2 0 2 Total 2 0 2 0 0 0 2 0 2
Special Grads Full Time 0 0 0 0 0 0 0 0 0 Part Time 0 4 4 0 0 0 0 4 4 Total 0 4 4 0 0 0 0 4 4
Total Full Time 110 329 439 6 32 38 112 352 464 Part Time 106 465 571 6 31 37 112 496 608 Total 216 794 1,010 12 63 75 224 848 1,072
Men Women Total Men Women Total Men Women TotalMaster's Full Time 234 91 325 0 0 0 234 91 325 Part Time 102 22 124 0 0 0 102 22 124 Total 336 113 449 0 0 0 336 113 449
Doctoral Full Time 78 24 102 0 0 0 78 24 102 Part Time 22 7 29 0 0 0 22 7 29 Total 100 31 131 0 0 0 100 31 131
Total Full Time 312 115 427 0 0 0 312 115 427 Part Time 124 29 153 0 0 0 124 29 153 Total 436 144 580 0 0 0 436 144 580
Men Women Total Men Women Total Men Women TotalMaster's Full Time 49 123 172 0 0 0 49 123 172 Part Time 45 87 132 0 0 0 45 87 132 Total 94 210 304 0 0 0 94 210 304
Raj Soin College of Business
College of Education and Human Services
University Total*
Main University Total*
Main Lake
Lake
College of Engineering and Computer Science
Main University Total*
College of Liberal Arts
Main University Total*
Graduate/ProfessionalHeadcount Enrollment by College
Lake
Lake

Men Women Total Men Women Total Men Women TotalMaster's Full Time 2 48 50 0 0 0 2 48 50 Part Time 10 139 149 0 0 0 10 139 149 Total 12 187 199 0 0 0 12 187 199
Men Women Total Men Women Total Men Women TotalMaster's Full Time 23 31 54 0 0 0 23 31 54 Part Time 22 26 48 0 0 0 22 26 48 Total 45 57 102 0 0 0 45 57 102
Professional Full Time 176 236 412 0 0 0 176 236 412 Part Time 0 0 0 0 0 0 0 0 0 Total 176 236 412 0 0 0 176 236 412
Total Full Time 199 267 466 0 0 0 199 267 466 Part Time 22 26 48 0 0 0 22 26 48 Total 221 293 514 0 0 0 221 293 514
Men Women Total Men Women Total Men Women TotalProfessional Full Time 31 89 120 0 0 0 31 89 120 Part Time 1 3 4 0 0 0 1 3 4 Total 32 92 124 0 0 0 32 92 124
Men Women Total Men Women Total Men Women TotalMaster's Full Time 71 91 162 3 7 10 71 92 163 Part Time 27 32 59 0 0 0 27 32 59 Total 98 123 221 3 7 10 98 124 222
Doctoral Full Time 55 49 104 0 0 0 55 49 104 Part Time 10 9 19 0 0 0 10 9 19 Total 65 58 123 0 0 0 65 58 123
Total Full Time 126 140 266 3 7 10 126 141 267 Part Time 37 41 78 0 0 0 37 41 78 Total 163 181 344 3 7 10 163 182 345
University Total*
School of Medicine
Main University Total*
College of Nursing and Health
Main Lake
Lake
Lake
Lake
College of Science and Mathematics
Main University Total*
School of Professional Psychology
Main University Total*

Men Women Total Men Women Total Men Women TotalMaster's Full Time 23 41 64 0 2 2 23 42 65 Part Time 94 107 201 1 6 7 95 113 208 Total 117 148 265 1 8 9 118 155 273
Special Graduates Full Time 0 11 11 0 0 0 0 11 11 Part Time 8 54 62 0 0 0 8 54 62 Total 8 65 73 0 0 0 8 65 73
Total Full Time 23 52 75 0 2 2 23 53 76 Part Time 102 161 263 1 6 7 103 167 270 Total 125 213 338 1 8 9 126 220 346
Men Women Total Men Women Total Men Women TotalMaster's Full Time 693 880 1,573 26 51 77 710 914 1,624 Part Time 488 942 1,430 11 41 52 499 983 1,482 Total 1,181 1,822 3,003 37 92 129 1,209 1,897 3,106
Special Graduates Full Time 0 11 11 0 0 0 0 11 11 Part Time 8 58 66 0 0 0 8 58 66 Total 8 69 77 0 0 0 8 69 77
Educational Specialist Full Time 0 0 0 0 0 0 0 0 0 Part Time 2 0 2 0 0 0 2 0 2 Total 2 0 2 0 0 0 2 0 2
Professional Full Time 207 325 532 0 0 0 207 325 532 Part Time 1 3 4 0 0 0 1 3 4 Total 208 328 536 0 0 0 208 328 536
Doctoral Full Time 133 73 206 0 0 0 133 73 206 Part Time 32 16 48 0 0 0 32 16 48 Total 165 89 254 0 0 0 165 89 254
Total Full Time 1,033 1,289 2,322 26 51 77 1,050 1,323 2,373 Part Time 531 1,019 1,550 11 41 52 542 1,060 1,602 Total 1,564 2,308 3,872 37 92 129 1,592 2,383 3,975
* Unduplicated Headcount**Students in the College of Continuing Education are all non-degree seeking students, but other non-degree seekingstudents are included in the other colleges- also contains School of Graduate Studies
Grand Totals
Main University Total*
Continuing Education/School of Graduate Studies**
Main University Total*Lake
Lake

Undergraduate Headcount Enrollment Total University
Continuing Ed.2%
Univ. College40%
Sci. & Math10% Nursing
6%
Liberal Arts18%
Egr. & CS5%
Education 10%
Business9%
Graduate Headcount Enrollment Total University
Egr. & CS15%
Liberal Arts8%
Nursing5%
Sci. & Math9%
Medicine13%
Continuing Ed.9%
SOPP3%
Business12%
Education 26%

11,108 students who registered Fall 2007 OBR 14th Day are receiving financial aid through programs administered by the Office of Financial Aid for the 2007-08 academic year. Total financial aid awarded is $178,557,262.
Types of aid, number of recipients, and amounts awarded as of October 11, 2007.
Awards by Programs
Pell Grants 3,351 $10,944,124
Supplemental Education Opportunity Grant 1,286 $871,017
Perkins Loans 1,473 $2,896,646
Nursing Student Loans 30 $130,900
Stafford Student Loans 14,010 $79,493,843
PLUS Loans 4,825 $56,000,110
Federal Academic Competitiveness Grants 550 $438,976
Federal Work-Study Employment 1,538 $3,714,130
Ohio College Opportunity Grant 824 $1,706,662
Ohio Instructional Grants 1,721 $2,227,370
Ohio Academic Scholarship 99 $218,295
Ohio War Orphans Scholarship 46 $341,173
Ohio National Guard Scholarships 142 $417,518
Wright State University Scholarships 5,550 $16,619,404
WSU Graduate Fellowships 179 $1,708,428
WSU Continuing Enrollment Loan 310 $828,666
Total 35,934 $178,557,262
Awards By ClassificationNumber of Average
Recipients** Award
Freshman 3,116 $47,045,450 $15,098
Sophomore 1,654 $24,403,229 $14,754
Junior 1,744 $26,833,623 $15,386
Senior 2,723 $38,254,090 $14,049
Master's 1,312 $21,173,716 $16,139
Doctoral 66 $1,018,397 $15,430
Medicine 376 $16,348,841 $43,481
Professional Psychology 117 $3,479,916 $29,743
Total 11,108 $178,557,262 $16,075
*Duplicated Headcount due to students receiving multiple scholarships**Unduplicated Headcount
Financial Aid
Total AmountsAwarded
DollarsAwarded
Number ofRecipients*

Full Part Full Part Total
Men 5,752 1,327 202 101 5,926 81% 1,428 19% 7,354
Women 7,067 2,005 360 182 7,378 77% 2,181 23% 9,559
Undergraduate 10,497 1,782 485 231 10,931 84% 2,007 16% 12,938
Degree 10,453 1,459 461 127 10,863 87% 1,580 13% 12,443
Non-Degree 44 323 24 104 68 14% 427 86% 495
Masters 1,573 1,432 77 52 1,624 52% 1,484 48% 3,108
Degree 1,508 1,207 75 45 1,558 55% 1,252 45% 2,810
Non-Degree 65 225 2 7 66 22% 232 78% 298
Doctoral 206 48 - - 206 81% 48 19% 254
Professional 532 4 - - 532 99% 4 1% 536
Special Graduate 11 66 - - 11 14% 66 86% 77
TOTAL 12,819 3,332 562 283 13,304 79% 3,609 21% 16,913
* Full-Time: Undergraduate and Med: 12 hours or more Masters and SOPP: 8 hours or more
Full Part Full Part Total
Freshman 3,522 438 223 147 3,744 87% 584 13% 4,328
Sophomore 1,958 208 106 31 2,053 90% 237 10% 2,290
Junior 2,001 275 73 19 2,062 88% 293 12% 2,355
Senior 3,016 861 83 34 3,072 77% 893 23% 3,965
TOTAL 10,497 1,782 485 231 10,931 84% 2,007 16% 12,938
Full Part
Full Part
Undergraduate Students
University Total**Main Campus Lake Campus
University Total**
Full-Time* / Part-Time
Main Campus Lake Campus
**Unduplicated Headcount

1539 1177 1574
84 236 87
189 39 189
514 3 514
Full-Time / Part-Time
University Total
13,304
3,609
2,373
10,931
1,6022,007
0
3,000
6,000
9,000
12,000
15,000
Total Undergraduate Graduate/ProfessionalFull-Time Part-Time
Undergraduate Students
237 293
2,0622,053
3,072
3,744
584
893
0
1,000
2,000
3,000
4,000
Freshman Sophomore Junior Senior
Full-Time Part-Time

Undergraduate Students in the Raj Soin College of Business
UniversityCollege Intended 2nd Major Minor
Fr So Jr Sr/Un Total Fr So Jr Sr/Un Total Fr So Jr Sr/Un TotalAccountancy (110, 610) 1 7 63 145 216 94 31 8 5 138 95 38 71 150 354 12Business (155) 2 20Business Economics (119, 120, 620) 2 18 20 58 9 1 68 58 9 2 19 88 1 11Finance (130, 630) 1 6 23 55 85 24 4 2 2 32 25 10 25 57 117 89Financial Services (131, 631) 12 40 52 3 4 7 3 4 12 40 59 4Human Resource Mgt. (157, 657) 10 30 40 16 1 6 1 24 16 1 16 31 64 14International Business (146, 147, 148, 646) 1 2 7 23 33 23 12 2 1 38 24 14 9 24 71 5 12International Trade 12Management (150, 650) 5 29 95 129 53 37 5 3 98 53 42 34 98 227 14 53Mgt. Info. Systems (154, 654) 2 19 77 98 24 13 5 42 24 15 24 77 140 1 11Marketing (160, 660) 2 40 103 145 74 30 5 109 74 32 45 103 254 8 41Operations Mgt. (180, 680) 1 4 16 21 2 6 2 10 2 7 6 16 31 2 8Undeclared Major (100, 600) 2 3 3 8 180 65 7 3 255 182 68 10 3 263Bus. & Adm. Conditional (169) 1 2 3 6 1 2 3 6Subtotal 5 29 214 605 853 551 212 42 16 821 556 241 256 621 1,674 152 168Pre-Business Accountancy (171) 13 41 19 10 83 13 41 19 10 83 Business Economics (172) 6 4 10 6 4 10 Finance (173) 4 13 9 6 32 4 13 9 6 32 Financial Services (174) 1 2 1 2 6 1 2 1 2 6 Management (175) 2 20 13 7 42 2 20 13 7 42 Mgt. Info. Systems (177) 1 13 16 6 36 1 13 16 6 36 Marketing (176) 7 26 17 7 57 7 26 17 7 57 Human Resource Mgt. (179) 3 7 2 12 3 7 2 12 International Business (181) 1 4 5 4 14 1 4 5 4 14 Operations Management (178) 2 3 5 2 3 5 Undeclared Major (170) 4 33 15 1 53 4 33 15 1 53Subtotal (Pre-Business) 39 157 109 45 350 39 157 109 45 350
Total 44 186 323 650 1,203 551 212 42 16 821 595 398 365 666 2,024 152 168
Undergraduate Students by Major
Majors Total
Students

Undergraduate Students in the College of Education and Human Services
UniversityCollege Intended 2nd Major Minor
Elementary Education Fr So Jr Sr/Un Total Fr So Jr Sr/Un Total Fr So Jr Sr/Un Total Early Childhood (231, 731) 1 6 65 173 245 156 93 49 7 305 157 99 114 180 550 1 Middle Childhood (225, 725) 2 57 84 207 350 79 23 8 2 112 81 80 92 209 462 1K - 12 Education Physical Education (207, 707) 1 2 9 32 44 26 18 15 3 62 27 20 24 35 106 3Rehabilitation Services (203, 703) 4 18 27 39 88 6 6 1 13 10 24 27 40 101 1Sign Language Interpreter 1 4 18 23 1 1 2 4 18 24Pre-Teacher Education (204) 13 7 2 1 23 13 7 2 1 23 1Integrated Bus. Edu. (210, 710) 1 4 5 1 1 2 1 2 4 7Marketing Education (209, 709) 1 1 1 1Athletic Training (236, 736) 13 10 6 18 47 43 8 51 56 18 6 18 98Org. Leadership (206, 706) 2 1 121 272 396 11 52 55 16 134 13 53 176 288 530 1Vocational Education (215) 13 7 4 3 27 13 7 4 3 27CT: Adolesc Young Adult - PRE 14 14 14 14CT: Middle Childhood - PRE 1 8 9 1 8 9Multi-Age Education Lic - PRE 2 2 2 2Undeclared Major (200, 700) 1 1 38 9 3 50 38 10 3 51Total 50 110 323 792 1,275 359 211 131 29 730 409 321 454 821 2,005 7 1
Undergraduate Students by Major
Majors Total
Students

Undergraduate Students in the College of Engineering and Computer Science
UniversityCollege Intended 2nd Major Minor
Fr So Jr Sr/Un Total Fr So Jr Sr/Un Total Fr So Jr Sr/Un Total Biomedical Engineering (427. 927) 9 16 29 54 30 11 3 44 30 20 19 29 98Computer Engineering (426, 926) 2 5 29 36 71 24 5 5 105 71 26 10 34 141 2Computer Science (451, 951) 4 13 54 71 88 36 15 4 143 88 40 28 58 214 2Computer Science for Engineers (435) 8Computing and Info Tech (448) 6Engineering (920) 30 12 2 44 30 12 2 44Engineering Physics (422, 922) 1 3 4 8 13 2 1 16 13 3 3 5 24 2Materials Sci. & Egr. (424, 924) 5 10 15 6 1 2 9 6 1 7 10 24 1 1Electrical Engineering (428, 928) 5 11 63 79 33 10 7 3 53 33 15 18 66 132Mechanical Egr. (429, 929) 7 22 47 94 170 87 39 13 3 142 94 61 60 97 312 3Industrial & Sys. Egr. (432, 932) 3 3 4 10 4 5 1 10 4 8 3 5 20Subtotal 7 46 103 287 443 362 140 45 19 566 369 186 148 306 1,009 10 15Pre-Engineering Engineering (471) 3 1 4 3 1 4 Biomedical Egr. (477) 15 4 5 3 27 15 4 5 3 27 Comp. Engineering (476) 14 9 8 7 38 14 9 8 7 38 Comp. Science (475) 19 13 15 16 63 19 13 15 16 63 Eng. Physics (472) 6 4 1 11 6 4 1 11 Ind. & Sys. Egr. (484) 1 1 2 1 1 2 Electrical Egr. (478) 14 10 7 16 47 14 10 7 16 47 Materials Sci.& Egr. (474) 4 2 6 4 2 6 Mechanical Egr. (479) 17 9 7 4 37 17 9 7 4 37Subtotal (Pre-Engineering) 93 52 42 48 235 93 52 42 48 235
Total 100 98 145 335 678 362 140 45 19 566 462 238 190 354 1,244 10 15
Undergraduate Students by Major
Majors StudentsTotal

Undergraduate Students in the College of Liberal Arts
UniversityCollege Intended 2nd Major Minor
Fr So Jr Sr/Un Total Fr So Jr Sr/Un Total Fr So Jr Sr/Un TotalB.A. in Art History (369, 869) 1 2 6 4 13 2 1 3 3 3 6 4 16 1 1B.F.A. in Art (371, 871) 8 12 36 50 106 26 1 27 34 13 36 50 133B.A. in Art (372, 872) 4 5 7 9 25 15 1 16 19 5 8 9 41B.F.A. in Art Edu. (368, 868) 1 2 13 16 32 1 2 13 16 32Classical Humanities (320, 820) 4 10 14 2 2 4 2 2 4 10 18 2African Amer. Studies (308, 808) 1 6 5 12 1 6 5 12 9Women's Studies (309, 809) 1 2 6 9 1 1 1 1 2 6 10 1 12Greek (321) 1 1 1 1Latin (322) 1 1 1 1Mass Communication (312, 812) 8 43 72 62 185 40 13 5 58 48 56 77 62 243 8Communication Studies (313, 813) 9 25 38 46 118 44 16 4 1 65 53 41 42 47 183 1 27Org. Communication (314, 814) 1 1 3 15 20 3 1 4 4 1 3 16 24Soc & Ind. Com. (315, 815) 1 1 1 1Economics, LA Degree (330, 830) 1 1 6 7 15 1 1 2 2 2 6 7 17 1 1English (350, 850) 21 57 70 77 225 38 4 1 43 59 61 71 77 268 6 8Eng. - Lang. Arts. Edu. (346, 846) 4 9 24 41 78 12 5 1 18 16 14 25 41 96Geography (331, 831) 1 3 4 10 18 2 2 3 3 4 10 20 1History (332, 832) 6 16 29 66 117 26 3 2 31 32 19 31 66 148 3 8International Studies (304, 804) 6 16 27 23 72 12 3 1 16 18 19 27 24 88 7 5Modern Languages (363, 863) 3 4 6 15 28 4 4 7 4 6 15 32 1French (360, 860) 1 2 9 12 24 3 3 4 2 9 12 27 3 29German (361, 861) 1 1 2 4 1 1 2 4 4 8Spanish (362, 862) 2 3 13 17 35 8 2 1 11 10 5 14 17 46 6 43B.A. in Music (378) 6 6 6 6 3B. Music in Music Ed. (377, 877) 1 2 6 25 34 1 2 6 25 34 2B.M. Music Hist. & Lit. (382, 882) 1Music: Performance (375, 875) 2 3 5 2 3 5 2Pre-Music-not audition (370, 870) 53 17 14 10 94 1 2 3 54 19 14 10 97Music - Undec. - Audition (376) 1 4 4 12 21 1 4 4 12 21Philosophy (351, 851) 4 3 3 10 3 1 4 3 4 4 3 14 5 5Political Science (333, 833) 11 41 52 59 163 48 11 4 2 65 59 52 56 61 228 8 17Religion (352, 852) 2 3 3 10 18 4 4 6 3 3 10 22 3 5
Undergraduate Students by Major
MajorsTotal
Students

College of Liberal Arts (continued) UniversityCollege Intended 2nd Major Minor
Fr So Jr Sr/Un Total Fr So Jr Sr/Un Total Fr So Jr Sr/Un TotalSocial Work (335, 835) 3 3 18 58 82 32 29 17 7 85 35 32 35 65 167Social Science Edu.(340, 840) 6 20 37 37 100 23 11 1 3 38 29 31 38 40 138 2Sociology (334, 834) 5 11 39 35 90 8 5 5 18 13 16 44 35 108 2 17Anthropology (336, 836) 2 10 8 18 38 11 5 16 13 15 8 18 54 3Theatre Arts Undec. (373, 873) 2 14 3 7 26 24 29 1 54 26 43 4 7 80B.F.A. - Acting (385, 885) 2 6 12 21 41 18 18 20 6 12 21 59B.F.A. in Dance (379, 879) 1 3 8 12 4 4 4 1 3 8 16B.F.A. - Design/Tech (387, 887) 2 2 9 13 26 5 1 6 7 2 10 13 32B.A. - Motion Pic. (384, 884) 1 3 4 8 16 2 2 3 3 4 8 18 1B.F.A. - Motion Pic. (383, 883) 3 6 19 12 40 33 2 35 36 8 19 12 75B.A. - Theatre Studies (374, 874) 1 10 5 10 26 21 9 30 22 19 5 10 56 2Urban Affairs (329, 829) 3 3 5 11 2 1 1 4 2 4 3 6 15 5Liberal Studies (311, 811) 6 5 15 39 65 14 3 3 2 22 20 8 18 41 87 1Criminal Justice (325, 825) 18 44 54 68 184 117 23 8 1 149 135 67 62 69 333 1 16Total 196 413 689 962 2,260 610 181 56 19 866 805 594 745 981 3,126 73 225
Undergraduate Students in the College of Nursing and Health
UniversityCollege Intended 2nd Major Minor
Fr So Jr Sr/Un Total Fr So Jr Sr/Un Total Fr So Jr Sr/Un TotalNursing (491, 991) 34 128 342 504 399 186 20 5 610 399 220 148 347 1114 2Nursing - Beacon Program (467) 1 1 38 40 1 1 38 40Nursing-Registered (490) 1 1 3 5 1 1 3 5Nursing-Completion(492) 2 17 85 104 2 17 85 104Nursing SHARE 1 1 1 1Pre- Nursing (498) 21 27 32 80 1 1 3 5 22 28 35 85Total 3 57 173 501 734 399 187 21 8 615 402 244 194 509 1,349 2
Undergraduate Students by Major
Majors Students
Majors Students
Total
Total

Undergraduate Students in the College of Science and Mathematics
UniversityCollege Intended 2nd Major Minor
Fr So Jr Sr/Un Total Fr So Jr Sr/Un Total Fr So Jr Sr/Un TotalHealth Sciences (408) 5Biological Sciences (410, 910) 45 100 85 196 426 186 23 4 2 215 231 123 89 198 641 4 8Clinical Lab. Science (411, 911) 3 4 3 18 28 5 3 8 8 7 3 18 36 1Environmental Sci. (414, 914) 1 4 6 13 24 11 11 12 4 6 13 35Chemistry (430, 930) 7 10 24 35 76 31 5 1 37 38 15 25 35 113 4Geological Sciences (440, 940) 5 7 16 28 8 8 8 5 7 16 36Mathematics (450, 950) 2 8 10 28 48 14 8 2 1 25 16 16 12 29 73 1 3Physics (460, 960) 2 3 2 7 14 7 1 8 9 4 2 7 22Psychology (470, 970) 43 89 160 201 493 151 26 6 3 186 194 115 166 204 679 5 58Integrated Science (419, 919) 1 2 3 4 10 1 2 3 4 10 4Pre-Medicine (581) 3 2 2 7 3 2 2 7Pre-Pharmacy (582) 1 1 1 1Pre Veterinary Medicine (587) 1 1 1 1Undeclared Major (400, 900) 14 34 43 42 133 2 1 1 4 16 35 44 42 137Total 118 262 345 564 1,289 415 67 14 6 502 533 329 359 570 1,791 19 74
Undergraduate Students in Lake Campus Associate Degree ProgramsUniversity
College Intended 2nd Major MinorFr So Jr Sr/Un Total Fr So Jr Sr/Un Total Fr So Jr Sr/Un Total
Business & Admin. (101) 6 12 3 21 6 12 3 21Communication (088) 1 2 3 1 2 3Drafting/Design Tech. (402) 7 5 1 13 7 5 1 13Financial MGT. Tech. (103) 2 3 1 1 7 2 3 1 1 7History (082) 2 2 2 2Liberal Studies 1 1 2 1 1 2Manufacturing Technology 1 1 1 1Office Info Systems (192) 18 15 3 1 37 18 15 3 1 37Psychology (084) 1 2 1 1 5 1 2 1 1 5Social Work (080) 2 2 2 1 7 2 2 2 1 7Sociology (083) 2 2 2 2Prelim. Info. Technology (089) 2 6 3 11 2 6 3 11Technical Study (404) 3 2 1 1 7 3 2 1 1 7Lake Campus -Conditional (597) 9 1 10 1 1 2 10 1 1 12Total 51 50 19 8 128 1 1 0 0 2 52 51 19 8 130
TotalMajors Students
Majors
Undergraduate Students by Major
Total Students

Undergraduate Students in University College
UniversityCollege Intended 2nd Major Minor
Fr So Jr Sr/Un Total Fr So Jr Sr/Un Total Fr So Jr Sr/Un TotalUniversity College Conditional 94 55 18 10 177 94 55 18 10 177 Undecided 545 51 5 1 602 545 51 5 1 602 All Others 2,697 998 308 94 4,097 2,697 998 308 94 4,097Special H.S. Option B 170 170 170 170Spec. High School-NonDegree 16 16 16 16Total 3,522 1,104 331 105 5,062 3,522 1,104 331 105 5,062
Majors
Undergraduate Students by Major
TotalStudents
1,203 1,275678
2,260734
1,289128
5,062
615566
730821
2
866
502
0
1,500
3,000
4,500
6,000
Business Education Egr & CS Liberal Arts Nursing Sci & Math Lake Campus Univ. College
Majors Intended Majors

Raj Soin College of Business Master's
Master of Business Adm. (MBA) 428Concentration Business Economics (122) 1 Executive MBA (105) 65 Finance (130) 71 Flexible Business (104) 24 Health Care Management (165) 4 International Business (146) 21 Nur & Health Car Systems 1 Management Information Technology (159) 15 Management Innovation & Change (158) 65 Marketing (160) 37 Project Management (156) 55 Supply Chain Management (182) 1 Undeclared (100) 68
Master of Science (MS) Accountancy (111) 31 Social and Applied Economics (121) 16 Logistics Management (153) 16
Total 491
College of Education & Human Services Master'sAdministration Specialist: C&I Prof Dev (288) 21Alternative Licensure (254) 17Classroom Teacher: Adol to Young Adult (247) 51Classroom Teacher: Computer Tech/Ed (244) 8Classroom Teacher: Early Childhood (251) 1Classroom Teacher: Multi-Age (234) 11Classroom Teacher: General (252) 21Classroom Teacher: Library/Media (253) 12Classroom Teacher: Mathematics (262) 4Classroom Teacher: Middle Child Ed (249) 66Classroom Teacher: Modern Language (237) 5Classroom Teacher: Phys Ed. (243) 7Classroom Teacher: Reading (255) 42Classroom Teacher: IS: Gifted Ed. Needs (260) 24Classroom Teacher: IS: Mild to Moderate Needs (277) 210Classroom Teacher: IS: Moderate to Intense Needs (256) 16Classroom Teacher: Science (261) 2Classroom Teacher: Career, Tech. & Adult Ed. Voc. Teacher Lic. (241) 20Counseling: Business & Industrial Mgt. (265) 8Counseling: Community Counseling (276) 23Counseling: Except Children (278) 6Counseling: Marriage & Family (268) 20Counseling: Mental Health (267) 46
Graduate Student Headcount Enrollment

College of Education & Human Services cont'd. Master's ED.S.
EDL:High Ed / Adult CE (296, 297) 2EDL:Student Affairs High Ed Admin (273) 50ED Leadership: Superintendent (299) 3Ed. Leadership:EAS: Teacher Leader (291) 206Early Childhood Intervention Specialist (240) 12PPS: School Counseling (275) 54PPS: School Nurse (242) 9Principalship (294) 43Pre-Kindergarten Special Needs 3Rehabilitation Counseling: Chemical Dependency (270) 24Rehabilitation Counseling: Severe Disabilities (271) 20TESOL Endorsements (245) 1
Total 1,066 2
College of Engineering & Computer Science Master's Doc./Prof
Biomedical Engineering (437) 57Computer Engineering (426) 29Computer Science (451) 54Electrical Engineering (438) 216Human Factors Engineering (433) 36Materials Science Engineering (434) 7Mechanical Engineering (439) 50Computer Science and Engineering (455) 43Engineering (454) 88
Total 449 131
College of Liberal Arts Master'sCriminal Justice & Social Problems (480) 37International & Comparative Politics (485) 29English: Composition & Rhetoric (349) 21 Literature (347) 27 Teaching of English to Speakers of Other Languages (TESOL) (348) 12History (332) 42Humanities (303) 30M. Music in Music Education (380) 9M. Music in Performance 14Public Administration (327) 58WSU-OSU Master of Social Work 25
Total 304
School of Medicine Master's M.D.Public Health Management (994) 26Health Promotion & ED (995) 13Aerospace Medicine (997) 6Emergency Preparedness 3Public Health Nursing 1Pharmacology & Toxicology (409) 13Medicine (999) 40 412
Total 102 412
Graduate Student Headcount Enrollment

College of Nursing & Health Master'sClinical Nurse Leader (466) 1Nursing: Acute Care Nurse Practitioner (486) 47Admin. Nursing & Health Care System (495, 496) 22Nursing: Child & Adolescent Health (487) 22Nursing: Family Nurse Practitioner (488) 56Nursing: Community Health (499) 8Nursing: Adult Health & Illness (497) 31Nursing: Undecided (493) 3Nursing: School Nurse Concentrated (494) 9
Total 199
College of Science & Mathematics Master's Doc./Prof
Anatomy (413) 35Applied Statistics (453) 22Biochemistry and Molecular Biology (415) 10Biological Sciences Biological Sciences (410) 33 Environmental Science (418) 4Chemistry (430) 23Chemistry - Environmental Science (431) 3Geological Sciences Geophysics (442) 2 Hydrogeology (443) 4 Envrionmental Science (446) 3 Geological Science (440) 15M.S.T. Earth Science (441) 16Mathematics: Applied Mathematics (452) 4Mathematics (450) 5Microbiology and Immunology (416) 14M.S.T. Interdisciplinary Science & Math (464) 5Physics (460) 8Physics: Medical Physics (462) 2Physiology and Biophysics (417) 9Human Factors/ Industrial Psychology (468, 469) 5 49Biomedical Sciences (481) 53Environmental Sciences Ph.D. (421) 21
Total 222 123
School of Professional Psychology Psy.D.Clinical Psychology (998)Professional Psychology 124
Master's ED.S. Doc./Prof.Grand Total 2,833 2 790
Graduate Student Headcount Enrollment

Ross90
Stark56
Wood31
Knox13
Darke223 Licking
51
Pike24
Scioto30
Huron17
Adams28
Lorain36
Wayne18
Gallia5
Allen81
Butler463
Logan115
Brown38
Clark911
Perry4
Trumbull20
Ashtabula13
Seneca26
Henry7
Union67
Athens13
Hardin9
Franklin583
Meigs1
Mercer222
Noble2
Miami732
Fulton7
Preble116
Belmont11
Vinton9
Fairfield71
Portage15
Putnam70
Hancock23
Highland77
Carroll3
Clinton192
Shelby215
Medina29
Marion17
Monroe5
Muskingum10
Lucas69
Richland29
Holmes2
Warren750
Summit63
Morrow11
Madison63
Morgan3
Guernsey9
Coshocton4
Fayette65
Greene2446
Washington8
Pickaway44
Hocking2
Ashland12
Williams17
Jackson6
Clermont149
Delaware64
Geauga18
Harrison1
Paulding9
Tuscarawas13
Cuyahoga215Defiance
20
Hamilton614
Auglaize128
Lawrence6
Wyandot9
Van Wert29 Columbiana
7
Crawford7
Sandusky17
Mahoning15
Champaign137
Montgomery4593
Ottawa13
Erie22
Lake34
Jefferson5
Ohio County of ResidenceMain CampusAll Students
88 Ohio counties represented90% of all students come from Ohio
54% of all Ohio students are from four counties: Clark, Greene, Miami, Montgomery
Legend1 - 44
45 - 137
138 - 223
224 - 911
912 - 4,593
"

Ross0
Stark0
Wood0
Knox0
Darke53 Licking
2
Pike0
Scioto1
Huron0
Adams0
Lorain1
Wayne1
Gallia0
Allen27
Butler1
Logan0
Brown0
Clark2
Perry0
Trumbull0
Ashtabula0
Seneca0
Henry0
Union0
Athens0
Hardin0
Franklin1
Meigs0
Mercer337
Noble0
Miami7
Fulton0
Preble1
Belmont0
Vinton0
Fairfield1
Portage0
Putnam4
Hancock1
Highland0
Carroll0
Clinton0
Shelby45
Medina0
Marion0
Monroe0
Muskingum0
Lucas0
Richland0
Holmes0
Warren1
Summit0
Morrow0
Madison0
Morgan0
Guernsey0
Coshocton0
Fayette0
Greene9
Washington0
Pickaway0
Hocking0
Ashland0
Williams0
Jackson0
Clermont0
Delaware0
Geauga0
Harrison0
Paulding8
Tuscarawas0
Cuyahoga0Defiance
0
Hamilton1
Auglaize217
Lawrence0
Wyandot0
Van Wert63 Columbiana
0
Crawford0
Sandusky0
Mahoning0
Champaign0
Montgomery12
Ottawa0
Erie0
Lake0
Jefferson0
Ohio County of ResidenceLake CampusAll Students
23 Ohio counties represented94% of all students come from Ohio
70% of all Ohio students are from two counties: Auglaize and Mercer
Legend0
1 - 12
13 - 27
28 - 63
64 - 337
"


STATE OF ORIGINALL STUDENTS
OH15,256
IN82
KY 30
IL34
MI49
WI10
PA 35
NY31
WV 9
TN 11
VA21
NC 12
SC 2GA
34
AL6MS
1
FL41
AK4
HI2
MN11
IA4
MO5
AR2
ND2
SD1
NE2
KS4
OK7
TX51
NM3
CO9
AZ9
UT4
WY3
MT3
WA7
OR6
ID0
NV1
CA31
ME3
VT1 NH
4MA 7
RI0
DE0
NJ9
CT 3
MD
LA6
DC1
16

International Students On Student Visas*
Total Freshman 63Sophomore 18Junior 19Senior 40Master's 366Doctoral/Professional 99Total 605
Total Degree Non-degree Degree Non-degree
New Students 13 10 128 1 152Continuing Students 85 20 314 2 421Readmitted Students 20 20Transfer Students 8 4 12Total 106 34 462 3 605
Total Raj Soin College of Business 78College of Education & HS 2College of Engineering and Computer Science 344College of Liberal Arts 15College of Nursing & Health 10College of Science and Math 68University College 34School of Medicine 8School of Professional Psychology 9Non-Degree 37Total 605
* F1 and J1 visas only
Undergraduate Graduate
Men Women369
1325
24373
399
2796
1512326
206
Undergraduate242
159
101234
34140
54Graduate
3296
56
893
465

New NewTotal Students Total Students
Africa Southeast AsiaAlgeria 1 Malaysia 1Benin 1 Vietnam 3 2Burundi 1 4 2Cameroon 1Chad 3 2Egypt 2 1 Middle EastGhana 3 2 Bahrain 2Guinea 1 Iran 1Kenya 5 Israel 2 1Ivory Coast 1 1 Kuwait 8Mauritania 1 Saudi Arabia 18 3Mauritius 1 1 Syria 1Morocco 1 1 32 4Nigeria 4 1South Africa 3Tanzania 1 Eastern EuropeZimbabwe 4 Albania 2
34 9 Croatia 1Greece 3 1Lithuania
Australia 1 Moldova 1Poland 1 1Romania 1
Canada 11 3 Serbia 2Slovenia 1 1Turkey 2
Caribbean 14 3Bermuda 1El Salvador 2 1Mexico 3 Western EuropeTurks & Caicos Islands 1 France 3 3Virgin Islands 1 Germany 4 1
8 1 Netherlands 1Spain 4Sweden 1 1
East Asia United Kingdom 2China 70 15 15 5Macau 3 1South Korea 24 5Russia 1 South AmericaTaiwan 7 2 Argentina 1Thailand 1 Brazil 3 1
106 23 Columbia 5Paraguay 1Peru 1
Mid-Asia Venezuela 3Bangladesh 1 14 1Burma 1India 353 99Nepal 4 1Pakistan 1Sri Lanka 5 1
365 101 Grand Total 605 152
Oceania- Fiji 1 Countries Represented: 66
International Students by Country

International Students
Canada11
Caribbean,Central and
South America23
Europe29
Africa34
Middle East32
Asia471
Far Eastand Pacific
4
Total Number of International Students is 605 representing 66 countries
Australia1

County of Origin TotalMen Women Total Tier 1 684 25%
Hamilton Hall 155 146 301 11% Clark 110Woods 460 648 1,108 40% Greene 112Forest Lane 55 120 175 6% Miami 81Village 51 76 127 5% Montgomery 381College Park 181 258 439 16%University Park 89 125 214 8%Honors Dorm 158 219 377 14% Tier 2 397 14%Total 1,149 1,592 2,741 100% Butler 129
Champaign 26 Clinton 52 Darke 48
Men Women Total % Preble 22New 567 821 1,388 51% Warren 120Continuing 519 715 1,234 45%Readmitted 3 4 7 0.3% Tier 3 98 4%Transfer 60 52 112 4% Auglaize 26Total 1,149 1,592 2,741 100% Mercer 33
Shelby 39
Tier 4 558 20%Men Women Total %
Freshman 714 986 1,700 62% Tier 5 364 13%Sophomore 203 266 469 17%Junior 107 176 283 10% Tier 6 478 17%Senior 98 131 229 8%Graduate 27 33 60 2% Non-Ohio/Unreported* 162 6%Total 1,149 1,592 2,741 100%
Total 2,741 100%
Men Women Total %Asian 20 18 38 1%African American 233 505 738 27%Foreign 17 15 32 1%Hispanic 15 13 28 1%Native American 3 5 8 0.3%Unknown 80 79 159 6%Caucasian 781 957 1,738 63%Total 1,149 1,592 2,741 100%
Students Living in Campus Housing
Race
Entrance Status
Classification
Communities
*Not all students have a county reported

Total Undergraduate Total Male Female Total
Age Male Female Male Female Male Female Male Female
14-15 1 1 1 1 2 2
16-20 2,395 3,311 3 1 5,710 151 210 361 2,548 3,516 6,064
21-25 2,225 2,359 650 849 6,083 67 108 8 38 221 2,932 3,326 6,258
26-30 436 446 410 565 1,857 16 49 13 25 103 871 1,071 1,942
31-35 188 198 172 249 807 6 27 7 10 50 371 481 852
36-40 91 167 114 194 566 13 15 4 5 37 221 379 600
41-45 65 118 82 150 415 6 19 2 5 32 154 291 445
46-50 51 72 65 140 328 2 11 8 21 118 230 348
51-55 17 49 43 105 214 5 2 1 8 61 160 221
56-60 17 18 14 48 97 3 2 1 6 35 68 103
61-65 16 11 6 7 40 1 1 2 23 19 42
66-70 6 8 1 15 7 8 15
71-75 4 4 3 11 1 1 2 8 5 13
76-80 3 1 1 5 1 1 4 2 6
81-82 1 1 2 1 1 2
Total 5,515 6,764 1,564 2,308 16,151 266 450 37 92 845 7,354 9,559 16,913
*Unduplicated Headcount
Age of Students
Graduate GraduateUndergraduate
University Total*Main Campus Lake Campus
1,195
1,452
6,258
1,942
6,066
0 1,000 2,000 3,000 4,000 5,000 6,000 7,000
40+ years
31-40 years
26-30 years
21-25 years
20 years & under
Number of Students

Mean Mean Mean RangeUndergraduates 22.7 23.9 22.8 15-83 Women 22.7 24.5 22.8 15-81 Men 22.8 22.8 22.8 16-83
Graduates 30.9 30.5 31.0 20-76 Women 31.6 30.0 31.6 20-63 Men 30.0 31.9 30.1 20-76
All 24.7 24.9 24.7 15-83
MenAge Full-Time Part-Time Full-Time Part-Time Under 20 28% 7% 30% 7%
20 13% 3% 13% 3%21 13% 3% 13% 3%22 12% 6% 11% 4%23 8% 9% 6% 5%24 5% 7% 5% 6%25 4% 7% 4% 6%26 3% 6% 3% 5%27 2% 4% 2% 5%28 2% 4% 2% 4%29 1% 4% 1% 3%30 1% 3% 1% 3%
31 - 39 5% 19% 5% 19% 40 - 49 2% 11% 3% 17%50 and over 1% 7% 1% 10%
100% 100% 100% 100%
Women
22-56
15-7615-83
21-5621-52
Mean Age and Range
Total University*Main LakeRange Range
15-7615-76
Undergraduates Graduates
15-8315-8116-83
20-7620-6320-76
16-74
Under 20 Years33%
30-39 Years
6%
25-29 Years
9%
20-24 Years48%
40+ Years4%
30-39 Years21%
25-29 Years31%
40+ Years19%
24 & Under29%
*Unduplicated count

Freshman Sophomore Junior Senior Men Women Total
College
Raj Soin College Main 3.054 2.954 2.981 2.955 2.898 3.052 2.961 of Business Lake - 2.841 3.312 - 3.505 3.052 3.126
Total U. 3.054 2.952 2.986 2.955 2.899 3.053 2.962
College of Main 3.340 3.117 2.914 3.037 2.770 3.136 3.017 Education & HS Lake 1.444 3.169 3.333 3.334 3.350 3.314 3.323
Total U. 3.184 3.122 2.952 3.062 2.813 3.150 3.043
College of Engineering and Main 2.329 3.017 3.015 2.937 2.954 2.962 2.956 Computer Science Lake - - - 2.021 - 2.021 2.021
Total U. 2.329 3.017 3.015 2.937 2.954 2.962 2.956
College of Main 2.805 2.868 2.860 2.961 2.860 2.971 2.921 Liberal Arts Lake - 3.212 2.736 3.020 2.942 2.976 2.957
Total U. 2.805 2.872 2.862 2.961 2.861 2.971 2.922
College of Main - 3.425 3.314 3.259 3.296 3.270 3.274 Nursing & Health Lake - 2.391 3.529 3.442 - 3.325 3.325
Total U. - 3.397 3.315 3.260 3.296 3.271 3.274
College of Science and Main 2.781 2.943 2.865 2.986 2.950 2.947 2.948 Mathematics Lake 2.909 2.525 2.559 3.170 2.769 2.824 2.812
Total U. 2.784 2.939 2.863 2.988 2.949 2.948 2.949
University College Main 2.228 2.558 2.461 2.339 2.361 2.502 2.436Lake 2.442 2.844 2.875 2.960 2.695 2.863 2.782Total U. 2.238 2.580 2.505 2.415 2.386 2.529 2.462
Undergraduates Main 2.355 2.787 2.894 3.005 2.836 2.997 2.924Lake 2.424 2.877 3.084 3.270 3.023 3.155 3.114Total U. 2.357 2.793 2.901 3.011 2.840 3.002 2.929
Total University Cumulative
GPA Ranges No. % No. % No. % No. % No. %4.0 34 3.0% 73 3.7% 63 3.0% 140 3.7% 310 3.5%
3.5 - 3.99 63 5.5% 306 15.6% 381 18.4% 798 21.1% 1,548 17.3%3.0 - 3.49 152 13.3% 439 22.4% 541 26.1% 1,164 30.8% 2,296 25.6%2.5 - 2.99 228 19.9% 500 25.5% 507 24.5% 963 25.4% 2,198 24.5%2.0 - 2.49 311 27.1% 443 22.6% 430 20.8% 588 15.5% 1,772 19.8%1.00 - 1.99 282 24.6% 169 8.6% 129 6.2% 111 2.9% 691 7.7%
Less than 1.00 76 6.6% 30 1.5% 21 1.0% 20 0.5% 147 1.6%
TOTAL 1,146 100% 1,960 100% 2,072 100% 3,784 100% 8,962 100%
Mean Cumulative UndergraduateGrade Point Average*
DEGREE SEEKING STUDENTS
Students All
Freshman Sophomore Junior Senior
*Does not include new freshmen students, transfer students or associate degree studentsNote: A '-' indicates no students in that category

Undergraduate Degree Seeking Student Mean GPA
3.002
2.462
3.274
2.956
3.043
2.949
2.840
2.922
2.929
2.962
0.000 1.000 2.000 3.000 4.000
All Students
Men
Women
University College
College of Science & Mathematics
College of Nursing & Health
College of Liberal Arts
College of Engineering & Computer Science
College of Education & Human Services
Raj Soin College of Business
Mean Cumulative GPA
Cumulative Grade Point Average Ranges
147
691
2,198
2,296
1,548
310
1,772
0 1,000 2,000 3,000
Less than 1.0
1.0-1.99
2.0-2.49
2.5-2.99
3.0-3.49
3.5-3.99
4.0
Number of Students

Auglaize County Clark CountyMain Lake Total** Main Lake Total**
Allen East 3 3 Greenon 17 17Memorial 3 18 21 Kenton Ridge 13 13Minster 5 6 11 Northeastern 11 11New Bremen 4 4 Northwestern 19 19New Knoxville 4 1 5 Shawnee 13 13Wapakoneta 4 4 Southeastern 2 2Total 15 33 48 Springfield North 13 13
Springfield South 4 4 Tecumseh 16 16
Greene County Total 108 108Main Lake Total**
Beavercreek 152 152 Bellbrook 46 46 Mercer Cedarville 9 9 Main Lake Total** Fairborn 56 56 Celina Senior 7 29 36 Greenview 17 17 Coldwater 4 7 11 Xenia 42 42 Fort Recovery 4 5 9 Yellow Springs 4 4 Marion Local 2 11 13Total 326 326 Parkway 2 2
Saint Henry 8 11 19Total 25 65 90
Montgomery CountyMain Lake Total** Miami County
Belmont 6 6 Main Lake Total** Brookville 15 15 Bethel 13 13 Butler Senior 36 36 Covington 1 1 Centerville 52 52 Miami East 7 7 Colonel White 24 24 Milton Union 8 8 Dixie 2 2 Newton 8 8 Jefferson 4 4 Piqua 8 8 John H Patterson 1 1 Tippecanoe 18 18 Kettering Fairmont 49 49 Troy 21 21 Meadowdale 12 12 Total 83 1 84 Miami Valley Career Tech Ctr 3 3 Miamisburg 37 37 Private Schools Northmont 47 47 Main Lake Total** Northridge 8 8 Archbishop Alter 15 15 Oakwood 16 16 Carroll 47 47 Paul Laurence Dunbar 8 8 Catholic Central 7 7 Stivers School for the Arts 14 14 Chaminade-Julienne 31 31 Trotwood-Madison 16 16 Dayton Christian 11 11 Valley View 11 11 Dayton Early College Academy 10 10 Walter E Stebbins 23 23 Dominion Academy 1 1 Wayne 61 61 Emmanuel Christian Academy 2 2 West Carrollton 16 16 Evangel Academy 1 1Total 461 461 Germantown Christian 1 1
Miami Valley School 3 3 Mound Street Academy 1 1 Nazarane Christian 2 2 Spring Valley Academy 2 2 Troy Christian 3 3 Xenia Christian 8 8Total 145 145
Main Lake Total**Other Schools 1,222 40 1,262
New Degree Seeking FreshmenHigh School Origin*
* A student's county of residence and high schoolorigin are not necessarily the same** Unduplicated headcount

Main Lake TotalArea of Study Campus Campus University* %
BusinessAccountancy 65 4 69Business Economics 33 2 35Finance 16 16Financial Services 2 2Human Resource Mgt. 6 1 7International Business 13 1 14Management 26 1 27Management Information Systems 9 9Marketing 41 1 42Operations Management 1 1Undeclared 95 10 105 Total 307 20 327 13.0%
Education & Human SevicesAthletic Training 42 42Early Childhood: Pre-K/Primary 83 13 96Middle Childhood 51 8 59K-12: Physical Education 16 16Rehabilitation Services 4 4Pre-Teacher Education 11 2 13Vocational Education 1 1Ed & Human Service: Undeclared 29 4 33 Total 237 27 264 10.5%
Engineering and Computer Science Biomedical Engineering 35 35Computer Engineering 53 1 54Computer Science 78 3 81Engineering 26 26Engineering Physics 13 1 14Electrical Engineering 35 35Mechanical Engineering 73 1 74Materials Science & Engineering 9 9Indust. & System Engineering 3 3 Total 325 6 331 13.1%
Science and MathematicsBiological Sciences 167 3 170Chemistry 24 24Clinical Labor. Science 6 6Environmental Science 5 5Geology 5 1 6Mathematics 5 2 7Psychology 109 2 111Physics 4 4Integrated Science 1 1Undeclared 2 2 Total 328 8 336 13.3%
Nursing & Health 263 11 274 10.9%
New Degree Seeking FreshmenIntended Area of Study
*Unduplicated headcount

New degree seeking freshmen area of study continuedMain Lake Total
Area of Study Campus Campus University* %
Liberal ArtsActing 18 18Anthropology 8 8Art 35 2 37Classical Humanities 1 1 2Communication Studies 26 1 27Criminal Justice 78 4 82Dance 4 4Design/Technology 5 5Economics 1 1English 36 3 39Eng: Language Arts Education 4 4French 3 3Greek 1 1History 20 1 21International Studies 13 1 14Liberal Studies 10 10Mass Communication 27 27Modern Languages 5 5Motion Pictures 34 34Organizational Communication 1 1Philosophy 3 3Political Science 35 1 36Pre-Music- Not Audition 38 38Religion 4 4Sociology 5 5Social Science Education 19 19Social Work 20 20Spanish 5 5Theatre Arts 15 15Theatre Studies 13 13Urban Affairs 2 2 Total 489 14 503 19.9%
Lake Campus- Associate DegreeApplied Business 12 12Applied Science 4 4 Total 16 16 0.6%
Undeclared 436 37 473 18.7%
Grand Total 2,385 139 2,524 100%
Lake Campus Associate Degree0.6%
Undeclared18.7%
Science & Math13.3%
Nursing & Health10.9% Liberal Arts
19.9%
Egr. & CS13.1%
Education & HS10.5%
Business13.0%
*Unduplicated headcount

New Degree Seeking Freshmen SAT Scores
SAT Math SAT Verbal SAT CompositeAll All All
Female Male Students Female Male Students Female Male StudentsSeventy-fifth percentile 530 600 570 540 570 550 1080 1140 1110Median 470 530 490 480 510 490 950 1030 990Twenty-fifth percentile 410 470 430 430 450 440 850 920 880Overall mean 475.5 528.4 499.4 490.0 506.4 497.4 964.0 1033.6 995.5No. of Students 379 313 692 379 313 692 379 313 692
Composite SAT by Intended College
Education &Business Human Services Egr. & CS Liberal Arts
Seventy-fifth percentile 1050 1020 1200 1120Median 950 905 1110 1000Twenty-fifth percentile 860 840 1000 900Overall mean 956.1 930.6 1092.3 1008.1No. of Students 77 62 111 165
AllNursing & Health Science & Math Undeclared Students
Seventy-fifth percentile 1060 1120 1060 1110Median 970 1010 950 990Twenty-fifth percentile 870 890 820 880Overall mean 963.3 1003.9 954.8 995.5No. of Students 63 101 113 692
Business 860 950 1050Education 840 905 1020Egr & CS 1000 1110 1200Liberal Arts 900 1000 1120Nursing 870 970 1060Sci & Math 890 1010 1120Undeclared 820 950 1060All 880 990 1110
0200400600800
10001200
Composite SAT Score
Busine
ss
Educa
tion
Egr & C
S
Libera
l Arts
Nursing
Sci & M
ath
Undec
lared All
25th
Perc
entil
e75
thPe
rcen
tile
Intended College
Composite SAT Percentiles
25th PercentileMedian75th Percentile

Score
Male Female All Male Female All Male Female All
35 1 1 1 134 1 3 4 1 3 4
33 1 1 2 1 1 2
32 4 2 6 4 2 6
31 9 9 18 1 1 10 9 19
30 17 16 33 17 16 33
29 16 10 26 1 1 2 17 11 28
28 26 24 50 26 24 50
27 24 33 57 1 1 24 34 58
26 47 38 85 1 4 5 48 42 90
25 56 67 123 3 5 8 59 72 131
24 57 70 127 4 6 10 61 76 137
23 77 78 155 2 2 4 79 80 159
22 96 108 204 5 2 7 101 110 211
21 84 107 191 5 3 8 89 110 199
20 75 112 187 3 11 14 78 123 201
19 91 118 209 4 5 9 95 123 218
18 67 106 173 4 7 11 71 113 184
17 35 107 142 7 4 11 42 111 153
16 35 68 103 3 5 8 38 73 111
15 21 53 74 6 2 8 27 55 82
14 13 39 52 1 4 5 14 43 57
13 7 14 21 1 1 7 14 21
12 5 5 10 5 6 11
11 1 2 3 1 2 3
Total 866 1,190 2,056 50 63 113 916 1,253 2,169
Mean 21.65 20.57 21.02 19.94 20.14 20.05 21.55 20.54 20.97
Main Campus Lake Campus University Total*
New Degree Seeking Freshmen Composite ACT Scores
*Unduplicated Total

Men Women All Men Women All Men Women All
BusinessSeventy-fifth percentile 23.0 22.0 23.0 24.0 25.0 24.0 23.0 22.0 23.0Median 21.0 19.5 20.0 22.5 21.0 22.0 21.0 20.0 20.0Twenty-fifth percentile 18.0 17.0 18.0 19.0 20.0 20.0 18.0 17.0 18.0Overall mean 20.7 19.9 20.3 21.7 22.0 21.8 20.8 20.0 20.4No. of Students 147 124 271 10 7 17 157 131 288
Education & Human ServicesSeventy-fifth percentile 22.0 22.0 22.0 26.5 22.0 24.0 22.0 22.0 22.0Median 19.0 19.0 19.0 21.0 19.0 20.0 19.5 19.0 19.0Twenty-fifth percentile 17.0 18.0 18.0 15.0 16.0 16.0 16.5 17.5 17.0Overall mean 19.4 19.9 19.8 21.4 19.4 20.0 19.7 19.9 19.8No. of Students 44 163 207 8 17 25 52 180 232
Engineering & Computer ScienceSeventy-fifth percentile 26.0 26.0 26.0 - - 23.0 26.0 26.0 26.0Median 23.0 23.5 23.0 - - 21.0 23.0 24.0 23.0Twenty-fifth percentile 21.0 21.0 21.0 - - 17.0 21.0 21.0 21.0Overall mean 23.3 23.4 23.3 - - 20.6 23.2 23.5 23.3No. of Students 238 46 284 - - 5 242 47 289
Liberal ArtsSeventy-fifth percentile 24.0 24.0 24.0 - 24.0 24.0 24.0 24.0 24.0Median 22.0 21.0 21.0 - 21.0 20.0 22.0 21.0 21.0Twenty-fifth percentile 19.0 18.0 19.0 - 20.0 19.5 19.0 18.0 19.0Overall mean 21.7 21.4 21.5 - 22.0 21.2 21.6 21.4 21.5No. of Students 160 234 394 - 8 12 164 242 406
Nursing & HealthSeventy-fifth percentile 23.0 22.0 23.0 - 24.0 24.0 23.0 23.0 23.0Median 21.5 20.0 20.0 - 24.0 23.0 22.0 20.0 20.0Twenty-fifth percentile 18.5 17.0 18.0 - 17.0 18.0 19.0 17.0 18.0Overall mean 21.1 20.1 20.2 - 21.3 21.4 21.1 20.2 20.3No. of Students 20 222 242 - 7 8 21 229 250
Science & MathematicsSeventy-fifth percentile 25.0 24.0 24.0 - 23.0 23.0 25.0 24.0 24.0Median 22.0 21.0 22.0 - 16.0 18.0 22.0 21.0 22.0Twenty-fifth percentile 19.0 18.0 18.0 - 15.0 15.0 19.0 18.0 18.0Overall mean 22.1 21.2 21.5 - 18.8 19.0 22.1 21.1 21.4No. of Students 96 192 288 - 5 6 97 197 294
Lake Campus Associates DegreeSeventy-fifth percentile - - - - 18.0 18.0 17.0 18.0 18.0Median - - - - 18.0 17.0 16.5 18.0 17.0Twenty-fifth percentile - - - - 17.0 16.0 15.5 17.0 16.0Overall mean - - - - 18.2 17.6 16.3 18.2 17.6No. of Students - - - - 9 13 4 9 13
UndeclaredSeventy-fifth percentile 23.0 22.0 23.0 21.0 20.0 21.0 23.0 22.0 22.0Median 20.0 20.0 20.0 19.0 20.0 19.0 20.0 20.0 20.0Twenty-fifth percentile 18.0 17.0 17.0 17.0 19.0 18.0 18.0 17.0 17.0Overall mean 20.4 19.8 20.1 19.3 19.7 19.4 20.3 19.8 20.0No. of Students 161 209 370 18 9 27 179 218 397
All StudentsSeventy-fifth percentile 24.0 23.0 24.0 22.0 24.0 23.0 24.0 23.0 24.0Median 21.0 20.0 21.0 19.5 20.0 20.0 21.0 20.0 21.0Twenty-fifth percentile 19.0 18.0 18.0 17.0 17.0 17.0 19.0 18.0 18.0Overall mean 21.7 20.6 21.0 19.9 20.1 20.1 21.6 20.5 21.0No. of Students 866 1,190 2,056 50 63 113 916 1,253 2,169
Main Campus Lake Campus University Total*
New Degree Seeking Freshmen Composite ACT Scoresby Intended College
*Unduplicated Total and includes ACT scores that were not shown due to FERPA regulationsNote: A '-' indicates either a score omitted for privacy or no students in that category

High School Rank High School GPAUpper 25% Upper 50% 3.0+ 2.5+
Intended College No. % No. % % No. %Business 81 26% 165 54% 50% 241 79%Education 62 26% 131 55% 58% 187 79%Engineering 149 46% 228 70% 68% 284 87%Liberal Arts 134 27% 275 56% 55% 390 80%Nursing 85 32% 165 63% 59% 230 87%Science & Mathematics 142 43% 220 67% 62% 276 84%Undecided 82 19% 198 45% 43% 308 71%
All Majors 735 35% 1,382 65% 2328 57% 1,916 82%
High School Rank and GPA
No. of Cumulative GPA No. of CumulativePercentile Students No. % Range Students No. %
95 - 100 155 155 7% Over 4.0 125 125 5%90 - 94 152 307 14% 4.0 47 172 7%85 - 89 150 457 21% 3.50 - 3.999 503 675 29%80 - 84 154 611 29% 3.25 - 3.499 320 995 43%
75 - 79 124 735 35% 3.00 - 3.249 325 1,320 57%70 - 74 141 876 41% 2.50 - 2.999 596 1,916 82%65 - 69 135 1,011 47% 2.00 - 2.499 336 2,252 97%60 - 64 128 1,139 53% 1.00 - 1.999 76 2,328 100%
Below 1.00 0 2,328 100%55 - 59 116 1,255 59% Subtotal 2,32850 - 54 127 1,382 65%45 - 49 126 1,508 71% Unreported 5740 - 44 107 1,615 76%
Total 2,38535 - 39 109 1,724 81%30 - 34 106 1,830 86% Mean GPA 3.1025 - 29 68 1,898 89%20 - 24 73 1,971 93%
15 - 19 64 2,035 96%10 - 14 50 2,085 98% 5 - 9 35 2,120 100%1 - 4 10 2,130 100%
Subtotal 2,130
Unreported 255
Total 2,385
Average New Degree Freshmen High School Percentile: 60
1,320
152137222267154202186
New Degree Seeking FreshmenHigh School Rank and GPA
Main Campus
No.

High School Rank High School GPAUpper 25% Upper 50% 3.0+ 2.5+
Intended College No. % No. % No. % No. %Business 4 20% 12 60% 70% 16 80%Education 9 33% 17 63% 56% 23 85%Engineering 1 17% 2 33% 33% 5 83%Liberal Arts 3 21% 8 57% 57% 13 93%Nursing 4 36% 6 55% 45% 7 64%Science & Mathematics 3 38% 50% 5 63%Lake Campus-Associates 1 4% 2 9% 30% 12 52%Undecided 3 10% 17 57% 60% 24 80%
All Majors 25 19% 67 51% 134 54% 105 78%
High School Rank and GPA
No. of Cumulative GPA No. of CumulativePercentile Students No. % Range Students No. %
95 - 100 1 1 1% Over 4.0 2 2 1%90 - 94 5 6 5% 4.0 2 4 3%85 - 89 4 10 8% 3.50 - 3.999 17 21 16%80 - 84 9 19 15% 3.25 - 3.499 14 35 26%
75 - 79 6 25 19% 3.00 - 3.249 38 73 54%70 - 74 3 28 21% 2.50 - 2.999 32 105 78%65 - 69 11 39 30% 2.00 - 2.499 21 126 94%60 - 64 6 45 34% 1.00 - 1.999 7 133 99%
Below 1.00 1 134 100%55 - 59 13 58 44% Subtotal 13450 - 54 9 67 51%45 - 49 6 73 56% Unreported 540 - 44 8 81 62%
Total 13935 - 39 11 92 70%30 - 34 7 99 76% Mean GPA 2.9425 - 29 8 107 82%20 - 24 6 113 86%
15 - 19 3 116 89%10 - 14 5 121 92% 5 - 9 5 126 96%1 - 4 5 131 100%
Subtotal 131
Unreported 8
Total 139
Average New Degree Freshmen High School Percentile: 48
New Degree Seeking FreshmenHigh School Rank and GPA
Lake Campus
14152854718
73

Ross11
Stark14
Wood4
Knox3
Darke40 Licking
8
Pike9
Scioto7
Huron3
Adams2
Lorain4
Wayne2
Gallia3
Allen14
Butler82
Logan21
Brown8
Clark117
Perry0
Trumbull3
Ashtabula1
Seneca6
Henry1
Union12
Athens1
Hardin4
Franklin118
Meigs1
Mercer23
Noble0
Miami95
Fulton2
Preble16
Belmont4
Vinton6
Fairfield22
Portage4
Putnam10
Hancock5
Highland10
Carroll0
Clinton43
Shelby32
Medina6
Marion7
Monroe0
Muskingum0
Lucas18
Richland6
Holmes1
Warren142
Summit10
Morrow3
Madison15
Morgan2
Guernsey0
Coshocton0
Fayette15
Greene376
Washington1
Pickaway15
Hocking0
Ashland1
Williams8
Jackson1
Clermont25
Delaware20
Geauga4
Harrison0
Paulding0
Tuscarawas2
Cuyahoga48Defiance
2
Hamilton170
Auglaize10
Lawrence1
Wyandot3
Van Wert2 Columbiana
1
Crawford1
Sandusky6
Mahoning0
Champaign25
Montgomery576
Ottawa2
Erie3
Lake5
Jefferson2
Ohio County of ResidenceMain Campus
New Degree Seeking Freshmen
77 Ohio counties represented97% of all new degree freshmen come from Ohio
49% of all new degree freshmen are from the four counties: Clark, Greene, Miami, Montgomery
"Legend
0
1 - 32
33 - 82
83 - 170
171 - 576

Ross0
Stark0
Wood0
Knox0
Darke7 Licking
1
Pike0
Scioto0
Huron0
Adams0
Lorain0
Wayne0
Gallia0
Allen4
Butler0
Logan0
Brown0
Clark0
Perry0
Trumbull0
Ashtabula0
Seneca0
Henry0
Union0
Athens0
Hardin0
Franklin0
Meigs0
Mercer70
Noble0
Miami1
Fulton0
Preble0
Belmont0
Vinton0
Fairfield0
Portage0
Putnam1
Hancock1
Highland0
Carroll0
Clinton0
Shelby6
Medina0
Marion0
Monroe0
Muskingum0
Lucas0
Richland0
Holmes0
Warren0
Summit0
Morrow0
Madison0
Morgan0
Guernsey0
Coshocton0
Fayette0
Greene0
Washington0
Pickaway0
Hocking0
Ashland0
Williams0
Jackson0
Clermont0
Delaware0
Geauga0
Harrison0
Paulding0
Tuscarawas0
Cuyahoga0Defiance
0
Hamilton0
Auglaize32
Lawrence0
Wyandot0
Van Wert13 Columbiana
0
Crawford0
Sandusky0
Mahoning0
Champaign0
Montgomery0
Ottawa0
Erie0
Lake0
Jefferson0
Ohio County of ResidenceLake Campus
New Degree Seeking Freshmen
10 Ohio counties represented98% of all new degree freshmen come from Ohio
73% of all new degree freshmen are from two counties:Auglaize and Mercer
"Legend
0
1 - 4
5 - 13
14 - 32
33 - 70

Retention and Graduation RatesFirst-time, Full-Time, Degree Seeking Freshmen*
Cohort Cohort Head Average %Continued %Continued %Graduated %Continued %Graduated %Continued %Graduated %ContinuedType Year Count ACT to_2nd_Yr to_3rd_Yr in_4_Yrs to_5th_Yr in_5_Yrs to_6th_Yr in_6_Yrs to_7th_YrTotal 1999 2,127 21.2 66.2% 53.3% 16.4% 32.7% 35.2% 9.0% 40.2% 3.4%Total 2000 2,124 21.1 70.5% 58.5% 19.7% 30.5% 37.2% 11.9% 43.5% 4.7%Total 2001 2,117 21.1 69.8% 57.2% 18.1% 31.0% 37.5% 10.8%Total 2002 2,149 21.4 67.8% 55.5% 18.3% 28.3%Total 2003 2,253 20.8 70.8% 56.0%Total 2004 2,261 20.8 71.7% 56.7%Total 2005 2,302 20.8 68.0%Female 1999 1,202 20.9 66.1% 54.2% 21.0% 31.3% 39.6% 7.2% 43.7% 2.8%Female 2000 1,218 20.7 71.9% 61.5% 24.9% 28.9% 43.0% 9.9% 49.0% 3.2%Female 2001 1,166 20.6 70.8% 58.7% 21.4% 29.9% 41.3% 9.5%Female 2002 1,211 21.1 69.5% 58.3% 22.1% 25.8%Female 2003 1,299 20.4 71.7% 58.0%Female 2004 1,281 20.4 71.2% 57.5%Female 2005 1,331 20.5 66.9%Male 1999 925 21.5 66.3% 52.0% 10.4% 34.6% 29.5% 11.4% 35.7% 4.1%Male 2000 906 21.7 68.5% 54.8% 12.9% 32.6% 29.5% 14.6% 36.0% 6.6%Male 2001 951 21.8 68.6% 55.3% 14.1% 32.4% 32.8% 12.4%Male 2002 938 21.8 65.6% 51.9% 13.4% 31.7%Male 2003 954 21.4 69.5% 53.2%Male 2004 980 21.3 72.3% 55.5%Male 2005 971 21.3 69.4%
-- Continuation Rates -- --------- Cumulative Graduation Rates and Continuation Rates ----------
*Main Campus onlyIncludes direct and not direct from high school students

Retention and Graduation RatesDegree Seeking Transfer Students*
Cohort Cohort Head % %Cont %Grad %Cont %Grad %Cont %Grad %Cont %Grad %Cont %Grad %ContType Year Count Part_time to_2nd_Yr in_2_Yrs to_3rd_Yr in_3_Yrs to_4th_Yr in_4_Yrs to_5th_Yr in_5_Yrs to_6th_Yr in_6_Yrs to_7th_Yr
Total 1999 224 33.5% 72.3% 17.9% 43.8% 41.5% 24.6% 52.2% 13.4% 57.5% 2.7% 57.9% 2.3%Total 2000 191 23.6% 69.1% 16.8% 41.9% 40.8% 17.3% 48.9% 6.3% 52.6% 4.2% 52.4% 3.1%Total 2001 218 31.7% 73.9% 17.4% 53.7% 45.6% 20.9% 59.5% 7.9% 62.8% 4.1%Total 2002 223 30.5% 76.7% 23.2% 45.1% 46.4% 19.2% 58.7% 7.2%Total 2003 241 20.3% 74.7% 14.1% 51.5% 39.8% 21.6%Total 2004 246 21.5% 78.0% 20.7% 50.4%Total 2005 252 23.0% 72.2%Female 1999 148 37.2% 70.9% 18.9% 41.9% 44.6% 18.2% 53.4% 10.8% 56.8% 2.1% 57.5% 3.4%Female 2000 113 16.8% 71.7% 23.0% 38.9% 49.6% 14.2% 56.8% 3.6% 57.7% 4.5% 56.7% 3.5%Female 2001 122 35.2% 71.3% 23.0% 46.7% 51.7% 20.0% 61.7% 9.2% 66.4% 2.5%Female 2002 136 32.4% 75.7% 27.2% 40.9% 48.9% 18.2% 62.5% 5.9%Female 2003 142 25.4% 70.4% 13.4% 46.5% 35.9% 21.1%Female 2004 145 24.1% 78.6% 20.7% 52.4%Female 2005 133 24.8% 72.2%Male 1999 76 26.3% 75.0% 15.8% 47.4% 35.5% 36.8% 50.0% 18.4% 58.7% 4.0% 58.7% 1.3%Male 2000 78 33.3% 65.4% 7.7% 46.2% 28.2% 21.8% 38.0% 10.1% 45.6% 3.8% 46.2% 2.6%Male 2001 96 27.1% 77.1% 10.4% 62.5% 37.9% 22.1% 56.8% 6.3% 58.3% 6.3%Male 2002 87 27.6% 78.2% 17.2% 51.7% 42.5% 20.7% 52.9% 9.2%Male 2003 99 13.1% 80.8% 15.2% 58.6% 45.5% 22.2%Male 2004 101 17.8% 77.2% 20.8% 47.5%Male 2005 119 21.0% 72.3%
*Degree Seeking Transfer students include:Full and Part-time studentsMain Campus students onlyStudents entering WSU for the first time onlyStudents who have ONLY attended community college(s) or 2 year institution(s)Students transferring at least 45 quarter hours (30 semester hours)Students who enrolled in the fall term who attended for the first time in the prior summer termStudents who entered with advance standing (college credit earned before graduation from high school)
---------------------------------------- Cumulative Graduation Rates and Continuation Rates ----------------------------------------

Transfer Students
Freshman Sophomore Junior Senior TotalRaj Soin College of Business 3 8 39 20 70College of Education & Human Services 2 6 29 24 61College of Engr. & Computer Science 2 1 8 5 16College of Liberal Arts 14 45 69 20 148College of Nursing & Health 3 14 30 33 80College of Science & Mathematics 17 36 46 18 117University College 185 191 50 13 439Associate Degree 1 1 2All Degree Programs 227 302 271 133 933
Non-Degree Students 81 2 3 7 93
All Undergraduates 308 304 274 140 1,026
Colleges and UniversitiesDegree Seeking Transfer Students
No. of No. ofOhio Public/Community/Tech. Colleges Students Ohio Public/Community/Tech. Colleges StudentsCinn. St. Tech. & Comm. Coll. 7 Marion Technical College 1Clark State Community College 48 North Central State College 1Columbus State Community College 17 Northwest State Community College 5Cuyahoga Community College 3 Owens State Community College 6Devry Institute of Technology 1 Sinclair Community College 287Edison State Community College 47 Southern State Community College 20Hocking Technical College 3 Terra Community College 1James A Rhodes State College 7
Sub-Total 133 Sub-Total 321

Transfer Students cont'd.
No. of No. ofOhio Public Universities/Regional Campuses Students Ohio Private Colleges/Universities StudentsBowling Green State University 14 Antioch University 2Central State University 4 Ashland University 4Cleveland State University 1 Capital University 4Kent State University 9 Cedarville University 8Miami University 31 Chatfield College 1The Ohio State University 34 Cincinnati Christian University 1Ohio University 33 College of Mount St. Joseph 1Shawnee State University 2 Defiance College 2University of Akron 3 Denison University 2University of Cincinnati 28 Heidelberg College 1University of Toledo 18 Hiram College 2Youngstown State University 4 Kettering College of Medical Arts 6
Mount Vernon Nazarane College 2TOTAL 181 Muskingum College 2
Myers University 1Ohio Northern University 5Ohio Wesleyan University 1
No. of Ohio Dominican College 2Out of State Students Otterbein College 4Illinois 7 Southern Ohio College 1Indiana 13 Tiffin University 4Kentucky 22 University of Dayton 23Michigan 15 University of Findlay 3Pennsylvania 5 University of Northwestern Ohio 2West Virginia 4 Urbana University 7
Wilberforce University 1Other States 112 Wilmington College 15
Wittenberg University 12TOTAL 178 Xavier University 1
TOTAL 120
GRAND TOTAL 933
Colleges and UniversitiesDegree Seeking Transfer Students

Degrees AwardedJuly 1, 2006 - June 30, 2007
All Students
Degrees by College/School
Raj Soin College of Business 452 20.2% 207 19.4%College of Education & Human Services 495 22.1% 449 42.0%College of Engineering & Computer Science 169 7.5% 150 14.0%College of Liberal Arts 597 26.6% 110 10.3%College of Nursing & Health 219 9.8% 63 5.9%College of Science & Mathematics 310 13.8% 79 7.4%School of Medicine 10 0.9%Total 2,242 100% 1,068 100%
Associate Degrees Awarded
Associate of Arts 14 20.3%Associate of Science 10 14.5%Associate of Applied Business 33 47.8%Associate of Applied Science 5 7.2%Associate of Technical Study 7 10.1%Total 69 100%
Associates
Bachelors Masters
Degrees by Level
24
1,068
2,242
69
28
3,519
88
0 500 1,000 1,500 2,000 2,500 3,000 3,500 4,000
Doctor of Professional Psychology
Doctor of Medicine
Doctor of Philosophy
Master's
Bachelor's
Associate
Total
Number of Students

Degrees AwardedJuly 1, 2006 - June 30, 2007
College and Program-All Students
Associate Degree Baccalaureate Degree Doctoral Degree Masters Degree TotalCollege of Ed & Human Services Administrative Specialist- MED 5 5
Athletic Training - BSED 11 11Classroom Teacher - MA 2 2Classroom Teacher - MED 146 146Counseling - MRC 8 8Counseling - MS 39 39CT: Adolesc Young Adult - MED 53 53CT: Middle Childhood - MED 59 59CT: Modern Languages - MED 2 2CT: Multi-Age - MED 14 14Early Childhood Ed - BSED 121 121Education Leadership - MA 1 1Education Leadership - MED 89 89Integrated Business Ed - BSED 5 5K-12: Physical Ed - BSED 24 24Marketing Education - BSED 1 1Middle Childhood Ed - BSED 83 83Organiz Leadership - BS 228 228PPS: School Counseling - MED 20 20Principalship - MED 11 11Rehabilitation Services - BS 21 21Vocational Education - BSED 1 1College of Ed & Human Services 495 449 944Biomedical Engineering - BSBE 16 16Biomedical Engineering - MSEG 17 17Computer Engineering - BSCE 20 20Computer Engineering - MSCE 16 16Computer Sci + Engineer - PHD 10 10Computer Science - BSCS 35 35Computer Science - MS 16 16Electrical Engineering - BSEE 34 34Electrical Engineering - MSEG 62 62Engineering - PHD 7 7Engineering Physics - BSEP 4 4Human Factors Engineer - MSEG 25 25Industr + Systems Egr - BSISE 10 10Materials Sci + Egr - BSMSE 4 4Materials Sci + Egr - MSEG 4 4Mech Engineering - BSME 46 46Mech Engineering - MSEG 10 10College of Egr & Computer Sci 169 17 150 336
College of Egr & Computer Sci

Degrees AwardedJuly 1, 2006 - June 30, 2007
College and Program-All Students
Associate Degree Baccalaureate Degree Doctoral Degree Masters Degree TotalCollege of Liberal Arts Acting - BFA 11 11
African Afri/Amer Studies - BA 1 1Anthropology - BA 6 6Applied Behavioral Science- MA 19 19Art - BA 3 3Art - BFA 32 32Art History - BA 3 3Classical Humanities - BA 5 5Communication Studies - BA 34 34Criminal Justice - BA 41 41Dance - BFA 5 5Design/Technology - BFA 17 17Economics - BA 5 5English - BA 42 42English - MA 29 29English: Lang Arts Ed - BA 15 15French - BA 12 12Geography - BA 1 1Geography - BS 1 1History - BA 34 34History - MA 17 17Humanities - MH 4 4International Studies - BA 27 27Internatnl+Comparatve Polit-MA 9 9Latin - BA 2 2Liberal Studies - BA 14 14Mass Communication - BA 44 44Modern Languages - BA 9 9Motion Pictures - BA 2 2Motion Pictures - BFA 6 6Music - BA 1 1Music - MM 4 4Music Education - BM 26 26Music: Performance - BM 6 6Organiz Communication - BA 13 13Philosophy - BA 5 5Political Science - BA 55 55Public Administration - MPA 28 28Religion - BA 3 3Social Science Education - BA 25 25Social Work - BA 35 35

Degrees AwardedJuly 1, 2006 - June 30, 2007
College and Program-All Students
Associate Degree Baccalaureate Degree Doctoral Degree Masters Degree TotalCollege of Liberal Arts-cont'd Social+Indust Comm - BA 1 1
Sociology - BA 30 30Spanish - BA 11 11Theatre Studies - BA 4 4Urban Affairs - BA 2 2Urban Affairs - BS 6 6Women's Studies - BA 2 2College of Liberal Arts 597 110 707Nursing - BSN 165 165Nursing - MS 63 63Nursing BEACON - BSN 21 21Nursing Completion - BSN 33 33College of Nursing & Health 219 63 282
College of Science & Math Anatomy - MS 5 5Applied Math - MS 1 1Applied Statistics - MS 7 7Biological Sciences - BA 4 4Biological Sciences - BS 88 88Biological Sciences - MS 10 10Biomedical Sciences - PHD 6 6Chemistry - BA 1 1Chemistry - BS 33 33Chemistry - MS 10 10Clinical Lab Science - BSCLS 3 3Earth Science - MST 10 10Environmental Sciences - BS 10 10Geological Sciences - BA 6 6Geological Sciences - BS 2 2Geological Sciences - MS 11 11Human Factors/Ind Psych - MS 9 9Human Factors/Ind Psych - PHD 1 1Integrated Science - BS 1 1Interdisc Science+Math - MST 4 4Mathematics - BA 1 1Mathematics - BS 19 19Mathematics - MS 1 1Microbiology + Immunology - MS 4 4Physics - BA 1 1Physics - BS 3 3
College of Nursing & Health

Degrees AwardedJuly 1, 2006 - June 30, 2007
College and Program-All Students
Associate Degree Baccalaureate Degree Doctoral Degree Masters Degree TotalCollege of Science & Math-cont'd Physics - MS 6 6
Physiology + Biophysics - MS 1 1Psychology - BA 103 103Psychology - BS 35 35College of Science & Math 310 7 79 396Accountancy - BSB 93 93Accountancy - MACC 18 18Business - MBA 167 167Business Economics - BSB 11 11Finance - BSB 84 84Financial Services - BSB 16 16Human Resource Mgmt - BSB 23 23International Business - BSB 11 11Logist Mgmt--Supply Chain - MS 15 15Management - BSB 70 70Marketing - BSB 72 72Mgmt Info Systems - BSB 58 58Operations Management - BSB 14 14Social + Applied Econ - MS 7 7Raj Soin College of Business 452 207 659Aerospace Medicine - MS 3 3Medicine-MD 88 88Pharmacology + Toxicology - MS 1 1Public Health - MPH 6 6School of Medicine 88 10 98Clinical Psychology - PSYD 28 28School of Prof Psychology 28 28Business - AS 9 9Chemistry - AS 1 1Communication - AA 4 4Drafting + Design Tech - AAS 5 5Financial Mgmt Technology- AAB 4 4History - AA 1 1Information Technology - AAB 11 11Liberal Studies - AA 2 2Office Info Systems - AAB 18 18Psychology - AA 2 2Social Work - AA 5 5Technical Study - ATS 7 7Wright State Lake Campus 69 69
69 2,242 140 1,068 3,519
School of Medicine
School of Prof Psychology
Wright State Lake Campus
Total Degrees Awarded
Raj Soin College of Business

Minority Students

Asian Men Women Total Men Women Total Men Women Total % Undergraduate 146 167 313 2 2 4 148 169 317 60% Masters 40 52 92 40 52 92 18% Doc/Professional 55 61 116 55 61 116 22%Total 241 280 521 2 2 4 243 282 525 3%African American Undergraduate 544 1,011 1,555 2 4 6 545 1,014 1,559 85% Masters 74 140 214 74 140 214 12% Doc/Professional 22 39 61 22 39 61 3%Total 640 1,190 1,830 2 4 6 641 1,193 1,834 11%Hispanic Undergraduate 86 101 187 2 4 6 87 104 191 80% Masters 12 27 39 12 27 39 16% Doc/Professional 6 4 10 6 4 10 4%Total 104 132 236 2 4 6 105 135 240 1%Foreign Undergraduate 107 61 168 1 2 3 108 63 171 27% Masters 285 137 422 2 2 287 137 424 66% Doc/Professional 37 13 50 37 13 50 8%Total 429 211 640 3 2 5 432 213 645 4%Native American Undergraduate 19 29 48 1 4 5 20 33 53 88% Masters 1 3 4 1 3 4 7% Doc/Professional 2 1 3 2 1 3 5%Total 22 33 55 1 4 5 23 37 60 0.4%Caucasian Undergraduate 4,249 4,985 9,234 230 415 645 4,462 5,366 9,828 78% Masters 727 1,450 2,177 32 90 122 751 1,523 2,274 18% Doc/Professional 244 285 529 244 285 529 4%Total 5,220 6,720 11,940 262 505 767 5,457 7,174 12,631 75%Unknown Undergraduate 364 410 774 28 19 47 392 427 819 84% Masters 52 82 134 3 2 5 54 84 138 14% Doc/Professional 7 14 21 7 14 21 2%Total 423 506 929 31 21 52 453 525 978 6%
Total 7,079 9,072 16,151 303 542 845 7,354 9,559 16,913 100%
Classification Asian Foreign Caucasian TotalFreshman 105 70 50 3,099 4,328Sophomore 63 34 32 1,761 2,290Junior 65 28 31 1,876 2,355Senior 84 59 58 3,092 3,965Total Undergraduates 317 191 171 9,828 12,938
Masters 92 39 424 2,274 3,185Doctoral/Professional 116 10 50 529 790
Total Students 525 240 645 12,631 16,913
Minority Headcount Enrollment is 2,659 students (16%).Minority Headcount includes Asian, African American, Hispanic and Native American students
Hispanic
Headcount Enrollment by Ethnicity
Main Lake
AfricanAmerican
Native
University Total*
American698287217357
1,559
21461
1,834
13821
819
Unknown288104128
189
978
1610
60
34
53299
*Unduplicated Headcount
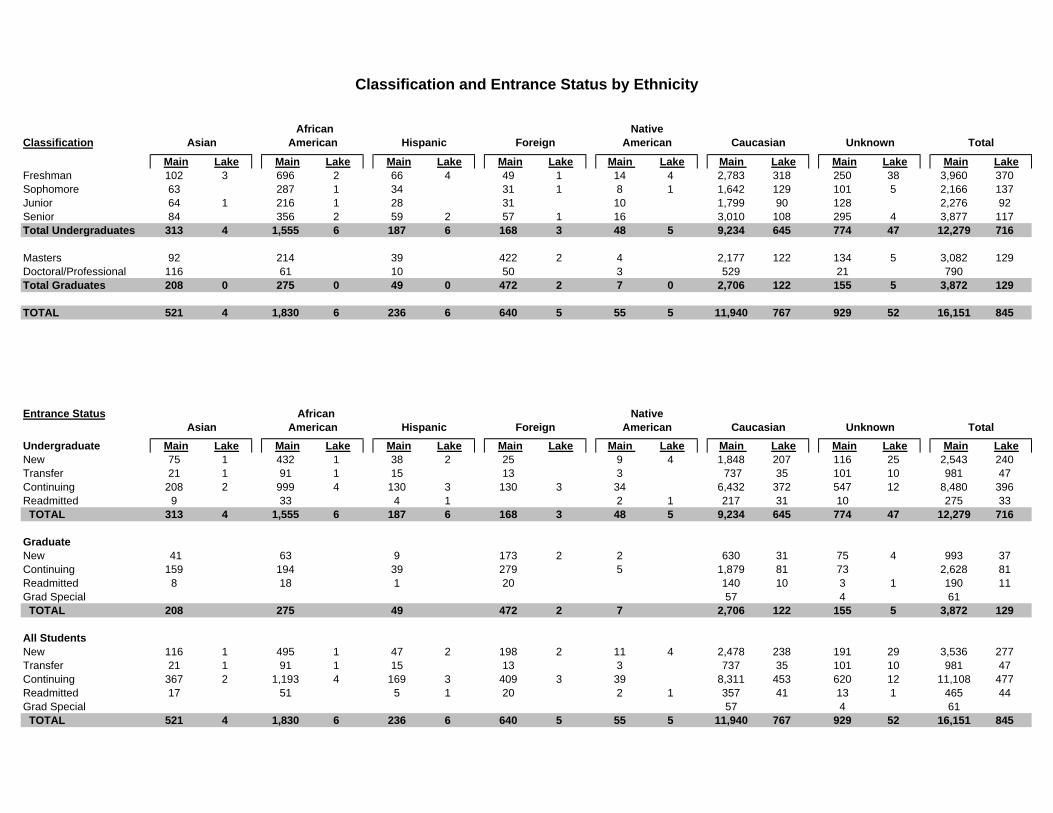
Classification
Main Lake Main Lake Main Lake Main Lake Main Lake Main Lake Main Lake Main LakeFreshman 102 3 696 2 66 4 49 1 14 4 2,783 318 250 38 3,960 370Sophomore 63 287 1 34 31 1 8 1 1,642 129 101 5 2,166 137Junior 64 1 216 1 28 31 10 1,799 90 128 2,276 92Senior 84 356 2 59 2 57 1 16 3,010 108 295 4 3,877 117Total Undergraduates 313 4 1,555 6 187 6 168 3 48 5 9,234 645 774 47 12,279 716
Masters 92 214 39 422 2 4 2,177 122 134 5 3,082 129Doctoral/Professional 116 61 10 50 3 529 21 790Total Graduates 208 0 275 0 49 0 472 2 7 0 2,706 122 155 5 3,872 129
TOTAL 521 4 1,830 6 236 6 640 5 55 5 11,940 767 929 52 16,151 845
Entrance Status
Undergraduate Main Lake Main Lake Main Lake Main Lake Main Lake Main Lake Main Lake Main LakeNew 75 1 432 1 38 2 25 9 4 1,848 207 116 25 2,543 240Transfer 21 1 91 1 15 13 3 737 35 101 10 981 47Continuing 208 2 999 4 130 3 130 3 34 6,432 372 547 12 8,480 396Readmitted 9 33 4 1 2 1 217 31 10 275 33 TOTAL 313 4 1,555 6 187 6 168 3 48 5 9,234 645 774 47 12,279 716
GraduateNew 41 63 9 173 2 2 630 31 75 4 993 37Continuing 159 194 39 279 5 1,879 81 73 2,628 81Readmitted 8 18 1 20 140 10 3 1 190 11Grad Special 57 4 61 TOTAL 208 275 49 472 2 7 2,706 122 155 5 3,872 129
All StudentsNew 116 1 495 1 47 2 198 2 11 4 2,478 238 191 29 3,536 277Transfer 21 1 91 1 15 13 3 737 35 101 10 981 47Continuing 367 2 1,193 4 169 3 409 3 39 8,311 453 620 12 11,108 477Readmitted 17 51 5 1 20 2 1 357 41 13 1 465 44Grad Special 57 4 61 TOTAL 521 4 1,830 6 236 6 640 5 55 5 11,940 767 929 52 16,151 845
Asian American Hispanic Foreign
Asian
Classification and Entrance Status by Ethnicity
Native African American Hispanic Foreign American
Total African Native
Caucasian Unknown Total
American Caucasian Unknown

Men Women Men Women Men Women Men Women Men Women Men Women Men Women Men Women
Raj Soin College of Business 13 14 36 44 4 7 22 5 1 571 402 41 34 687 507College of Education & HS 7 6 34 58 3 8 3 1 2 2 309 682 21 41 379 798College of Liberal Arts 16 29 95 174 18 17 8 6 7 7 761 944 83 86 988 1,263College of Nursing & Health 5 16 12 50 4 15 2 14 1 80 480 9 31 112 607College of Science & Mathematics 26 31 29 98 12 7 11 11 1 6 389 567 42 50 510 770College of Engineering & Computer Science 21 10 25 8 10 16 4 2 462 68 44 8 580 98University College 51 58 305 577 35 45 39 18 7 12 1,587 1,771 89 105 2,113 2,586Lake Campus-Assoc. Degree 1 6 1 6Non-Degree 7 3 8 2 2 6 2 89 65 35 55 145 129Total 146 167 544 1,011 86 101 107 61 19 29 4,249 4,985 364 410 5,515 6,764
Men Women Men Women Men Women Men Women Men Women Men Women Men Women Men Women
Raj Soin College of Business 4 7 1 4 8College of Education & HS 1 1 1 1 31 87 1 1 33 91College of Liberal Arts 1 7 4 7 5College of Nursing & Health 1 15 0 16College of Science & Mathematics 1 2 9 1 2 11College of Engineering & Computer Science 1 0 1University College 1 1 1 1 1 3 153 195 13 10 168 211Lake Campus-Assoc. Degree 1 1 1 2 1 26 85 6 1 35 89Non-Degree 1 1 1 7 12 8 5 17 18Total 2 2 2 4 2 4 1 2 1 4 230 415 28 19 266 450
Undergraduate Total* 148 169 545 1,014 87 104 108 63 20 33 4,462 5,366 392 427 5,762 7,176
*Unduplicated Headcount
Unknown TotalAmerican
Undergraduate Headcount Enrollment by Ethnicity and College
Native African Total
Main Campus
Caucasian UnknownAsian American
African Native
American
Lake Campus
Hispanic Foreign
CaucasianAmerican Hispanic ForeignAsian

Men Women Men Women Men Women Men Women Men Women Men Women Men Women Men Women
Raj Soin College of Business 11 11 16 17 3 7 58 34 172 120 5 5 265 194College of Education & HS 2 11 18 56 1 6 2 1 1 181 698 13 20 216 794College of Liberal Arts 1 6 21 1 6 3 4 2 77 155 7 21 94 210School of Medicine 24 43 15 29 1 1 7 1 1 1 165 209 8 9 221 293College of Nursing & Health 4 15 2 2 12 152 12 12 187School of Professional Psychology 1 4 7 12 3 2 1 5 20 62 7 32 92College of Science & Mathematics 12 21 8 17 3 2 17 20 1 114 120 8 1 163 181College of Engineering & Computer Science 31 10 13 5 4 3 228 79 149 44 11 3 436 144Non-Degree 14 8 13 7 2 2 8 3 81 175 7 18 125 213Total 95 113 96 179 18 31 322 150 3 4 971 1,735 59 96 1,564 2,308
Men Women Men Women Men Women Men Women Men Women Men Women Men Women Men Women
Raj Soin College of Business 2 17 13 2 1 21 14College of Education & HS 12 62 1 12 63College of Liberal Arts 0 0School of Medicine 0 0College of Nursing & Health 0 0School of Professional Psychology 0 0College of Science & Mathematics 2 7 1 3 7College of Engineering & Computer Science 0 0Non-Degree 1 8 1 8Total 0 0 0 0 0 0 2 0 0 0 32 90 3 2 37 92
Graduate Total* 95 113 96 179 18 31 324 150 3 4 995 1,808 61 98 1,592 2,383
*Unduplicated Headcount
American
Unknown Total
Caucasian Unknown Total
Caucasian
Graduate/Professional Headcount Enrollment by Ethnicity and College
Asian American Hispanic Foreign African
Hispanic Foreign American
Native
Lake Campus
Asian American
Main Campus
African Native

Raj Soin College of Business
Freshman Men 1 1 2 Women 1 1 2 Total 2 1 1 4
Sophomore Men 2 9 1 12 Women 4 3 1 8 Total 6 12 2 20
Junior Men 3 8 1 12 Women 2 11 13 Total 5 19 1 25
Senior Men 7 19 1 27 Women 7 29 6 1 43 Total 14 48 7 1 70
Total Men 13 36 4 53 Women 14 44 7 1 66 Total 27 80 11 1 119
College of Education and Human Services
Freshman Men 1 1 Women 1 1 Total 1 1 2
Sophomore Men 2 1 3 Women 1 4 1 6 Total 1 6 2 9
Junior Men 4 8 1 13 Women 3 19 22 Total 7 27 1 35
Senior Men 3 23 3 29 Women 2 36 8 1 47 Total 5 59 11 1 76
Total Men 7 34 3 2 46 Women 6 59 8 3 76 Total 13 93 11 5 122
*Unduplicated Headcount
Total*AsianAfrican
American HispanicNative
American
Minority UndergraduatesHeadcount Enrollment by College
AsianAfrican
American HispanicNative
American Total*

Minority Undergraduate Headcount Enrollment cont'd
College of Engineering and Computer Science
Freshman Men 3 3 1 7 Women 1 1 2 Total 4 4 1 9
Sophomore Men 5 5 10 Women 2 1 3 Total 7 6 13
Junior Men 2 2 3 7 Women 3 1 4 Total 5 3 3 11
Senior Men 11 15 6 2 34 Women 4 5 9 Total 15 20 6 2 43
Total Men 21 25 10 2 58 Women 10 8 18 Total 31 33 10 2 76
College of Liberal Arts
Freshman Men 1 10 2 1 14 Women 1 7 2 10 Total 2 17 4 1 24
Sophomore Men 1 22 4 1 28 Women 7 27 4 1 39 Total 8 49 8 2 67
Junior Men 10 23 7 1 41 Women 14 68 5 3 90 Total 24 91 12 4 131
Senior Men 4 40 5 4 53 Women 8 72 6 3 89 Total 12 112 11 7 142
Total Men 16 95 18 7 136 Women 30 174 17 7 228 Total 46 269 35 14 364
*Unduplicated Headcount
Total*AsianAfrican
American HispanicNative
American
AsianAfrican
American HispanicNative
American Total*

Minority Undergraduate Headcount Enrollment cont'd
College of Nursing and Health
Freshman Men Women 1 1 Total 1 1
Sophomore Men 1 1 Women 5 5 Total 1 5 6
Junior Men 1 1 Women 5 11 5 21 Total 5 12 5 22
Senior Men 4 11 4 19 Women 10 35 10 1 56 Total 14 46 14 1 75
Total Men 5 12 4 21 Women 16 51 15 1 83 Total 21 63 19 1 104
College of Science and Mathematics
Freshman Men 1 5 1 7 Women 1 9 10 Total 2 14 1 17
Sophomore Men 10 5 4 19 Women 9 24 3 1 37 Total 19 29 7 1 56
Junior Men 5 5 4 14 Women 9 25 2 36 Total 14 30 4 2 50
Senior Men 10 14 4 28 Women 12 40 4 3 59 Total 22 54 8 3 87
Total Men 26 29 12 1 68 Women 31 98 7 6 142 Total 57 127 19 7 210
*Unduplicated Headcount
Total*AsianAfrican
American HispanicNative
American
AsianAfrican
American HispanicNative
American Total*

Minority Undergraduate Headcount Enrollment cont'd
University College
Freshman Men 40 218 25 3 286 Women 45 434 37 11 527 Total 85 652 62 14 813
Sophomore Men 8 70 11 2 91 Women 12 109 6 2 129 Total 20 179 17 4 220
Junior Men 3 11 1 15 Women 2 24 2 2 30 Total 5 35 2 3 45
Senior Men 6 1 7 Women 11 1 12 Total 17 1 1 19
Total Men 51 305 36 7 399 Women 59 578 46 15 698 Total 110 883 82 22 1,097
Continuing Education**
Freshman Men 5 7 12 Women 3 1 1 5 Total 8 8 1 17
Sophomore Men 1 1 Women 1 1 Total 1 1 2
Junior Men Women 1 1 Total 1 1
Senior Men 2 1 3 Women 1 1 Total 2 1 1 4
Total Men 8 8 16 Women 3 2 3 8 Total 11 10 3 24
*Unduplicated Headcount**Students in the College of Continuing Education are all non-degree students, but other non-degree students are included in the other colleges
Total*AsianAfrican
American HispanicNative
American
AsianAfrican
American HispanicNative
American Total*

Minority Undergraduate Headcount Enrollment cont'd
Lake Campus
Freshman Men 1 1 1 3 Women 1 1 Total 1 1 1 1 4
Sophomore Men Women Total
Total Men 1 1 1 3 Women 1 1 Total 1 1 1 1 4
Grand Totals
Freshman Men 52 245 29 6 332 Women 53 453 41 12 559 Total 104 697 69 17 891
Sophomore Men 28 113 20 4 165 Women 35 174 14 5 228 Total 63 287 34 9 393
Junior Men 27 58 15 3 103 Women 38 159 13 7 217 Total 65 217 28 10 320
Senior Men 41 129 23 7 200 Women 43 228 36 9 316 Total 84 357 59 16 516
Total Men 148 545 87 20 800 Women 169 1,014 104 33 1,320 Total 317 1,559 191 53 2,120
*Unduplicated Headcount
Total*AsianAfrican
American HispanicNative
American
AsianAfrican
American HispanicNative
American Total*
Minority Undergraduate Headcount EnrollmentTotal University
Univ College55%
Continuing Ed.1%
Egr & CS4%
Business6%
Education6%
Nursing5%
Sci. & Mth10% Liberal Arts
17%
Lake Campus0.2%

Master's Men 11 16 3 30 Women 11 17 7 35 Total 22 33 10 65
Master's Men 1 18 1 1 21 Women 11 56 6 1 74 Total 12 74 7 2 95
Educational Specialist Men 1 1 Women Total 1 1
Total Men 2 18 1 22 Women 11 56 6 1 74 Total 13 74 7 1 96
Master's Men 8 11 3 22 Women 7 3 3 13 Total 15 14 6 35
Doctoral Men 23 2 1 26 Women 3 2 5 Total 26 4 1 31
Total Men 31 13 4 48 Women 10 5 3 18 Total 41 18 7 66
Master's Men 6 1 7 Women 1 21 6 2 30 Total 1 27 7 2 37
*Unduplicated Headcount
Total*Native
American
AsianAfrican
American HispanicNative
American Total*
AsianAfrican
American Hispanic
AsianAfrican
American HispanicNative
American Total*
College of Education and Human Services
College of Engineering and Computer Science
College of Liberal Arts
Raj Soin College of Business
Minority Graduate/ProfessionalHeadcount Enrollment by College
Native American Total*
AsianAfrican
American Hispanic

Minority Graduate/Professional Headcount Enrollment cnt'd
Master's Men Women 4 15 2 21 Total 4 15 2 21
Master's Men 2 3 5 Women 4 7 11 Total 6 10 16
Professional Men 22 12 1 1 36 Women 39 22 1 1 63 Total 61 34 2 2 99
Total Men 24 15 1 1 41 Women 43 29 1 1 74 Total 67 44 2 2 115
Professional Men 1 7 3 11 Women 4 12 2 18 Total 5 19 5 29
Master's Men 3 7 2 12 Women 6 14 1 21 Total 9 21 3 33
Doctoral Men 9 1 1 1 12 Women 15 3 1 19 Total 24 4 2 1 31
Total Men 12 8 3 1 24 Women 21 17 2 40 Total 33 25 5 1 64
Total*AsianAfrican
American HispanicNative
American
Total*
AsianAfrican
American HispanicNative
American Total*
AsianAfrican
American HispanicNative
American
AsianAfrican
American HispanicNative
American Total*
College of Science and Mathematics
School of Medicine
School of Professional Psychology
College of Nursing and Health

Minority Graduate/Professional Headcount Enrollment cnt'd
Master's Men 14 13 2 29 Women 8 7 2 17 Total 22 20 4 46
Master's Men 39 74 12 1 126 Women 52 140 27 3 222 Total 91 214 39 4 348
Educational Specialist Men 1 1 Women Total 1 1
Professional Men 23 19 4 1 47 Women 43 34 3 1 81 Total 66 53 7 2 128
Doctoral Men 32 3 2 1 38 Women 18 5 1 24 Total 50 8 3 1 62
Total Men 95 96 18 3 212 Women 113 179 31 4 327 Total 208 275 49 7 539
*Unduplicated Headcount**Students in the College of Continuing Education are all non-degree students, but othernon-degree students are included in the other colleges
Total*AsianAfrican
American HispanicNative
American
AsianAfrican
American HispanicNative
American Total*
Grand Totals
Continuing Education/Graduate Studies**
Minority Graduate Headcount EnrollmentTotal University
SOM21%
Nursing4%
Liberal Arts7%
Egr. & CS12%
Education18%
Business12%
Sci & Math12%
SOPP5%
Contiuning Ed.9%

Minority Undergraduate Students by Major
Undergraduate Students in the Raj Soin College of Business
University Total College Intended Students
Asian AfrAm Hisp NatAm Total Asian AfrAm Hisp NatAm Total Asian AfrAm Hisp NatAm TotalAccountancy (110, 610) 3 15 3 21 2 36 3 2 43 5 51 6 2 64Business Economics (120, 620) 2 12 1 15 2 12 1 15Finance (130, 630) 3 4 1 8 6 6 3 10 1 14Financial Services (131, 631) 1 4 5 3 3 1 7 8Human Resource Mgt. (157, 657) 1 4 5 5 1 6 1 9 1 11International Business (146, 646) 5 3 8 5 3 8Management (150, 650) 1 9 1 11 23 2 25 1 32 3 36Mgt. Info. Systems (154, 654) 3 5 1 1 10 3 9 1 13 6 14 2 1 23Marketing (160, 660) 4 11 2 17 3 24 2 1 30 7 35 4 1 47Operations Mgt. (180, 680) 1 1 1 1 2 2Undeclared Major (100, 600) 7 48 4 2 61 7 48 4 2 61Subtotal 16 53 8 1 78 17 172 17 5 211 33 225 25 6 289Pre-Business Accountancy (171) 2 3 1 6 2 3 1 6 Business Economics (172) 1 1 1 1 Finance (173) 3 3 3 3 Financial Services 1 1 1 1 Human Resource Mgt. (179) 1 1 1 1 International Business (181) 1 2 3 1 2 3 Management (175) 6 1 7 6 1 7 Mgt. Info. Systems (177) 2 3 5 2 3 5 Marketing (176) 4 4 4 4 Operations Management (178) 1 1 1 1 Undeclared Major (170) 5 4 9 5 4 9Subtotal (Pre-Business) 11 27 3 41 11 27 3 41
Total 27 80 11 1 119 17 172 17 5 211 44 252 28 6 330
Undergraduate Students in the College of Education and Human ServicesUniversity Total
College Intended StudentsElementary Education Asian AfrAm Hisp NatAm Total Asian AfrAm Hisp NatAm Total Asian AfrAm Hisp NatAm Total Early Childhood (231, 731) 3 2 1 6 2 24 1 1 28 2 27 3 2 34 Middle Childhood(225, 725) 5 17 4 1 27 1 12 1 1 15 6 29 5 2 42K - 12 Physical Education (207, 707) 2 2 3 3 5 5Rehabilitation Serv (203, 703) 18 1 19 1 6 7 1 24 1 26Org Leadership (206, 706) 8 50 4 1 63 1 24 25 9 74 4 1 88Athletic Training (236, 736) 1 1 1 3 3 10 1 14 3 11 2 1 17Vocational Education (215, 715) 2 2 2 2Undeclared Major (700) 1 5 1 7 1 5 1 7Total 13 93 11 5 122 9 84 4 2 99 22 177 15 7 221
Majors
Majors

Minority Undergraduate Students by Major
Undergraduate Students in the College of Engineering and Computer ScienceUniversity
College IntendedAsian AfrAm Hisp NatAm Total Asian AfrAm Hisp NatAm Total Asian AfrAm Hisp NatAm Total
Biomedical Egr. (427, 927) 8 4 2 14 6 4 10 14 8 2 24Computer Engineering (426, 926) 1 1 6 17 2 1 26 7 17 2 1 27Computer Science (451, 951) 2 6 1 9 3 14 4 21 5 20 5 30Electrical Engineering (428, 928) 5 4 2 1 12 2 9 1 12 7 13 2 2 24Engineering (920) 10 1 1 12 10 1 1 12Engineering Physics (422, 922) 1 1 2 1 1 2Industrial & Sys. Egr. (432, 932) 2 1 3 2 2 4 1 5Mechanical Egr. (429, 929) 3 6 2 11 7 17 1 1 26 10 23 3 1 37Subtotal 19 22 7 2 50 25 74 8 4 111 44 96 15 6 161
University Total College Intended Students
Asian AfrAm Hisp NatAm Total Asian AfrAm Hisp NatAm Total Asian AfrAm Hisp NatAm TotalPre-Engineering Biomedical Egr. (477) 5 2 7 5 2 7 Comp. Engineering (476) 1 3 3 7 1 3 3 7 Comp. Science (475) 3 3 3 3 Electrical Egr. (478) 2 6 8 2 6 8 Mechanical Egr. (479) 1 1 1 1Subtotal (Pre-Engineering) 12 11 3 26 0 0 0 0 0 12 11 3 0 26
Total 31 33 10 2 76 25 74 8 4 111 56 107 18 6 187
Undergraduate Students in the College of Liberal Arts
University Total College Intended Students
Asian AfrAm Hisp NatAm Total Asian AfrAm Hisp NatAm Total Asian AfrAm Hisp NatAm TotalAnthropology (336), 836) 1 1 1 1 4 1 1 2 2 2 1 1 6B.A. in Art History (369, 869) 1 1 1 3 1 1 2 1 1 4B.F.A. in Art (371, 871) 3 7 1 11 1 1 2 4 8 1 13B.A. in Art (372, 872) 2 2 2 1 3 2 2 1 5B.F.A. in Art Education (368, 868) 1 1 1 1Classical Humanities (320, 820) 1 1 2 1 1 2African/Afr. Amer. Stud.(308,808) 11 11 11 11Women's Studies (309, 809) 2 2 1 1 3 3Mass Communication (312, 812) 2 35 2 39 22 1 23 2 57 3 62Communication Studies(313, 813) 4 13 1 18 19 4 23 4 32 5 41Org. Communication (314, 814) 1 1 1 1Economics - LA Degree (330, 830) 1 1 1 1English (350, 850) 6 23 2 6 37 1 9 1 11 7 32 3 6 48Eng - Lang. Arts. Edu. (346, 846) 1 3 1 5 1 3 4 2 6 1 9Geography (331, 831) 1 1 1 1History (332, 832) 1 5 2 8 2 2 1 7 2 10International Studies (304, 804) 5 6 1 1 13 2 2 5 8 1 1 15Modern Languages (363, 863) 1 2 3 1 1 1 3 4
StudentsTotal
Majors
Majors
Majors

Minority Undergraduate Students by Major
Undergraduate Students in the College of Liberal Arts (continued)University Total
College Intended StudentsAsian AfrAm Hisp NatAm Total Asian AfrAm Hisp NatAm Total Asian AfrAm Hisp NatAm Total
French (360, 860) 2 2 2 2Spanish (362, 862) 3 3 6 2 3 5 5 6 11B. Music in Music Ed. (377, 877) 1 4 5 1 4 5Music Und.-audition (376, 876) 4 4 4 4Pre-Music-not audition (370, 870) 4 11 2 17 4 11 2 17Philosophy (351, 851) 1 1 1 1 1 1 2Political Science (333, 833) 1 26 2 1 30 2 12 1 1 16 3 38 3 2 46Religion (352, 852) 1 1 1 1 2 2Social Work (335, 835) 1 15 1 17 28 1 1 30 1 43 2 1 47Social Science Edu. (340, 840) 4 1 5 2 1 1 4 2 5 2 9Sociology (334, 834) 1 31 32 12 12 1 43 44Theatre Arts Undec (373, 873) 1 3 4 9 2 11 1 12 2 15B.F.A. - Acting (385, 885) 7 1 8 1 2 3 8 3 11B.F.A. in Dance (379, 879) 1 1 1 1B.F.A. - Design/Tech (387, 887) 2 2 2 2B.A. - Motion Pictures (384, 884) 2 2 4 1 1 1 2 2 5B.F.A. - Motion Pic (383, 883) 4 1 5 4 1 5B.A. - Theatre Studies (374, 874) 1 2 1 4 10 10 1 12 1 14Urban Affairs (329, 829) 4 1 5 2 2 6 1 7Liberal Studies (311, 811) 3 8 1 12 2 2 3 8 2 1 14Criminal Justice (325, 825) 5 29 7 1 42 46 1 2 49 5 75 8 3 91Total 46 269 35 14 364 9 192 22 4 227 55 461 57 18 591
Undergraduate Students in the College of Nursing and HealthUniversity Total
College Intended StudentsAsian AfrAm Hisp NatAm Total Asian AfrAm Hisp NatAm Total Asian AfrAm Hisp NatAm Total
Nursing - Beacon Program (467) 4 2 4 10 4 2 4 10Nursing-General (491, 991) 14 47 13 1 75 10 112 15 3 140 24 159 28 4 215Nursing-Completion (492) 2 1 3 2 1 3Nursing SHARE 1 1 1 1Pre- Nursing (498) 3 11 1 15 3 11 1 15Total 21 63 19 1 104 10 112 15 3 140 31 175 34 4 244
Majors
Majors

Minority Undergraduate Students by MajorUndergraduate Students in the College of Science and Mathematics
University Total College Intended Students
Asian AfrAm Hisp NatAm Total Asian AfrAm Hisp NatAm Total Asian AfrAm Hisp NatAm Total
Biological Sciences (410, 910) 29 32 4 1 66 14 52 4 1 71 43 84 8 2 137Clinical Labor. Science (411,911) 1 2 1 4 1 2 3 2 4 1 7Environmental Sciences (414,914) 1 1 2 2 3 3Chemistry (430, 930) 6 3 5 14 2 6 8 8 9 5 22Geological Sciences (440) 1 1 2 2 2 1 3Mathematics (450, 950) 4 4 1 9 1 2 1 4 5 6 2 13Physics (460, 960) 1 1 1 1Psychology (470, 970) 10 71 5 4 90 4 55 2 1 62 14 126 7 5 152Integrated Science (419, 919) 2 2 2 2Undeclared Major (400, 900) 7 12 4 23 7 12 4 23Total 57 127 19 7 210 22 121 8 2 153 79 248 27 9 363
Undergraduate Students in Lake Campus Associate Degree ProgramsUniversity Total
College Intended StudentsAsian AfrAm Hisp NatAm Total Asian AfrAm Hisp NatAm Total Asian AfrAm Hisp NatAm Total
Business & Admin. 1 1 1 1Information Technology 1 1 1 1Office Info Systems (192) 1 1 1 1Lake Campus -Conditional (597) 1 1 1 1Total 1 1 1 1 4 1 1 1 1 4
Undergraduate Students in University CollegeUniversity Total
College Intended StudentsAsian AfrAm Hisp NatAm Total Asian AfrAm Hisp NatAm Total Asian AfrAm Hisp NatAm Total
University College Conditional (505, 555) 4 47 2 1 54 4 47 2 1 54 Undecided (500) 11 79 6 1 97 11 79 6 1 97 All Others 92 755 74 20 941 92 755 74 20 941Special H.S. Option B (502) 3 2 5 3 2 5Total 110 883 82 22 1,097 110 883 82 22 1,097
Majors
Majors
Majors

Raj Soin College of Business
Master of Business Adm. (MBA)Concentration Finance (130) 2 10 Flexible Business (104) 1 3 1 International Business (146) 3 2 Management Information Technology (159) 2 Management Innovation & Change (158) 4 3 2 Marketing (160) 1 1 3 Nursing & Health Care Management (185) 1 Project Management (156) 2 8 Supply Chain Management (182) Undeclared (100) 5 3 2
Subtotal 21 30 8 0
Master of Science (MS) Accountancy (111) 2 1 Social and Applied Economics (121) Logistics Management (153) 1 1 1
Subtotal 1 3 2 0
Total 22 33 10 0
College of Education & Human Services
Administration Specialist: C&I Prof Dev (288) 2 1Alternative Licensure 1 1Classroom Teacher: Adol to Young Adult (247) 1Classroom Teacher: Multi-Age (234) 1Classroom Teacher: Library/Media (253) 1Classroom Teacher: Middle Child Ed (249) 1Classroom Teacher: Phys Ed. (243) 1Classroom Teacher: Reading (255) 1Classroom Teacher: IS: Mild to Moderate Needs (277) 1 9 2Classroom Teacher: IS: Moderate to Intense Needs (256) 1Classroom Teacher: Career, Tech. & Adult Ed. Voc. Teacher Lic. (241) 6Counseling: Business & Industrial Mgt. (265) 2Counseling: Community Counseling (276) 1 1Counseling: Marriage & Family (268) 1Counseling: Mental Health (267) 6EDL:Student Affairs High Ed Admin (273) 14Ed. Leadership:EAS: Teacher Leader (291) 3 11 2PPS: School Counseling (275) 1 5Principalship (294) 8 1Rehabilitation Counseling: Chemical Dependency (270) 5Rehabilitation Counseling: Severe Disabilities (271) 2 1TESOL Endorsements (245) 1Subtotal 12 74 7 2
College of Education & Human Services
EDL:High Ed / Adult CE (297) 1Subtotal 1
Total 13 74 7 2
Master's
Ed.S.
Minority Graduate Student Headcount Enrollment
AsianAfrican
American HispanicNative
American

Raj Soin College of Business
Master of Business Adm. (MBA)Concentration Finance (130) 2 10 Flexible Business (104) 1 3 1 International Business (146) 3 2 Management Information Technology (159) 2 Management Innovation & Change (158) 4 3 2 Marketing (160) 1 1 3 Nursing & Health Care Management (185) 1 Project Management (156) 2 8 Supply Chain Management (182) Undeclared (100) 5 3 2
Subtotal 21 30 8
Master of Science (MS) Accountancy (111) 2 1 Social and Applied Economics (121) Logistics Management (153) 1 1 1
Subtotal 1 3 2
Total 22 33 10 0
College of Education & Human Services
Administration Specialist: C&I Prof Dev (288) 2 1Alternative Licensure 1 1Classroom Teacher: Adol to Young Adult (247) 1Classroom Teacher: Multi-Age (234) 1Classroom Teacher: Library/Media (253) 1Classroom Teacher: Middle Child Ed (249) 1Classroom Teacher: Phys Ed. (243) 1Classroom Teacher: Reading (255) 1Classroom Teacher: IS: Mild to Moderate Needs (277) 1 9 2Classroom Teacher: IS: Moderate to Intense Needs (256) 1Classroom Teacher: Career, Tech. & Adult Ed. Voc. Teacher Lic. (241) 6Counseling: Business & Industrial Mgt. (265) 2Counseling: Community Counseling (276) 1 1Counseling: Marriage & Family (268) 1Counseling: Mental Health (267) 6EDL:Student Affairs High Ed Admin (273) 14Ed. Leadership:EAS: Teacher Leader (291) 3 11 2PPS: School Counseling (275) 1 5Principalship (294) 8 1Rehabilitation Counseling: Chemical Dependency (270) 5Rehabilitation Counseling: Severe Disabilities (271) 2 1TESOL Endorsements (245) 1Subtotal 12 74 7 2
College of Education & Human Services
EDL:High Ed / Adult CE (297) 1Subtotal 1
Total 13 74 7 2
Minority Graduate Student Headcount Enrollment
AsianAfrican
American HispanicNative
American
Master's
Ed.S.

Minority Graduate Student Headcount Enrollment
College of Science & Mathematics
Anatomy (413) 2 2Applied Statistics (453) 2 4Biochemistry and Molecular Biology (415) 2Biological Sciences Biological Sciences (410) 2 1 1 Environmental Science (418)Chemistry (430) 3Chemistry - Environmental Science (431) 1 1Geological Sciences Hydrogeology (443) 1 Envrionmental Science (446) 1M.S.T. Earth Science (441) 1Mathematics: Applied Mathematics (452) 1Microbiology and Immunology (416) 4 1Physiology and Biophysics (417) 1 1Human Factors/ Industrial Psychology (468, 469) 1
Subtotal 9 21 3 0
College of Science & Mathematics
Human Factors/ Industrial Psychology (468, 469) 4 1 2 1Biomedical Sciences (481) 14 3Environmental Sciences Ph.D. (421) 6
Subtotal 24 4 2 1
Total 33 25 5 1
School of Professional PsychologyClinical Psychology (998) 5 19 5Total 5 19 5
Grand Total 186 255 45 7
Psy.D.
Doc./Prof.
Master'sAsian
African American Hispanic
Native American

AsianAfrican
American Hispanic Native American
Men 183 45% 547 35% 92 45% 17 34% 839 38%
Women 226 55% 1,018 65% 114 55% 33 66% 1,391 62%
Undergraduate 265 65% 1,392 89% 174 84% 46 92% 1,877 84%
Degree 265 65% 1,392 89% 174 84% 46 92% 1,877 84%
Non-Degree
Masters 39 10% 112 7% 22 11% 2 4% 175 8%
Degree 31 8% 110 7% 22 11% 2 4% 165 7%
Non-degree 8 2% 2 0.1% 10 0.4%
Doctoral 40 10% 8 1% 3 1% 51 2%
Professional 65 16% 53 3% 7 3% 2 4% 127 6%
TOTAL 409 78% 1,565 85% 206 86% 50 83% 2,230 84%
*Full Time: Undergraduate and Med: 12 hours or more; Masters and SOPP: 8 hours or more
AsianAfrican
American Hispanic Native American Total
Men 60 52% 94 35% 13 38% 6 60% 173 40%
Women 56 48% 175 65% 21 62% 4 40% 256 60%
Undergraduate 52 45% 167 62% 17 50% 7 70% 243 57%
Degree 38 33% 155 58% 14 41% 7 70% 214 50%
Non-Degree 14 12% 12 4% 3 9% 29 7%
Masters 53 46% 102 38% 17 50% 2 20% 174 41%
Degree 39 34% 81 30% 13 38% 1 10% 134 31%
Non-degree 14 12% 21 8% 4 12% 1 10% 40 9%
Doctoral 10 9% 1 10% 11 3%
Professional 1 1% 1 0.2%
TOTAL 116 22% 269 15% 34 14% 10 17% 429 16%
Part-Time
Total
Full-Time/Part-Time
Full-Time*

AsianAfrican
American HispanicNative
American TotalTier 1Clark 8 39 9 4 60Greene 97 74 49 9 229Miami 10 9 9 4 32Montgomery 106 643 54 10 813Total 221 765 121 27 1,134
Tier 2Butler 13 40 2 55Champaign 1 3 3 7Clinton 2 5 7Darke 2 1 3Preble 1 1Warren 11 13 5 6 35Total 28 58 16 6 108
Tier 3Auglaize 1 3 4Mercer 3 1 1 4 9Shelby 1 3 1 5Total 4 5 5 4 18
Tier 4Franklin 8 227 3 1 239Hamilton 5 238 2 1 246Total 13 465 5 2 485
Tier 5Total 9 163 17 3 192
Tier 6Total 12 50 10 7 79
Non-Ohio/Unreported*Total 30 53 17 4 104
95% of all undergraduate minorities come from Ohio53% of all minority undergraduate students are from the four counties:
Clark, Greene, Miami, and Montgomery
Ohio County of Residence*
59 counties represented
Minority Undergraduate Students
*Not all students have a county reported

AsianAfrican
American HispanicNative
American TotalTier 1Clark 12 1 13Greene 31 24 6 1 62Miami 4 2 6Montgomery 39 129 13 1 182Total 74 167 20 2 263
Tier 2Butler 2 6 2 10ChampaignClinton 1 1DarkePreble 1 1Warren 3 1 1 5Total 5 8 4 17
Tier 3Auglaize 1 1MercerShelby 1 1Total 1 1 2
Tier 4Franklin 11 18 2 1 32Hamilton 5 16 2 23Total 16 34 4 1 55
Tier 5Total 17 14 2 33
Tier 6Total 7 8 1 1 17
Non-Ohio/Unreported*Total 88 44 17 3 152
72% of all minority graduate students come from Ohio49% of all minority graduate students are from the four counties:
Clark, Greene, Miami, and Montgomery
Ohio County of Residence
32 counties represented
Minority Graduate Students
*Not all students have a county reported

STATE OF ORIGIN - MINORITIES
OH407-A 1736-B
206-H 53-I
IN3-A8-B
KY 1-A 2-B 1-H 1-I
IL5-A 13-B
1-H
MI6-A7-B3-H1-I
WI1-B
PA 3-A 3-B
NY1-A 2-B
2-H
WV 1-A
TN 0
VA3-A 3-B1-H 1-I
NC 3-B 1-H
SC 2-BGA
2-A 10-B 2-H
AL 1-BMS
0
FL2-A3-B 4-H
AK0
HI0
MN1-A
IA0
MO1-B
AR0
ND1-A
SD0
NE0
KS1-I
OK0
TX3-A 4-B 6-H 1-I
NM1-B1-H
CO 1-A1-B
AZ1-A
UT0
WY1-B
MT1-I
WA1-H
OR1-A
ID0
NV1-A
CA3-A4-B4-H
ME0
VT0 NH
0MA 2-B
RI0
DE0
NJ1-A 3-H
CT 0
MD
LA2-B
DC0
8-B
A=Asian B=African American H=Hispanic I=Native American

Communities
Hamilton Hall 7 67 7 1Woods 10 329 7 3Forest Lane 3 53 1Village 2 37 1 1College Park 8 157 3 1University Park 3 43 1 1Honors Dorm 5 52 8 1
Total 38 738 28 8
County of Origin
Tier 1 Clark 17 1 Greene 4 11 1 Miami 1 2 1 Montgomery 6 153 5 1 Tier 1 Total 11 183 8 1
Tier 2 Butler 23 1 Champaign 2 Clinton 1 1 Darke 1 Preble 1 Warren 2 6 2 Tier 2 Total 3 32 5
Tier 3 Auglaize Mercer 1 Shelby 1 1 Tier 3 Total 1 1 1
Tier 4 Franklin 3 163 1 1 Hamilton 3 174 1 Tier 4 Total 6 337 2 1
Tier 5 Total 5 120 6 1
Tier 6 Total 6 33 2 5
Non-Ohio/Unreported* 6 32 4
Total 38 738 28 8
Minority Students Living in Campus Housing
Hispanic
Hispanic
Native American
Native American
Asian
Asian
African American
African American
*Not all students have a county reported

All**College Freshman Sophomore Junior Senior Men Women StudentsRaj Soin College of Business - 2.722 - 2.997 2.771 3.075 2.895
College of Education & HS - - 2.573 3.153 2.438 3.260 2.855
College of Engineering & Computer Science - 2.899 3.441 3.063 3.149 2.882 3.083
College of Liberal Arts - 2.629 2.828 2.887 2.949 2.730 2.823
College of Nursing & Health - - - 2.973 3.239 2.946 3.006
College of Science & - 3.122 2.697 3.125 2.906 3.113 3.022 Mathematics
University College 2.066 2.334 - - 2.219 2.355 2.299
All Degree Undergraduates** 2.099 2.724 2.815 3.036 2.885 2.909 2.897
All**College Freshman Sophomore Junior Senior Men Women StudentsRaj Soin College of Business - 2.669 2.572 2.642 2.510 2.719 2.632
College of Education & HS - 2.650 2.444 2.577 2.260 2.704 2.548
College of Engineering & Computer Science - 2.745 - 2.488 2.565 2.429 2.526
College of Liberal Arts 2.460 2.586 2.549 2.628 2.697 2.547 2.598
College of Nursing & Health - - 3.083 2.891 2.984 2.914 2.925
College of Science & 2.814 2.637 2.353 2.645 2.412 2.607 2.577 Mathematics
University College 1.917 2.319 2.197 1.975 2.151 2.153 2.152
All Degree Undergraduates** 1.992 2.451 2.485 2.628 2.464 2.545 2.518
Mean Cumulative Minority UndergraduateGrade Point Average*
ASIAN DEGREE STUDENTS
AFRICAN AMERICAN DEGREE STUDENTS
* Does not include new freshmen students, transfer students or associate degree students**Includes GPA's that were not shown due to FERPA regulations
Note: A '-' indicates either a score omitted for privacy or no students in that category.

Mean Cumulative GPA cont'd
All**College Freshman Sophomore Junior Senior Men Women StudentsRaj Soin College of Business - - - 3.151 - 3.157 3.125
College of Education & HS - - - 3.109 - 3.140 3.109
College of Engineering & Computer Science - - - 3.493 3.344 - 3.344
College of Liberal Arts - 2.355 3.064 2.969 2.903 2.861 2.884
College of Nursing & Health - - 3.041 3.501 - 3.306 3.403
College of Science & - 3.008 - 2.989 2.761 3.116 2.909 Mathematics
University College 2.042 2.559 - - 2.153 2.426 2.299
All Degree Undergraduates** 2.224 2.648 2.978 3.173 2.950 3.027 2.992
All**College Freshman Sophomore Junior Senior Men Women StudentsRaj Soin College of Business - - - - - - -
College of Education & HS - - - - - - -
College of Engineering & Computer Science - - - - - - -
College of Liberal Arts - - - 3.086 2.865 2.969 2.906
College of Nursing & Health - - - - - - -
College of Science & - - - - - 2.830 2.830 Mathematics
University College - - - - 2.478 2.472 2.474
All Degree Undergraduates** - 2.634 2.634 2.942 2.822 2.794 2.805
HISPANIC DEGREE STUDENTS
NATIVE AMERICAN DEGREE STUDENTS
* Does not include new freshmen students, transfer students or associate degree students**Includes GPA's that were not shown due to FERPA regulations
Note: A '-' indicates either a score omitted for privacy or no students in that category.

Asian African
American HispanicNative
American Asian African
American HispanicNative
American
Under 20 years 33% 41% 37% 30% 30 - 39 years 5% 6% 7% 6%20 - 24 years 52% 42% 43% 45% 40 + years 2% 3% 4% 9%25 - 29 years 7% 7% 9% 9%
Asian African
American HispanicNative
American % Asian African
American HispanicNative
American % Asian African
American HispanicNative
American %
Age
Under20 50 209 31 4 37% 56 435 39 12 41% 106 644 70 16 39%
20-24 79 238 44 12 47% 85 421 39 12 42% 164 659 83 24 44%
25-29 11 45 7 2 8% 12 69 10 3 7% 23 114 17 5 8%
30-39 6 34 4 1 6% 11 55 9 2 6% 17 89 13 3 6%
40-49 14 1 1 2% 3 24 5 3 3% 3 38 6 4 2%
50-59 1 3 0.5% 1 8 1 1% 2 11 1 1%
60-69 1 2 0.4% 1 1 1 0.2% 2 3 1 0.3%
70-79 0% 1 0.1% 1 0.05%
80+ 0% 1 0.1% 1 0.05%148 545 87 20 100% 169 1,014 104 33 100% 317 1,559 191 53 100%
Asian African
American HispanicNative
American Asian African
American HispanicNative
American
20 - 24 years 24% 19% 22% 14% 30 - 39 years 25% 31% 20% 29%25 - 29 years 39% 29% 35% 29% 40 + years 12% 21% 22% 29%
Asian African
American HispanicNative
American % Asian African
American HispanicNative
American % Asian African
American HispanicNative
American %
Age
20-24 19 19 3 19% 31 32 8 1 22% 50 51 11 1 21%
25-29 43 24 6 2 35% 38 55 11 32% 81 79 17 2 33%
30-39 25 35 4 30% 28 51 6 2 27% 53 86 10 2 28%
40-49 8 10 3 1 10% 11 30 4 1 14% 19 40 7 2 13%
50-59 7 1 4% 4 10 2 5% 4 17 3 4%
60-69 1 1 1% 1 1 1% 1 2 1 1%
70-79 0% 0% 0%
80+ 0% 0% 0%95 96 18 3 100% 113 179 31 4 100% 208 275 49 7 100%
Men Women All
Graduate/Professional
Undergraduates
Age of Minority Students
Men Women All

Miami County AsianAfrican
American HispanicNative
American Total Piqua 2 2 Troy 1 1Total 1 2 3
Montgomery County AsianAfrican
American HispanicNative
American Total Belmont 1 3 4 Brookville 1 1 Butler Senior 1 1 2 Centerville 4 3 1 8 Colonel White 21 1 22 Jefferson 3 3 John H Patterson 0 Kettering Fairmont 4 2 6 Meadowdale 12 12 Miami Valley 1 1 Miamisburg 2 1 1 4 Northmont 2 9 3 14 Oakwood 1 1 2 Paul Laurence Dunbar 8 8 Stivers School for the Arts 1 5 6 Trotwood-Madison 16 16 Walter E Stebbins 5 1 6 Wayne 9 11 2 22 West Carrollton 1 1Total 27 100 11 138
Clark County AsianAfrican
American HispanicNative
American Total Greenon 1 1 Northwestern 1 1 Shawnee 1 1 Springfield North 4 4 Springfield South 2 2Total 8 1 9
Greene County AsianAfrican
American HispanicNative
American Total Beavercreek 11 2 3 16 Bellbrook 1 1 1 3 Fairborn 4 6 1 2 13 Xenia 1 2 3 Yellow Springs 2 2Total 17 13 5 2 37
Private Schools AsianAfrican
American HispanicNative
American Total Archbishop Alter 1 1 Carroll 1 1 1 3 Catholic Central 1 1 Chaminade-Julienne 1 8 9 Dayton Christian 1 1 Dayton Early College 8 8 Dominion of Dayton 1 1 Mound Street 1 1 Troy Christian 1 1 Xenia Christian 1 1Total 3 20 3 1 27
AsianAfrican
American HispanicNative
American TotalOther Schools 24 284 21 9 338
Minority New Degree Seeking FreshmenHigh School Origin

Area of Study
Business AsianAfrican
American HispanicNative
American Total %
Accountancy 1 18 2 21Business Economics 2 6 8Finance 1 1Finance Services 1 1Human Resource Management 1 1International Business 1 1 2Management 6 1 7Management Information Systems 1 1 2Marketing 1 8 1 10Undeclared 3 23 1 27 Total 8 66 4 2 80 14.5%
Education & Human Services AsianAfrican
American HispanicNative
American Total %
Early Childhood: Pre K/Primary 5 2 7Athletic Training 3 8 11Middle Childhood 1 5 1 7K-12: Physical Education 2 2Rehabilitation Services 2 2Undeclared 1 5 6 Total 5 27 3 35 6.3%
AsianAfrican
American HispanicNative
American Total %
Biomedical Engineering 5 3 8Computer Engineering 4 8 2 14Computer Science 4 8 12Engineering 5 1 6Engineering Physics 1 1 2Electrical Engineering 6 6Industrial + Systems Engineering 1 1Mechanical Engineering 5 8 1 14 Total 19 40 3 1 63 11.4%
AsianAfrican
American HispanicNative
American Total %
Information Technology 1 1Office Info. Systems 1 1 Total 1 1 2 0.4%
Minority New Degree Seeking Freshmen
Engineering & Computer Science
Lake Campus-Associate Degree
Intended Area of Study

Area of Study
Liberal Arts AsianAfrican
American HispanicNative
American Total %
Acting 1 2 3Anthropology 1 1Art 1 2 1 4Communication Studies 9 2 11Criminal Justice 21 1 2 24English 1 8 1 10Eng: Language Arts Edu 1 1International Studies 1 1Liberal Studies 1 1Mass Communication 6 1 7Modern Languages 1 1Motion Pictures 1 4 1 6Music-No Audition-Pre 2 7 1 10Philosophy 1 1Political Science 1 7 1 1 10Social Science Education 2 1 3Social Work 7 7Sociology 3 3Spanish 2 2Theatre Arts Undecided 2 1 3Theatre Studies 3 3Urban Affairs 1 1 Total 10 84 16 3 113 20.5%
Nursing & Health AsianAfrican
American HispanicNative
American Total %
Nursing 3 53 7 2 65 11.8%
Science and Mathematics AsianAfrican
American HispanicNative
American Total %
Biological Sciences 13 37 3 53Chemistry 1 1 2Geological Science 2 2Environmental Science 2 2Clinical Laboratory Science 1 1Physics 1 1Psychology 1 37 1 1 40 Total 15 80 5 1 101 18.3%
AsianAfrican
American HispanicNative
American Total %Undeclared 12 77 4 93 16.8%
Total 72 427 40 13 552 100%
Minority New Degree Freshmen Intended Area of Study Continued

Minority New Degree Seeking Freshmen
A B H I Business 19% 16% 13% 0%Education 2% 7% 6% 13%Egr. & CS 17% 14% 6% 25%Lake Cam 0% 0% 6% 100%Liberal Ar 15% 17% 6% 300%Nursing & 4% 10% 13% 200%Science & 21% 19% 19% 25%Undecide 23% 18% 25% 38%
Asian Students Intended Area of Study N=72
Undecided17%
Nursing& Health
4%
Science & Math21%
Business11%
Education & HS7%
Egr. & CS26%
Liberal Arts14%
African American Students Intended Area of Study N=427
Undecided18%
Nursing & Health
12%
Science & Math19%
Business15%
Education & HS6%
Egr. & CS9%
Liberal Arts20%
Hispanic Students Intended Area of StudyN=40
Undecided10%
Lake Campus3%
Science & Math
13%
Business10%
Nursing & Health18%
Egr. & CS8%
Liberal Arts40%
Native American Students Intended Area of Study N=13
Science & Math8%
Nursing & Health15%
Lake Campus8%
Egr. & CS8%
Business15%
Education & HS23%
Liberal Arts23%

Minority New Degree Seeking FreshmenHigh School Rank and GPA*
Asian High School Rank High School GPAUpper 25% Upper 50% 3.0+ 2.5+
Intended Majors No. % No. % No. % No. %Business - - - - - - 5 63%Education - - - - - - - -Engineering 9 47% 10 53% 11 58% 14 74%Liberal Arts - - 6 60% - - 7 70%Nursing - - - - - - - -Science & Mathematics 6 40% 10 67% 10 67% 11 73%Undecided - - 9 75% 8 67% 11 92%
All Majors 30 42% 43 60% 42 58% 54 75%
African American High School Rank High School GPAUpper 25% Upper 50% 3.0+ 2.5+
Intended Majors No. % No. % No. % No. %Business 15 23% 35 53% 23 35% 46 70%Education 8 30% 12 44% 9 33% 15 56%Engineering 17 43% 23 58% 18 45% 28 70%Liberal Arts 20 24% 41 49% 32 38% 54 64%Nursing 11 21% 33 62% 14 26% 40 75%Science & Mathematics 28 35% 44 55% 35 44% 57 71%Undecided 13 17% 31 40% 18 23% 39 51%
All Majors 111 26% 219 51% 149 35% 279 65%
Hispanic High School Rank High School GPAUpper 25% Upper 50% 3.0+ 2.5+
Intended Majors No. % No. % No. % No. %Business - - - - - - - -Education - - - - - - - -Engineering - - - - - - - -Liberal Arts - - 10 63% 8 50% 12 75%Nursing - - - - - - 6 86%Science & Mathematics - - - - - - - -Undecided - - - - - - - -
All Majors 10 25% 20 50% 18 45% 29 73%
Native American High School Rank High School GPAUpper 25% Upper 50% 3.0+ 2.5+
Intended Majors No. % No. % No. % No. %Business - - - - - - - -Education - - - - - - - -Engineering - - - - - - - -Liberal Arts - - - - - - - -Nursing - - - - - - - -Science & Mathematics - - - - - - - -Undecided - - - - - - - -
All Majors - - 9 69% 10 77% 11 85%
All Minority Students High School Rank High School GPAUpper 25% Upper 50% 3.0+ 2.5+
Intended Majors No. % No. % No. % No. %Business 19 24% 41 51% 30 38% 56 70%Education 10 29% 16 46% 14 40% 20 57%Engineering 28 44% 37 59% 33 52% 46 73%Liberal Arts 29 26% 60 53% 47 42% 76 67%Nursing 15 23% 40 62% 21 32% 51 78%Science & Mathematics 35 35% 55 54% 48 48% 71 70%Undecided 16 17% 41 44% 26 28% 52 56%
All Majors 152 28% 291 53% 219 40% 373 68%
*Includes Ranks and GPA's that were not shown due to FERPA regulations
Note: A '-' indicates either a number omitted for privacy or no students in that categor

Minority New Degree Seeking Freshmen SAT Scores
AsianSAT Math SAT Verbal SAT Composite
Women Men All* Women Men All* Women Men All*Seventy-fifth percentile 580 610 610 580 550 580 1160 1100 1150Median 500 570 530 535 470 510 990 1050 1010Twenty-fifth percentile 420 530 460 440 420 430 950 990 950Overall mean 510.0 567.7 529.2 520.0 497.7 512.6 1028.1 1061.5 1039.2No. of Students 26 13 39 26 13 39 26 13 39
African AmericanSAT Math SAT Verbal SAT Composite
Women Men All* Women Men All* Women Men All*Seventy-fifth percentile 460 500 470 480 510 490 930 1000 940Median 410 440 420 430 450 435 840 890 860Twenty-fifth percentile 370 400 380 390 400 390 770 800 770Overall mean 419.6 453.4 428.5 441.1 466.2 447.7 862.2 916.6 876.5No. of Students 81 29 110 81 29 110 81 29 110
HispanicSAT Math SAT Verbal SAT Composite
Women Men All* Women Men All* Women Men All*Seventy-fifth percentile 460 - 550 460 - 490 890 - 1035Median 410 - 490 430 - 445 840 - 940Twenty-fifth percentile 410 - 410 410 - 410 820 - 830Overall mean 442.0 - 485.0 452.0 - 456.3 894.0 - 941.3No. of Students 5 - 8 5 - 8 5 - 8
Native AmericanSAT Math SAT Verbal SAT Composite
Women Men All* Women Men All* Women Men All*Seventy-fifth percentile - - - - - - - - -Median - - - - - - - - -Twenty-fifth percentile - - - - - - - - -Overall mean - - - - - - - - -No. of Students - - - - - - - - -
All Minority StudentsSAT Math SAT Verbal SAT Composite
Women Men All* Women Men All* Women Men All*Seventy-fifth percentile 490 550 520 510 520 510 970 1050 1000Median 420 500 440 450 470 450 885 990 900Twenty-fifth percentile 375 420 390 400 410 400 770 860 790Overall mean 441.6 496.0 457.7 459.9 480.2 465.9 902.1 973.2 923.1No. of Students 112 47 159 112 47 159 112 47 159
*Includes SAT scores that were not shown due to FERPA regulationsNote: A '-' indicates either a score omitted for privacy or no students in that category

All*Women Men Students
AsianSeventy-fifth percentile 23.0 26.0 25.0Median 21.0 22.5 21.0Twenty-fifth percentile 17.0 19.0 19.0Overall mean 20.6 22.5 21.6No. of Students 27 30 57
African AmericanSeventy-fifth percentile 22.0 23.0 22.0Median 19.0 21.0 19.0Twenty-fifth percentile 17.0 19.0 17.0Overall mean 19.2 20.6 19.8No. of Students 209 152 361
HispanicSeventy-fifth percentile 25.0 24.0 24.0Median 19.0 22.0 20.5Twenty-fifth percentile 16.0 18.0 17.0Overall mean 20.2 21.2 20.6No. of Students 19 15 34
Native AmericanSeventy-fifth percentile 27.0 - 24.0Median 23.5 - 22.0Twenty-fifth percentile 22.0 - 19.0Overall mean 23.8 - 21.6No. of Students 6 - 9
All Minority StudentsSeventy-fifth percentile 22.0 23.0 23.0Median 19.0 21.0 20.0Twenty-fifth percentile 17.0 19.0 17.0Overall mean 19.6 20.9 20.1No. of Students 261 200 461
*Includes ACT scores that were not shown due to FERPA regulationsNote: A '-' indicates either a score omitted for privacy or no students in that category
Minority New Degree Seeking Freshmen ACT Composite Scores

AsianAfrican
American HispanicNative
American Total
Tier 1Clark 8 1 9Greene 19 12 8 3 42Miami 1 3 4Montgomery 29 128 11 168Total 49 151 19 4 223
Tier 2Butler 1 10 1 12Champaign 1 1Clinton 1 1Darke 1 1PrebleWarren 4 4 2 2 12Total 5 15 5 2 27
Tier 3Auglaize 1 2 3Mercer 3 3Shelby 1 1 2Total 1 1 3 3 8
Tier 4Franklin 1 78 1 80Hamilton 3 102 1 106Total 4 180 2 186
Tier 5Total 2 51 2 55
Tier 6Total 6 19 2 4 31
Non-Ohio/Unreported*Total 5 10 7 22
96% of all new degree freshmen minorities come from Ohio43% of all new degree freshmen minorities are from the four counties:
Clark, Greene, Miami, and Montgomery
Ohio County of ResidenceMinority New Degree Seeking Freshmen
38 counties represented
*Not all students have a county reported

Retention and Graduation Rates-Minorities
First-time, Full-time, Degree Seeking Freshmen*
Cohort Cohort Head Average %Continued %Continued %Graduated %Continued %Graduated %Continued %Graduated %ContinuedType Year Count ACT to_2nd_Yr to_3rd_Yr in_4_Yrs to_5th_Yr in_5_Yrs to_6th_Yr in_6_Yrs to_7th_Yr
African American 1999 317 18.0 63.7% 49.2% 8.8% 32.8% 25.2% 12.6% 34.4% 2.8%African American 2000 274 17.5 68.6% 55.5% 12.0% 34.7% 29.9% 12.0% 36.5% 5.1%African American 2001 233 17.2 69.5% 51.9% 9.4% 36.1% 26.2% 16.3%African American 2002 256 17.7 57.8% 44.9% 10.2% 23.8%African American 2003 346 17.2 68.5% 49.1%African American 2004 398 17.6 66.1% 44.5%African American 2005 379 17.3 62.0%Hispanic 1999 19 21.1 47.4% 47.4% 10.5% 21.1% 21.1% 0.0% 21.1% 5.3%Hispanic 2000 14 19.2 50.0% 50.0% 14.3% 28.6% 28.6% 14.3% 35.7% 7.1%Hispanic 2001 27 19.7 63.0% 40.7% 18.5% 18.5% 29.6% 11.1%Hispanic 2002 10 18.5 70.0% 60.0% 10.0% 30.0%Hispanic 2003 23 20.5 91.3% 52.2%Hispanic 2004 21 23.1 71.4% 71.4%Hispanic 2005 34 19.5 67.6%Asian 1999 33 19.1 66.7% 60.6% 9.1% 39.4% 42.4% 6.1% 45.5% 3.0%Asian 2000 22 19.6 86.4% 72.7% 31.8% 36.4% 50.0% 9.1% 50.0% 9.1%Asian 2001 45 20.4 66.7% 62.2% 15.6% 31.1% 42.2% 4.4%Asian 2002 51 21.6 80.4% 58.8% 15.7% 27.5%Asian 2003 41 21.2 80.5% 65.9%Asian 2004 55 22.1 81.8% 72.7%Asian 2005 59 19.9 88.1%Native American 1999 6 20.2 33.3% 66.7% 16.7% 33.3% 33.3% 0.0% 33.3% 0.0%Native American 2000 8 20.4 87.5% 50.0% 0.0% 12.5% 12.5% 0.0% 12.5% 0.0%Native American 2001 5 21.4 80.0% 40.0% 0.0% 20.0% 0.0% 20.0%Native American 2002 7 21.1 42.9% 42.9% 28.6% 14.3%Native American 2003 13 21.9 69.2% 53.8%Native American 2004 9 18.8 66.7% 44.4%Native American 2005 6 17.5 83.3%
-- Continuation Rates -- --------- Cumulative Graduation Rates and Continuation Rates ----------
*Main Campus onlyIncludes direct and not direct from high school students

Retention and Graduation Rates-MinoritiesDegree Seeking Transfer Students*
Cohort Cohort Head % %Cont %Grad %Cont %Grad %Cont %Grad %Cont %Grad %Cont %Grad %ContType Year Count Part_time to_2nd_Yr in_2_Yrs to_3rd_Yr in_3_Yrs to_4th_Yr in_4_Yrs to_5th_Yr in_5_Yrs to_6th_Yr in_6_Yrs to_7th_Yr
African American 1999 17 47.1% 64.7% 11.8% 23.5% 29.4% 11.8% 29.4% 17.6% 29.4% 11.8% 29.4% 5.9%African American 2000 7 14.3% 71.4% 14.3% 42.9% 14.3% 28.6% 14.3% 14.3% 42.9% 14.3% 42.9% 0.0%African American 2001 12 25.0% 83.3% 0.0% 75.0% 0.0% 33.3% 66.7% 8.3% 75.0% 0.0%African American 2002 11 36.4% 54.5% 0.0% 45.5% 18.2% 36.4% 36.4% 18.2%African American 2003 9 22.2% 44.4% 11.1% 44.4% 22.2% 22.2%African American 2004 21 23.8% 66.7% 0.0% 52.4%African American 2005 21 33.3% 61.9%Hispanic 1999 2 100.0% 50.0% 0.0% 0.0% 0.0% 0.0% 0.0% 0.0% 0.0% 0.0% 0.0% 0.0%Hispanic 2000 0Hispanic 2001 0Hispanic 2002 3 33.3% 100.0% 66.7% 33.3% 100.0% 0.0% 100.0% 0.0%Hispanic 2003 2 50.0% 50.0% 50.0% 50.0% 50.0% 50.0%Hispanic 2004 1 0.0% 100.0% 0.0% 0.0%Hispanic 2005 2 0.0% 50.0%Asian 1999 4 25.0% 75.0% 0.0% 50.0% 0.0% 50.0% 50.0% 0.0% 50.0% 0.0% 50.0% 0.0%Asian 2000 4 75.0% 25.0% 0.0% 0.0% 0.0% 0.0% 0.0% 0.0% 0.0% 0.0% 0.0% 0.0%Asian 2001 4 50.0% 75.0% 0.0% 75.0% 25.0% 50.0% 50.0% 0.0% 50.0% 0.0%Asian 2002 8 0.0% 100.0% 4.0% 50.0% 75.0% 12.5% 75.0% 0.0%Asian 2003 5 0.0% 60.0% 0.0% 60.0% 20.0% 20.0%Asian 2004 4 75.0% 50.0% 0.0% 75.0%Asian 2005 3 0.0% 66.7%Native American 1999 1 100.0% 100.0% 0.0% 100.0% 100.0% 0.0% 100.0% 0.0% 100.0% 0.0% 100.0% 0.0%Native American 2000 1 100.0% 100.0% 0.0% 100.0% 100.0% 0.0% 100.0% 0.0% 100.0% 0.0% 100.0% 0.0%Native American 2001 0Native American 2002 2 100.0% 50.0% 0.0% 50.0% 0.0% 100.0% 50.0% 50.0%Native American 2003 2 0.0% 100.0% 0.0% 100.0% 50.0% 50.0%Native American 2004 0 0.0% 0.0% 0.0% 0.0%Native American 2005 2 0.0% 100.0%
*Degree Seeking Transfer students include:Full and Part-time studentsMain Campus students onlyStudents entering WSU for the first time onlyStudents who have ONLY attended community college(s) or 2 year institution(s)Students transferring at least 45 quarter hours (30 semester hours)Students who enrolled in the fall term who attended for the first time in the prior summer termStudents who entered with advance standing (college credit earned before graduation from high school)
---------------------------------------- Cumulative Graduation Rates and Continuation Rates ----------------------------------------

Freshman Soph. Junior Senior TotalRaj Soin College of Business 1 1College of Education & Human Services 1 1College of Engr. & Computer Science 1 1College of Liberal Arts 1 1 2College of Nursing & Health 1 1 2College of Science & Mathematics 2 2 2 6University College 3 2 1 6Associate Degree Total All Degree Programs 4 4 8 3 19
Non-Degree Students 2 1 3
All Undergraduates 6 4 8 4 22
Colleges and UniversitiesDegree Seeking Transfer Students
No. of No. ofOhio Public/Community/Technical Colleges Students Ohio Public Universities/Regional Campuses StudentsClark State Community College 1 Cleveland State University 1Columbus State Community College 1 Kent State University 1Edison State Community College 1 Miami University- Hamilton Camp. 1Sinclair Community College 5 Ohio University 1Sub-Total 8 Sub-Total 4
No. of No. ofOhio Private Universities/Regional Campuses Students Out of State StudentsHiram College 1University of Findlay 1 Other States 8Sub-Total 2 Sub-Total 8
TOTAL 22
Asian Transfer Students

Freshman Soph. Junior Senior TotalRaj Soin College of Business 2 1 3College of Education & Human Services 3 2 5College of Engr. & Computer Science 1College of Liberal Arts 1 5 6 3 15College of Nursing & Health 1 2 2 5College of Science & Mathematics 4 2 2 3 11University College 29 17 4 50Associate Degree Total All Degree Programs 34 25 20 11 89
Non-Degree Students 2 2
All Undergraduates 36 25 20 11 92
Colleges and UniversitiesDegree Seeking Transfer Students
No. of No. ofOhio Public/Community/Technical Colleges Students Ohio Private Colleges/Universities StudentsCinn. St. Tech. & Comm. Coll. 2 Capital University 1Clark State Community College 6 Myers University 1Columbus State Community College 2 Tiffin University 2Cuyahoga Community College 1 Wilmington College 1James A. Rhodes State College 1 Wilberforce University 1Sinclair Community College 26 Wittenberg University 2Sub-Total 38 Sub-Total 8
No. of No. ofOhio Public Universities/Regional Campuses Students Out of State StudentsBowling Green State University 3 Kentucky 2Central State University 3 Michigan 3Kent State University 1 Pennsylvania 2Miami University 1Ohio State University 4 Other States 16Ohio University 1 Sub-Total 23Shawnee State University 1University of Akron 1University of Cincinnati 5University of Toledo 2Youngstown State University 1Sub-Total 23 TOTAL 92
African American Transfer Students

Freshman Soph. Junior Senior TotalRaj Soin College of BusinessCollege of Education & Human ServicesCollege of Engr. & Computer ScienceCollege of Liberal Arts 1 1 2College of Nursing & Health 1 1College of Science & Mathematics 1 2 3University College 4 4 1 9Associate Degree Total All Degree Programs 4 6 4 1 15
Non-Degree Students
All Undergraduates 4 6 4 1 15
Colleges and UniversitiesDegree Seeking Transfer Students
No. of No. ofOhio Public/Community/Technical Colleges Students Ohio Public Universities/Regional Campuses StudentsClark State Community College 1 Miami University- Hamilton Camp 1Columbus State Comm College 1 Ohio State University 1Sinclair Community College 3 Sub-Total 2Sub-Total 5
No. ofNo. of Out of State Students
Ohio Private Colleges/Universities Students Indiana 1Wilmington College 1 Michigan 1Sub-Total 1
Other States 5Sub-Total 7
TOTAL 15
Hispanic Transfer Students

Freshman Soph. Junior Senior TotalRaj Soin College of BusinessCollege of Education & Human ServicesCollege of Engr. & Computer ScienceCollege of Liberal Arts 1 1College of Nursing & HealthCollege of Science & Mathematics 1 1University College 1 1Associate Degree Total All Degree Programs 1 1 1 3
Non-Degree Students
All Undergraduates 1 1 1 3
Colleges and UniversitiesDegree Seeking Transfer Students
No. of No. ofOhio Public Universities/Regional Campuses Students Out of State StudentsUniversity of Toledo 1Sub-Total 1 Other States 2
Sub-Total 2
TOTAL 3
Native American Transfer Students

Associate 1 1Bachelor's 47 163 20 8 238Master's 41 60 18 2 121Doctor of Philosophy 11 11Doctor of Medicine 13 6 2 21Doctor of Professional Psychology 3 4 7TOTAL 115 234 40 10 399
Raj Soin College of Business 10 27 7 1 45College of Education 3 46 4 2 55 & Human ServicesCollege of Engineering & 9 7 16 Computer ScienceCollege of Liberal Arts 9 45 5 1 60College of Nursing & Health 3 18 1 2 24College of Science & Math 13 20 3 2 38TOTAL 47 163 20 8 238
Raj Soin College of Business 13 6 3 1 23College of Education 3 25 8 1 37 & Human ServicesCollege of Engineering & 14 5 19 Computer Science 16 16College of Liberal Arts 2 3 5College of Nursing & Health 4 2 6College of Science & Math 8 4 2 14School of Medicine (Masters) 1 1TOTAL 18 121
Total
AsianAfrican
American Hispanic
AsianAfrican
American HispanicNative
American
HispanicNative
American
Bachelor's Degrees
Master's Degrees
41 60 2
Degrees Awarded to Minority StudentsJuly 1, 2006 - June 30, 2007
Total
Total
Native American
AsianAfrican
American

Degrees Awarded to Minorities by College
Bachelor Degrees Awarded
0
10
20
30
40
50
60
70
RSCOBA CEHS CECS COLA CONH COSM
Asian African American Hispanic Native American
Master's Degrees Awarded
0
5
10
15
20
25
30
35
40
RSCOBA CEHS CECS COLA CONH COSM SOM
Asian African American Hispanic Native American

Degrees Awardedby Ethnicity
July 1, 2006 - June 30, 2007
Caucasian 1,887 81.7% 895 74.1%African American 164 7.1% 70 5.8%Hispanic 20 0.9% 20 1.7%Foreign 27 1.2% 121 10.0%Native American 8 0.3% 2 0.17%Asian 47 2.0% 68 5.6%Unknown 158 6.8% 32 2.6%
Total 2,311 100% 1,208 100%
Graduate/ProfessionalUndergraduate
Undergraduate Degree Distribution
Caucasian81.7%
Other18.3% Native American
0.3%
Asian 1.4%
Foreign 1.0%
Unknown 5.7%
Hispanic 0.7%
African American7.1%
Graduate/Professional Degree Distribution
Caucasian74.1%
Asian5.6%
Unknown2.6%
Other25.9%
Hispanic1.7%
African American5.8%
Foreign10.0%
Native American0.2%

Longitudinal InformationFall Quarters 2002 - 2007
Lake Campus

2002 2003 2004 2005 2006 2007
Total Enrollment 1,122 1,061 995 910 864 845
Full-Time 624 673 583 590 570 56256% 63% 59% 65% 66% 67%
Part-Time 498 388 412 320 294 28344% 37% 41% 35% 34% 33%
Men 342 314 312 284 296 30330% 30% 31% 31% 34% 36%
Women 780 747 683 626 568 54270% 70% 69% 69% 66% 64%
Degree 872 868 807 743 713 70878% 82% 81% 82% 83% 84%
Non-Degree 250 193 188 167 151 13722% 18% 19% 18% 17% 16%
Degree Students Freshmen 313 312 323 275 271 244 Sophomore 184 181 157 160 136 135 Junior 133 119 97 88 101 92 Senior 131 142 138 139 127 117 Master's 107 109 87 78 78 120 Unclassified 4 5 5 3
Continuing 632 615 568 510 483 477
Readmitted 91 71 55 62 42 44
Transfer 52 55 43 45 48 47
New 347 320 329 293 291 277
1,122 1,061 995 910 864 845
Lake Campus Headcount Enrollment

Lake Campus Headcount Enrollment (cont'd)
2002 2003 2004 2005 2006 2007
Associate Degree Students 152 136 130 130 132 124
University College Degree Students 399 428 409 346 308 286
Non-Degree Students 250 193 188 167 151 137
Admitted to a Bachelor's Degree Program 214 195 181 189 195 178
Bachelor's Degree ProgramsRaj Soin College of Business 19 6 4 10 16 12College of Education & HS 142 151 136 138 128 124College of Engineering & Computer Science 2 1 1 2 1College of Liberal Arts 19 11 12 13 21 12College of Nursing & Health 14 18 19 19 17 16College of Science & Mathematics 18 9 9 8 11 13
Degree Graduate Students 107 109 87 78 78 120
1,122 1,061 995 910 864 845
Average Credit Hour Load 9.84 10.92 10.35 10.61 10.29 10.29Full-Time 14.26 14.7 14.27 14.22 12.78 12.67Part-Time 5.18 6.01 5.40 5.67 5.46 5.57
Undergraduate FTE 692.01 723.13 654.10 611.40 558.33 526.80Graduate FTE 43.97 49.04 32.33 32.40 34.33 53.07
Total FTE 735.98 772.17 686.43 643.80 592.66 579.87
Associate's Degrees Awarded 71 68 79 79 72 69

Longitudinal InformationFall Quarters 2002 - 2007
Total University

2002 2003 2004 2005 2006 2007Main Campus 15,446 15,694 15,985 16,207 16,088 16,151
Lake Campus 1,122 1,061 995 910 864 845
Total University 16,517 16,729 16,944 17,074 16,870 16,913 (Unduplicated)
Full-Time 12,063 12,852 13,142 13,261 13,225 13,304 Percent 73% 77% 78% 78% 78% 79%
Part-Time 4,454 3,877 3,802 3,813 3,645 3,609 Percent 27% 23% 22% 22% 22% 21%
Men 7,014 7,034 7,131 7,271 7,242 7,354 Percent 42% 42% 42% 43% 43% 43%
Women 9,503 9,695 9,813 9,803 9,628 9,559 Percent 58% 58% 58% 57% 57% 57%
Undergraduate 12,531 12,708 13,001 13,058 12,934 12,938 Percent 76% 76% 77% 76% 77% 76%
Graduate 3,497 3,528 3,444 3,502 3,419 3,439 Percent 21% 21% 20% 21% 20% 20%
Professional 489 493 499 514 517 536 Percent 3% 3% 3% 3% 3% 3%
Degree Seeking Undergraduates
Freshman 3,779 3,820 3,889 3,890 3,942 3,898 Percent (of all 30% 30% 30% 30% 30% 30% undergraduates)
Sophomore 2,392 2,419 2,465 2,374 2,289 2,280 Percent 19% 19% 19% 18% 18% 18%
Junior 2,233 2,350 2,351 2,374 2,288 2,348 Percent 18% 18% 18% 18% 18% 18%
Senior 3,392 3,505 3,652 3,761 3,825 3,917 Percent 27% 28% 28% 29% 30% 30%
Unclassified 25 32 31 13 0 0 Percent 0.2% 0.3% 0.2% 0.1% 0% 0%
Total Undergraduates 11,821 12,126 12,388 12,412 12,344 12,443 Percent (of all degree 78% 77% 78% 78% 78% 78% seeking students)
Total University Headcount Enrollment

Total University Headcount Enrollment cont'd.
2002 2003 2004 2005 2006 2007
Graduate Degree Seeking Students
Master's 2,653 2,833 2,758 2,789 2,773 2,808 Percent (of all 67% 70% 70% 69% 70% 71% graduate/professional students)
Educational Specialist 4 5 5 5 1 2 Percent 0.1% 0.1% 0.1% 0.1% 0.03% 0.1%
Medicine 355 366 371 381 398 412 Percent 9% 9% 9% 9% 10% 10%
Professional Psychology 134 127 128 133 119 124 Percent 1% 1% 1% 1% 1% 1%
Doctor of Philosophy 171 196 223 223 227 254 Percent 1% 1% 2% 2% 2% 2%
Total 3,317 3,527 3,485 3,531 3,518 3,600 Percent (of all 22% 23% 22% 22% 22% 22% degree seeking students)
Grand Total Degree Seeking Students 15,138 15,653 15,873 15,943 15,862 16,043 Percent of all Students 92% 94% 94% 93% 94% 95% (degree and non-degree)
Non-Degree Seeking Students
Undergraduate 710 582 613 646 590 495 Percent (of all non-degree 51% 54% 57% 57% 59% 57%seeking students)Graduate 669 494 458 485 418 375 Percent (of all non-degree 49% 46% 43% 43% 41% 43%seeking students)
Grand Total Non-Degree Seeking Students 1,379 1,076 1,071 1,131 1,008 870 Percent of all Students 8% 6% 6% 7% 6% 5%

2002 2003 2004 2005 2006 2007
TOTAL 73% 77% 78% 78% 78% 79%
Men 75% 79% 79% 78% 80% 81%
Women 71% 75% 77% 77% 77% 77%
Undergraduates 81% 83% 83% 84% 84% 84%
Master's 43% 49% 51% 49% 52% 51%
Professional/Doctoral 93% 94% 94% 94% 94% 93%
2002 2003 2004 2005 2006 2007
TOTAL 27% 23% 22% 22% 22% 21%
Men 25% 21% 21% 22% 20% 19%
Women 29% 25% 23% 23% 23% 23%
Undergraduates 19% 17% 17% 16% 16% 16%
Master's 57% 51% 49% 51% 48% 49%
Professional/Doctoral 7% 6% 6% 6% 6% 7%
2002 2003 2004 2005 2006 2007
Undergraduate 11,068.47 11,538.40 11,684.17 11,688.53 11,584.00 11,716.93
Master's 1,429.07 1,529.10 1,544.80 1,573.13 1,586.27 1,574.87
Doctoral 130.60 156.20 172.00 167.27 173.70 185.53
Professional 543.93 556.60 564.00 587.00 599.20 612.60
TOTAL 13,172.07 13,780.30 13,964.97 14,015.93 13,943.17 14,089.93
* Student Credit Hours divided by 15
Full-Time / Part-Time
Full-Time
Part-Time
Full-Time Equivalent Students*

2002 2003 2004 2005 2006 2007Degree Seeking Students
New Undergraduate Students 2,375 2,483 2,519 2,509 2,383 2,547 Percent of all degree students 16% 16% 16% 16% 15% 16%
New Graduate and Professional Students 713 694 689 733 839 866 Percent of all degree students 5% 4% 4% 5% 5% 5%
Transfer Students 898 915 935 934 952 933 Percent of all degree students 6% 6% 6% 6% 6% 6%
Continuing Students 10,440 10,832 11,079 11,116 11,109 11,255 Percent of all degree students 69% 69% 70% 70% 70% 70%
Readmitted Students 712 729 651 651 579 442 Percent of all degree students 5% 5% 4% 4% 4% 3%
Total Degree Seeking Students 15,138 15,653 15,873 15,943 15,862 16,043
Non-Degree Seeking Students
New Undergraduate Students 289 305 354 409 324 235 Percent of all non degree students 21% 28% 33% 36% 32% 27%
New Graduate/Professional Students 233 182 168 183 137 162 Percent of all non degree students 17% 17% 16% 16% 14% 19%
Transfer Students 158 67 63 33 95 93 Percent of all non degree students 11% 6% 6% 3% 9% 11%
Continuing Students (Includes Spec. Grads) 422 407 302 337 348 317 Percent of all non degree students 31% 38% 28% 30% 35% 36%
Readmitted Students 277 115 184 169 104 63 Percent of all non degree students 20% 11% 17% 15% 10% 7%
Total Non-Degree Seeking Students 1,379 1,076 1,071 1,131 1,008 870
Entrance Status

2002 2003 2004 2005 2006 2007
Raj Soin College of Business 1,375 1,270 1,178 1,146 1,211 1,203College of Ed. and Human Services 854 1,090 1,187 1,268 1,280 1,275College of Engineering and Computer Science 658 661 632 632 622 678College of Liberal Arts 1,968 2,009 2,096 2,204 2,243 2,260College of Nursing and Health 481 579 676 710 689 734College of Science and Mathematics 1,255 1,212 1,206 1,320 1,314 1,289University College 5,077 5,165 5,278 4,999 4,847 4,876Lake Campus/ Associate Degree 153 140 135 133 138 128TOTAL 11,821 12,126 12,388 12,412 12,344 12,443
2002 2003 2004 2005 2006 2007
Raj Soin College of Business 432 470 442 455 448 491College of Ed. and Human Services 1,059 1,151 1,106 1,116 1,087 1,068College of Engineering and Computer Science 618 636 587 555 525 580College of Liberal Arts 253 279 298 304 310 279School of Medicine 371 380 405 429 475 514College of Nursing and Health 150 158 169 195 203 199School of Professional Psychology 134 127 128 133 119 124College of Science and Mathematics 300 326 350 344 351 345TOTAL 3,317 3,527 3,485 3,531 3,518 3,600
2002 2003 2004 2005 2006 2007
Raj Soin College of Business 1,807 1,740 1,620 1,601 1,659 1,694College of Ed. and Human Services 1,913 2,241 2,293 2,384 2,367 2,343College of Engineering and Computer Science 1,276 1,297 1,219 1,187 1,147 1,258College of Liberal Arts 2,221 2,288 2,394 2,508 2,553 2,539School of Medicine 371 380 405 429 475 514College of Nursing and Health 631 737 845 905 892 933School of Professional Psychology 134 127 128 133 119 124College of Science and Mathematics 1,555 1,538 1,556 1,664 1,665 1,634University College 5,077 5,165 5,278 4,999 4,847 4,876Lake Campus 153 140 135 133 138 128TOTAL 15,138 15,653 15,873 15,943 15,862 16,043
Degree Undergraduate Headcount Enrollment by College/School
Degree Graduate/Professional Headcount Enrollment by College/School
Degree Headcount Enrollment by College Total/School

2002 2003 2004 2005 2006 2007Undergraduate StudentsRaj Soin College of Business* 1,375 1,270 1,178 1,146 1,211 1,203 University College 880 812 840 901 878 821 TOTAL 2,255 2,082 2,018 2,047 2,089 2,024
College of Ed. & Hum. Services 854 1,090 1,187 1,268 1,280 1,275 University College 962 1,025 1,011 962 854 730 TOTAL 1,816 2,115 2,198 2,230 2,134 2,005
College of Engineering and Computer Science * 658 661 632 632 622 678 University College 648 579 584 516 544 566 TOTAL 1,306 1,240 1,216 1,148 1,166 1,244
College of Liberal Arts * 1,968 2,009 2,096 2,204 2,243 2,260 University College 669 804 883 897 840 866 TOTAL 2,637 2,813 2,979 3,101 3,083 3,126
College of Nursing and Health * 481 579 676 710 689 734 University College 308 477 541 567 659 615 TOTAL 789 1,056 1,217 1,277 1,348 1,349
College of Science & Math* 1,255 1,212 1,206 1,320 1,314 1,289 University College 382 457 478 413 475 502 TOTAL 1,637 1,669 1,684 1,733 1,789 1,791
Master's Degree StudentsRaj Soin College of Business 432 470 442 455 448 491
College of Ed. & Hum. Services 1,054 1,148 1,104 1,114 1,086 1,066
College of Engineering and Computer Science 520 527 470 439 411 449
College of Liberal Arts 253 279 298 304 310 304
College of Nursing and Health 150 158 169 195 203 199
College of Science & Math 226 238 244 237 238 222
School of Medicine 16 20 38 52 77 102
* Admitted to the College
All Students by College

2002 2003 2004 2005 2006 2007Accountancy* (110) 236 219 217 204 222 216 University College (610) 88 84 87 103 120 138 Pre-Accountancy* (171) 48 51 56 72 73 83 TOTAL 372 354 360 379 415 437Business Economics* (120) 17 28 16 17 22 20 University College (620) 28 40 38 31 83 68 Pre-Business Economics* (172) 15 9 10 9 6 10 TOTAL 60 77 64 57 111 98Finance* (130) 72 70 78 62 80 85 University College (630) 33 27 20 25 42 32 Pre-Finance* (173) 19 17 29 16 29 32 TOTAL 124 114 127 103 151 149Financial Services* (131) 59 48 35 35 46 52 University College (631) 22 12 10 7 11 7 Pre-Financial Services* (174) 9 4 10 12 6 6 TOTAL 90 64 55 54 63 65Human Resource Management* (157) 44 30 41 31 44 40 University College (657) 7 14 14 14 24 24 Pre-Human Resources Mgt* (179) 32 7 8 11 6 12 TOTAL 83 51 63 56 74 76International Business* (146) 27 33 28 21 26 33 University College (646) 18 26 31 42 34 38 Pre-International Business* (181) 28 18 15 15 23 14 TOTAL 73 77 74 78 83 85Management* (150) 90 97 92 113 125 129 University College (650) 51 58 62 82 114 98 Pre-Management* (175) 32 29 42 37 47 42 TOTAL 173 184 196 232 286 269Management Info. Systems* (154) 277 223 163 132 120 98 University College (654) 104 70 38 49 57 42 Pre-MIS* (177) 76 61 51 37 45 36 TOTAL 457 354 252 218 222 176Marketing* (160) 176 172 152 149 142 145 University College (660) 91 69 82 92 122 109 Pre-Marketing* (176) 36 53 46 48 39 57 TOTAL 303 294 280 289 303 311Operations Management* (180) 32 31 19 23 21 21 University College (680) 9 3 5 4 10 10 Pre-Operations Management* (178) 3 7 7 4 5 5 TOTAL 44 41 31 31 36 36Undeclared* (100) 19 17 10 26 7 8 University College (600) 219 214 217 268 261 255 Pre-Business Undeclared* (170) 47 37 48 67 69 53 TOTAL 285 268 275 361 337 316
Adult and Transfer 210 183 214 160
Conditional* (169) 6 9 5 5 8 6
Developmental Education 12 22 24
TOTAL BUSINESS * 1,055 977 856 818 863 853 University College 880 812 840 901 878 821 Pre-Business* 345 293 322 328 348 350
GRAND TOTAL 2,280 2,082 2,018 2,047 2,089 2,024
* Admitted to the Raj Soin College of Business
Undergraduate Majors
Raj Soin College of Business

Undergraduate Majors cont'd.
2002 2003 2004 2005 2006 2007Elementary Education Early Childhood* (231) 355 345 339 293 270 245 University College (731) 372 370 355 356 396 305 Total 727 715 694 649 666 550
Middle Childhood* (225) 95 249 330 378 365 350 University College (725) 130 122 109 114 128 112 Total 225 371 439 492 493 462
Classroom Teacher Adolesc Young Adult 6 14 Middle Childhood 2 9 Total 8 23
General* University College 1 Total 1
Humanities/English* 1 University College 0 Total 1
Language* (201) 1 University College 3 0 Total 3 1
Physical Education* (207) 75 46 55 43 45 44 University College (707) 87 83 70 59 71 62 Total 162 129 125 102 116 106
Rehabilitation Services* (203) 44 40 47 69 71 88 University College (703) 10 20 17 24 34 13 Total 54 60 64 93 105 101
Integrated Business* (210) 6 9 19 13 7 5 University College (710) 2 3 8 8 4 2 Total 8 12 27 21 11 7
English* 2 University College 0 Total 2
Marketing Education* (209) 1 1 1 University College (709) 1 1 1 1 1 0 Total 1 1 2 1 2 1
Modern Language* 1 University College 0 Total 1
Multi-Age Education* 1 2 University College 0 0 Total 1 2
History* University College (709) 1 Total 1
Social Studies Comp* 1 University College 1 Total 2
* Admitted to the College of Education & Human Services
College of Education & Human Services

Undergraduate Majors cont'd.
2002 2003 2004 2005 2006 2007Mathematics* University College 1 Total 1
Biology* 1 University College 0 Total 1
Sign Language Interpreter* 18 23 University College 2 1 Total 20 24
Science Education* University College (919) 6 4 Total 6 4
Athletic Training* (236) 40 41 49 52 47 University College (736) 1 18 27 57 51 Total 41 59 76 109 98
Pre-Teacher Education* (204) 52 70 41 33 32 23
Special EducationHistory* (713) University College 2 Total 2
Mathematics* (714) University College 3 2 Total 3 2
Teacher Certification* (254) 4 2 1
Organizational Leadership* (206) 184 261 284 354 377 396 University College 36 45 63 103 123 134 Total 220 306 347 457 500 530
Vocational Education* (215) 11 22 27 36 32 27 University College 0 0 0 0 0 0 Total 11 22 27 36 32 27
Vocational Endorsements* (216) 21 4 1 University College 0 0 0 Total 21 4 1
Undeclared Major* (200) 1 1 1 1 University College (700) 62 64 39 27 38 50 Total 63 65 40 27 38 51
Adult & Transfer 258 309 292 215
Developmental Education 31 24
TOTAL EDUCATION * 853 1,090 1,187 1,268 1,280 1,275 University College 964 1,024 1,011 962 854 730
GRAND TOTAL 1,817 2,114 2,198 2,230 2,134 2,005
* Admitted to the College of Education & Human Services
College of Education & Human Services
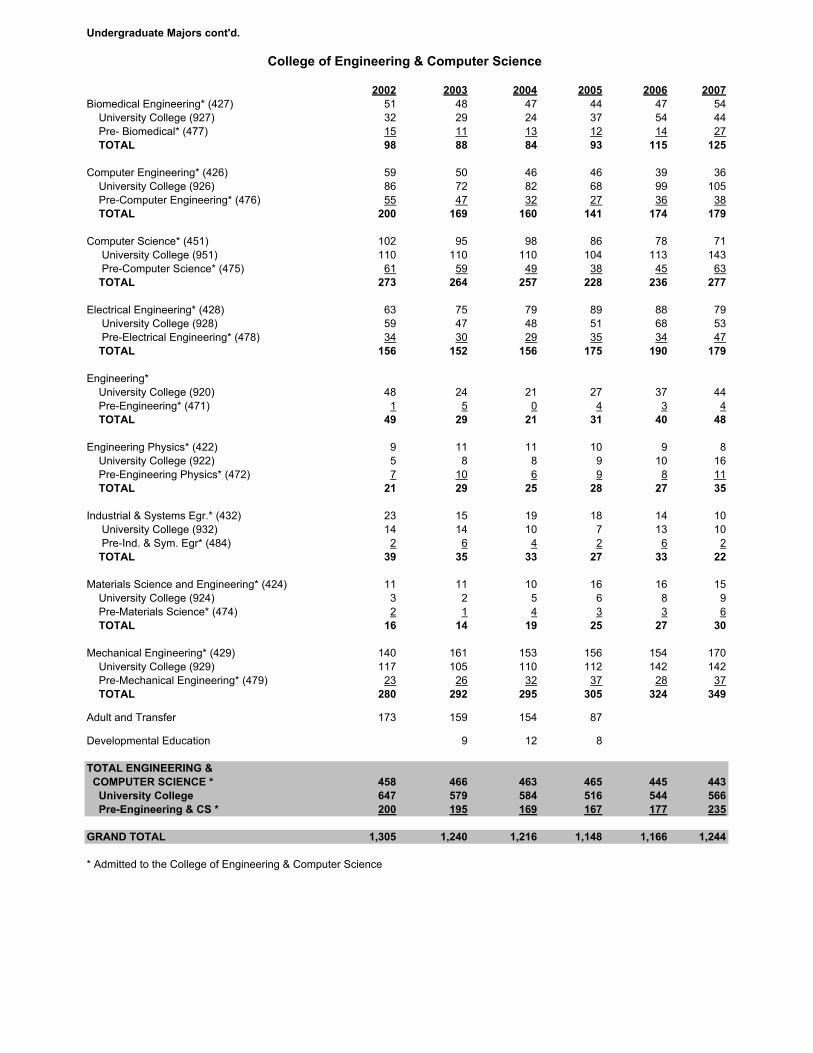
Undergraduate Majors cont'd.
2002 2003 2004 2005 2006 2007Biomedical Engineering* (427) 51 48 47 44 47 54 University College (927) 32 29 24 37 54 44 Pre- Biomedical* (477) 15 11 13 12 14 27 TOTAL 98 88 84 93 115 125
Computer Engineering* (426) 59 50 46 46 39 36 University College (926) 86 72 82 68 99 105 Pre-Computer Engineering* (476) 55 47 32 27 36 38 TOTAL 200 169 160 141 174 179
Computer Science* (451) 102 95 98 86 78 71 University College (951) 110 110 110 104 113 143 Pre-Computer Science* (475) 61 59 49 38 45 63 TOTAL 273 264 257 228 236 277
Electrical Engineering* (428) 63 75 79 89 88 79 University College (928) 59 47 48 51 68 53 Pre-Electrical Engineering* (478) 34 30 29 35 34 47 TOTAL 156 152 156 175 190 179
Engineering* University College (920) 48 24 21 27 37 44 Pre-Engineering* (471) 1 5 0 4 3 4 TOTAL 49 29 21 31 40 48
Engineering Physics* (422) 9 11 11 10 9 8 University College (922) 5 8 8 9 10 16 Pre-Engineering Physics* (472) 7 10 6 9 8 11 TOTAL 21 29 25 28 27 35
Industrial & Systems Egr.* (432) 23 15 19 18 14 10 University College (932) 14 14 10 7 13 10 Pre-Ind. & Sym. Egr* (484) 2 6 4 2 6 2 TOTAL 39 35 33 27 33 22
Materials Science and Engineering* (424) 11 11 10 16 16 15 University College (924) 3 2 5 6 8 9 Pre-Materials Science* (474) 2 1 4 3 3 6 TOTAL 16 14 19 25 27 30
Mechanical Engineering* (429) 140 161 153 156 154 170 University College (929) 117 105 110 112 142 142 Pre-Mechanical Engineering* (479) 23 26 32 37 28 37 TOTAL 280 292 295 305 324 349
Adult and Transfer 173 159 154 87
Developmental Education 9 12 8
TOTAL ENGINEERING & COMPUTER SCIENCE * 458 466 463 465 445 443 University College 647 579 584 516 544 566 Pre-Engineering & CS * 200 195 169 167 177 235
GRAND TOTAL 1,305 1,240 1,216 1,148 1,166 1,244
* Admitted to the College of Engineering & Computer Science
College of Engineering & Computer Science

Undergraduate Majors cont'd.
2002 2003 2004 2005 2006 2007Art and Art History* (369, 371, 372, 368) 123 151 176 171 166 176 University College (869, 871, 872, 868) 39 39 41 47 43 46 TOTAL 162 190 217 218 209 222
Selected Studies* (306) 1 1 University College 0 0 TOTAL 1 1
African American Studies* (308) 5 4 3 3 5 12 University College (808) 0 0 0 2 0 0 TOTAL 5 4 3 5 5 12
Classical Humanities* (320) 11 9 10 15 14 14 University College (820) 1 2 2 1 1 4 TOTAL 22 19 18 26 25 42
Communications* (312, 313, 314, 315) 335 314 282 302 295 324 University College (812, 814, 815) 117 105 128 131 149 127 TOTAL 452 419 410 433 444 451
Economics* (330) 29 20 20 18 13 15 University College (830) 3 2 3 4 4 2 TOTAL 32 22 23 22 17 17
English* (350) 151 148 168 198 228 225 University College (850) 24 30 34 45 37 43 TOTAL 175 178 202 243 265 268
English Lan. Arts Edu* (346) 68 67 78 87 84 78 University College (846) 12 22 20 27 12 18 TOTAL 80 89 98 114 96 96
Geography* (331) 23 13 6 9 11 18 University College (831) 2 4 2 1 1 2 TOTAL 25 17 8 10 12 20
History* (332) 88 83 96 127 130 117 University College (832) 19 23 33 23 40 31 TOTAL 107 106 129 150 170 148
International Studies* (304) 40 44 57 59 70 72 University College (804) 10 9 8 15 14 16 TOTAL 50 53 65 74 84 88
Languages* (321, 322, 360, 361, 362, 363) 51 59 66 77 93 92 University College (860, 861, 862, 863) 21 18 12 13 15 19 TOTAL 72 77 78 90 108 111
Music* (378, 377, 382, 375, 370, 376) 179 188 190 165 166 160 University College (870, 877, 882) 2 9 16 13 6 3 TOTAL 181 197 206 178 172 163
Philosophy* (351) 11 10 9 14 11 10 University College (851) 2 3 5 5 7 4 TOTAL 13 13 14 19 18 14
Political Science* (333) 155 185 175 168 160 163 University College (833) 59 42 52 45 47 65 TOTAL 214 227 227 213 207 228
* Admitted to the College of Liberal Arts
College of Liberal Arts

Undergraduate Majors cont'd.
2002 2003 2004 2005 2006 2007Religion* (352) 30 21 23 16 14 18 University College (852) 4 3 1 2 6 4 TOTAL 34 24 24 18 20 22
Social Science Edu* (340) 137 142 134 114 97 100 University College (840) 35 24 25 36 22 38 TOTAL 172 166 159 150 119 138
Social Work* (335) 69 62 77 76 71 82 University College (835) 58 57 41 67 110 85 TOTAL 127 119 118 143 181 167
Sociology & Anthropology* (334, 336) 124 130 114 114 116 128 University College (834, 836) 27 17 16 15 26 34 TOTAL 151 147 130 129 142 162
Theatre Arts* (373, 385, 379, 386, 387, 384, 383, 374) 239 223 216 222 217 187 University College (873, 885, 879, 886, 887, 884, 883, 874) 103 111 134 119 141 149 TOTAL 342 334 350 341 358 336
Urban Affairs* (329) 41 29 30 26 19 11 University College (829) 4 3 3 2 4 4 TOTAL 45 32 33 28 23 15
Women's Studies* (309, 310) 6 7 6 8 13 9 University College (809) 0 1 0 0 2 1 TOTAL 6 8 6 8 15 10
Criminal Justice* (325) 43 70 114 157 175 184 University College (825) 0 81 90 91 129 149 TOTAL 43 151 204 248 304 333
Liberal Studies* (311) 10 29 46 58 74 65 University College (811) 0 5 9 14 24 22 TOTAL 10 34 55 72 98 87
Undeclared* University College (800) 1 3 3 2 TOTAL 1 3 3 2
Adult and Transfer 127 178 186 149
Developmental Education 13 19 28TOTAL LIBERAL ARTS* 1,968 2,009 2,096 2,204 2,243 2,260 University College 669 804 883 897 840 866
GRAND TOTAL 2,637 2,813 2,979 3,101 3,083 3,126
* Admitted to the College of Liberal Arts
2002 2003 2004 2005 2006 2007Nursing** (467, 490, 491, 492) 406 464 549 608 622 654 University College (991) 247 365 436 471 659 615 Pre-Nursing** (498) 74 115 127 102 67 80
Adult and Transfer 61 101 93 77
Developmental Education 11 12 19
TOTAL NURSING** 480 579 676 710 689 734 University College 308 477 541 567 659 615
GRAND TOTAL 788 1,056 1,217 1,277 1,348 1,349
** Admitted to the College of Nursing & Health
College of Liberal Arts
College of Nursing & Health

Undergraduate Majors cont'd.
2002 2003 2004 2005 2006 2007Biological Sciences* (410) 399 364 380 445 436 426 University College (910) 136 175 173 143 205 215 TOTAL 535 539 553 588 641 641
Clinical Laboratory Science* (411) 29 31 33 36 31 28 University College (911) 7 6 18 12 9 8 TOTAL 36 37 51 48 40 36
Environmental Sciences* (414) 58 38 33 30 28 24 University College (914) 10 5 7 4 9 11 TOTAL 68 43 40 34 37 35
Chemistry* (430) 75 83 93 100 103 76 University College (930) 13 25 23 21 39 37 TOTAL 88 108 116 121 142 113
Geological Sciences* (440) 26 23 17 18 28 28 University College (940) 0 4 1 6 3 8 TOTAL 26 27 18 24 31 36
Mathematics* (450) 47 52 53 60 62 48 University College (950) 13 15 16 17 19 25 TOTAL 60 67 69 77 81 73
Physics* (460) 7 11 9 15 21 14 University College (960) 0 6 3 4 10 8 TOTAL 7 17 12 19 31 22
Psychology* (470) 461 476 462 489 469 493 University College (970) 133 117 142 130 175 186 TOTAL 594 593 604 619 644 679
Integrated Science* (419) 12 16 9 13 15 10 University College 4 0 4 4 0 0 TOTAL 16 16 13 17 15 10
Pre-Medicine* (581) 12 16 9 13 1 7 University College 4 0 4 4 0 0 TOTAL 16 16 13 17 1 7
Pre-Pharmacy* (582) 1 University College 0 TOTAL 1
Pre-Veterinary Medicine* (587) 1 University College 0 TOTAL 1
Undeclared* (400) 141 118 117 114 120 133 University College (900) 13 21 27 19 6 4 TOTAL 154 139 144 133 126 137
Adult and Transfer 53 77 57 46
Developmental Education 6 7 7TOTAL SCIENCE & MATHEMATICS * 1,255 1,212 1,206 1,320 1,314 1,289 University College 382 457 478 413 475 502
GRAND TOTAL 1,637 1,669 1,684 1,733 1,789 1,791
* Admitted to the College of Science & Mathematics
College of Science & Mathematics

2002 2003 2004 2005 2006 2007Raj Soin College of Business Master of Business Administration (MBA) 393 415 394 388 396 428 Logistics Management (MS) 1 1 22 13 16 Social and Applied Economics (MS) 15 22 15 11 10 16 Accountancy (MS) 23 32 33 34 29 31 TOTAL 432 470 442 455 448 491
College of Education & Human Services Certification Candidate (254) 19 25 15 29 39 17 PPS: School Nurse (242) 17 20 17 23 9 9 Early Childhood Intervention Specialist (240) 3 11 6 7 1 12 Classroom Teacher:
Physical Education (243) 5 7 6 5 6 7Computer Education (244) 19 20 21 15 11 8Business (248) 2 1Art (250) 1Early Childhood (251) 24 24 23 18 6 1Middle Childhood (249) 29 61 69 87 67 66Adolescent to Young Adult (247) 47 58 69 65 51 51General (252) 12 22 12 30 46 21Library/Media (253) 28 24 30 21 15 12Modern Language (237) 2 1 5 6 3 5Reading (255) 27 34 28 34 37 42Multi-Age (234) 5 3 13 20 10 11Career, Tech., Adult Ed. Voc. (241) 16 17 14 13 27 20IS: Mild to Moderate Needs (277) 106 148 194 190 219 210IS: Moderate to Intense Needs (256) 22 37 35 32 20 16Special Education: DH (257) 1Special Education: SLD (258) 10 2 2 1Special Education: MH (259) 1Special Education: Gifted (260) 16 8 4 13 30 24Science (261) 5 3 2 2 2 2Mathematics (262) 6 7 4 1 4Certification-Secondary (263) 5 1Certification-Elementary (264) 7 1
Administration Special: C&I Professional Dev. (288) 10 18 20 15 6 21 Education Administration Special: C&I Tech (295) 4 3 2 2 Business & Industrial Counseling (265) 7 5 9 6 7 8 Mental Health Counseling (267) 30 42 47 59 50 46 Marriage & Family Counseling (268) 13 15 16 15 20 20 Rehab. Counseling: Chem. Dependency (270) 3 6 10 15 23 24 Rehab. Counseling: Severely Disabled (271) 15 23 28 18 21 20 PPS: School Counseling (275) 33 48 66 72 59 54 Counseling Exceptional Children (278) 6 5 6 4 4 6 Community Counseling (276) 22 30 37 30 25 23 Vocational Education (215) 2 1 TESOL Endorsement (245) 1 3 1 1 Curriculum and Supervision:
Media (289) 1Computer Coordinator (292) 1
EL:EAS: Teacher Leader (291) 397 336 209 177 177 206 ED Leadership: Superintendent (299) 3 Principalship (294) 39 49 59 51 50 43 Education Leadership (296) 5
Master's Degree Students by Program

2002 2003 2004 2005 2006 2007College of Education & Human Services (cont.) EDL: Student Affairs in Higher Education (273) 31 28 30 32 42 50 Pre-Kindergarten Special Needs 1 3 EDL:EAS: Voc. Ed. Admin. (287) 2 1 TOTAL 1,054 1,148 1,104 1,114 1,086 1,066
College of Engineering & Computer Science Computer Engineering (426) 53 44 32 39 25 29 Computer Science (451) 99 91 77 48 51 54 Human Factors Engineering (433) 49 44 44 47 39 36 Materials Science Engineering (434) 9 15 12 14 9 7 Biomedical Engineering (437) 35 45 63 64 49 57 Electrical Engineering (438) 218 236 194 182 200 216 Mechanical Engineering (439) 57 52 48 45 38 50 TOTAL 520 527 470 439 411 449
College of Liberal Arts ABS: Criminal Justice & Social Problems (480) 39 52 57 50 41 37 ABS: International & Comparative Politics (485) 30 33 36 34 31 29 English (347, 348, 349) 62 65 68 82 72 60 History (332) 41 47 47 37 45 42 Humanities (303) 32 37 31 35 36 30 Music (380,381) 15 10 9 16 18 23 Public Administration (327) 16 33 50 50 67 58 Urban Administration (328) 18 2 WSU-OSU Master of Social Work 25 TOTAL 253 279 298 304 310 304
College of Nursing & Health 150 158 169 195 203 199
College of Science and Mathematics Biological Sciences Anatomy (413) 17 25 29 29 28 35 Biological Chemistry and Molecular Biology (415) 8 7 8 7 10 10 Biological Sciences (410) 42 42 39 32 35 33 Microbiology and Immunology (416) 6 11 15 16 11 14 Physiology and Biophysics (417) 3 2 2 2 8 9 Environmental Science (418) 16 18 11 8 8 4 Chemistry (430) 32 29 33 33 32 23 Chemistry-Environmental Sciences (431) 4 1 2 1 2 3 Geological Science (440, 442, 443, 444, 445, 446, 449) 27 28 24 26 24 24 Human Factors/Industrial Psychology (468, 469) 15 12 9 6 7 5 Mathematics and Statistics (450, 452, 453) 19 24 23 31 24 31 M.S.T Earth Science (441) 21 18 22 16 11 16 MST Physics (461) 4 2 2 MST Interdisciplinary: S&M (464) 5 11 14 17 20 5 Physics (460) 3 5 9 12 16 8 Medical Physics (462) 4 3 2 1 2 2 TOTAL 226 238 244 237 238 222School of Medicine Aerospace Medicine (997) 7 4 4 2 2 6 Public Health Management (994) 13 25 25 26 Public Health Nursing 1 Emergency Preparedness 3 Health Promotion & Ed (995) 4 9 11 13 Pharmacology/Toxicology (409) 9 11 13 12 11 13 Medicine (999) 25 40 Health Care MGT. Certification (019) 5 4 4 3 TOTAL 16 20 38 52 77 102
Master's Degree Students by Program

2002 2003 2004 2005 2006 2007Educational Specialist 4 5 5 5 1 2
Ph.D. in Computer Science & Engineering 37 40 40 31 31 43
Ph.D. in Engineering 61 69 77 85 83 88
Ph.D. in Biomedical Sciences 42 47 49 44 46 53
Ph.D in Human Factors/ Industrial Psychology 26 28 36 40 47 49
Ph.D in Environmental Sciences 5 12 21 23 20 21
Medicine 355 366 371 381 398 412
Professional Psychology 134 127 128 133 119 124
2002 2003 2004 2005 2006 2007Business & Administration 283 301 274 375 356 327
Education & HS 293 338 316 292 284 264
Liberal Arts 400 440 499 472 494 503
Nursing & Health 167 208 251 298 309 274
Engineering & Computer Science 318 290 299 275 313 331
Science & Math 320 331 328 336 325 336
Associate Degree 20 22 27 25 16 16
Undecided 555 532 495 413 256 473
Programs Beyond the Master's Degree
New Degree Seeking Freshmen Intended Area of Study

2002 2003 2004 2005 2006 2007Native American 53 60 60 63 54 60Asian 310 332 362 416 505 525African American 1,536 1,599 1,757 1,793 1,801 1,834Hispanic 142 164 176 212 243 240 TOTAL 2,041 2,155 2,355 2,484 2,603 2,659Percent of all Students 12.4% 12.9% 13.9% 14.5% 15.4% 15.7%
2002 2003 2004 2005 2006 2007Undergraduates 125 119 131 132 160 140Graduates 509 538 484 430 474 465 TOTAL 634 657 615 562 634 605
Number of Countries 69 60 66 67 69 66
2002 2003 2004 2005 2006 2007Undergraduate Women 23.2 23.1 22.9 22.9 22.7 22.8Undergraduate Men 23.0 22.9 23.0 22.9 22.7 22.8 ALL Undergraduates 23.1 23.0 22.9 22.9 22.7 22.8
Graduate Women 33.3 32.2 31.7 31.9 32.0 31.6Graduate Men 30.8 30.3 32.3 31.6 30.9 30.1 ALL Graduates 32.3 31.4 30.9 31.8 31.5 31.0
ALL STUDENTS 25.3 25.0 25.0 25.0 24.8 24.7
2002 2003 2004 2005 2006 2007Living on Campus 2,674 2,764 2,832 2,994 2,743 2,741Commuting 13,843 13,965 14,112 14,080 14,127 14,172
Percent of all Housing Students 16.2% 16.5% 16.7% 17.5% 16.3% 16.2%
Housing Students Vs. Commuter Students
Minority Students
Students Attending with Foreign Student Visas
Mean Age

2002 2003 2004 2005 2006 2007All Degree UndergraduatesFreshman 2.325 2.373 2.304 2.370 2.323 2.357Sophomore 2.744 2.766 2.817 2.852 2.842 2.793Junior 2.893 2.889 2.871 2.941 2.956 2.901Senior 2.951 2.988 2.994 3.000 3.067 3.011Men 2.771 2.800 2.808 2.828 2.796 2.840Women 2.955 2.978 2.983 3.021 2.975 3.002All Students 2.875 2.902 2.908 2.930 2.896 2.929
Raj Soin College of BusinessFreshman 1.837 2.386 3.248 2.573 2.603 3.054Sophomore 3.009 2.946 3.034 2.975 3.060 2.952Junior 2.957 2.962 2.924 3.003 2.964 2.986Senior 2.977 3.005 2.956 2.919 2.982 2.955Men 2.919 2.937 2.894 2.892 2.949 2.899Women 3.036 3.044 3.204 3.011 3.043 3.053All Students 2.975 2.988 2.956 2.945 2.988 2.962
College of Education & Human ServicesFreshman 3.764 3.355 3.545 3.445 3.296 3.184Sophomore 3.169 3.086 3.235 3.156 3.222 3.122Junior 3.045 2.945 3.003 2.978 3.003 2.952Senior 3.130 3.128 3.079 3.077 3.114 3.062Men 2.843 2.779 2.844 2.812 2.900 2.813Women 3.199 3.174 3.152 3.159 3.187 3.150All Students 3.114 3.083 3.071 3.062 3.095 3.043
College of Engineering & Computer ScienceFreshman 2.284 2.688 3.190 2.591 2.275 2.329Sophomore 3.137 3.046 3.166 3.126 3.058 3.017Junior 3.082 3.102 2.991 3.097 3.027 3.015Senior 2.891 2.965 2.960 2.978 2.979 2.937Men 2.921 2.988 2.974 3.007 2.980 2.954Women 3.040 3.041 3.008 3.015 3.031 2.962All Students 2.940 2.997 2.979 3.009 2.986 2.956
* Does not include new freshmen students, transfer students, or associate degree students.
Mean Cumulative UndergraduateGrade Point Average by College *

Mean Cumulative Undergraduate Grade Point Average by College (cont.)
2002 2003 2004 2005 2006 2007College of Liberal ArtsFreshman 2.737 2.796 2.856 2.728 2.694 2.805Sophomore 2.825 2.862 2.959 2.927 2.949 2.872Junior 2.900 2.853 2.869 2.940 2.948 2.862Senior 2.870 2.907 2.934 2.962 3.039 2.961Men 2.792 2.793 2.837 2.867 2.900 2.861Women 2.929 2.960 2.981 3.008 3.033 2.971All Students 2.871 2.888 2.919 2.949 2.978 2.922
College of Nursing & HealthFreshman 3.187 3.364 3.280 2.639 3.086 -Sophomore 3.137 3.172 3.429 3.340 3.179 3.397Junior 4.556 3.180 3.269 3.342 3.330 3.315Senior 3.043 3.148 3.202 3.253 3.343 3.260Men 3.104 3.193 3.302 3.284 3.354 3.296Women 3.069 3.153 3.219 3.272 3.323 3.271All Students 3.071 3.156 3.226 3.274 3.327 3.274
College of Science & MathematicsFreshman 2.582 2.711 2.642 2.782 2.732 2.784Sophomore 2.862 2.834 2.984 3.023 2.919 2.939Junior 2.931 2.890 2.872 2.969 2.957 2.863Senior 2.950 2.955 2.989 2.965 3.047 2.988Men 2.814 2.810 2.874 2.913 2.965 2.949Women 2.989 2.982 2.997 3.008 2.992 2.948All Students 2.926 2.917 2.951 2.972 2.981 2.949
University CollegeFreshman 2.257 2.289 2.205 2.290 2.247 2.238Sophomore 2.540 2.583 2.572 2.595 2.640 2.580Junior 2.453 2.556 2.510 2.498 2.620 2.505Senior 2.507 2.514 2.598 2.447 2.660 2.415Men 2.347 2.411 2.389 2.377 2.346 2.386Women 2.537 2.570 2.540 2.566 2.562 2.529All Students 2.447 2.499 2.472 2.474 2.463 2.462
* Does not include new freshmen students, transfer students, or associate degree students.

2002 2003 2004 2005 2006 2007Undergraduate Part-Time 6.21 6.40 6.22 6.09 6.29 6.53 Full-Time 14.94 15.07 14.95 14.85 14.81 14.88 All 13.25 13.62 13.48 13.43 13.43 13.67
Master's Part-Time 5.19 5.50 5.59 5.50 3.97 4.01 Full-Time 13.54 13.19 13.52 13.49 10.89 10.62 All 6.45 6.89 7.21 7.21 7.76 7.41
Doctoral Part-Time 4.37 4.33 3.69 3.77 2.47 2.04 Full-Time 13.63 13.62 13.68 13.59 13.28 13.03 All 11.19 11.66 11.32 11.00 11.43 10.96
Professional Part-Time 6.04 2.75 4.60 3.09 2.00 4.25 Full-Time 17.31 17.29 17.34 17.44 17.47 17.24 All 16.69 16.94 16.95 17.13 17.38 17.14
2002 2003 2004 2005 2006 2007Mean ACT Scores 21.3 20.8 20.8 20.8 20.8 21.0
2002 2003 2004 2005 2006 2007
Mean SAT Scores 1015.2 1002.7 1005.0 997.8 995.8 995.5
Average Credit Hour Loads
Mean ACT Composite Score of New Degree Freshmen
Mean SAT Composite Score of New Degree Freshmen

2002 2003 2004 2005 2006 2007
Clark County
Springfield 18 15 22 30 29 17Greenon 29 32 15 17 24 17Tecumseh 33 23 26 27 26 16Northeastern 3 9 7 10 22 11Northwestern 23 14 9 19 13 19Southeastern 6 5 5 7 2Kenton Ridge 13 20 11 10 19 13Shawnee 11 9 24 22 10 13Total 130 128 119 140 150 108
Greene County
Fairborn 49 61 62 46 43 56Xenia 32 38 35 37 32 42Yellow Springs 6 5 9 7 1 4Beavercreek 84 95 118 98 97 152Cedarville 2 8 5 1 9 9Greenview 13 9 17 17 11 17Greene County Career Center 1 1 1Bellbrook 19 31 29 23 43 46Total 205 249 276 230 237 326
Miami County
Piqua 13 9 14 19 5 8Troy 25 19 20 24 24 21Bradford 5 1 3 1 4Covington 2 4 7 1 1Milton Union 8 5 11 11 22 8Bethel 9 2 12 13 13 13Miami East 10 5 15 6 10 7Newton 5 4 2 8 4 8Tippecanoe 15 24 28 16 18 18Total 92 69 109 105 101 84
New Degree Seeking FreshmenHigh School Origin-Miami Valley

New Degree FreshmenHigh School Origin cont'd.
2002 2003 2004 2005 2006 2007
Montgomery County
Butler Senior 18 27 25 21 26 36Centerville 37 43 49 52 36 52Colonel White 10 11 13 16 18 24Paul Laurence Dunbar 11 7 13 8 14 8Patterson 7 8 8 4 1 1Meadowdale 15 9 21 25 22 12Belmont 14 9 9 10 10 6Fairmont East 1Kettering Fairmont 52 46 45 51 48 49Miami Valley Career Tech Ctr 1 3Miamisburg 31 29 16 25 29 37Northmont 31 35 40 45 31 47Oakwood 5 6 6 11 3 16Trotwood-Madison 10 16 16 15 18 16West Carrollton 23 23 16 15 25 16Brookville 13 10 10 11 2 15Jefferson 1 4 6 4 4 4Stivers School for the Arts 13 16 20 18 9 14Stebbins 18 20 12 21 16 23Dixie 13 7 11 8 5 2Northridge 11 4 4 5 1 8Valley View 11 4 9 9 4 11Wayne 41 49 51 57 51 61Wilbur Wright 1Total 385 383 402 432 373 461
Private Schools
Alter 30 12 18 7 7 15Carroll 47 50 53 28 32 47Catholic Central-Springfield 6 3 3 7 1 7Chaminade-Julienne 26 23 22 26 26 31Dayton Christian 18 12 12 3 13 11Dayton Early Colllege Academy 10Dominion Academy 1Emmanuel Christian Academy 2Evangel Academy 4 1 1 1Germantown Christian 1Lighthouse Christian 1 1Miami Valley School 1 3 3Mound Street Academy 1Nazarene Christian 2Spring Valley Academy 1 3 2 1 1 2Temple Christian 2 2 1 1Troy Christian 3Xenia Christian Academy 9 5 5 8 3 8Total 143 115 117 82 84 145
Grand Total 955 944 1,023 989 945 1,124

2002 2003 2004 2005Ohio Public/Community/Technical CollegesBelmont Technical College 1Cincinnati State Tech and Comm College 4 4 11 4 10 7Central Ohio Technical College 2 1Clark State Community College 38 48 34 44 36 48Columbus State Community College 11 15 25 20 21 17Cuyahoga Community College 4 1 5 3 8 3Devry Institute of Technology 1Edison State College 63 52 49 59 38 47Hocking Technical College 7 1 3 1 1 3James A Rhodes State College 9 7 12 7 7Lakeland Community College 2 3 1Lima Technical College 12Lorain Community College 1 1 1 3Marion Technical College 1 1Muskingum Area Technical College 1 1 1North Central Technical College 2 3 3 2 1 1Northwest State Community College 4 2 1 5Owens Technical College 2 5 4 2 5 6Sinclair Community College 215 238 272 267 265 287Southern State Community College 29 21 18 25 24 20Stark State College of Technology 1 1 1 1 1Terra Technical College 1 1 1 2 1 1Washington State Community College 1Total 396 408 439 445 421 454
Ohio Public Universities/Regional CampusesBowling Green State University 20 22 18 15 21 14Central State University 5 3 10 15 8 4Cleveland State University 2 2 2 2 2 1Kent State University 8 13 5 12 8 9Miami University 32 34 41 32 34 31Ohio State University 42 31 43 29 33 34Ohio University 24 20 26 25 21 33Shawnee State University 3 4 3 3 6 2University of Akron 1 5 2 5 2 3University of Cincinnati 35 34 36 25 31 28University of Toledo 18 15 26 16 16 18Youngstown State University 4 3 2 5 4Total 194 186 212 181 187 181
Degree Seeking Transfer Students
20072006

Degree Seeking Transfer Students cont'd.
Ohio Private Colleges/UniversitiesAntioch College 1 4 1 2Art Academy of Cincinnati 1Ashland University 3 1 1 1 4Baldwin Wallace College 1 3 2 1Bluffton College 2 2 1 6Capital University 2 6 6 2 4Cedarville University 11 11 5 6 8 8Chatfield College 1 1 1Christ Hospital School of Nursing 1 1 1Cincinnati Christian University 1Cleveland Institute of Art 1College of Mount St. Joseph 1 1 2 1 2 1College of Wooster 1 2Columbus College of Art and Design 1 1Defiance College 1 1 4 1 2Denison University 1 1 1 2Franklin University 1 1Heidelberg College 1 2 3 2 3 1Hiram College 1 2John Carroll University 1 1Kettering College of Medical Arts 7 4 1 3 6Lourdes College 1Malone College 2Marietta College 1 1 1 1Mercy College of Northwest Ohio 1Miami Valley Hospital School of Nursing 1Mount Union College 1 1Mount Vernon Nazarene College 6 2 4 2Muskingum College 1 2 1 2Myers University 1Notre Dame College of Ohio 1 2Oberlin College 1 1Ohio Dominican College 2 3 4 2Ohio Northern University 11 4 5 4 5 5Ohio Wesleyan University 2 2 1 3 1 1Otterbein College 3 1 4 5 8 4Southern Ohio College 1Tiffin University 4 3 1 1 4 4University of Rio Grande 2 2 1University of Dayton 16 16 9 20 22 23University of Findlay 1 5 5 4 4 3
20072002 20062003 20052004

Degree Seeking Transfer Students cont'd.
University of Northwestern Ohio 7 2 4 3 2 2Urbana University 2 5 5 5 6 7Walsh College 3 1Wilberforce University 1 9 2 2 2 1Wilmington College 4 7 3 6 6 15Wittenberg University 8 8 5 12 7 12Xavier University 2 1 1 1 1Total 108 102 81 100 108 120
Out of StateIllinois 8 8 6 4 4 7Indiana 22 20 20 24 20 13Kentucky 14 26 24 30 29 22Michigan 16 6 7 10 7 15Pennsylvania 6 6 5 2 5 5West Virginia 1 3 2 3 3 4
Other States 133 150 139 135 168 112Total 200 219 203 208 236 178
Grand Total 898 915 935 934 952 933
20072002 200620052003 2004

Degrees No. % No. % No. % No. % No. % No. %Associate's 71 3 68 2 79 2 79 2 72 2 69 2Bachelor's 1,869 68 1,879 63 2,062 62 2,035 59 2,123 59 2,242 64Master's 713 26 912 31 1,062 32 1,181 35 1,265 35 1,068 30Educational Specialist 2 0.1 2 0.1Doctor of Philosophy 13 0.5 15 1 16 0.5 19 1 22 1 24 1Doctor of Medicine 91 3 81 3 86 3 85 2 86 2 88 3Doctor of Professional Psychology 9 0.3 24 1 22 1 22 1 21 1 28 1TOTAL 2,768 2,981 3,327 3,421 3,589 3,519
Associates's Degrees No. % No. % No. % No. % No. % No. %Associate of Arts 13 18 12 18 14 18 12 15 13 18 14 20Associate of Applied Business 20 28 31 46 27 34 30 38 27 38 33 48Associate of Applied Science 8 11 6 9 8 10 5 6 2 3 5 7Associate of Science 19 27 8 12 13 16 17 22 17 24 10 14Associate of Technical Studies 11 15 11 16 17 22 15 19 13 18 7 10TOTAL 71 68 79 79 72 69
Bachelor's Degrees No. % No. % No. % No. % No. % No. %Raj Soin College of Business 444 25 440 23 483 23 405 20 357 17 452 20College of Ed & HS 377 21 350 19 435 21 444 22 499 24 495 22College of Eng. & Comp.Sci. 161 9 153 8 173 8 150 7 170 8 169 8College of Liberal Arts 471 26 518 28 541 26 545 27 600 28 597 27College of Nursing & Health 116 7 109 6 143 7 172 8 211 9 219 10College of Science & Math 300 17 309 16 287 14 319 16 286 13 310 14TOTAL 1,783 1,879 2,062 2,035 2,123 2,242
Master's Degrees No. % No. % No. % No. % No. % No. %Raj Soin College of Business 178 25 165 18 219 21 253 21 276 22 207 19College of Ed & HS 189 27 358 39 419 39 459 39 507 40 449 42College of Eng. & Comp.Sci. 125 18 169 19 214 20 229 19 215 17 150 14College of Liberal Arts 63 9 70 8 80 8 102 9 98 8 110 10School of Medicine 2 0.3 5 1 4 0.4 2 0.2 25 2 10 1College of Nursing & Health 56 8 65 7 41 4 44 4 57 5 63 6College of Science & Math 100 14 80 9 85 8 92 8 87 7 79 7TOTAL 713 912 1,062 1,181 1,265 1,068
2006-07
Degrees Awarded
2006-07
2006-07
2006-07
2005-06
2005-06
2005-06
2005-06
2002-03 2004-05
2004-05
2001-02
2001-02
2001-02
2004-05
2004-05
2001-02
2002-03
2002-03
2002-03
2003-04
2003-04
2003-04
2003-04

Fall Quarter Headcount Enrollment
Total UniversityTotal University Graduate/ Main Lake Total
Year Undergraduate Professional Campus Campus University1964 3,203 3,2031965 4,453 4,4531966 4,691 4,6911967 5,704 5,7041968 7,810 8,2271969 8,964 574 9,9211970 9,981 669 11,1751971 11,020 689 12,1991972 11,212 757 12,3571973 11,624 732 12,7421974 12,373 675 13,2021975 13,423 805 14,4031976 12,798 808 13,6991977 13,559 714 14,3621978 13,493 767 14,2611979 13,874 739 14,7351980 14,716 879 15,6351981 14,418 904 15,3271982 13,888 940 14,8261983 14,544 905 15,4521984 14,625 901 15,5131985 15,324 792 16,0971986 16,209 799 16,9771987 16,210 880 17,0661988 16,270 860 17,1041989 16,602 853 17,4231990 16,497 904 17,3801991 16,907 878 17,7611992 16,839 848 17,6571993 16,597 722 17,2951994 16,204 638 16,8231995 15,900 639 16,4881996 15,078 654 15,6971997 15,332 729 16,0331998 14,971 692 15,6361999 14,781 951 15,7022000 14,493 929 15,3982001 14,834 1,016 15,8102002 15,436 1,122 16,5172003 15,694 1,061 16,7292004 15,985 995 16,9442005 16,207 910 17,0742006 16,088 864 16,8702007 16,151 845 16,91312,938 3,975
13,058 4,01612,934 3,936
13,001 3,94312,708 4,021
3,5023,5903,986
11,89612,22012,531
3,8544,1563,7273,586
3,9583,8703,9954,234
3,5583,4833,5973,930
3,2223,4633,7453,711
3,9573,6603,2663,349
2,9143,2313,3453,517
2,2892,6402,9413,158
1,1031,6701,7611,890
335413430543
2,868
11,84311,87711,909
13,54613,94013,78313,831
12,63413,232
12,116
13,69913,425
12,254
13,355
12,828
11,66711,56012,10312,291
11,13110,91611,21811,678
10,10210,26111,24510,755
8,2519,41410,30910,068
4,0404,2615,1617,124

Fall Quarter Headcount Enrollment1964 - 2007
0
2,000
4,000
6,000
8,000
10,000
12,000
14,000
16,000
18,000
1964
1965
1966
1967
1968
1969
1970
1971
1972
1973
1974
1975
1976
1977
1978
1979
1980
1981
1982
1983
1984
1985
1986
1987
1988
1989
1990
1991
1992
1993
1994
1995
1996
1997
1998
1999
2000
2001
2002
2003
2004
2005
2006
2007
Undergraduate
Graduate
Main Campus
Lake Campus
Total University

Fall Quarter Full-Time Equivalents
Total UniversityTotal University Graduate/ Main Lake Total
Year Undergraduate Professional Campus Campus University
1982 9,098 1,797 10,331 565 10,896
1983 9,681 1,836 10,933 584 11,517
1984 9,788 1,699 10,907 579 11,486
1985 10,002 1,730 11,212 520 11,732
1986 10,420 1,789 11,705 504 12,209
1987 10,383 1,771 11,613 541 12,154
1988 10,631 1,700 11,783 548 12,331
1989 10,918 1,630 12,009 538 12,547
1990 10,998 1,726 12,181 543 12,724
1991 11,164 1,874 12,497 541 13,038
1992 11,163 1,949 12,583 529 13,112
1993 10,972 1,901 12,406 468 12,873
1994 10,522 1,899 12,016 405 12,421
1995 10,016 1,960 11,568 408 11,975
1996 9,762 1,927 11,246 442 11,689
1997 9,857 2,030 11,404 482 11,887
1998 10,137 1,916 11,560 493 12,053
1999 10,338 1,823 11,563 599 12,162
2000 10,319 1,859 11,567 612 12,178
2001 10,702 1,920 11,934 688 12,622
2002 11,068 2,104 12,436 736 13,172
2003 11,538 2,242 13,008 772 13,780
2004 11,684 2,281 13,279 686 13,965
2005 11,689 2,327 13,372 644 14,016
2006 11,584 2,359 13,350 593 13,943
2007 11,717 2,373 13,510 580 14,090

Fall Quarter Full-Time Equivalents1982 - 2007
0
1,500
3,000
4,500
6,000
7,500
9,000
10,500
12,000
13,500
15,000
1982
1983
1984
1985
1986
1987
1988
1989
1990
1991
1992
1993
1994
1995
1996
1997
1998
1999
2000
2001
2002
2003
2004
2005
2006
2007
Undergraduate
Graduate
Total UniversityMain Campus
Lake Campus