Student Debt and Declining Retirement Savings
22
Campus Box 1196 One Brookings Drive St. Louis, MO 63130-9906 (314) 935.7433 csd.wustl.edu Student Debt and Declining Retirement Savings William Elliott, PhD University of Kansas, School of Social Welfare Michal Grinstein-Weiss, PhD Center for Social Development Ilsung Nam, PhD Hallym University Aging Institute 2013 CSD Working Paper No. 13-34
Transcript of Student Debt and Declining Retirement Savings
Campus Box 1196 One Brookings Drive St. Louis, MO 63130-9906 (314) 935.7433 csd.wustl.edu
Student Debt and Declining Retirement Savings
William Elliott, PhD University of Kansas, School of Social Welfare
Michal Grinstein-Weiss, PhD Center for Social Development
Ilsung Nam, PhD Hallym University Aging Institute
2013
CSD Working Paper
No. 13-34

STUDENT DEBT AND DECLINING RETIREMENT SAVINGS
C E N T E R F O R S O C I A L D E V E L O P M E N T
W A S H I N G T O N U N I V E R S I T Y I N S T . L O U I S
2
Acknowledgments
Support for this study comes from the Charles Stewart Mott Foundation. The authors would like to thank Tiffany Trautwein for her very helpful review.
STUDENT DEBT AND DECLINING RETIREMENT SAVINGS
C E N T E R F O R S O C I A L D E V E L O P M E N T
W A S H I N G T O N U N I V E R S I T Y I N S T . L O U I S
3
Student Debt and Declining Retirement Savings
In this study, the authors use the Survey of Consumer Finances (SCF) to determine whether student loan debt is associated with retirement savings. They find that the median 2009 retirement savings amount for households with no outstanding student loan debt ($55,000) is nearly twice as high as it is for households with outstanding student loan debt ($25,000). Further, multivariate statistics indicate that a household with a four-year college graduate, outstanding student loan debt, and median retirement savings ($80,983) in 2007 incurred a loss of 52% of those retirement savings in 2009 contrasted with household with a similar household with no outstanding student loan debt. The main policy implication of this study is that outstanding student loan debt may jeopardize retirement savings in the short term. This finding raises questions about the short-term financial effects of overreliance on student borrowing as a financial aid strategy. However, more research is needed before suggesting policy prescriptions.
Keywords: retirement savings, homeownership, student loans, survey of consumer finances, assets
Introduction
The financial aid model in America is based on a belief that education, especially higher education, is a commodity to be purchased by students and their families (Baum, 1996; Heller & Rogers, 2006). Changes in federal and state policies in recent years have reinforced this shift toward the commodity model. Increased tuition costs and reductions in grant-based aid mean that students and their families are taking on more of the responsibility of paying for college. We question whether this policy burdens some students and their families disproportionately (Elliott & Friedline, 2013).
To assess this burden, we examine how it affects college access. For example, the shift in the financial aid system from societal responsibility to individual responsibility may make college appear out of reach to lower income students, particularly those reluctant to take on large amounts of debt. Over time, these enrollment patterns could exacerbate educational attainment gaps between wealthy and poor students. Reduced college enrollment from a given community also will sever some of the information and relational ties—as a result of having fewer people in the community with college experience—that can facilitate access to college.
Increasing dependence on student loans
Dependence on student loans has increased, at least in part, because of the shift in financial aid policy over the last several decades toward greater individual responsibility. If higher education is a commodity, some might suggest that students should bear much of the cost, which they do. To carry this additional burden, more students rely on student loans. Fry (2012) finds that 40% of all households headed by an individual younger than age 35 have outstanding student loan debt. The
proportion of undergraduate students who took out federal loans increased from 23% in 2001‒2002
to 35% in 2011‒2012 (College Board, 2012). According to Fry (2012), the average outstanding student loan debt in 2007 was $23,349 and rose to $26,683 by 2010. Further, total borrowing for
college hit $113.4 billion for the 2011‒2012 school year, up 24% from five years earlier (College
Board, 2012). As a result, households are faced with ever-growing student loan debt. In the 2011‒2012 school year, about 37% of all undergraduate financial aid ($70.8 billion) came from federal loans (College Board, 2012). Federal Pell Grants were the next highest source at 19% and institutional grants at 18%.
STUDENT DEBT AND DECLINING RETIREMENT SAVINGS
C E N T E R F O R S O C I A L D E V E L O P M E N T
W A S H I N G T O N U N I V E R S I T Y I N S T . L O U I S
4
Student loans are not just a problem for the young
According to the Federal Reserve Bank of New York (FRBNY) (2012), of the 38.8 million individuals with student loans in the US, the under-30 age group makes up about 39% of student loan borrowers (15 million), the 30–39 age group makes up about 28% (10.9 million), the 40–49 age group makes up about 15% (6 million), the 50–59 age group makes up just over 12% (4.7 million), and the over-60 age group makes up nearly 6% (2.2 million).
Even older adults are not exempt from the burden of student debt. Parents often cosign for student loans, making them equally liable for repayment and the consequences of default, and take out their own educational loans for their children, as well as for themselves. The 2.2 million Americans age 60 years and older who have student loan debt have an average of $19,521, and 12.5% were at least 90 days delinquent at the end of 2012 (FRBNY, 2012). Even if they are not delinquent, cosigners’ responsibility for loan repayment affects their credit and may make it more difficult for them to qualify for other loans. Data from the Department of the Treasury show that a growing number of Social Security recipients’ payments are being garnished to pay for student loan debt (Andriotis, 2012). In 2007, there were 60,000 cases, which rose to 115,000 cases in 2012 (Andriotis, 2012).
Potential of postcollege effects of student loans on young adults
Student loan debt’s effects on a household’s Social Security benefits introduce another aspect of the potential student debt crisis in America. Student loan debt has the potential to hinder students’ ability to accumulate assets after college. Using cross-sectional data from the 2003 Survey of Consumer Finance (SCF), Shand (2007) finds that student loan debt has a negative effect on homeownership rates but little evidence to suggest that this is the result of credit constraints. In other words, the presence of student loan debt does not prevent individuals from obtaining a mortgage, but it might make them averse to taking out a mortgage for a home.
Using longitudinal data from the 2007 and 2009 SCFs, Elliott and Nam (2013) examine the effects of student loans on net worth (i.e., total assets minus total liabilities). They find that household with a four-year college graduate, median 2007 net worth, and outstanding student loan debt had $185,996 less net worth in 2009 contrasted with a similar household with no outstanding student loan debt. Using 2010 SCF data to project the potential for households with student loan debt to have less wealth, Hiltonsmith (2013) finds that households headed by two people with degrees from four-year universities with student loan debt have nearly $208,000 less lifetime wealth when contrasted with similar households with no student debt. A large portion of this difference comes from having lower retirement savings ($134,000) and lower home equity ($70,000) (Hiltonsmith, 2013).
Retirement savings
Social Security was never meant to finance retirement (DeWitt, 1996). Therefore, retirement savings play an important role in people’s ability to be financially stable during their retirement years. Amid proposals to reform Social Security and a widespread reduction in employer-sponsored, defined benefit pension plans, many suggest that individuals should build a pool of savings to supplement other sources of income after retirement. This shifting of the burden to individuals is similar to the shift in financial aid and is a concern not only for households but also for policymakers and researchers.

STUDENT DEBT AND DECLINING RETIREMENT SAVINGS
C E N T E R F O R S O C I A L D E V E L O P M E N T
W A S H I N G T O N U N I V E R S I T Y I N S T . L O U I S
5
Review of Retirement Savings Research
An absence or low amount of retirement savings may cause people to delay retirement, increase their use of public welfare programs, and reduce consumption and quality of life. The National Retirement Risk Index (NRRI), which measures the percentage of working-age households at risk of being unable to maintain their preretirement standard of living in retirement,1 suggests that 50% of those in an older cohort and 68% of those in Generation X are at risk of being unable to maintain their standard of living (Munnell, Soto, Webb, Golub-Sass, & Muldoon, 2008). Yuh (2011) finds that at least 44% of households may be unable to maintain 70% of their permanent income at retirement. In 2007 and in 2009, SCF data suggest that about 56% of households had dedicated retirement savings accounts (Bricker, Bucks, Kennickell, Mach, & Moore, 2011).
In contrast, using panel data from the National Health and Retirement Study (HRS), Scholz, Seshadri, and Khitatrakun (2006) find that most Americans between the ages of 51 and 61 in 1992 were meeting or exceeding optimal targets for retirement savings. In a follow-up study, Scholz and Seshadri (2008) include Social Security earnings data and two younger cohorts and find that only 3.6% of households have net worth below the optimal target. War babies and early boomer cohorts are the least likely to meet net worth targets.
Likelihood of having retirement savings and the amount differ by income. Households in the top income quartile are five times more likely to own retirement accounts than households in the lowest income quartile (Butrica, Zedlewski, & Issa, 2010). A study by the Urban Institute finds that low-income families do not accurately predict the level of financial assets needed for retirement and are disproportionately more reliant on Social Security benefits than higher income households (Bell, Carasso, & Steuerle, 2005). The NRRI suggests that among those in the bottom third of the income distribution, 72% risk retirement insufficiency (Munnell et al., 2008).
Introduction of tax incentives, IRAs, and 401(k) plans
To increase preparedness for retirement and respond to a decline in the number of workers covered by defined benefit pensions, retirement saving vehicles with tax-related saving incentives (e.g., Individual Retirement Accounts (IRAs) and employer-sponsored 401(k) accounts) were introduced in the early 1980s. However, economists disagree about whether these incentivized saving tools have raised net savings amounts. Poterba, Venti, and Wise (1996) analyze retirement savings data from multiple sources while attempting to control for the heterogeneity of savings behavior among households. They find that contributions to IRA and 401(k) accounts are distinct, not simply substitutions for savings that would have been put into other accounts in the absence of the IRA or 401(k) incentives. However, Engen, Gale, and Scholz (1996), conduct different analyses of the same data and find that the opposite is true. According to their study, IRA and 401(k) contributions are primarily reallocated from other assets and do not represent new savings. They conclude that savings incentives affect the placement but not the level of savings and that most research overstates the impact of saving incentives.
In an analysis of Survey of Income and Program Participation (SIPP) wave 4 data from 1990, Benjamin (2003) finds that about a quarter of aggregate 401(k) balances represent new savings. In his analysis, foregone tax revenue and conversions from preexisting pension plans each represent another quarter, and the remaining amount comes from other assets, including retirement savings.
1 To learn more about NRRI go to http://crr.bc.edu/special-projects/national-retirement-risk-index/.
STUDENT DEBT AND DECLINING RETIREMENT SAVINGS
C E N T E R F O R S O C I A L D E V E L O P M E N T
W A S H I N G T O N U N I V E R S I T Y I N S T . L O U I S
6
Benjamin also finds evidence that suggest this differs among renters and homeowners: 401(k) contributions made by renters—but not homeowners—constitute new savings.
Research suggests that individuals’ level of financial knowledge correlates with their likelihood of saving for retirement (Lusardi & Mitchelli, 2007; Olsen & Whitman, 2007). Health also may be correlated with retirement savings. Controlling for other assets, Poterba, Venti, and Wise (2011) find that people in poor health are less likely to have a personal retirement account (e.g., IRA or 401(k)) than people in good health. People with access to automatic enrollment in retirement plans are more likely to accumulate retirement savings, and opt-out plans greatly increase participation rates (Madrian & Shea, 2001). Finally, the design and presentation of retirement savings opportunities may increase the rate of uptake, savings levels, and persistence (Benartzi & Thaler, 2007).
Differences by income level
Low-income households may experience lower levels of persistence of retirement savings. For example, in a study of those who made early withdrawals from retirement accounts, Butricia, Zedlewski, and Issa (2010) find that age, education, race, income, wealth, employment status, and health are correlated with early withdrawal. Among retirement account owners, being younger, not having a college degree, being African American, having lower income and assets, losing or changing jobs, and experiencing health problems are predictive of making early withdrawals.
In a randomized experiment among low- and middle-income tax filers, Duflo, Gale, Liebman, Orszag, and Saez (2006) find that the offer of a savings match for a one-time IRA contribution during the tax filing process increased the likelihood of participation and the average amount of the contribution. Several factors are associated with a higher likelihood of uptake: higher incomes, receipt of tax refunds, ownership of a savings account, previous 401(k) contributions, investment income, prior history as a customer of H&R Block, and not owning a home. The study also finds that tax filers were more responsive to the match offer than to Saver’s Credit incentives. The authors suggest that the simplicity of the match offer compared to the complexity of the Saver’s Credit may explain this finding.
Theoretical Framework
There is limited research on the effects of student loan debt on students’ postcollege outcomes, partly because economists generally believe that student loan debt should have little effect on consumption throughout the life course (Rothstein & Rouse, 2011). Many assume that students are rational actors who weigh the amount of student debt against potential lifetime earnings. As Rothstein and Rouse (2011) point out, $10,000 in student debt represents less than 1% of the present value of the average college graduate’s potential lifetime earnings, which will have little effect on consumption at any point during the life course. Therefore, students will reason that college is worth the investment. In this study, we contest that students are rational actors. We also suggest that assets should be differentiated from income when considering the effects of student loan debt on postcollege outcomes.
Students are not always rational decision makers?
Evidence suggests that students do not act rationally when deciding whether or not to take on student debt. For example, while Dwyer, McCloud, and Hodson (2011) find that while students’ debt is positively associated with their self-concept and sense of mastery during and soon after college (i.e., from ages 18 to 24 and 25 to 27), it has negative effects later in life (i.e., from age 28 on). They suggest that students might adjust their expected lifetime earnings upward based on access to student loans. Somon and Cheema (2002) find empirical evidence that people do not have the
STUDENT DEBT AND DECLINING RETIREMENT SAVINGS
C E N T E R F O R S O C I A L D E V E L O P M E N T
W A S H I N G T O N U N I V E R S I T Y I N S T . L O U I S
7
cognitive capability to determine the right ratio of debt to future earnings. Current lifetime limits on Direct Subsidized and Direct Unsubsidized Loans from the federal government allow students to accumulate large amounts of debt. In the aggregate, dependent undergraduate students can borrow up to $31,000, and independent undergraduate students can borrow up to $57,500. In the 2007–2008 school year, 53% of students who took out loans took out the maximum amount allowed (GAO, 2011). Deciding how much student loan debt to incur based on expected future earnings is made even more complicated by students’ being allowed to defer repayment of student loans until after they leave college. As such, student loan debt might seem less real to them and harder to put into perspective.
Also, students often do not have enough information to determine accurately whether or not they actually will complete college (e.g., Elliott, Song, & Nam, 2013) or how much they will earn after graduation (Carnevale, Stohl, & Melton, 2010). Students may overestimate their future earnings relative to the amount of student debt they are willing to take on, or they might lack information about their earnings potential, overextending themselves and reducing their ability to prepare financially for retirement.
Assets are different from income
The economic perspective fails to recognize the importance of assets (i.e., wealth) in creating advantage or disadvantage. Even though the lifetime earnings potential of a graduate with student loan debt may be equal to that of the graduate without student loan debt, she may less able to accumulate assets (e.g., retirement savings). Assets are different from income in an important way: assets reflect ownership power or control over resources stored over time and used for human development and social mobility and to pass advantage from one generation to the next. In contrast, income represents resources earned over a week or month. Households’ ability to leverage income for wealth creation differs according to their access to institutional supports that cultivate advantage (such as 401k plans) (Sherraden, 1991). For instance, Shapiro, Meschede, and Osoro (2013) find that each $1 increase in income translates to a $5 increase in wealth for Whites but only $0.70 for Blacks. Therefore, graduates with similar abilities who expend the same amount of effort may be equally able to earn, but their capacity to accumulate wealth may be very different. This is important because higher education is valued primarily as a means of attaining economic security, not as a good itself. Therefore, looking at the circumstances in which the same degree does or does not result in financial well-being plays an important role in determining how valuable it really is.
Research Questions
In addition to the potential negative effects that student loans may have on retirement security for older Americans through the garnishment of Social Security income, the Consumer Financial Protection Bureau (CFPB) (2013) suggests that rising student loan debt might delay young adults’ retirement saving or reduce the amount saved during the critical early years of work. For example, the CFPB (2013) indicates that only half of workers younger than age 30 enroll in their employers’ 401(k) plans, and less than half contribute enough to receive a full employer match.

STUDENT DEBT AND DECLINING RETIREMENT SAVINGS
C E N T E R F O R S O C I A L D E V E L O P M E N T
W A S H I N G T O N U N I V E R S I T Y I N S T . L O U I S
8
In this study, we examine the effects of student loan debt on college attendees’ ability to accumulate retirement savings. More specifically, we explore three research questions:
1. Is having outstanding student loan debt associated with retirement savings?
2. Is the amount of outstanding student loan debt associated with retirement savings?
3. Do households with a college graduate and outstanding student loan debt have less retirement savings than households with a college graduate and no outstanding student loan debt?
Methods
Data
We used panel data from the 2007–2009 Survey of Consumer Finances (SCF) survey, sponsored by the Federal Reserve Board. The data include observations on 3,857 families in the US who responded in 2007 and 2009. Instead of the usual cross-sectional SCF data, these panel data are longitudinal which provides an opportunity for researchers to avoid causality issues.
We analyzed data on survey respondents instead of household heads because the SCF does not provide information on key variables (e.g., race) for the household head. The respondent in a household is defined as, ―the economically dominant single individual or the financially most knowledgeable member of the economically dominant couple‖ (Kennickell, 2010, p. 4). Survey questions focus on the primary economic unit, which ―includes the core individual or couple and any other people in the household or away at school who were financially interdependent with that person or couple‖ (Kennickell, 2010, p. 4).
The aggregate sample for this study consists of all 3,857 households in the SCF, from which we created two subsamples. We restricted the sample to include only respondents who graduated from a four-year college (n = 2,385) to test whether the effects of student loan debt on financial well-being are mitigated by college completion. We then restricted the sample to students with outstanding student loan debt (n = 543) to determine whether the amount of student loan debt determines household asset amounts.
Measures
We used the macro created for use with the 2007–2009 survey panel to construct the variables in this sample.2
Dependent variables
Retirement savings equals IRAs, Keogh accounts, and other pension accounts from which the owner can make withdrawals or take out loans (e.g., 401[k] accounts).3 We transformed retirement savings using the inverse hyperbolic sine (IHS) (see Pence, 2006). This was done, in part, to make comparisons with other studies (e.g., Elliott & Nam, 2013). The transformation can be expressed as:
sinh-1(θa) = θ-1ln(θa + [θ2a2 + 1]½)
in which θ is a scaling parameter and a is assets. To make interpretation of results easier, we converted IHS assets values back into dollar amounts.
2 The macro can be found at http://www.federalreserve.gov/econresdata/scf/files/fedstables.macro.txt. 3 The SCF variable code is RETQLIQ. For more information on this variable go to http://www.wealthandwant.com/issues/wealth/SCF_defs.html.

STUDENT DEBT AND DECLINING RETIREMENT SAVINGS
C E N T E R F O R S O C I A L D E V E L O P M E N T
W A S H I N G T O N U N I V E R S I T Y I N S T . L O U I S
9
The conversion can be expressed as:
( + )
and can be considered a marginal effect of a change in independent variable X on dollars of assets w,
where = n ( ), θ is a scaling parameter for IHS transformation, and is a coefficient for variable . The IHS marginal effects depend on the chosen value of θ. Regression estimates in this study are based on a θ of 0.0003, the optimal value as estimated by the maximum likelihood method.4
Covariates We include eight covariates in our analyses: (a) respondent’s income, (b) four-year college or postgraduate degree of any household member, (c) respondent’s occupational prestige, (d) respondents’ age (e) respondent’s marital status, (f) household’s use of welfare programs, (g) respondent’s race, and (h) respondent’s health status.5
Income is a continuous variable. Respondents were asked how much total income they received from all sources before taxes and other deductions in 2007. We determined four-year college graduate status—a dichotomous variable—using the respondent’s answer to the survey question about the highest grade of school or year of college attained by any member of the household. We measured occupational prestige using the SCF’s classifications of respondents’ job titles: professional, technical/service, other, and not working. Age is a continuous variable. The SCF measured marital status by asking respondents if they are married, living with a partner, separated, divorced, widowed, or never married, which we coded as married = 1 and all others = 0. The survey measured the use of welfare programs by asking respondents if they or anyone else in the household receives income from Temporary Assistance for Needy Families (TANF), the Supplemental Nutrition Assistance Program (SNAP), or other forms of welfare or assistance, such as Social Security Insurance (SSI). Respondents described themselves as White, Black, Hispanic, or Asian and measured their health status by choosing one of the following categories: excellent, good, fair, or poor, which we coded as excellent = 4, good = 3, fair = 2, and poor = 1.
We included two variables of interest: (a) retirement savings (described above) and (b) outstanding student loan debt amount. The SCF asked respondents whether they or anyone in their household owes money or has outstanding student loan debt. We drew all controls from the 2007 wave of the SCF using the macro provided by SCF (see footnote 1).
Analysis Plan
Median regression
We used Stata (version 12) and median regression to analyze the data. According to Pence (2006), median regression offers two advantages over ordinary least squares regression. First, median regression can handle extreme values in data without a major distortion in estimation because it is affected by the order of the data only. Second, the difference-in-difference estimator by median regression is an unbiased estimator of percentage change (Wooldridge, 2002). Using a series of
4 To calculate the optimal values we used a macro created by Pence (2006) available at http://works.bepress.com/karen_pence/16/. 5 The SCF measured unemployment by asking respondents whether they were unemployed and looking for work at any time during the past twelve months. We did not use the unemployment variable in the main models but used it to replace occupational prestige in supplemental models not presented here. Findings are consistent with models that used occupational prestige and are available upon request.

STUDENT DEBT AND DECLINING RETIREMENT SAVINGS
C E N T E R F O R S O C I A L D E V E L O P M E N T
W A S H I N G T O N U N I V E R S I T Y I N S T . L O U I S
10
median regression analyses, we estimate the effect of outstanding 2007 student loan debt on 2009 assets using three sample groups: the aggregate sample, a sample of four-year college graduates, and a sample of respondents between the ages of 30 and 60.
Missing data and adjustment of standard errors
Because many respondents in dataset were reluctant to reveal the values of their assets (Kennickell, 1998), imputation for unbiased model estimation was inevitable. This introduces uncertainty into the process. Additionally, median regression standard errors and median regression standard errors potentially are inaccurate because of the heteroscedasticity. Finally, standard errors should be adjusted because of the complex stratification and clustering in the SCF sample design. The SCF data do not provide information on respondent confidentiality.
We used the same methods Pence (2006) used in her study with tools provided by the SCF to adjust standard errors for heteroscedasticity, survey design, and imputation uncertainty. The first method we used was bootstrapping, using 999 bootstrapped sample weight replicates provided by the SCF (Kennickell, 1998, 2010; Pence, 2006). We also used the repeated-imputation inference technique to adjust the standard errors for imputation uncertainty (Pence, 2002, 2006).
Sensitivity analysis
We estimated models restricting the sample by (a) whether an individual with a four-year college degree or postgraduate degree lives in the household and (b) the respondent’s age. In the main models, we control for four-year college graduation, but by restricting the sample to households in which a member has a four-year or postgraduate degree, we are able to better account for differences that might result from having a four-year degree (see Table 6). We restricted our sample to those ages 30 to 60 years. We used 60 years as the cutoff because retirement options might affect saving decisions for those older than 60 (Pence, 2006). Results are similar to those of the aggregate sample (see the Appendix).
Results
Sample characteristics
In both surveys, about 56% of households reported having retirement savings. Surprisingly, median retirement savings increased slightly from $44,013 in 2007 to $47,500 in 2009. Approximately 36% of households have a family member who is a four-year college graduate or higher, and 18% have an average of $26,018 in student loan debt. The average respondent’s age is approximately 52 years (minimum 19; maximum 95). Median income in 2007 is $50,054, and 12% of households use welfare programs (Table 1).

STUDENT DEBT AND DECLINING RETIREMENT SAVINGS
C E N T E R F O R S O C I A L D E V E L O P M E N T
W A S H I N G T O N U N I V E R S I T Y I N S T . L O U I S
11
Table 1. Sample Characteristics (N = 113,178,790)
Number or mean % or median
Student loan use 19,891,202 18% Amount of student loan debt (student loan users only) $26,018 $15,000 2009 retirement accounts 63,571,527 56% 2009 retirement savings amounts among those with retirement accounts $138,771 $47,500 2007 retirement savings 62,948,803 56% 2007 retirement savings amounts among those with retirement accounts $161,5779 $44,013 Four-year college graduate 41,136,768 36% Age 52 50.00 Income $88,9727 $50,054 Occupational prestige
Professional 32,674,464 29% Technical services 24,703,413 22% Other 23,807,313 21% Not working 31,993,600 28%
Married 67,511,805 60% Uses welfare 13,226,579 12% Race
White 83,313,885 74% Black 14,911,713 13% Hispanic 10,160,730 9% Asian 4,792,463 4%
Has health insurance 104,111,747 92%
Note: Weighted data are from the SCF 2007–2009. SCF imputes data using multiple imputations. Column percentages are rounded to the nearest whole percent or number.
Sample characteristics by student loan use
Table 2 provides information about student loan borrowers. Among respondents with four-year college degrees, 24% live in households with outstanding student loan debt. The median age of this group is about 43 years. In contrast, 76% of households with four-year college graduates live in households with no outstanding student loan debt. The median age of this group is 52 years. One third of people who took out student loans did not get a degree. The median household income is $57,509 for households with student loan debt and $47,923 for households with no student loan debt.6 A higher percentage of Black respondents’ households (28%) have loans than Hispanic respondents’ households (14%) (Table 2).
6 All households with student loan debt have a member that has at least some college, while households with no student loan debt may or may not have a member with any college. This might explain income differences.

STUDENT DEBT AND DECLINING RETIREMENT SAVINGS
C E N T E R F O R S O C I A L D E V E L O P M E N T
W A S H I N G T O N U N I V E R S I T Y I N S T . L O U I S
12
Table 2. Sample Characteristics by Student Loan Use (N = 113,178,790) Has student loans Does not have student loans
Number or mean
% or median Number or mean
% or median
Income $75,443 $57,509 $91,855 $47,923 Four-year college graduate 9,819,552 24% 31,065,119 76% Not a four-year college graduate 10,071,649 14% 62,222,470 86% Occupational prestige
Professional 7,587,411 23% 25,087,053 78% Technical services 5,459,732 22% 19,243,681 78% Other 4,402,555 19% 19,404,758 82% Not working 2,441,503 8% 29,552,097 92%
Age 41 39 54 52 Married 13,035,998 19% 54,475,807 81% Not married 6,855,204 15% 38,811,782 84% Uses welfare 2,289,349 99% 10,937.230 <1% Does not use welfare 17,601,853 18% 82,350,359 82% Race
White 13,241,607 16% 70,072,278 84% Black 4,167,678 28% 10,744,035 72% Hispanic 1,426,037 14% 8,734,693 86% Asian 1,055,880 22% 3,736,582 78%
Health status Excellent 6,024,499 20% 24,004,961 80% Good 10,730,265 19% 44,470,985 81% Fair 2,557,727 12% 19,286,623 88% Poor 578,710 10% 5,525,018 91%
Note: Weighted data are from the SCF 2007–2009. All columns are rounded to the nearest whole percent.
Retirement savings by student loan use
Table 3 provides information on retirement savings by student loan use. Median 2007 retirement savings for households with no outstanding student loan debt ($57,994) are more than twice that of households with outstanding student loan debt ($23,922). To a lesser extent, this pattern holds true for 2009 retirement savings amounts ($55,000) for those with no student loan debt vs. $25,000 for those with student loan debt). Households with no outstanding student loan debt had a larger decrease in retirement savings from 2007 to 2009 (-$2,673) than households with outstanding student loan debt (-$1,176).
Table 3. Retirement Savings by Student Loan Use (N = 51,089,468)
Has student loans Does not have student loans
Variables Number or mean
% or median
Number or mean
% or median
2009 retirement savings $81,794 $25,000 $150,395 $55,000 2007 retirement savings $87,582 $23,922 $185,946 $57,994 Change in retirement savings -$5,789 -$1,176 -$35,551 -$2,673 Change in retirement savings/retirement savings 2009 (%)
7% 5% 24%
5%
Note: Weighted data are from the SCF 2007–2009. All columns are rounded to the nearest whole percent.

STUDENT DEBT AND DECLINING RETIREMENT SAVINGS
C E N T E R F O R S O C I A L D E V E L O P M E N T
W A S H I N G T O N U N I V E R S I T Y I N S T . L O U I S
13
Predicting 2009 retirement savings by percentile (25th, 50th, and 75th) of 2007 retirement savings
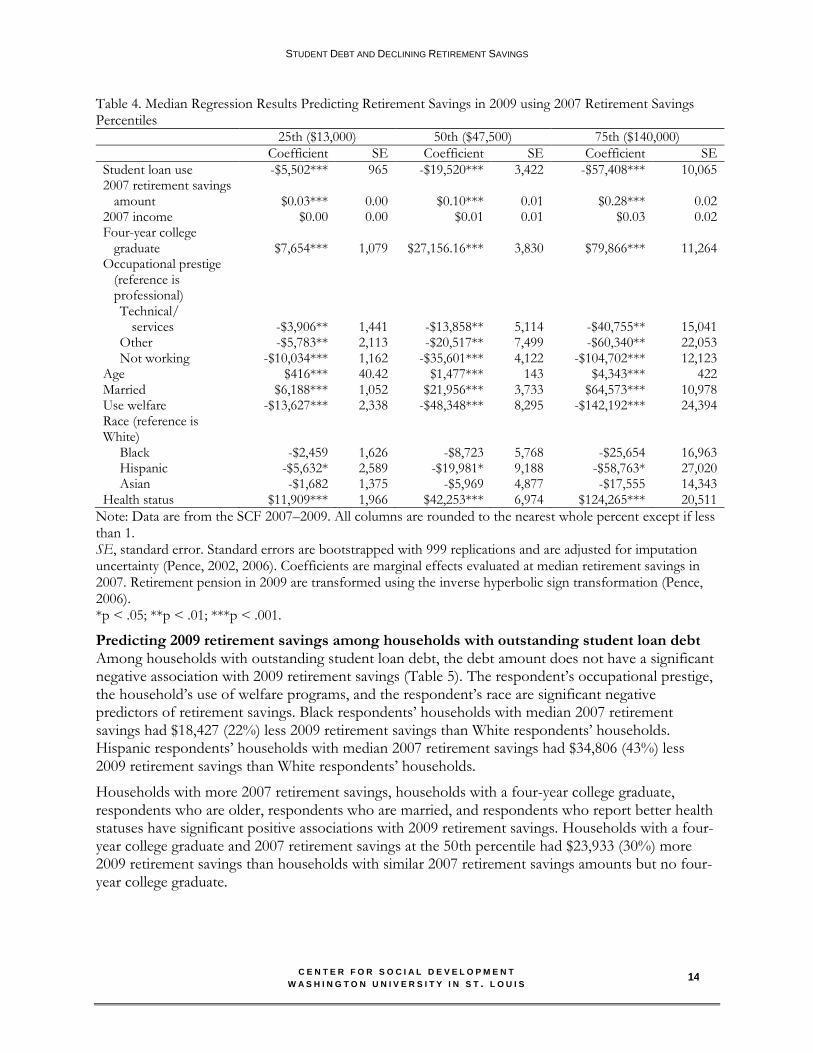
In the next series of analyses, we evaluate the marginal effects of coefficients at the 25th, 50th, and 75th percentiles. With regard to our variable of interest, having student loan debt is an important predictor of having retirement savings after holding all other factors constant. The association between student loan debt and 2009 retirement savings is negative (Table 4). A household at the 25th percentile with outstanding student debt and 2007 retirement savings of $13,000 had $5,502 (42%) less 2009 retirement savings than a similar household with no student debt. A household at the 50th percentile with outstanding student debt and 2007 retirement savings of $47,500 had $19,520 (41%) less 2009 retirement savings than a similar household with no student debt. A household at the 75th percentile with outstanding student debt and 2007 retirement savings of $140,000 had $57,408 (41%) less 2009 retirement savings than a similar household with no student debt.
Lower occupational prestige of the respondent, the household’s use of welfare programs, and the respondent’s being of Hispanic ethnicity have significant negative associations with 2009 retirement savings. Households that use welfare programs and had 2007 retirement savings at the 25th, 50th, or 75th percentiles had less 2009 retirement savings (-$13,627 at the 25th percentile, a loss of 105%; -$48,349 at the 50th percentile, a loss of 102%; and -$142,192 at the 75th percentile, a loss of 102%) than households with similar amounts of 2007 retirement savings that do not use welfare programs. Hispanic respondents’ households and households with 2007 retirement savings at the 25th, 50th, or 75th percentiles also have fewer 2009 assets (-$5,634 at the 25th percentile, a loss of 43%; -$19,981 at the 50th percentile, a loss of 42%; and -$58,763 at the 75th percentile, a loss of 42%) than White households with similar levels of 2007 retirement savings.
In contrast, having higher 2007 retirement savings, a four-year college graduate living in the household, and respondents who are older, are married, and report better health statuses are all associated with an increase in 2009 retirement savings amounts. A household with a four-year college graduate had more 2009 retirement savings than a household with similar 2007 retirement savings amounts but no four-year college graduate: $7,654 at the 25th percentile a gain of 59%; $27,156 at the 50th percentile, a gain of 57%; and $79,866 at the 75th percentile, a gain of 57%. A household with an older respondent had more 2009 retirement savings than a household with similar 2007 retirement savings amounts but a younger respondent: $416 at the 25th percentile, a gain of 3%; $1,477 at the 50th percentile, a gain of 2%; and $4,343 at the 75th percentile, gain of 4%. A household with a married respondent had more 2009 retirement savings than a household with similar 2007 retirement savings amounts whose respondent is not married: $6,188.23 at the 25th percentile, a gain of 48%; $21,956 at the 50th percentile, a gain of 46%; and $64,573 at the 75th percentile, a gain of 46%. A household whose respondent reported a better health status had more 2009 retirement savings than a household with similar 2007 retirement savings amounts whose respondent reported a worse health status: $11,909 at the 25th percentile, a gain of 92%; $42,253 at the 50th percentile, a gain of 89%; and $124,265 at the 75th percentile, a gain of 88%.
STUDENT DEBT AND DECLINING RETIREMENT SAVINGS
C E N T E R F O R S O C I A L D E V E L O P M E N T
W A S H I N G T O N U N I V E R S I T Y I N S T . L O U I S
14
Table 4. Median Regression Results Predicting Retirement Savings in 2009 using 2007 Retirement Savings Percentiles
25th ($13,000) 50th ($47,500) 75th ($140,000)
Coefficient SE Coefficient SE Coefficient SE
Student loan use -$5,502*** 965 -$19,520*** 3,422 -$57,408*** 10,065 2007 retirement savings
amount $0.03*** 0.00 $0.10*** 0.01 $0.28*** 0.02 2007 income $0.00 0.00 $0.01 0.01 $0.03 0.02 Four-year college
graduate $7,654*** 1,079 $27,156.16*** 3,830 $79,866*** 11,264 Occupational prestige
(reference is professional) Technical/
services -$3,906** 1,441 -$13,858** 5,114 -$40,755** 15,041 Other -$5,783** 2,113 -$20,517** 7,499 -$60,340** 22,053 Not working -$10,034*** 1,162 -$35,601*** 4,122 -$104,702*** 12,123
Age $416*** 40.42 $1,477*** 143 $4,343*** 422 Married $6,188*** 1,052 $21,956*** 3,733 $64,573*** 10,978 Use welfare -$13,627*** 2,338 -$48,348*** 8,295 -$142,192*** 24,394 Race (reference is White)
Black -$2,459 1,626 -$8,723 5,768 -$25,654 16,963 Hispanic -$5,632* 2,589 -$19,981* 9,188 -$58,763* 27,020 Asian -$1,682 1,375 -$5,969 4,877 -$17,555 14,343
Health status $11,909*** 1,966 $42,253*** 6,974 $124,265*** 20,511
Note: Data are from the SCF 2007–2009. All columns are rounded to the nearest whole percent except if less than 1. SE, standard error. Standard errors are bootstrapped with 999 replications and are adjusted for imputation uncertainty (Pence, 2002, 2006). Coefficients are marginal effects evaluated at median retirement savings in 2007. Retirement pension in 2009 are transformed using the inverse hyperbolic sign transformation (Pence, 2006). *p < .05; **p < .01; ***p < .001.
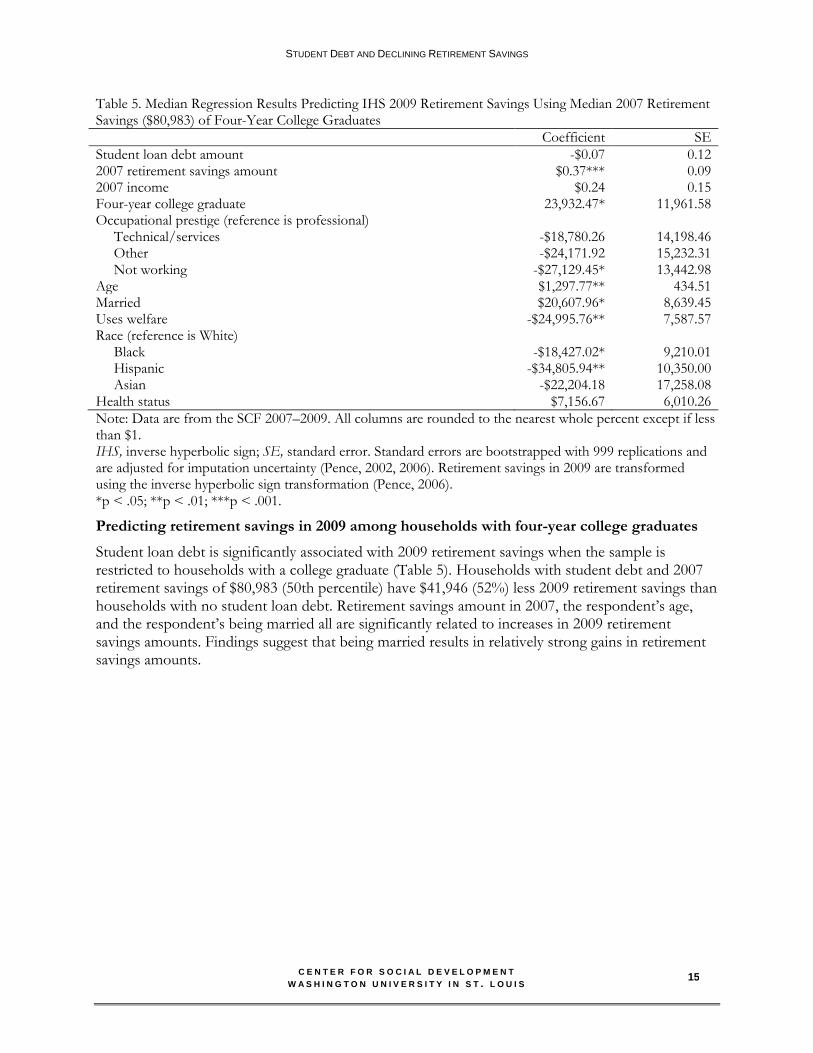
Predicting 2009 retirement savings among households with outstanding student loan debt Among households with outstanding student loan debt, the debt amount does not have a significant negative association with 2009 retirement savings (Table 5). The respondent’s occupational prestige, the household’s use of welfare programs, and the respondent’s race are significant negative predictors of retirement savings. Black respondents’ households with median 2007 retirement savings had $18,427 (22%) less 2009 retirement savings than White respondents’ households. Hispanic respondents’ households with median 2007 retirement savings had $34,806 (43%) less 2009 retirement savings than White respondents’ households.
Households with more 2007 retirement savings, households with a four-year college graduate, respondents who are older, respondents who are married, and respondents who report better health statuses have significant positive associations with 2009 retirement savings. Households with a four-year college graduate and 2007 retirement savings at the 50th percentile had $23,933 (30%) more 2009 retirement savings than households with similar 2007 retirement savings amounts but no four-year college graduate.
STUDENT DEBT AND DECLINING RETIREMENT SAVINGS
C E N T E R F O R S O C I A L D E V E L O P M E N T
W A S H I N G T O N U N I V E R S I T Y I N S T . L O U I S
15
Table 5. Median Regression Results Predicting IHS 2009 Retirement Savings Using Median 2007 Retirement Savings ($80,983) of Four-Year College Graduates
Coefficient SE
Student loan debt amount -$0.07 0.12 2007 retirement savings amount $0.37*** 0.09 2007 income $0.24 0.15 Four-year college graduate 23,932.47* 11,961.58 Occupational prestige (reference is professional)
Technical/services -$18,780.26 14,198.46 Other -$24,171.92 15,232.31 Not working -$27,129.45* 13,442.98
Age $1,297.77** 434.51 Married $20,607.96* 8,639.45 Uses welfare -$24,995.76** 7,587.57 Race (reference is White)
Black -$18,427.02* 9,210.01 Hispanic -$34,805.94** 10,350.00 Asian -$22,204.18 17,258.08
Health status $7,156.67 6,010.26
Note: Data are from the SCF 2007–2009. All columns are rounded to the nearest whole percent except if less than $1. IHS, inverse hyperbolic sign; SE, standard error. Standard errors are bootstrapped with 999 replications and are adjusted for imputation uncertainty (Pence, 2002, 2006). Retirement savings in 2009 are transformed using the inverse hyperbolic sign transformation (Pence, 2006). *p < .05; **p < .01; ***p < .001.
Predicting retirement savings in 2009 among households with four-year college graduates
Student loan debt is significantly associated with 2009 retirement savings when the sample is restricted to households with a college graduate (Table 5). Households with student debt and 2007 retirement savings of $80,983 (50th percentile) have $41,946 (52%) less 2009 retirement savings than households with no student loan debt. Retirement savings amount in 2007, the respondent’s age, and the respondent’s being married all are significantly related to increases in 2009 retirement savings amounts. Findings suggest that being married results in relatively strong gains in retirement savings amounts.

STUDENT DEBT AND DECLINING RETIREMENT SAVINGS
C E N T E R F O R S O C I A L D E V E L O P M E N T
W A S H I N G T O N U N I V E R S I T Y I N S T . L O U I S
16
Table 6. Median Regression Results Predicting IHS 2009 Retirement Pension Using 2007 Median Retirement Savings ($80,983) for Four-Year College Graduates
Coefficient SE
Student loan use -$41,946*** 9,250 2007 retirement pension amount $0.13*** 0.01 2007 income $0.01 0.01 Occupational prestige (reference is professional)
Technical/services -$23,041* 9,302 Other -$57,251** 17,577 Not working -$63,188*** 9,584
Age $2,553*** 327 Married $42,764*** 7,324 Uses welfare -$87,657*** 20,003 Race (reference is White)
Black -$22,415 15,181 Hispanic -$24,453 16,118 Asian -$9684 9,648
Health status $32,921 52,448
Note: Data are from the SCF 2007–2009. IHS, inverse hyperbolic sign; SE, standard error. Standard errors are bootstrapped with 999 replications and are adjusted for imputation uncertainty (Pence, 2002, 2006). Retirement savings in 2009 are transformed using the inverse hyperbolic sign transformation (Pence, 2006). *p < .05; **p < .01; ***p < .001.
Discussion
About 18% of households in our sample have outstanding student loan debt with an average of $26,018 in 2007. Our first research question in this study is whether having student loan debt is associated with 2009 retirement savings amounts. We find that the median 2009 retirement savings amount among households with no outstanding student loan debt ($55,000) is just over twice that of households with outstanding student debt ($25,000). After controlling for demographic factors, we find that the pattern suggested by the descriptive data remains: having outstanding student loan debt is associated with having less retirement savings.
A hypothetical household that has exactly the median amount of retirement savings in 2007 ($47,500) and outstanding student loan debt had a 41% greater loss of retirement savings in 2009 than a household with similar levels of 2007 retirement savings but no student loan debt. The finding that having student loan debt is associated with having less retirement savings is consistent with past research (Hiltonsmith, 2013). More generally, the idea that student loan debt might negatively affect postgraduation outcomes is consistent with previous research. For example, findings suggest that students who graduate from a four-year college delay purchasing major assets such as a car or a home (Shand, 2007; Stone, Van Horn & Zukin, 2012), delay marriage (Gicheva, 2011), and have less net worth (Elliott & Nam, 2013; Hiltonsmith, 2013).
Our second research question in this study is whether the amount of outstanding student loan debt is associated with retirement savings amounts. We find that having higher amounts of student loan debt may not result in greater retirement savings losses, which suggests that amount might not matter, just having any debt might reduce retirement savings. However, future research may want to examine whether different thresholds (e.g., less than $10,000, $10,000 to $19,999, etc.) of student debt reduce retirement savings. This is a preliminary finding, and future research using more detailed

STUDENT DEBT AND DECLINING RETIREMENT SAVINGS
C E N T E R F O R S O C I A L D E V E L O P M E N T
W A S H I N G T O N U N I V E R S I T Y I N S T . L O U I S
17
data should control for number of years out of college. People who have graduated more recently may have accumulated less retirement savings.
Our third research question in this study is whether retirement savings amounts are different for four-year college graduates with outstanding student loan debt than that of their counterparts with no student loan debt. We find that households with median retirement savings, a four-year college graduate, and outstanding student loan debt have $41,946 (52%) less retirement savings than a similar household with a four-year college graduate and no outstanding student loan debt. This is consistent with past research on student debt and retirement savings (Hiltonsmith, 2013).
It is important to highlight the finding that households with a four-year college graduate have more retirement savings than households without a four-year college graduate while controlling for student loans. This suggests that getting a college degree pays off, even if the rewards are unequal for those with and without outstanding student loan debt.
Limitations
We cannot rule out that student loan debt may be a marker for larger but unobserved household economic challenges. In other words, having outstanding student loan debt may not result in the decline in retirement savings. We mitigated this potential somewhat by controlling for a number of factors believed to be important for predicting household retirement savings. Also, the consistency of our findings with previous research (Hiltonsmith, 2013) reinforces our findings. However, findings from this study suggest only that there might be an association between student loan debt and retirement savings. We cannot completely rule out the possibility that some other factor may be causing retirement savings to decline. Moreover, the 2007 to 2009 period was a unique time for financial markets, and our findings may speak more to the potential vulnerability of households with student loan debt during periods of recession than during nonrecessionary periods.
Policy implications
The main policy implication of this study is that outstanding student loan debt may reduce retirement savings amounts among households in the short term. However, our findings are a first look at this question, and more research should to refute or substantiate these findings. Moreover, the policy issues are complex and must be considered within the broader context of educational finance.
Conclusion
An emerging body of evidence that includes this study challenges the long-held assumption within economics and education field that students who graduate from college with student loan debt are no worse off than students who graduate with no student loan debt. This research goes beyond examining lifetime earnings or income to examining student loan debt’s effects on college attendee’s wealth accumulation. When wealth is considered, research suggests that even though graduates who leave college with debt may have the same earning capacity as those who do not have debt, their capacity for accumulating wealth is unequal. Wealth is a key component in determining households’ ability to reverse cycles of poverty and achieve economic mobility (Sherraden, 1991). Thus, higher education and higher education financing may reinforce patterns of disadvantage.

STUDENT DEBT AND DECLINING RETIREMENT SAVINGS
C E N T E R F O R S O C I A L D E V E L O P M E N T
W A S H I N G T O N U N I V E R S I T Y I N S T . L O U I S
18
Appendix. Median Regression Results Predicting 2009 Retirement Pension Using 2007 Median Retirement
Savings ($11,392) for Respondents Ages 30 to 60 Years Coefficient SE
Student loan use -$4,801.97*** 1,186.69 2007 retirement pension amount $0.03*** 0.00 2007 income $0.00 0.00 Four-year college graduate $6,504.41*** 1,210.47 Occupational prestige (reference is professional)
Technical/services -$3,036.88* 1,252.65 Other -$4,817.88* 2,107.91 Not working -$3,669.20 2,373.21
Age $368.89*** 68.51 Married $4,517.98** 1,316.86 Uses welfare -$13,833.65*** 2,684.47 Race (reference is White)
Black -$3,576.08* 1,823.87 Hispanic -$4,994.28* 2,426.75 Asian -$1,909.81 1,477.53
Health status $11,302.66*** 2,195.24
Note: Data are from the SCF 2007–2009. IHS, inverse hyperbolic sign; SE, standard error. Standard errors are bootstrapped with 999 replications and are adjusted for imputation uncertainty (Pence, 2002, 2006). Retirement savings in 2009 are transformed using the inverse hyperbolic sign transformation (Pence, 2006). *p < .05; **p < .01; ***p < .001.
STUDENT DEBT AND DECLINING RETIREMENT SAVINGS
C E N T E R F O R S O C I A L D E V E L O P M E N T
W A S H I N G T O N U N I V E R S I T Y I N S T . L O U I S
19
References
Andriotis, A. M. (2012). How student loans could hit your social security. Retrieved from http://www.marketwatch.com/story/how-student-loans-could-hit-your-social-security-2012-08-10
Baum, S. (1996). New Directions in Student Loans: Intergenerational Implications. Journal of Student Financial Aid 26(2): 7–18.
Benjamin, D. J. (2003). Does 401(k) eligibility increase saving? Evidence from propensity score subclassification. Journal of Public Economics, 87(5–6), 1259–1290. doi:10.1016/S0047-2727 (01)00167-0
Benartzi, S., & Thaler, R. H. (2007). Heuristics and biases in retirement savings behavior. Journal of Economic Perspectives 21(3), 81–104.
Bricker, J., Bucks, B., Kennickell, A. B., Mach, T. L., & Moore, K. B. (2011). Surveying the aftermath of the storm (Finance and Economics Discussion Series 2011-17). Retrieved from Board of Governors of the Federal Reserve System website: http://www.federalreserve.gov/pubs/ feds/2011/201117/201117pap.pdf
Butrica, B. A., & Issa, P. (2010). Retirement account balances (Fact Sheet on Retirement Policy, January 2010). Washington, DC: The Urban Institute.
Butrica, B. A., Zedlewski, S. R., & Issa, P. (2010). Understanding early withdrawals from retirement accounts (Retirement Policy Program Discussion Paper No. 10-02). Retrieved from Urban Institute website: http://www.urban.org/UploadedPDF/412107-early-withdrawals.pdf
Carnevale, A. P., & Strohl, J. (2010). How increasing college access is increasing inequality, and what to do about it. In R. Kahlenberg (Ed.), Rewarding strivers: Helping low-income students succeed in
college (pp. 1‒231). New York, NY: Century Foundation Books.
Consumer Financial Protection Bureau. (2013). Student loan affordability: Analysis of public input on impact and solutions. Washington, DC: Author.
College Board. (2012). Trends in student aid 2012: Trends in higher education series. New York, NY: Author.
DeWitt, L. (1996). Origins of the three-legged stool metaphor for Social Security (Research Note #1). Retrieved from http://www.socialsecurity.gov/history/stool.html
Dwyer, R. E., McCloud, L., & Hodson, R. (2011). Youth debt, mastery, and self-esteem: Class-stratified effects of indebtedness on self-concept. Social Science Research, 40, 727–741.
Duflo, E., Gale, W. G., Liebman, J., Orszag, P., & Saez, E. (2006). Saving incentives for low- and middle-income families: Evidence from a field experiment with H&R Block. Quarterly Journal of Economics, 121(4), 1311–1346. doi:10.1093/qje/121.4.1311
Elliott, W., & Friedline, T. (2013). You pay your share, we’ll pay our share. Economics of Education
Review, 33(1), 134‒153.
Elliott, W., & Nam, I. (2013). Reducing student loan debt through parents’ college savings (CSD Working Paper 13-07). St. Louis, MO: Washington University, Center for Social Development. Retrieved from http://csd.wustl.edu/Publications/Documents/WP13-07.pdf
STUDENT DEBT AND DECLINING RETIREMENT SAVINGS
C E N T E R F O R S O C I A L D E V E L O P M E N T
W A S H I N G T O N U N I V E R S I T Y I N S T . L O U I S
20
Elliott, W., Song, H-a, and Nam, I. (2013). Small-dollar children’s saving accounts and children’s college outcomes by income level. Children and Youth Services Review, 35(3), 560–571.
Engen, E. M., Gale, W. G., & Scholz, J. K. (1996). The illusory effects of saving incentives on saving. Journal of Economic Perspectives, 10(4), 113–138. doi:10.1257/jep.10.4.113
Federal Reserve Bank of New York. (2012). Student loan debt by age group. Retrieved from http://www.newyorkfed.org/studentloandebt/
Fry, R. (2012). A record one-in-five households now owe student loan debt. Retrieved from the Pew Research Center website: http://www.pewsocialtrends.org/2012/09/26/a-record-one-in-five-households-now-owe-student-loan-debt/
Gicheva, D. (2011). Does the student-loan burden weigh into the decision to start a family? Retrieved from http://www.uncg.edu/bae/people/gicheva/Student_loans_marriageMarch11.pdf
Heller, D. E., & Rogers, K. R. (2006). Shifting the burden: Public and private financing of higher education in the United States and implications for Europe. Tertiary Education and Management, 12(2), 91–117.
Hiltonsmith, R. (2013). At what cost? How student debt reduces lifetime wealth. Retrieved from http://www.demos.org/sites/default/files/publications/AtWhatCostFinal_Demos.pdf
Kennickell, A. B. (1998). Multiple imputation and disclosure protection: The case of the 1995 survey of consumer finances. Retrieved from the Board of Governors of the Federal Reserve System website: http://www.federalreserve.gov/econresdata/scf/files/impute98.pdf
Kennickell, A. B. (2010). Try, try again: Response and nonresponse in the 2009 SCF panel. Retrieved from the Board of Governors of the Federal Reserve System website: http://www.federalreserve.gov/econresdata/scf/files/ASA2010final.pdf
Lusardi, A., & Mitchell, O. S. (2007). Baby Boomer retirement security: The role of planning, financial literacy, and housing wealth. Journal of Monetary Economics, 54, 205–224.
Brigitte, M., & Shea, D. (2001). The power of suggestion: Inertia in 401(k) participation and savings behavior. Quarterly Journal of Economics 66(4): 1149–88.
Munnell, A. H., Soto, M., Webb, A., Golub-Sass, F., & Muldoon, D. (2008). Health care costs drive up the National Retirement Risk Index. Retrieved from Center for Retirement Research at Boston College website: http://crr.bc.edu/wp-content/uploads/2008/02/ib_8-3.pdf
Olsen, A., & Whitman, K. (2007). Effective retirement savings programs: Design features and financial education. Social Security Bulletin, 67(3), 53–72.
Pence, K. M. (2002). 401(k)s and household saving: New evidence from the survey of consumer finances. Retrieved from the Federal Reserve Board of Governors website: www.federalreserve.gov/pubs/feds/2002/200206/200206pap.pdf
Pence, K. M. (2006). The role of wealth transformation: An application to estimating the effect of tax incentives on savings. Contributions to Economic Analysis and Policy, 5(1), 1–24.
Poterba, J. M., Venti, S. F., & Wise, D. A. (1996). How retirement saving programs increase saving. Journal of Economic Perspectives, 10(4), 91–112. doi:10.1257/jep.10.4.91
http://www.pewsocialtrends.org/2012/09/26/a-record-one-in-five-households-now-owe-student-loan-debt/

STUDENT DEBT AND DECLINING RETIREMENT SAVINGS
C E N T E R F O R S O C I A L D E V E L O P M E N T
W A S H I N G T O N U N I V E R S I T Y I N S T . L O U I S
21
Poterba, J., Venti, S. F., & Wise, D. (2011). The composition and draw-down of wealth in retirement (NBER Working Paper 17536). Retrieved from The National Bureau of Economic Research website: http://www.nber.org/papers/w17536.pdf?new_window=1
Rothstein, J., & Rouse, C. E. (2011). Constrained after college: Student loans and early-career
occupational choices. Journal of Public Economics, 95, 149‒163.
Scholz, J. K. & Seshadri, A. (2008). Are All Americans Saving ‘Optimally’ for Retirement? Retrieved from http://www.ssc.wisc.edu/~scholz/Research/Are_All_Americans_v2.pdf
Scholz, J. K., Seshadri, A., & Khitatrakun, S. (2006). Are Americans saving ―optimally‖ for retirement? Journal of Political Economy, 114(4), 626–643.
Shand, J. M. (2007). The impact of early-life debt on the homeonwership rates of young households: An emperical investigation. Retreived from http://www.fdic.gov/bank/analytical/cfr/2008/jan/ CFR_SS_2008Shand.pdf
Shapiro, T., Meschede, T., & Osoro, S. (2013). The roots of the widening racial wealth gap: Explaining the Black-White economic divide. Waltham, MA: Brandeis University, Institute on Assets and Social Policy.
Sherraden, M. (1991). Assets and the poor: A new American welfare policy. Armonk, NY: M. E. Sharpe.
Somon, D., & Cheema, A. (2002). The effect of credit on spending decisions: The role of the credit limit and credibility. Marketing Science, 27, 32–53.
Stone, C., Van Horn, C., & Zukin, C. (2012). Chasing the American dream: Recent college graduates and the great recession. New Brunswick, NJ: Center for Workforce Development.
Wooldridge, J. M. (2002). Econometric analysis of cross section and panel data. Boston, MA: MIT Press.
Yuh, Y. (2011). Assessing adequacy of retirement income for U.S. households: A replacement ratio approach. Geneva Papers on Risk and Insurance: Issues and Practice 36(2), 304–23.
Suggested citation
Elliott, W., Grinstein-Weiss, M., & Nam, I. (2013). Student debt and declining retirement savings (CSD Working Paper 13-34). St. Louis, MO: Washington University, Center for Social Development.
Contact us
William Elliott 1545 Lilac Lane 309 Twente Hall Lawrence, KS 66044 Email: [email protected] Phone: (785) 864-2283 Fax: (785) 864-5277
Michal Grinstein-Weiss Campus Box 1196 One Brookings Drive St. Louis, MO 63130 Email: [email protected] Phone: (314) 935-8201 Fax: (314) 935-8661

STUDENT DEBT AND DECLINING RETIREMENT SAVINGS
C E N T E R F O R S O C I A L D E V E L O P M E N T
W A S H I N G T O N U N I V E R S I T Y I N S T . L O U I S
22
Ilsung Nam Hallym University Aging Institute Hallymdaehak-sil 1 Chunchon-si, Kangwon-do Korea, 200-702 Email: [email protected]