
Student Attitude and Gender in Relation to Student ...
39
Western Kentucky University TopSCHOLAR® Honors College Capstone Experience/esis Projects Honors College at WKU Spring 5-16-2014 Student Aitude and Gender in Relation to Student Participation in Physical Activity Kayla Steber Western Kentucky University, [email protected] Follow this and additional works at: hp://digitalcommons.wku.edu/stu_hon_theses Part of the Education Commons is esis is brought to you for free and open access by TopSCHOLAR®. It has been accepted for inclusion in Honors College Capstone Experience/ esis Projects by an authorized administrator of TopSCHOLAR®. For more information, please contact [email protected]. Recommended Citation Steber, Kayla, "Student Aitude and Gender in Relation to Student Participation in Physical Activity" (2014). Honors College Capstone Experience/esis Projects. Paper 495. hp://digitalcommons.wku.edu/stu_hon_theses/495
Transcript of Student Attitude and Gender in Relation to Student ...

Western Kentucky UniversityTopSCHOLAR®Honors College Capstone Experience/ThesisProjects Honors College at WKU
Spring 5-16-2014
Student Attitude and Gender in Relation toStudent Participation in Physical ActivityKayla SteberWestern Kentucky University, [email protected]
Follow this and additional works at: http://digitalcommons.wku.edu/stu_hon_theses
Part of the Education Commons
This Thesis is brought to you for free and open access by TopSCHOLAR®. It has been accepted for inclusion in Honors College Capstone Experience/Thesis Projects by an authorized administrator of TopSCHOLAR®. For more information, please contact [email protected].
Recommended CitationSteber, Kayla, "Student Attitude and Gender in Relation to Student Participation in Physical Activity" (2014). Honors College CapstoneExperience/Thesis Projects. Paper 495.http://digitalcommons.wku.edu/stu_hon_theses/495

STUDENT ATTITUDE AND GENDER IN RELATION TO
STUDENT PARTICIPATION IN PHYSICAL ACTIVITY
A Capstone Experience/Thesis Project
Presented in Partial Fulfillment of the Requirements for
The Degree Bachelor of Science with
Honors College Graduate Distinction at Western Kentucky University
By
Kayla M. Steber
*****
Western Kentucky University
2014
CE/T Committee:
Approved by
Dr. Pamela Jukes
Dr. Lisa Murley ________________________
Advisor
Nathan Phelps School of Teacher Education

Copyright by
Kayla M. Steber
2014

ii
ABSTRACT
The purpose of this research project was to determine how student gender and
attitude toward physical activity correspond to student participation in physical activity in
and outside the after-school program setting. Surveys were administered to parents and
the lead counselor of five different after-school programs located in the south-central part
of the United States. Surveys were used for data collection about student attitude and
physical activity. The lead counselor at each site provided information regarding number
of students in the program and the percent of students who were physically active at the
after-school program. The parent survey gathered information on the student attitude and
physical activity outside of the after-school program as well as parental attitude toward
physical activity. It was concluded that gender does impact student activity level and the
types of activities in which students participate. Males spend more time participating in
physical and more vigorous activities than females. However, around fourth grade the
percent of activity level begins to decrease for males and females. A link between student
attitude and physical activity level could not be determined. Further research could be
conducted to determine if the two are related.
Keywords: after-school programs; attitude; gender; participation; physical activity;
student

iii
Dedicated to all educators who inspired my
pursuit of a career in teaching.
iv
ACKNOWLEDGMENTS
I would like to thank my amazing advisors, Dr. Jukes and Dr. Murley, for guiding
me through the research process every step of the way. Without their support, dedication,
and critical feedback I would not have been able to produce this paper. Next, I want to
thank Community Education for working with me and allowing me to use their after-
school programs to collect data. The lead counselors and staff members at the after-
school program were welcoming and accommodating. Furthermore, I would like to thank
Paul Mooney who provided guidance through the Institutional Review Board process.
Without his care and understanding I would not have been able to conduct my research. I
want to thank the Honors College for the opportunity to engage in an undergraduate
thesis project. The staff members encouraged the completion of a thesis project and
helped answer any questions or concerns regarding my project. Lastly, I would like to
thank my friends and family who supported me throughout the whole process. They were
there to listen about ideas, frustrations, or concerns about this research project. Their
thoughtful support allowed me to “keep the end in mind”.

v
VITA
Kayla M. Steber (859) 319-3302
19 Hamon Drive • Danville, KY 40422 [email protected]
Objective:
To obtain an elementary education teaching position
Certification:
Grades K-5 May 2014
Education:
Western Kentucky University – Bowling Green, KY
Bachelor of Science Elementary Education May 2014
4.0 GPA
Honors College Graduate
Experience:
International Student Teacher
Werne, Germany April-May ‘14
Instructed ESL students in English
Developed a video presentation about experience
Attended professional development event
Student Teacher
Dishman-McGinnis Elementary School, Bowling Green, KY Spring 2014
Completed 6 weeks of teaching: K-2 math class & 3-5 reading
class
Conducted leadership project entailing a possible reward trip for
3rd
-5th
grades
Developed collaboration project to improve student behavior
Implemented technology: class Dojo, math manipulatives,
storyline online
Executed co-teaching techniques to enhance teaching and lessons
Attended faculty meetings and cluster planning meetings
Classroom Observation/Field Experience 2011-2013
Completed over 200 field experience hours in Warren
County/Bowling Green Schools
Conducted lessons in science and social studies
Academic Awards:
Scholar Athlete of the Year May 2014

vi
Outstanding Elementary Education Undergraduate Student May 2014
Scholar of the College Award for School of Teacher Education April 2014
Honors Thesis:
Student Attitude and Gender in Relation to Student Participation in Physical
Activity
Western Kentucky University REACH Conference March 2014
Research Across the Disciplines hosted by CEBS March 2014
Leadership Experiences:
Kappa Delta Pi Member 2011-present
President 2013-14, Historian 2012-13
Planned literacy nights (Alvaton and Lost River Elem.), community
service projects, Leader in Me book club, coordinated guest speakers
for professional development
Extra-Curricular Experiences:
Assistant Coach for SKY Soccer Club Present
FIFA certified soccer referee 2004-Present
Western Kentucky University Soccer Camps June 2011-2013
Student-Athlete: WKU Women’s Soccer Team 2010-2013
Study Abroad:
England – Program on History and Religion May/June 2013
Ecuador – Program on Development and Sustainability January 2013
Visited several elementary schools; Participated in Dental Varnish
Project
Volunteer Work:
International Education Week November 2013
Participant in International Quiz Bowl
A guide for the Giant Floor Map of South America
4-H Adult Camp Counselor 2008-2011
Professional Development:
Kappa Delta Pi webinars 2011-Present
Teach Like Your Hair is On Fire by Rafe Esquith Fall 2012
FIELDS OF STUDY
Major Field: Elementary Education

vii
TABLE OF CONTENTS
Page
Abstract ............................................................................................................................. ii
Dedication ......................................................................................................................... iii
Acknowledgments............................................................................................................. iv
Vita .................................................................................................................................... v
List of Tables……………………………………………………………………………viii
Chapters:
1. Introduction ........................................................................................................... 1
2. Method .................................................................................................................. 3
3. Results ................................................................................................................... 5
4. Discussion ............................................................................................................. 17
5. Limitations ............................................................................................................ 20
6. Further Research ................................................................................................... 21
References ......................................................................................................................... 22
Appendices ........................................................................................................................ 24

viii
LIST OF TABLES
Table Page
1 Organized Activities Students Participate
in Outside After-School Program ............................................................................... 6
2 Students Requesting Activities ................................................................................... 7
3 Collection of data about the Females and
Males in the After-School Programs from Lead Counselors ...................................... 7
4 Physical Activity Improving Attitude ......................................................................... 9
5 Average Time Students Spend Participating
in Physical Activity per Week by Gender ................................................................... 11
6 Average Time Students Spend Participating
in Physical Activity per Week by Grades ................................................................... 11
7 Number of Students who Prefer Physical
Activity or T.V. Based on Gender .............................................................................. 12
8 Number of Students who Prefer Physical
Activity or T.V. Based on Grade Level ...................................................................... 13
1
CHAPTER 1
INTRODUCTION
In recent decades the United States experienced a dramatic increase in the
number of children who are obese. According to the Centers for Disease Control and
Prevention (CDC), more than 9 million children ages 6 to 19 are overweight or in danger
of becoming obese, that number has tripled since 1980 (Cook, 2005). There are many
factors contributing to this epidemic, including poor eating habits and physical inactivity.
Obesity is a major health problem and if not addressed will potentially lead to serious
health issues in this generation. Schools have the opportunity to educate students about
the importance of exercising as part of a healthy lifestyle. However, in recent years
schools have cut or even eliminated student opportunities to engage in physical activity.
On average, elementary students currently receive structured physical education once a
week in addition to 20-30 minutes of recess time per day. Elementary schools and
teachers are focusing more on academic learning, which may be due to an increased
emphasis on test scores. With less time devoted during the day for physical activity, one
solution to this problem could be for after-school programs to promote physical activity.
According to the Educational Broadcasting Corporation (2004), after-school programs
are:
Community-driven, expanded learning opportunities that support developmentally
appropriate cognitive, social, physical, and emotional outcomes. In addition, these

2
programs offer a balanced program of academic support, arts and cultural enrichment,
recreation, and nutrition. After-school programs can run directly after school, or during
evenings, weekends, summer vacations, and holidays (para. 1).
Recent research studies have attempted to calculate the number of minutes
students spend being active in after-school programs. Beets, Huberty, and Beighle (2012)
found that students spend approximately 26.6 minutes per day in physical activity. Their
findings include a need for after-school programs to identify strategies that ensure
students are sufficiently active. The National AfterSchool Association (NAA, 2011)
suggests after-school programs allow students to obtain 30 minutes of physical activity
per day. Based on the study by Beets, Huberty, and Beighle (2012), students are falling
short of meeting the time recommended by the NAA. After-school programs have time
designated for students to engage in physical activity, so why are students not active?
Teachers and adult supervisors can offer students the opportunity to be active, but it is
ultimately the student who has to be motivated to participate.
The purpose of this study is to determine how student gender and attitude toward
physical activity correspond to student participation in physical activity in and outside the
after-school program. This study will attempt to answer the following research questions:
1. How does student attitude toward physical activity impact student activity
level?
2. How does gender affect student activity level and the types of activities in
which students participate?

3
CHAPTER 2
METHOD
The researcher began by developing a project to investigate the relationship
between student attitudes and gender with their level of physical activity in five
elementary after-school programs. A parental survey was developed with questions
addressing the child’s physical activity and attitude as well as parental attitude toward
physical activity. A second survey was prepared to be administered to the lead counselors
at each of the after-school programs. This survey gathered information related to the total
number of students in the after-school program by grade and gender, the percentage of
students active in the program, and in which activities the students preferred to participate
(See Appendices A and B). The researcher contacted the Community Education
Department staff, who operates the after-school programs in the targeted school districts,
to seek approval for research. Then a research proposal was submitted to the university
Human Subjects and Institutional Review Board (IRB). Upon IRB approval, the
researcher established dates and times with Community Education to visit five different
after-school programs and administer the survey to parents and the lead counselor at each
site. At each after-school program the researcher asked each parent to complete the
survey as they arrived to pick up their child. The research project was described and
documentation was given to each parent explaining the purpose of the project. The
parents had the option to not participate in the research. A survey was

4
completed for each child, so if a parent had more than one child in the after-school
program multiple surveys were completed. Out of the 194 surveys distributed, 162 were
completed and returned, an 83 percent return rate. The data from the surveys were
entered in an Excel spread sheet. Help was sought from a Microsoft Excel expert who
converted the data into percentages and comparisons for data analysis.

5
CHAPTER 3
RESULTS
The results from the data collection are presented below and organized by
research question. Tables are used to display the data gathered from the parent and lead
counselor surveys. The data provide evidence to support each research question.
Question 1: How does student attitude toward physical activity impact student
activity level?
Several questions in the parental survey addressed student attitude toward
physical activity. One question asked if the child requested the activities in which he or
she participates. The results of this question are displayed in Table 1. Out of the 142
parents who responded to the question, 102 identified their children participating in more
than one organized activity outside the after-school program.

6
As shown in Table 2, 144 out of 159 students requested the activities in which
they participate (displayed in Table 1) and 15 students did not. Of the 15 students who
did not request the activities there were eight male, six female, and one whose gender
was not indicated on the survey. There were more male students who did not request
activities. Of the fifteen students who did not request activities, five were second graders
and four were kindergarteners. There were four parents who said their child did not
request activities because the child did not participate in any activities.
Table 1
Organized Activities Students Participate in Outside After-School Program
Gradea 1 2 3 4 5 6 Grand Total
Running 1 1
Dance 1 1
Cheerleading 1 1 1 1 1 5
Archery
Baseball/Softball 3 3 1 1 2 10
Basketball 1 1 1 3
Football
Soccer 2 1 1 2 1 7
4-H or Scouting 2 2
Martial Arts 1 1
Swimming 1 2 3
Hockey 1 1
Gymnastics 2 2 1 5
Two or more Sports 15 23 20 17 18 9 102
None 1 1
Grand Total 26 29 32 22 21 12 142
Note. a Grade Level begin with Kindergarten; 1 represents kindergarten.

7
Table 2
Students Requesting Activities
Request Activities
Yes 144
No 15
Grand Total 159
Table 3 displays the average percentage of students who are active by grade and
gender. The lowest percentage of activity of female students was 57.5 in fifth grade; the
lowest percentage of active male students was 72 in second grade. The percentage of
active males exceeded 80 percent in all grades except second and fifth. The same cannot
be said for the females; only three grades were higher than 80 percent. The highest
percentage of active females was fourth grade at 87 percent. Overall, the percentage for
students active in the after-school programs was an average of 77.71 percent.
Table 3
Lead Counselor data about the Females and Males in the After-School (ASP)
Female
Gradea # in
ASPb
Average %
Activec
Activities
1 36 84 Crafts, Playground, Role Games, Tag
2 32 82 Crafts, Jump Rope, Role Game, Running,
Swings
3 30 62 Hula Hoop, Playground, Running, Soccer
4 30 87 Crafts, Dance, Dodge ball, Playground, Softball
5 21 62 Dance, Dodge ball, Playground, Softball
6 15 57.5 Dance, Kickball, Tag

8
Male
Gradea # in
ASPb
Average %
Activec
Activities
1 28 86 Dodge ball, Gym, Kickball, Role games,
Running
2 33 90 Dodge ball, Gym, Role games, Running
3 27 72 Baseball, Basketball, Dodge ball, Football,
Gym
4 30 96 Basketball, Dodge ball, Gym, Role games,
Running
5 21 81 Basketball, Dodge ball, Football, Gym,
Running
6 18 73 Basketball, Gym, Tag
Note. ASP= After-School Program a Grade Level begin with Kindergarten; 1 represents kindergarten.
b The number of students is a total of all five after-school programs.
c The percent of students active is an average calculated from all five after-school programs.
On the parental survey, the parents were asked if there was an improvement in
their child’s attitude due to participating in physical activity. This question does not
directly answer student attitude toward physical activity. However, if student attitude
improves because of physical activity, one can assume the student has a positive view of
physical activity. Table 4 displays that out of the 162 parent surveys collected, 152
responded that their children’s attitudes improved; ten parents indicated their children’s
attitudes did not improve. When examining the ten students whose attitude did not
improve, only students did not request the activities in which he/she participates. Gender
did not appear to be a factor, as there was an equal number of female and male students
whose attitudes did not improve. Out of ten students whose attitude did not improve, five

9
were in the fourth grade and the remaining five were in either kindergarten, first, or
second grade. There is no clear explanation for why those students’ attitudes did not
improve. Based on the data collected, there is not a clear correlation between student
attitude and gender or grade level.
Question 2: How does gender affect student activity level and the types of activities
in which they participate?
Gender does affect the physical activity levels of students. During the after-school
programs a higher percent of males participate in physical activity compared to females;
on average, 83.6 percent of males are active compared to 72.4 percent of females. When
looking at grade level, male students are more active than female students. As noted in
Table 3, the percentage of females who participate in physical activity begins to drop off
after the fourth grade. The percentage of kindergarten females who participate in physical
activity is 84%, while fifth grade it is 57.5% - a significant drop. Male student activity
level is higher than female activity level in all grade levels; the lowest percent of activity
for male students is second grade with 72 percent.
The data gathered from the counselors correspond to data gathered in the parent
survey. Table 5 shows the average physical activity time per week for males and females,
and Table 6 depicts the average time students spend participating in physical activity per
Table 4
Physical Activity Improving Attitude
Improves Attitude % of Total
Yes 152 0.94
No 10 0.06
Grand Total 162

10
week by grade level. On average, males participate 4.6 hours and females participate 4.3
hours per week. The difference in time is 0.3 hours, which confirms that males spend
more time participating in physical activity than females in and outside the after-school
program.
The average time given for physical activity per week was also examined by
grade level. Based on the data in Table 6, one can see that fifth grade students spend the
most time participating in physical activity per week, with an average of five hours. The
results indicate that students get approximately five hours per week of physical activity.
Therefore, these students are receiving more than 30 minutes of physical activity per day,
which is the recommended amount according to the National Afterschool Association
(NAA, 2011). For example, in fourth grade students are participating in physical activity
on average four hours per week. If the four hours were evenly divided throughout the
week, students would be active for 35 minutes per day. However, the hours per week are
an average; not all students are getting the necessary amount of physical activity needed.
Parents made estimates as to how much time their children actually spend per week
participating in physical activity, which may or may not be accurate. The data are an
estimate of how much time students spend in and outside of the after-school program
participating in organized sports and playing outside.

11
Table 6
Average Time Students Spend Participating in Physical Activity per Week by Grades
Gradea Time # of Students
1 4.00 31
2 4.61 33
3 4.74 34
4 4.85 26
5 4.00 24
6 5.00 12
Grand Total 4.53 160
Note. Time is calculated in hours.
a Grade Level starts at Kindergarten; 1 stands for kindergarten.
Another question the parental survey addressed whether the child preferred
physical activity or television. The data gathered led to some interesting findings and
conclusions. Table 7 illustrates the number of students who preferred physical activity or
television. More males were reported to prefer television over physical activity than
females; 73.91 percent of the females preferred physical activity compared to 24.64
percent who preferred television. For the males, 59.30 percent preferred physical activity
Table 5
Average Time Students Spend Participating in Physical Activity per Week by Gender
Gender Time # of Students
Male 4.64 86
Female 4.30 73
Grand Total 4.48 159
Note. Time is calculated in hours.

12
and 40.70 percent preferred television. Overall, a total of 65.81 percent preferred physical
activity over television, while approximately one-third of the students (33.55 percent)
preferred television.
Table 8 displays that as students get older their preference for physical activity
versus television begins to change, especially for males. In the third grade the percent of
students who prefer physical activity was 72 percent. In the fourth grade, however, there
is a shift; only 45.83 percent of the students prefer physical activity at that grade level.
The same trend is evident when examining the results displayed in Table 7 by gender. In
the third grade, 64.29 percent of male students prefer physical activity and 35.71 percent
prefer television. By the fourth grade, only 41.18 percent of male students prefer physical
activity and 58.82 percent prefer television. By the time they reach fourth grade, more
male students would rather watch TV than do some type of physical activity. For females,
this shift occurs in the fifth grade. Data show that 25 percent of fifth grade females prefer
Table 7
Number of Students who Prefer Physical Activity or T.V. Based on Gender
Gender Physical
Activity
%Prefer Physical
Activity
T.V.
%Prefer
T.V.
Both
Grand
Total
Female 51 73.91% 17 24.64% 1 69
Male 51 59.30% 35 40.70% 86
Total 102 65.81% 52 33.55% 1 155
Note. Data retrieved from 155 surveys
13
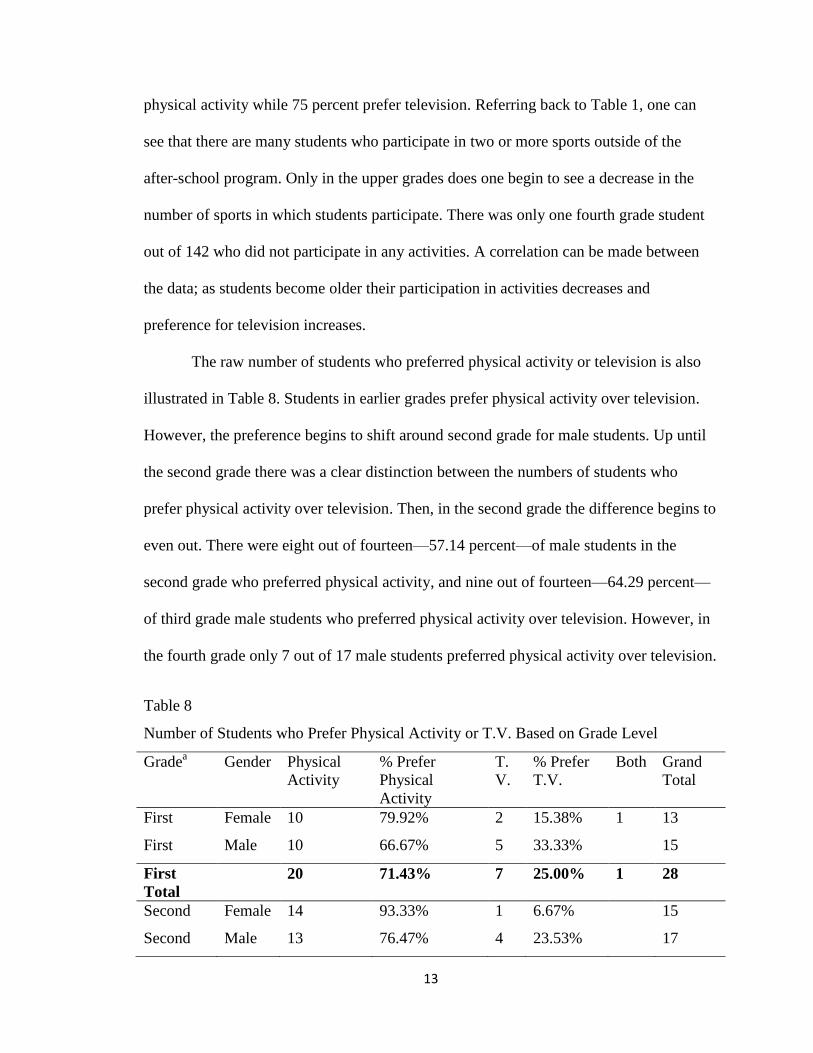
physical activity while 75 percent prefer television. Referring back to Table 1, one can
see that there are many students who participate in two or more sports outside of the
after-school program. Only in the upper grades does one begin to see a decrease in the
number of sports in which students participate. There was only one fourth grade student
out of 142 who did not participate in any activities. A correlation can be made between
the data; as students become older their participation in activities decreases and
preference for television increases.
The raw number of students who preferred physical activity or television is also
illustrated in Table 8. Students in earlier grades prefer physical activity over television.
However, the preference begins to shift around second grade for male students. Up until
the second grade there was a clear distinction between the numbers of students who
prefer physical activity over television. Then, in the second grade the difference begins to
even out. There were eight out of fourteen—57.14 percent—of male students in the
second grade who preferred physical activity, and nine out of fourteen—64.29 percent—
of third grade male students who preferred physical activity over television. However, in
the fourth grade only 7 out of 17 male students preferred physical activity over television.
Table 8
Number of Students who Prefer Physical Activity or T.V. Based on Grade Level
Gradea Gender Physical
Activity
% Prefer
Physical
Activity
T.
V.
% Prefer
T.V.
Both Grand
Total
First Female 10 79.92% 2 15.38% 1 13
First Male 10 66.67% 5 33.33% 15
First
Total
20 71.43% 7 25.00% 1 28
Second Female 14 93.33% 1 6.67% 15
Second Male 13 76.47% 4 23.53% 17

14
Second
Total
27 84.38% 5 15.63% 32
Third Female 13 72.22% 5 27.78% 18
Third Male 8 57.14% 6 42.86% 14
Third
Total
21 65.63% 11 34.38% 32
Fourth Female 9 81.82% 2 18.18% 11
Fourth Male 9 64.29% 5 35.71% 14
Fourth
Total
18 72.00% 7 28.00% 25
Fifth Female 4 57.14% 3 42.86% 7
Fifth Male 7 41.18% 10 58.82% 17
Fifth
Total
11 45.83% 13 54.17% 24
Sixth Female 1 25.00% 3 75.00% 4
Sixth Male 4 57.14% 3 42.86% 7
Sixth
Total
5 45.45% 6 54.55% 11
Note. a Grade Level begin with Kindergarten; 1 represents kindergarten.
As noted in Table 6, the average amount of time devoted to physical activity per
week increases from four hours in kindergarten to 4.85 hours in third grade, and then
suddenly drops off to four hours in fourth grade. Table 6 data are consistent with the data
from Table 8, which states more students preferring television in the fourth grade. These
data do not align with the average number of hours students participate in physical
activity students per week; however, the number of hours increases to five for fifth grade
students which does not correlate to student preference. If students prefer spending time
in front of the television instead of being active, then the number of hours would be
lower. The fourth grade data are consistent in showing that as students become older and
their preferences change so does the amount of physical activity.

15
The data gathered from the counselor survey at each after-school program
correspond to student preference. As seen in Table 1, the percentage of female students
participating in physical activity consistently decreases starting in the third grade, from
87 percent in the third grade to 57.5 percent in the fifth grade. The data reveal a similar
occurrence for males. In the third grade 96 percent are active; and by the fifth grade that
number drops to73 percent. The number of active students begins to decrease around the
fourth grade. This is consistent with students preferring television over physical activity
in the upper grades; a connection could be made between the two.
The lead counselors made note of which activities students participated during the
after-school program. The types of activities in which students participate somewhat
depend on gender, although there were activities in which both males and females
participated. As noted in Table 3, females participate in a wider variety of activities
compared to males. Activities selected by females include dance, swinging, playing on
the playground, jump rope, hula hoop, kickball and softball. Male students primarily play
baseball, basketball, football, dodge ball, running, and free play in the gym. Both male
and female students participate in vigorous activities. For example, male and female
students in the after-school programs play tag and running games. According to the
World Health Organization (2013, p.1), vigorous activity can be defined as an activity
that “…requires a large amount of effort and causes rapid breathing and a substantial
increase in heart rate.” Activities such as football, basketball, and running are examples
of vigorous physical activity. The other category is moderate physical activity, which
“requires a moderate amount of effort and noticeably accelerates the heart rate” (World
Health, 2013, p.1). Female students participate in more moderate activities such as

16
dance, swinging, and hula hoop. This information correlates to the percentage of students
active in the after-school program. The males participate in more vigorous activity and
are more active overall than females.

17
CHAPTER 4
DISCUSSION
Results for research question one, “How does student attitude toward physical
activity impact student activity level?” were inconclusive. With the data collected, a clear
link between student attitude and physical activity level could not be determined. Further
research would need to be conducted. However, there were several other conclusions one
could infer from the data regarding attitude. When students are given the choice of what
type of physical activity in which to participate their attitudes improve. For example, a
child is given the opportunity to choose between playing basketball or football. The child
chooses basketball. His attitude is more likely to improve because that is the activity in
which he wanted to participate. Students in the younger grades did not request the
activities in which they were involved. These students are still at an age where sometimes
they do not have a choice in what activities they participate or know what activities in
which they want to participate. The parents placed children in these activities for a
variety of reasons and to give them an opportunity to be active. This could discourage the
student away from forming a positive attitude toward physical activity. Being forced to
do something could have negative consequences. Even at a young age students can make
choices about activities in which they participate and have input into selecting those
activities. Having an initial liking for an activity can mean the student is more willing to
participate in the activity, which leads to a positive attitude and a possible increase in the

18
amount of physical activity. In the after-school programs, students are given a choice of
physical activities in which they participate. In this study it was concluded that a high
percentage of the students were active in the after-school programs. It can be concluded
that when students are given the choice of the physical activity in which they participate
their participation level will be higher. This is due to the students enjoying the activities
in which they participate. Participation in physical activity may lead to an improved
attitude, but attitude may not determine the amount and level of physical activity in
which a student participates.
The second research question, “How does gender affect student activity level and
the types of activities in which students participate?” was answered. The data collected
from the surveys revealed a higher percentage of males participate in physical activity
than females. Although the difference is small, males spend more time per week
participating in physical activity compared to females. However, more males prefer
watching television than physical activity starting around the fourth grade. The data
gathered in the counselor and parent survey showed a decrease in the amount of physical
activity in which males participated at that age. The after-school programs do not allow
the students to watch television or play video games, which promotes physical activity.
Only when television is an option do older males choose that over physical activity.
According to an article from The Henry J. Kaiser Family Foundation (2009), “Forty-four
percent of boys report playing video games compared to 17 percent of girls. Between
ages eight through 13, boy game playing peaks at 47 minutes a day, on average” (para.
8). Males play video games more often than females; however, this does not mean that
females are participating in more physical activity. As students become older, they begin

19
to determine their interests and what areas they are successful. This leads to a decrease in
the number of organized sports students participate in and, in some cases, physical
activity altogether. The types of activities in which males and females participate varies.
Based on the information from the counselors and parents, males participate in more
vigorous activities. However, females tend to participate in a wider variety than males.
There were some activities that overlapped.
One can conclude that gender does affect the activity level of students and the
types of activities in which they participate. After-school programs provide students with
time to participate in physical activity. To increase student participation, the after-school
programs should provide a variety of activities and allow the students to have the
freedom to choose the type of physical activity in which to participate. Females
participate in a wider variety and would benefit from having multiple activities from
which to choose. Student choice correlates to student attitude and choice of the type of
physical activity may lead to an improvement in student attitude.

20
CHAPTER 5
LIMITATIONS
Administering a survey to parents and the lead counselor limits the information
one can gather about student attitude. Without interaction and direct answers from the
students, it is difficult to gage whether or not attitude toward physical activity impacts
activity level. There is an element of subjectivity in surveys which may have impacted
the validity of the survey. The researcher was not able to make observations about the
students during physical activity. An insignificant amount of data were gathered from
sixth grade students, therefore, the results from this age level could not be used. Surveys
were only gathered from five after-school programs in two school systems in the same
geographic area; which limited the amount of data gathered as well as the population
size.

21
CHAPTER 6
FURTHER RESEARCH
Further research would need to be conducted to determine if attitude affects the
physical activity level of students. This could be accomplished by designing longitudinal
study where the researcher interacts with a group of students over a period of time to
determine their views on physical activity and how that correlates to their physical
activity. Additional longitudinal studies could be conducted to track targeted students’
physical activity throughout the entire time they are in elementary school. Observations
and other data could be gathered to determine how student attitude affects physical
activity level. Further research could be conducted to examine why male students
participate in more vigorous activities than female students.
Research could be conducted to assess how parent attitude toward physical
activity affect the child’s views about physical activity. The researcher could interview
family members to discover their attitudes toward physical activity. Specific
demographic information could be gathered, such as parents’ job, household income, the
number of parents in the house, to investigate how it affects the child’s amount and level
of physical activity. The information on these topics was gathered from the survey but
did not pertain to the research questions being studied. This demographic information
may affect the child’s attitude towards physical activity.

22
REFERENCES
Beets, M. W., Huberty, J., & Beighle, A. (2012). Physical activity of children attending
after school programs: Research and practice-based implications. American
Journal of Preventive Medicine, 42, 180-184. Retrieved from
http://web.ebscohost.com.libsrv.wku.edu/ehost/detail?sid=f6e8ad4e-1415-49ea-
88ed-e3e49e5d3484%40sessionmgr14&vid=8&hid=17
Cook, G. (2005). Killing PE is killing our kids the slow way. American School Board
Journal, 192, 16-19. Retrieved from
http://web.ebscohost.com.libsrv.wku.edu/ehost/pdfviewer/pdfviewer?vid=3&hid=
28&sid=dafc79f4-5f63-4e09-a72e-749b31dd52cc%40sessionmgr4
Education Broadcasting Corporation (2004). Concept to classroom: Afterschool
programs- from vision to reality. Retrieved from
http://www.thirteen.org/edonline/concept2class/afterschool/index_sub1.html
National AfterSchool Association. (2011). HEPA standards. Retrieved from
http://www.naaweb.org/downloads/resources/HEPAStandards8-4-11final.pdf
The Henry J. Kaiser Family Foundation (2009). Children and Video Games. Retrieved
from http://www.education.com/reference/article/Ref_Children_Video_Games/

23
World Health Organization (2013). What is moderate-intensity and vigorous-intensity
physical activity? Retrieved from
http://www.who.int/dietphysicalactivity/physical_activity_intensity/en/

24
APPENDIX A
Parent Survey (one per child)
School
School A School C
School B School D
School E
1. What is your gender of your child?
Male
Female
2. What is the current grade level of your child?
Kindergarten
1st
2nd
3rd
4th
5th
6th
3. What is the highest level of education completed in the home?
some high school
high school graduate
some college
trade/technical/vocational training
college graduate
some postgraduate work
post graduate degree
25
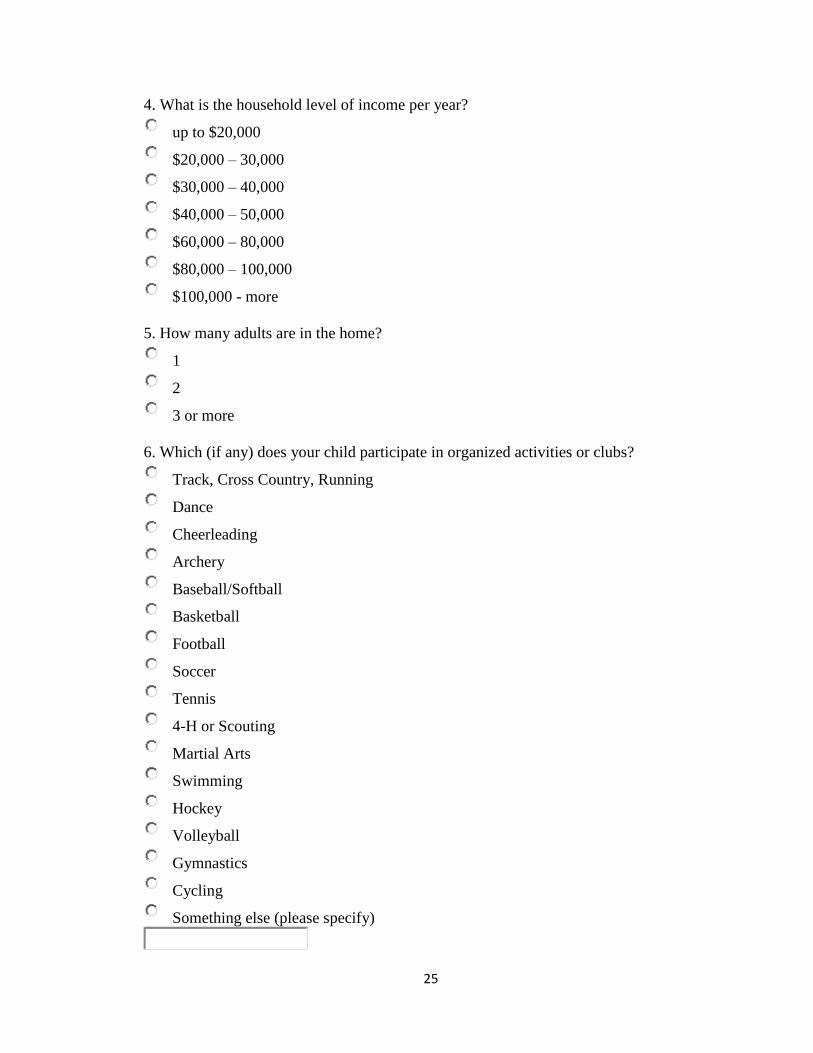
4. What is the household level of income per year?
up to $20,000
$20,000 – 30,000
$30,000 – 40,000
$40,000 – 50,000
$60,000 – 80,000
$80,000 – 100,000
$100,000 - more
5. How many adults are in the home?
1
2
3 or more
6. Which (if any) does your child participate in organized activities or clubs?
Track, Cross Country, Running
Dance
Cheerleading
Archery
Baseball/Softball
Basketball
Football
Soccer
Tennis
4-H or Scouting
Martial Arts
Swimming
Hockey
Volleyball
Gymnastics
Cycling
Something else (please specify)

26
7. How much time is dedicated per week to your child’s physical activity?
1 hour
2 hours
3 hours
4 hours
5 hours
6 or more hours
8. Does your child request this/these activities?
Yes
No
9. Does this meet your desired target for your child’s physical activity?
Yes
No
10. Does your child’s health show improvement with increased physical activity?
Yes
No
11. Does your child’s attitude improve with physical activity?
Yes
No
12. Which does your child prefer?
Physical activity
Time in front of the TV or with electronics
13. Does your child’s physical activity level interfere or improve grades?
Interfere
Improve

27
14. How much time is dedicated per week to parent physical activity?
1 hour
2 hours
3 hours
4 hours
5 hours
6 or more hours
15. Does this meet your desired target for your physical activity?
Yes
No

28
APPENDIX B
Survey (lead counselor)
School
School A
School B
School C
School D
School E
1. How many students are in each grade level in this school’s after-school program?
Kindergarten _____Male _____ Female
1st _____Male _____ Female
2nd
_____Male _____ Female
3rd
_____Male _____ Female
4th
_____Male _____ Female
5th
_____Male _____ Female
6th
_____Male _____ Female
2. How many of those students (by percentage) in each grade level are active in this
school’s after-school program?
Kindergarten _____%Male _____ %Female
1st _____%Male _____ %Female
2nd
_____%Male _____ %Female
3rd
_____%Male _____ %Female
4th
_____%Male _____ %Female
5th
_____%Male _____ %Female
6th
_____%Male _____ %Female
29
3. (By grade) What activities are preferred in this school’s after-school program?
Kindergarten ___________________Male _________________Female
1st ___________________Male _________________Female
2nd
___________________Male _________________Female
3rd
___________________Male _________________Female
4th
__________________Male __________________ Female
5th
__________________Male __________________Female
6th
__________________Male __________________Female


