Structuring EMR Data For Analytics
14
2015 Annual Conference HDWA 2015 – Grand Rapids, Michigan October 13 – 15 UNLOCKING THE POWER of DATA to TRANSFORM HEALTHCARE Sponsored by Spectrum Health Photos courtesy of ExperienceGR.com and Pure Michigan Structuring EMR Data For Analytics: Engineering Features from Repeated Clinical Measurements Brandon Stange Data Scientist, Trinity Health
-
Upload
brandon-stange -
Category
Data & Analytics
-
view
123 -
download
0
Transcript of Structuring EMR Data For Analytics
2015 Annual Conference
HDWA 2015 – Grand Rapids, Michigan October 13 – 15
UNLOCKING THE POWER of DATA to TRANSFORM HEALTHCARE
Sponsored by Spectrum Health
Photos courtesy of ExperienceGR.com and Pure Michigan
Structuring EMR Data For Analytics:Engineering Features from Repeated Clinical Measurements
Brandon StangeData Scientist, Trinity Health

HDWA 2015Grand Rapids, MichiganSponsored by Spectrum Health Photos courtesy of ExperienceGR.com
Agenda
• General Data Formatting for Analytics• Transforming Repeated Clinical Measurements– Standardize length of time-series– Cluster common trends together
• Scaling and other options• Questions
2
HDWA 2015Grand Rapids, MichiganSponsored by Spectrum Health Photos courtesy of ExperienceGR.com
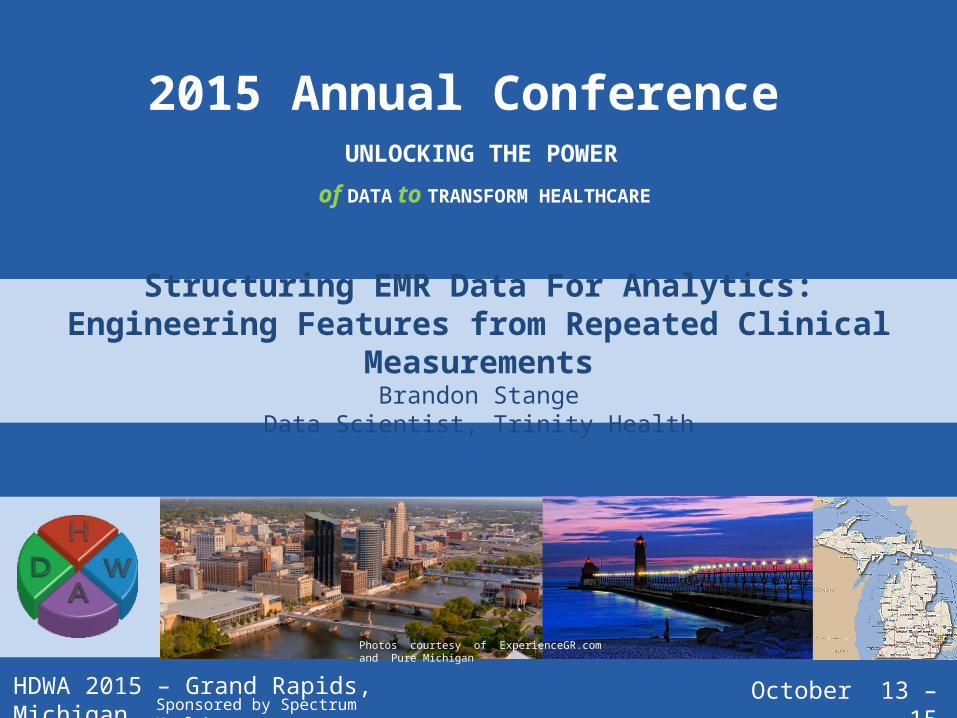
Institution Profile
3
HDWA 2015Grand Rapids, MichiganSponsored by Spectrum Health Photos courtesy of ExperienceGR.com
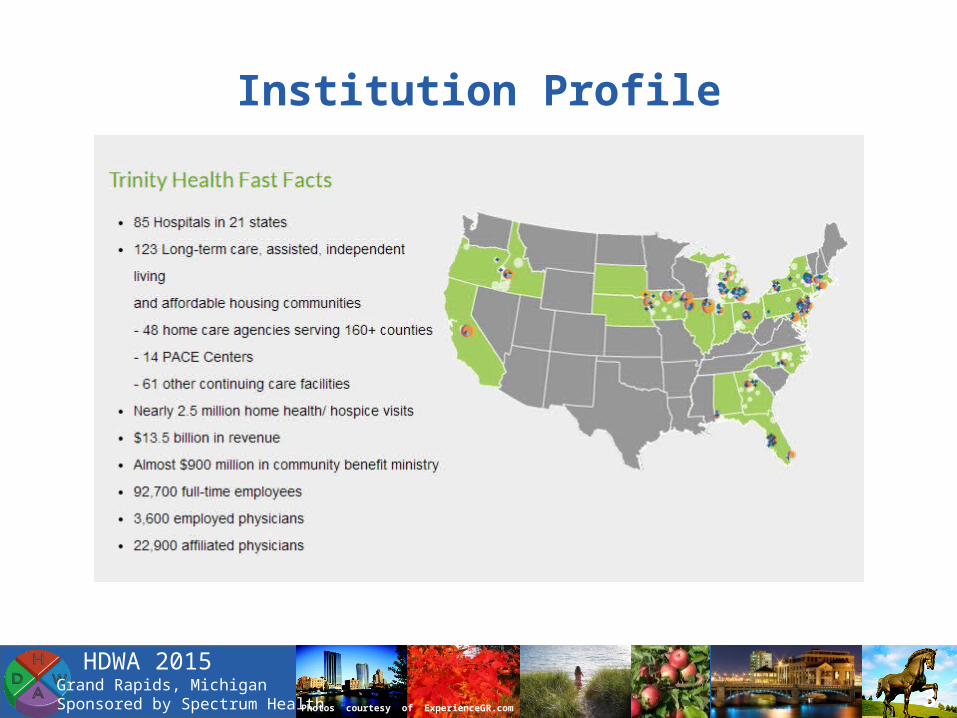
Data Governance and Research
• 13 members (4 managers)• Data scientists (3), data governance analysts
(4), clinical/business intelligence analysts (6)• Dozens of data sources• 30k daily reports from Unified Data
Warehouse
4
HDWA 2015Grand Rapids, MichiganSponsored by Spectrum Health Photos courtesy of ExperienceGR.com
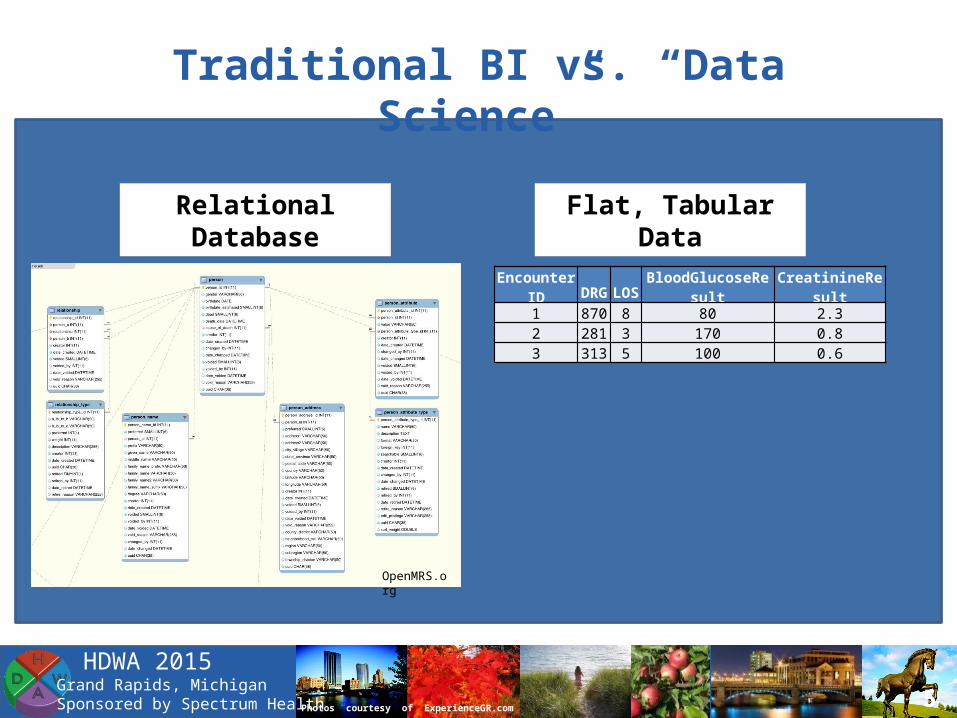
Traditional BI vs. “Data Science”
OpenMRS.org
EncounterID DRG LOS BloodGlucoseResult CreatinineResult1 870 8 80 2.32 281 3 170 0.83 313 5 100 0.6
Relational Database Flat, Tabular Data
5
HDWA 2015Grand Rapids, MichiganSponsored by Spectrum Health Photos courtesy of ExperienceGR.com
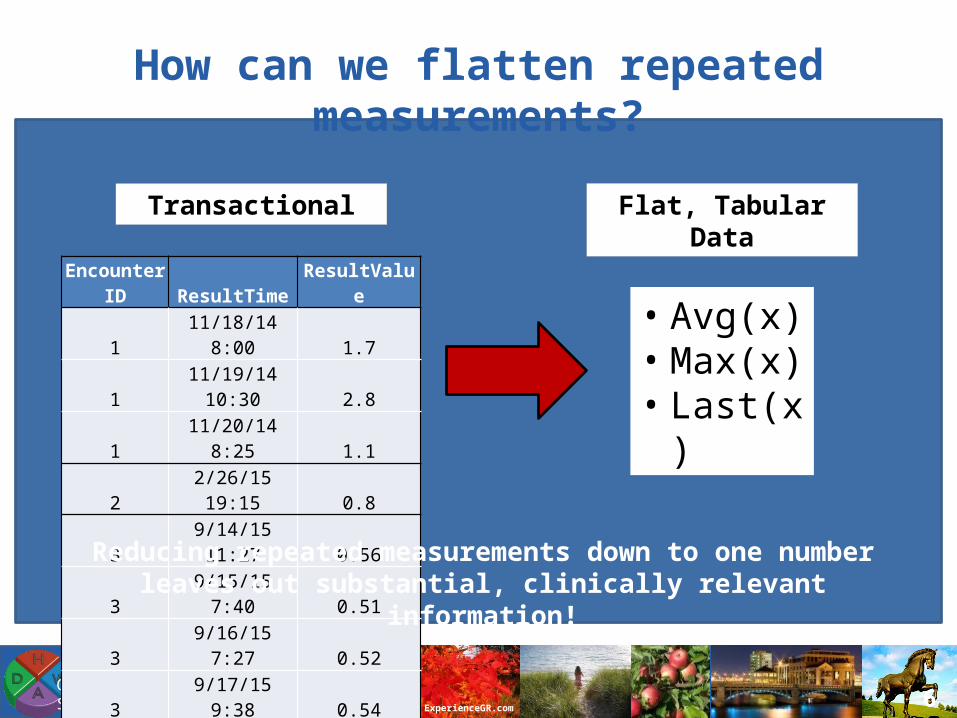
How can we flatten repeated measurements?
EncounterID ResultTime ResultValue1 11/18/14 8:00 1.71 11/19/14 10:30 2.81 11/20/14 8:25 1.12 2/26/15 19:15 0.83 9/14/15 11:27 0.563 9/15/15 7:40 0.513 9/16/15 7:27 0.523 9/17/15 9:38 0.543 9/18/15 8:15 0.593 9/19/15 9:20 0.51
• Avg(x)• Max(x)• Last(x)
Reducing repeated measurements down to one number leaves out substantial, clinically relevant information!
Transactional Flat, Tabular Data
6

HDWA 2015Grand Rapids, MichiganSponsored by Spectrum Health Photos courtesy of ExperienceGR.com
Another Approach
EncounterID R1 R2 R3 R41 0.8 0.7 0.72 0.673 0.5 0.61 0.62 0.624 0.6 0.8 0.7
EncounterID S1 S2 S3 S41 0.8 0.73 0.7 0.72 0.67 0.67 0.67 0.673 0.5 0.61 0.62 0.624 0.6 0.73 0.77 0.7
Standardize to length m• Choose a value to meet needs
(3-5 seems to work well)• For long series, smooth to m• For short series, impute to m
Standardize the Length of Jagged Time-Series
7
HDWA 2015Grand Rapids, MichiganSponsored by Spectrum Health Photos courtesy of ExperienceGR.com
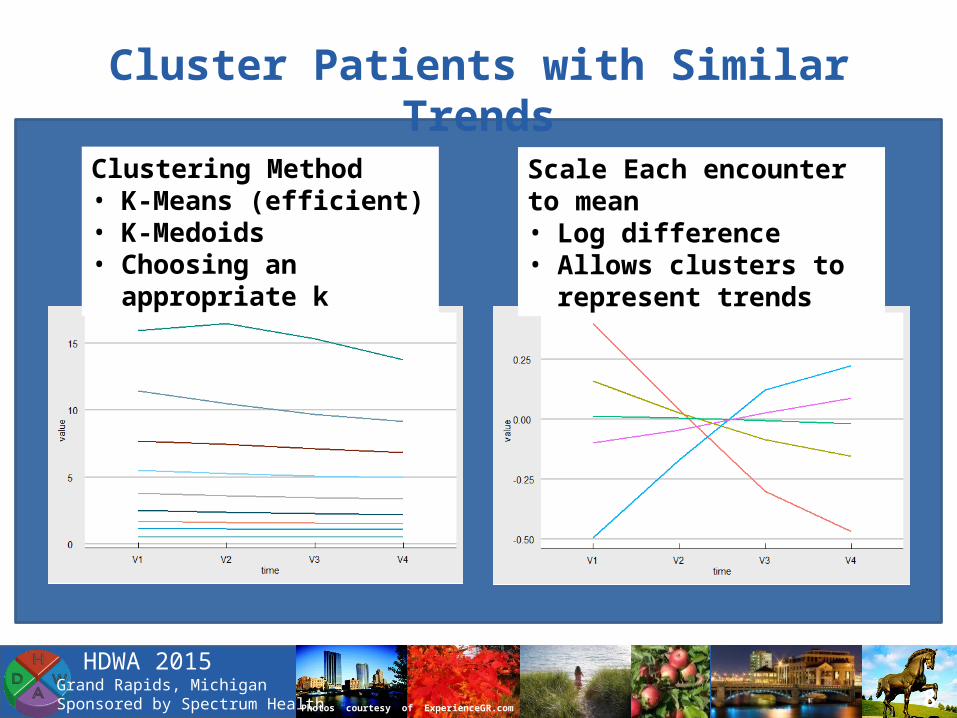
Cluster Patients with Similar Trends
Clustering Method• K-Means (efficient)• K-Medoids• Choosing an appropriate k
Scale Each encounter to mean• Log difference• Allows clusters to represent
trends
8
HDWA 2015Grand Rapids, MichiganSponsored by Spectrum Health Photos courtesy of ExperienceGR.com
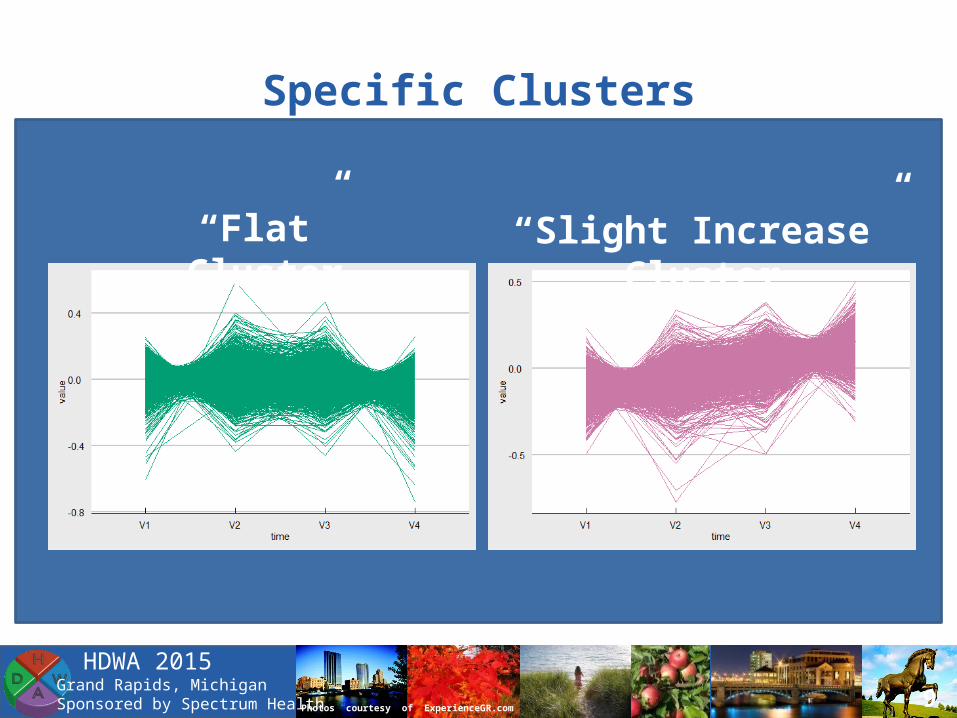
Specific Clusters
“Flat” Cluster “Slight Increase” Cluster
9
HDWA 2015Grand Rapids, MichiganSponsored by Spectrum Health Photos courtesy of ExperienceGR.com
Additional Considerations
• Store cluster centers for easy reference• If scaled well, many types of measurements can be
clustered together• Allows for standard “Common Trends”• The trends can be named more descriptively
• Can be used in other areas• Tremendous importance in Pop Health• Clinical text (rounding observations, disease
progression)
10

HDWA 2015Grand Rapids, MichiganSponsored by Spectrum Health Photos courtesy of ExperienceGR.com
New Data Structure
EncounterID CreatMean CreatClus GlucMean GlucClus1 0.55 C3 93 C12 0.91 C1 156 C43 0.76 C5 72 C2
EncounterID Measure Value1 CreatMean 0.551 CreatClus C31 GlucMean 931 GlucClus C12 CreatMean 0.912 CreatClus C12 GlucMean 1562 GlucClus C43 CreatMean 0.763 CreatClus C53 GlucMean 723 GlucClus C2
Storing as a flat table is an option
Storing in a “long” format is ideal for some applications• Easily pivot in R, Python• Flexible model• Converts easily to sparse
matrix
11

HDWA 2015Grand Rapids, MichiganSponsored by Spectrum Health Photos courtesy of ExperienceGR.com
Alternative Approaches
• Single Value (mean, max, last, etc.)• Generative models• Constant + linear trend + quadratic
• Principle Components or other Matrix Decomposition
• Other Kernel Methods
12

HDWA 2015Grand Rapids, MichiganSponsored by Spectrum Health Photos courtesy of ExperienceGR.com
Summary
• The needs of advanced analytics are different than those of traditional BI
• A variety of methods exist for flattening complex health care data
• Applying more simple methods can allow for rapid model generation while maintaining interpretability
13

HDWA 2015Grand Rapids, MichiganSponsored by Spectrum Health Photos courtesy of ExperienceGR.com
Presenter Contact Information
Brandon [email protected]
14