Structured Agency Credit Risk (“STACR”) Debt Notes, HQ1 · Structured Agency Credit Risk...
62
March 2015 Structured Agency Credit Risk (“STACR”) Debt Notes, 2015‐HQ1 Roadshow Investor Presentation
Transcript of Structured Agency Credit Risk (“STACR”) Debt Notes, HQ1 · Structured Agency Credit Risk...

March 2015
Structured Agency Credit Risk (“STACR”) Debt Notes, 2015‐HQ1 RoadshowInvestor Presentation
© Freddie Mac 2015
DisclaimerNoticetoUnitedStatesInvestors:
ThisdocumentisnotanoffertosellanyFreddieMacsecurities.Offersforanygivensecurityaremadeonlythroughapplicable offeringcircularsandanyrelatedsupplements,whichincorporateFreddieMac'sAnnualReportonForm10‐KfortheyearendedDecember31,2014,filedwiththeSEConFebruary19,2015,andQuarterlyReportonForm10‐QforthequarterendedSeptember30,2014,filedwiththeSEConNovember6, 2014,andalldocumentsthatFreddieMacfileswiththeSECpursuanttoSection13(a),13(c)or14oftheExchangeAct,excludinganyinformation"furnished"totheSEConForm8‐K.Contentinthispresentationisnotreflectiveofcurrentmarkets/spreadsandisnotindicativeofanyfutureFreddieMacofferings.Pleaseusethisdeckforinformationalpurposesonly.
NoticetoUnitedKingdomInvestors:
Thisdocumentisonlybeingdistributedtoandisdirectedat:(a)investmentprofessionalsfallingwithinArticle19oftheFinancialServicesandMarketsAct2000(FinancialPromotion)Order2005(the"FPO");(b)highnetworthentitiesfallingwithinArticle49oftheFPO; and(c)otherpersonsinrespectofwhomexemptionsundertheFPOareavailable.Theinvestmentstowhichthisdocumentrelatesareavailableonly to,andanyagreementtoacquiresuchinvestments,willbemadeonlywith,suchpersons.Anyotherpersonshouldnotactorrelyonthis documentoranyofitscontents.
ThisdocumentisnotintendedtobeanofferoftransferablesecuritiestothepublicintheUnitedKingdomoranyEuropeanUnionjurisdiction,inaccordancewiththeProspectusDirective(2003/71/EC,asamended).Inanyevent,thisdocumentismadeavailableonlyincircumstancesinwhichaprospectusrequirementundersuchDirectivedoesnotapply,includingbutnotlimitedtothedistributionofthisdocumentto qualifiedinvestorsonly.
2
© Freddie Mac 2015
Agenda1. Executive Summary 4
2. STACR Transactions Comparison 12
3. STACR 2015‐HQ1: Cohort Analysis 15
4. STACR Investor Participation 20
Appendices
1. Freddie Mac Corporate Summary 23
A. Single Family Business Overview 29
B. Underwriting and Quality Control 32
C. Single Family Servicing Oversight and Control 38
2. Data and Market Transparency 41
3. STACR 2015‐HQ1: Key Terms & Structure Overview 45
4. STACR 2015‐HQ1: Reference Pool Overview 48
5. STACR 2015‐HQ1: Prepayment / Default Sensitivity 52
6. Historical Home Price Appreciation 58
7. Key Contacts 60
3
© Freddie Mac 2015
1. Executive Summary
4
© Freddie Mac 2015 5
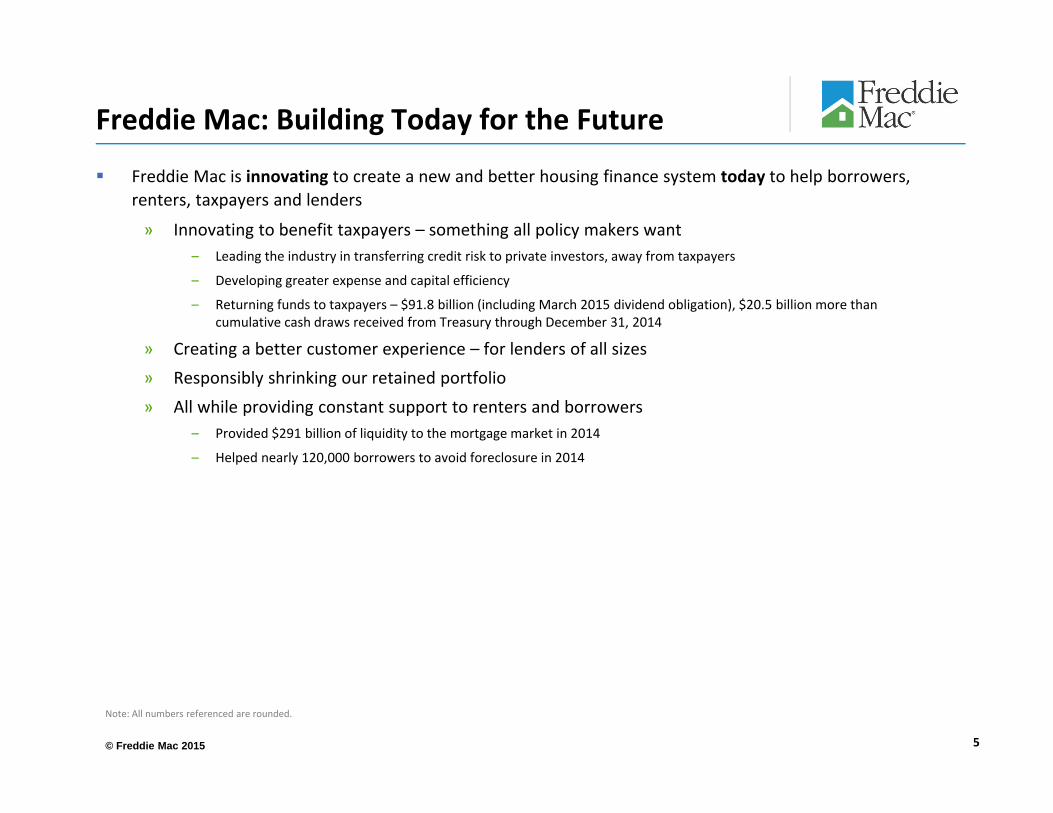
Freddie Mac: Building Today for the Future
Freddie Mac is innovating to create a new and better housing finance system today to help borrowers, renters, taxpayers and lenders
» Innovating to benefit taxpayers – something all policy makers want– Leading the industry in transferring credit risk to private investors, away from taxpayers
– Developing greater expense and capital efficiency
– Returning funds to taxpayers – $91.8 billion (including March 2015 dividend obligation), $20.5 billion more than cumulative cash draws received from Treasury through December 31, 2014
» Creating a better customer experience – for lenders of all sizes» Responsibly shrinking our retained portfolio» All while providing constant support to renters and borrowers
– Provided $291 billion of liquidity to the mortgage market in 2014
– Helped nearly 120,000 borrowers to avoid foreclosure in 2014
5
Note: All numbers referenced are rounded.
© Freddie Mac 2015
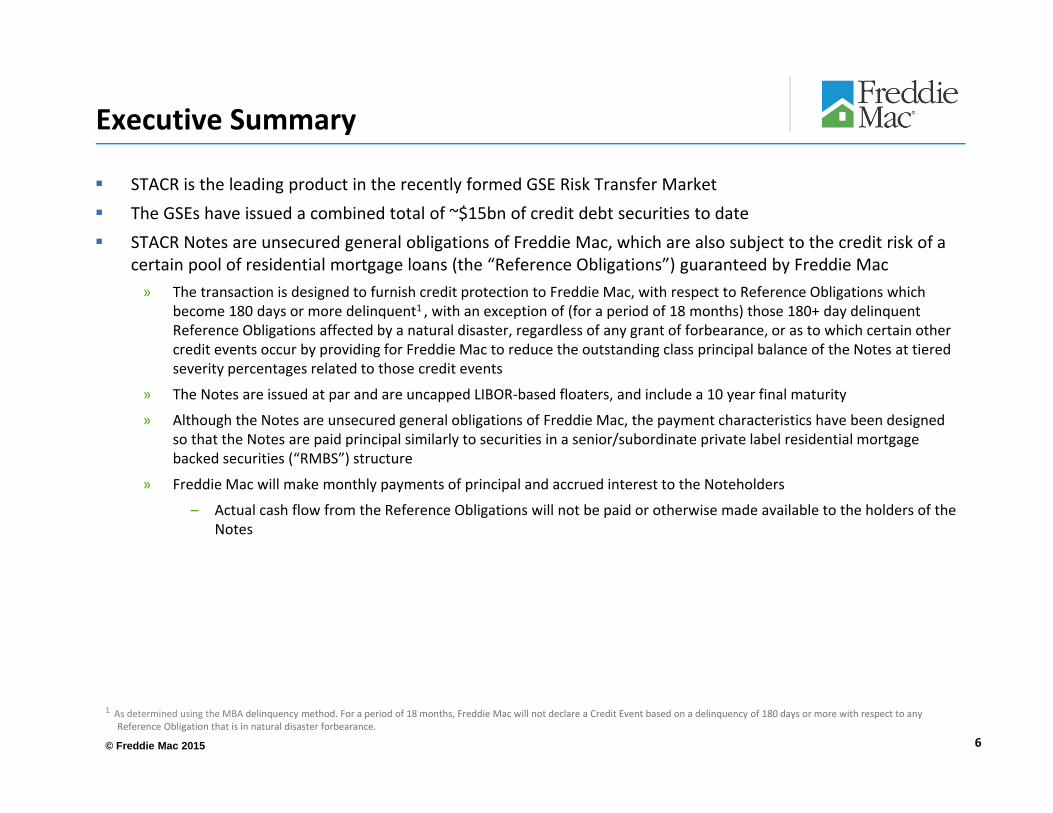
Executive Summary
STACR is the leading product in the recently formed GSE Risk Transfer Market The GSEs have issued a combined total of ~$15bn of credit debt securities to date STACR Notes are unsecured general obligations of Freddie Mac, which are also subject to the credit risk of a
certain pool of residential mortgage loans (the “Reference Obligations”) guaranteed by Freddie Mac» The transaction is designed to furnish credit protection to Freddie Mac, with respect to Reference Obligations which
become 180 days or more delinquent1 , with an exception of (for a period of 18 months) those 180+ day delinquent Reference Obligations affected by a natural disaster, regardless of any grant of forbearance, or as to which certain other credit events occur by providing for Freddie Mac to reduce the outstanding class principal balance of the Notes at tiered severity percentages related to those credit events
» The Notes are issued at par and are uncapped LIBOR‐based floaters, and include a 10 year final maturity
» Although the Notes are unsecured general obligations of Freddie Mac, the payment characteristics have been designed so that the Notes are paid principal similarly to securities in a senior/subordinate private label residential mortgage backed securities (“RMBS”) structure
» Freddie Mac will make monthly payments of principal and accrued interest to the Noteholders
– Actual cash flow from the Reference Obligations will not be paid or otherwise made available to the holders of the Notes
1 As determined using the MBA delinquency method. For a period of 18 months, Freddie Mac will not declare a Credit Event based on a delinquency of 180 days or more with respect to any Reference Obligation that is in natural disaster forbearance.
6
© Freddie Mac 2015
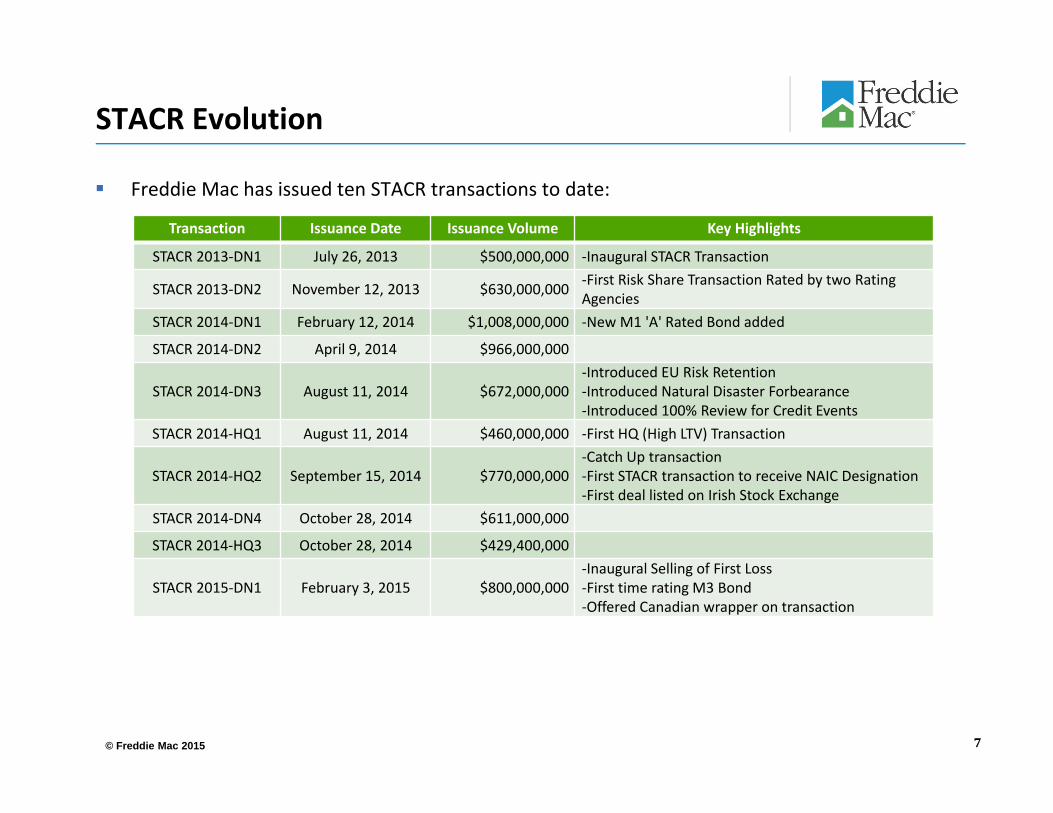
STACR Evolution
7
Freddie Mac has issued ten STACR transactions to date:
Transaction Issuance Date Issuance Volume Key Highlights
STACR 2013‐DN1 July 26, 2013 $500,000,000 ‐Inaugural STACR Transaction
STACR 2013‐DN2 November 12, 2013 $630,000,000 ‐First Risk Share Transaction Rated by two Rating Agencies
STACR 2014‐DN1 February 12, 2014 $1,008,000,000 ‐New M1 'A' Rated Bond added
STACR 2014‐DN2 April 9, 2014 $966,000,000
STACR 2014‐DN3 August 11, 2014 $672,000,000‐Introduced EU Risk Retention ‐Introduced Natural Disaster Forbearance ‐Introduced 100% Review for Credit Events
STACR 2014‐HQ1 August 11, 2014 $460,000,000 ‐First HQ (High LTV) Transaction
STACR 2014‐HQ2 September 15, 2014 $770,000,000‐Catch Up transaction ‐First STACR transaction to receive NAIC Designation ‐First deal listed on Irish Stock Exchange
STACR 2014‐DN4 October 28, 2014 $611,000,000
STACR 2014‐HQ3 October 28, 2014 $429,400,000
STACR 2015‐DN1 February 3, 2015 $800,000,000‐Inaugural Selling of First Loss‐First time rating M3 Bond‐Offered Canadian wrapper on transaction

© Freddie Mac 2015
Freddie Mac STACR Program Changes & Highlights
8
STACR Program Enhancements: Class M3 Notes rated Class M3 credit enhancement increased to 1.50% Freddie Mac will always maintain ownership of at least 5% of the Class M Tranches and 50% of the Class B
Tranche
Transactions Highlights: 100% of loans have never had any history of delinquency Moody’s and Kroll rated Multiple investment opportunities – rated/unrated and shorter/longer duration Frequent programmatic issuance and transparent secondary market Among the industry’s largest and most highly diversified pools supporting more stable and predictable
performance» Significantly more diverse by seller and geography than many mortgage credit investments

© Freddie Mac 2015
2015‐HQ1 Capital Structure Overview
9*Calculated WAL assume 0 CDR
STACR 2015‐HQ1
Expected Ratings WAL (yrs.)* WAL (yrs.)* Loss Cum. Net Credit Events
Applicable SeverityTranche Moody’s Kroll Balance ($) 10% CPR 5% CPR Attach Detach
M‐1 TBD TBD 231,000,000 1.87 3.21 4.75% 6.50% ≤ 1% 10%
M‐2 TBD TBD 231,000,000 4.88 8.13 3.00% 4.75% 1% < and ≤ 3% 20%
M‐3 TBD TBD 198,000,000 8.81 9.99 1.50% 3.00% 3% < and ≤ 5% 25%
B TBD TBD 65,000,000 9.99 9.99 0.00% 1.50% > 5% 40%
Total 725,000,000
Min C/E Test: 7.0%
Cohort is based on a pool of 75,508 loans with a UPB of $16.6B, LTV range: 80‐95%
April 1 – July 31, 2014 Acquisitions
Cumulative Net Credit Event % Threshold: Year 1: 0.40%, with 0.40% step‐ups each year
© Freddie Mac 2015 10
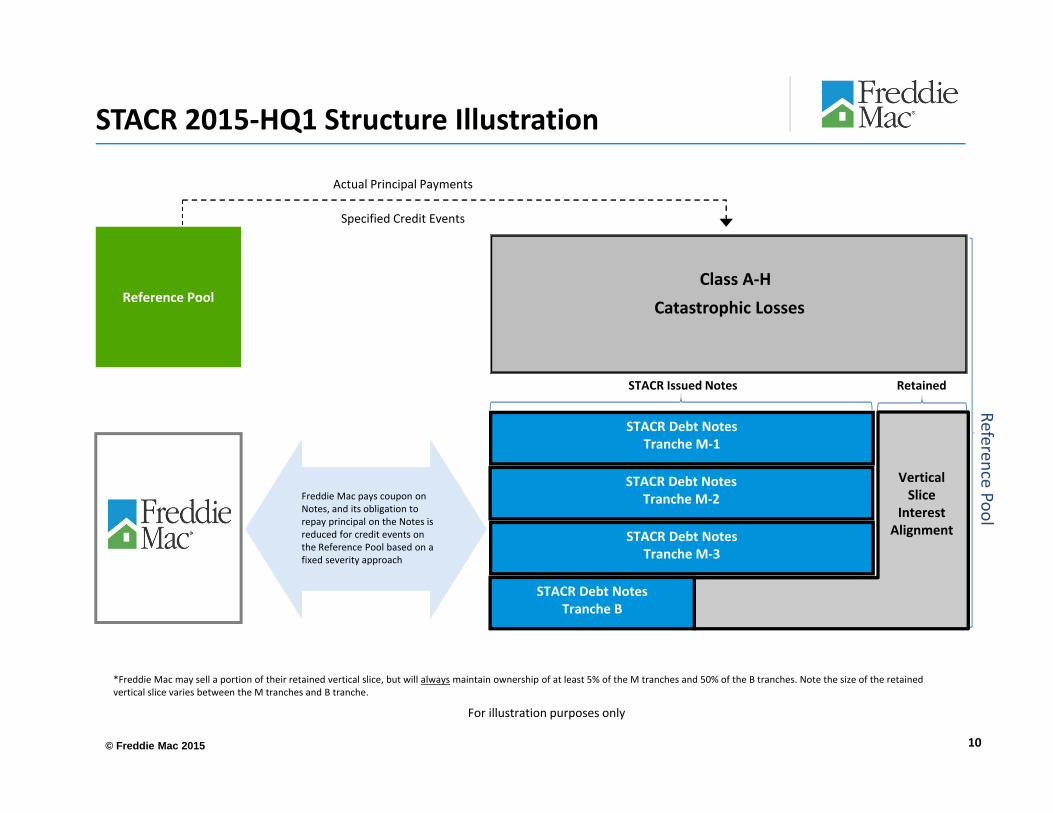
STACR 2015‐HQ1 Structure Illustration
Reference Pool
Specified Credit Events
Freddie Mac pays coupon on Notes, and its obligation to repay principal on the Notes is reduced for credit events on the Reference Pool based on a fixed severity approach
Actual Principal Payments
For illustration purposes only
*Freddie Mac may sell a portion of their retained vertical slice, but will always maintain ownership of at least 5% of the M tranches and 50% of the B tranches. Note the size of the retained vertical slice varies between the M tranches and B tranche.
Class A‐HCatastrophic Losses
STACR Issued Notes Retained
Reference Pool
STACR Debt NotesTranche M‐1
STACR Debt NotesTranche M‐2
STACR Debt NotesTranche M‐3
VerticalSlice
InterestAlignment
STACR Debt NotesTranche B

© Freddie Mac 2015
Class B Tax Considerations
11
The Class B Notes should be treated as derivatives for U.S. federal income tax purposes Freddie Mac will treat the Class B Notes as a contingent notional principal contract (“NPC”) and will bind
investors to such treatment Freddie Mac (and holders, unless a holder already has chosen another method) will tax account for the Class
B Notes under a mark‐to‐market method and will be required to treat the initial payment for the Class B Notes as a deemed loan pursuant to the NPC accounting rules (tax accounting guidance will be provided in the Offering Circular)
Purchases and transfers of Class B Notes will be restricted to U.S. persons who must provide a certification of that status on IRS Form W‐9
Class B Notes will be issued as physical notes
© Freddie Mac 2015
2. STACR Transactions Comparison
12
© Freddie Mac 2015 13
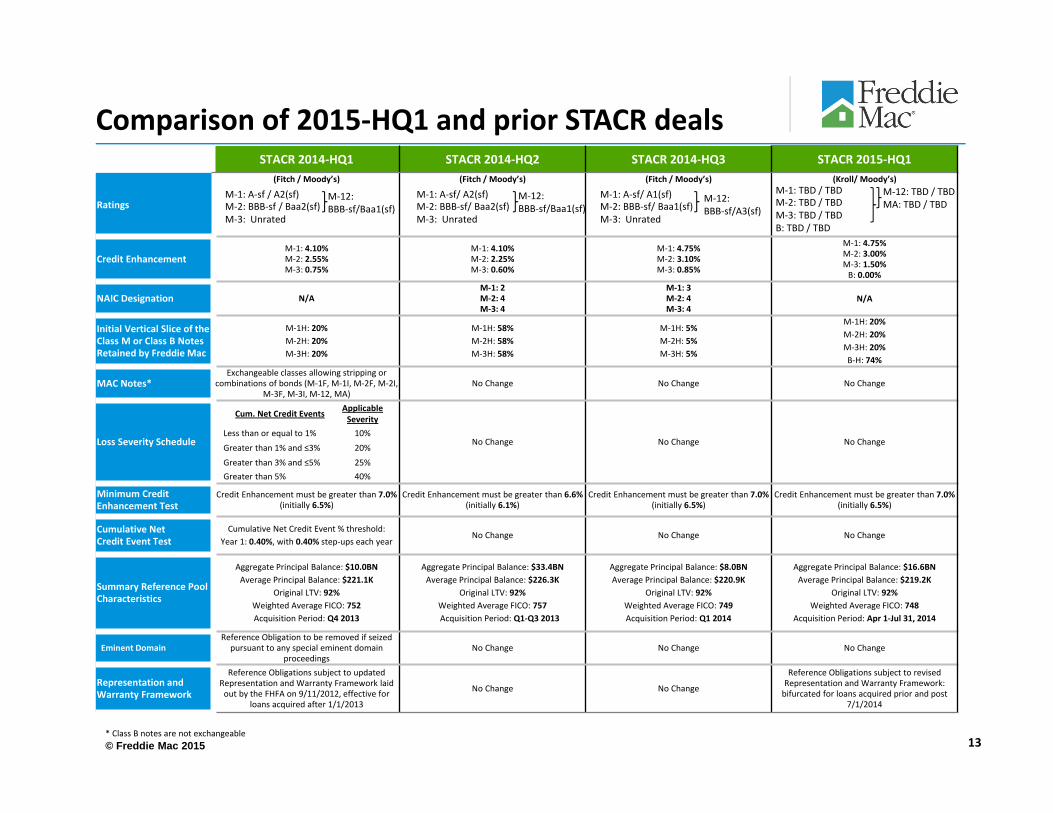
Comparison of 2015‐HQ1 and prior STACR dealsSTACR 2014‐HQ1 STACR 2014‐HQ2 STACR 2014‐HQ3 STACR 2015‐HQ1
Ratings
(Fitch / Moody’s) (Fitch / Moody’s) (Fitch / Moody’s) (Kroll/ Moody’s)
Credit EnhancementM‐1: 4.10%M‐2: 2.55%M‐3: 0.75%
M‐1: 4.10%M‐2: 2.25%M‐3: 0.60%
M‐1: 4.75%M‐2: 3.10%M‐3: 0.85%
M‐1: 4.75%M‐2: 3.00%M‐3: 1.50%B: 0.00%
NAIC Designation N/AM‐1: 2M‐2: 4M‐3: 4
M‐1: 3M‐2: 4M‐3: 4
N/A
Initial Vertical Slice of the Class M or Class B Notes Retained by Freddie Mac
M‐1H: 20%M‐2H: 20%M‐3H: 20%
M‐1H: 58%M‐2H: 58%M‐3H: 58%
M‐1H: 5%M‐2H: 5%M‐3H: 5%
M‐1H: 20%M‐2H: 20%M‐3H: 20%B‐H: 74%
MAC Notes*Exchangeable classes allowing stripping or
combinations of bonds (M‐1F, M‐1I, M‐2F, M‐2I, M‐3F, M‐3I, M‐12, MA)
No Change No Change No Change
Loss Severity Schedule No Change No Change No Change
Minimum Credit Enhancement Test
Credit Enhancement must be greater than 7.0%(initially 6.5%)
Credit Enhancement must be greater than 6.6% (initially 6.1%)
Credit Enhancement must be greater than 7.0%(initially 6.5%)
Credit Enhancement must be greater than 7.0%(initially 6.5%)
Cumulative Net Credit Event Test
Cumulative Net Credit Event % threshold:Year 1: 0.40%, with 0.40% step‐ups each year
No Change No Change No Change
Summary Reference Pool Characteristics
Aggregate Principal Balance: $10.0BNAverage Principal Balance: $221.1K
Original LTV: 92%Weighted Average FICO: 752Acquisition Period: Q4 2013
Aggregate Principal Balance: $33.4BNAverage Principal Balance: $226.3K
Original LTV: 92%Weighted Average FICO: 757 Acquisition Period: Q1‐Q3 2013
Aggregate Principal Balance: $8.0BNAverage Principal Balance: $220.9K
Original LTV: 92%Weighted Average FICO: 749Acquisition Period: Q1 2014
Aggregate Principal Balance: $16.6BNAverage Principal Balance: $219.2K
Original LTV: 92% Weighted Average FICO: 748
Acquisition Period: Apr 1‐Jul 31, 2014
Eminent DomainReference Obligation to be removed if seized pursuant to any special eminent domain
proceedingsNo Change No Change No Change
Representation and Warranty Framework
Reference Obligations subject to updated Representation and Warranty Framework laid out by the FHFA on 9/11/2012, effective for
loans acquired after 1/1/2013
No Change No Change
Reference Obligations subject to revised Representation and Warranty Framework: bifurcated for loans acquired prior and post
7/1/2014
M‐1: A‐sf/ A2(sf)M‐2: BBB‐sf/ Baa2(sf)M‐3: Unrated
M‐12: BBB‐sf/Baa1(sf)
M‐1: A‐sf / A2(sf)M‐2: BBB‐sf / Baa2(sf)M‐3: Unrated
M‐12:BBB‐sf/Baa1(sf)
M‐1: A‐sf/ A1(sf)M‐2: BBB‐sf/ Baa1(sf)M‐3: Unrated
M‐12: BBB‐sf/A3(sf)
M‐1: TBD / TBDM‐2: TBD / TBDM‐3: TBD / TBDB: TBD / TBD
M‐12: TBD / TBDMA: TBD / TBD
* Class B notes are not exchangeable
Cum. Net Credit Events Applicable Severity
Less than or equal to 1% 10%
Greater than 1% and ≤3% 20%
Greater than 3% and ≤5% 25%Greater than 5% 40%
© Freddie Mac 2015
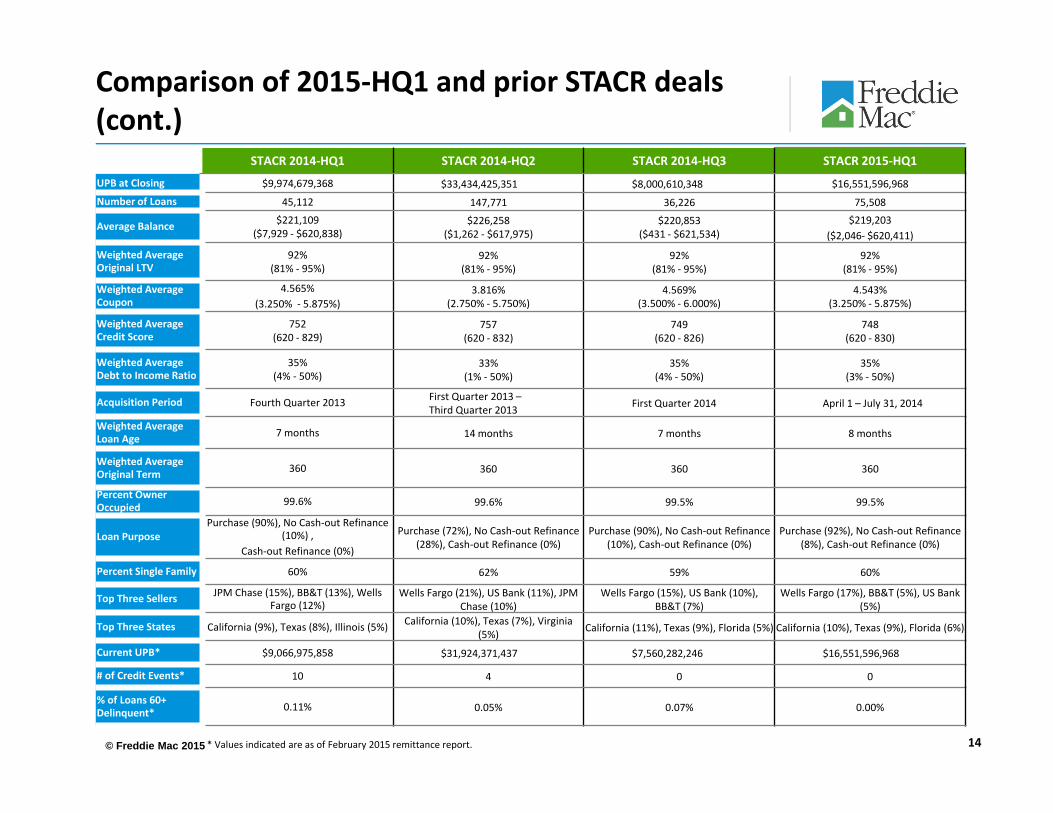
STACR 2014‐HQ1 STACR 2014‐HQ2 STACR 2014‐HQ3 STACR 2015‐HQ1
UPB at Closing $9,974,679,368 $33,434,425,351 $8,000,610,348 $16,551,596,968Number of Loans 45,112 147,771 36,226 75,508
Average Balance $221,109($7,929 ‐ $620,838)
$226,258($1,262 ‐ $617,975)
$220,853 ($431 ‐ $621,534)
$219,203 ($2,046‐ $620,411)
Weighted Average Original LTV
92%(81% ‐ 95%)
92%(81% ‐ 95%)
92%(81% ‐ 95%)
92% (81% ‐ 95%)
Weighted Average Coupon
4.565%(3.250% ‐ 5.875%)
3.816%(2.750% ‐ 5.750%)
4.569%(3.500% ‐ 6.000%)
4.543%(3.250% ‐ 5.875%)
Weighted Average Credit Score
752(620 ‐ 829)
757(620 ‐ 832)
749(620 ‐ 826)
748(620 ‐ 830)
Weighted Average Debt to Income Ratio
35%(4% ‐ 50%)
33%(1% ‐ 50%)
35%(4% ‐ 50%)
35%(3% ‐ 50%)
Acquisition Period Fourth Quarter 2013 First Quarter 2013 –Third Quarter 2013 First Quarter 2014 April 1 – July 31, 2014
Weighted Average Loan Age 7 months 14 months 7 months 8 months
Weighted Average Original Term 360 360 360 360
Percent Owner Occupied 99.6% 99.6% 99.5% 99.5%
Loan PurposePurchase (90%), No Cash‐out Refinance
(10%) , Cash‐out Refinance (0%)
Purchase (72%), No Cash‐out Refinance (28%), Cash‐out Refinance (0%)
Purchase (90%), No Cash‐out Refinance (10%), Cash‐out Refinance (0%)
Purchase (92%), No Cash‐out Refinance (8%), Cash‐out Refinance (0%)
Percent Single Family 60% 62% 59% 60%
Top Three Sellers JPM Chase (15%), BB&T (13%), Wells Fargo (12%)
Wells Fargo (21%), US Bank (11%), JPM Chase (10%)
Wells Fargo (15%), US Bank (10%), BB&T (7%)
Wells Fargo (17%), BB&T (5%), US Bank (5%)
Top Three States California (9%), Texas (8%), Illinois (5%) California (10%), Texas (7%), Virginia (5%) California (11%), Texas (9%), Florida (5%) California (10%), Texas (9%), Florida (6%)
Current UPB* $9,066,975,858 $31,924,371,437 $7,560,282,246 $16,551,596,968
# of Credit Events* 10 4 0 0
% of Loans 60+ Delinquent* 0.11% 0.05% 0.07% 0.00%
14
Comparison of 2015‐HQ1 and prior STACR deals(cont.)
* Values indicated are as of February 2015 remittance report.
© Freddie Mac 2015
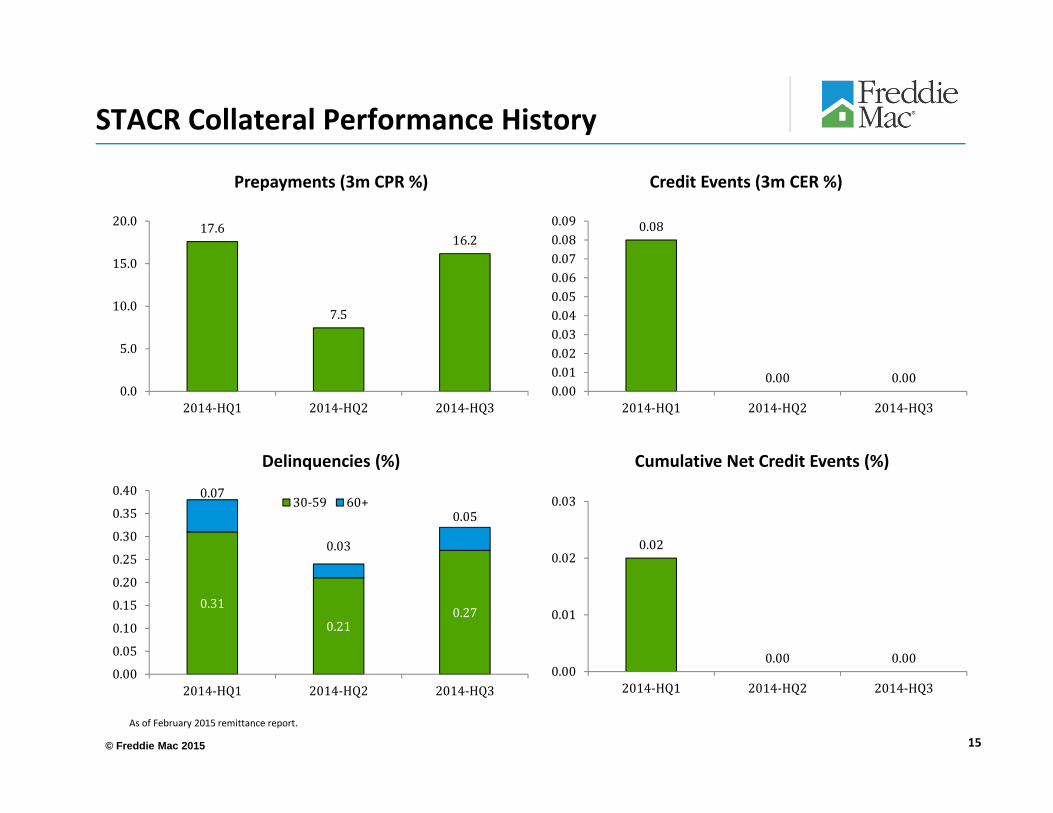
STACR Collateral Performance History
Prepayments (3m CPR %)
15
17.6
7.5
16.2
0.0
5.0
10.0
15.0
20.0
2014‐HQ1 2014‐HQ2 2014‐HQ3
0.08
0.00 0.000.000.010.020.030.040.050.060.070.080.09
2014‐HQ1 2014‐HQ2 2014‐HQ3
0.31
0.210.27
0.07
0.03
0.05
0.00
0.05
0.10
0.15
0.20
0.25
0.30
0.35
0.40
2014‐HQ1 2014‐HQ2 2014‐HQ3
30‐59 60+
0.02
0.00 0.000.00
0.01
0.02
0.03
2014‐HQ1 2014‐HQ2 2014‐HQ3
Credit Events (3m CER %)
Delinquencies (%) Cumulative Net Credit Events (%)
As of February 2015 remittance report.
© Freddie Mac 2015
3. STACR 2015‐HQ1: Cohort Analysis
16
© Freddie Mac 2015
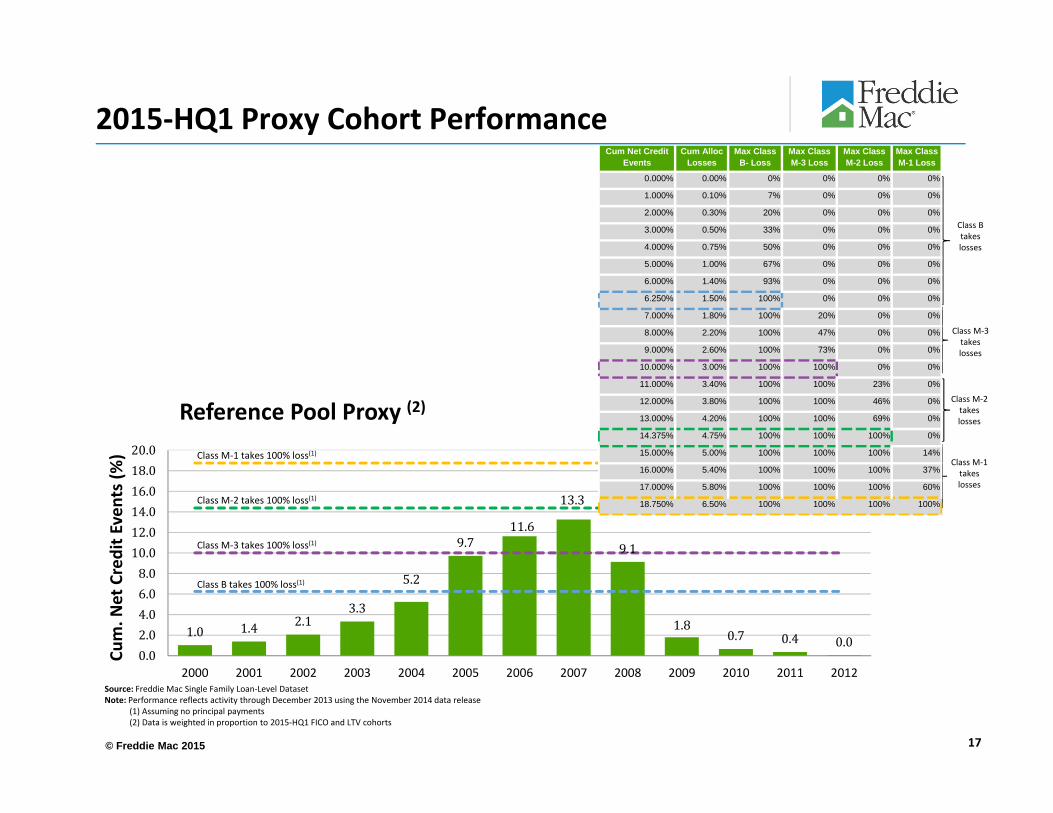
1.0 1.4 2.13.3
5.2
9.711.6
13.3
9.1
1.80.7 0.4 0.0
0.02.04.06.08.010.012.014.016.018.020.0
2000 2001 2002 2003 2004 2005 2006 2007 2008 2009 2010 2011 2012
Cum. N
et Credit E
vents (%
)
Reference Pool Proxy (2)
Class M‐3 takes 100% loss(1)
Class M‐1 takes losses
Class M‐2 takes losses
17
2015‐HQ1 Proxy Cohort Performance
Class B takes losses
Class M‐3 takes losses
Source: Freddie Mac Single Family Loan‐Level DatasetNote: Performance reflects activity through December 2013 using the November 2014 data release
(1) Assuming no principal payments(2) Data is weighted in proportion to 2015‐HQ1 FICO and LTV cohorts
Class M‐1 takes 100% loss(1)
Class M‐2 takes 100% loss(1)
Class B takes 100% loss(1)
0.000% 0.00% 0% 0% 0% 0%
1.000% 0.10% 7% 0% 0% 0%
2.000% 0.30% 20% 0% 0% 0%
3.000% 0.50% 33% 0% 0% 0%
4.000% 0.75% 50% 0% 0% 0%
5.000% 1.00% 67% 0% 0% 0%
6.000% 1.40% 93% 0% 0% 0%
6.250% 1.50% 100% 0% 0% 0%
7.000% 1.80% 100% 20% 0% 0%
8.000% 2.20% 100% 47% 0% 0%
9.000% 2.60% 100% 73% 0% 0%
10.000% 3.00% 100% 100% 0% 0%
11.000% 3.40% 100% 100% 23% 0%
12.000% 3.80% 100% 100% 46% 0%
13.000% 4.20% 100% 100% 69% 0%
14.375% 4.75% 100% 100% 100% 0%
15.000% 5.00% 100% 100% 100% 14%
16.000% 5.40% 100% 100% 100% 37%
17.000% 5.80% 100% 100% 100% 60%
18.750% 6.50% 100% 100% 100% 100%
Cum Net Credit Events
Cum Alloc Losses
Max Class B- Loss
Max Class M-3 Loss
Max Class M-2 Loss
Max Class M-1 Loss
© Freddie Mac 2015 18
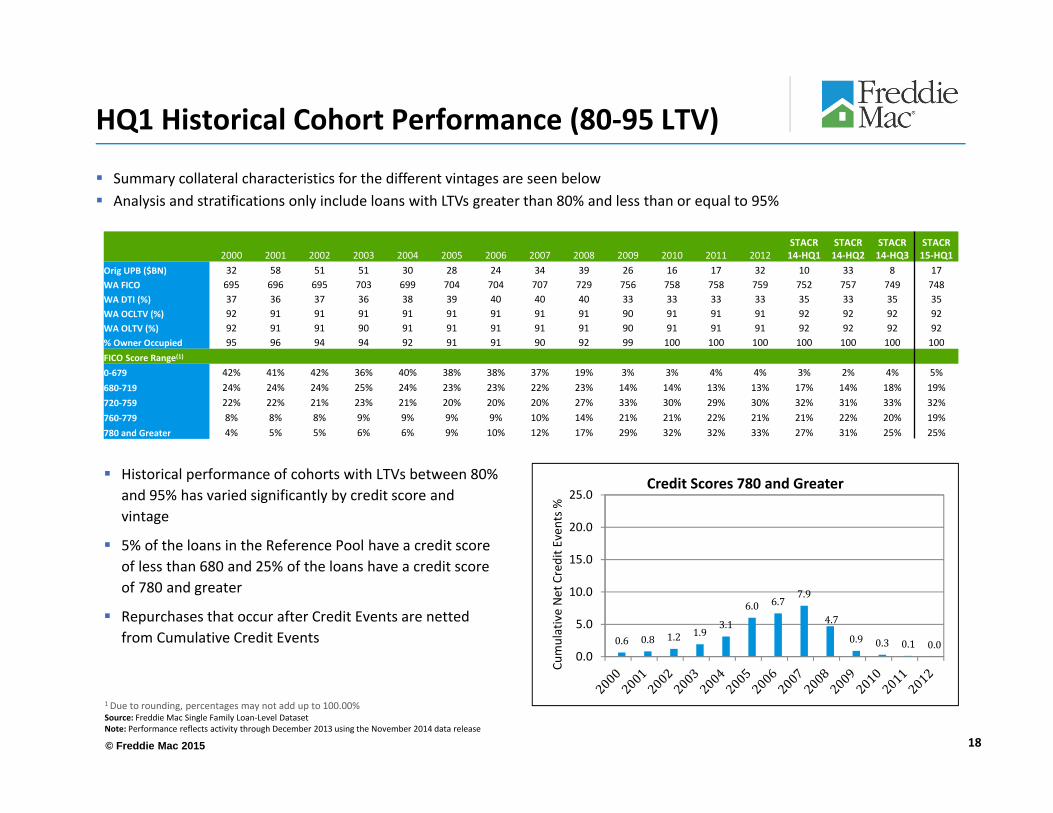
HQ1 Historical Cohort Performance (80‐95 LTV)
1 Due to rounding, percentages may not add up to 100.00% Source: Freddie Mac Single Family Loan‐Level DatasetNote: Performance reflects activity through December 2013 using the November 2014 data release
Historical performance of cohorts with LTVs between 80% and 95% has varied significantly by credit score and vintage
5% of the loans in the Reference Pool have a credit score of less than 680 and 25% of the loans have a credit score of 780 and greater
Repurchases that occur after Credit Events are netted from Cumulative Credit Events
Summary collateral characteristics for the different vintages are seen below Analysis and stratifications only include loans with LTVs greater than 80% and less than or equal to 95%
2000 2001 2002 2003 2004 2005 2006 2007 2008 2009 2010 2011 2012STACR 14‐HQ1
STACR 14‐HQ2
STACR 14‐HQ3
STACR 15‐HQ1
Orig UPB ($BN) 32 58 51 51 30 28 24 34 39 26 16 17 32 10 33 8 17WA FICO 695 696 695 703 699 704 704 707 729 756 758 758 759 752 757 749 748WA DTI (%) 37 36 37 36 38 39 40 40 40 33 33 33 33 35 33 35 35WA OCLTV (%) 92 91 91 91 91 91 91 91 91 90 91 91 91 92 92 92 92WA OLTV (%) 92 91 91 90 91 91 91 91 91 90 91 91 91 92 92 92 92% Owner Occupied 95 96 94 94 92 91 91 90 92 99 100 100 100 100 100 100 100FICO Score Range(1)
0‐679 42% 41% 42% 36% 40% 38% 38% 37% 19% 3% 3% 4% 4% 3% 2% 4% 5%680‐719 24% 24% 24% 25% 24% 23% 23% 22% 23% 14% 14% 13% 13% 17% 14% 18% 19%720‐759 22% 22% 21% 23% 21% 20% 20% 20% 27% 33% 30% 29% 30% 32% 31% 33% 32%760‐779 8% 8% 8% 9% 9% 9% 9% 10% 14% 21% 21% 22% 21% 21% 22% 20% 19%780 and Greater 4% 5% 5% 6% 6% 9% 10% 12% 17% 29% 32% 32% 33% 27% 31% 25% 25%
0.6 0.8 1.2 1.93.1
6.0 6.77.9
4.7
0.9 0.3 0.1 0.00.0
5.0
10.0
15.0
20.0
25.0
Cumulative Net Credit E
vents %
Credit Scores 780 and Greater

© Freddie Mac 2015 19
HQ1 Historical Cohort Performance (80‐95 LTV)
Source: Freddie Mac Single Family Loan‐Level DatasetNote: Performance reflects activity through December 2013 using the November 2014 data release
0.7 1.1 1.93.2
5.1
10.112.2 13.9
9.4
1.7 0.7 0.3 0.00.0
5.0
10.0
15.0
20.0
25.0
Cum Net Credit E
vents %
Credit Scores Between 720 and 759
0.5 0.6 1.1 2.03.6
7.19.1 10.6
6.4
1.1 0.4 0.2 0.00.0
5.0
10.0
15.0
20.0
25.0
Cum Net Credit E
vents %
Credit Scores Between 760 and 779
1.7 2.3 3.25.3
8.1
14.116.8
19.0
14.2
3.01.2 0.9 0.1
0.0
5.0
10.0
15.0
20.0
25.0
Cum Net Credit E
vents %
Credit Scores Between 680 and 719
4.4 5.6 6.88.8
12.4
19.223.3
25.6
21.3
4.81.3 0.8 0.2
0.0
5.0
10.0
15.0
20.0
25.0
30.0
35.0
Cum Net Credit E
vents %
Credit Scores Less than or Equal to 680
© Freddie Mac 2015
4. STACR Investor Participation
20
© Freddie Mac 2015
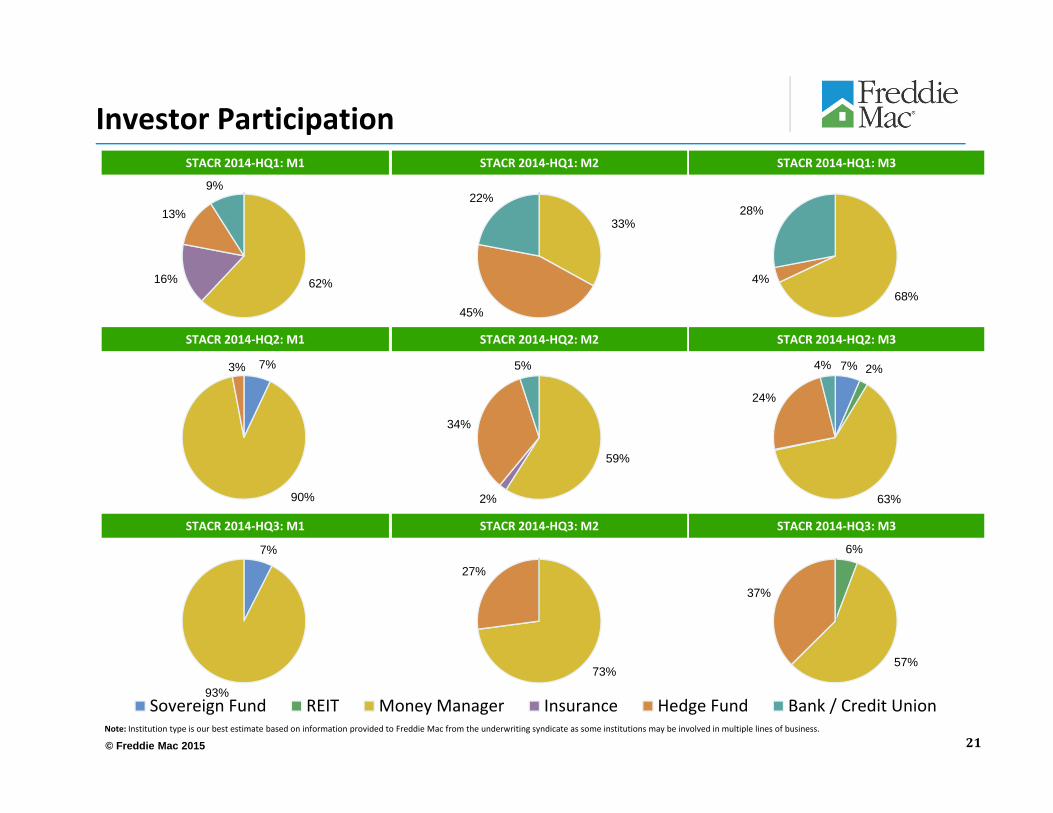
Sovereign Fund REIT Money Manager Insurance Hedge Fund Bank / Credit Union
Investor Participation
21Note: Institution type is our best estimate based on information provided to Freddie Mac from the underwriting syndicate as some institutions may be involved in multiple lines of business.
STACR 2014‐HQ3: M3STACR 2014‐HQ3: M2STACR 2014‐HQ3: M1
STACR 2014‐HQ2: M3STACR 2014‐HQ2: M2STACR 2014‐HQ2: M1
STACR 2014‐HQ1: M3STACR 2014‐HQ1: M2STACR 2014‐HQ1: M1
62%16%
13%
9%
33%
45%
22%
68%4%
28%
7%
90%
3%
59%
2%
34%
5% 7% 2%
63%
24%
4%
7%
93%
73%
27%
6%
57%
37%

© Freddie Mac 2015 22
Appendices
© Freddie Mac 2015 23
Appendix 1. Freddie Mac Corporate Summary
© Freddie Mac 2015 24
Corporate Overview
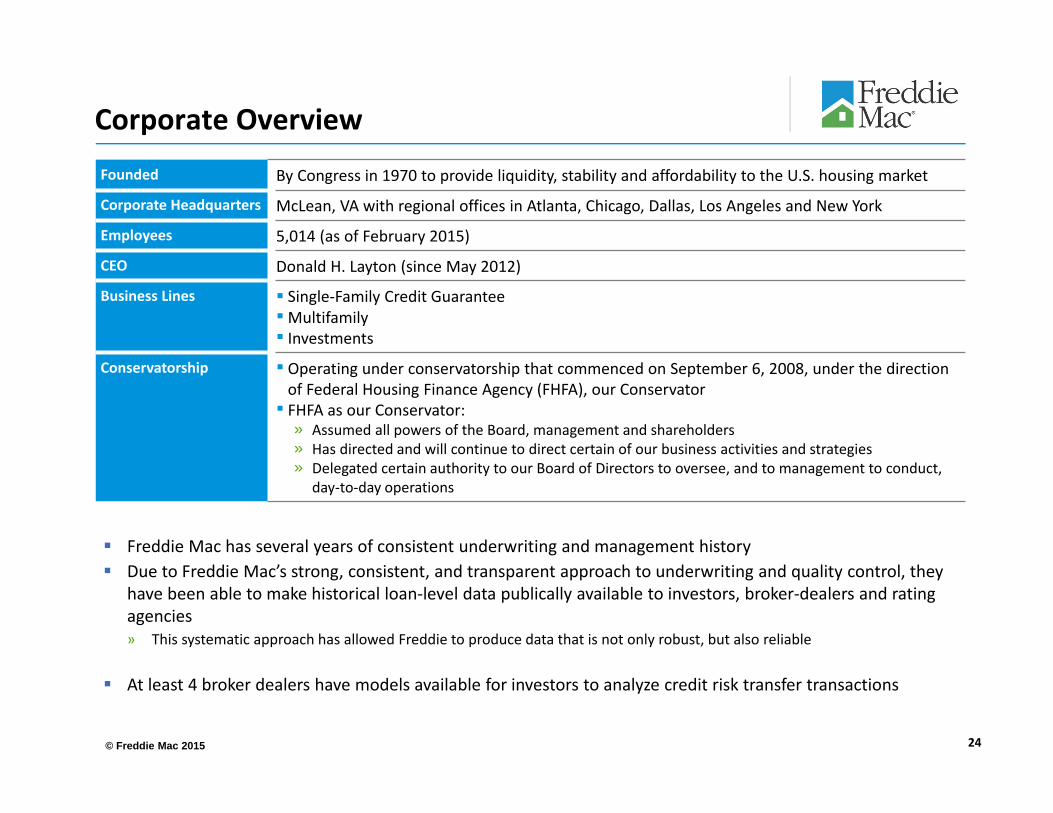
Founded By Congress in 1970 to provide liquidity, stability and affordability to the U.S. housing market
Corporate Headquarters McLean, VA with regional offices in Atlanta, Chicago, Dallas, Los Angeles and New York
Employees 5,014 (as of February 2015)
CEO Donald H. Layton (since May 2012)
Business Lines Single‐Family Credit GuaranteeMultifamily Investments
Conservatorship Operating under conservatorship that commenced on September 6, 2008, under the direction of Federal Housing Finance Agency (FHFA), our Conservator FHFA as our Conservator:
» Assumed all powers of the Board, management and shareholders» Has directed and will continue to direct certain of our business activities and strategies» Delegated certain authority to our Board of Directors to oversee, and to management to conduct,
day‐to‐day operations
Freddie Mac has several years of consistent underwriting and management history Due to Freddie Mac’s strong, consistent, and transparent approach to underwriting and quality control, they
have been able to make historical loan‐level data publically available to investors, broker‐dealers and rating agencies» This systematic approach has allowed Freddie to produce data that is not only robust, but also reliable
At least 4 broker dealers have models available for investors to analyze credit risk transfer transactions
© Freddie Mac 2015
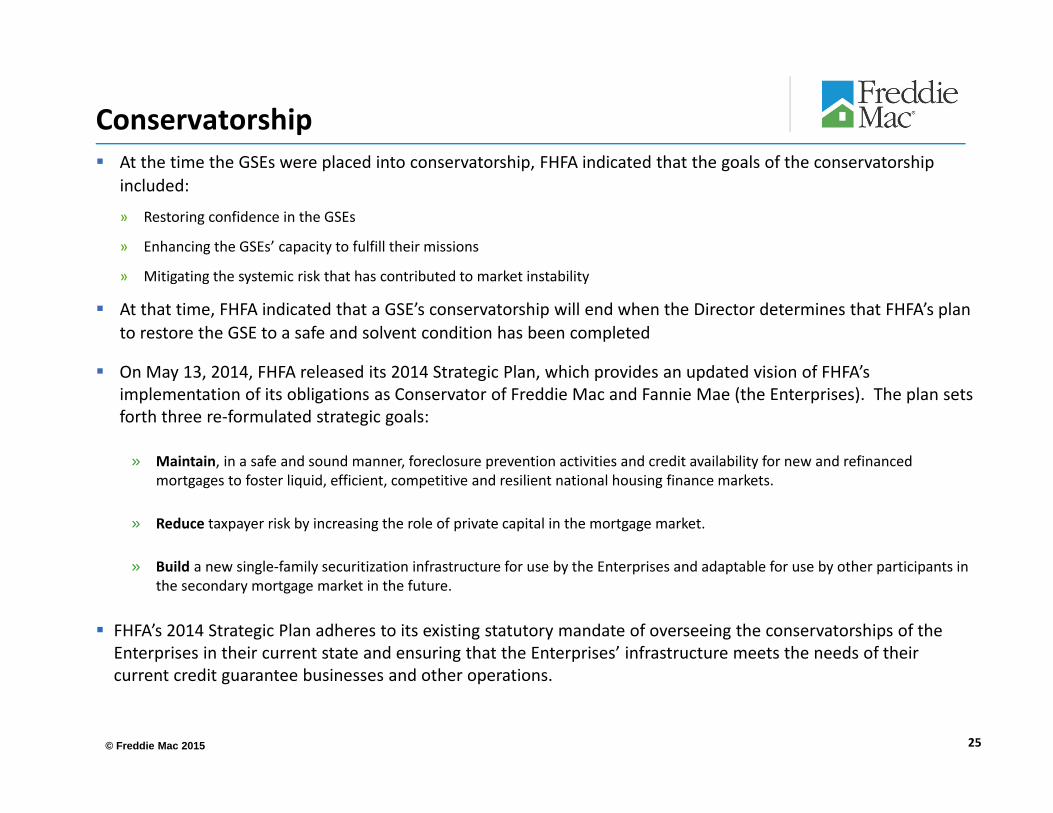
Conservatorship At the time the GSEs were placed into conservatorship, FHFA indicated that the goals of the conservatorship
included:
» Restoring confidence in the GSEs
» Enhancing the GSEs’ capacity to fulfill their missions
» Mitigating the systemic risk that has contributed to market instability
At that time, FHFA indicated that a GSE’s conservatorship will end when the Director determines that FHFA’s plan to restore the GSE to a safe and solvent condition has been completed
On May 13, 2014, FHFA released its 2014 Strategic Plan, which provides an updated vision of FHFA’s implementation of its obligations as Conservator of Freddie Mac and Fannie Mae (the Enterprises). The plan sets forth three re‐formulated strategic goals:
» Maintain, in a safe and sound manner, foreclosure prevention activities and credit availability for new and refinanced mortgages to foster liquid, efficient, competitive and resilient national housing finance markets.
» Reduce taxpayer risk by increasing the role of private capital in the mortgage market.
» Build a new single‐family securitization infrastructure for use by the Enterprises and adaptable for use by other participants in the secondary mortgage market in the future.
FHFA’s 2014 Strategic Plan adheres to its existing statutory mandate of overseeing the conservatorships of the Enterprises in their current state and ensuring that the Enterprises’ infrastructure meets the needs of their current credit guarantee businesses and other operations.
25

© Freddie Mac 2015
Housing Market Support
Purchase and Issuance Volume(Single‐Family and Multifamily)
$ Billions
Freddie Mac has provided $2.5 trillion in liquidity to the market since 2009 through its purchases of loans and issuances of mortgage‐related securities.
Freddie Mac has helped 1.1 million borrowers avoid foreclosure since 2009 with 8 out of every 10 families retaining their homes.
Foreclosure Prevention ActivitiesNumber of Loans (in thousands)
26
Cumulative Since 2009: $2.5T Cumulative Since 2009: 1,073
$546
$406$349
$456 $453
$291
0
100
200
300
400
500
600
2009 2010 2011 2012 2013 2014
133
275
208
169 168
120
0
50
100
150
200
250
300
2009 2010 2011 2012 2013 2014
© Freddie Mac 2015
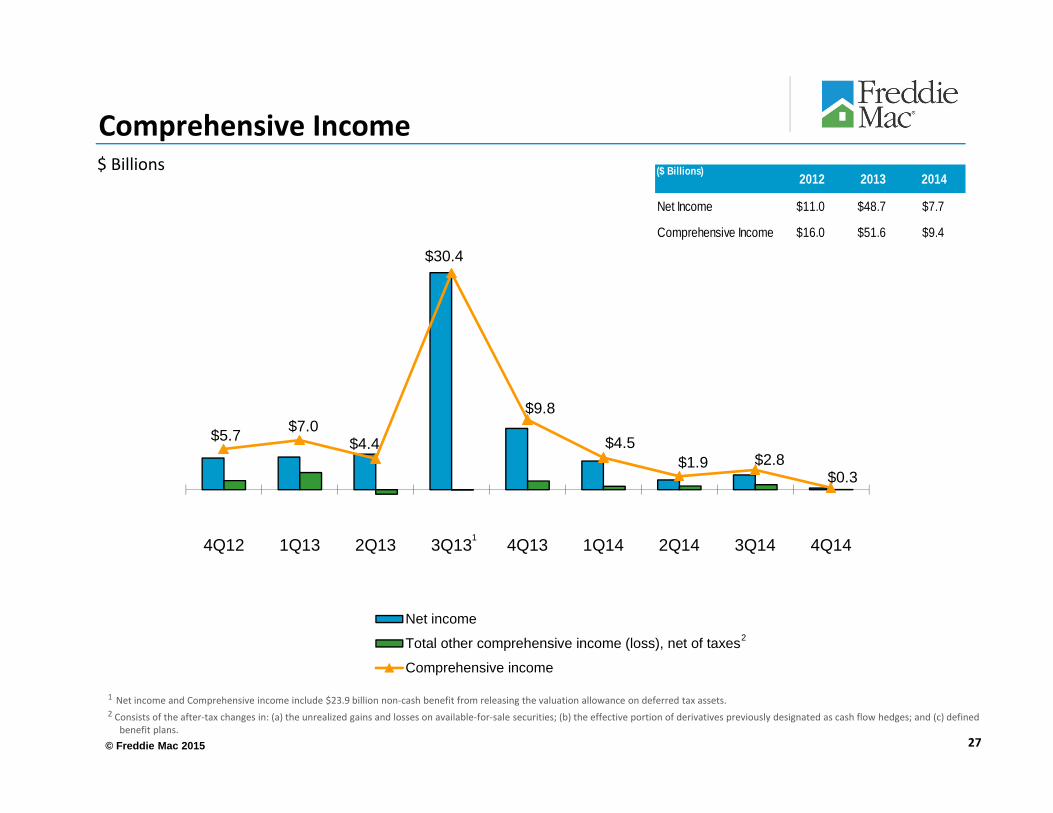
$5.7 $7.0 $4.4
$30.4
$9.8
$4.5 $1.9 $2.8
$0.3
4Q12 1Q13 2Q13 3Q13 4Q13 1Q14 2Q14 3Q14 4Q14
Net income
Total other comprehensive income (loss), net of taxes
Comprehensive income
27
Comprehensive Income
1
$ Billions
1 Net income and Comprehensive income include $23.9 billion non‐cash benefit from releasing the valuation allowance on deferred tax assets.2 Consists of the after‐tax changes in: (a) the unrealized gains and losses on available‐for‐sale securities; (b) the effective portion of derivatives previously designated as cash flow hedges; and (c) defined
benefit plans.
2
($ Billions) 2012 2013 2014
Net Income $11.0 $48.7 $7.7
Comprehensive Income $16.0 $51.6 $9.4
© Freddie Mac 2015
$44.6
$6.1 $13.0
$7.6 $0.02 $0.0 $0.0
2008 2009 2010 2011 2012 2013 2014
$0.2 $4.1 $5.7 $6.5 $7.2
$47.6
$19.6
2008 2009 2010 2011 2012 2013 2014
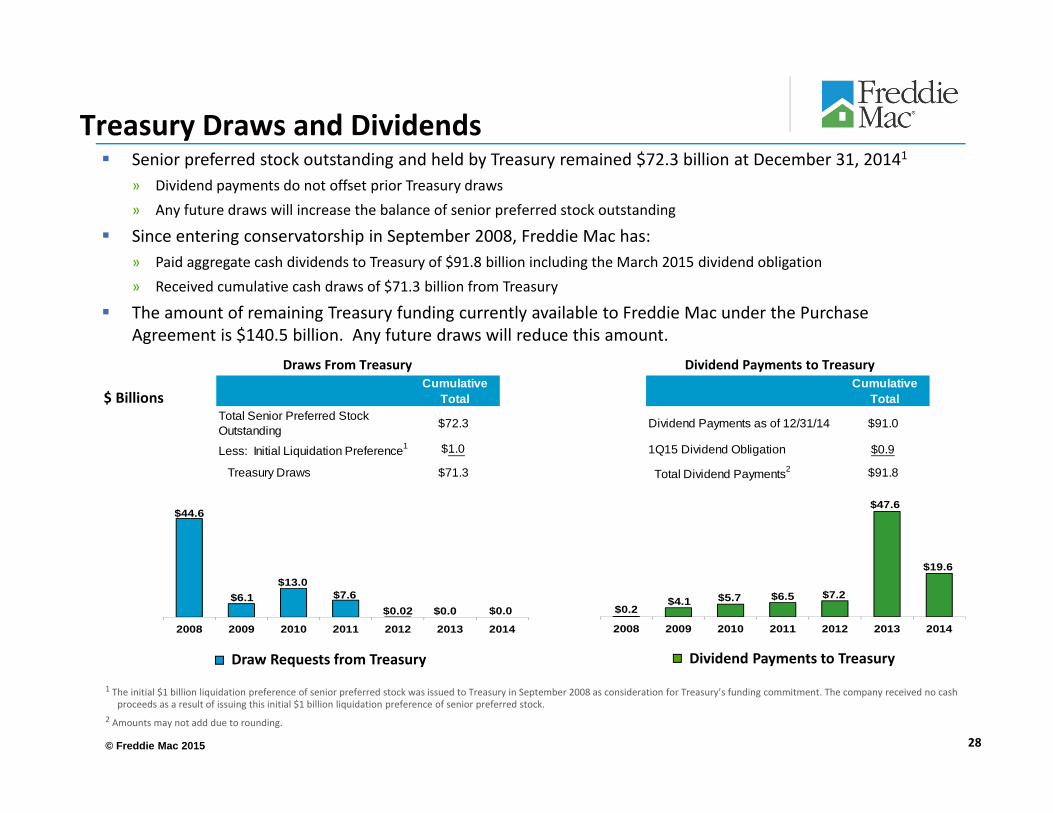
Senior preferred stock outstanding and held by Treasury remained $72.3 billion at December 31, 20141
» Dividend payments do not offset prior Treasury draws» Any future draws will increase the balance of senior preferred stock outstanding
Since entering conservatorship in September 2008, Freddie Mac has:» Paid aggregate cash dividends to Treasury of $91.8 billion including the March 2015 dividend obligation» Received cumulative cash draws of $71.3 billion from Treasury
The amount of remaining Treasury funding currently available to Freddie Mac under the Purchase Agreement is $140.5 billion. Any future draws will reduce this amount.
Dividend Payments to TreasuryDraw Requests from Treasury
28
Treasury Draws and Dividends
$ Billions
Draws From Treasury Dividend Payments to Treasury
1 The initial $1 billion liquidation preference of senior preferred stock was issued to Treasury in September 2008 as consideration for Treasury’s funding commitment. The company received no cash proceeds as a result of issuing this initial $1 billion liquidation preference of senior preferred stock.
2 Amounts may not add due to rounding.
Cumulative Total
Dividend Payments as of 12/31/14 $91.0
1Q15 Dividend Obligation $0.9
Total Dividend Payments2 $91.8
Cumulative Total
Total Senior Preferred Stock Outstanding $72.3
Less: Initial Liquidation Preference1 $1.0
Treasury Draws $71.3
© Freddie Mac 2015
Appendix 1 – Part A. Single Family Business Overview
29
© Freddie Mac 2015
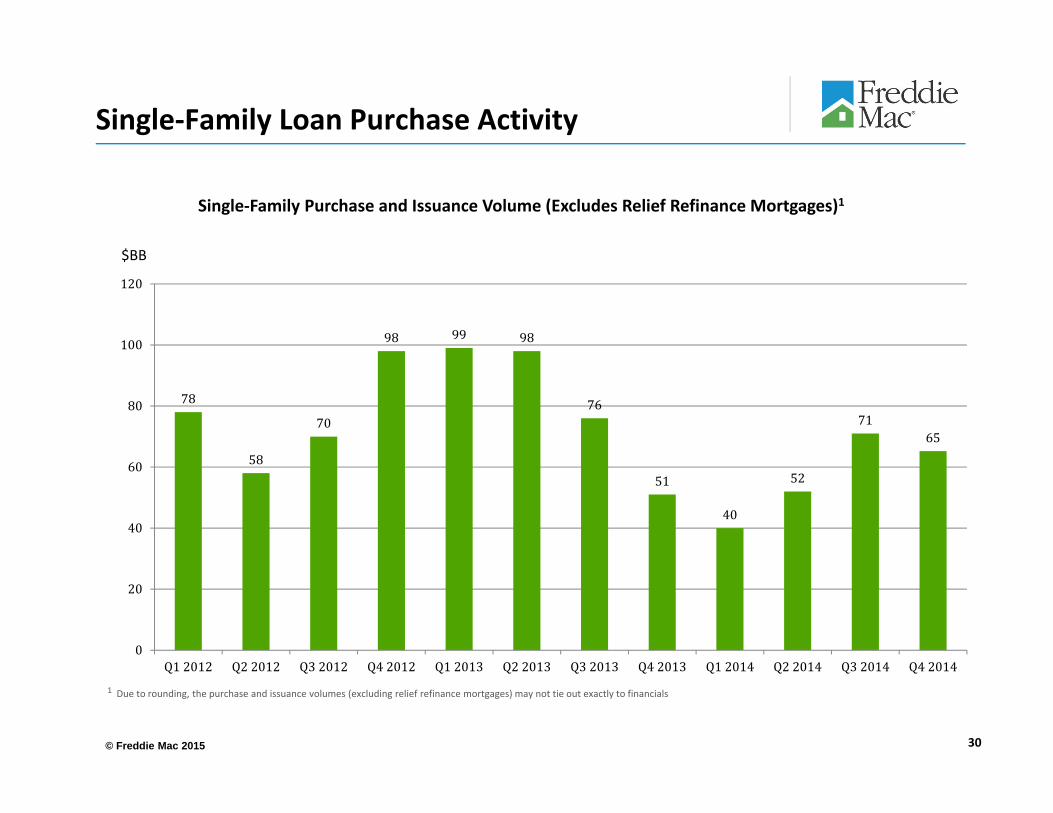
Single‐Family Loan Purchase Activity
Single‐Family Purchase and Issuance Volume (Excludes Relief Refinance Mortgages)1
$BB
30
1 Due to rounding, the purchase and issuance volumes (excluding relief refinance mortgages) may not tie out exactly to financials
78
58
70
98 99 98
76
51
40
52
7165
0
20
40
60
80
100
120
Q12012 Q22012 Q32012 Q42012 Q12013 Q22013 Q32013 Q42013 Q12014 Q22014 Q32014 Q42014

© Freddie Mac 2015
Approved Sellers and Servicers Freddie Mac approves sellers and servicers of mortgage loans based on a number of factors, including their financial condition, operational capability and origination and servicing experience
In approving sellers and servicers, Freddie Mac verifies references and performs a background review, functional area reviews – such as quality control, originations and underwriting – servicing and privacy compliance prior to approving an entity as a seller or servicer
Freddie Mac acquires a significant portion of its single‐family mortgage purchase volume from several large lenders or sellers/servicers» Freddie Mac’s top 10 single‐family sellers provided approximately 50% of Freddie Mac’s single‐family purchase volume during
2014
» Wells Fargo Bank, N.A accounted for 13% of Freddie Mac’s single‐family mortgage purchase volume and was the only single‐family seller that comprised 10% or more of Freddie Mac’s purchase volume during 2014
31
Seller Distribution
13%
87%
Wells Fargo Bank, N.A.
Other

© Freddie Mac 2015
Appendix 1 – Part B. Underwriting and Quality Control
32
© Freddie Mac 2015
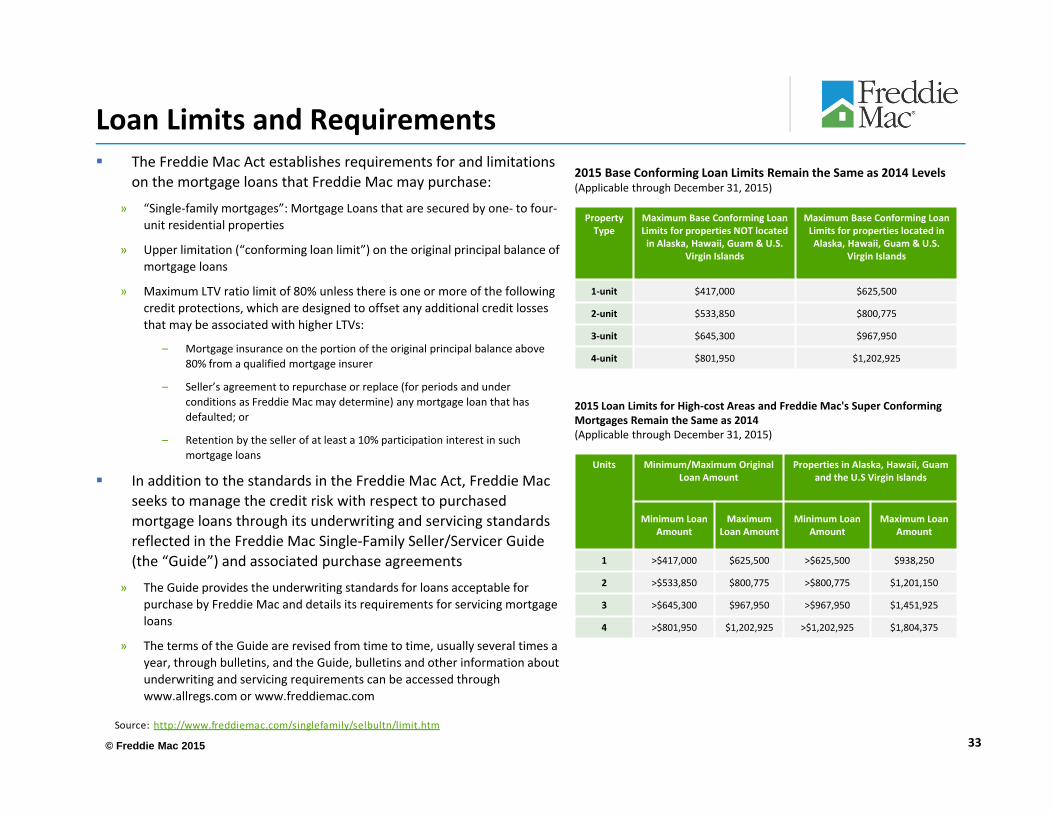
Loan Limits and Requirements
Property Type
Maximum Base Conforming Loan Limits for properties NOT located in Alaska, Hawaii, Guam & U.S.
Virgin Islands
Maximum Base Conforming Loan Limits for properties located in Alaska, Hawaii, Guam & U.S.
Virgin Islands
1‐unit $417,000 $625,500
2‐unit $533,850 $800,775
3‐unit $645,300 $967,950
4‐unit $801,950 $1,202,925
2015 Base Conforming Loan Limits Remain the Same as 2014 Levels(Applicable through December 31, 2015)
Units Minimum/Maximum Original Loan Amount
Properties in Alaska, Hawaii, Guam and the U.S Virgin Islands
Minimum Loan Amount
Maximum Loan Amount
Minimum Loan Amount
Maximum Loan Amount
1 >$417,000 $625,500 >$625,500 $938,250
2 >$533,850 $800,775 >$800,775 $1,201,150
3 >$645,300 $967,950 >$967,950 $1,451,925
4 >$801,950 $1,202,925 >$1,202,925 $1,804,375
2015 Loan Limits for High‐cost Areas and Freddie Mac's Super Conforming Mortgages Remain the Same as 2014(Applicable through December 31, 2015)
33Source: http://www.freddiemac.com/singlefamily/selbultn/limit.htm
The Freddie Mac Act establishes requirements for and limitations on the mortgage loans that Freddie Mac may purchase:
» “Single‐family mortgages”: Mortgage Loans that are secured by one‐ to four‐unit residential properties
» Upper limitation (“conforming loan limit”) on the original principal balance of mortgage loans
» Maximum LTV ratio limit of 80% unless there is one or more of the following credit protections, which are designed to offset any additional credit losses that may be associated with higher LTVs:
– Mortgage insurance on the portion of the original principal balance above 80% from a qualified mortgage insurer
– Seller’s agreement to repurchase or replace (for periods and under conditions as Freddie Mac may determine) any mortgage loan that has defaulted; or
– Retention by the seller of at least a 10% participation interest in such mortgage loans
In addition to the standards in the Freddie Mac Act, Freddie Mac seeks to manage the credit risk with respect to purchased mortgage loans through its underwriting and servicing standards reflected in the Freddie Mac Single‐Family Seller/Servicer Guide (the “Guide”) and associated purchase agreements
» The Guide provides the underwriting standards for loans acceptable for purchase by Freddie Mac and details its requirements for servicing mortgage loans
» The terms of the Guide are revised from time to time, usually several times a year, through bulletins, and the Guide, bulletins and other information about underwriting and servicing requirements can be accessed through www.allregs.com or www.freddiemac.com
© Freddie Mac 2015
Underwriting Standards
34
Delegated Underwriting» Freddie Mac uses a process of delegated underwriting whereby loans are purchased from seller/servicers that make representations and warranties
that the loans meet the standards and requirements of their contracts with Freddie Mac» Approximately 650 out of more than 1,100 active mortgage sellers approved by Freddie Mac are provided negotiated terms of business (“TOB”) which
may amend, waive or otherwise alter certain terms of the Guide– Prior to approving a TOB, Freddie Mac engages in a review process to assess potential implications and impacts of any proposed TOB across Freddie
Mac and monitors TOBs on a go forward basis» Ninety‐eight percent of the loans purchased by Freddie Mac are underwritten using an automated underwriting system (“AUS”), either Freddie Mac’s
proprietary system, Loan Prospector® (“LP”), the seller/servicer’s own system, or Fannie Mae’s proprietary system, Desktop Underwriter® (“DU”)– In permitting a seller to use an AUS other than LP, Freddie Mac requires a number of additional credit standards for mortgage loans evaluated by such
other AUS
Underwriting Standards» Mortgage loans sold to Freddie Mac must, at a minimum, have documented property values and a mortgage file which reflects an acceptable level of
documentation and evidence of the mortgagor’s ability to repay» Freddie Mac requires a seller to obtain credit scores through credit bureaus when underwriting a mortgage Loan
– The Guide requires a minimum credit score of 620 for manually underwritten loans– LP evaluates the borrower’s credit profile and determines if it is acceptable and in some cases, LP may accept Credit Scores below 620 based on
compensating factors» Other factors considered in the underwriting are the applicant’s credit history, the amount of the applicant’s debts compared to his or her gross
monthly income, the intended occupancy of the subject property, the property type, and the purpose of the loan transaction» Freddie Mac requires the seller to conduct a valuation of the mortgaged property as collateral for each mortgage
– With few exceptions this collateral valuation is determined by an appraisal report where the mortgaged property and the neighborhood are inspected by an appraiser and the value of the mortgaged property is estimated by the appraiser
Documentation Standards» Freddie Mac requires the Seller to obtain verifications and documentation for each source of qualifying income and assets identified by the Mortgagor in
the application– Streamlined Accept Documentation: qualifying income for a salaried Mortgagor would require documentation that includes a verification of
employment, a year‐to‐date paystub or evidence of thirty (30) days of income, and W‐2 form(s) for the most recent year. Assets listed on the application and required to qualify for the mortgage loan that are in a checking account would require a bank statement covering the most recent one month
– Standard Documentation: qualifying income for a salaried Mortgagor would require documentation that includes a verification of employment, a year‐to‐date paystub or evidence of thirty (30) days of income, and W‐2 form(s) for the most recent two years. Assets listed on the application and required to qualify for the mortgage loan that are in a checking account and would require a bank statement covering the most recent two months

© Freddie Mac 2015
Representations and Warranties» Freddie Mac relies on representations and warranties of each seller covering such matters as, but not limited to:
– The accuracy of the information provided by the mortgagor and seller,
– The validity of each mortgage loan as a first lien,
– The fact that payments are current on each mortgage loan,
– The physical condition of the Mortgaged Property,
– The originator’s compliance with applicable laws, including state anti‐predatory lending statutes.
Performing Loan Quality Control Review » Each month Freddie Mac selects a sample of the single‐family mortgage loans it acquired in the previous month in order to conduct a quality
control review of performing mortgage loans, with supplemental targeted sampling to focus on loan attributes or sellers that may be of particular interest or concern
» Freddie Mac verifies that each mortgage loan complies with Freddie Mac’s underwriting guidelines and other requirements set forth in the Guide as may be modified in any applicable TOBs
Non‐Performing Loan Quality Control Review» In addition to reviewing samples of newly‐acquired mortgage loans, Freddie Mac also reviews a significant portion of the mortgage loans that
default within the first few years after purchase or guarantee by Freddie Mac
» The review of non‐performing mortgage loans follows a similar process as the on‐going quality control reviews performed on samples of newly purchased loans
» Freddie Mac plans to review every loan that suffers a Credit Event for a STACR transaction
Seller In‐House Quality Control (QC)» Freddie Mac requires each seller to have an in‐house QC program that has written procedures, operates independently of the origination and
underwriting functions, includes re‐verification and/or re‐underwriting processes, regularly monitors the overall quality of mortgage production, and employs effective sampling and reporting procedures under which sellers agreed to sell mortgage loans to Freddie Mac
» Freddie Mac reviews, monitors and provides feedback on sellers, QC and origination practices in a variety of ways, including performing on‐site reviews of its largest sellers
Quality Control Overview
35
© Freddie Mac 2015
Credit Review» For mortgage loans selected to be reviewed, files are sent to vendors to re‐verify factual information and then the files are placed in a queue for
review.
» All mortgage loans reviewed are compared against the underwriting standards set forth in the Guide and as may be modified by any applicable TOBs in effect at the time of purchase by Freddie Mac, including a review of the original appraisals of the Mortgaged Properties that were obtained in connection with the origination of those mortgage loans.
» The original appraisal value of the Mortgaged Property is reviewed against a value from Freddie Mac’s automated valuation model, Home Value Explorer (“HVE”), when available, as well as a desk review by an underwriter, in order to assess if the original appraisal report supported the value and marketability of the subject property.
– To the extent HVE indicates that the original appraisal report significantly exceeded the actual value, Freddie Mac uses other tools, including review appraisals, to determine if value and marketability of the Mortgaged Property was supported.
» Freddie Mac also captures the names of parties to the sampled mortgage loan transactions and compares them to Freddie Mac’s exclusionary list, which is comprised of individuals and companies that are prohibited from participating in transactions involving Freddie Mac, either directly or indirectly, due to lack of integrity or business competency.
Compliance Review» Some mortgage loans are selected for anti‐predatory lending reviews and are reviewed to assess whether those mortgage loans were originated
in compliance with certain applicable laws and regulations.
» This assessment includes, for example, whether the mortgage loans reviewed met the definition of “high cost” loans under HOEPA or similar state or local laws.
» Mortgage loans in the sample that violate Freddie Mac’s charter or anti‐predatory laws are required to be repurchased by the applicable seller.
Quality Assurance» A Quality Assurance review is a secondary review performed on a small percentage of the mortgage loans in the Quality Control process, to
evaluate quality and consistency of the Quality Control underwriters’ and third‐party vendors’ decisions and processes with Freddie Mac’s credit policies and procedures.
Quality Control Review Process
36
© Freddie Mac 2015
Underwriting Defects» In its sole discretion, Freddie Mac determines that a loan has an underwriting defect, through the identification of one of the following:
– a material violation of the underwriting guidelines and other requirements in the Guide and as may be modified by the related seller contract withrespect to such loan,
– inadequate collateral securing such loan; or
– as of the origination date, repayment in full cannot be expected
» The most common underwriting defects found in the reviews of loans purchased in 2013 related to insufficient income and inadequate or missing documentation to support Mortgagor qualification. Other common defects include LP requirements not met and inappropriate comparables used to support appraisal value
Underwriting Defects Repurchase Process» Freddie Mac may require or permit the seller or servicer of a Mortgage Loan to repurchase any such loan if there is an underwriting defect
discovered through the credit review, compliance review, or quality assurance process
» To the extent that Freddie Mac determines that the origination of a Mortgage Loan has an underwriting defect relating to a representation or warranty given by a seller, the applicable seller or servicer generally will be obligated to repurchase the Mortgage Loan within 60 days after receipt of notice from Freddie Mac of such defect
» Upon receipt of a repurchase notice, the seller or servicer may file an appeal if it has additional supporting information and/or documentation that may affect Freddie Mac’s decision. The appeal must be filed within 60 days from the date of Freddie Mac’s notice requiring repurchase
» An underwriting defect becomes confirmed when:
– Such loan is repurchased by the related seller or servicer,
– In lieu of repurchase, an alternative remedy (such as indemnification) is mutually agreed upon by both Freddie Mac and the seller or servicer; or
– Freddie Mac, in its sole discretion, elects to waive the enforcement of a remedy against the seller or servicer in respect of such underwriting defect
Quality Control Review Process (cont.)
37
© Freddie Mac 2015
Appendix 1 – Part C. Single Family Servicing Oversight and Control
38

© Freddie Mac 2015
Servicing Standards
39
Servicing Overview» Servicers are required to perform customary mortgage loan servicing functions, including:
– collection of payments from Mortgagors and remitting payments to Freddie Mac;– maintenance of primary mortgage loan and property insurance and filing and settlement of claims under those policies;– maintenance of escrow accounts of some Mortgagors for payment of taxes, insurance, and other items required to be paid by the Mortgagors pursuant
to terms of the related mortgage loan;– processing of assumptions, substitutions, payoffs and releases;– attempting to cure delinquencies and mitigate losses;– supervising foreclosures or repossessions;
» Freddie Mac retains the right to revoke, re‐assign or terminate servicing of any servicer, subject to the terms of the Guide (as modified) and as may be further modified by terms of business applicable to a servicer
Loss Mitigation» Servicers are required to contact a delinquent Mortgagor early in the delinquency process and throughout the delinquency cycle in order to
mitigate the risk of default» Freddie Mac’s loss mitigation strategy emphasizes early intervention by servicers in delinquent mortgage loans and provides alternatives to
foreclosure, including:– Forbearance agreements, where reduced payments or no payments are required during a defined period, generally less than one year (Freddie Mac
does not permit principal forgiveness)– Repayment plans, which are contractual plans to make up past due amounts– Loan modifications, which may involve changing the terms of the mortgage loan, or capitalizing outstanding indebtedness, (such as delinquent
interest), to the unpaid principal balance of the mortgage loan, or a combination of both. Freddie Mac may grant partial principal forbearance as part of a modification but does not utilize principal forgiveness
– Short sales, which involve allowing the Mortgagor to sell the Mortgaged Property to an unrelated third party for an amount that is insufficient to pay off the mortgage loan in full
– Deeds in lieu of foreclosure which are processed similar to a short sale except that the Mortgaged Property is not sold to a third party but is conveyed directly to Freddie Mac
– Mortgage assumption by which a new party assumes the obligations of the Mortgagor under the Mortgage Note, and may be performed simultaneously with a loan modification
» If a loan workout has not been reached by the 120th day of delinquency, servicers are generally required to accelerate payment of principal from the Mortgagor and initiate foreclosure proceedings with respect to a Mortgage in accordance with the provisions of the Guide (as modified) and as may be modified any terms of business applicable to a servicer
© Freddie Mac 2015
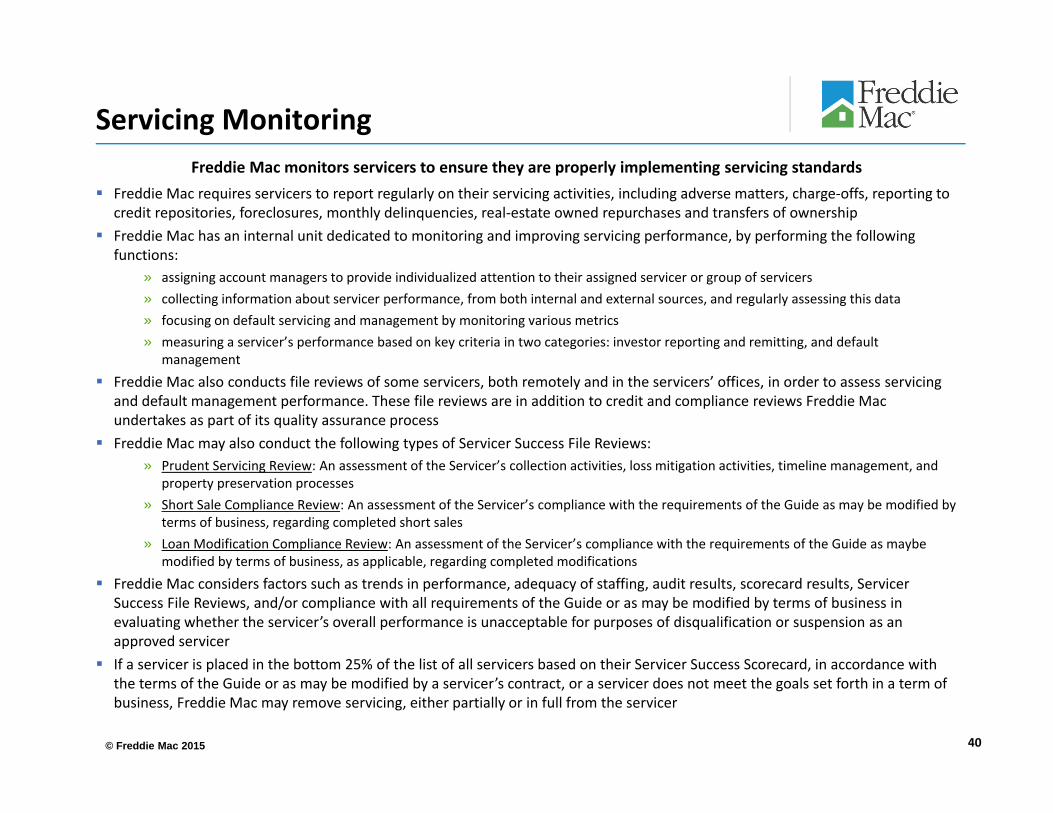
Servicing Monitoring
Freddie Mac requires servicers to report regularly on their servicing activities, including adverse matters, charge‐offs, reporting to credit repositories, foreclosures, monthly delinquencies, real‐estate owned repurchases and transfers of ownership
Freddie Mac has an internal unit dedicated to monitoring and improving servicing performance, by performing the following functions:
» assigning account managers to provide individualized attention to their assigned servicer or group of servicers» collecting information about servicer performance, from both internal and external sources, and regularly assessing this data» focusing on default servicing and management by monitoring various metrics» measuring a servicer’s performance based on key criteria in two categories: investor reporting and remitting, and default
management Freddie Mac also conducts file reviews of some servicers, both remotely and in the servicers’ offices, in order to assess servicing
and default management performance. These file reviews are in addition to credit and compliance reviews Freddie Mac undertakes as part of its quality assurance process
Freddie Mac may also conduct the following types of Servicer Success File Reviews:» Prudent Servicing Review: An assessment of the Servicer’s collection activities, loss mitigation activities, timeline management, and
property preservation processes» Short Sale Compliance Review: An assessment of the Servicer’s compliance with the requirements of the Guide as may be modified by
terms of business, regarding completed short sales» Loan Modification Compliance Review: An assessment of the Servicer’s compliance with the requirements of the Guide as maybe
modified by terms of business, as applicable, regarding completed modifications Freddie Mac considers factors such as trends in performance, adequacy of staffing, audit results, scorecard results, Servicer
Success File Reviews, and/or compliance with all requirements of the Guide or as may be modified by terms of business in evaluating whether the servicer’s overall performance is unacceptable for purposes of disqualification or suspension as an approved servicer
If a servicer is placed in the bottom 25% of the list of all servicers based on their Servicer Success Scorecard, in accordance with the terms of the Guide or as may be modified by a servicer’s contract, or a servicer does not meet the goals set forth in a term of business, Freddie Mac may remove servicing, either partially or in full from the servicer
Freddie Mac monitors servicers to ensure they are properly implementing servicing standards
40
© Freddie Mac 2015
Appendix 2. Data and Market Transparency
41

© Freddie Mac 2015
Data Transparency Freddie Mac has made available the Single‐Family Loan‐Level Dataset as part of a larger effort to increase
transparency and help investors build more accurate credit performance models in support of the risk‐sharing initiatives.
The Single‐Family Loan‐Level Dataset includes loan‐level origination and monthly loan performance data on a portion of single‐family mortgages acquired by Freddie Mac. Approximately 16.9 million loans are in the “full” Single‐Family Loan‐Level Dataset, meeting the following selection criteria:
» Fully amortizing 30‐year fixed‐rate mortgages originated from January 1, 1999 through June 30, 2013, with monthly loan performance data through December 31, 2013, that were sold to Freddie Mac or issued in Freddie Mac Participation Certificates (“PCs”)
» Mortgages categorized as having verified or waived documentation (i.e. “full documentation”)
This level of quality and historical data is generally not seen in the private label RMBS market
Freddie Mac has created a smaller dataset for those who do not require the full dataset or do not have the capability to download the full dataset
Investors can rely upon the dataset to model transaction projections and performance
Additionally, Freddie Mac releases loan level data for all STACR deals on a monthly basis
42
© Freddie Mac 2015
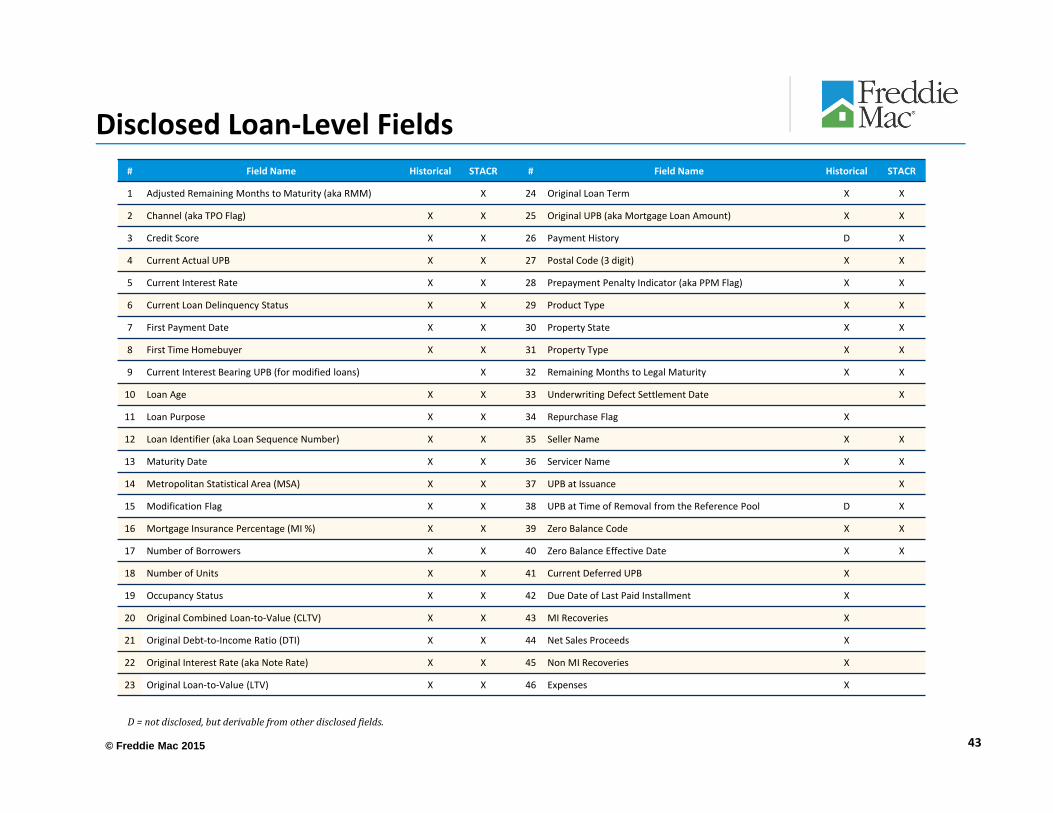
Disclosed Loan‐Level Fields# Field Name Historical STACR # Field Name Historical STACR
1 Adjusted Remaining Months to Maturity (aka RMM) X 24 Original Loan Term X X
2 Channel (aka TPO Flag) X X 25 Original UPB (aka Mortgage Loan Amount) X X
3 Credit Score X X 26 Payment History D X
4 Current Actual UPB X X 27 Postal Code (3 digit) X X
5 Current Interest Rate X X 28 Prepayment Penalty Indicator (aka PPM Flag) X X
6 Current Loan Delinquency Status X X 29 Product Type X X
7 First Payment Date X X 30 Property State X X
8 First Time Homebuyer X X 31 Property Type X X
9 Current Interest Bearing UPB (for modified loans) X 32 Remaining Months to Legal Maturity X X
10 Loan Age X X 33 Underwriting Defect Settlement Date X
11 Loan Purpose X X 34 Repurchase Flag X
12 Loan Identifier (aka Loan Sequence Number) X X 35 Seller Name X X
13 Maturity Date X X 36 Servicer Name X X
14 Metropolitan Statistical Area (MSA) X X 37 UPB at Issuance X
15 Modification Flag X X 38 UPB at Time of Removal from the Reference Pool D X
16 Mortgage Insurance Percentage (MI %) X X 39 Zero Balance Code X X
17 Number of Borrowers X X 40 Zero Balance Effective Date X X
18 Number of Units X X 41 Current Deferred UPB X
19 Occupancy Status X X 42 Due Date of Last Paid Installment X
20 Original Combined Loan‐to‐Value (CLTV) X X 43 MI Recoveries X
21 Original Debt‐to‐Income Ratio (DTI) X X 44 Net Sales Proceeds X
22 Original Interest Rate (aka Note Rate) X X 45 Non MI Recoveries X
23 Original Loan‐to‐Value (LTV) X X 46 Expenses X
43
D=notdisclosed,butderivablefromotherdisclosedfields.
© Freddie Mac 2015
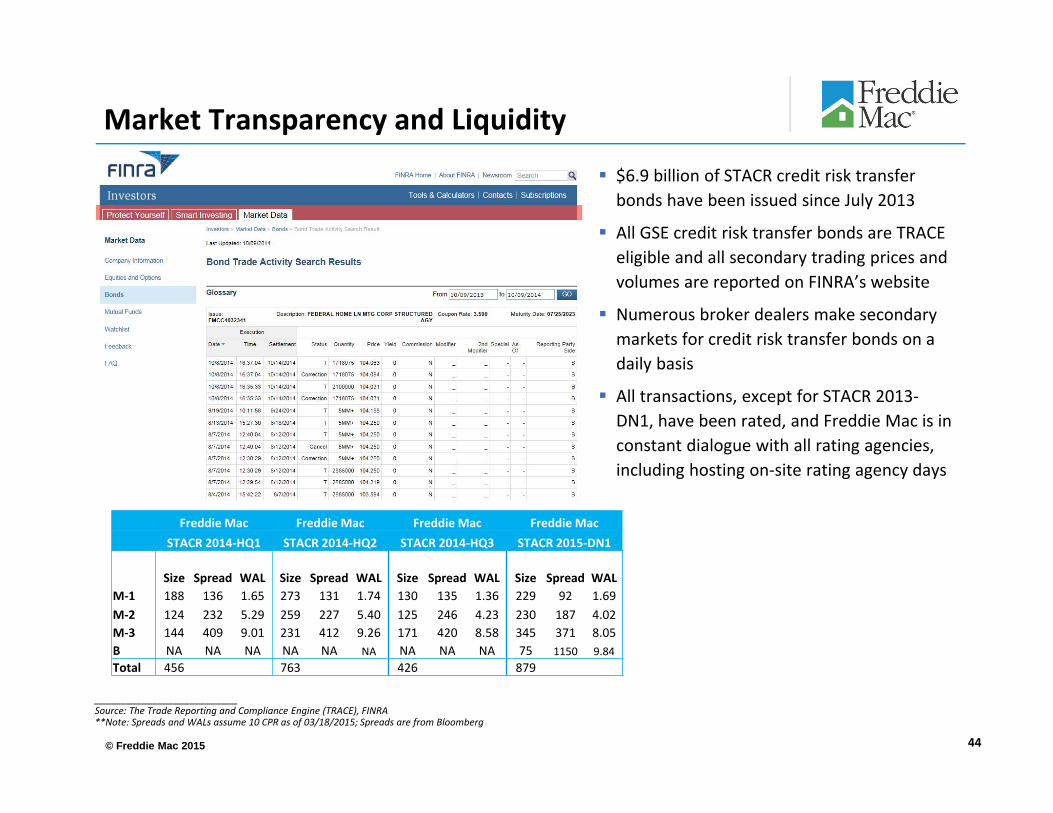
Market Transparency and Liquidity
44
$6.9 billion of STACR credit risk transfer bonds have been issued since July 2013
All GSE credit risk transfer bonds are TRACE eligible and all secondary trading prices and volumes are reported on FINRA’s website
Numerous broker dealers make secondary markets for credit risk transfer bonds on a daily basis
All transactions, except for STACR 2013‐DN1, have been rated, and Freddie Mac is in constant dialogue with all rating agencies, including hosting on‐site rating agency days
Freddie Mac Freddie Mac Freddie Mac Freddie MacSTACR 2014‐HQ1 STACR 2014‐HQ2 STACR 2014‐HQ3 STACR 2015‐DN1
Size Spread WAL Size Spread WAL Size Spread WAL Size Spread WALM‐1 188 136 1.65 273 131 1.74 130 135 1.36 229 92 1.69M‐2 124 232 5.29 259 227 5.40 125 246 4.23 230 187 4.02M‐3 144 409 9.01 231 412 9.26 171 420 8.58 345 371 8.05B NA NA NA NA NA NA NA NA NA 75 1150 9.84Total 456 763 426 879
___________________________Source: The Trade Reporting and Compliance Engine (TRACE), FINRA**Note: Spreads and WALs assume 10 CPR as of 03/18/2015; Spreads are from Bloomberg

© Freddie Mac 2015
Appendix 3. STACR 2015‐HQ1: Key Terms & Structure Overview
45

© Freddie Mac 2015
Issuer Freddie Mac
Master Servicer Freddie Mac
Reference Pool Pool of all mortgage loans acquired by Freddie Mac between April 1, 2014 and July 31, 2014 and securitized in a mortgage participation certificate (“PC”) by October 31, 2014 and remained in such PC as of March 3, 2015, that meet the Eligibility Criteria, and have not been prepaid in full, have never been delinquent as of January 31, 2015, have not been repurchased and do not have any outstanding repurchase letters
Credit Event1 Any loan that becomes 180 or more Days Delinquent2; or Third Party Sale prior to D180; or Short Sale prior to D180; or Deed‐in‐Lieu of Foreclosure prior to D180; or REO acquisition prior to D180. 1 100% of Reference Obligations that suffer Credit Events undergo Freddie Mac Quality Control review2 For a period of 18 months, Freddie Mac will not declare a Credit Event based on a delinquency of 180 days or more with respect to any Reference Obligation that is in natural disaster forbearance
Modifications Modifications do not constitute Credit Events and remain in the pool until they prepay in full or experience a Credit Event. Principal reduction modifications (if applicable) would be treated as partial prepays and capitalized arrears would increase the balance of the reference pool
Maturity 10 year legal final maturity
Optional Clean‐up Call 10%
Allocation of Principal and Write‐downs
Sequential pay among subordinate classes
Reference Pool Removals Credit Event; payment in full of the Reference Obligation; Underwriting Defect; discovery of a violation of the Eligibility Criteria; Reference Obligation is seized pursuant to any special eminent domain proceeding brought by any federal, state or local government instrumentality with the intent to provide relief to financially‐distressed borrowers with negative equity in the underlying mortgage loan.
Credit Event Reversals Principal balance of STACR note previously written down due to Credit Events on mortgage loans in the Reference Pool will be restored in the event that Freddie Mac determines, subsequent to the Credit Event, that an underwriting defect has been confirmed
46
Key STACR 2015‐HQ1 Terms
M‐1 & M‐1H
M‐2 & M‐2H
M‐3 & M‐3H
B & B‐H
Write‐downs are allocated reverse sequentially
Principal is allocated sequentially
© Freddie Mac 2015
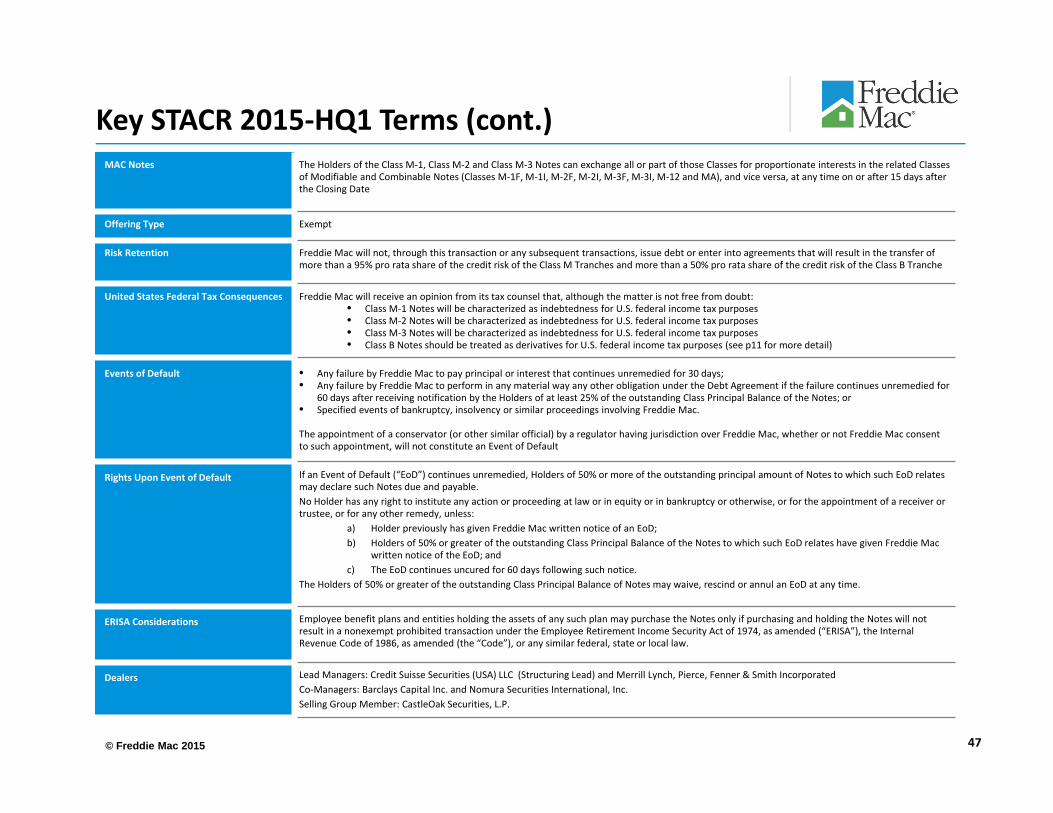
MAC Notes The Holders of the Class M‐1, Class M‐2 and Class M‐3 Notes can exchange all or part of those Classes for proportionate interests in the related Classes of Modifiable and Combinable Notes (Classes M‐1F, M‐1I, M‐2F, M‐2I, M‐3F, M‐3I, M‐12 and MA), and vice versa, at any time on or after 15 days after the Closing Date
Offering Type Exempt
Risk Retention Freddie Mac will not, through this transaction or any subsequent transactions, issue debt or enter into agreements that will result in the transfer of more than a 95% pro rata share of the credit risk of the Class M Tranches and more than a 50% pro rata share of the credit risk of the Class B Tranche
United States Federal Tax Consequences Freddie Mac will receive an opinion from its tax counsel that, although the matter is not free from doubt: • Class M‐1 Notes will be characterized as indebtedness for U.S. federal income tax purposes• Class M‐2 Notes will be characterized as indebtedness for U.S. federal income tax purposes• Class M‐3 Notes will be characterized as indebtedness for U.S. federal income tax purposes• Class B Notes should be treated as derivatives for U.S. federal income tax purposes (see p11 for more detail)
Events of Default • Any failure by Freddie Mac to pay principal or interest that continues unremedied for 30 days;• Any failure by Freddie Mac to perform in any material way any other obligation under the Debt Agreement if the failure continues unremedied for
60 days after receiving notification by the Holders of at least 25% of the outstanding Class Principal Balance of the Notes; or• Specified events of bankruptcy, insolvency or similar proceedings involving Freddie Mac.
The appointment of a conservator (or other similar official) by a regulator having jurisdiction over Freddie Mac, whether or not Freddie Mac consent to such appointment, will not constitute an Event of Default
Rights Upon Event of Default If an Event of Default (“EoD”) continues unremedied, Holders of 50% or more of the outstanding principal amount of Notes to which such EoD relates may declare such Notes due and payable.No Holder has any right to institute any action or proceeding at law or in equity or in bankruptcy or otherwise, or for the appointment of a receiver or trustee, or for any other remedy, unless:
a) Holder previously has given Freddie Mac written notice of an EoD;b) Holders of 50% or greater of the outstanding Class Principal Balance of the Notes to which such EoD relates have given Freddie Mac
written notice of the EoD; andc) The EoD continues uncured for 60 days following such notice.
The Holders of 50% or greater of the outstanding Class Principal Balance of Notes may waive, rescind or annul an EoD at any time.
ERISA Considerations Employee benefit plans and entities holding the assets of any such plan may purchase the Notes only if purchasing and holding the Notes will not result in a nonexempt prohibited transaction under the Employee Retirement Income Security Act of 1974, as amended (“ERISA”), the Internal Revenue Code of 1986, as amended (the “Code”), or any similar federal, state or local law.
Dealers Lead Managers: Credit Suisse Securities (USA) LLC (Structuring Lead) and Merrill Lynch, Pierce, Fenner & Smith IncorporatedCo‐Managers: Barclays Capital Inc. and Nomura Securities International, Inc.Selling Group Member: CastleOak Securities, L.P.
47
Key STACR 2015‐HQ1 Terms (cont.)
© Freddie Mac 2015
Appendix 4. STACR 2015‐HQ1: Reference Pool Overview
48
© Freddie Mac 2015
STACR 2015‐HQ1 Initial Cohort Pool to Reference Pool
49
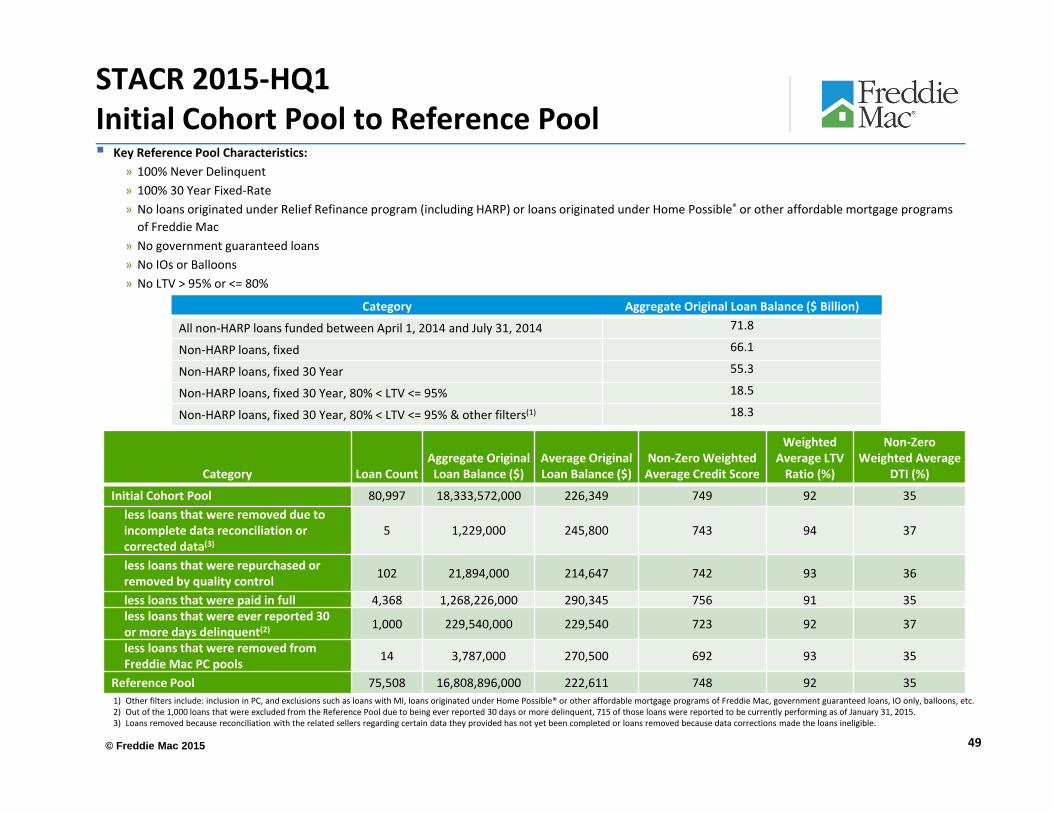
1) Other filters include: inclusion in PC, and exclusions such as loans with MI, loans originated under Home Possible® or other affordable mortgage programs of Freddie Mac, government guaranteed loans, IO only, balloons, etc.2) Out of the 1,000 loans that were excluded from the Reference Pool due to being ever reported 30 days or more delinquent, 715 of those loans were reported to be currently performing as of January 31, 2015.3) Loans removed because reconciliation with the related sellers regarding certain data they provided has not yet been completed or loans removed because data corrections made the loans ineligible.
Key Reference Pool Characteristics:» 100% Never Delinquent» 100% 30 Year Fixed‐Rate» No loans originated under Relief Refinance program (including HARP) or loans originated under Home Possible® or other affordable mortgage programs of Freddie Mac
» No government guaranteed loans» No IOs or Balloons» No LTV > 95% or <= 80%
Category Aggregate Original Loan Balance ($ Billion)
All non‐HARP loans funded between April 1, 2014 and July 31, 2014 71.8
Non‐HARP loans, fixed 66.1
Non‐HARP loans, fixed 30 Year 55.3
Non‐HARP loans, fixed 30 Year, 80% < LTV <= 95% 18.5
Non‐HARP loans, fixed 30 Year, 80% < LTV <= 95% & other filters(1) 18.3
Category Loan CountAggregate Original Loan Balance ($)
Average Original Loan Balance ($)
Non‐Zero Weighted Average Credit Score
Weighted Average LTV Ratio (%)
Non‐Zero Weighted Average
DTI (%)
Initial Cohort Pool 80,997 18,333,572,000 226,349 749 92 35less loans that were removed due to incomplete data reconciliation or corrected data(3)
5 1,229,000 245,800 743 94 37
less loans that were repurchased or removed by quality control 102 21,894,000 214,647 742 93 36
less loans that were paid in full 4,368 1,268,226,000 290,345 756 91 35less loans that were ever reported 30 or more days delinquent(2) 1,000 229,540,000 229,540 723 92 37
less loans that were removed from Freddie Mac PC pools 14 3,787,000 270,500 692 93 35
Reference Pool 75,508 16,808,896,000 222,611 748 92 35
© Freddie Mac 2015 50
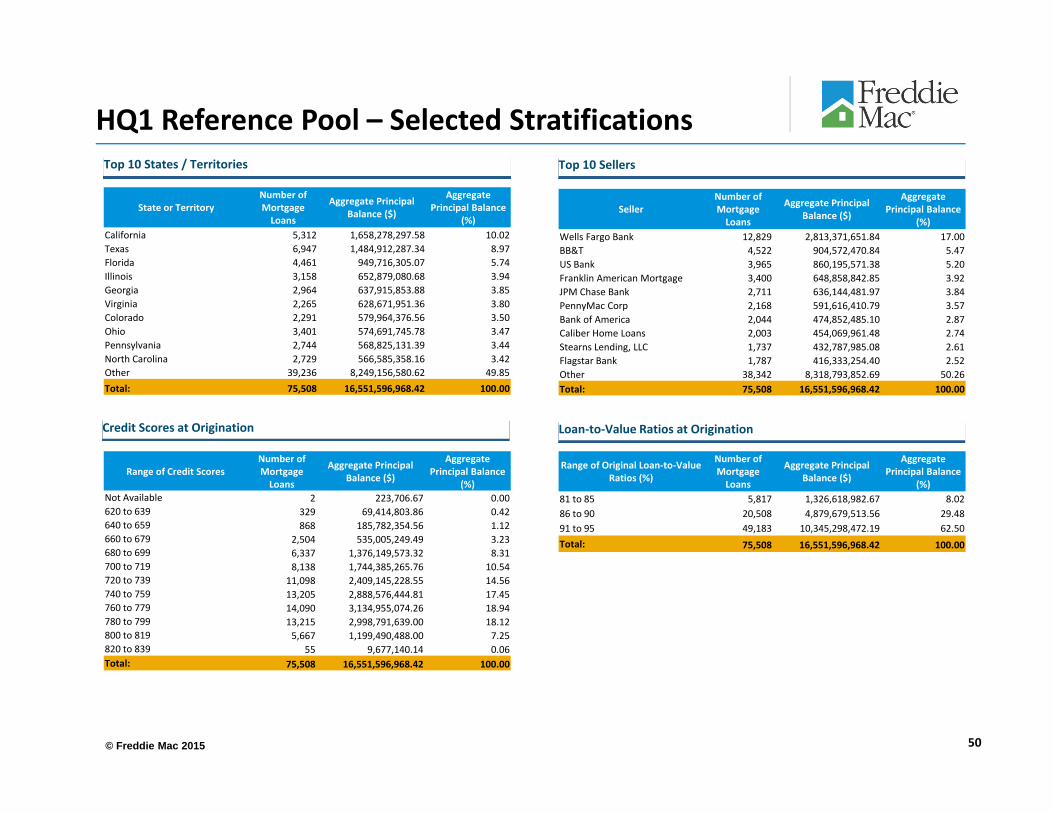
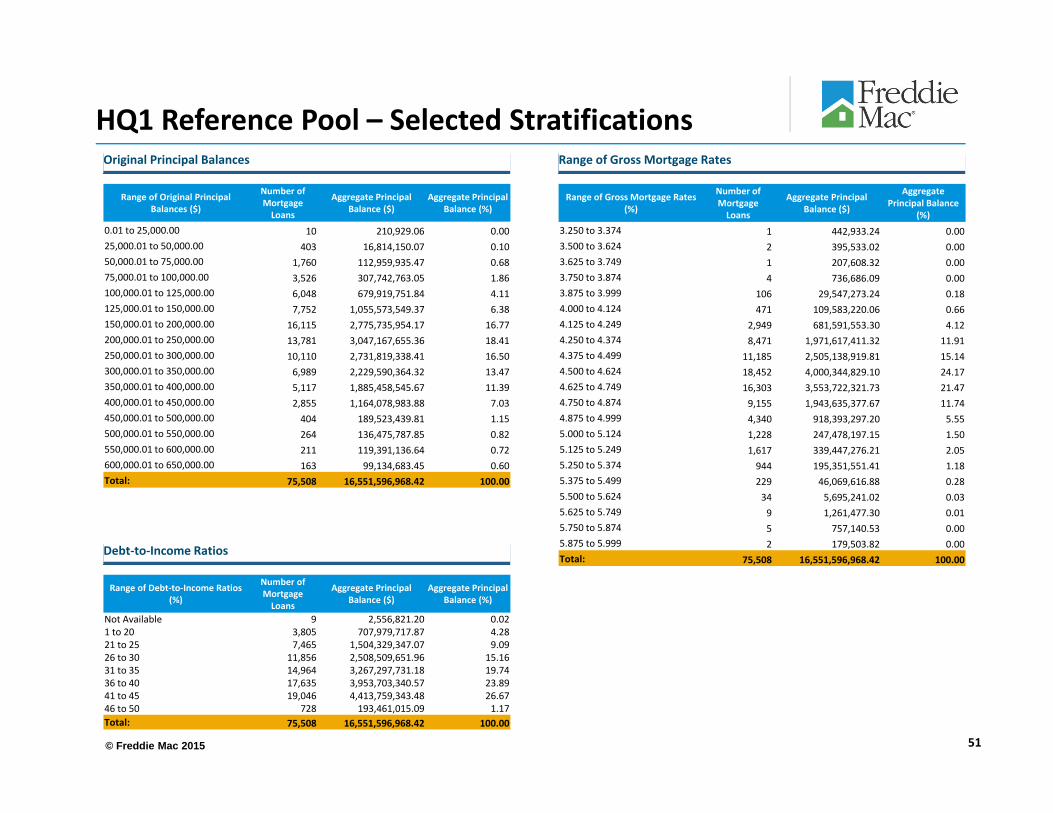
HQ1 Reference Pool – Selected Stratifications
State or TerritoryNumber ofMortgageLoans
Aggregate PrincipalBalance ($)
AggregatePrincipal Balance
(%)California 5,312 1,658,278,297.58 10.02Texas 6,947 1,484,912,287.34 8.97Florida 4,461 949,716,305.07 5.74Illinois 3,158 652,879,080.68 3.94Georgia 2,964 637,915,853.88 3.85Virginia 2,265 628,671,951.36 3.80Colorado 2,291 579,964,376.56 3.50Ohio 3,401 574,691,745.78 3.47Pennsylvania 2,744 568,825,131.39 3.44North Carolina 2,729 566,585,358.16 3.42Other 39,236 8,249,156,580.62 49.85Total: 75,508 16,551,596,968.42 100.00
Top 10 States / Territories Top 10 Sellers
SellerNumber ofMortgageLoans
Aggregate PrincipalBalance ($)
AggregatePrincipal Balance
(%)Wells Fargo Bank 12,829 2,813,371,651.84 17.00BB&T 4,522 904,572,470.84 5.47US Bank 3,965 860,195,571.38 5.20Franklin American Mortgage 3,400 648,858,842.85 3.92JPM Chase Bank 2,711 636,144,481.97 3.84PennyMac Corp 2,168 591,616,410.79 3.57Bank of America 2,044 474,852,485.10 2.87Caliber Home Loans 2,003 454,069,961.48 2.74Stearns Lending, LLC 1,737 432,787,985.08 2.61Flagstar Bank 1,787 416,333,254.40 2.52Other 38,342 8,318,793,852.69 50.26Total: 75,508 16,551,596,968.42 100.00
Range of Credit ScoresNumber ofMortgageLoans
Aggregate PrincipalBalance ($)
AggregatePrincipal Balance
(%)Not Available 2 223,706.67 0.00620 to 639 329 69,414,803.86 0.42640 to 659 868 185,782,354.56 1.12660 to 679 2,504 535,005,249.49 3.23680 to 699 6,337 1,376,149,573.32 8.31700 to 719 8,138 1,744,385,265.76 10.54720 to 739 11,098 2,409,145,228.55 14.56740 to 759 13,205 2,888,576,444.81 17.45760 to 779 14,090 3,134,955,074.26 18.94780 to 799 13,215 2,998,791,639.00 18.12800 to 819 5,667 1,199,490,488.00 7.25820 to 839 55 9,677,140.14 0.06Total: 75,508 16,551,596,968.42 100.00
Credit Scores at Origination Loan‐to‐Value Ratios at Origination
Range of Original Loan‐to‐Value Ratios (%)
Number ofMortgageLoans
Aggregate PrincipalBalance ($)
AggregatePrincipal Balance
(%)81 to 85 5,817 1,326,618,982.67 8.0286 to 90 20,508 4,879,679,513.56 29.4891 to 95 49,183 10,345,298,472.19 62.50Total: 75,508 16,551,596,968.42 100.00
© Freddie Mac 2015
HQ1 Reference Pool – Selected Stratifications
Range of Original Principal Balances ($)
Number ofMortgageLoans
Aggregate PrincipalBalance ($)
Aggregate PrincipalBalance (%)
0.01 to 25,000.00 10 210,929.06 0.0025,000.01 to 50,000.00 403 16,814,150.07 0.1050,000.01 to 75,000.00 1,760 112,959,935.47 0.6875,000.01 to 100,000.00 3,526 307,742,763.05 1.86100,000.01 to 125,000.00 6,048 679,919,751.84 4.11125,000.01 to 150,000.00 7,752 1,055,573,549.37 6.38150,000.01 to 200,000.00 16,115 2,775,735,954.17 16.77200,000.01 to 250,000.00 13,781 3,047,167,655.36 18.41250,000.01 to 300,000.00 10,110 2,731,819,338.41 16.50300,000.01 to 350,000.00 6,989 2,229,590,364.32 13.47350,000.01 to 400,000.00 5,117 1,885,458,545.67 11.39400,000.01 to 450,000.00 2,855 1,164,078,983.88 7.03450,000.01 to 500,000.00 404 189,523,439.81 1.15500,000.01 to 550,000.00 264 136,475,787.85 0.82550,000.01 to 600,000.00 211 119,391,136.64 0.72600,000.01 to 650,000.00 163 99,134,683.45 0.60Total: 75,508 16,551,596,968.42 100.00
Original Principal Balances
Range of Debt‐to‐Income Ratios (%)
Number ofMortgageLoans
Aggregate PrincipalBalance ($)
Aggregate PrincipalBalance (%)
Not Available 9 2,556,821.20 0.021 to 20 3,805 707,979,717.87 4.2821 to 25 7,465 1,504,329,347.07 9.0926 to 30 11,856 2,508,509,651.96 15.1631 to 35 14,964 3,267,297,731.18 19.7436 to 40 17,635 3,953,703,340.57 23.8941 to 45 19,046 4,413,759,343.48 26.6746 to 50 728 193,461,015.09 1.17Total: 75,508 16,551,596,968.42 100.00
Debt‐to‐Income Ratios
Range of Gross Mortgage Rates
Range of Gross Mortgage Rates (%)
Number ofMortgageLoans
Aggregate PrincipalBalance ($)
AggregatePrincipal Balance
(%)3.250 to 3.374 1 442,933.24 0.003.500 to 3.624 2 395,533.02 0.003.625 to 3.749 1 207,608.32 0.003.750 to 3.874 4 736,686.09 0.003.875 to 3.999 106 29,547,273.24 0.184.000 to 4.124 471 109,583,220.06 0.664.125 to 4.249 2,949 681,591,553.30 4.124.250 to 4.374 8,471 1,971,617,411.32 11.914.375 to 4.499 11,185 2,505,138,919.81 15.144.500 to 4.624 18,452 4,000,344,829.10 24.174.625 to 4.749 16,303 3,553,722,321.73 21.474.750 to 4.874 9,155 1,943,635,377.67 11.744.875 to 4.999 4,340 918,393,297.20 5.555.000 to 5.124 1,228 247,478,197.15 1.505.125 to 5.249 1,617 339,447,276.21 2.055.250 to 5.374 944 195,351,551.41 1.185.375 to 5.499 229 46,069,616.88 0.285.500 to 5.624 34 5,695,241.02 0.035.625 to 5.749 9 1,261,477.30 0.015.750 to 5.874 5 757,140.53 0.005.875 to 5.999 2 179,503.82 0.00Total: 75,508 16,551,596,968.42 100.00
51
© Freddie Mac 2015
Appendix 5. STACR 2015‐HQ1: Prepayment / Default Sensitivity
52

© Freddie Mac 2015 53
HQ1 Credit Event Sensitivity Table
Note: “CER” is Credit Event Rate, which is the assumed constant rate of Reference Obligations becoming Credit Event ReferenceObligations each month relative to the then outstanding aggregate principal balance of Reference Obligations.
Cumulative Credit Events (as % of Cut‐Off Date Balance)
CER 0% CPR 5% CPR 10% CPR 15% CPR 25% CPR 35% CPR0.25% ............................... 2.2% 1.8% 1.4% 1.1% 0.8% 0.6%0.50% ............................... 4.4% 3.5% 2.8% 2.3% 1.6% 1.1%0.75% ............................... 6.6% 5.2% 4.2% 3.4% 2.3% 1.7%1.00% ............................... 8.7% 6.9% 5.5% 4.5% 3.1% 2.2%1.25% ............................... 10.7% 8.5% 6.9% 5.6% 3.8% 2.7%1.50% ............................... 12.7% 10.1% 8.2% 6.6% 4.6% 3.3%2.00% ............................... 16.6% 13.3% 10.7% 8.7% 6.0% 4.3%2.50% ............................... 20.3% 16.3% 13.1% 10.7% 7.4% 5.4%
© Freddie Mac 2015 54
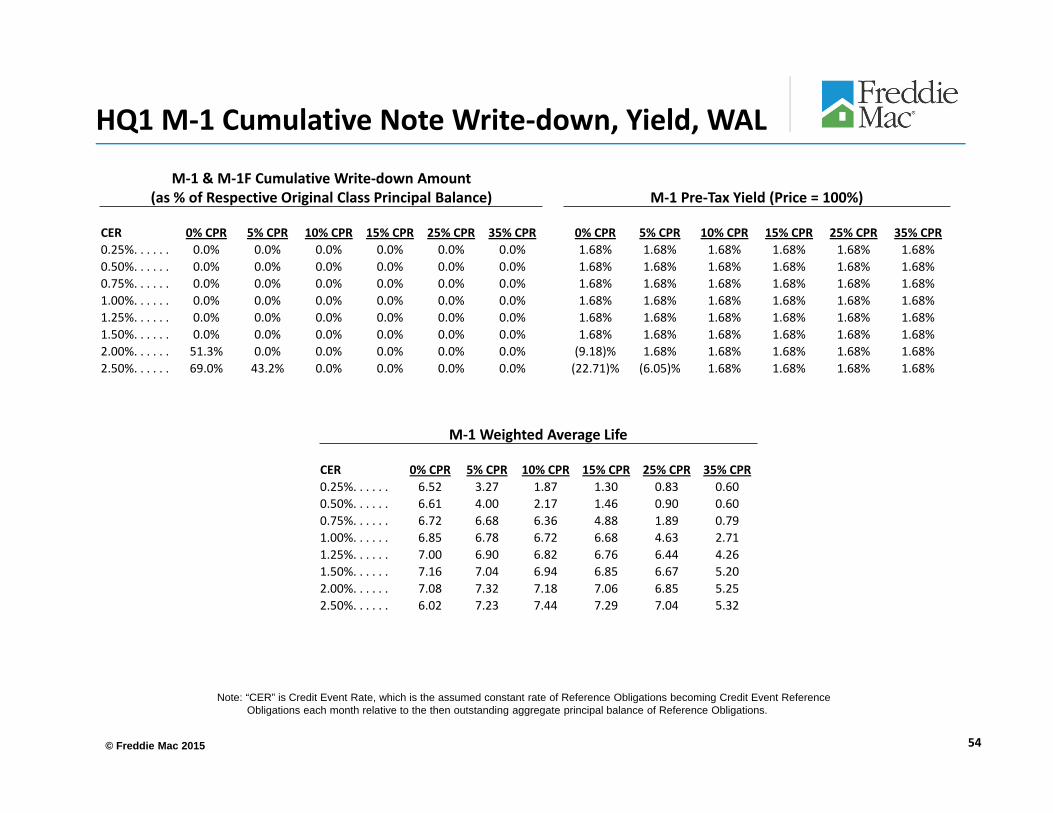
HQ1 M‐1 Cumulative Note Write‐down, Yield, WAL
M‐1 & M‐1F Cumulative Write‐down Amount (as % of Respective Original Class Principal Balance) M‐1 Pre‐Tax Yield (Price = 100%)
CER 0% CPR 5% CPR 10% CPR 15% CPR 25% CPR 35% CPR 0% CPR 5% CPR 10% CPR 15% CPR 25% CPR 35% CPR0.25%. . . . . . 0.0% 0.0% 0.0% 0.0% 0.0% 0.0% 1.68% 1.68% 1.68% 1.68% 1.68% 1.68%0.50%. . . . . . 0.0% 0.0% 0.0% 0.0% 0.0% 0.0% 1.68% 1.68% 1.68% 1.68% 1.68% 1.68%0.75%. . . . . . 0.0% 0.0% 0.0% 0.0% 0.0% 0.0% 1.68% 1.68% 1.68% 1.68% 1.68% 1.68%1.00%. . . . . . 0.0% 0.0% 0.0% 0.0% 0.0% 0.0% 1.68% 1.68% 1.68% 1.68% 1.68% 1.68%1.25%. . . . . . 0.0% 0.0% 0.0% 0.0% 0.0% 0.0% 1.68% 1.68% 1.68% 1.68% 1.68% 1.68%1.50%. . . . . . 0.0% 0.0% 0.0% 0.0% 0.0% 0.0% 1.68% 1.68% 1.68% 1.68% 1.68% 1.68%2.00%. . . . . . 51.3% 0.0% 0.0% 0.0% 0.0% 0.0% (9.18)% 1.68% 1.68% 1.68% 1.68% 1.68%2.50%. . . . . . 69.0% 43.2% 0.0% 0.0% 0.0% 0.0% (22.71)% (6.05)% 1.68% 1.68% 1.68% 1.68%
M‐1 Weighted Average Life
CER 0% CPR 5% CPR 10% CPR 15% CPR 25% CPR 35% CPR0.25%. . . . . . 6.52 3.27 1.87 1.30 0.83 0.600.50%. . . . . . 6.61 4.00 2.17 1.46 0.90 0.600.75%. . . . . . 6.72 6.68 6.36 4.88 1.89 0.791.00%. . . . . . 6.85 6.78 6.72 6.68 4.63 2.711.25%. . . . . . 7.00 6.90 6.82 6.76 6.44 4.261.50%. . . . . . 7.16 7.04 6.94 6.85 6.67 5.202.00%. . . . . . 7.08 7.32 7.18 7.06 6.85 5.252.50%. . . . . . 6.02 7.23 7.44 7.29 7.04 5.32
Note: “CER” is Credit Event Rate, which is the assumed constant rate of Reference Obligations becoming Credit Event ReferenceObligations each month relative to the then outstanding aggregate principal balance of Reference Obligations.
© Freddie Mac 2015 55
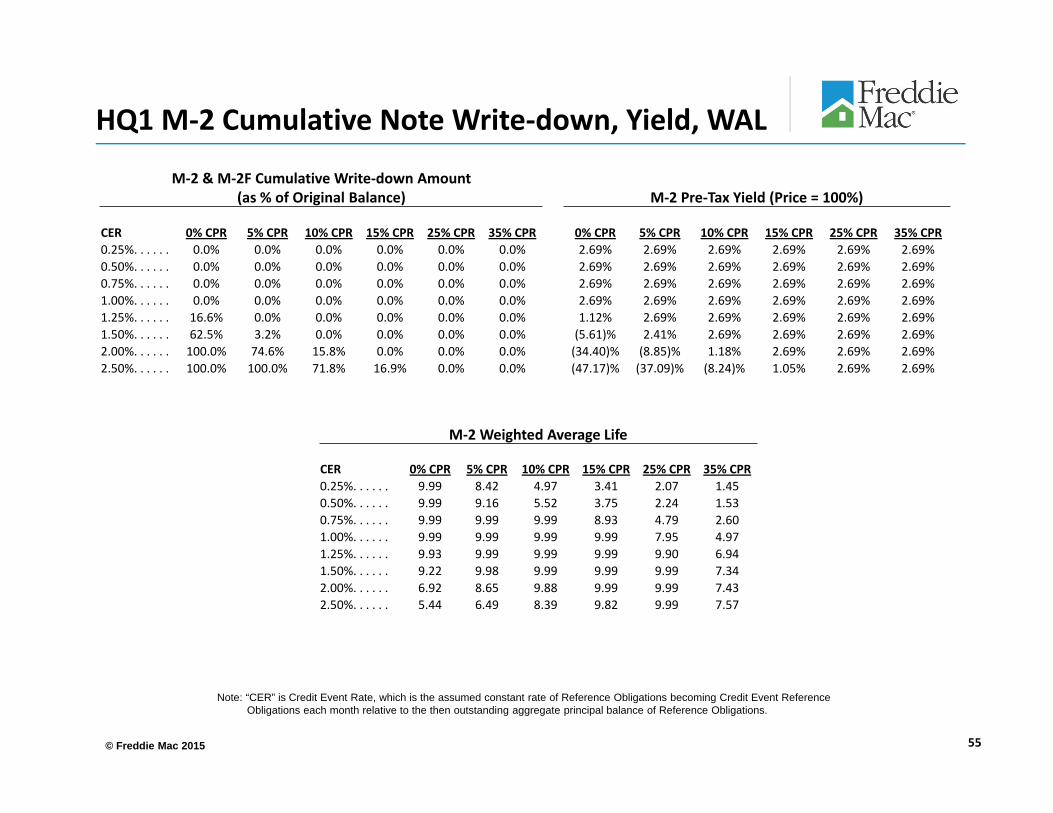
HQ1 M‐2 Cumulative Note Write‐down, Yield, WAL
M‐2 & M‐2F Cumulative Write‐down Amount (as % of Original Balance) M‐2 Pre‐Tax Yield (Price = 100%)
CER 0% CPR 5% CPR 10% CPR 15% CPR 25% CPR 35% CPR 0% CPR 5% CPR 10% CPR 15% CPR 25% CPR 35% CPR0.25%. . . . . . 0.0% 0.0% 0.0% 0.0% 0.0% 0.0% 2.69% 2.69% 2.69% 2.69% 2.69% 2.69%0.50%. . . . . . 0.0% 0.0% 0.0% 0.0% 0.0% 0.0% 2.69% 2.69% 2.69% 2.69% 2.69% 2.69%0.75%. . . . . . 0.0% 0.0% 0.0% 0.0% 0.0% 0.0% 2.69% 2.69% 2.69% 2.69% 2.69% 2.69%1.00%. . . . . . 0.0% 0.0% 0.0% 0.0% 0.0% 0.0% 2.69% 2.69% 2.69% 2.69% 2.69% 2.69%1.25%. . . . . . 16.6% 0.0% 0.0% 0.0% 0.0% 0.0% 1.12% 2.69% 2.69% 2.69% 2.69% 2.69%1.50%. . . . . . 62.5% 3.2% 0.0% 0.0% 0.0% 0.0% (5.61)% 2.41% 2.69% 2.69% 2.69% 2.69%2.00%. . . . . . 100.0% 74.6% 15.8% 0.0% 0.0% 0.0% (34.40)% (8.85)% 1.18% 2.69% 2.69% 2.69%2.50%. . . . . . 100.0% 100.0% 71.8% 16.9% 0.0% 0.0% (47.17)% (37.09)% (8.24)% 1.05% 2.69% 2.69%
M‐2 Weighted Average Life
CER 0% CPR 5% CPR 10% CPR 15% CPR 25% CPR 35% CPR0.25%. . . . . . 9.99 8.42 4.97 3.41 2.07 1.450.50%. . . . . . 9.99 9.16 5.52 3.75 2.24 1.530.75%. . . . . . 9.99 9.99 9.99 8.93 4.79 2.601.00%. . . . . . 9.99 9.99 9.99 9.99 7.95 4.971.25%. . . . . . 9.93 9.99 9.99 9.99 9.90 6.941.50%. . . . . . 9.22 9.98 9.99 9.99 9.99 7.342.00%. . . . . . 6.92 8.65 9.88 9.99 9.99 7.432.50%. . . . . . 5.44 6.49 8.39 9.82 9.99 7.57
Note: “CER” is Credit Event Rate, which is the assumed constant rate of Reference Obligations becoming Credit Event ReferenceObligations each month relative to the then outstanding aggregate principal balance of Reference Obligations.
© Freddie Mac 2015 56
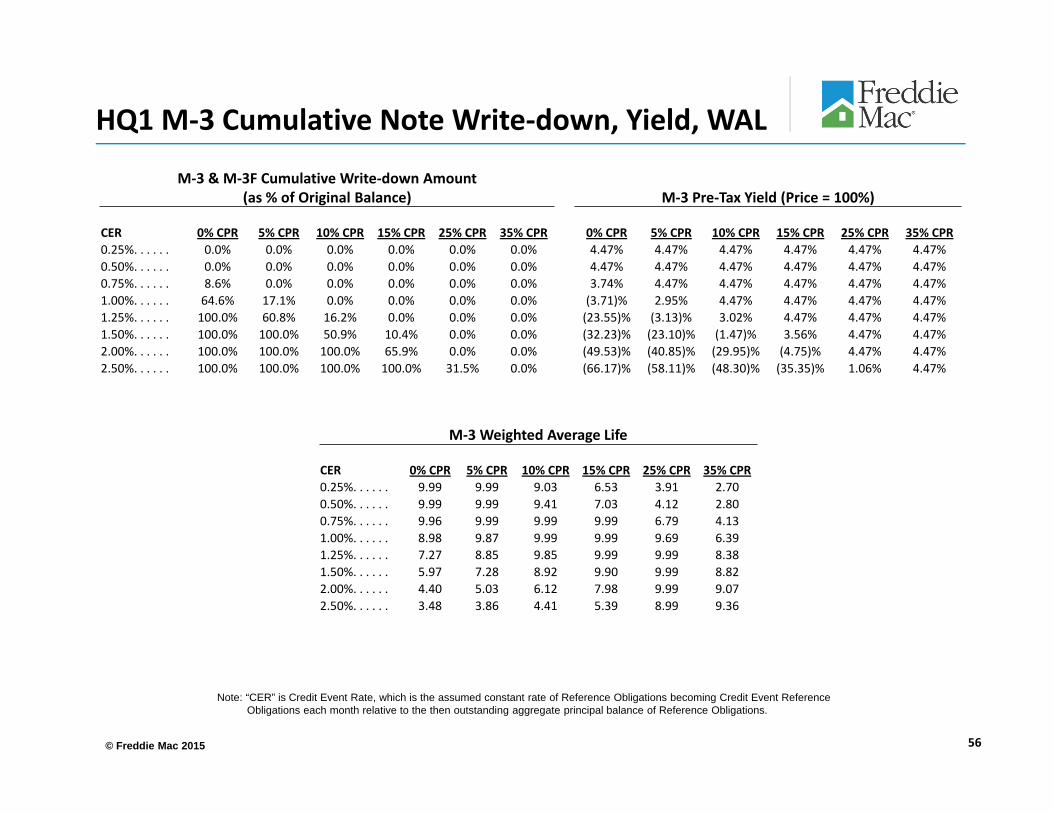
HQ1 M‐3 Cumulative Note Write‐down, Yield, WAL
M‐3 & M‐3F Cumulative Write‐down Amount(as % of Original Balance) M‐3 Pre‐Tax Yield (Price = 100%)
CER 0% CPR 5% CPR 10% CPR 15% CPR 25% CPR 35% CPR 0% CPR 5% CPR 10% CPR 15% CPR 25% CPR 35% CPR0.25%. . . . . . 0.0% 0.0% 0.0% 0.0% 0.0% 0.0% 4.47% 4.47% 4.47% 4.47% 4.47% 4.47%0.50%. . . . . . 0.0% 0.0% 0.0% 0.0% 0.0% 0.0% 4.47% 4.47% 4.47% 4.47% 4.47% 4.47%0.75%. . . . . . 8.6% 0.0% 0.0% 0.0% 0.0% 0.0% 3.74% 4.47% 4.47% 4.47% 4.47% 4.47%1.00%. . . . . . 64.6% 17.1% 0.0% 0.0% 0.0% 0.0% (3.71)% 2.95% 4.47% 4.47% 4.47% 4.47%1.25%. . . . . . 100.0% 60.8% 16.2% 0.0% 0.0% 0.0% (23.55)% (3.13)% 3.02% 4.47% 4.47% 4.47%1.50%. . . . . . 100.0% 100.0% 50.9% 10.4% 0.0% 0.0% (32.23)% (23.10)% (1.47)% 3.56% 4.47% 4.47%2.00%. . . . . . 100.0% 100.0% 100.0% 65.9% 0.0% 0.0% (49.53)% (40.85)% (29.95)% (4.75)% 4.47% 4.47%2.50%. . . . . . 100.0% 100.0% 100.0% 100.0% 31.5% 0.0% (66.17)% (58.11)% (48.30)% (35.35)% 1.06% 4.47%
M‐3 Weighted Average Life
CER 0% CPR 5% CPR 10% CPR 15% CPR 25% CPR 35% CPR0.25%. . . . . . 9.99 9.99 9.03 6.53 3.91 2.700.50%. . . . . . 9.99 9.99 9.41 7.03 4.12 2.800.75%. . . . . . 9.96 9.99 9.99 9.99 6.79 4.131.00%. . . . . . 8.98 9.87 9.99 9.99 9.69 6.391.25%. . . . . . 7.27 8.85 9.85 9.99 9.99 8.381.50%. . . . . . 5.97 7.28 8.92 9.90 9.99 8.822.00%. . . . . . 4.40 5.03 6.12 7.98 9.99 9.072.50%. . . . . . 3.48 3.86 4.41 5.39 8.99 9.36
Note: “CER” is Credit Event Rate, which is the assumed constant rate of Reference Obligations becoming Credit Event ReferenceObligations each month relative to the then outstanding aggregate principal balance of Reference Obligations.
© Freddie Mac 2015 57
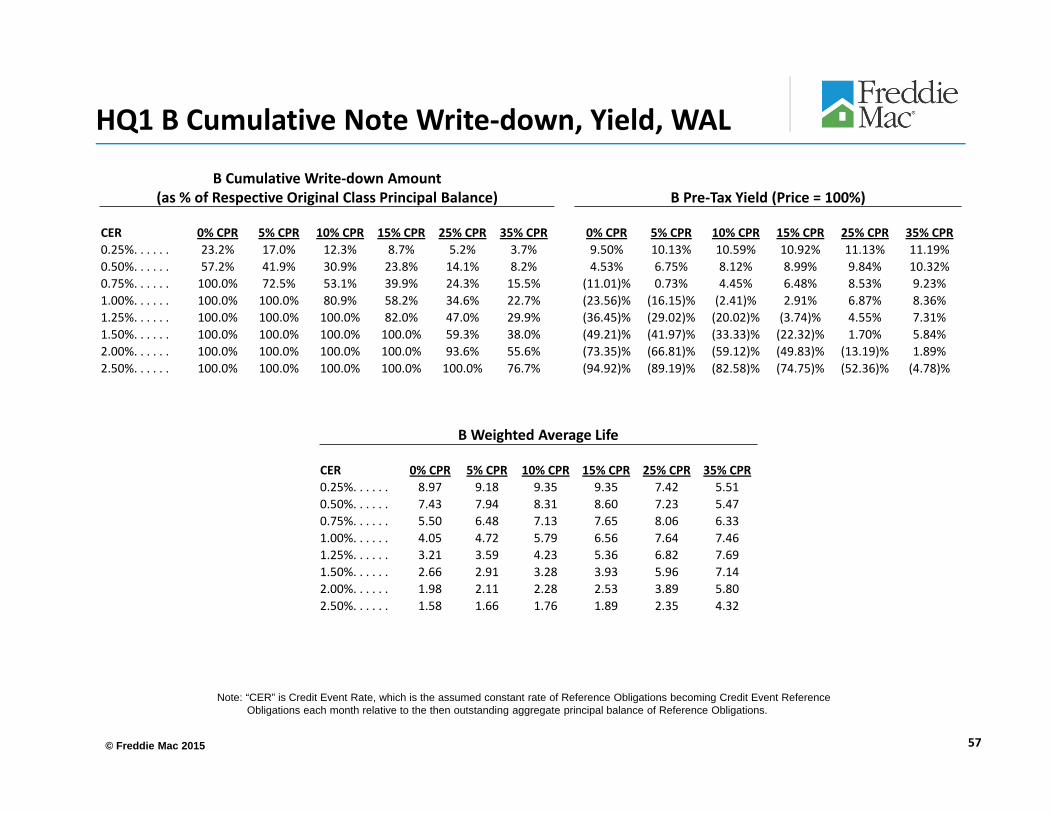
HQ1 B Cumulative Note Write‐down, Yield, WAL
B Cumulative Write‐down Amount(as % of Respective Original Class Principal Balance) B Pre‐Tax Yield (Price = 100%)
CER 0% CPR 5% CPR 10% CPR 15% CPR 25% CPR 35% CPR 0% CPR 5% CPR 10% CPR 15% CPR 25% CPR 35% CPR0.25%. . . . . . 23.2% 17.0% 12.3% 8.7% 5.2% 3.7% 9.50% 10.13% 10.59% 10.92% 11.13% 11.19%0.50%. . . . . . 57.2% 41.9% 30.9% 23.8% 14.1% 8.2% 4.53% 6.75% 8.12% 8.99% 9.84% 10.32%0.75%. . . . . . 100.0% 72.5% 53.1% 39.9% 24.3% 15.5% (11.01)% 0.73% 4.45% 6.48% 8.53% 9.23%1.00%. . . . . . 100.0% 100.0% 80.9% 58.2% 34.6% 22.7% (23.56)% (16.15)% (2.41)% 2.91% 6.87% 8.36%1.25%. . . . . . 100.0% 100.0% 100.0% 82.0% 47.0% 29.9% (36.45)% (29.02)% (20.02)% (3.74)% 4.55% 7.31%1.50%. . . . . . 100.0% 100.0% 100.0% 100.0% 59.3% 38.0% (49.21)% (41.97)% (33.33)% (22.32)% 1.70% 5.84%2.00%. . . . . . 100.0% 100.0% 100.0% 100.0% 93.6% 55.6% (73.35)% (66.81)% (59.12)% (49.83)% (13.19)% 1.89%2.50%. . . . . . 100.0% 100.0% 100.0% 100.0% 100.0% 76.7% (94.92)% (89.19)% (82.58)% (74.75)% (52.36)% (4.78)%
B Weighted Average Life
CER 0% CPR 5% CPR 10% CPR 15% CPR 25% CPR 35% CPR0.25%. . . . . . 8.97 9.18 9.35 9.35 7.42 5.510.50%. . . . . . 7.43 7.94 8.31 8.60 7.23 5.470.75%. . . . . . 5.50 6.48 7.13 7.65 8.06 6.331.00%. . . . . . 4.05 4.72 5.79 6.56 7.64 7.461.25%. . . . . . 3.21 3.59 4.23 5.36 6.82 7.691.50%. . . . . . 2.66 2.91 3.28 3.93 5.96 7.142.00%. . . . . . 1.98 2.11 2.28 2.53 3.89 5.802.50%. . . . . . 1.58 1.66 1.76 1.89 2.35 4.32
Note: “CER” is Credit Event Rate, which is the assumed constant rate of Reference Obligations becoming Credit Event ReferenceObligations each month relative to the then outstanding aggregate principal balance of Reference Obligations.

© Freddie Mac 2015
Appendix 6. Historical Home Price Appreciation
58

© Freddie Mac 2015
Historical Home Price Appreciation
59
Source: U.S. Cumulative HPA calculated using CoreLogic Aggregated HPI at each month since Jan 2000 and up to October 2014 U.S. Cumulative HPA
0%
20%
40%
60%
80%
100%
120%
0.0%1.0%2.0%3.0%4.0%5.0%6.0%7.0%
Apr May Jun Jul Aug Sep Oct Nov Dec Jan
© Freddie Mac 2015 60
Appendix 7. Key Contacts
© Freddie Mac 2015
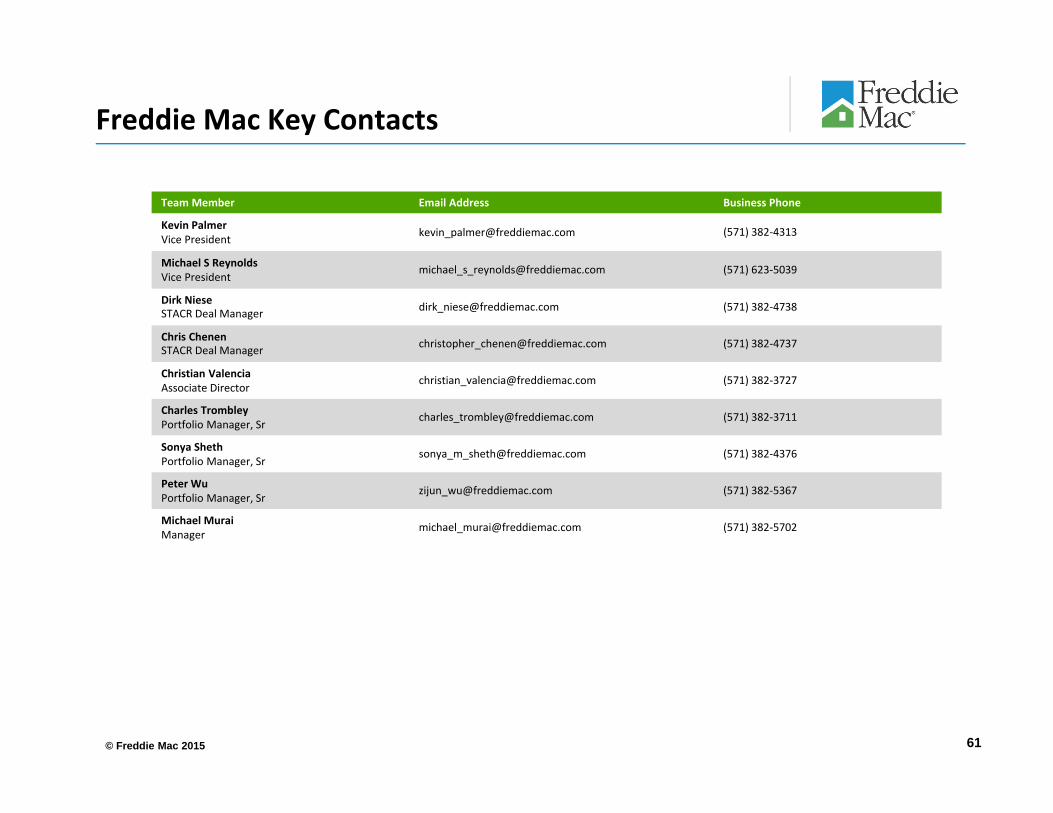
Freddie Mac Key Contacts
61
Team Member Email Address Business Phone
Kevin PalmerVice President [email protected] (571) 382‐4313
Michael S Reynolds Vice President
[email protected] (571) 623‐5039
Dirk NieseSTACR Deal Manager [email protected] (571) 382‐4738
Chris ChenenSTACR Deal Manager [email protected] (571) 382‐4737
Christian ValenciaAssociate Director
[email protected] (571) 382‐3727
Charles TrombleyPortfolio Manager, Sr
[email protected] (571) 382‐3711
Sonya ShethPortfolio Manager, Sr
[email protected] (571) 382‐4376
Peter WuPortfolio Manager, Sr
[email protected] (571) 382‐5367
Michael MuraiManager
[email protected] (571) 382‐5702

© Freddie Mac 2015
Freddie Mac & Bloomberg STACR Event PleasejoinFreddieMacandBloombergforaco‐hostedCreditRiskSharing/STACREventattheBloombergHeadquartersinNewYork,NY.
Date:May7th 2015
Time:3:30to5:30pmEastern
Address:BloombergHeadquarters731LexingtonAvenue(between58&59thStreet)NewYork,NY1002228thFloor|28WMPR
Speakers:DonLayton,CEO,FreddieMac
MichaelReynolds,VicePresidentofSTACR,FreddieMac
Panelist:KevinPalmer,HeadofCreditRiskTransfer,FreddieMac
MichaelCanter,DirectorofStructuredAssets,AllianceBernstein
MichaelDryden,GlobalHeadofRealEstateandMortgageFinance,CreditSuisse
MattMcQueen,HeadofNon‐AgencyRMBSTrading,BankofAmericaMerrillLynch
ShowCaseofBloomberg’snewCreditRiskModel:RobertSainato,HeadofMortgagePredictiveModels,Bloomberg
EarlyRegistrationLink
http://go.bloomberg.com/promo/invite/558622518‐bloomberg‐freddie‐mac‐stacr‐event/*Pleasenote:Seatsarelimitedandregistrationisrequired.
62