Structure Borne NVH Basics -...
122
NVH Workshop © www.AutoAnalytics.com, 2003 Structure Borne NVH Basics SAE 2003 NVH Conference; Traverse City, Michigan Wednesday Evening, May 7, 2003 Presenters: A. E. Duncan Automotive Analytics, Inc. G. Goetchius Material Sciences Corp. S. Gogate Altair Engineering, Inc. Sponsored By: Material Sciences Corporation
Transcript of Structure Borne NVH Basics -...
NVH Workshop© www.AutoAnalytics.com, 2003
Structure Borne NVH BasicsSAE 2003 NVH Conference; Traverse City, Michigan
Wednesday Evening, May 7, 2003
Presenters:
A. E. Duncan Automotive Analytics, Inc.
G. Goetchius Material Sciences Corp.
S. Gogate Altair Engineering, Inc.
Sponsored By:Material Sciences Corporation
NVH Workshop© www.AutoAnalytics.com, 2003
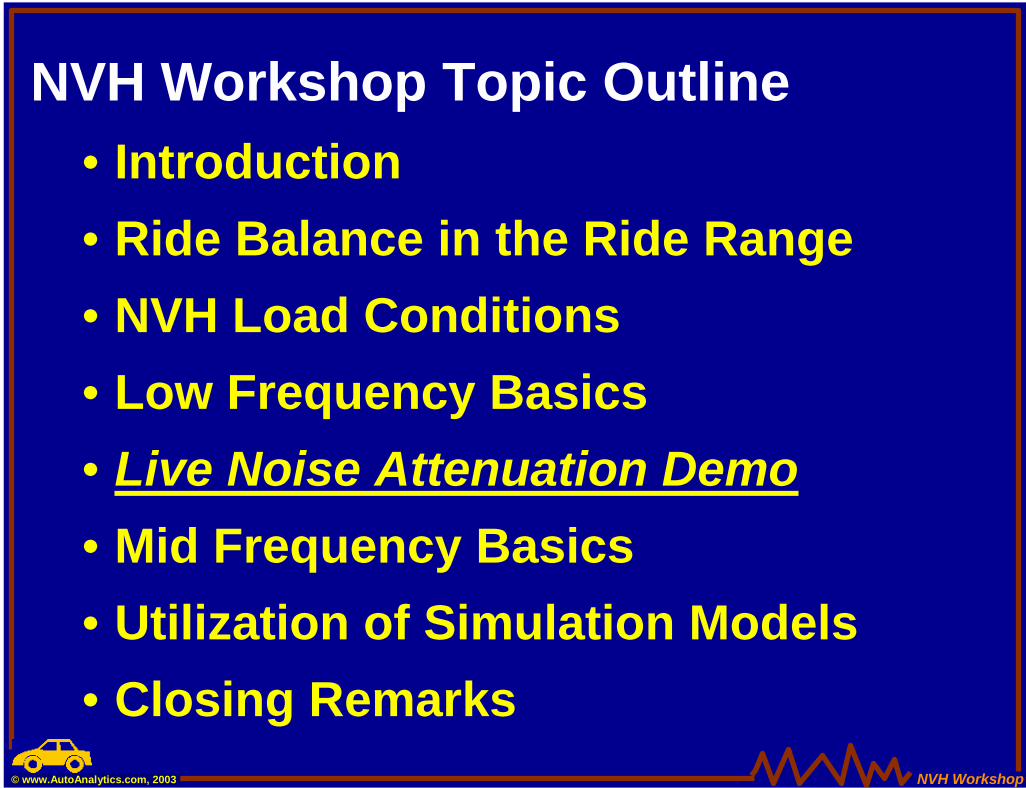
NVH Workshop Topic Outline• Introduction• Ride Balance in the Ride Range• NVH Load Conditions• Low Frequency Basics• Live Noise Attenuation Demo• Mid Frequency Basics• Utilization of Simulation Models• Closing Remarks

NVH Workshop© www.AutoAnalytics.com, 2003
The Fundamental Secret ofStructure Borne
NVH Performance
The Fundamental Secret ofStructure Borne
NVH Performance
Revealed here tonight !
NVH Workshop© www.AutoAnalytics.com, 2003
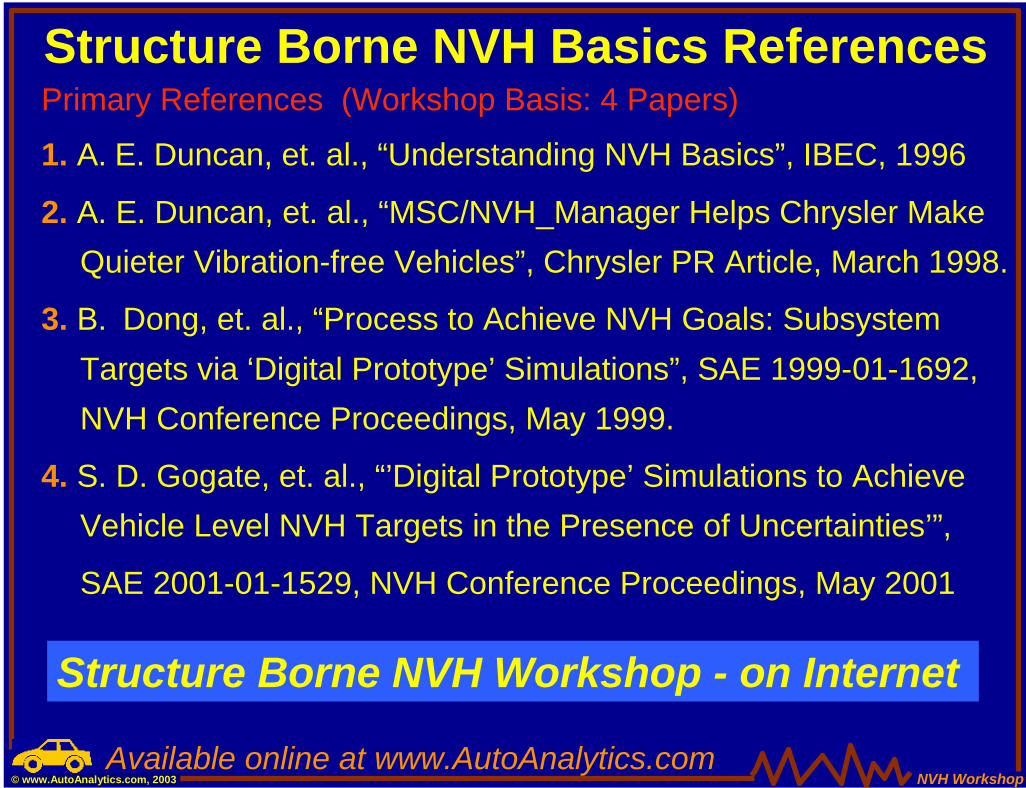
Primary References (Workshop Basis: 4 Papers)
1. A. E. Duncan, et. al., “Understanding NVH Basics”, IBEC, 1996
2. A. E. Duncan, et. al., “MSC/NVH_Manager Helps Chrysler Make Quieter Vibration-free Vehicles”, Chrysler PR Article, March 1998.
3. B. Dong, et. al., “Process to Achieve NVH Goals: Subsystem Targets via ‘Digital Prototype’ Simulations”, SAE 1999-01-1692, NVH Conference Proceedings, May 1999.
4. S. D. Gogate, et. al., “’Digital Prototype’ Simulations to Achieve Vehicle Level NVH Targets in the Presence of Uncertainties’”,
SAE 2001-01-1529, NVH Conference Proceedings, May 2001
Structure Borne NVH Basics References
Available online at www.AutoAnalytics.com
Structure Borne NVH Workshop - on Internet
NVH Workshop© www.AutoAnalytics.com, 2003
Supplemental References5. T.D. Gillespie, Fundamentals of Vehicle Dynamics, SAE 1992
(Also see SAE Video Lectures Series, same topic and author)6. D. E. Cole, Elementary Vehicle Dynamics, Dept. of Mechanical
Engineering, University of Michigan, Ann Arbor, Michigan, Sept. 1972
7. J. Y. Wong, Theory of Ground Vehicles, John Wiley & Sons, New York, 1978
8. Kompella, M. S., and Bernhard, J., “Measurement of the Statistical Variation of Structural-Acoustic Characteristics of Automotive Vehicles”, SAE No. 931272, 1993
9. Freymann, R., and Stryczek, R., “A New Optimization Approach in the Field of Structural-Acoustics”, SAE No. 2000-01-0729, 2000
Structure Borne NVH Basics References
NVH Workshop© www.AutoAnalytics.com, 2003
NVH Workshop Topic Outline• Introduction
• Ride Balance in the Ride Range
• NVH Load Conditions
• Low Frequency Basics

NVH Workshop© www.AutoAnalytics.com, 2003
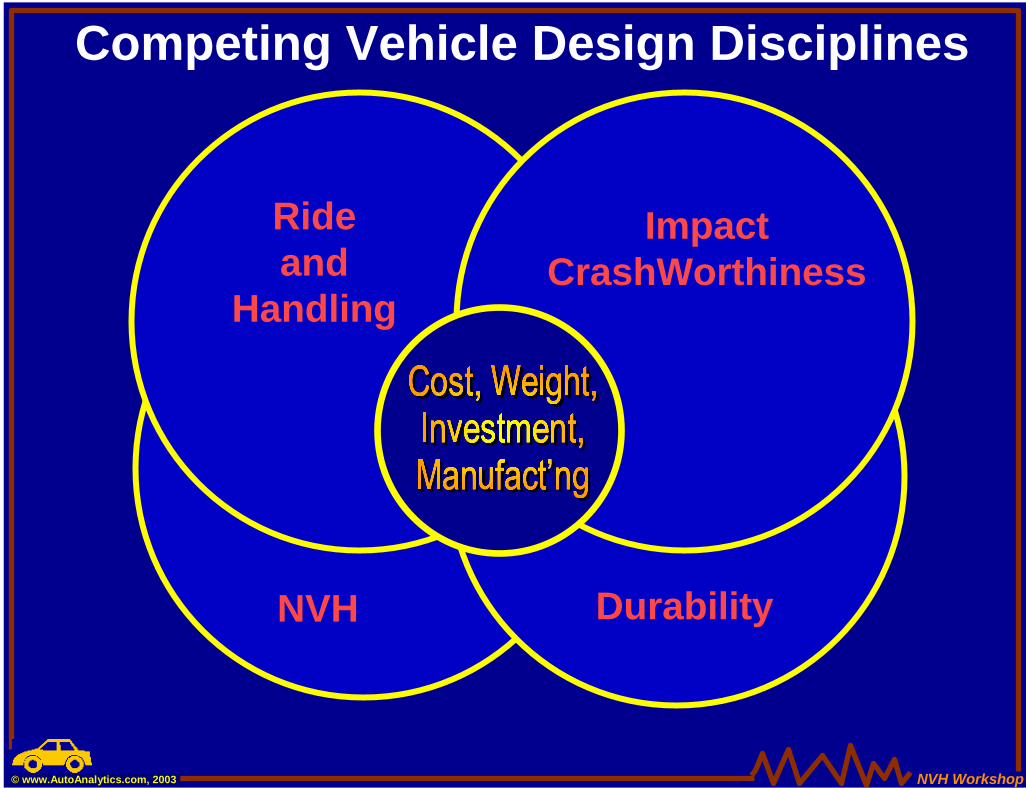
Rideand
Handling
NVH Durability
ImpactCrashWorthiness
Competing Vehicle Design Disciplines
NVH Workshop© www.AutoAnalytics.com, 2003
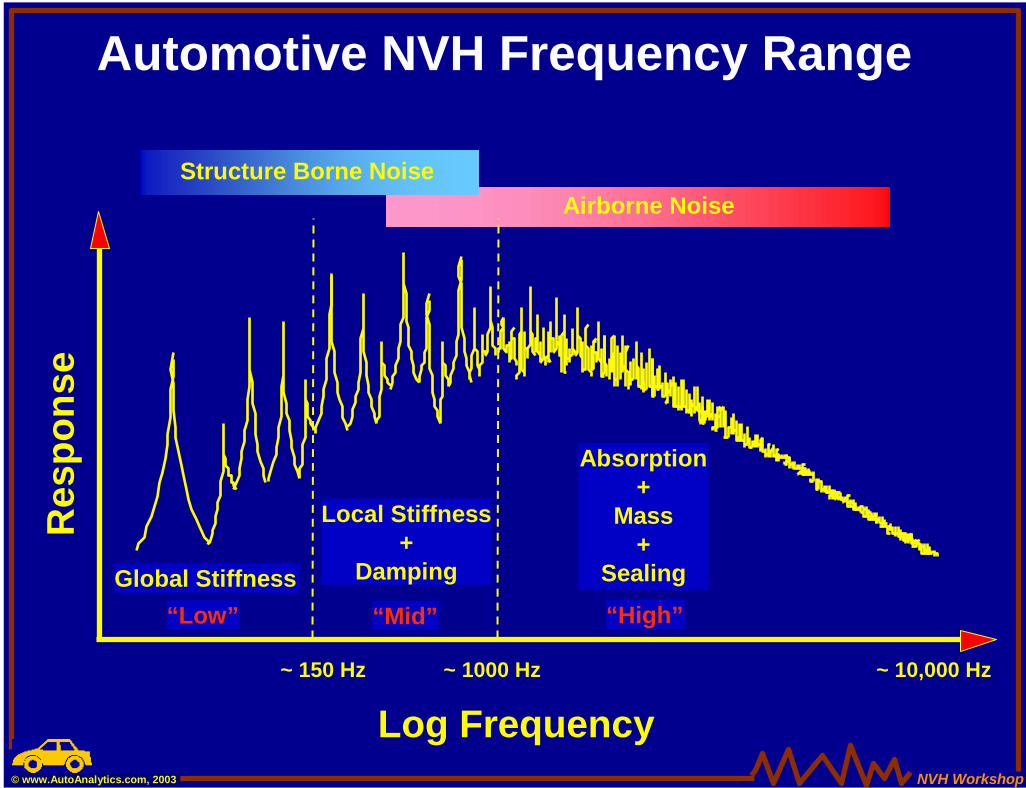
Structure Borne NoiseAirborne Noise
Res
pons
e
Log Frequency
“Low”Global Stiffness
“Mid”
Local Stiffness+
Damping
“High”
Absorption+
Mass+
Sealing
~ 150 Hz ~ 1000 Hz ~ 10,000 Hz
Automotive NVH Frequency Range
NVH Workshop© www.AutoAnalytics.com, 2003
NVH Workshop Topic Outline• Introduction
• Ride Balance in the Ride Range
• NVH Load Conditions
• Low Frequency Basics
NVH Workshop© www.AutoAnalytics.com, 2003
Study of Ride Balance
• Demonstrate the First Order Vehicle Modes
• Demonstrate Transient Response in Time Domain
• Derive Transition into the Frequency Domain
NVH Workshop© www.AutoAnalytics.com, 2003
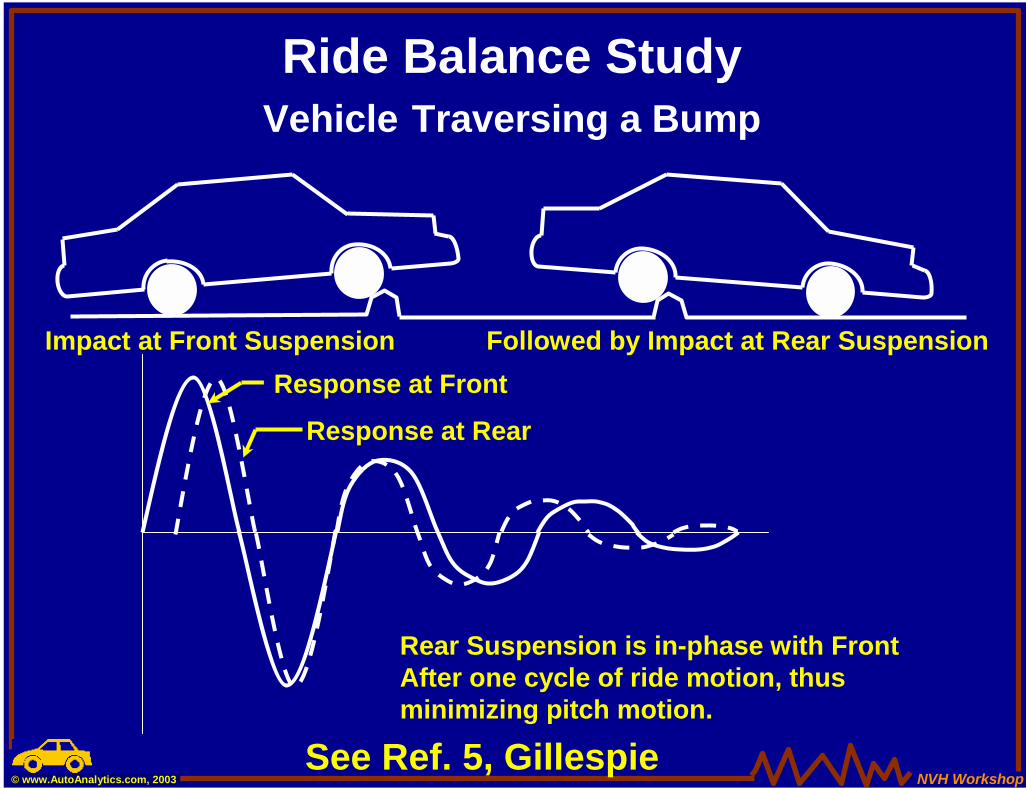
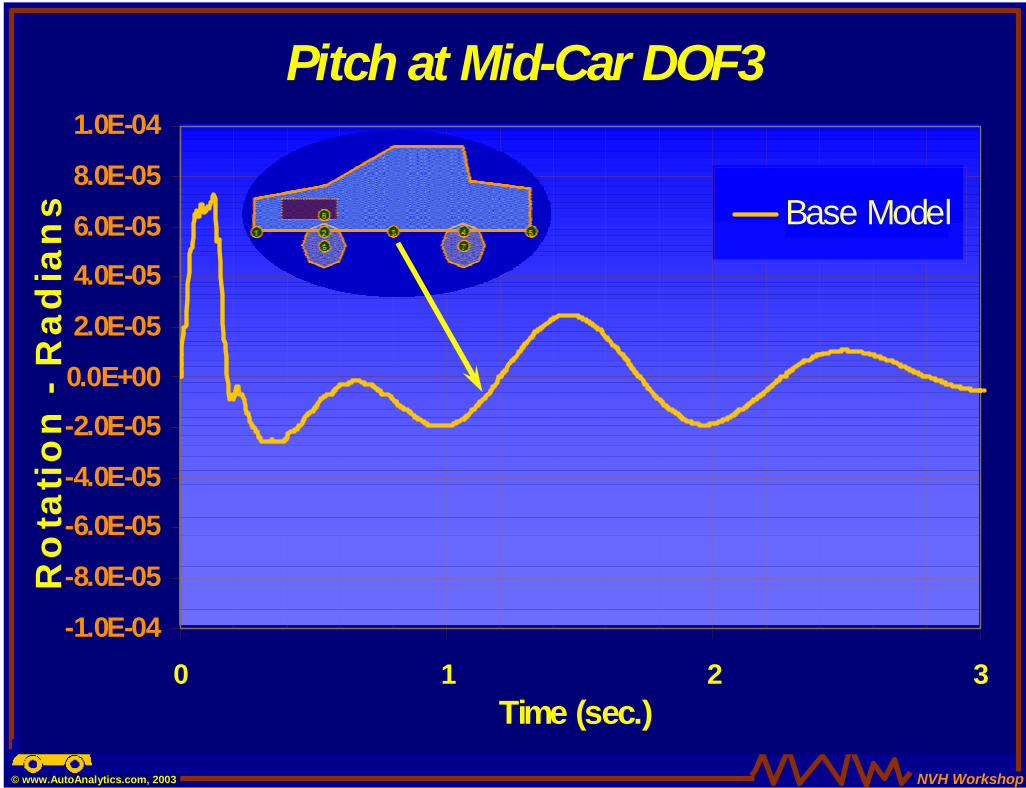
Ride Balance StudyVehicle Traversing a Bump
Impact at Front Suspension Followed by Impact at Rear Suspension
Response at Rear
Rear Suspension is in-phase with FrontAfter one cycle of ride motion, thusminimizing pitch motion.
Response at Front
See Ref. 5, Gillespie
NVH Workshop© www.AutoAnalytics.com, 2003
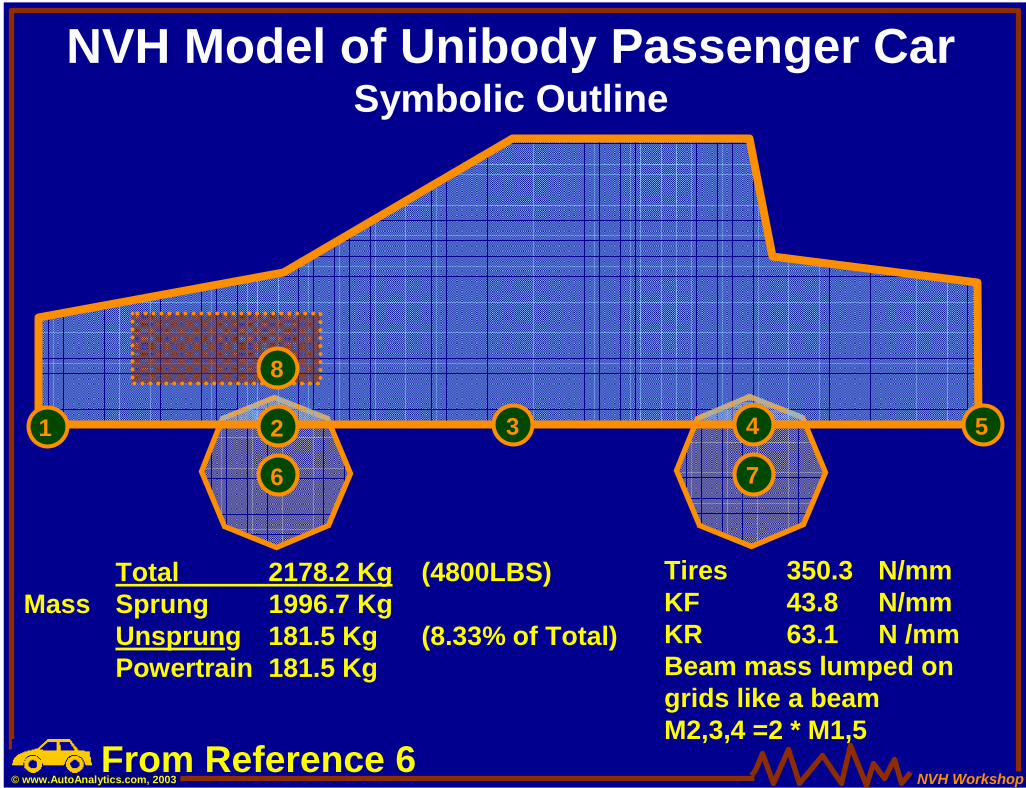
Total 2178.2 Kg (4800LBS)Mass Sprung 1996.7 Kg
Unsprung 181.5 Kg (8.33% of Total)Powertrain 181.5 Kg
Tires 350.3 N/mmKF 43.8 N/mmKR 63.1 N /mmBeam mass lumped on grids like a beam M2,3,4 =2 * M1,5
31
8
2
6
4
7
5
NVH Model of Unibody Passenger CarSymbolic Outline
From Reference 6
NVH Workshop© www.AutoAnalytics.com, 2003
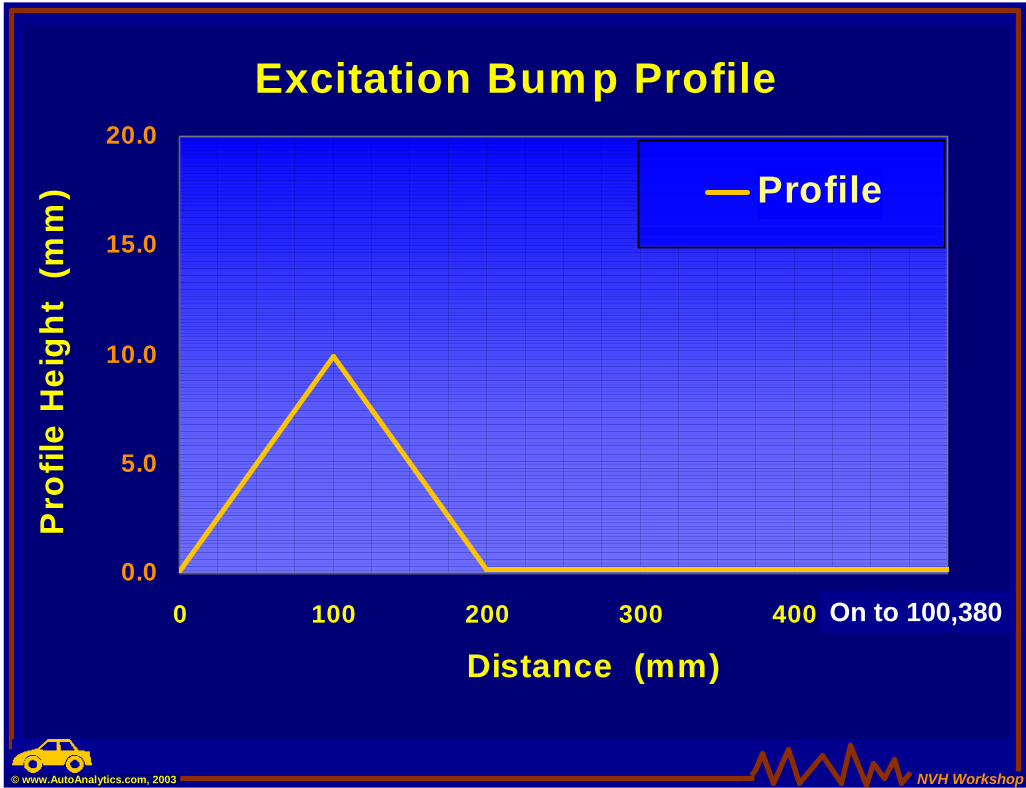
Excitation Bump Profile
0.0
5.0
10.0
15.0
20.0
0 100 200 300 400 500
Distance (mm)
Pro
file
Hei
ght
(mm
) Profile
On to 100,380
NVH Workshop© www.AutoAnalytics.com, 2003
Pitch at Mid-Car DOF3
-1.0E-04
-8.0E-05
-6.0E-05
-4.0E-05
-2.0E-05
0.0E+00
2.0E-05
4.0E-05
6.0E-05
8.0E-05
1.0E-04
0 1 2 3Time (sec.)
Ro
tati
on
- R
adia
ns Base Model
NVH Workshop© www.AutoAnalytics.com, 2003
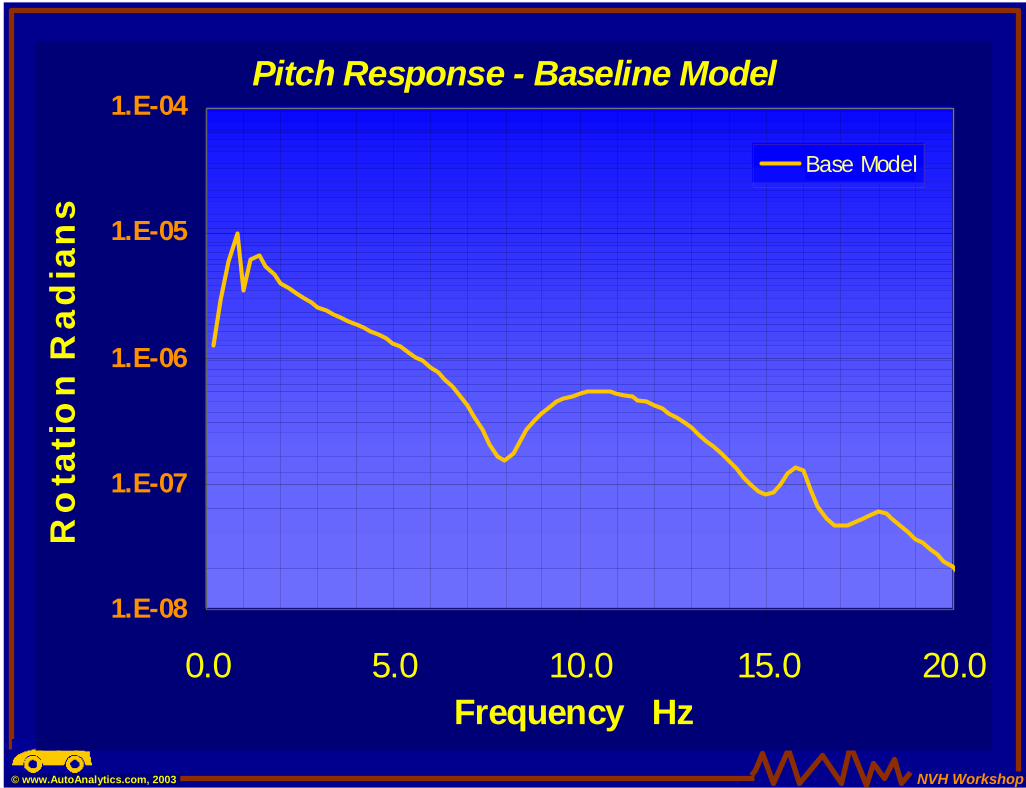
Pitch Response - Baseline Model
1.E-08
1.E-07
1.E-06
1.E-05
1.E-04
0.0 5.0 10.0 15.0 20.0Frequency Hz
Ro
tati
on
Rad
ian
s
Base Model
NVH Workshop© www.AutoAnalytics.com, 2003
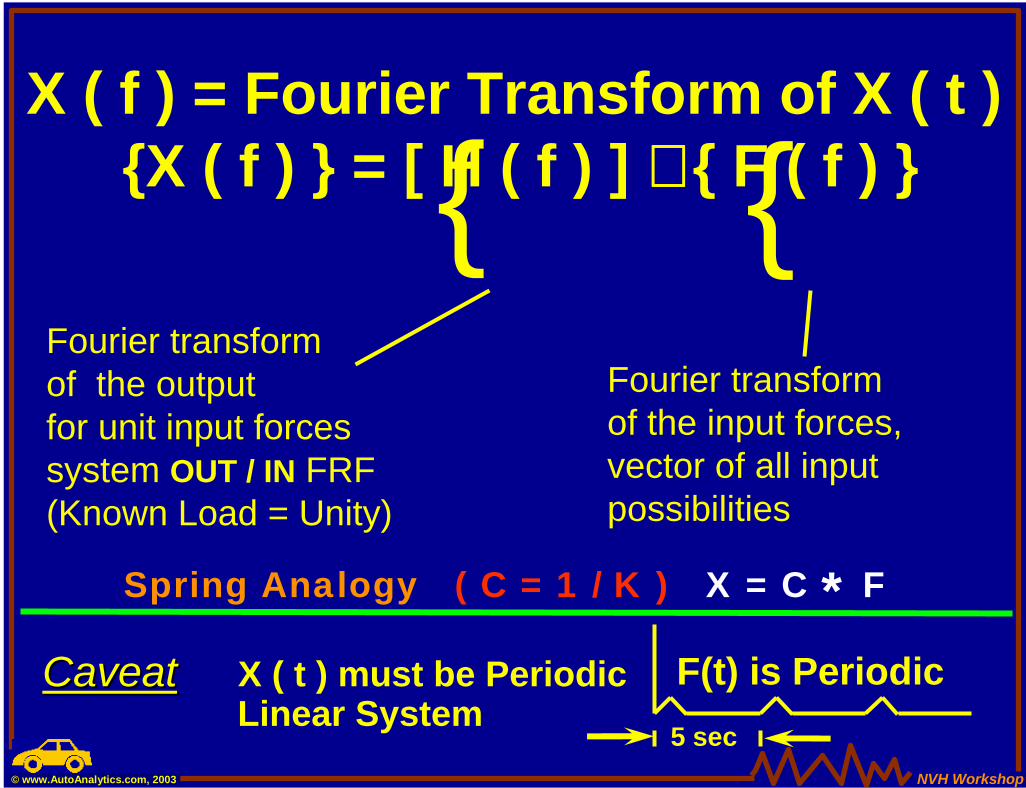
X ( f ) = Fourier Transform of X ( t ){X ( f ) } = [ H ( f ) ] ∗∗∗∗ { F ( f ) }{
Fourier transformof the input forces,vector of all inputpossibilities
Fourier transformof the outputfor unit input forcessystem OUT / IN FRF(Known Load = Unity)
Spring Analogy ( C = 1 / K ) X = C * F
{
CaveatCaveat X ( t ) must be PeriodicLinear System
5 sec
F(t) is Periodic
NVH Workshop© www.AutoAnalytics.com, 2003
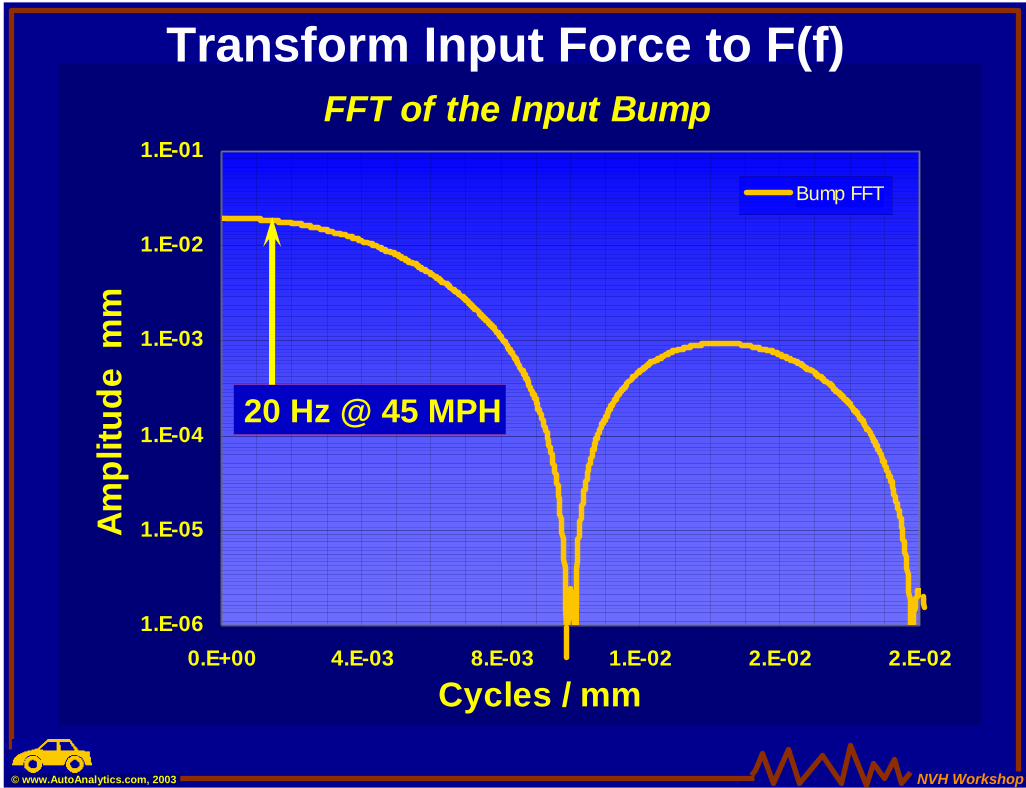
FFT of the Input Bump
1.E-06
1.E-05
1.E-04
1.E-03
1.E-02
1.E-01
0.E+00 4.E-03 8.E-03 1.E-02 2.E-02 2.E-02
Cycles / mm
Ampl
itude
mm
Bump FFT
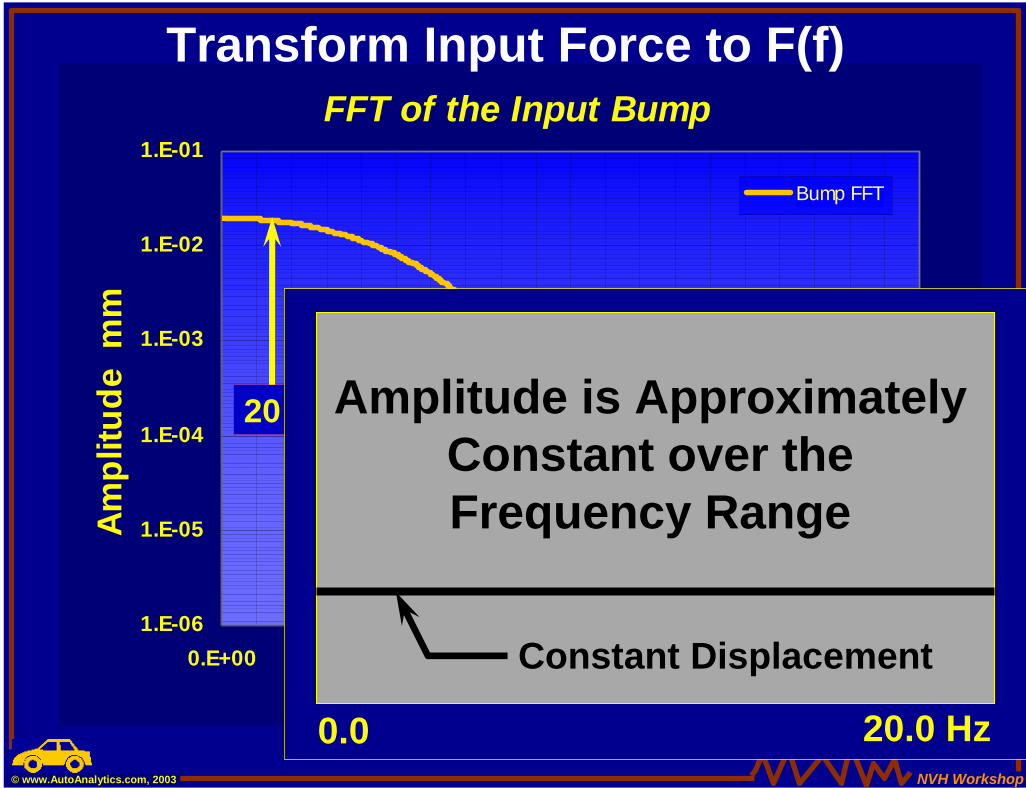
Transform Input Force to F(f)
20 Hz @ 45 MPH
NVH Workshop© www.AutoAnalytics.com, 2003
FFT of the Input Bump
1.E-06
1.E-05
1.E-04
1.E-03
1.E-02
1.E-01
0.E+00 4.E-03 8.E-03 1.E-02 2.E-02 2.E-02
Cycles / mm
Ampl
itude
mm
Bump FFT
Transform Input Force to F(f)
20 Hz @ 45 MPH
0.0 20.0 Hz
Amplitude is Approximately Constant over the Frequency Range
Constant Displacement
NVH Workshop© www.AutoAnalytics.com, 2003
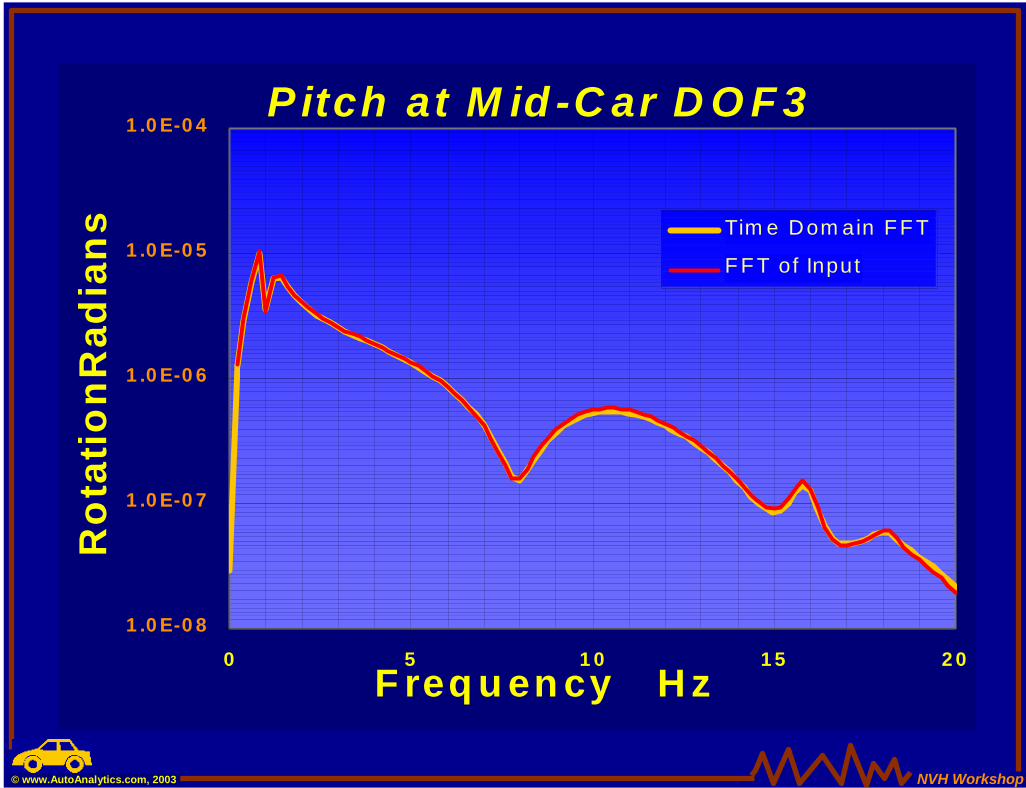
Pitch at M id -C ar D O F 3
1 .0 E-0 8
1 .0 E-0 7
1 .0 E-0 6
1 .0 E-0 5
1 .0 E-0 4
0 5 1 0 1 5 2 0F req u en cy H z
Ro
tati
on
Rad
ian
s Tim e Dom ain FF T
F F T of Input
NVH Workshop© www.AutoAnalytics.com, 2003
Ride Balance Study Summary
• Demonstrated the Fundamental Bounce and Pitch Modes in the Ride Range
• Demonstrated Transient Response in Time Domain then Obtained the FRF
• Derived Direct Computation of FRF in the Frequency Domain
NVH Workshop© www.AutoAnalytics.com, 2003
NVH Workshop Topic Outline• Introduction
• Ride Balance in the Ride Range
• NVH Load Conditions
• Low Frequency Basics
NVH Workshop© www.AutoAnalytics.com, 2003
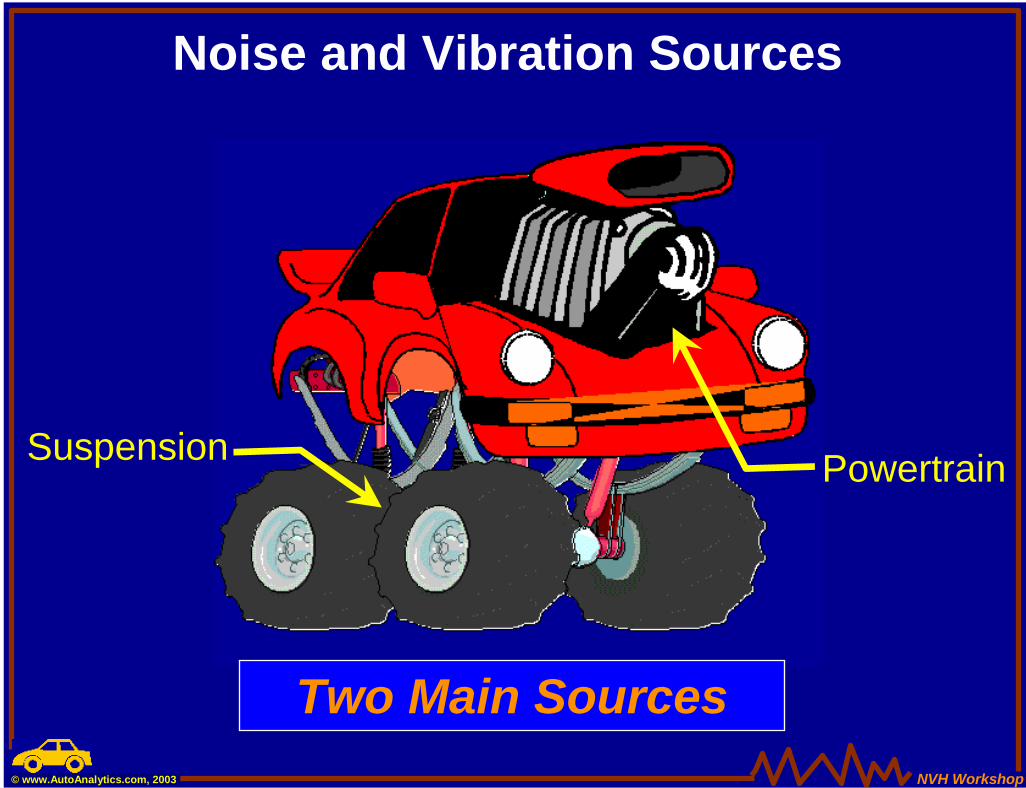
Two Main Sources
Noise and Vibration Sources
Suspension Powertrain
NVH Workshop© www.AutoAnalytics.com, 2003
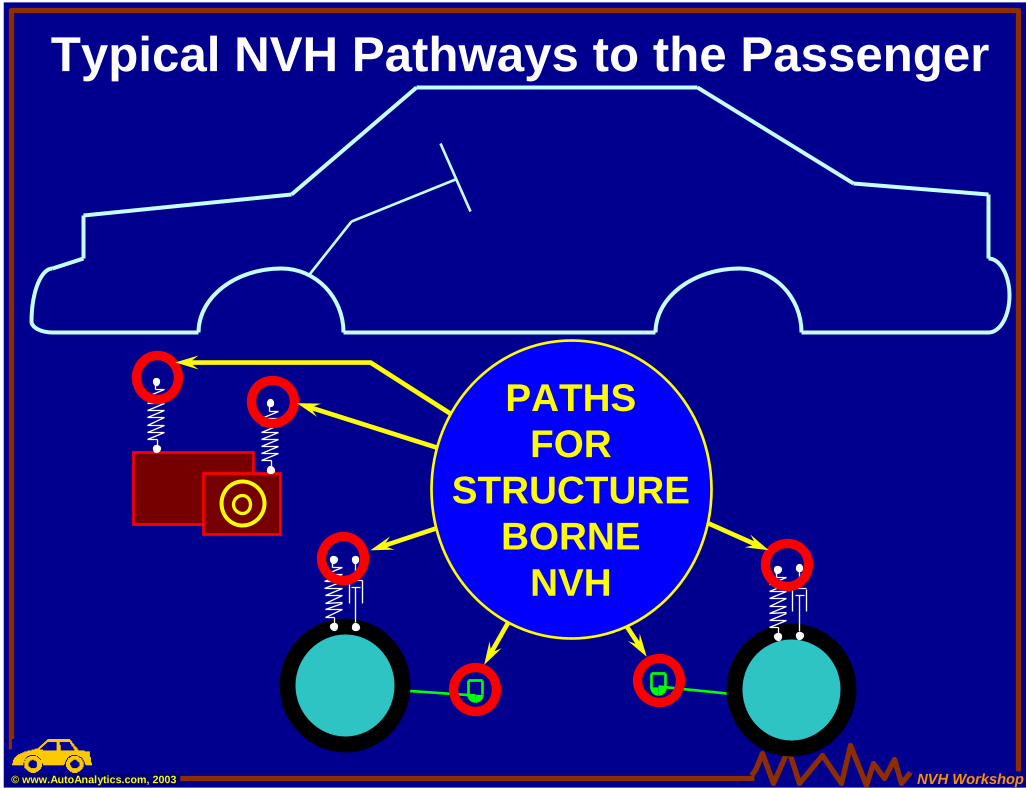
Typical NVH Pathways to the Passenger
PATHS FOR
STRUCTURE BORNE
NVH
NVH Workshop© www.AutoAnalytics.com, 2003
NVH Workshop© www.AutoAnalytics.com, 2003
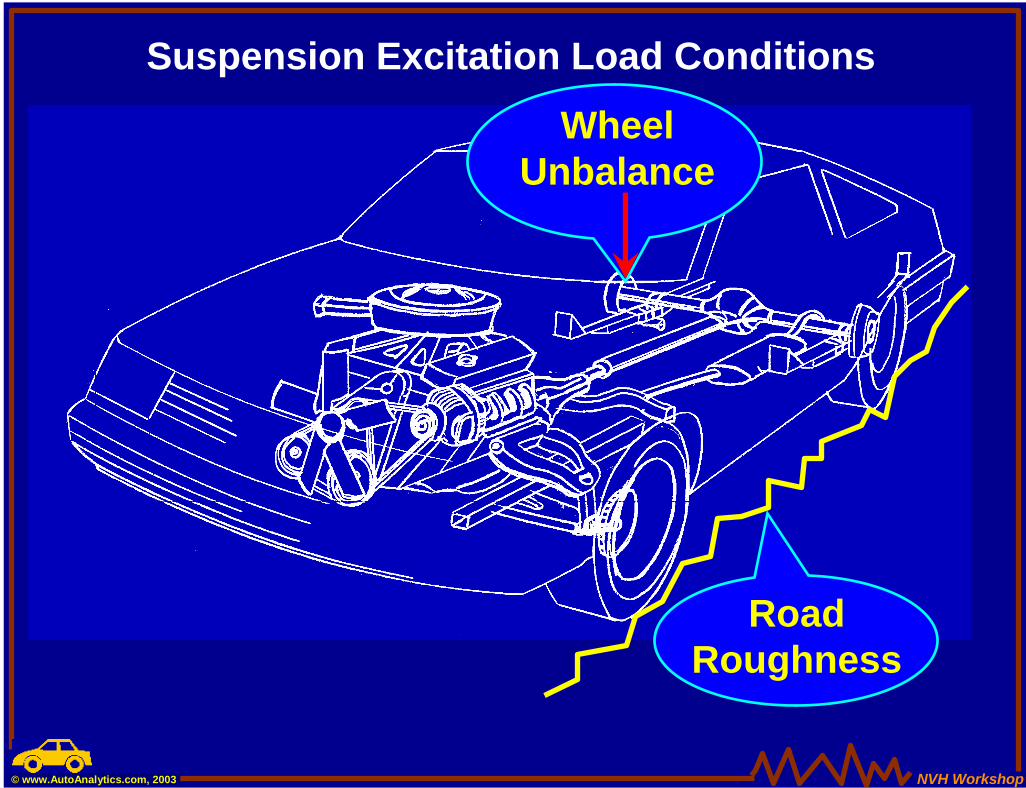
Suspension Excitation Load Conditions
WheelUnbalance
RoadRoughness
NVH Workshop© www.AutoAnalytics.com, 2003
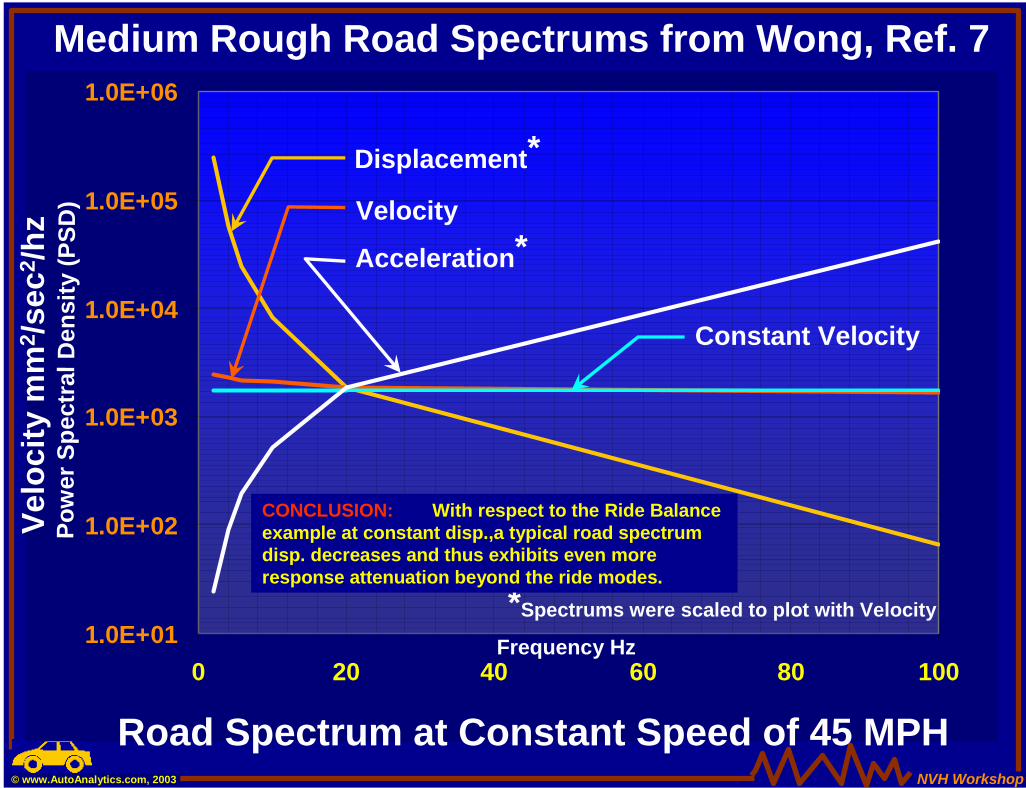
Medium Rough Road Spectrums from Wong, Ref. 7
1.0E+01
1.0E+02
1.0E+03
1.0E+04
1.0E+05
1.0E+06
0 20 40 60 80 100
Displacement*
Acceleration*Velocity
Constant Velocity
Road Spectrum at Constant Speed of 45 MPH
Frequency Hz
Velo
city
mm
2 /sec
2 /hz
P ow
er S
p ect
ral D
e ns i
ty (P
SD)
*Spectrums were scaled to plot with Velocity
CONCLUSION: With respect to the Ride Balance example at constant disp.,a typical road spectrum disp. decreases and thus exhibits even more response attenuation beyond the ride modes.
NVH Workshop© www.AutoAnalytics.com, 2003
NVH Workshop Topic Outline• Introduction
• Ride Balance in the Ride Range
• NVH Load Conditions
• Low Frequency Basics
NVH Workshop© www.AutoAnalytics.com, 2003
Low Frequency NVH Basics
• Subjective to Objective Relationships
• Single Degree of Freedom Vibration
• Vibration and Noise Attenuation Strategies
NVH Workshop© www.AutoAnalytics.com, 2003
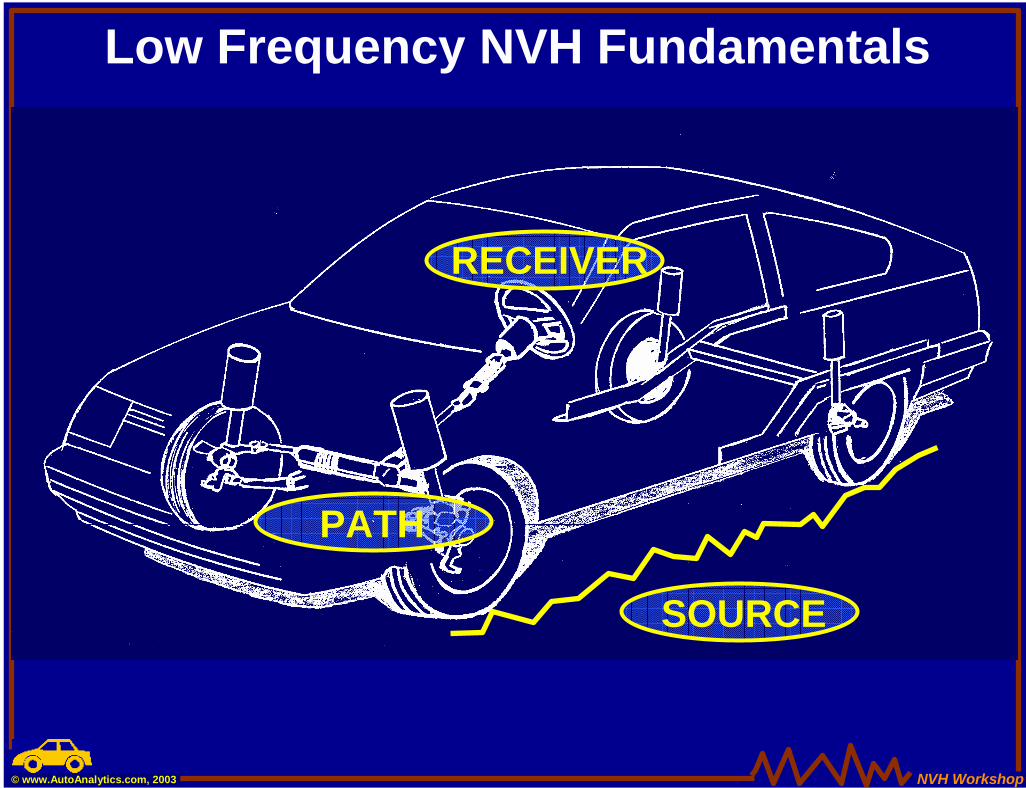
RECEIVER
PATH
SOURCE
Low Frequency NVH Fundamentals
NVH Workshop© www.AutoAnalytics.com, 2003
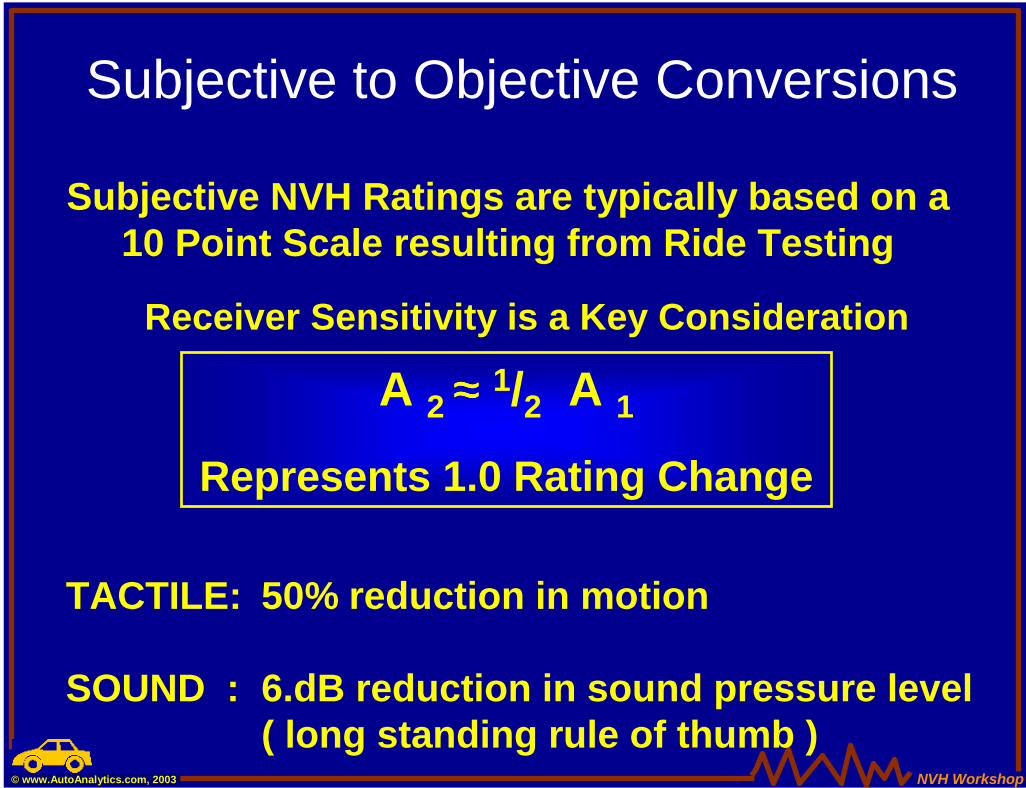
Subjective to Objective Conversions
Subjective NVH Ratings are typically based on a 10 Point Scale resulting from Ride Testing
A 2 ≈≈≈≈ 1/2 A 1Represents 1.0 Rating Change
TACTILE: 50% reduction in motion
SOUND : 6.dB reduction in sound pressure level ( long standing rule of thumb )
Receiver Sensitivity is a Key Consideration
NVH Workshop© www.AutoAnalytics.com, 2003
m
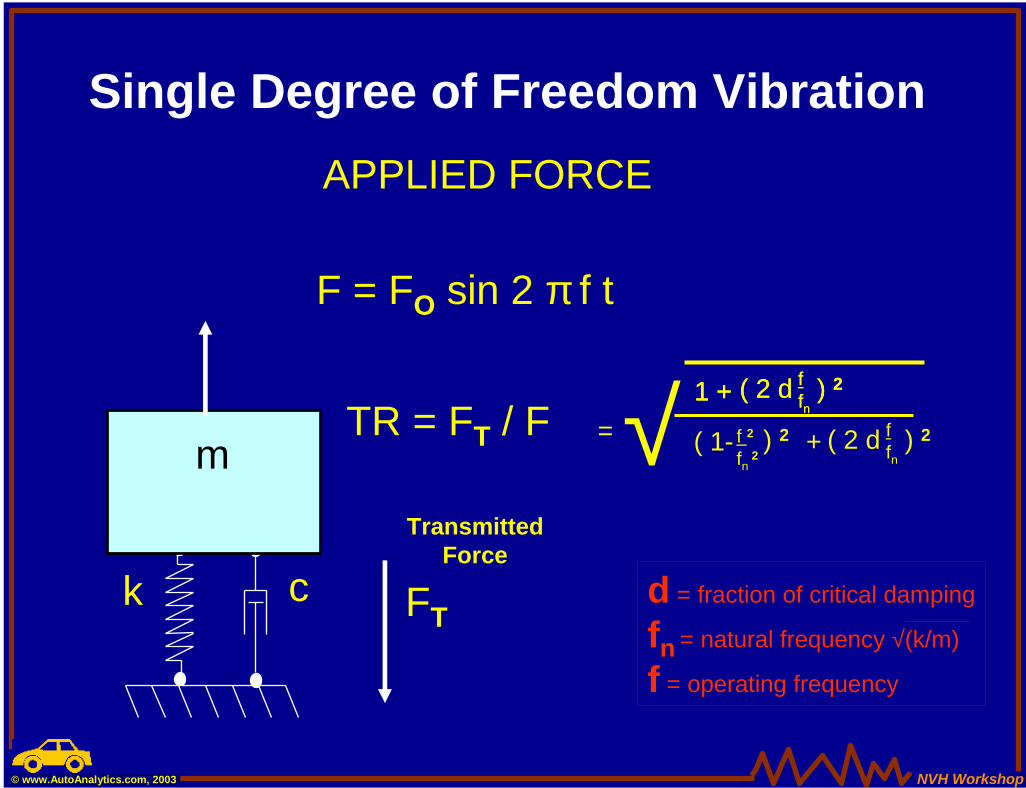
APPLIED FORCE
F = FO sin 2 π f t
k c FT
TR = FT / F
TransmittedForce
Single Degree of Freedom Vibration
=√ f 2fn
2) 2
ffn
( 2 d ) 21 +1 + ffn
( 2 d ) 21 +
( 1- ffn
( 2 d ) 2+
d = fraction of critical damping
fn = natural frequency √(k/m)
f = operating frequency
NVH Workshop© www.AutoAnalytics.com, 2003
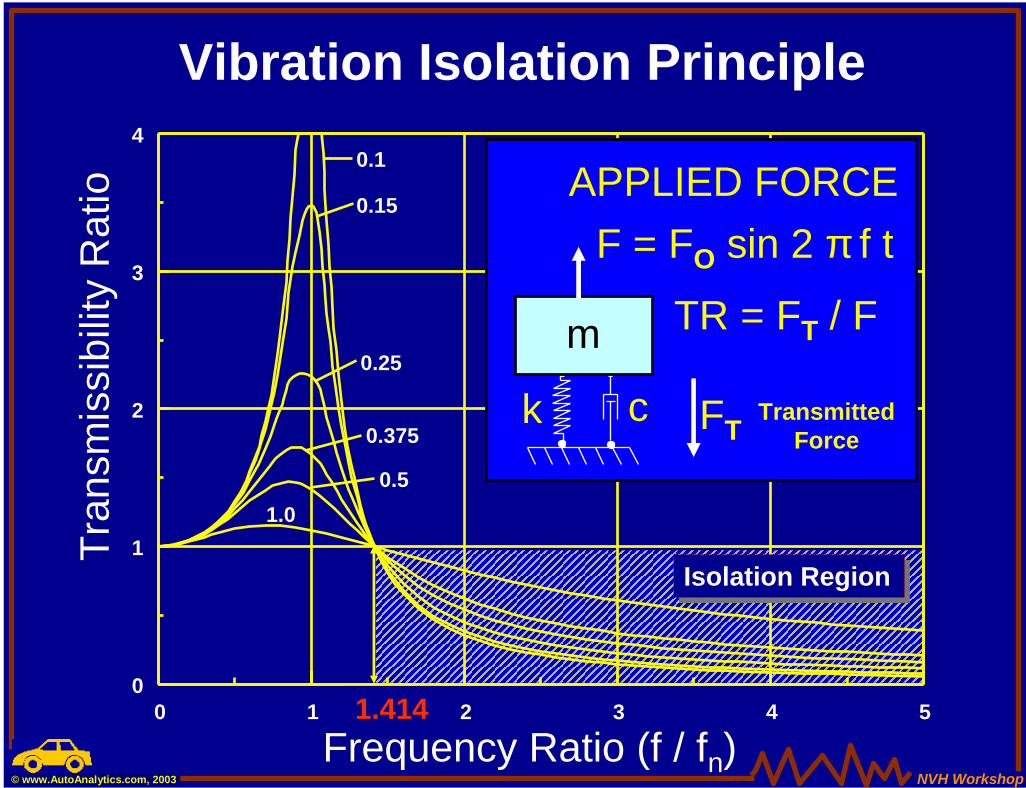
0 1 2 3 4 50
1
2
3
4Tr
ansm
issi
bilit
y R
atio
1.414
0.5
0.1
0.15
0.375
1.0
0.25
Frequency Ratio (f / fn)
Vibration Isolation Principle
m
APPLIED FORCEF = FO sin 2 π f t
k c FT
TR = FT / F
TransmittedForce
Isolation RegionIsolation Region
NVH Workshop© www.AutoAnalytics.com, 2003
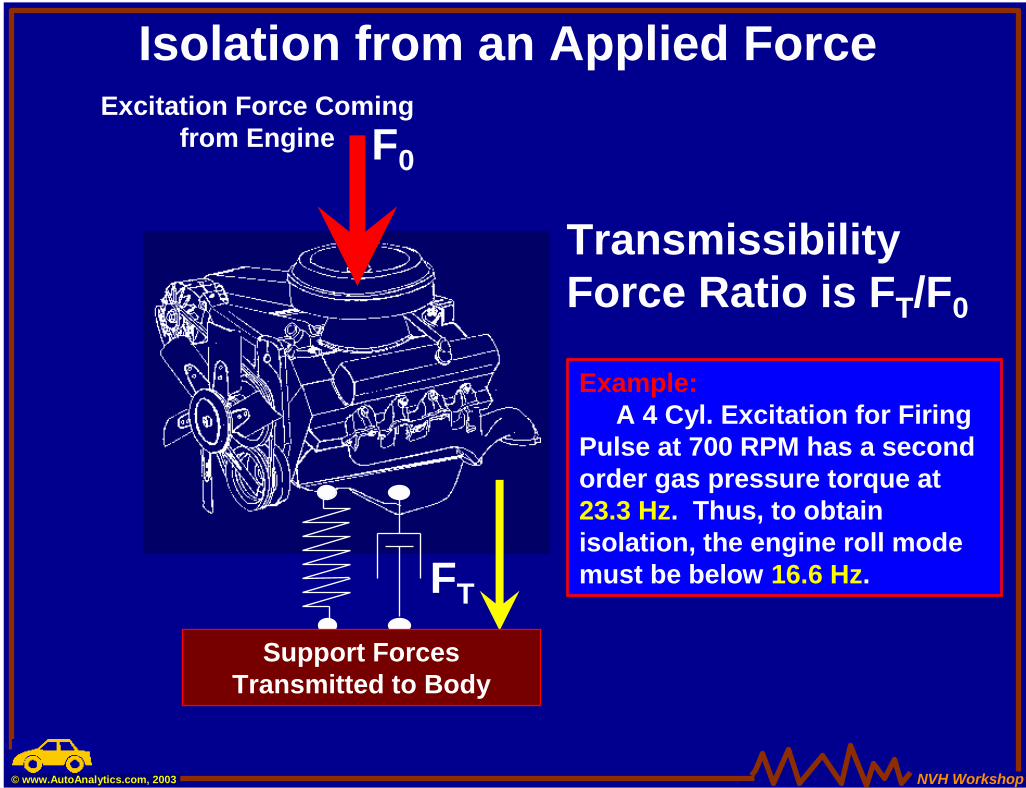
Excitation Force Comingfrom Engine F0
FT
Transmissibility Force Ratio is FT/F0
Isolation from an Applied Force
Support Forces Transmitted to Body
Example:A 4 Cyl. Excitation for Firing
Pulse at 700 RPM has a second order gas pressure torque at 23.3 Hz. Thus, to obtain isolation, the engine roll mode must be below 16.6 Hz.
NVH Workshop© www.AutoAnalytics.com, 2003
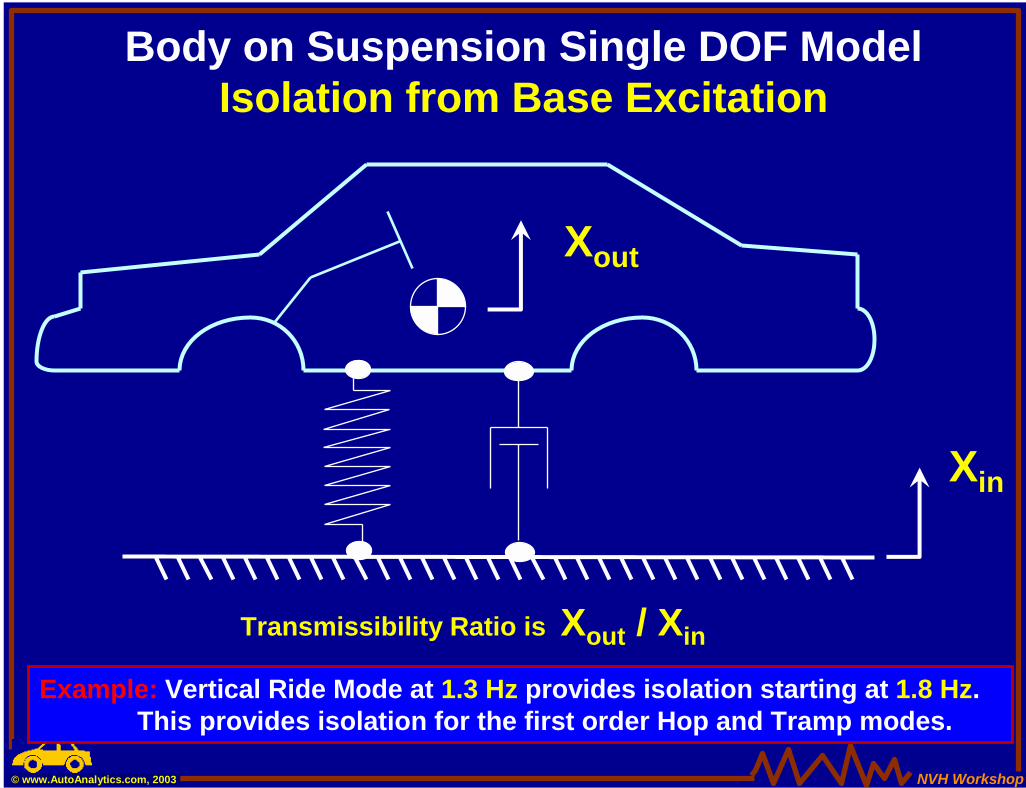
Body on Suspension Single DOF ModelIsolation from Base Excitation
Xin
Xout
Transmissibility Ratio is Xout / Xin
Example: Vertical Ride Mode at 1.3 Hz provides isolation starting at 1.8 Hz. This provides isolation for the first order Hop and Tramp modes.
NVH Workshop© www.AutoAnalytics.com, 2003
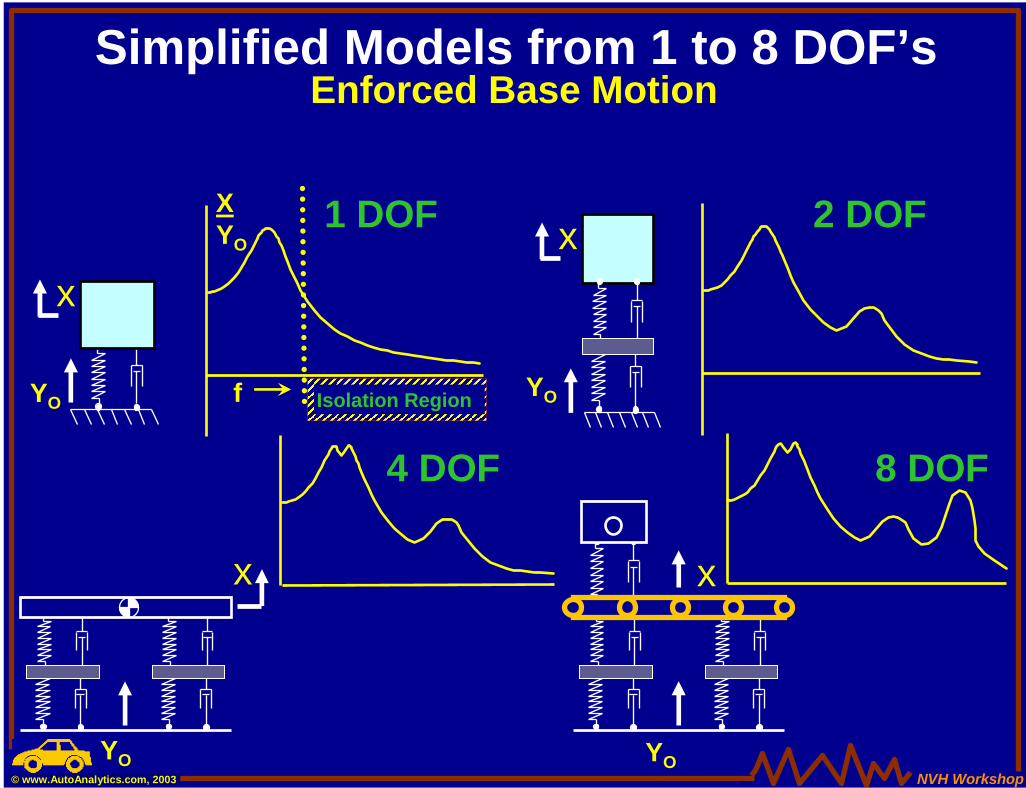
Simplified Models from 1 to 8 DOF’s
1 DOF 2 DOF
fYO
x
YO
x
4 DOF 8 DOF
YO
x
Enforced Base Motion
YO
x
XYO
Isolation Region
NVH Workshop© www.AutoAnalytics.com, 2003
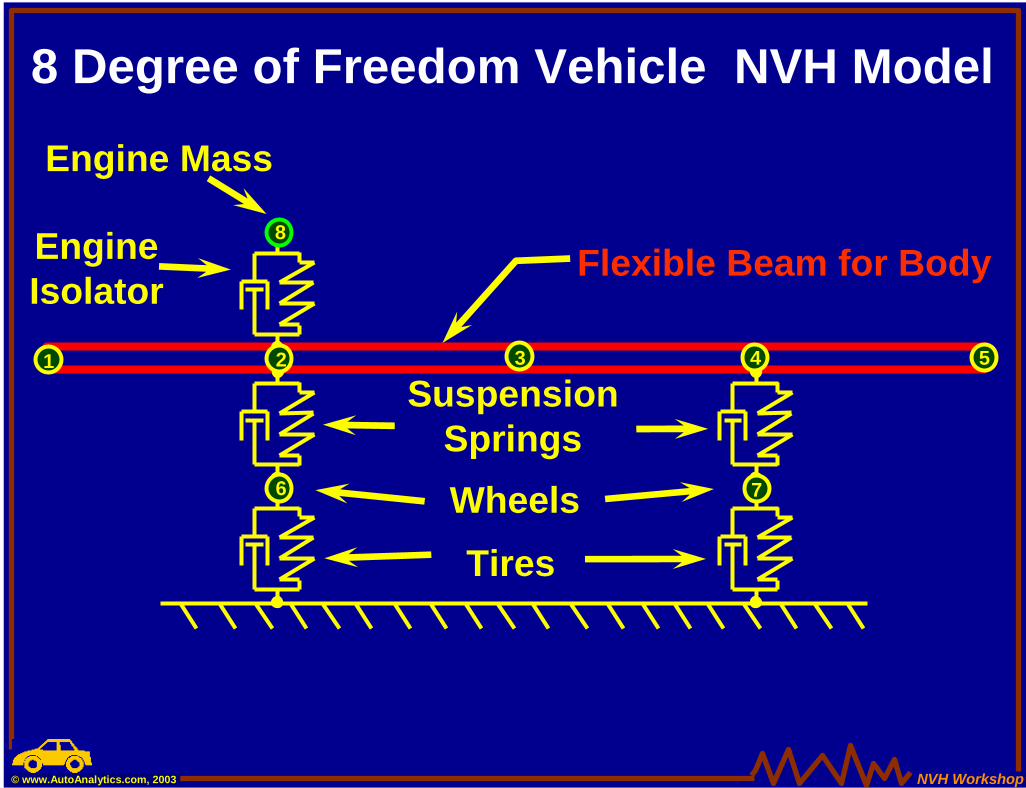
8 Degree of Freedom Vehicle NVH Model
1 2 4 5
6 7
8
3
TiresWheels
SuspensionSprings
Engine Mass
EngineIsolator
Flexible Beam for Body
NVH Workshop© www.AutoAnalytics.com, 2003
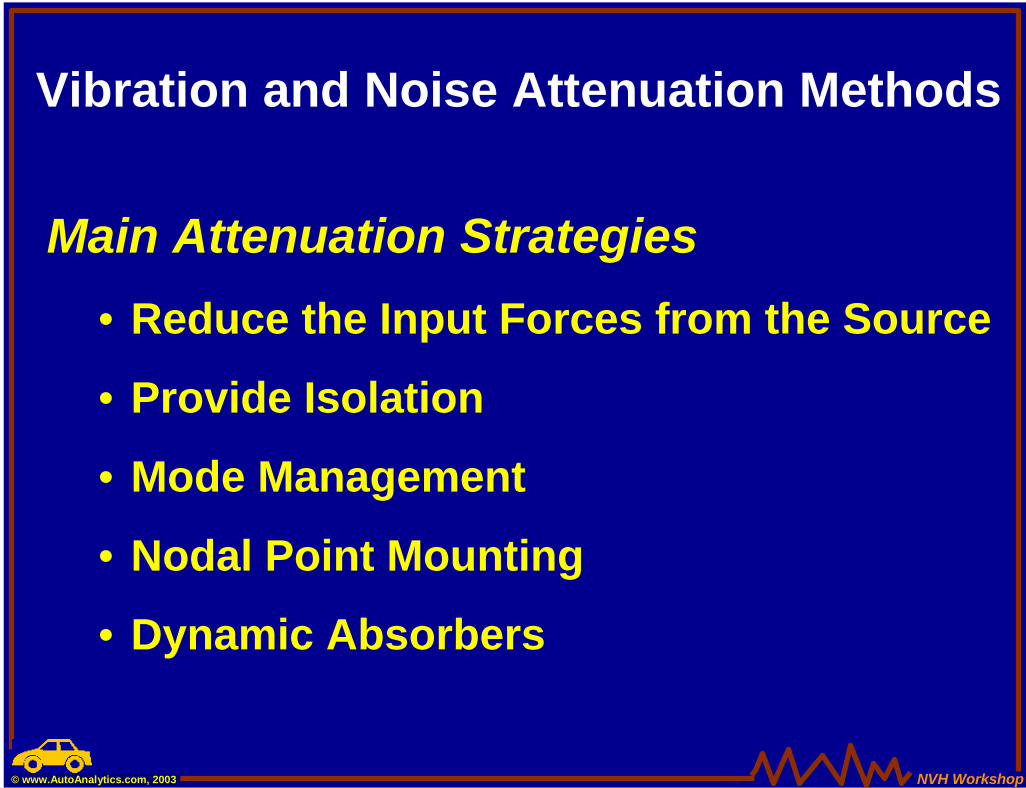
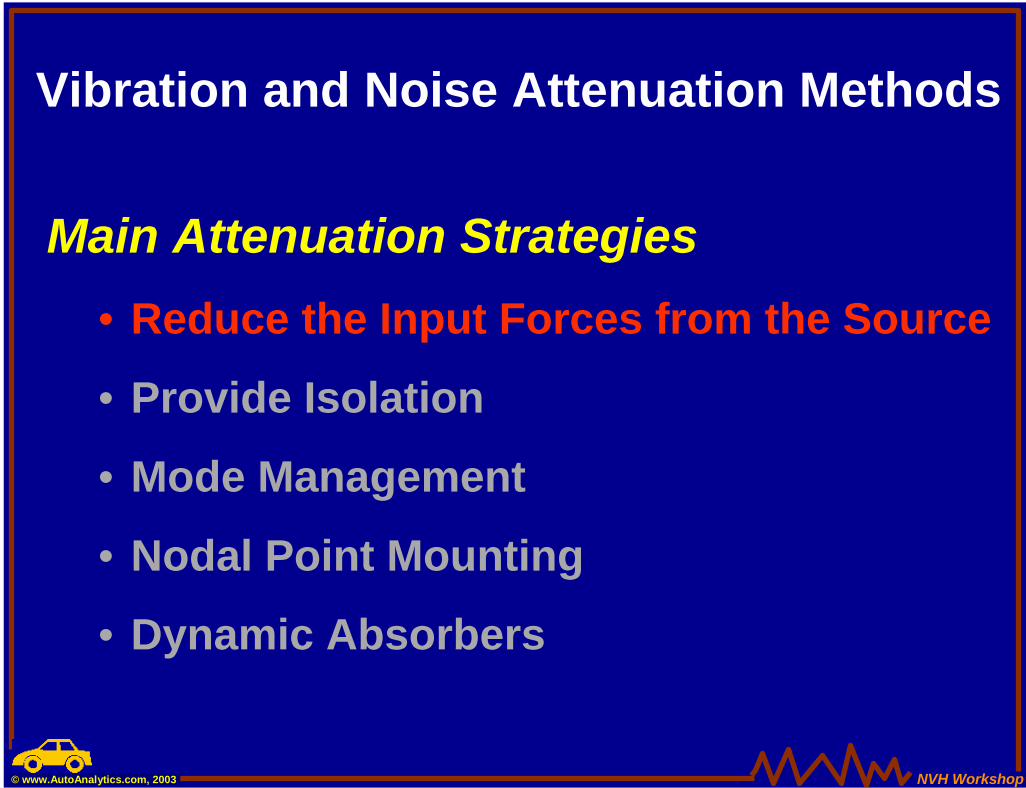
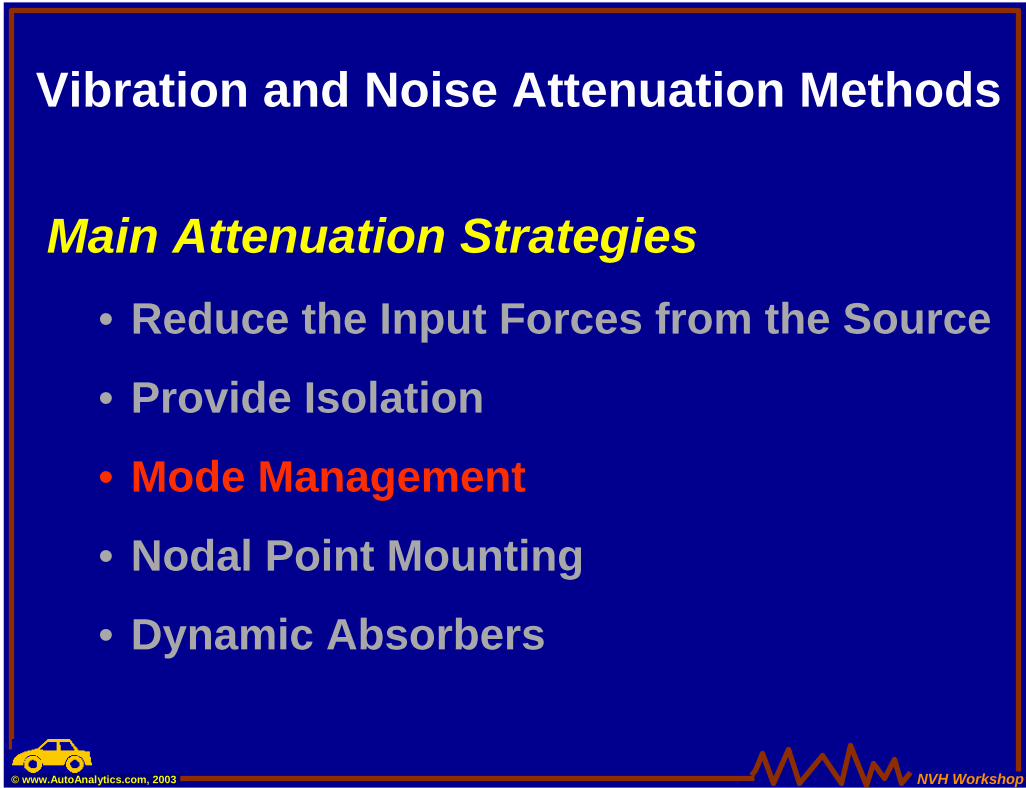
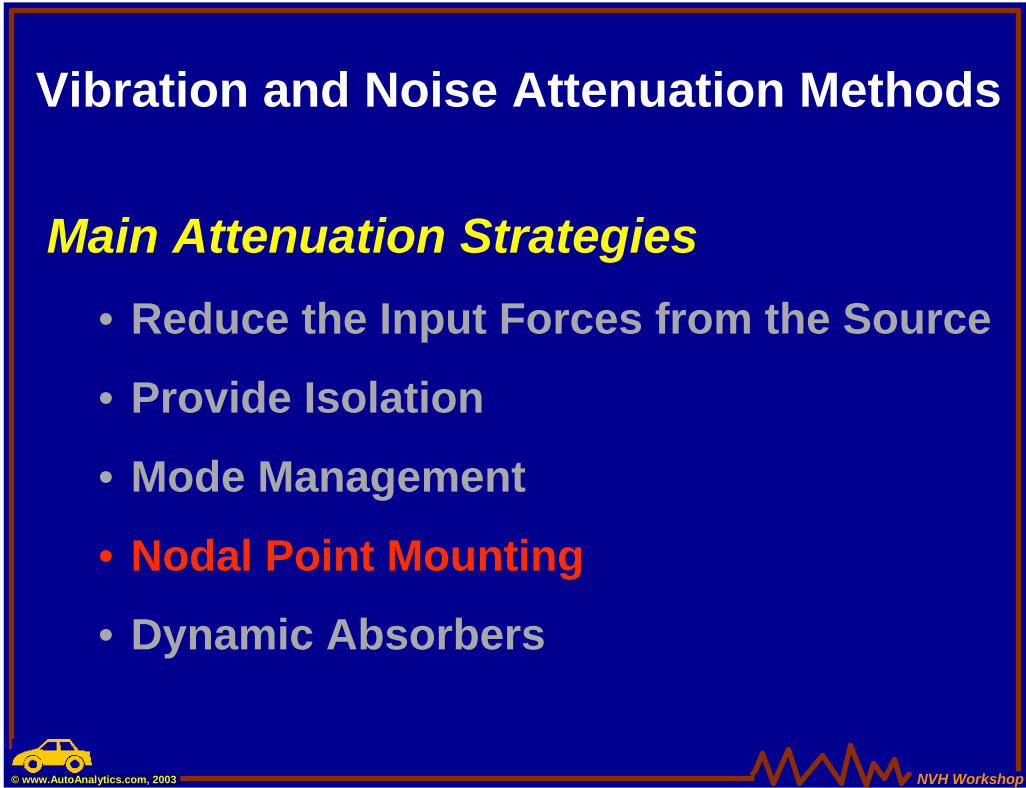
Vibration and Noise Attenuation Methods
Main Attenuation Strategies• Reduce the Input Forces from the Source
• Provide Isolation
• Mode Management
• Nodal Point Mounting
• Dynamic Absorbers
NVH Workshop© www.AutoAnalytics.com, 2003
Vibration and Noise Attenuation Methods
Main Attenuation Strategies• Reduce the Input Forces from the Source
• Provide Isolation
• Mode Management
• Nodal Point Mounting
• Dynamic Absorbers
NVH Workshop© www.AutoAnalytics.com, 2003
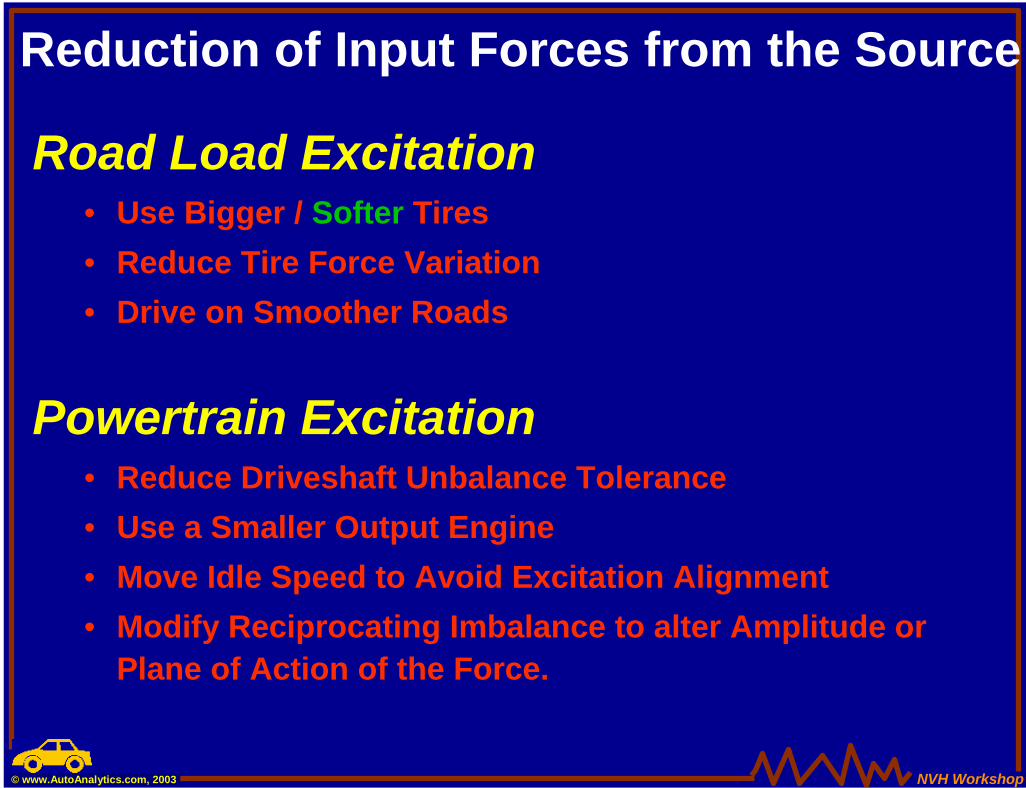
Reduction of Input Forces from the Source
Road Load Excitation• Use Bigger / Softer Tires• Reduce Tire Force Variation• Drive on Smoother Roads
Powertrain Excitation• Reduce Driveshaft Unbalance Tolerance• Use a Smaller Output Engine• Move Idle Speed to Avoid Excitation Alignment• Modify Reciprocating Imbalance to alter Amplitude or
Plane of Action of the Force.
NVH Workshop© www.AutoAnalytics.com, 2003
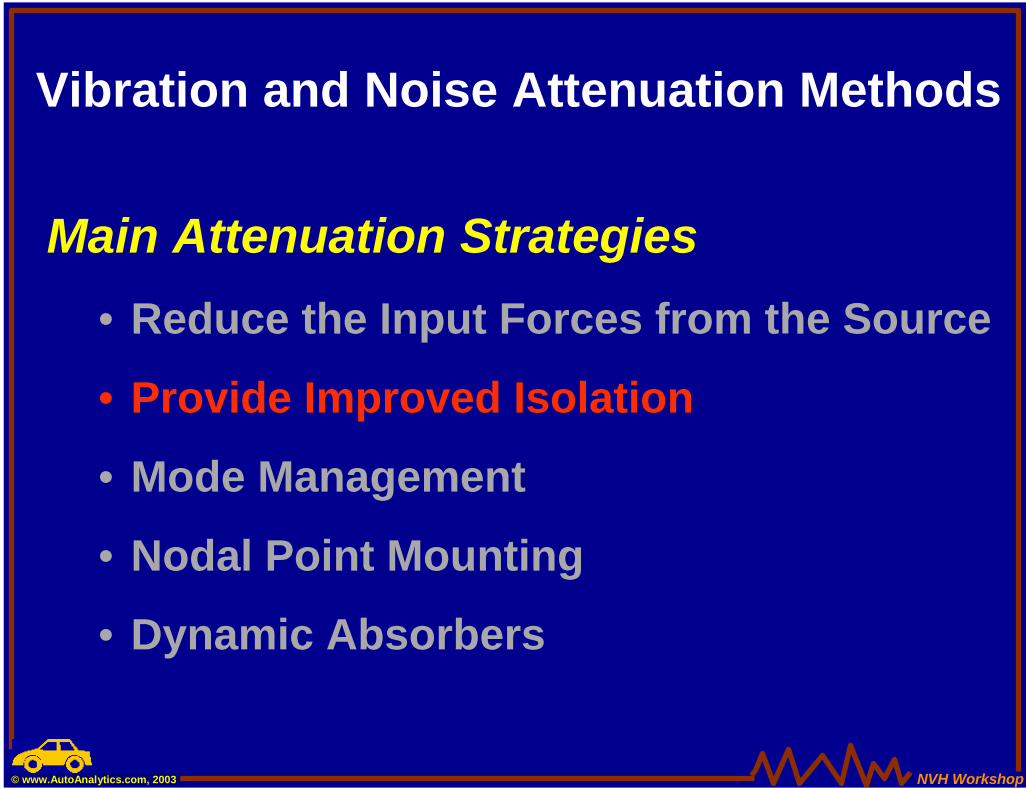
Vibration and Noise Attenuation Methods
Main Attenuation Strategies• Reduce the Input Forces from the Source
• Provide Improved Isolation
• Mode Management
• Nodal Point Mounting
• Dynamic Absorbers
NVH Workshop© www.AutoAnalytics.com, 2003
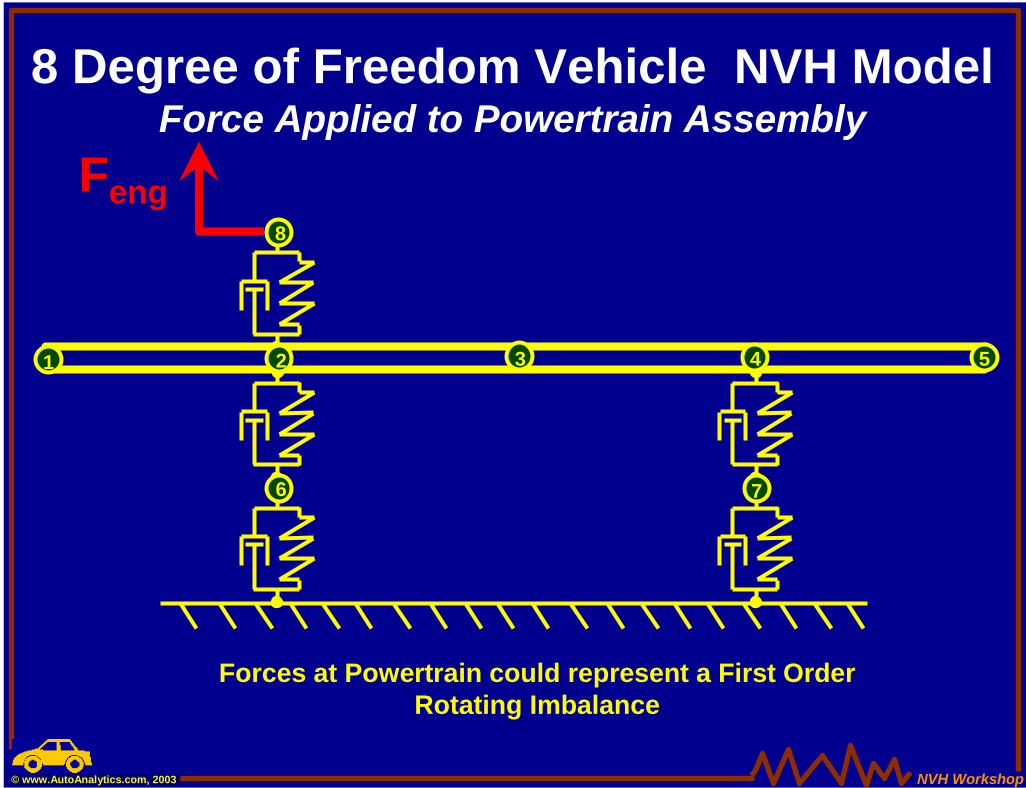
8 Degree of Freedom Vehicle NVH ModelForce Applied to Powertrain Assembly
Forces at Powertrain could represent a First OrderRotating Imbalance
1 2 4 5
6 7
8
3
Feng
NVH Workshop© www.AutoAnalytics.com, 2003
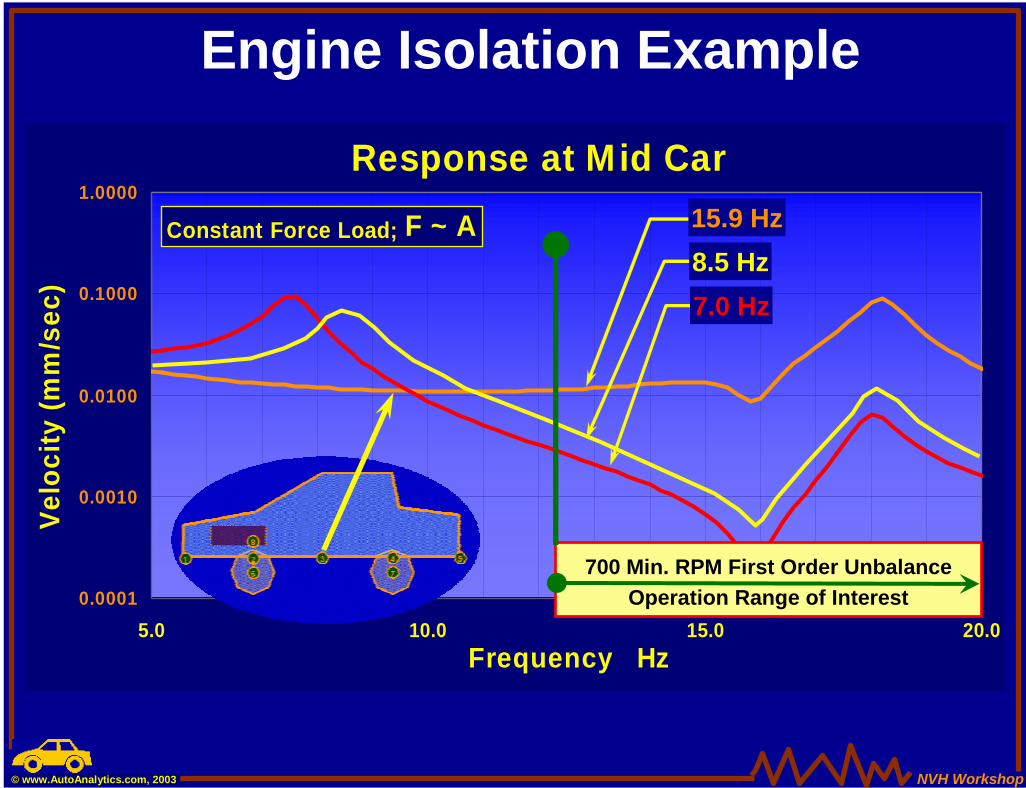
Engine Isolation Example
Response at Mid Car
0.0001
0.0010
0.0100
0.1000
1.0000
5.0 10.0 15.0 20.0Frequency Hz
Velo
city
(mm
/sec
)
Constant Force Load; F ~ A 15.9 Hz8.5 Hz7.0 Hz
700 Min. RPM First Order UnbalanceOperation Range of Interest
NVH Workshop© www.AutoAnalytics.com, 2003
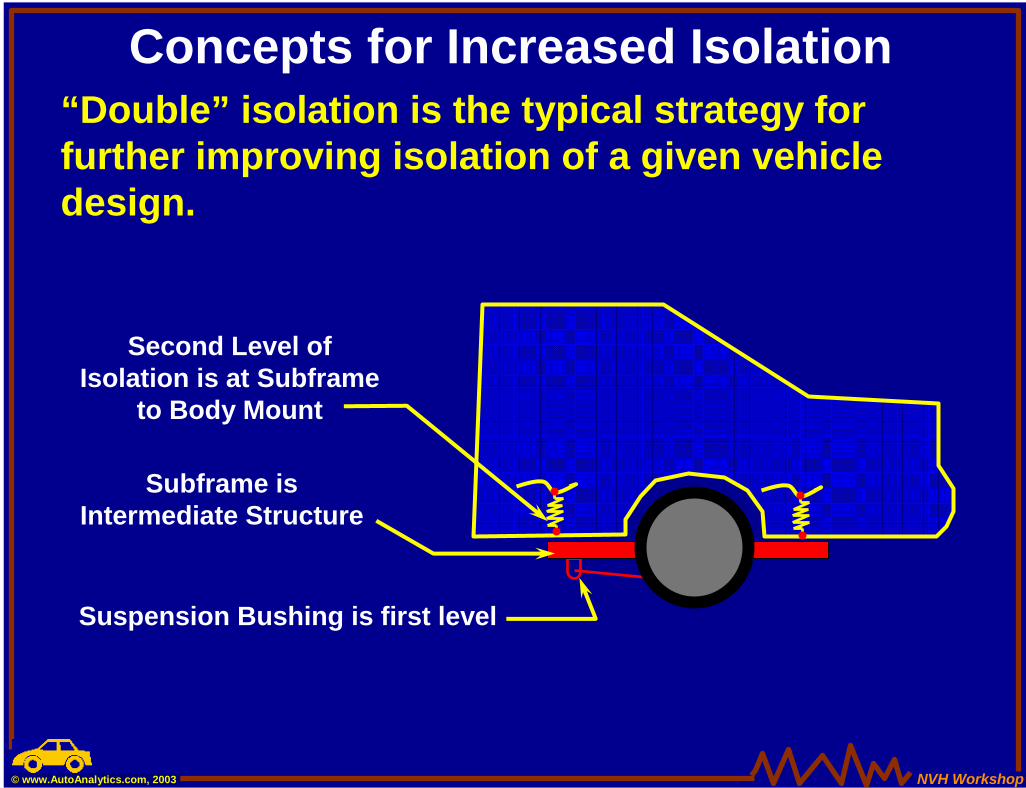
Concepts for Increased Isolation“Double” isolation is the typical strategy for further improving isolation of a given vehicle design.
Subframe is Intermediate Structure
Suspension Bushing is first level
Second Level of Isolation is at Subframe
to Body Mount
NVH Workshop© www.AutoAnalytics.com, 2003
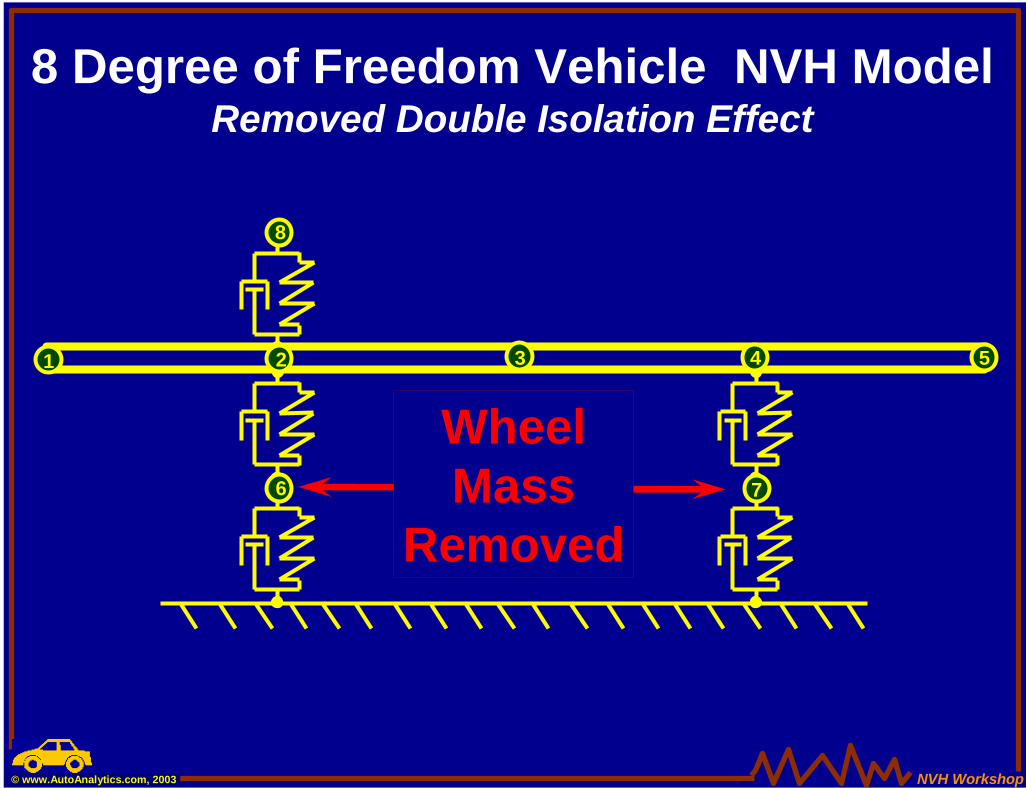
8 Degree of Freedom Vehicle NVH ModelRemoved Double Isolation Effect
1 2 4 5
6 7
8
3
WheelMass
Removed
NVH Workshop© www.AutoAnalytics.com, 2003
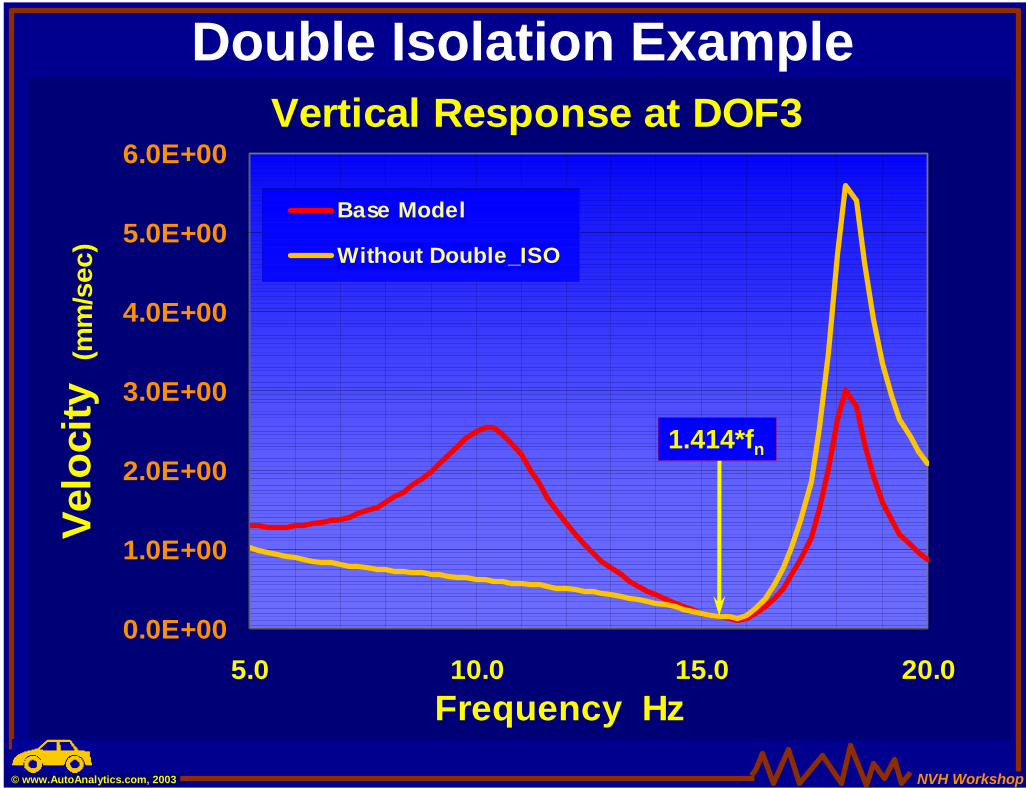
Double Isolation ExampleVertical Response at DOF3
0.0E+00
1.0E+00
2.0E+00
3.0E+00
4.0E+00
5.0E+00
6.0E+00
5.0 10.0 15.0 20.0Frequency Hz
Velo
city
(m
m/s
ec)
Base Model
Without Double_ISO
1.414*fn
NVH Workshop© www.AutoAnalytics.com, 2003
Vibration and Noise Attenuation Methods
Main Attenuation Strategies• Reduce the Input Forces from the Source
• Provide Isolation
• Mode Management
• Nodal Point Mounting
• Dynamic Absorbers
NVH Workshop© www.AutoAnalytics.com, 2003
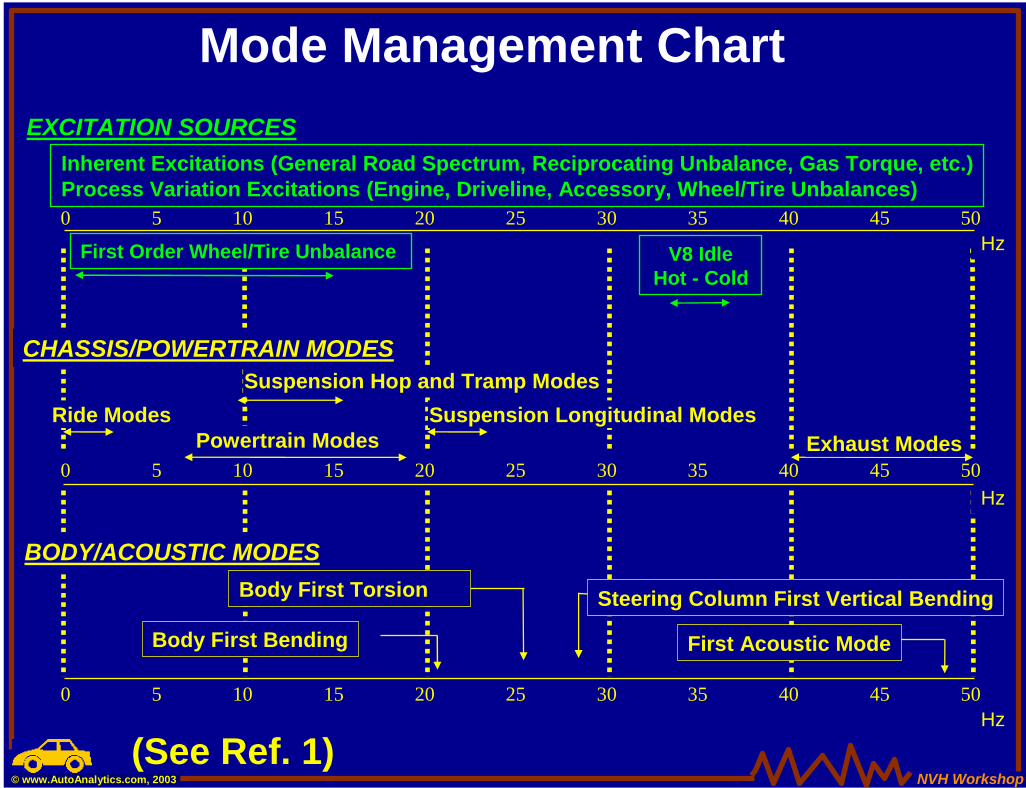
Mode Management Chart
0 5 10 15 20 25 30 35 40 45 50HzFirst Order Wheel/Tire Unbalance V8 Idle
Hot - Cold
EXCITATION SOURCESInherent Excitations (General Road Spectrum, Reciprocating Unbalance, Gas Torque, etc.)Process Variation Excitations (Engine, Driveline, Accessory, Wheel/Tire Unbalances)
Hz
Hz0 5 10 15 20 25 30 35 40 45 50
0 5 10 15 20 25 30 35 40 45 50
CHASSIS/POWERTRAIN MODES
Ride ModesPowertrain Modes
Suspension Hop and Tramp ModesSuspension Longitudinal Modes
Exhaust Modes
BODY/ACOUSTIC MODES
Body First Bending First Acoustic Mode
Steering Column First Vertical BendingBody First Torsion
(See Ref. 1)
NVH Workshop© www.AutoAnalytics.com, 2003
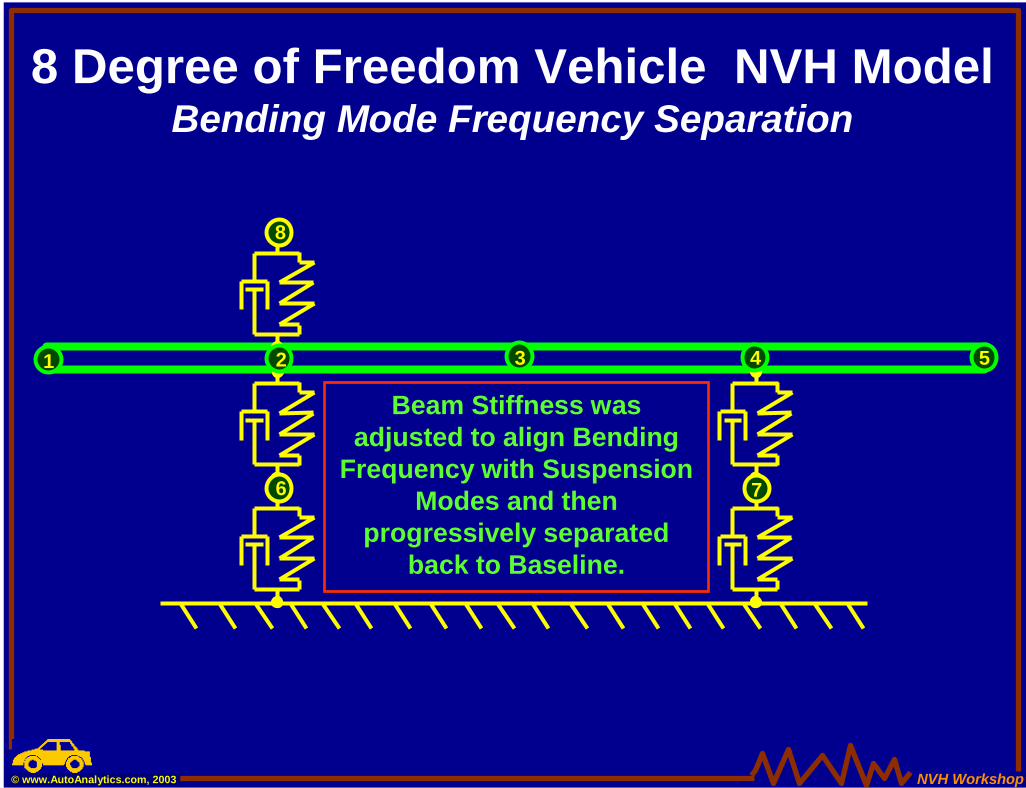
8 Degree of Freedom Vehicle NVH ModelBending Mode Frequency Separation
1 2 4 5
6 7
8
3
Beam Stiffness was adjusted to align Bending
Frequency with Suspension Modes and then
progressively separated back to Baseline.
NVH Workshop© www.AutoAnalytics.com, 2003
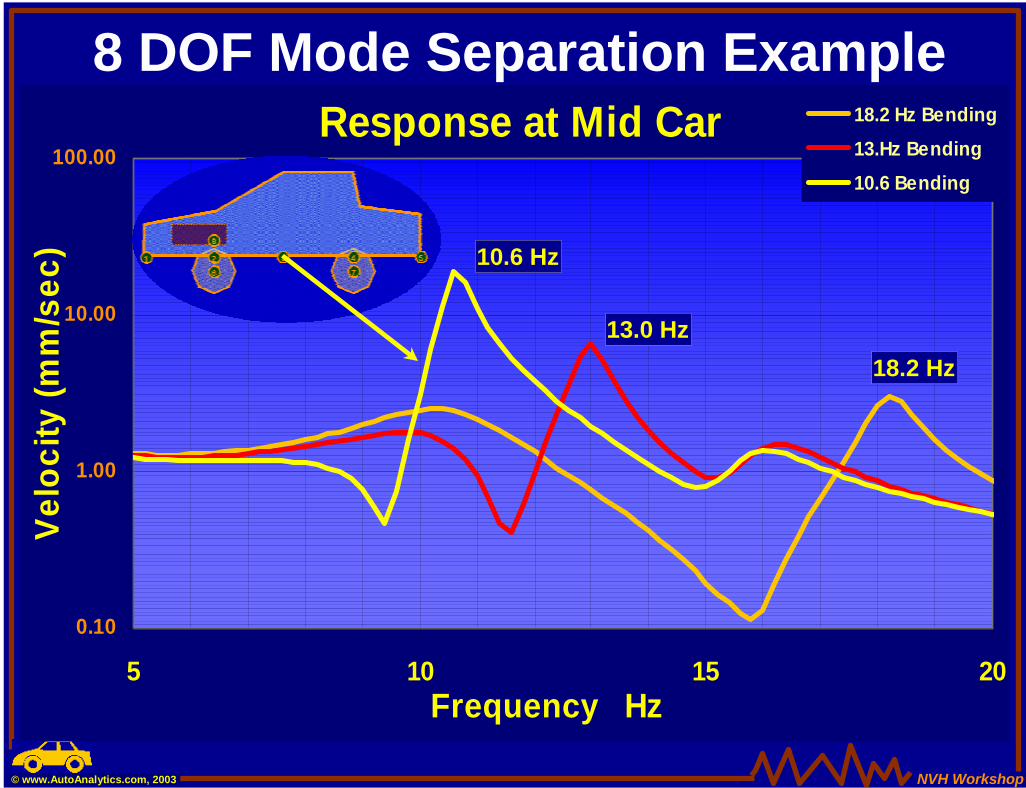
Response at Mid Car
0.10
1.00
10.00
100.00
5 10 15 20Frequency Hz
Velo
city
(mm
/sec
)
18.2 Hz Bending13.Hz Bending10.6 Bending
8 DOF Mode Separation Example
18.2 Hz13.0 Hz
10.6 Hz
NVH Workshop© www.AutoAnalytics.com, 2003
Vibration and Noise Attenuation Methods
Main Attenuation Strategies• Reduce the Input Forces from the Source
• Provide Isolation
• Mode Management
• Nodal Point Mounting
• Dynamic Absorbers
NVH Workshop© www.AutoAnalytics.com, 2003
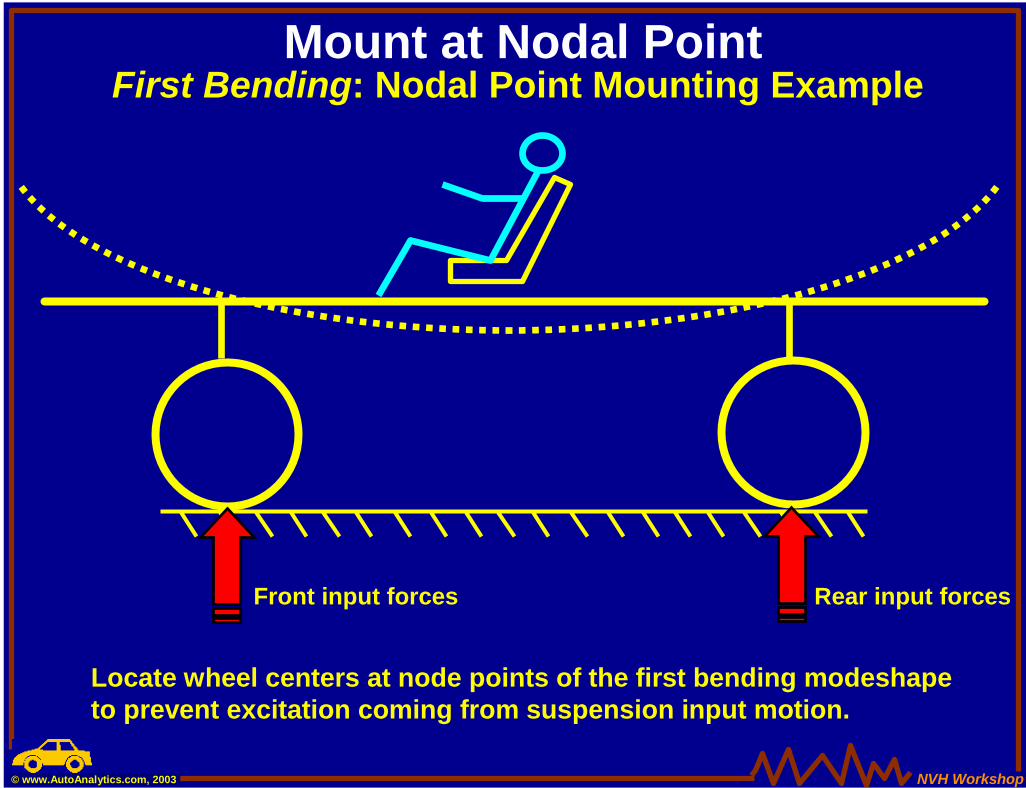
Front input forces Rear input forces
First Bending: Nodal Point Mounting ExampleMount at Nodal Point
Locate wheel centers at node points of the first bending modeshapeto prevent excitation coming from suspension input motion.
NVH Workshop© www.AutoAnalytics.com, 2003
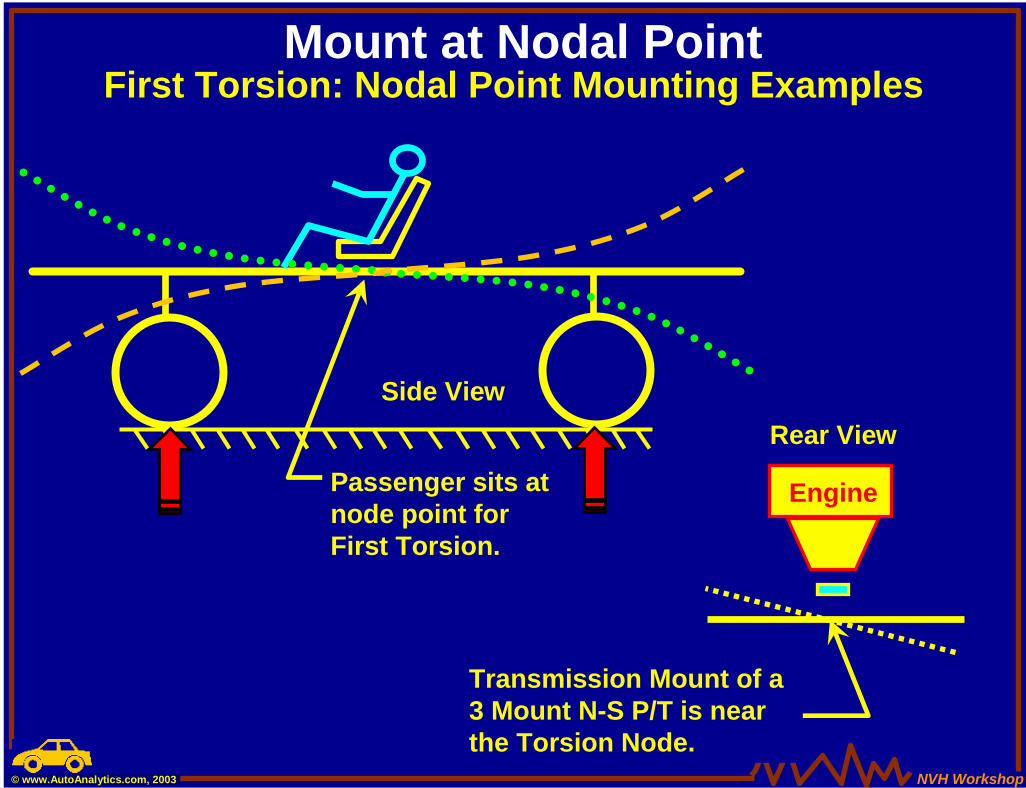
Passenger sits at node point for First Torsion.
Side View
First Torsion: Nodal Point Mounting ExamplesMount at Nodal Point
Transmission Mount of a3 Mount N-S P/T is nearthe Torsion Node.
Rear View
Engine
NVH Workshop© www.AutoAnalytics.com, 2003
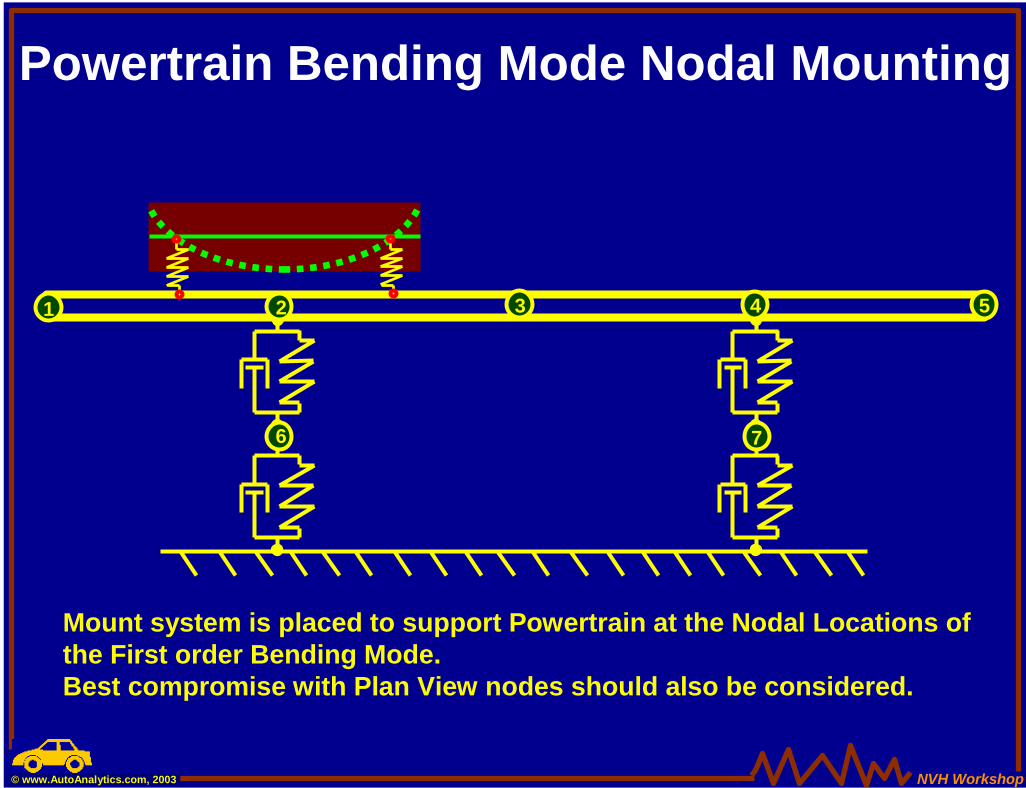
Powertrain Bending Mode Nodal Mounting
1 2 4 5
6 7
3
Mount system is placed to support Powertrain at the Nodal Locations of the First order Bending Mode. Best compromise with Plan View nodes should also be considered.
NVH Workshop© www.AutoAnalytics.com, 2003
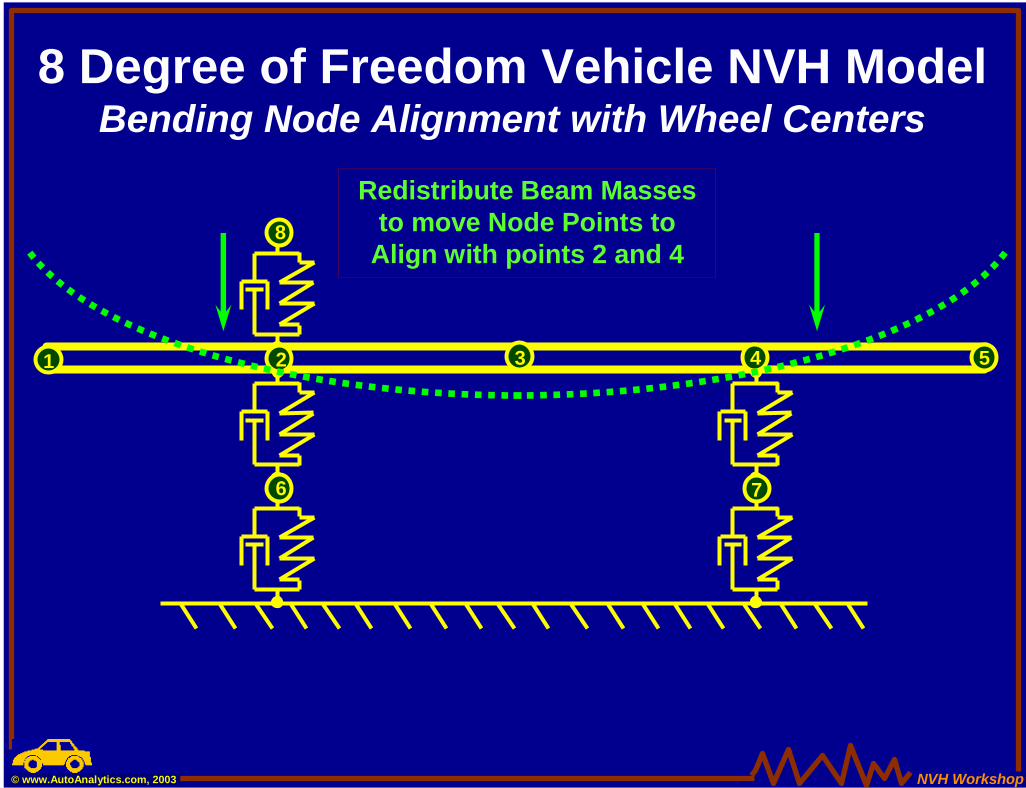
8 Degree of Freedom Vehicle NVH ModelBending Node Alignment with Wheel Centers
1 2 4 5
6 7
8
3
Redistribute Beam Masses to move Node Points to
Align with points 2 and 4
NVH Workshop© www.AutoAnalytics.com, 2003
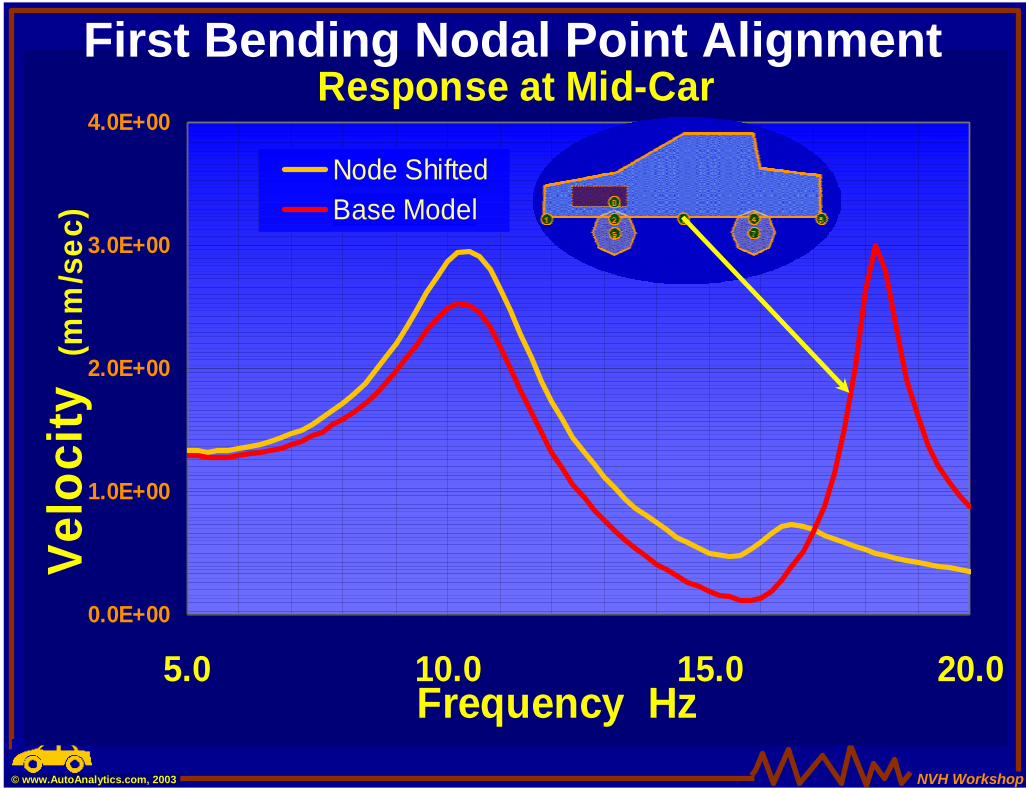
Response at Mid-Car
0.0E+00
1.0E+00
2.0E+00
3.0E+00
4.0E+00
5.0 10.0 15.0 20.0Frequency Hz
Velo
city
(m
m/s
ec)
Node ShiftedBase Model
First Bending Nodal Point Alignment
NVH Workshop© www.AutoAnalytics.com, 2003
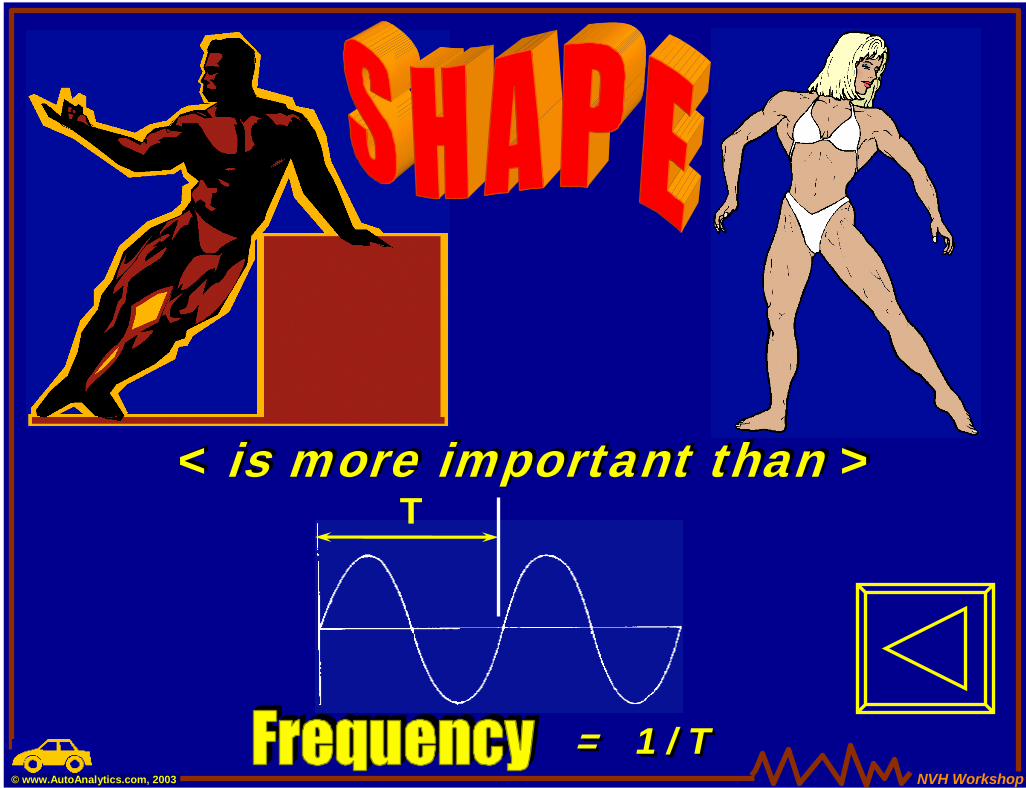
T
= 1 / T= 1 / T
< is more important than >< is more important than >
NVH Workshop© www.AutoAnalytics.com, 2003
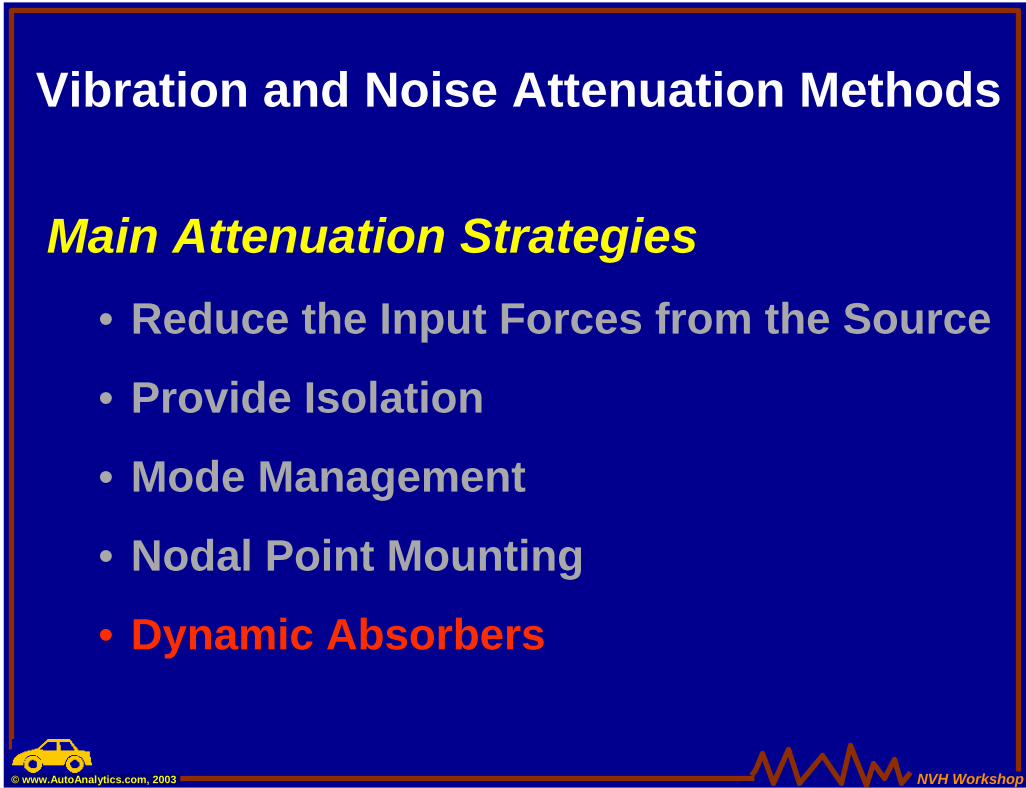
Vibration and Noise Attenuation Methods
Main Attenuation Strategies• Reduce the Input Forces from the Source
• Provide Isolation
• Mode Management
• Nodal Point Mounting
• Dynamic Absorbers
NVH Workshop© www.AutoAnalytics.com, 2003
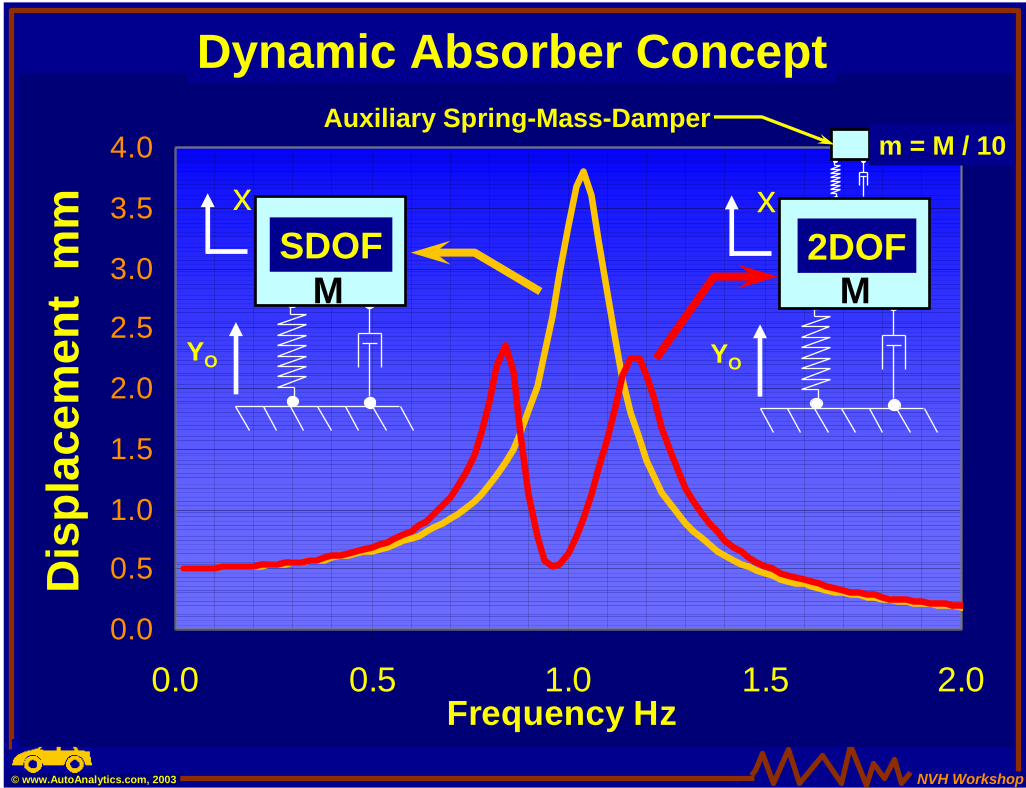
0.0
0.5
1.0
1.5
2.0
2.5
3.0
3.5
4.0
0.0 0.5 1.0 1.5 2.0Frequency Hz
Dis
plac
emen
t m
m
YO
xSDOF
Dynamic Absorber Concept
MYO
x
Auxiliary Spring-Mass-Damperm = M / 10
2DOFM
NVH Workshop© www.AutoAnalytics.com, 2003
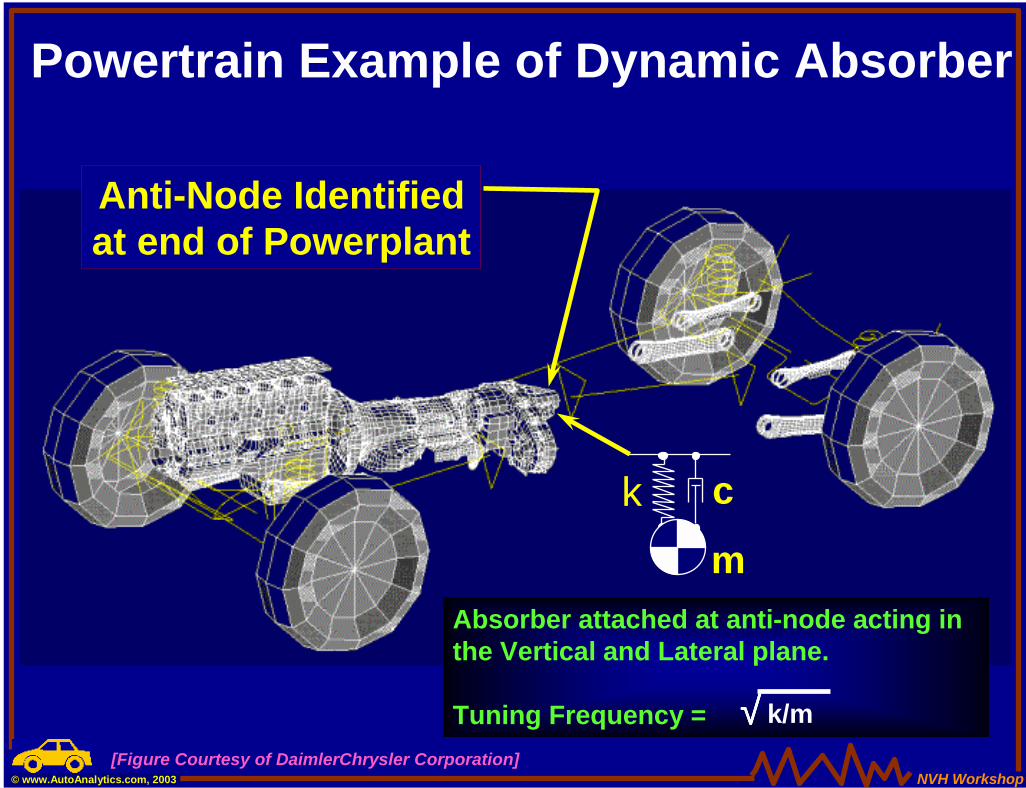
Powertrain Example of Dynamic Absorber
Anti-Node Identifiedat end of Powerplant
k c
Absorber attached at anti-node acting in the Vertical and Lateral plane.
Tuning Frequency = √√√√ k/m
m
[Figure Courtesy of DaimlerChrysler Corporation]
NVH Workshop© www.AutoAnalytics.com, 2003
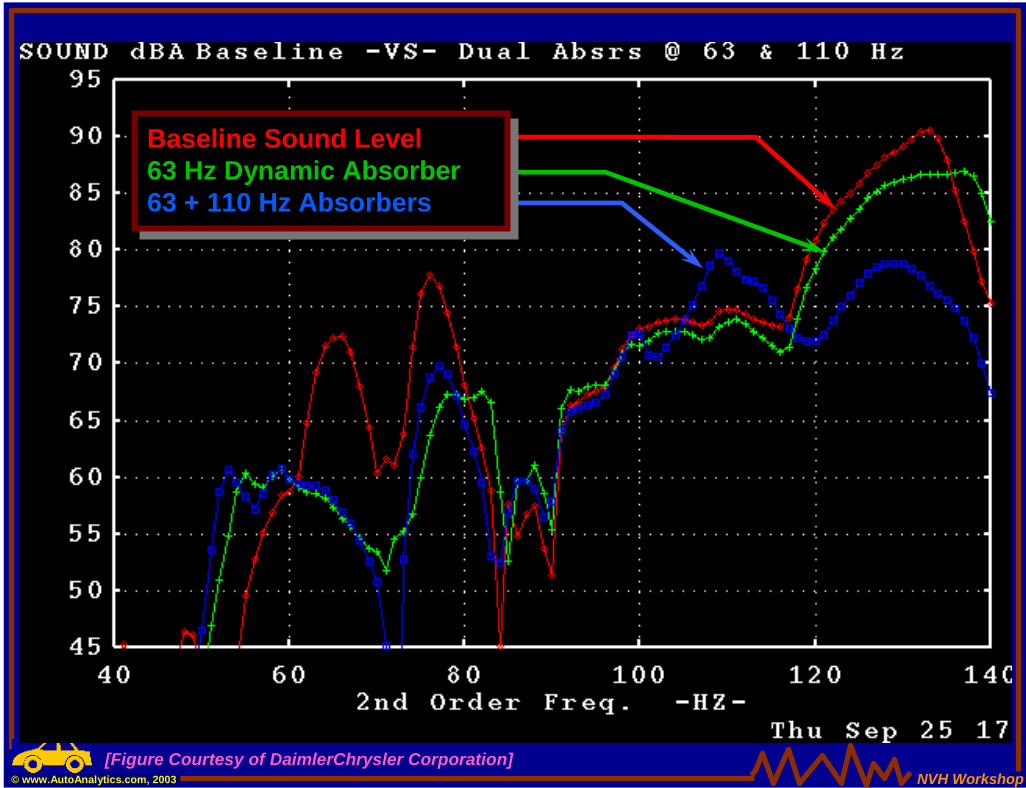
Baseline Sound Level63 Hz Dynamic Absorber63 + 110 Hz Absorbers
Baseline Sound Level63 Hz Dynamic Absorber63 + 110 Hz Absorbers
[Figure Courtesy of DaimlerChrysler Corporation]
NVH Workshop© www.AutoAnalytics.com, 2003
Vibration and Noise Attenuation Methods
Main Attenuation Strategies• Reduce the Input Forces from the Source
• Provide Isolation
• Mode Management
• Nodal Point Mounting
• Dynamic Absorbers
NVH Workshop© www.AutoAnalytics.com, 2003
NVH Workshop Topic Outline• Introduction• Ride Balance in the Ride Range• NVH Load Conditions• Low Frequency Basics• Live Noise Attenuation Demo• Mid Frequency Basics• Utilization of Simulation Models• Closing Remarks
Greg Goetchius
NVH Workshop© www.AutoAnalytics.com, 2003
NVH Workshop Topic Outline• Introduction• Ride Balance in the Ride Range• NVH Load Conditions• Low Frequency Basics• Live Noise Attenuation Demo• Mid Frequency Basics• Utilization of Simulation Models• Closing Remarks
Sachin Gogate
NVH Workshop© www.AutoAnalytics.com, 2003
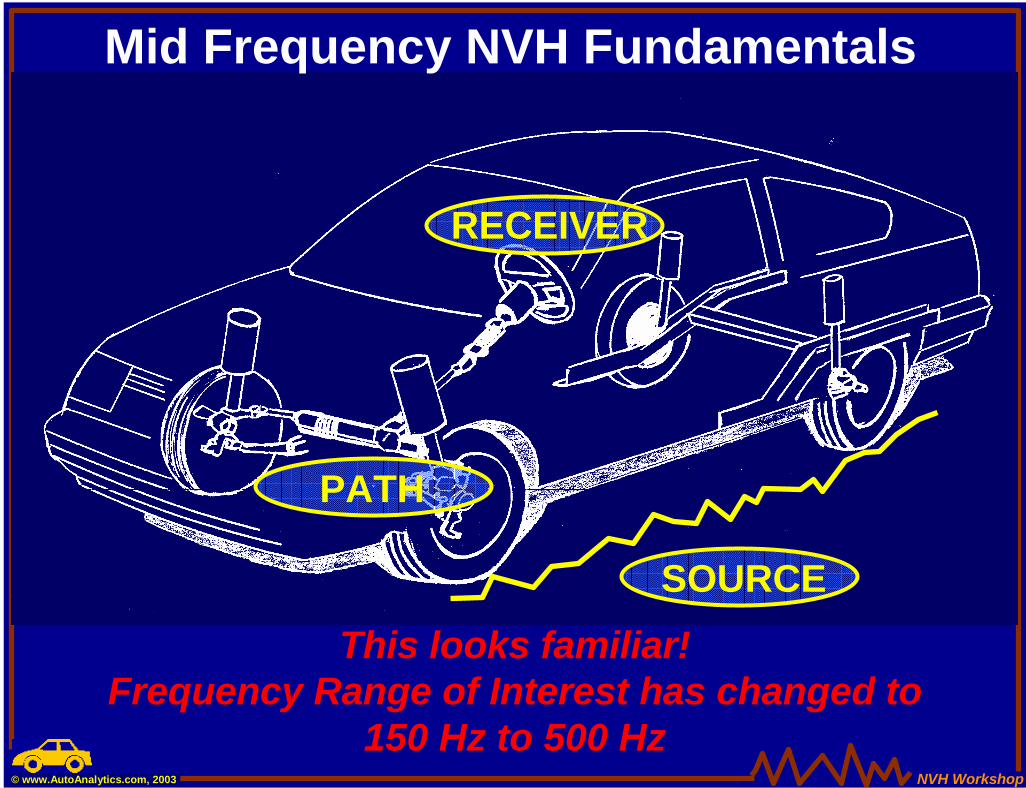
RECEIVER
PATH
SOURCE
Mid Frequency NVH Fundamentals
This looks familiar!Frequency Range of Interest has changed to
150 Hz to 500 Hz
NVH Workshop© www.AutoAnalytics.com, 2003
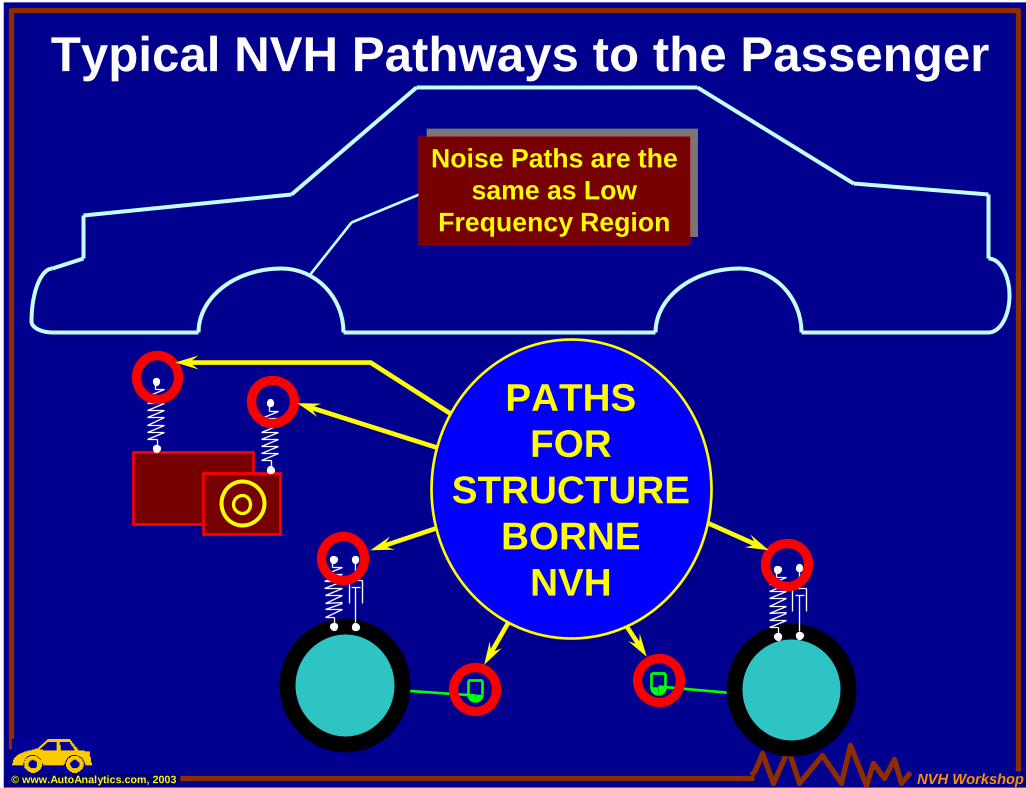
Typical NVH Pathways to the Passenger
PATHS FOR
STRUCTURE BORNE
NVH
Noise Paths are thesame as Low
Frequency Region
Noise Paths are thesame as Low
Frequency Region
NVH Workshop© www.AutoAnalytics.com, 2003
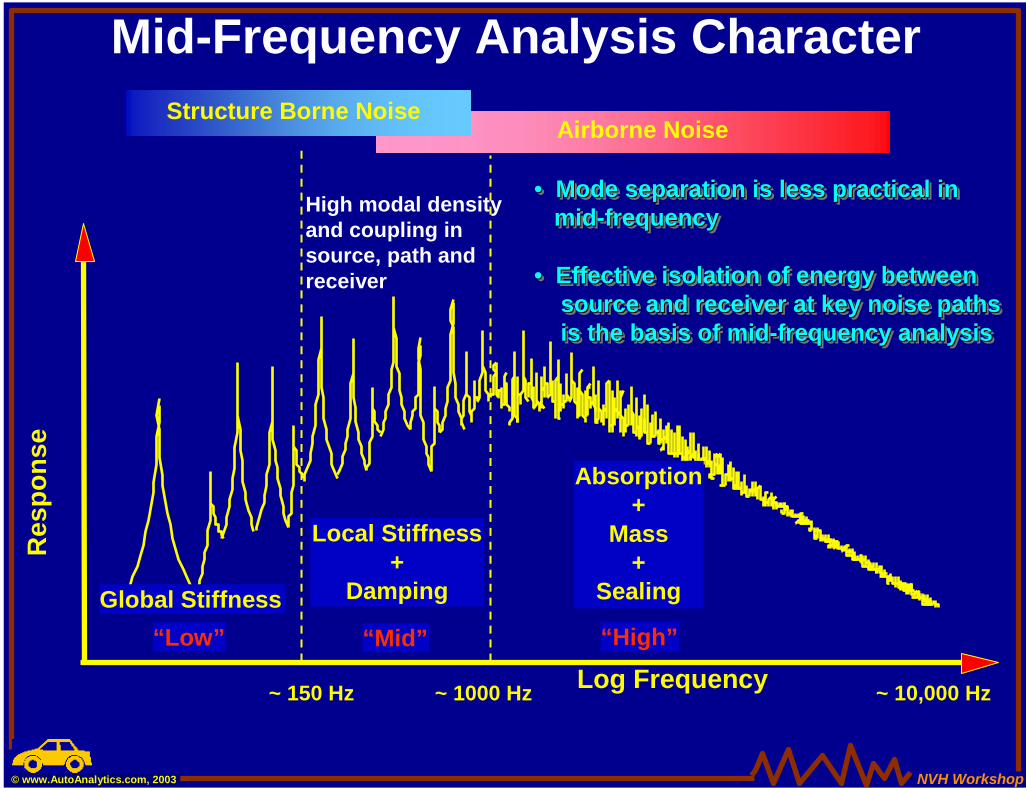
Mid-Frequency Analysis CharacterStructure Borne Noise
Airborne Noise
Res
pons
e
Log Frequency“Low”
Global Stiffness“Mid”
Local Stiffness+
Damping
“High”
Absorption+
Mass+
Sealing
~ 150 Hz ~ 1000 Hz ~ 10,000 Hz
High modal densityand coupling insource, path andreceiver
• Mode separation is less practical inmid-frequency
• Effective isolation of energy betweensource and receiver at key noise pathsis the basis of mid-frequency analysis
•• Mode separation is less practical inMode separation is less practical inmidmid--frequencyfrequency
•• Effective isolation of energy betweenEffective isolation of energy betweensource and receiver at key noise pathssource and receiver at key noise pathsis the basis of midis the basis of mid--frequency analysisfrequency analysis
NVH Workshop© www.AutoAnalytics.com, 2003
Mid-Frequency Analysis Character
• Important characteristics of mid frequency analysis
&
Identifying Key Noise Paths
Effective Isolation
NVH Workshop© www.AutoAnalytics.com, 2003
Mid-Frequency Analysis Character
&
• Important characteristics of mid frequency analysis
Identifying Key Noise Paths
Effective IsolationEffective Isolation
NVH Workshop© www.AutoAnalytics.com, 2003
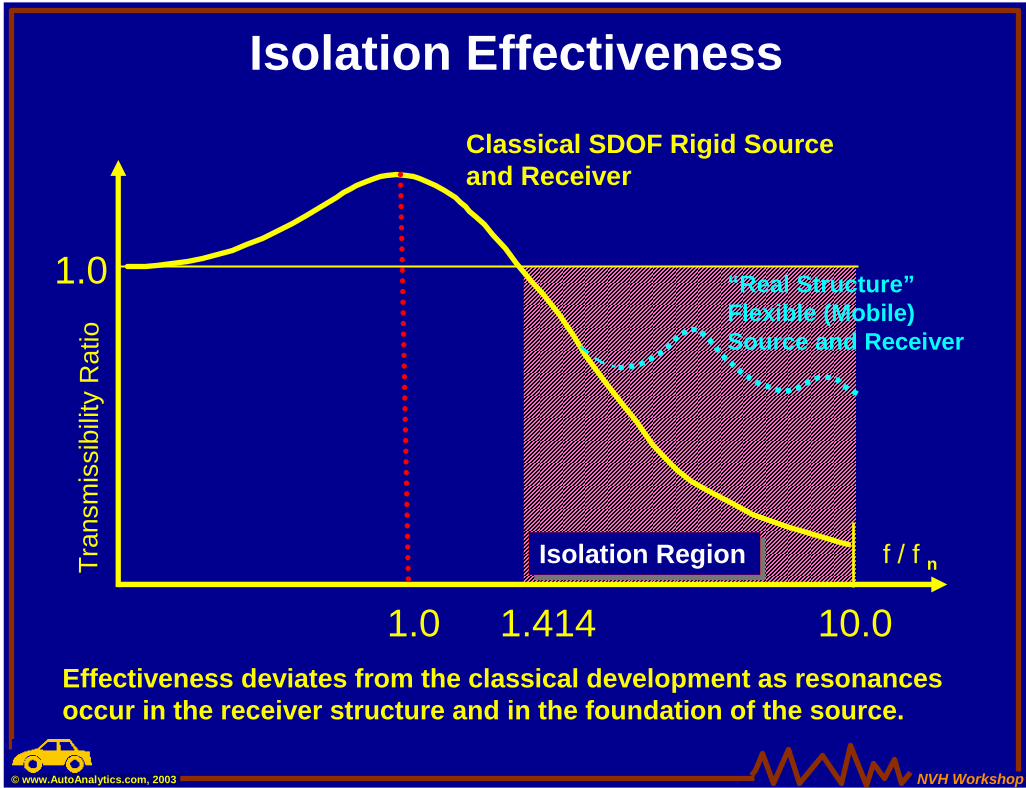
Classical SDOF Rigid Source and Receiver
T ran
smis
sib i
lity
Rat
io
1.0 1.414 10.0
f / f n
“Real Structure”Flexible (Mobile)Source and Receiver
Isolation Effectiveness
Effectiveness deviates from the classical development as resonances occur in the receiver structure and in the foundation of the source.
Isolation RegionIsolation Region
1.0
NVH Workshop© www.AutoAnalytics.com, 2003
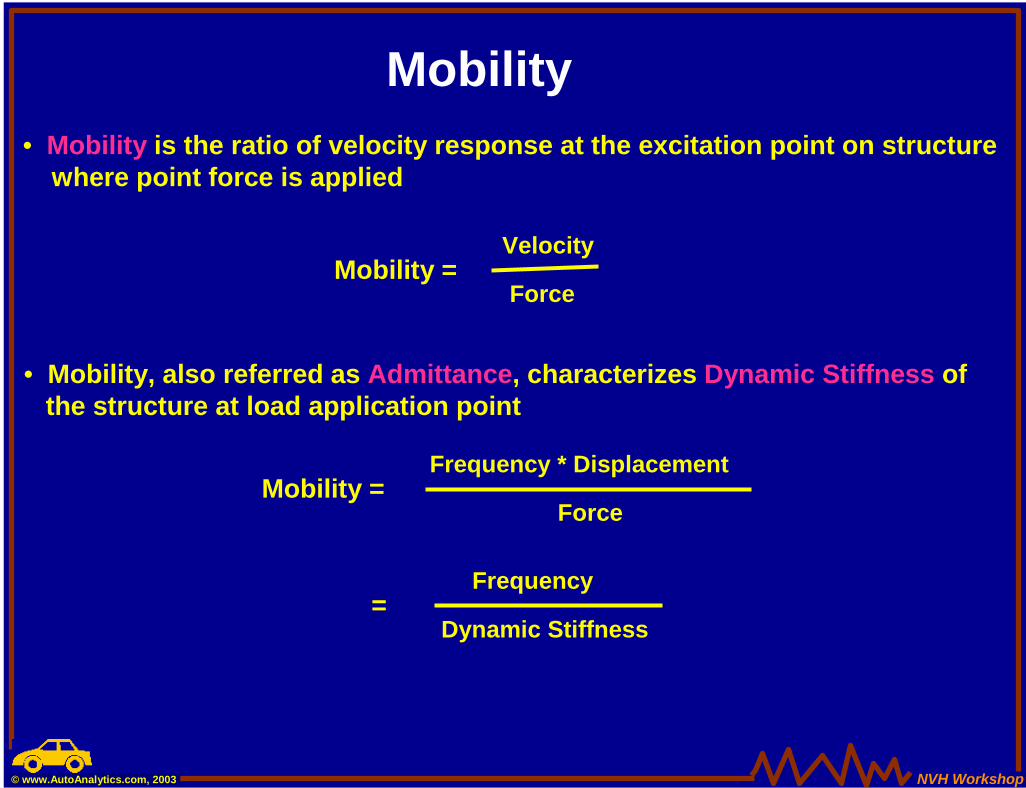
Mobility• Mobility is the ratio of velocity response at the excitation point on structure
where point force is applied
Mobility =Velocity
Force
• Mobility, also referred as Admittance, characterizes Dynamic Stiffness of the structure at load application point
Mobility =Frequency * Displacement
Force
=Frequency
Dynamic Stiffness
NVH Workshop
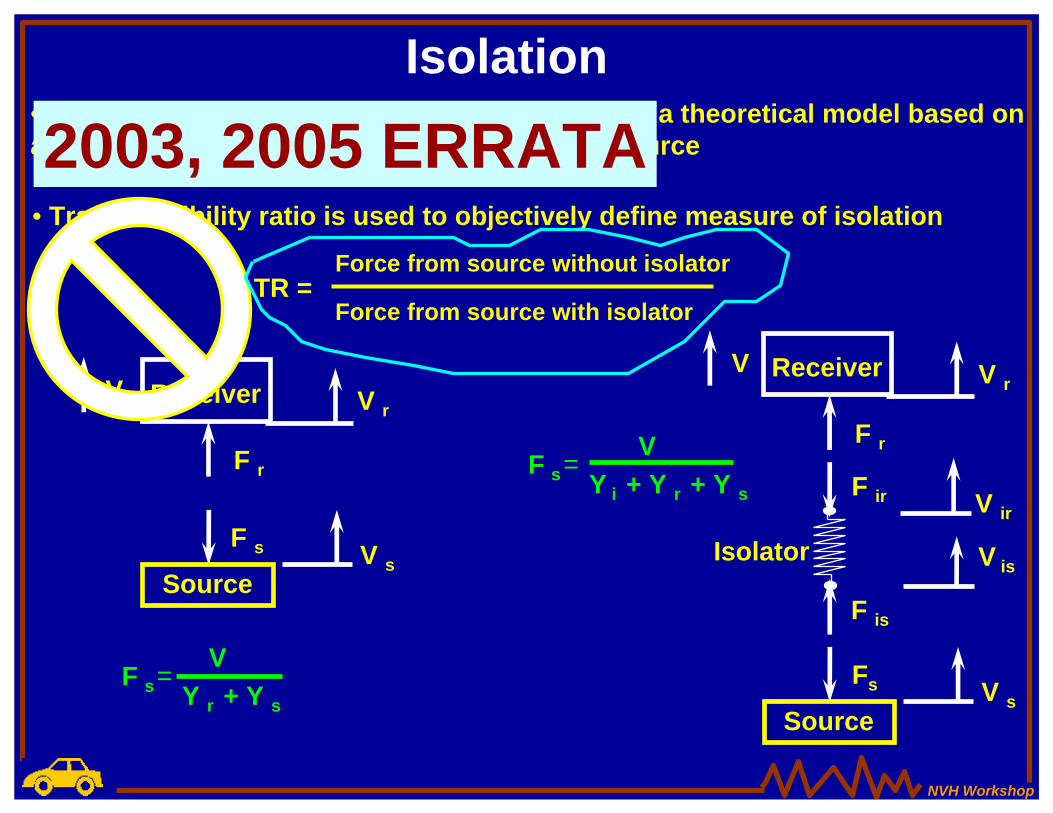
• The isolation effectiveness can be quantified by a theoretical model based on analysis of mobilities of receiver, isolator and source
• Transmissibility ratio is used to objectively define measure of isolation
TR =Force from source without isolator
Force from source with isolator
Isolation
V r
V ir
V is
F r
F ir
Receiver
Source
F is
Fs V s
Isolator
VF s=
Y i + Y r + Y s
V r
F r
Receiver
Source
F s V s
VF s=
Y r + Y s
VV
2003, 2005 ERRATA
NVH Workshop
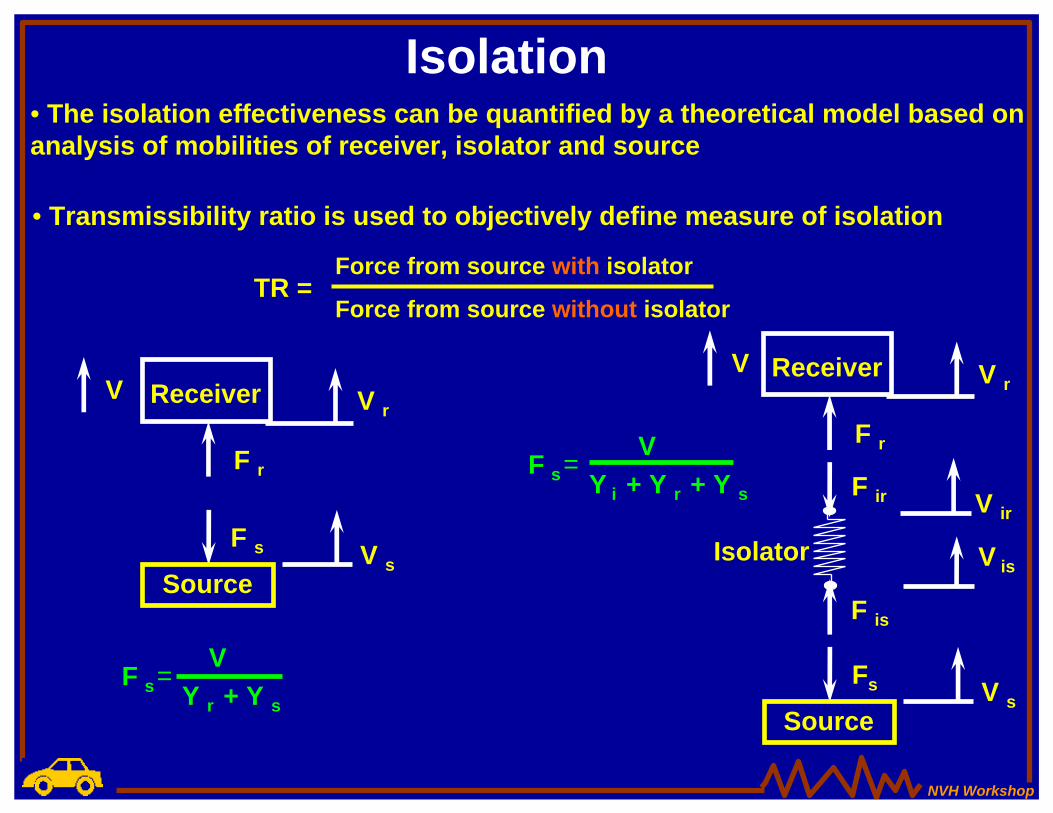
• The isolation effectiveness can be quantified by a theoretical model based on analysis of mobilities of receiver, isolator and source
• Transmissibility ratio is used to objectively define measure of isolation
TR =Force from source without isolator
Force from source with isolator
Isolation
V r
V ir
V is
F r
F ir
Receiver
Source
F is
Fs V s
Isolator
VF s=
Y i + Y r + Y s
V r
F r
Receiver
Source
F s V s
VF s=
Y r + Y s
VV
NVH Workshop
Isolation
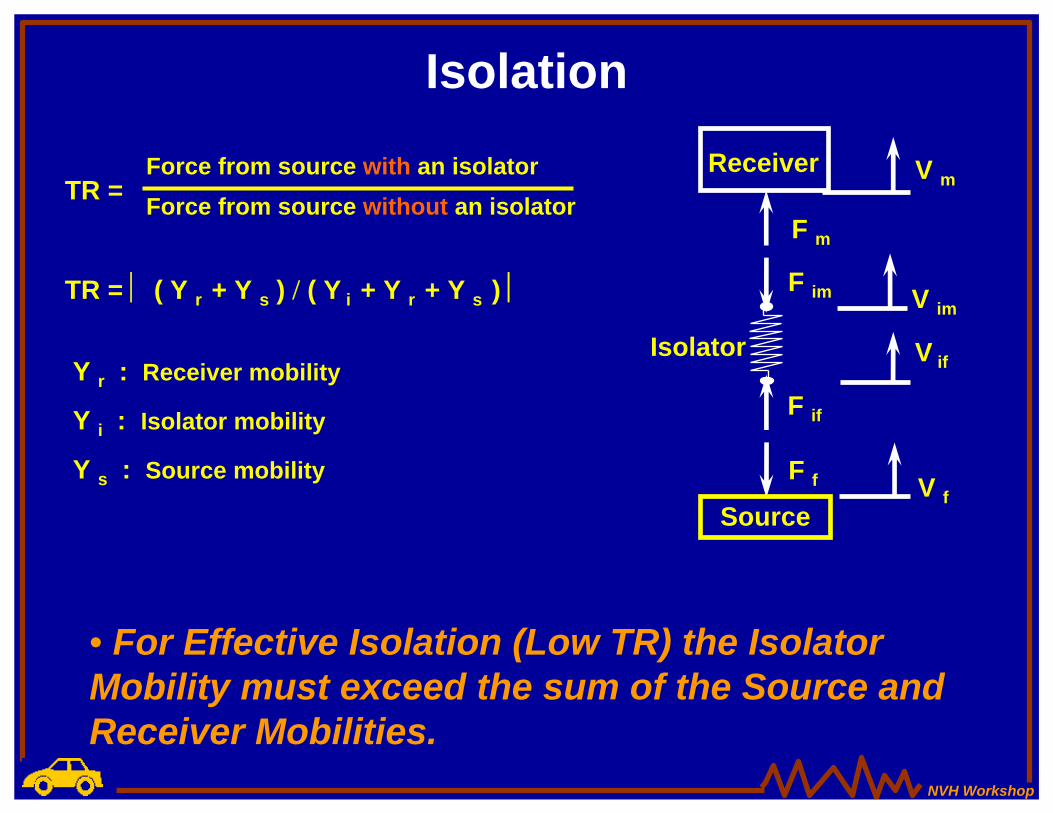
TR = ⏐ ( Y r + Y s ) / ( Y i + Y r + Y s ) ⏐
• For Effective Isolation (Low TR) the Isolator Mobility must exceed the sum of the Source and Receiver Mobilities.
Y r : Receiver mobility
Y s : Source mobility
Y i : Isolator mobility
V m
V im
V if
F m
F im
Receiver
Source
F if
F f V f
Isolator
TR = Force from source without an isolator Force from source with an isolator
NVH Workshop© www.AutoAnalytics.com, 2003
Mid-Frequency Analysis Character
Effective Isolation
&
• Important characteristics of mid frequency analysis
Identifying Key Noise PathsIdentifying Key Noise Paths
NVH Workshop© www.AutoAnalytics.com, 2003
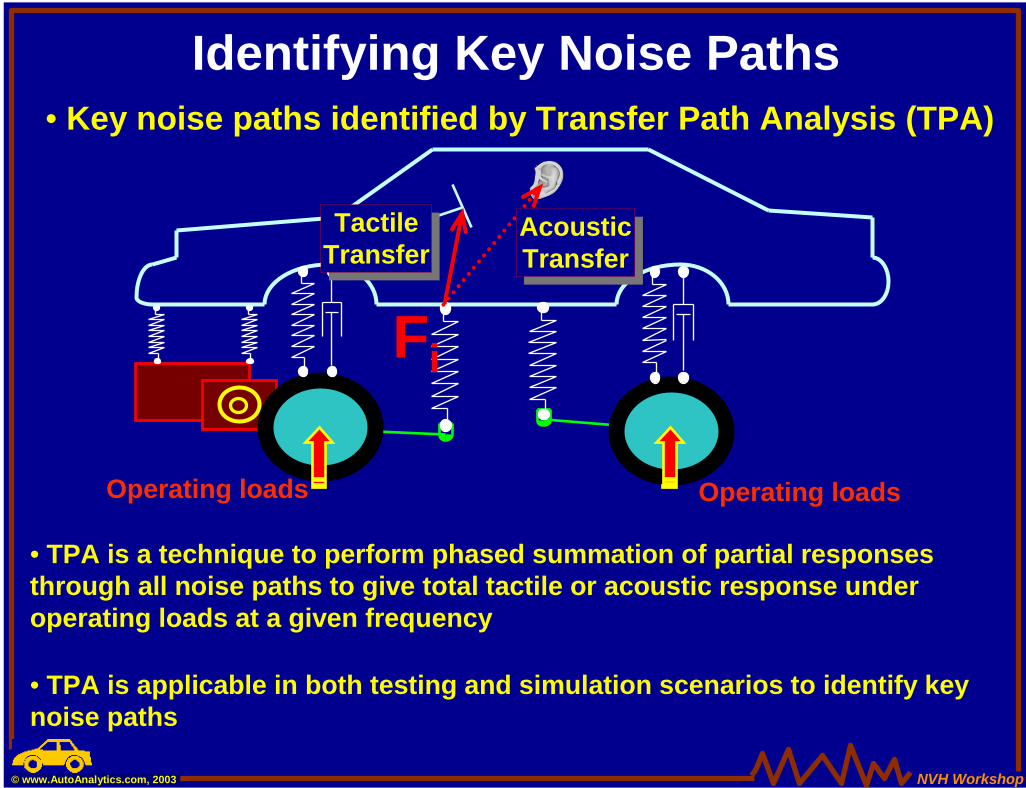
Identifying Key Noise Paths• Key noise paths identified by Transfer Path Analysis (TPA)
Fi
TactileTransferTactile
TransferAcousticTransfer
AcousticTransfer
Operating loads Operating loads
• TPA is a technique to perform phased summation of partial responses through all noise paths to give total tactile or acoustic response under operating loads at a given frequency
• TPA is applicable in both testing and simulation scenarios to identify key noise paths
NVH Workshop© www.AutoAnalytics.com, 2003
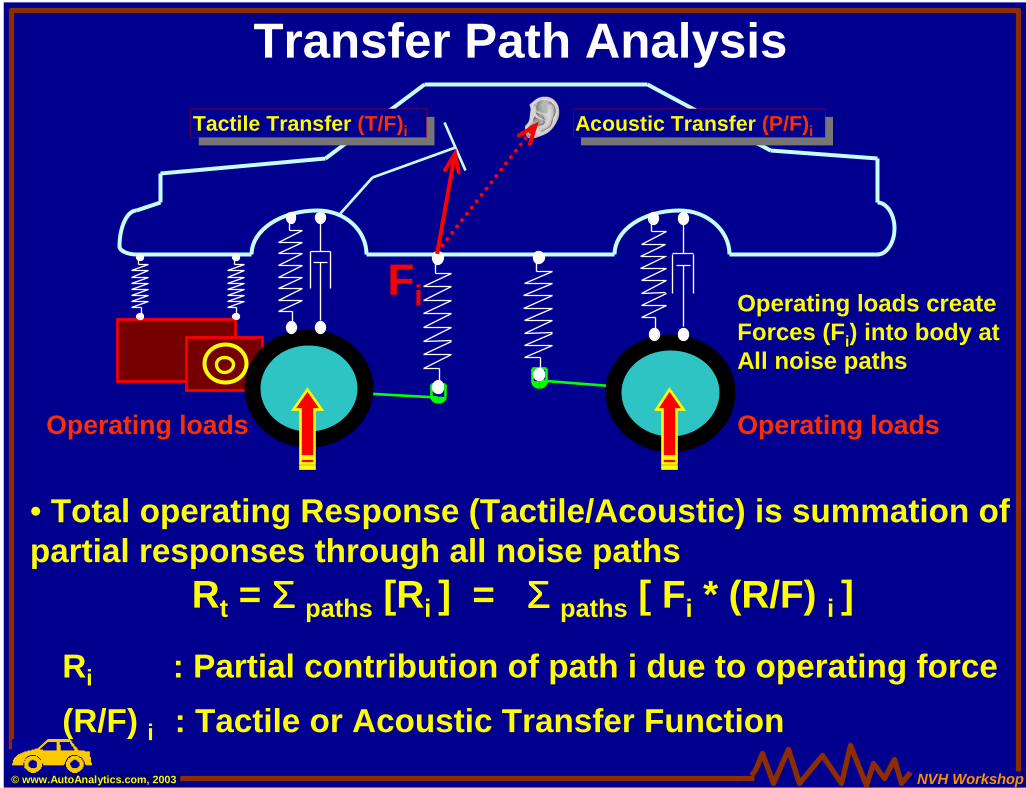
Transfer Path Analysis
Fi
Operating loads Operating loads
• Total operating Response (Tactile/Acoustic) is summation of partial responses through all noise paths
Rt = ΣΣΣΣ paths [Ri ] = ΣΣΣΣ paths [ Fi * (R/F) i ]
Acoustic Transfer (P/F)iAcoustic Transfer (P/F)iTactile Transfer (T/F)i
Tactile Transfer (T/F)i
Ri : Partial contribution of path i due to operating force
Operating loads createForces (Fi) into body atAll noise paths
(R/F) i : Tactile or Acoustic Transfer Function
NVH Workshop© www.AutoAnalytics.com, 2003
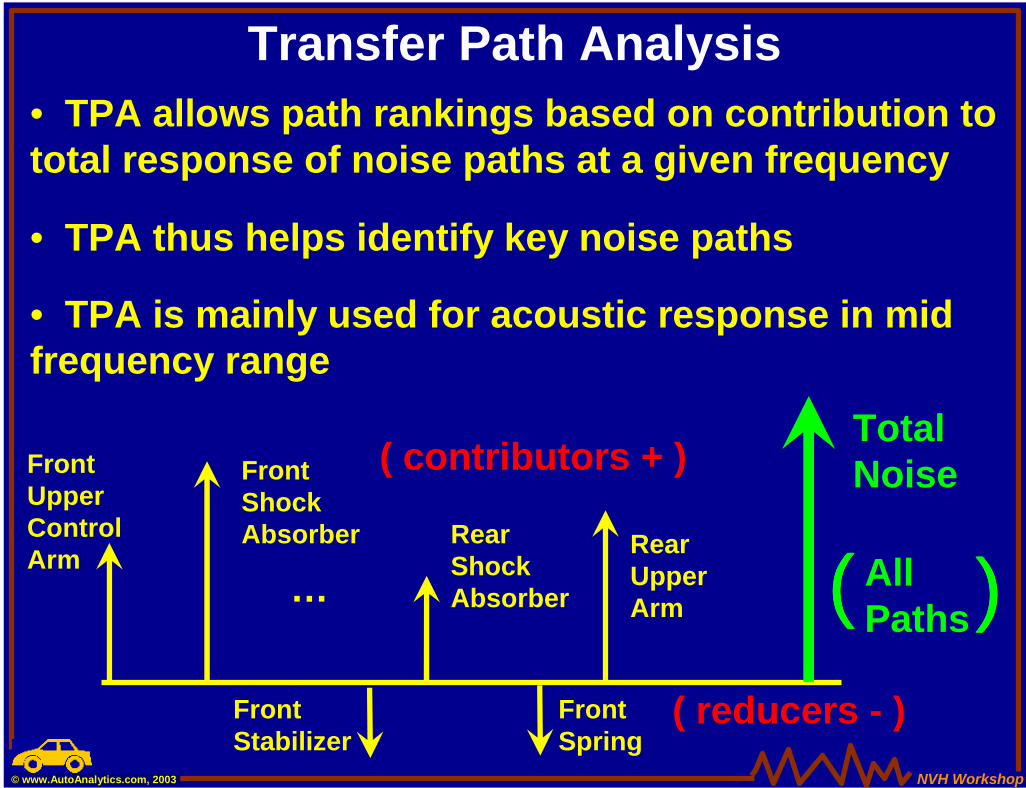
Transfer Path Analysis
( contributors + )
( reducers - )
…
FrontUpperControlArm
FrontShockAbsorber Rear
ShockAbsorber
RearUpperArm
TotalNoise
(((( AllPaths))))
FrontStabilizer
FrontSpring
• TPA allows path rankings based on contribution to total response of noise paths at a given frequency
• TPA thus helps identify key noise paths
• TPA is mainly used for acoustic response in mid frequency range
NVH Workshop© www.AutoAnalytics.com, 2003
Designing for Mid Frequency
• Important characteristics of mid frequency analysis
Effective Isolation
&
Identifying Key Noise Paths
NVH Workshop© www.AutoAnalytics.com, 2003
Designing for Mid Frequency
While designing a new vehicle, generic targets are set for key parameters along all noise paths in order to achieve effective isolation.
What are these generic targets andkey parameters ?
What are these generic targets andkey parameters ?
NVH Workshop© www.AutoAnalytics.com, 2003
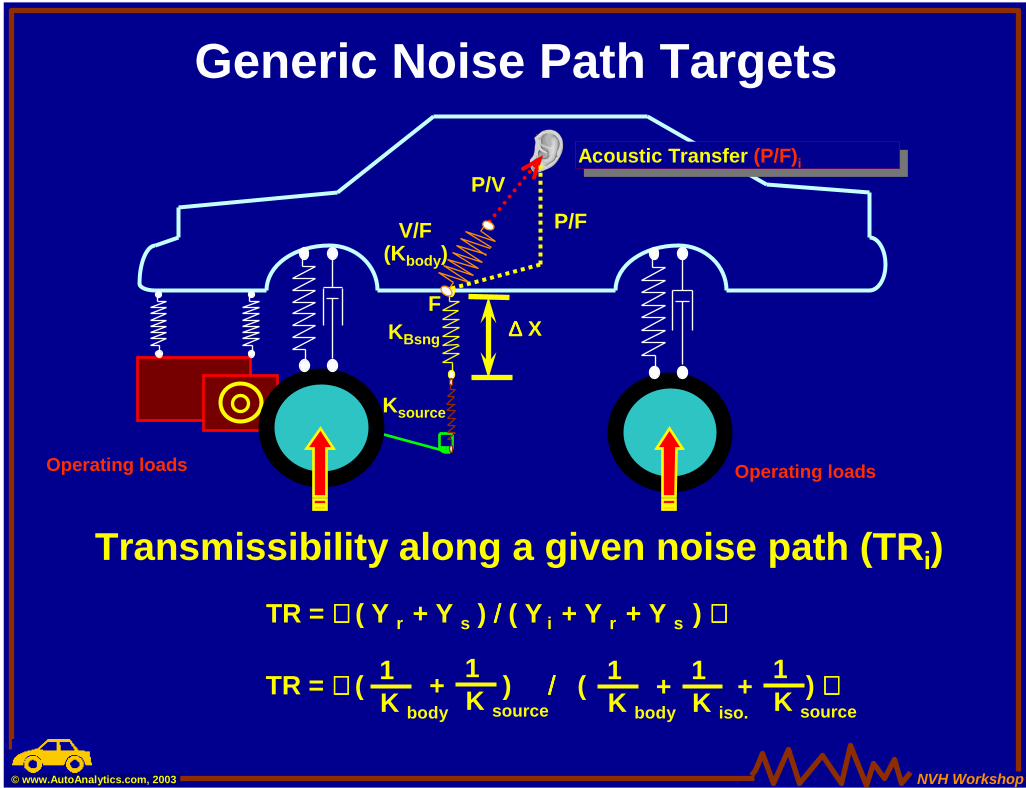
Generic Noise Path Targets
Operating loads Operating loads
Acoustic Transfer (P/F)iAcoustic Transfer (P/F)i
∆∆∆∆ XKBsng
V/F
P/VP/F
F
Ksource
(Kbody)
Transmissibility along a given noise path (TRi)TR = ( Y r + Y s ) //// ( Y i + Y r + Y s )
TR = ( ) //// ( ) K body
1K source
1+ K body
1 + K iso.
1K source
1+
NVH Workshop© www.AutoAnalytics.com, 2003
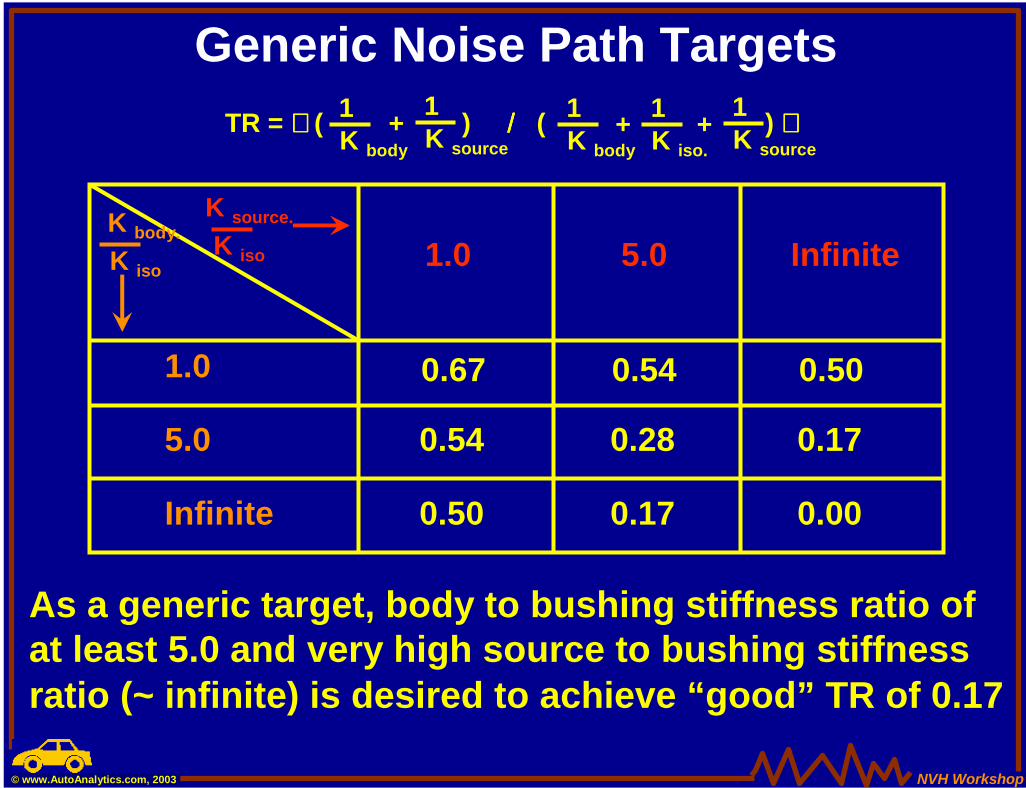
Generic Noise Path TargetsTR = ( ) //// ( ) K body
1K source
1+ K body
1 + K iso.
1K source
1+
K iso
K source.
K iso
K body.1.0 5.0 Infinite
1.0
5.0
Infinite
0.67 0.54 0.50
0.54 0.28 0.17
0.50 0.17 0.00
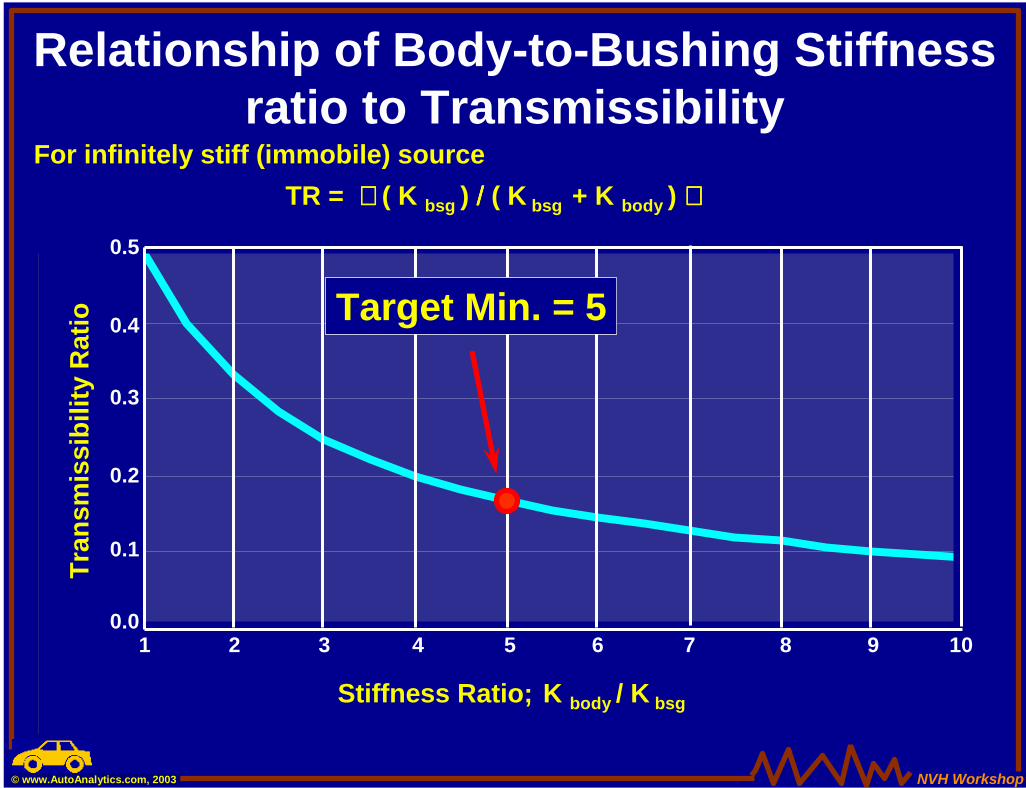
As a generic target, body to bushing stiffness ratio ofat least 5.0 and very high source to bushing stiffnessratio (~ infinite) is desired to achieve “good” TR of 0.17
NVH Workshop© www.AutoAnalytics.com, 2003
0
0.1
0.2
0.3
0.4
0.5
1 1.5 2 2.5 3 3.5 4 4.5 5 5.5 6 6.5 7 7.5 8 8.5 9 9.5 10
Series2
0.0
0.1
0.2
0.3
0.4
0.5
1 2 3 4 5 6 7 8 9 10
Stiffness Ratio; K body / K bsg
Tran
smis
sibi
lity
Rat
io
TR = ( K bsg ) //// ( K bsg + K body ) For infinitely stiff (immobile) source
Target Min. = 5
Relationship of Body-to-Bushing Stiffness ratio to Transmissibility
NVH Workshop© www.AutoAnalytics.com, 2003
Generic Noise Path Targets
Fi
Operating loads Operating loads
Acoustic Transfer (P/F)iAcoustic Transfer (P/F)iTactile Transfer (T/F)i
Tactile Transfer (T/F)i
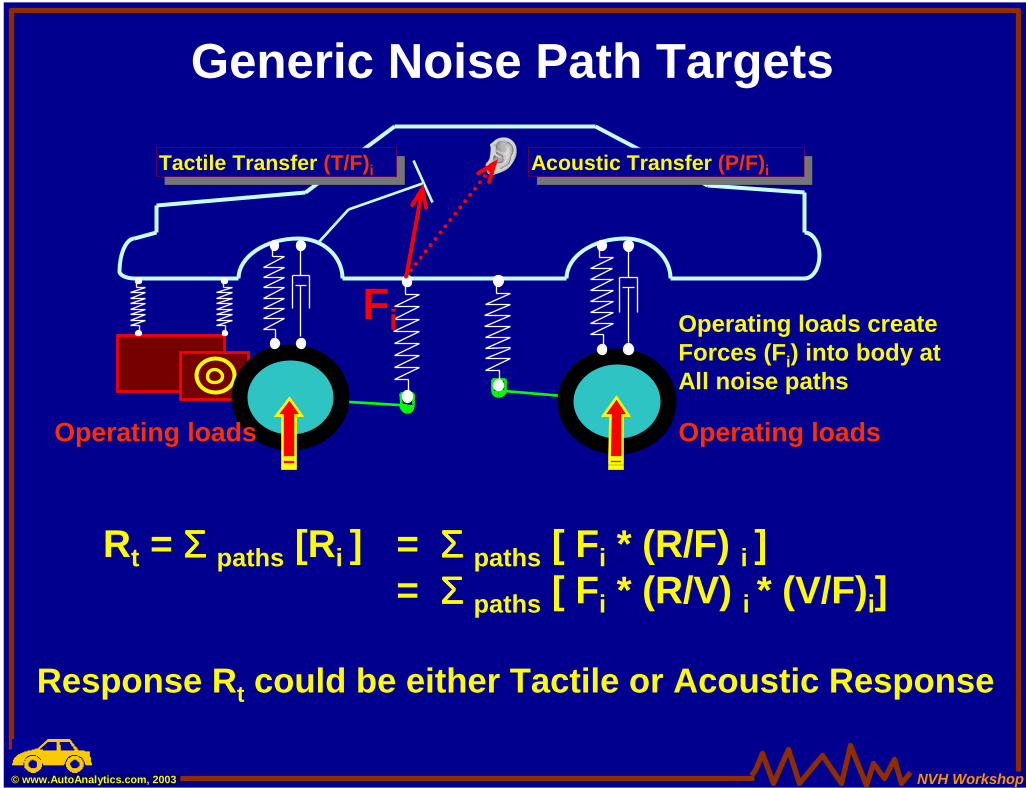
Operating loads createForces (Fi) into body atAll noise paths
Rt = ΣΣΣΣ paths [Ri ] = ΣΣΣΣ paths [ Fi * (R/F) i ] = ΣΣΣΣ paths [ Fi * (R/V) i * (V/F)i]
Response Rt could be either Tactile or Acoustic Response
NVH Workshop© www.AutoAnalytics.com, 2003
Generic Noise Path Targets
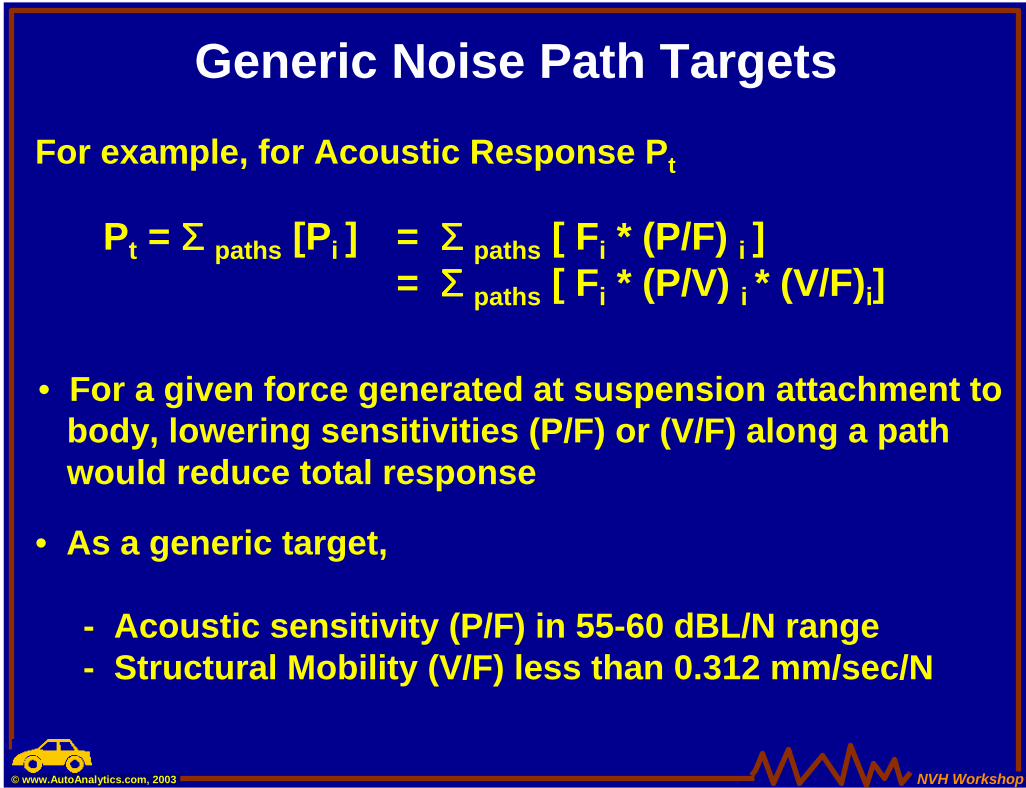
• For a given force generated at suspension attachment to body, lowering sensitivities (P/F) or (V/F) along a pathwould reduce total response
• As a generic target,
- Acoustic sensitivity (P/F) in 55-60 dBL/N range- Structural Mobility (V/F) less than 0.312 mm/sec/N
For example, for Acoustic Response Pt
Pt = ΣΣΣΣ paths [Pi ] = ΣΣΣΣ paths [ Fi * (P/F) i ] = ΣΣΣΣ paths [ Fi * (P/V) i * (V/F)i]
NVH Workshop© www.AutoAnalytics.com, 2003
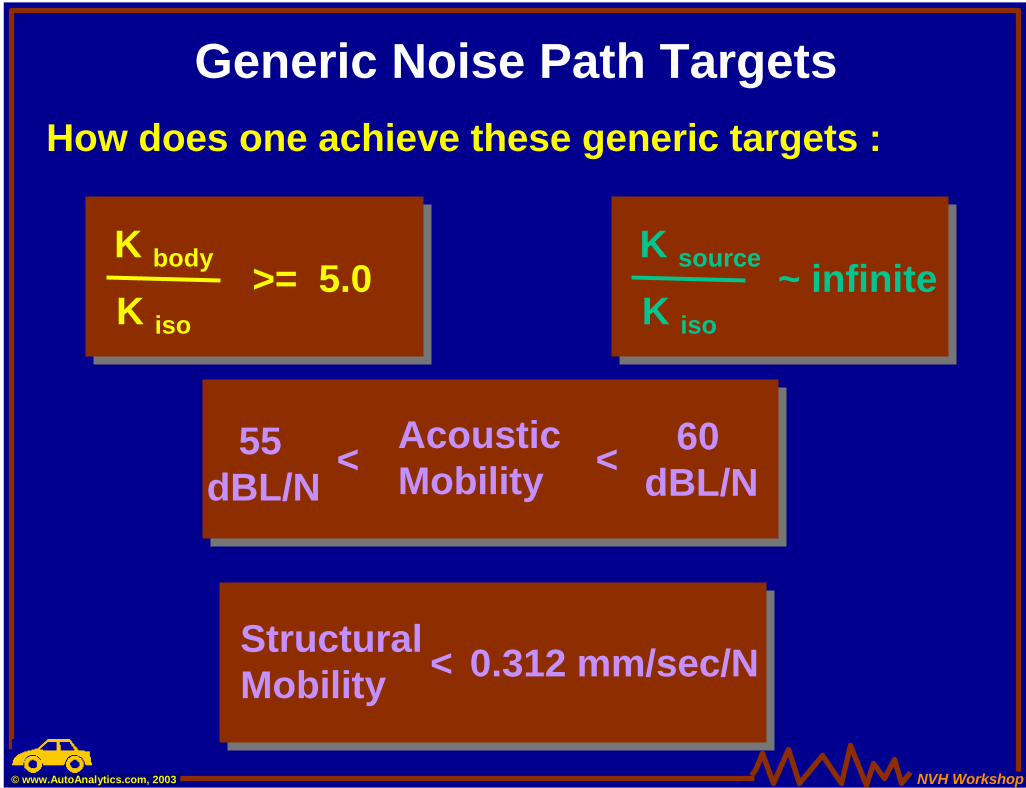
Generic Noise Path TargetsHow does one achieve these generic targets :
K iso
K body >= 5.0K iso
K source ~ infinite
AcousticMobility <<55
dBL/N60
dBL/N
StructuralMobility < 0.312 mm/sec/N
NVH Workshop© www.AutoAnalytics.com, 2003
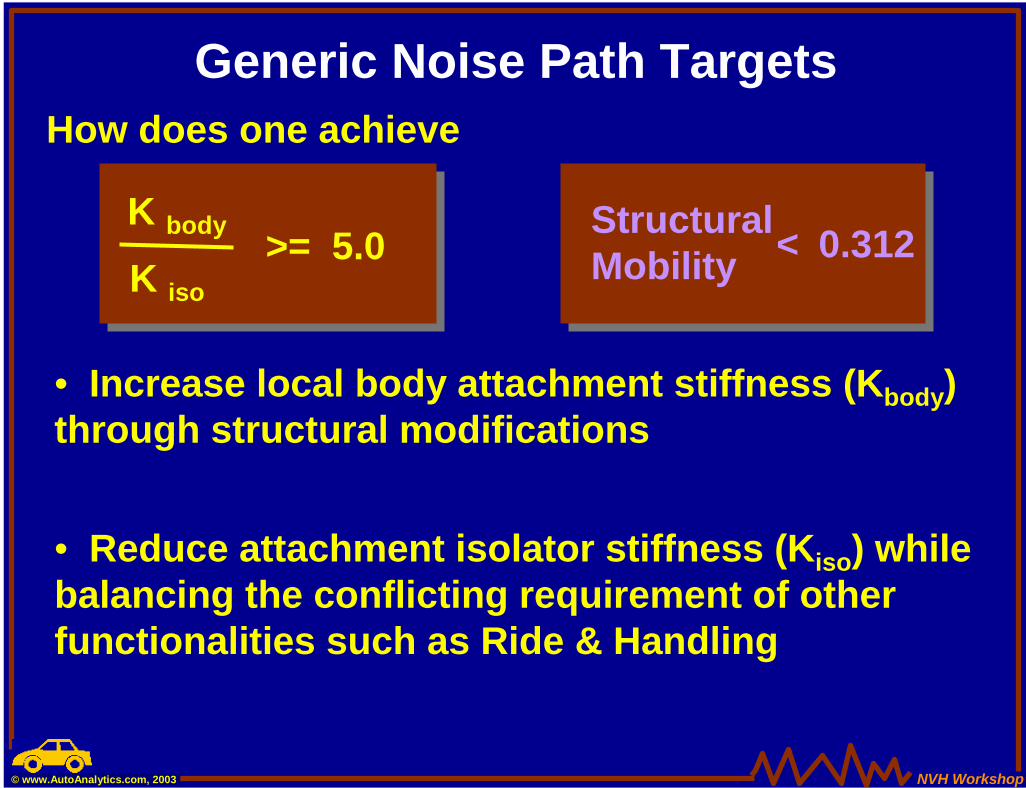
Generic Noise Path TargetsHow does one achieve
• Increase local body attachment stiffness (Kbody) through structural modifications
K iso
K body >= 5.0
• Reduce attachment isolator stiffness (Kiso) while balancing the conflicting requirement of other functionalities such as Ride & Handling
StructuralMobility < 0.312
NVH Workshop© www.AutoAnalytics.com, 2003
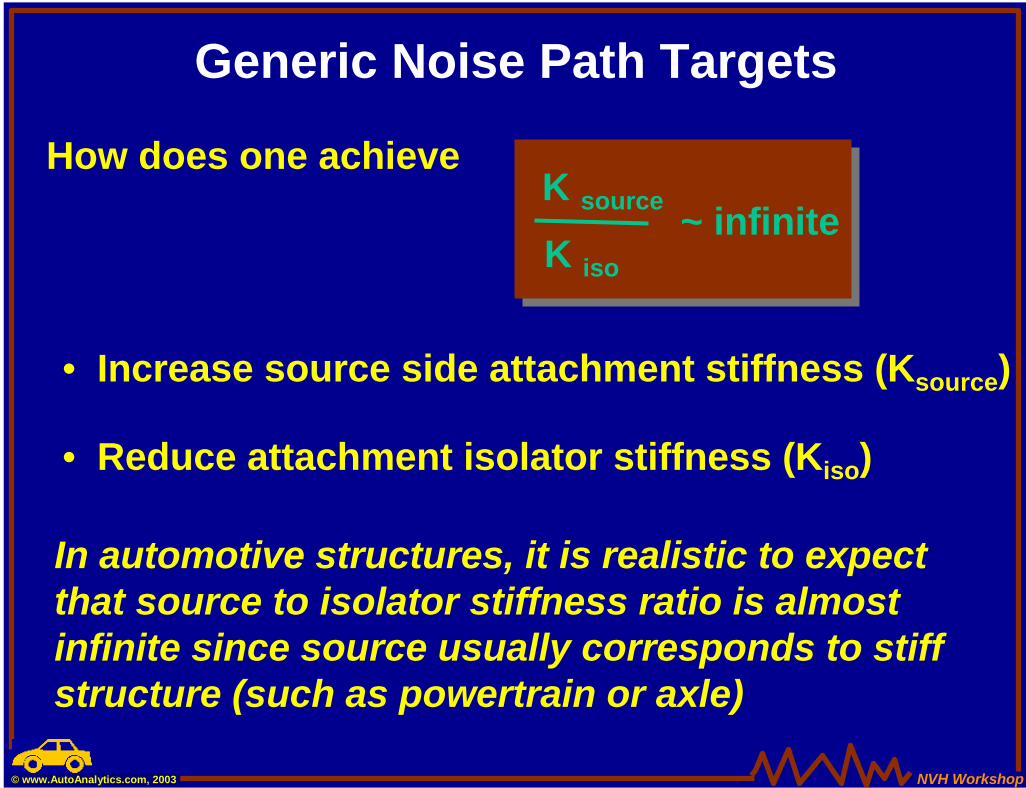
Generic Noise Path Targets
How does one achieve
• Increase source side attachment stiffness (Ksource)
• Reduce attachment isolator stiffness (Kiso)
K iso
K source ~ infinite
In automotive structures, it is realistic to expect that source to isolator stiffness ratio is almost infinite since source usually corresponds to stiff structure (such as powertrain or axle)
NVH Workshop© www.AutoAnalytics.com, 2003
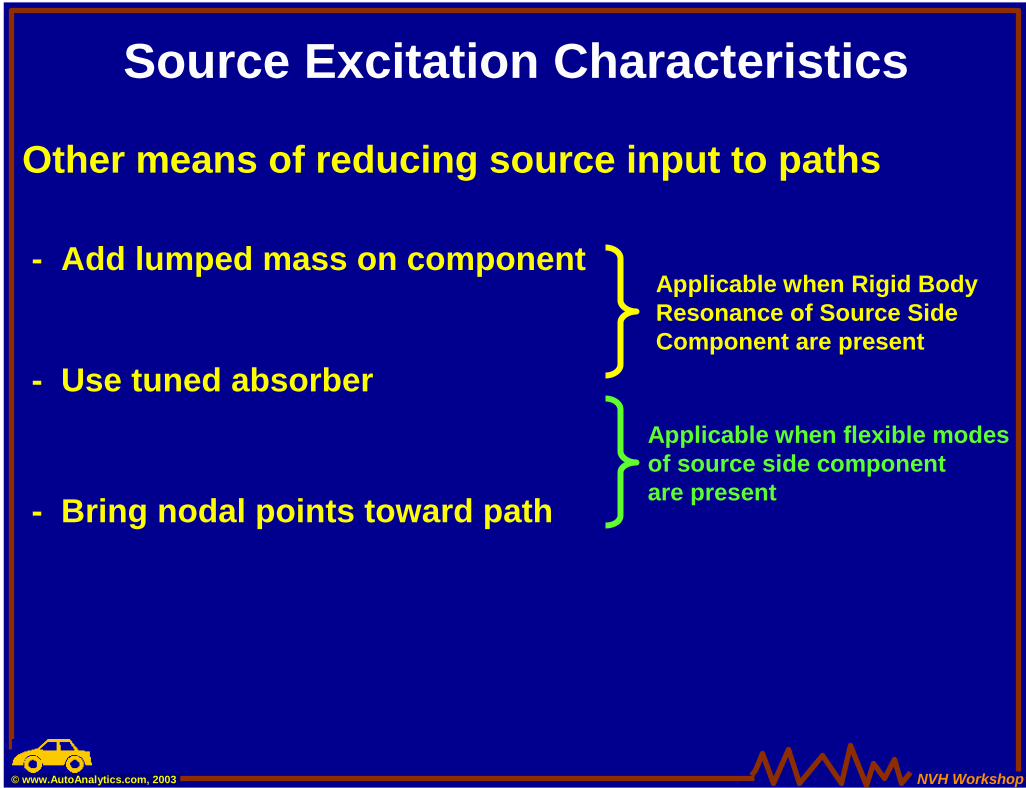
Source Excitation Characteristics
Other means of reducing source input to paths
- Add lumped mass on component
- Use tuned absorber
- Bring nodal points toward path
Applicable when Rigid BodyResonance of Source SideComponent are present
Applicable when flexible modesof source side componentare present
NVH Workshop© www.AutoAnalytics.com, 2003
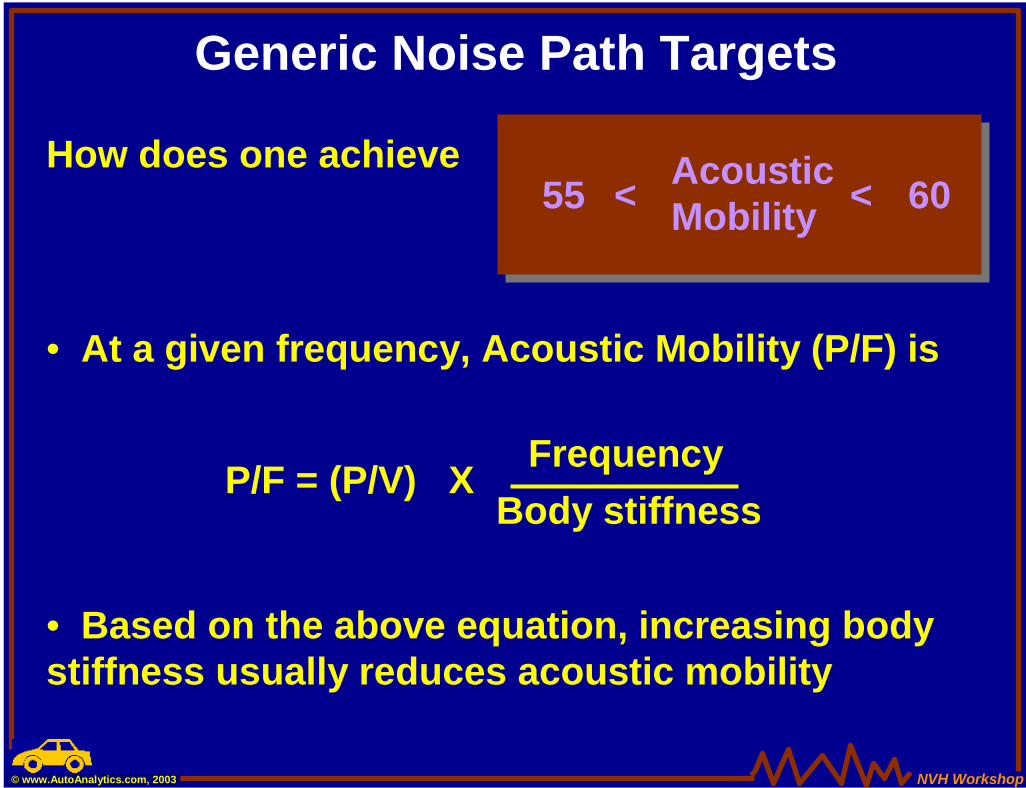
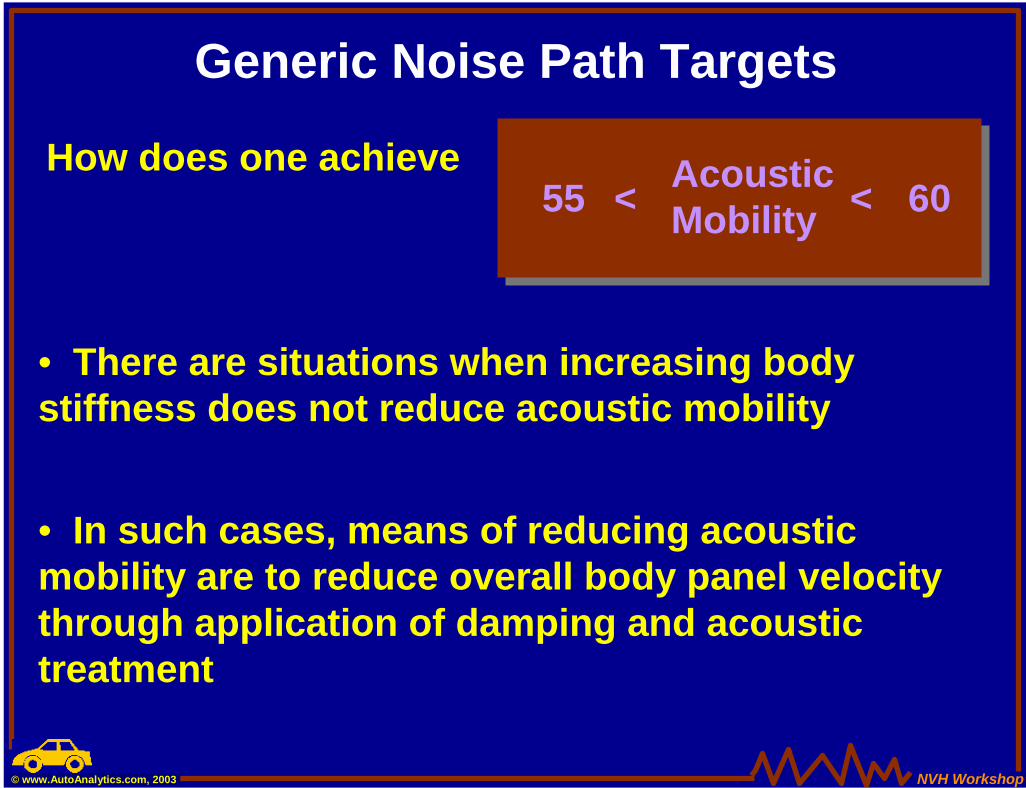
Generic Noise Path Targets
How does one achieve AcousticMobility <<55 60
• At a given frequency, Acoustic Mobility (P/F) is
P/F = (P/V) X FrequencyBody stiffness
• Based on the above equation, increasing body stiffness usually reduces acoustic mobility
NVH Workshop© www.AutoAnalytics.com, 2003
Generic Noise Path Targets
How does one achieve AcousticMobility <<55 60
• In such cases, means of reducing acoustic mobility are to reduce overall body panel velocity through application of damping and acoustic treatment
• There are situations when increasing body stiffness does not reduce acoustic mobility
NVH Workshop© www.AutoAnalytics.com, 2003
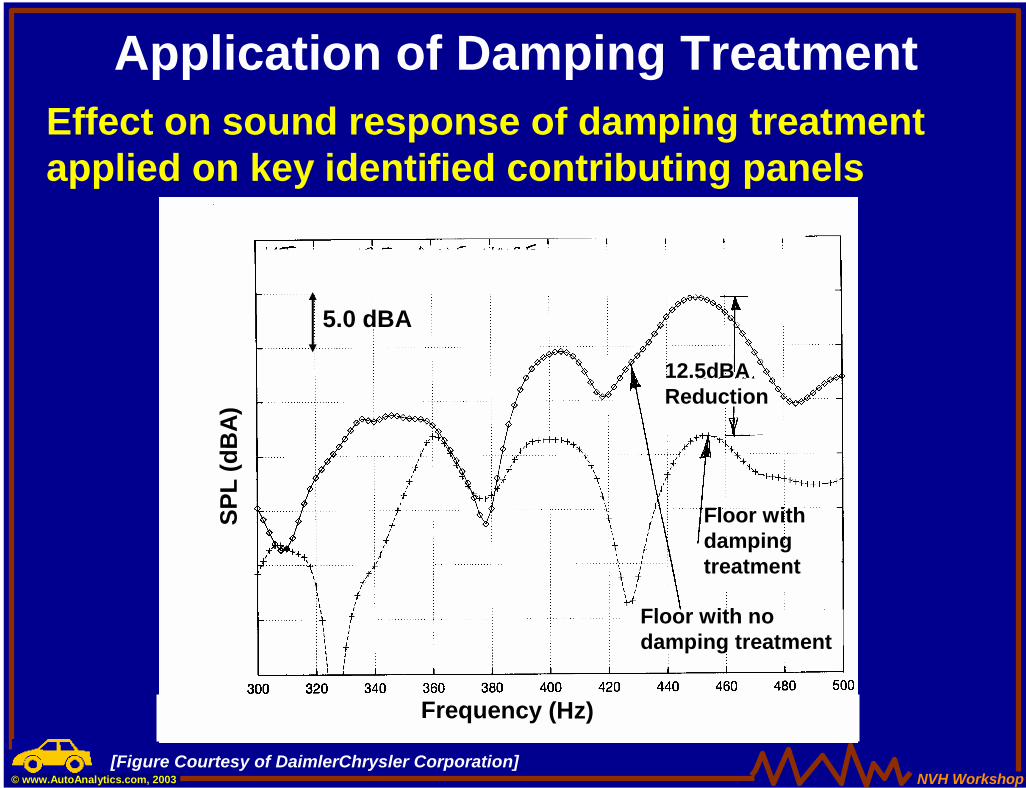
Application of Damping TreatmentEffect on sound response of damping treatment applied on key identified contributing panels
[Figure Courtesy of DaimlerChrysler Corporation]
12.5dBA Reduction
Floor with no damping treatment
Floor with damping treatment
Frequency (Hz)
5.0 dBA
SPL
(dB
A)
NVH Workshop© www.AutoAnalytics.com, 2003
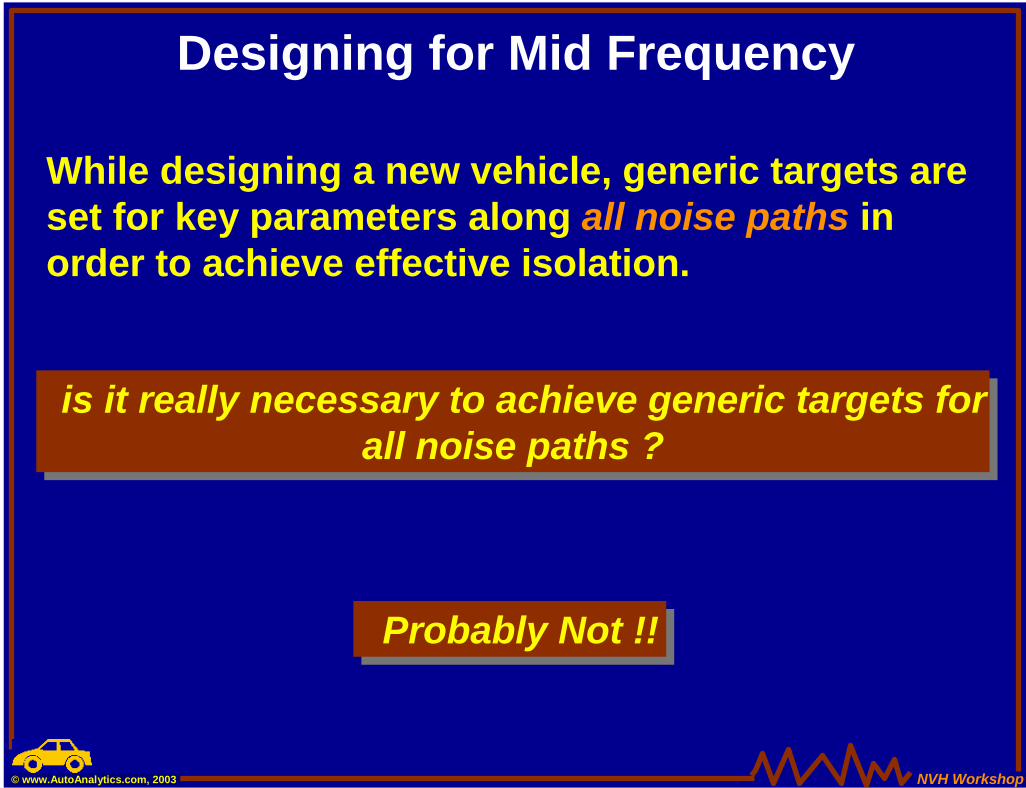
Designing for Mid Frequency
While designing a new vehicle, generic targets are set for key parameters along all noise paths in order to achieve effective isolation.
is it really necessary to achieve generic targets forall noise paths ?
is it really necessary to achieve generic targets forall noise paths ?
Probably Not !!Probably Not !!
NVH Workshop© www.AutoAnalytics.com, 2003
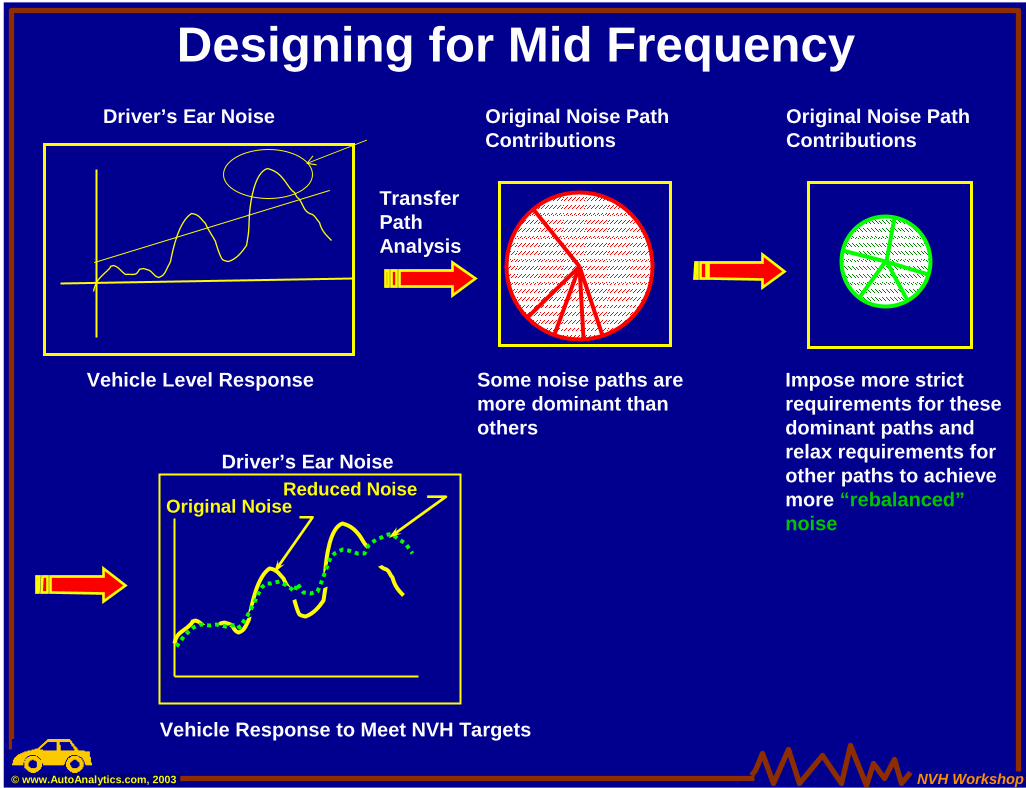
Designing for Mid FrequencyDriver’s Ear Noise
Vehicle Level Response
Original Noise Path Contributions
Transfer Path Analysis
Some noise paths are more dominant than others
Impose more strict requirements for these dominant paths and relax requirements for other paths to achieve more “rebalanced”noise
Original Noise Path Contributions
Driver’s Ear Noise
Vehicle Response to Meet NVH Targets
Original NoiseReduced Noise
NVH Workshop© www.AutoAnalytics.com, 2003
Designing for Mid Frequency
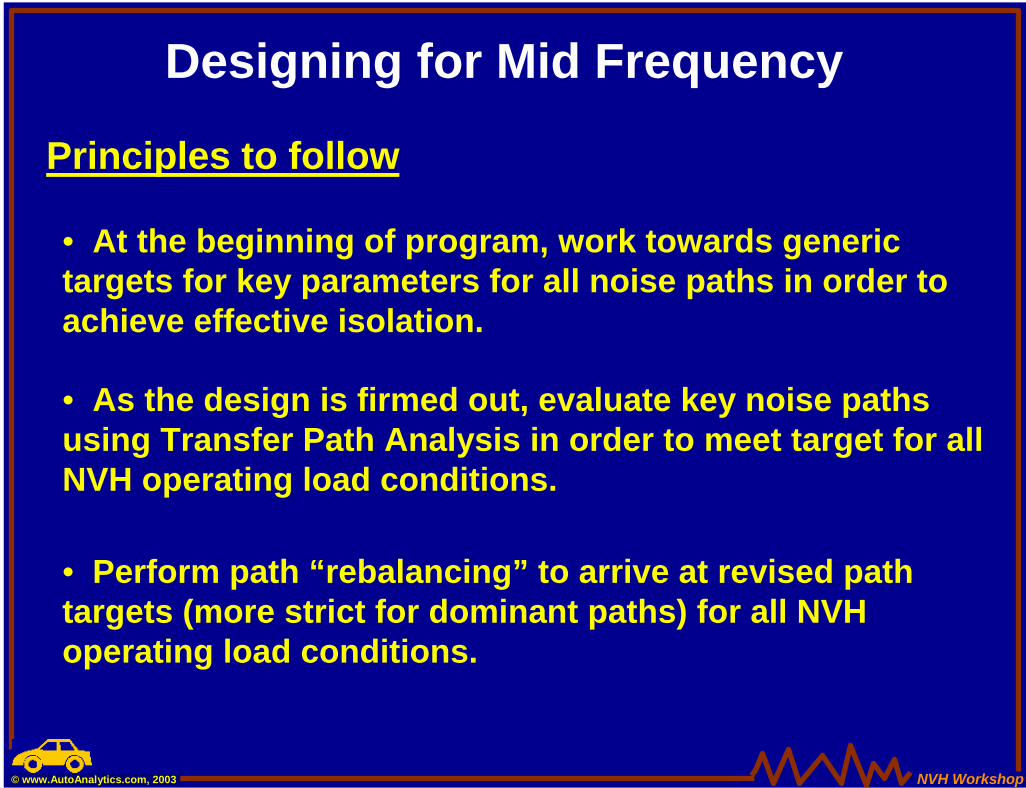
Principles to follow
• At the beginning of program, work towards generic targets for key parameters for all noise paths in order to achieve effective isolation.
• As the design is firmed out, evaluate key noise paths using Transfer Path Analysis in order to meet target for all NVH operating load conditions.
• Perform path “rebalancing” to arrive at revised path targets (more strict for dominant paths) for all NVH operating load conditions.
NVH Workshop© www.AutoAnalytics.com, 2003
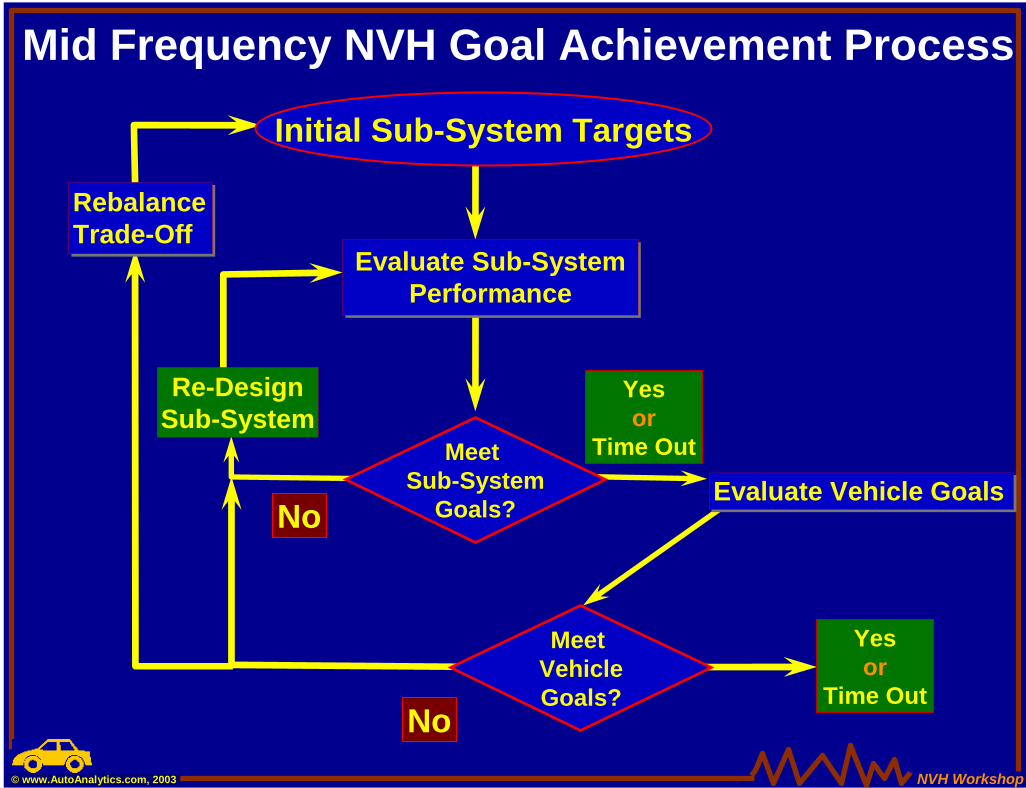
Yesor
Time Out
No
Re-DesignSub-System
Evaluate Sub-SystemPerformance
Evaluate Sub-SystemPerformance
No
Meet VehicleGoals?
RebalanceTrade-OffRebalanceTrade-Off
Meet Sub-System
Goals? Evaluate Vehicle GoalsEvaluate Vehicle Goals
Mid Frequency NVH Goal Achievement Process
Initial Sub-System Targets
Yesor
Time Out
NVH Workshop© www.AutoAnalytics.com, 2003
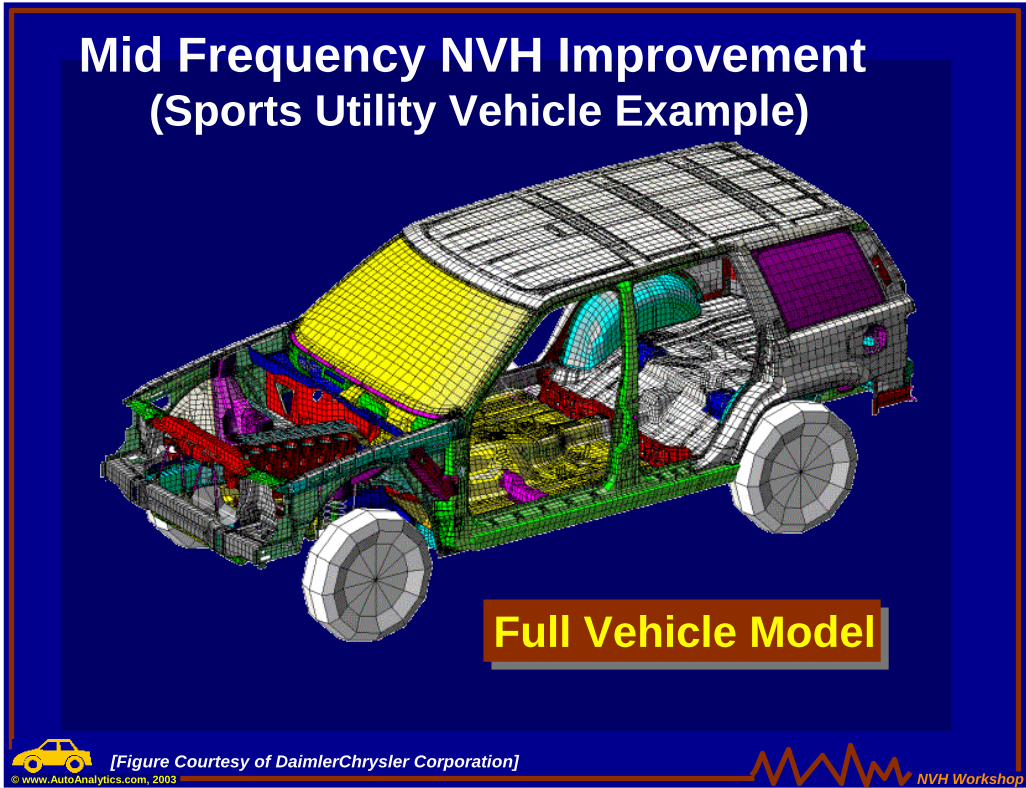
Mid Frequency NVH Improvement (Sports Utility Vehicle Example)
Full Vehicle ModelFull Vehicle Model
[Figure Courtesy of DaimlerChrysler Corporation]
NVH Workshop© www.AutoAnalytics.com, 2003
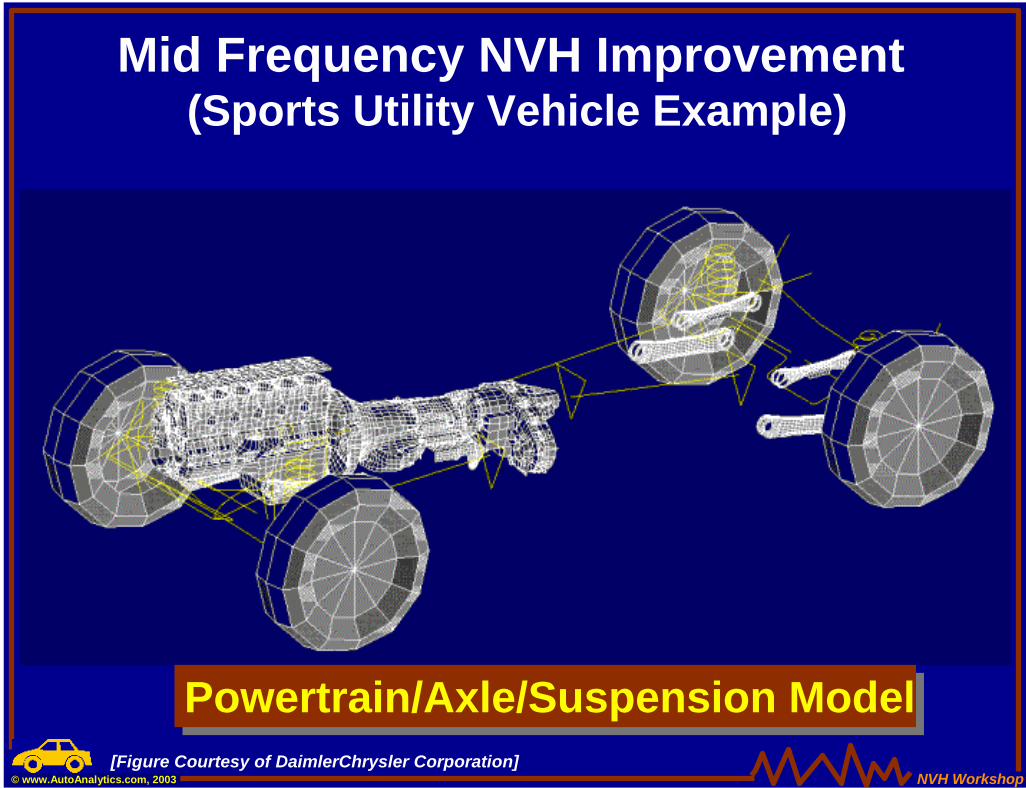
Mid Frequency NVH Improvement(Sports Utility Vehicle Example)
Powertrain/Axle/Suspension ModelPowertrain/Axle/Suspension Model[Figure Courtesy of DaimlerChrysler Corporation]
NVH Workshop© www.AutoAnalytics.com, 2003
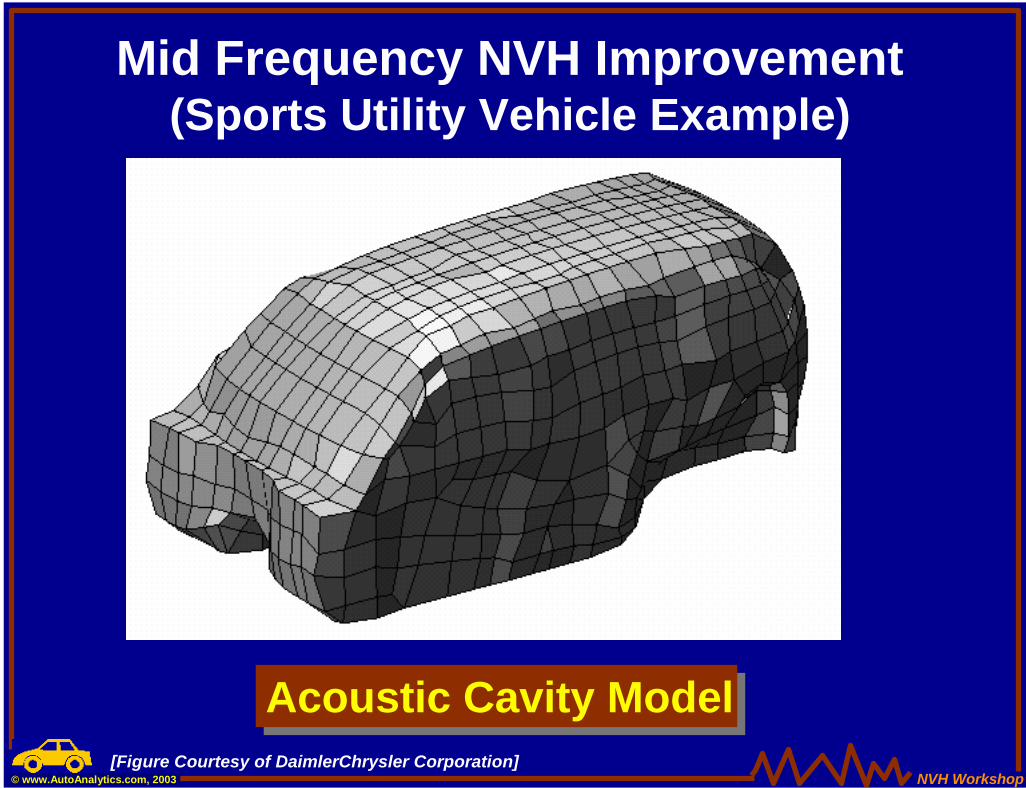
Mid Frequency NVH Improvement(Sports Utility Vehicle Example)
Acoustic Cavity ModelAcoustic Cavity Model[Figure Courtesy of DaimlerChrysler Corporation]
NVH Workshop© www.AutoAnalytics.com, 2003
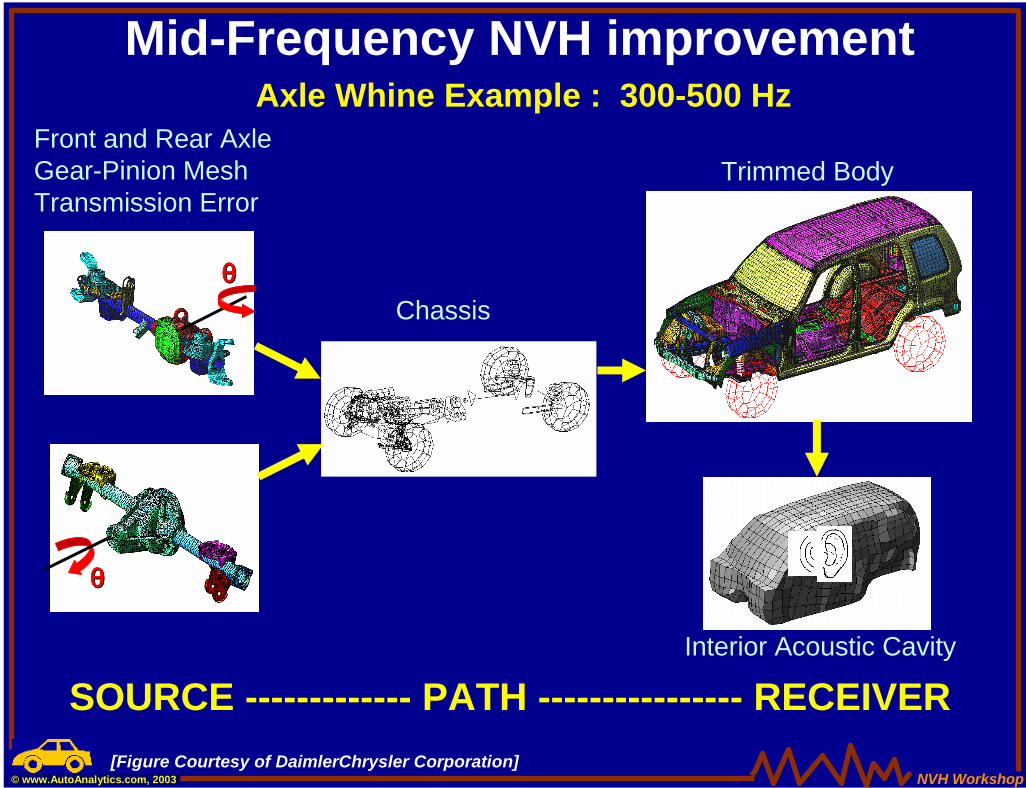
Mid-Frequency NVH improvementAxle Whine Example : 300-500 Hz
θθθθθθθθ
θθθθθθθθ
Trimmed Body
Interior Acoustic Cavity
Chassis
Front and Rear Axle Gear-Pinion Mesh Transmission Error
SOURCE ------------- PATH ---------------- RECEIVER[Figure Courtesy of DaimlerChrysler Corporation]
NVH Workshop© www.AutoAnalytics.com, 2003
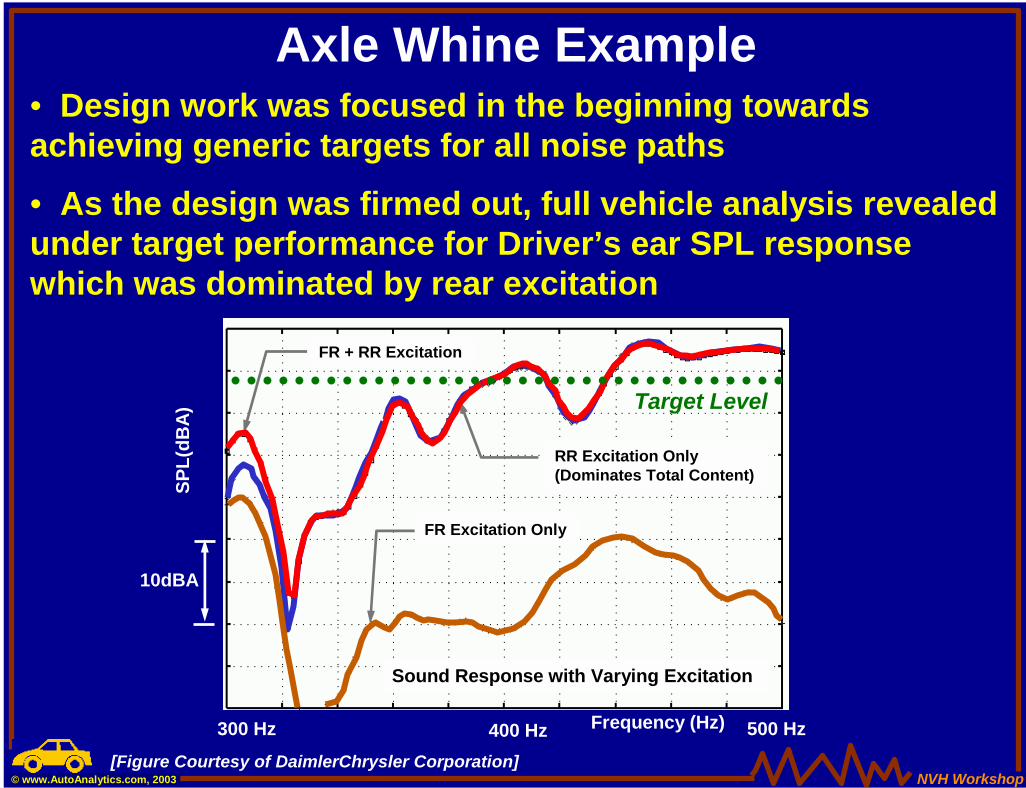
Axle Whine Example• Design work was focused in the beginning towards achieving generic targets for all noise paths
• As the design was firmed out, full vehicle analysis revealed under target performance for Driver’s ear SPL response which was dominated by rear excitation
[Figure Courtesy of DaimlerChrysler Corporation]
400 Hz 500 Hz300 Hz
10dBA
FR + RR Excitation
FR Excitation Only
RR Excitation Only(Dominates Total Content)
Target Level
Sound Response with Varying Excitation
Frequency (Hz)
SPL(
dBA
)
NVH Workshop© www.AutoAnalytics.com, 2003
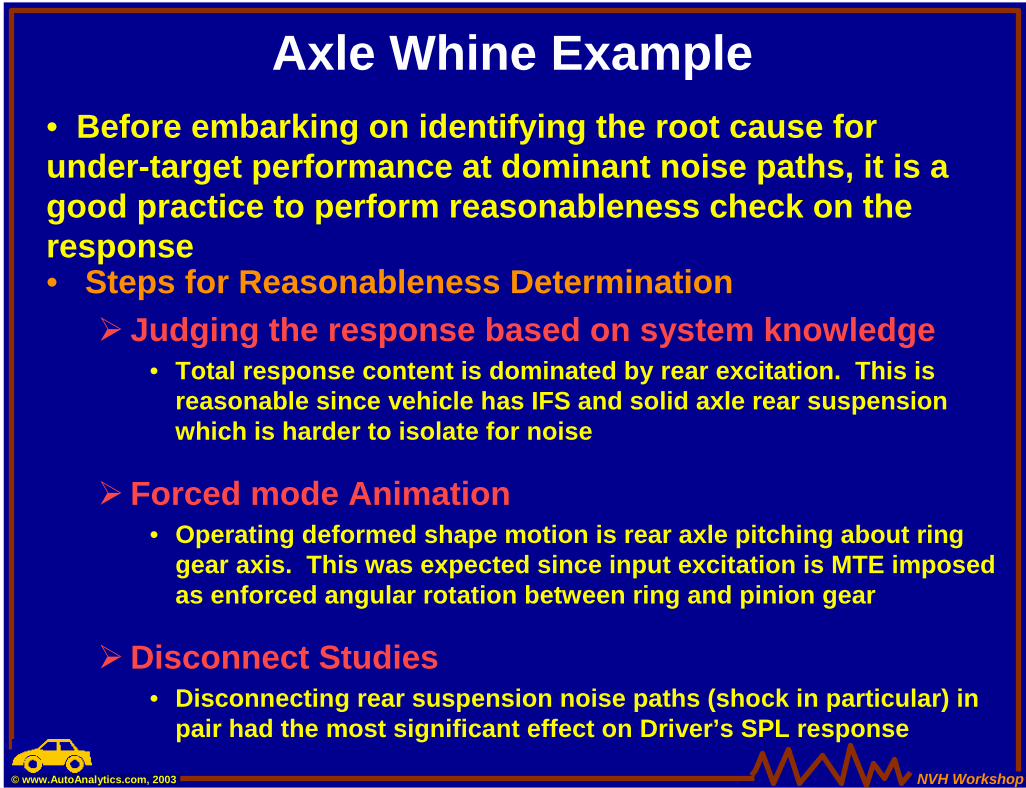
Axle Whine Example• Before embarking on identifying the root cause for under-target performance at dominant noise paths, it is a good practice to perform reasonableness check on the response• Steps for Reasonableness Determination
! Judging the response based on system knowledge• Total response content is dominated by rear excitation. This is
reasonable since vehicle has IFS and solid axle rear suspension which is harder to isolate for noise
! Forced mode Animation • Operating deformed shape motion is rear axle pitching about ring
gear axis. This was expected since input excitation is MTE imposed as enforced angular rotation between ring and pinion gear
!Disconnect Studies• Disconnecting rear suspension noise paths (shock in particular) in
pair had the most significant effect on Driver’s SPL response
NVH Workshop© www.AutoAnalytics.com, 2003
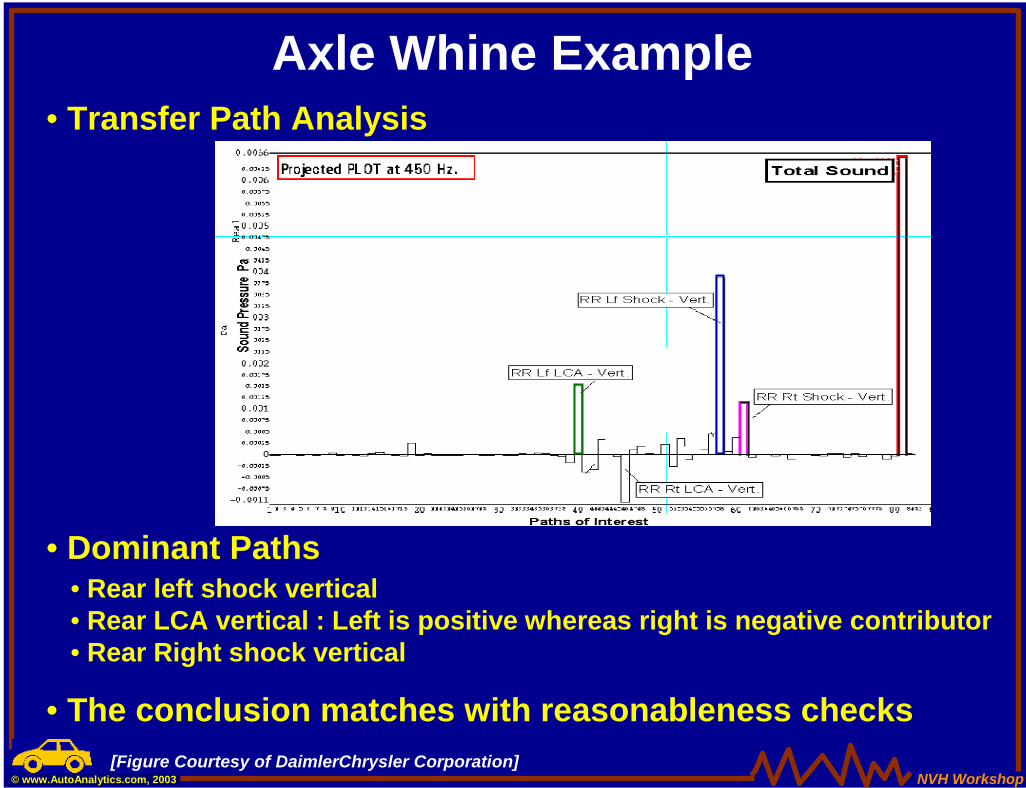
Axle Whine Example• Transfer Path Analysis
• Dominant Paths• Rear left shock vertical• Rear LCA vertical : Left is positive whereas right is negative contributor • Rear Right shock vertical
• The conclusion matches with reasonableness checks[Figure Courtesy of DaimlerChrysler Corporation]
NVH Workshop© www.AutoAnalytics.com, 2003
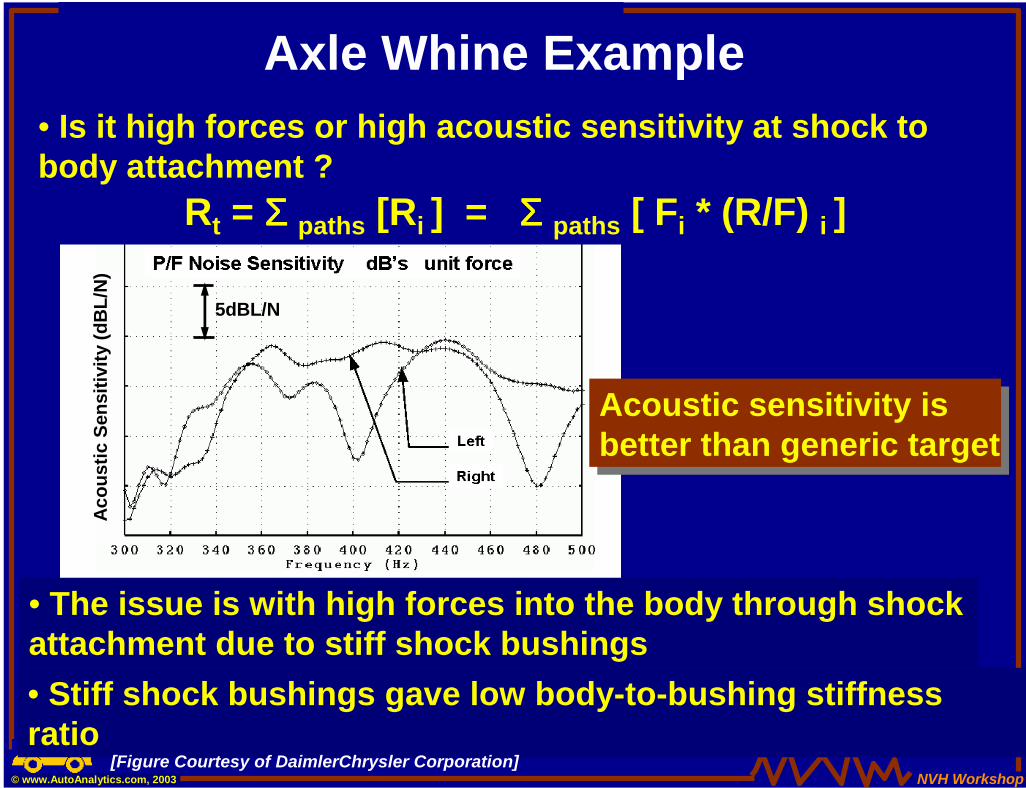
Rt = ΣΣΣΣ paths [Ri ] = ΣΣΣΣ paths [ Fi * (R/F) i ]
• Is it high forces or high acoustic sensitivity at shock to body attachment ?
Acoustic sensitivity is better than generic targetAcoustic sensitivity is better than generic target
Axle Whine Example
• The issue is with high forces into the body through shock attachment due to stiff shock bushings• Stiff shock bushings gave low body-to-bushing stiffness ratio
[Figure Courtesy of DaimlerChrysler Corporation]
5dBL/N
Aco
ustic
Sen
sitiv
ity (d
BL/
N)
NVH Workshop© www.AutoAnalytics.com, 2003
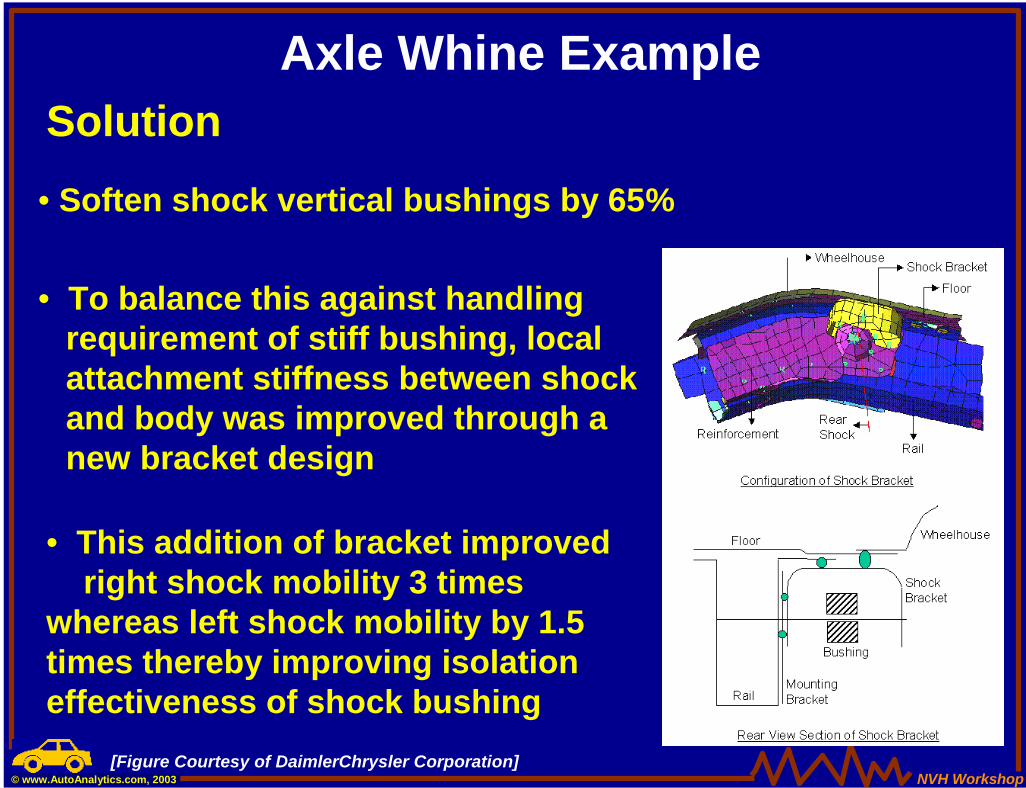
Axle Whine ExampleSolution• Soften shock vertical bushings by 65%
• To balance this against handlingrequirement of stiff bushing, local attachment stiffness between shock and body was improved through a new bracket design
• This addition of bracket improved right shock mobility 3 times
whereas left shock mobility by 1.5 times thereby improving isolation effectiveness of shock bushing
[Figure Courtesy of DaimlerChrysler Corporation]
NVH Workshop© www.AutoAnalytics.com, 2003
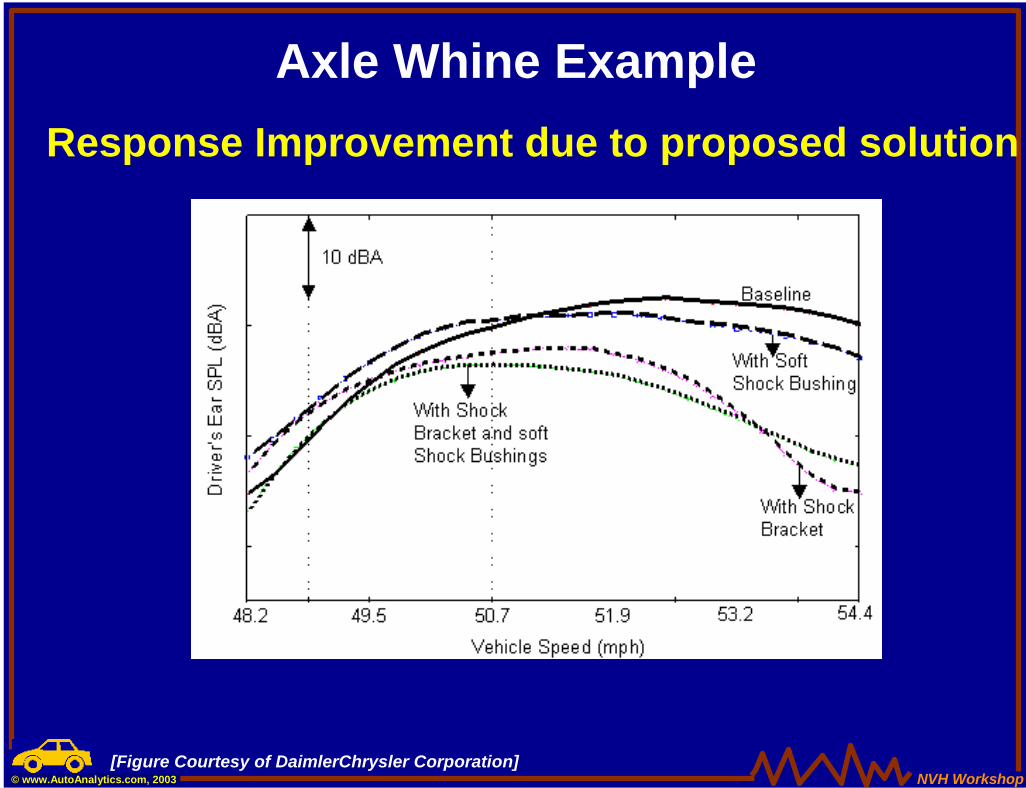
Axle Whine ExampleResponse Improvement due to proposed solution
[Figure Courtesy of DaimlerChrysler Corporation]
NVH Workshop© www.AutoAnalytics.com, 2003
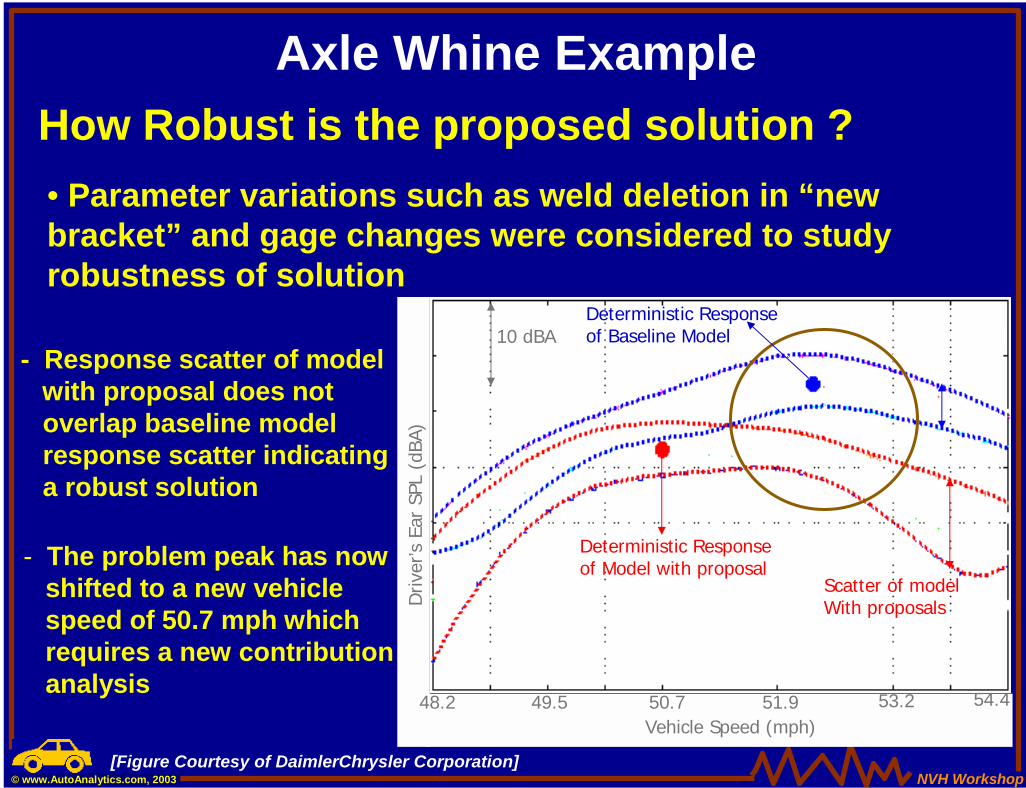
Axle Whine ExampleHow Robust is the proposed solution ?• Parameter variations such as weld deletion in “new bracket” and gage changes were considered to study robustness of solution
10 dBA
Deterministic Responseof Model with proposal
Scatter of modelWith proposals
Baseline ModelScatter
Vehicle Speed (mph)49.5 50.7 51.9 53.2 54.4
Driv
er’s
Ear
SPL
(dB
A)
48.2
Deterministic Responseof Baseline Model
- Response scatter of modelwith proposal does notoverlap baseline model response scatter indicatinga robust solution
- The problem peak has nowshifted to a new vehiclespeed of 50.7 mph whichrequires a new contributionanalysis
[Figure Courtesy of DaimlerChrysler Corporation]
NVH Workshop© www.AutoAnalytics.com, 2003
Final Remarks on Mid Frequency Analysis• Effective isolation at dominant noise paths is critical• Effective isolation at dominant noise paths is critical
• Reduced mobilities at body & source and softenedbushing are key for effective isolation
• Reduced mobilities at body & source and softenedbushing are key for effective isolation
• It is important to balance NVH requirement againstother functionalities (Ride and Handling, Impact)
• It is important to balance NVH requirement againstother functionalities (Ride and Handling, Impact)
• It is important to understand the robustness ofdesign recommendations
• It is important to understand the robustness ofdesign recommendations
• Other means of dealing high levels of source input(Tuned dampers, damping treatments, isolatorplacement at nodal locations) are also effective
• Other means of dealing high levels of source input(Tuned dampers, damping treatments, isolatorplacement at nodal locations) are also effective
NVH Workshop© www.AutoAnalytics.com, 2003
NVH Workshop Topic Outline• Introduction• Ride Balance in the Ride Range• NVH Load Conditions• Low Frequency Basics• Live Noise Attenuation Demo• Mid Frequency Basics• Utilization of Simulation Models• Closing Remarks Alan Duncan
NVH Workshop© www.AutoAnalytics.com, 2003
NVH Workshop Topic Outline• Introduction
• Ride Balance in the Ride Range
• NVH Load Conditions
• Low Frequency Basics
• Live Noise Attenuation Demo
• Mid Frequency Basics
• Utilization of Simulation Models
NVH Workshop© www.AutoAnalytics.com, 2003
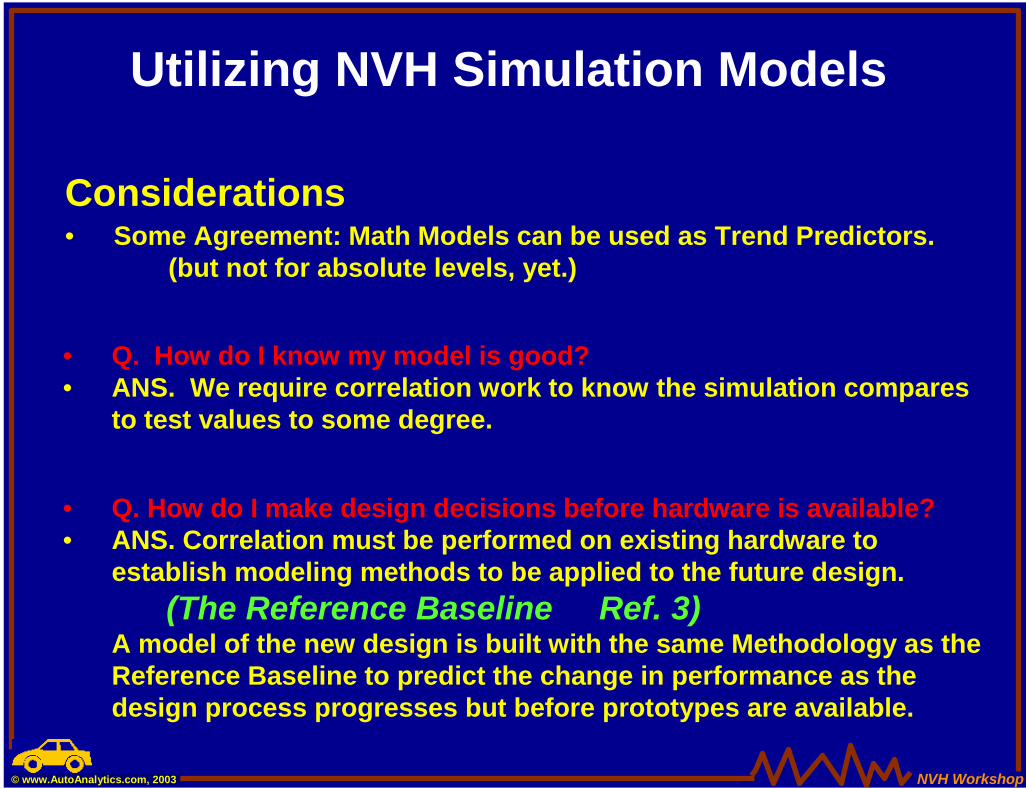
Utilizing NVH Simulation Models
Considerations• Some Agreement: Math Models can be used as Trend Predictors.
(but not for absolute levels, yet.)
• Q. How do I make design decisions before hardware is available?• ANS. Correlation must be performed on existing hardware to
establish modeling methods to be applied to the future design. (The Reference Baseline Ref. 3)
A model of the new design is built with the same Methodology as the Reference Baseline to predict the change in performance as the design process progresses but before prototypes are available.
• Q. How do I know my model is good?• ANS. We require correlation work to know the simulation compares
to test values to some degree.
NVH Workshop© www.AutoAnalytics.com, 2003
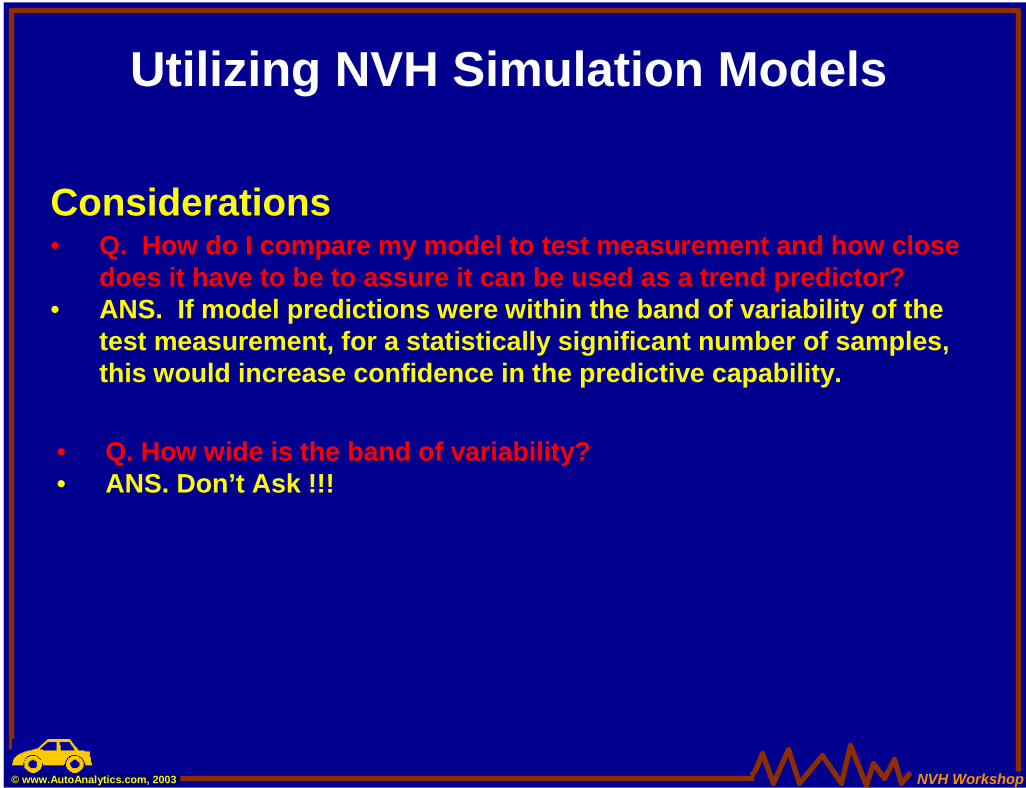
Utilizing NVH Simulation Models
Considerations• Q. How do I compare my model to test measurement and how close
does it have to be to assure it can be used as a trend predictor?• ANS. If model predictions were within the band of variability of the
test measurement, for a statistically significant number of samples, this would increase confidence in the predictive capability.
• Q. How wide is the band of variability?• ANS. Don’t Ask !!!
NVH Workshop© www.AutoAnalytics.com, 2003
Discussion of Product Variability
Topics
• Kompella and Bernhard Observations
• Freyman NVH Scatter Results
• Model Confidence Criteria
• Conclusions
NVH Workshop© www.AutoAnalytics.com, 2003
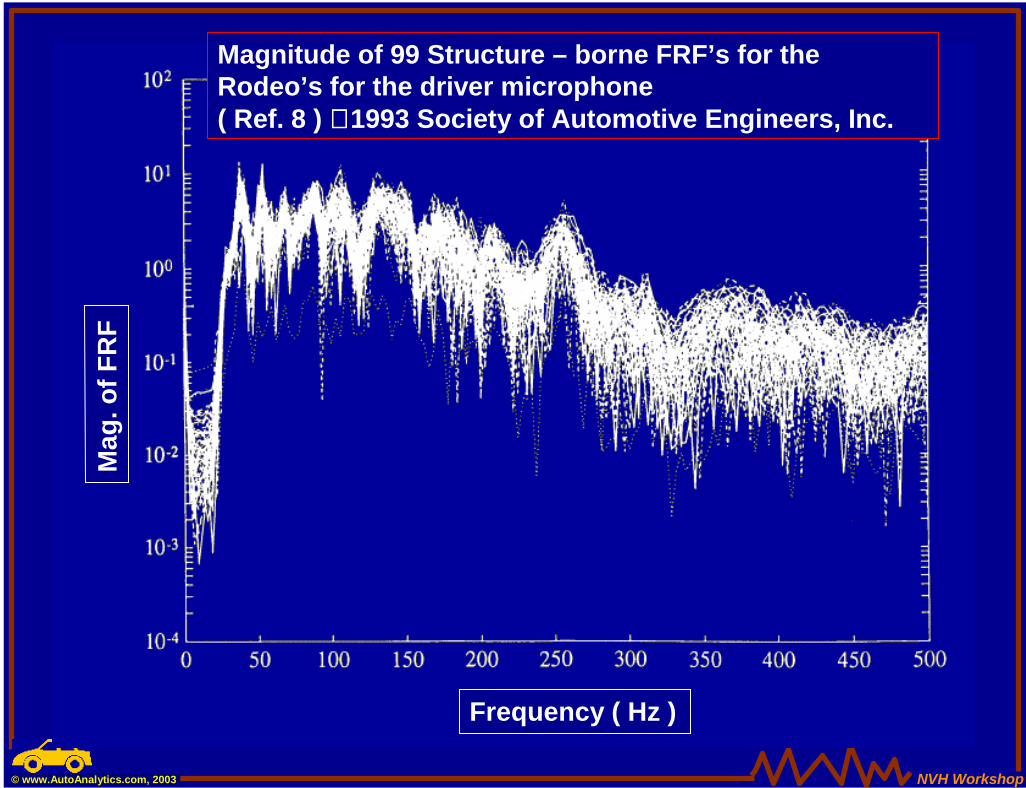
Frequency ( Hz )
Mag
. of F
RF
Magnitude of 99 Structure – borne FRF’s for theRodeo’s for the driver microphone( Ref. 8 ) 1993 Society of Automotive Engineers, Inc.
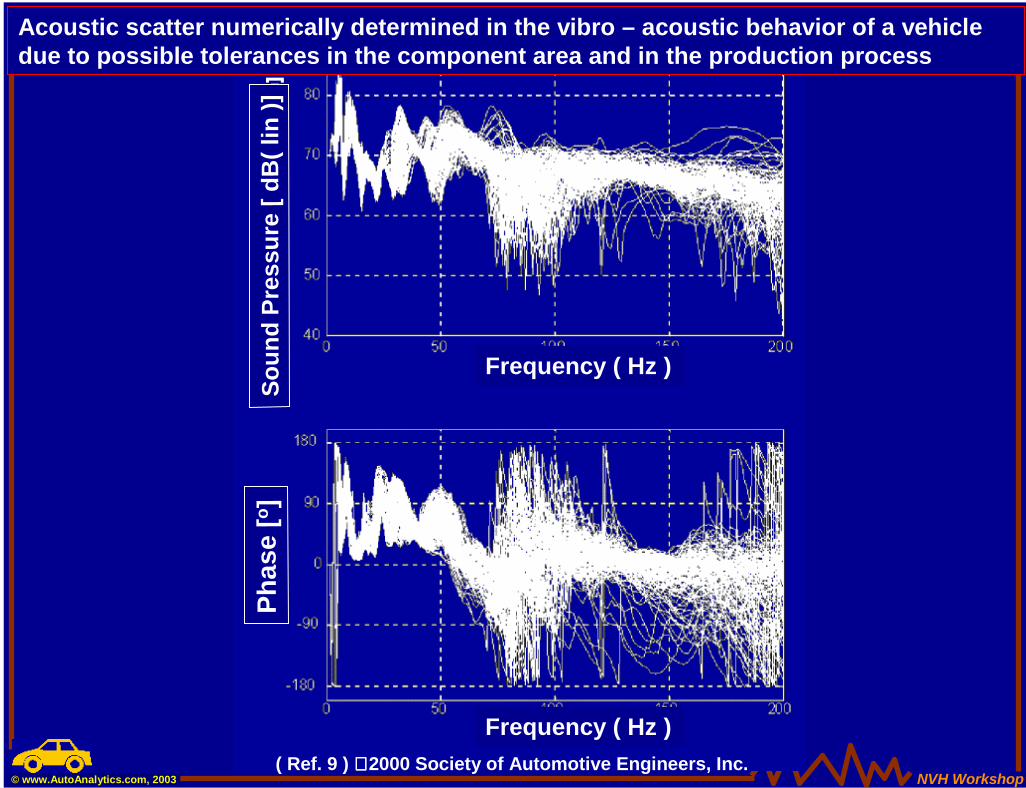
NVH Workshop© www.AutoAnalytics.com, 2003( Ref. 9 ) 2000 Society of Automotive Engineers, Inc.
Frequency ( Hz )
Soun
d Pr
essu
re [
dB( l
in)]
Frequency ( Hz )
Phas
e [o
]
Acoustic scatter numerically determined in the vibro – acoustic behavior of a vehicle due to possible tolerances in the component area and in the production process
NVH Workshop© www.AutoAnalytics.com, 2003
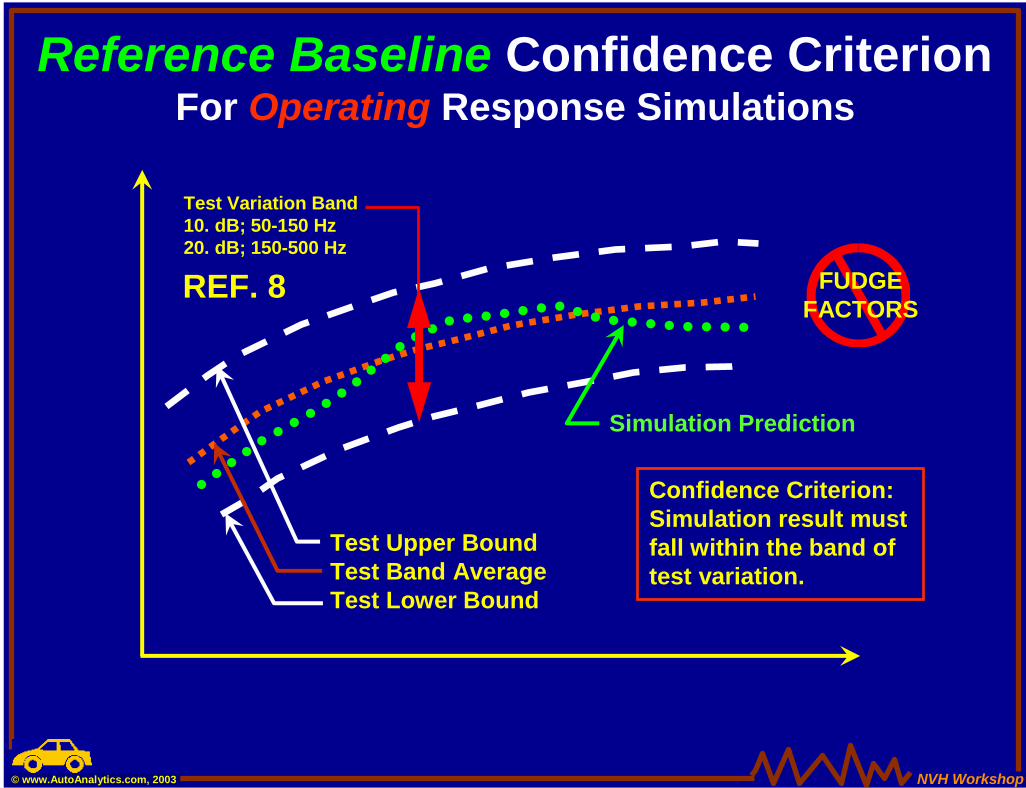
Reference Baseline Confidence CriterionFor Operating Response Simulations
Test Upper BoundTest Band AverageTest Lower Bound
Test Variation Band10. dB; 50-150 Hz20. dB; 150-500 Hz
REF. 8
Confidence Criterion:Simulation result mustfall within the band oftest variation.
Simulation Prediction
FUDGEFACTORS
NVH Workshop© www.AutoAnalytics.com, 2003
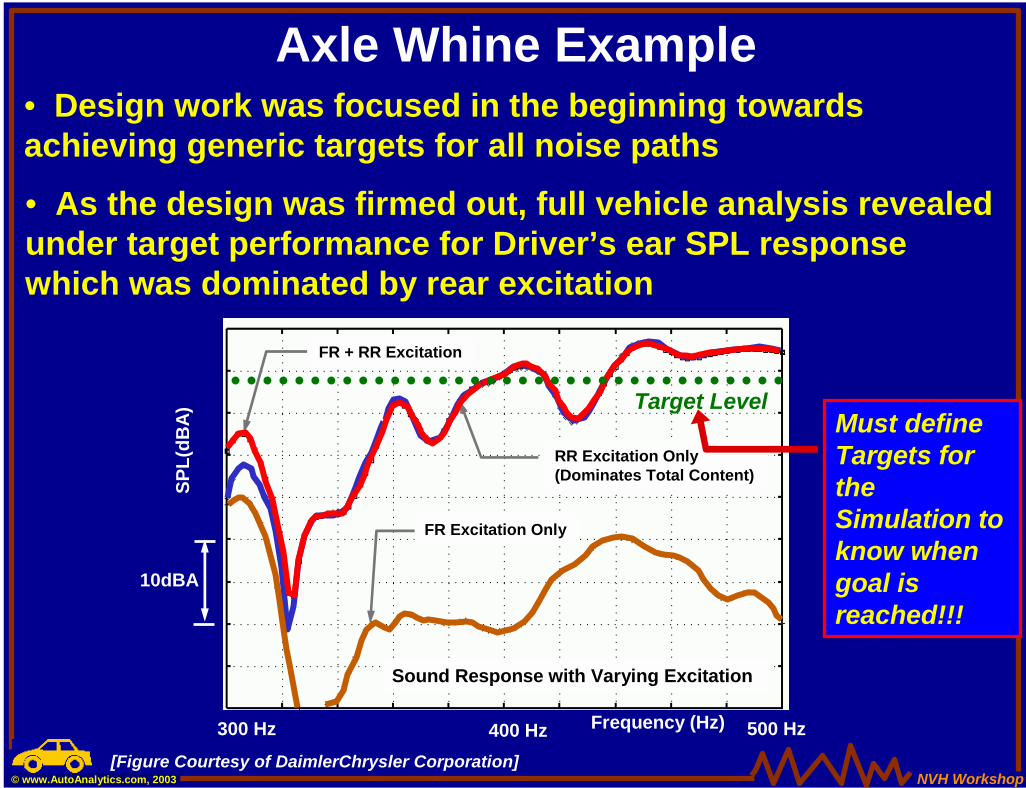
Axle Whine Example• Design work was focused in the beginning towards achieving generic targets for all noise paths
• As the design was firmed out, full vehicle analysis revealed under target performance for Driver’s ear SPL response which was dominated by rear excitation
[Figure Courtesy of DaimlerChrysler Corporation]
400 Hz 500 Hz300 Hz
10dBA
FR + RR Excitation
FR Excitation Only
RR Excitation Only(Dominates Total Content)
Target Level
Sound Response with Varying Excitation
Frequency (Hz)
SPL(
dBA
)
Must define Targets for the Simulation to know when goal is reached!!!
NVH Workshop© www.AutoAnalytics.com, 2003
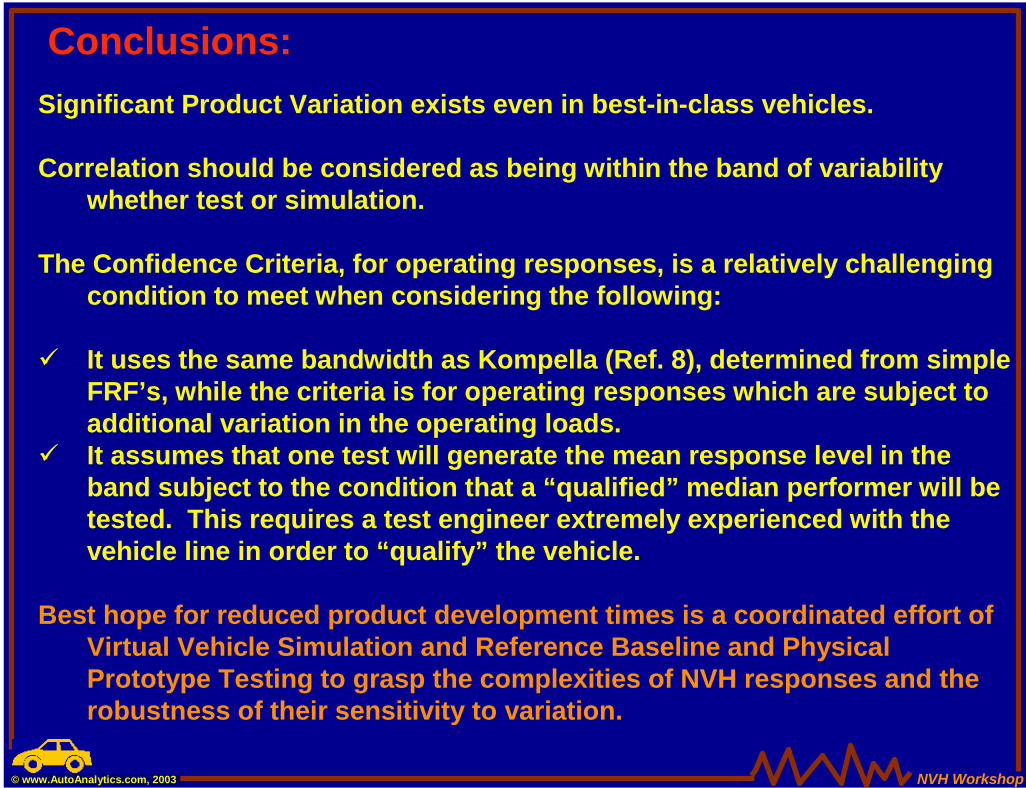
Conclusions:Significant Product Variation exists even in best-in-class vehicles.
Correlation should be considered as being within the band of variability whether test or simulation.
The Confidence Criteria, for operating responses, is a relatively challenging condition to meet when considering the following:
" It uses the same bandwidth as Kompella (Ref. 8), determined from simple FRF’s, while the criteria is for operating responses which are subject to additional variation in the operating loads.
" It assumes that one test will generate the mean response level in the band subject to the condition that a “qualified” median performer will be tested. This requires a test engineer extremely experienced with the vehicle line in order to “qualify” the vehicle.
Best hope for reduced product development times is a coordinated effort of Virtual Vehicle Simulation and Reference Baseline and Physical Prototype Testing to grasp the complexities of NVH responses and the robustness of their sensitivity to variation.
NVH Workshop© www.AutoAnalytics.com, 2003
Rideand
Handling
NVH Durability
ImpactCrashWorthiness
Competing Vehicle Design Disciplines
NVH Workshop© www.AutoAnalytics.com, 2003
The Fundamental Secret ofStructure Borne
NVH Performance
The Fundamental Secret ofStructure Borne
NVH Performance
Revealed here tonight !

NVH Workshop© www.AutoAnalytics.com, 2003
Fundamental Secret to Making Money
in the Stock Market
Buy Low and Sell High !
NVH Workshop© www.AutoAnalytics.com, 2003
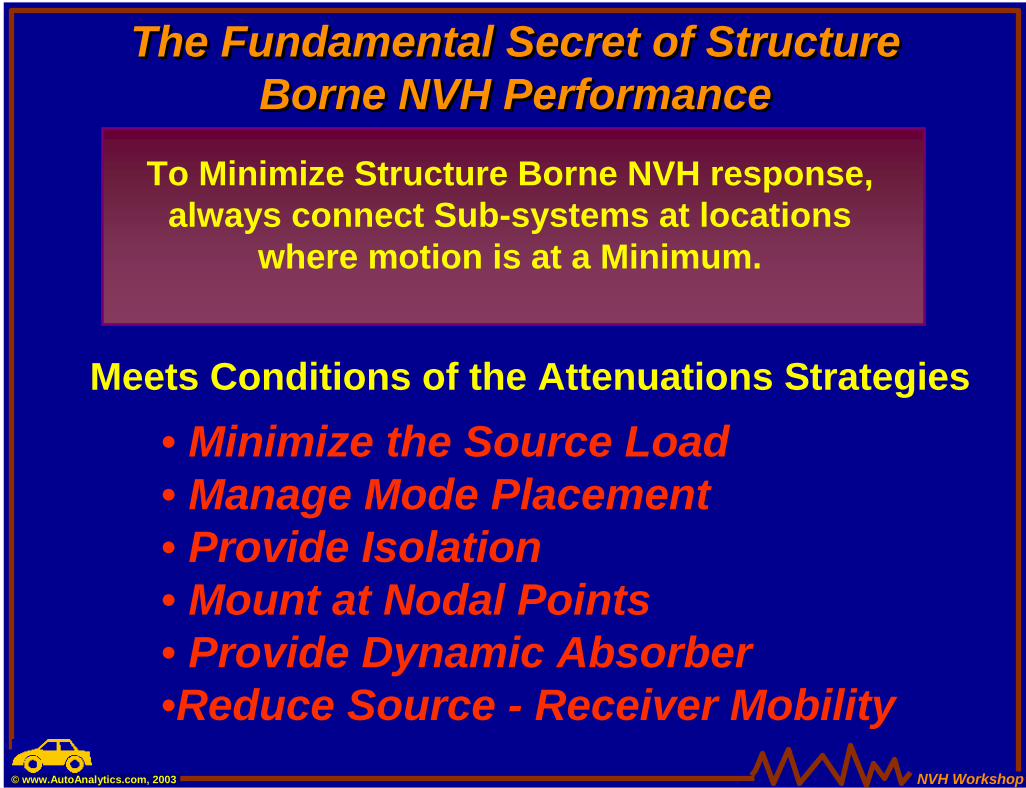
The Fundamental Secret of Structure Borne NVH Performance
The Fundamental Secret of Structure The Fundamental Secret of Structure Borne NVH PerformanceBorne NVH Performance
Meets Conditions of the Attenuations Strategies• Minimize the Source Load• Manage Mode Placement• Provide Isolation• Mount at Nodal Points• Provide Dynamic Absorber•Reduce Source - Receiver Mobility
To Minimize Structure Borne NVH response, always connect Sub-systems at locations
where motion is at a Minimum.
NVH Workshop© www.AutoAnalytics.com, 2003
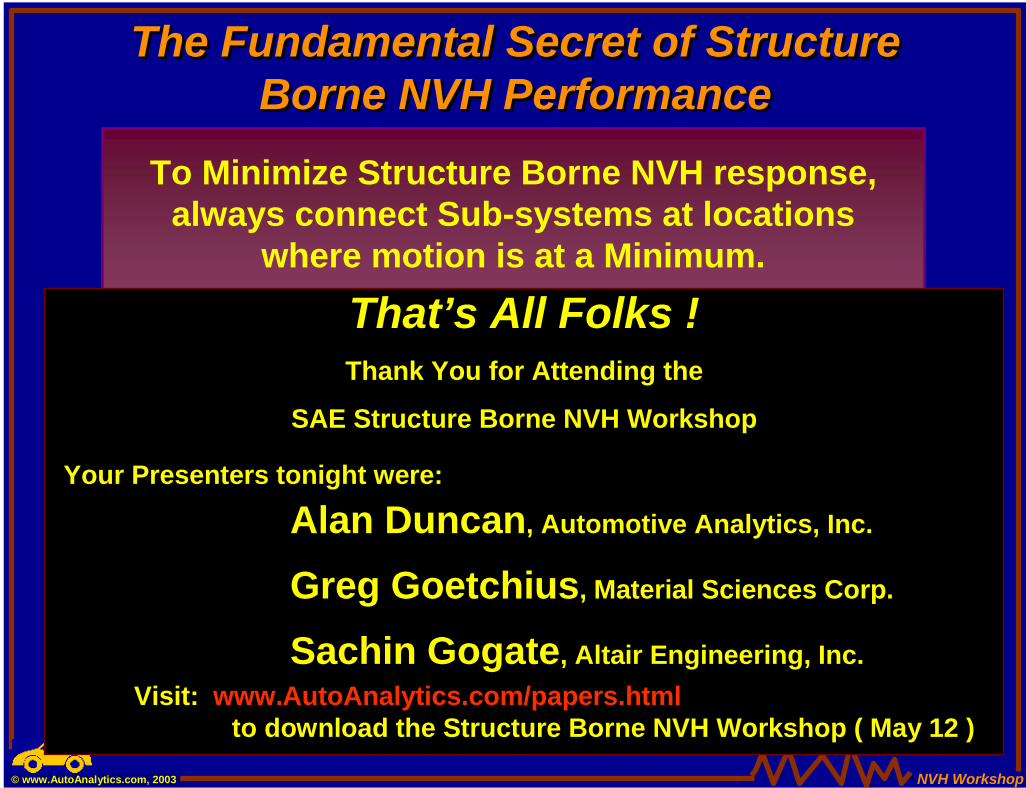
The Fundamental Secret of Structure Borne NVH Performance
The Fundamental Secret of Structure The Fundamental Secret of Structure Borne NVH PerformanceBorne NVH Performance
Meets Conditions of the Attenuations Strategies• Minimize the Source Load• Manage Mode Placement• Provide Isolation• Mount at Nodal Points• Provide Dynamic Absorber•Reduce Source - Receiver Mobility
That’s All Folks !Thank You for Attending the
SAE Structure Borne NVH Workshop
Your Presenters tonight were:
Alan Duncan, Automotive Analytics, Inc.
Greg Goetchius, Material Sciences Corp.
Sachin Gogate, Altair Engineering, Inc.Visit: www.AutoAnalytics.com/papers.html
to download the Structure Borne NVH Workshop ( May 12 )
To Minimize Structure Borne NVH response, always connect Sub-systems at locations
where motion is at a Minimum.