Structural Variation and Medical Genomics Benjamin...
22
Structural Variation and Medical Genomics Benjamin J. Raphael 1 Introduction The decade since the assembly of the human genome has witnessed dramatic advances in understanding the genetic differences that distinguish individual humans and that are responsible for specific traits. Genome- wide association studies (GWAS) in humans have identified common germline, or inherited, DNA variants that are associated with various common human diseases, including diabetes, heart disease, etc. At the same time, cancer genome sequencing studies have cataloged numerous somatic mutations that arise during the lifetime of an individual and that drive cancer progression. These successes are ushering in the era of personalized medicine, where treatment for a disease is tailored to the genetic characteristics of the individual. Despite this progress, significant hurdles remain in achieving a comprehensive understanding of the genetic basis of human traits and disease. The germline variants discovered by GWAS thus far explain only a small fraction of the heritability of many traits, and this “missing heritability” gap [20] is a major bottleneck for future GWAS. The somatic mutations measured in cancer genomes are very heterogeneous, with relatively few mutations that are shared by large numbers of cancer patients, even those with the same (sub)type of cancer. This mutational heterogeneity complicates efforts to distinguish functional mutations that drive cancer development from random passenger mutations. Comprehensive studies of the genetic basis of disease require the measurement of all variants that dis- tinguish individual genomes. Most GWAS thus far focused on the measurement of single nucleotide poly- morphisms (SNPs), single nucleotide differences between individual genomes. In the past few years, it has become clear that germline variants occupy a continuum of scales ranging from single nucleotide polymor- phisms (SNPs) to larger structural variants (SVs) – duplications, deletions, inversions, and translocations of large (> 100 nucleotides) blocks of DNA sequence. Similarly, current GWAS focused attention on common SNPs, those whose frequency in the population was at least 5%. This restriction was part of the “common disease, common variant” hypothesis which posits that some fraction of susceptibility to common diseases results from germline variants that are common in the population. However, this restriction was also dic- tated by technological limitations, as it was not cost effective to measure all variants in the large number of individual genomes that are necessary to perform a GWAS. Beginning the mid-2000’s, next-generation DNA sequencing technologies became commercially avail- able from companies such as 454 Life Sciences, Illumina, and Applied Biosystems (now Life Technologies). These and other technologies continue to advance at a breathtaking pace with the result that the cost of DNA sequencing has declined by several orders of magnitude in the past decade. These technologies provide an unprecedented opportunity to measure all variants; germline and somatic; SNPs and SVs, in both normal and cancer genomes. In this chapter, we discuss the application of these sequencing technologies in medical genomics, and specifically on the characterization of structural variation that was largely absent from earlier GWAS. In this 1
Transcript of Structural Variation and Medical Genomics Benjamin...

Structural Variation and Medical GenomicsBenjamin J. Raphael
1 Introduction
The decade since the assembly of the human genome has witnessed dramatic advances in understanding the
genetic differences that distinguish individual humans and that are responsible for specific traits. Genome-
wide association studies (GWAS) in humans have identified common germline, or inherited, DNA variants
that are associated with various common human diseases, including diabetes, heart disease, etc. At the
same time, cancer genome sequencing studies have cataloged numerous somatic mutations that arise during
the lifetime of an individual and that drive cancer progression. These successes are ushering in the era
of personalized medicine, where treatment for a disease is tailored to the genetic characteristics of the
individual.
Despite this progress, significant hurdles remain in achieving a comprehensive understanding of the
genetic basis of human traits and disease. The germline variants discovered by GWAS thus far explain
only a small fraction of the heritability of many traits, and this “missing heritability” gap [20] is a major
bottleneck for future GWAS. The somatic mutations measured in cancer genomes are very heterogeneous,
with relatively few mutations that are shared by large numbers of cancer patients, even those with the same
(sub)type of cancer. This mutational heterogeneity complicates efforts to distinguish functional mutations
that drive cancer development from random passenger mutations.
Comprehensive studies of the genetic basis of disease require the measurement of all variants that dis-
tinguish individual genomes. Most GWAS thus far focused on the measurement of single nucleotide poly-
morphisms (SNPs), single nucleotide differences between individual genomes. In the past few years, it has
become clear that germline variants occupy a continuum of scales ranging from single nucleotide polymor-
phisms (SNPs) to larger structural variants (SVs) – duplications, deletions, inversions, and translocations of
large (> 100 nucleotides) blocks of DNA sequence. Similarly, current GWAS focused attention on common
SNPs, those whose frequency in the population was at least 5%. This restriction was part of the “common
disease, common variant” hypothesis which posits that some fraction of susceptibility to common diseases
results from germline variants that are common in the population. However, this restriction was also dic-
tated by technological limitations, as it was not cost effective to measure all variants in the large number of
individual genomes that are necessary to perform a GWAS.
Beginning the mid-2000’s, next-generation DNA sequencing technologies became commercially avail-
able from companies such as 454 Life Sciences, Illumina, and Applied Biosystems (now Life Technologies).
These and other technologies continue to advance at a breathtaking pace with the result that the cost of DNA
sequencing has declined by several orders of magnitude in the past decade. These technologies provide an
unprecedented opportunity to measure all variants; germline and somatic; SNPs and SVs, in both normal
and cancer genomes.
In this chapter, we discuss the application of these sequencing technologies in medical genomics, and
specifically on the characterization of structural variation that was largely absent from earlier GWAS. In this
1

chapter, you will learn the following.
1. Current knowledge about the prevalence of structural variation in human and cancer genomes.
2. Strategies for using next-generation DNA sequencing technologies to measure structural variation.
3. Computational techniques that are used to detect structural variants from DNA sequencing data.
2 Germline and Somatic Structural Variation
Structural variants are important contributors to genome variation and consideration of these variants is
necessary for disease association and cancer genetics studies. In this section, we briefly review current
knowledge about structural variation in human and cancer genomes.
Germline Structural Variation
Characterizing the DNA sequence differences that distinguish individuals is a major challenge in human
genetics. Until a few years ago, the primary focus was to identify single nucleotides polymorphisms (SNPs),
and projects such as HapMap [10] provide catalogs of common SNPs in several human populations. Recent
whole-genome sequencing and microarray measurements have shown that structural variation, including
duplications, deletions, and inversions of large blocks of DNA sequence, is common in the human genome
[36]. SVs include both copy number variants – duplications and deletions – that change the number of copies
of a segment of the genome, and balanced rearrangements – such as inversions and translocations – that do
not alter the copy number of the genome. The Database of Genomic Variants [13] currently (winter 2010)
lists nearly 30 thousand copy number variants and nearly 900 inversion variants in the human genome, and
this number continues to increase.
Germline SVs account for a greater share of the total nucleotide differences between two individual
human genomes than SNPs [32]. Copy number variants alone account for approximately 18% of genetic
variation in gene expression, having little overlap with variation associated to SNPs [42], and can affect the
expression of genes up to 300kb away from the variant [19]. Both common and rare SVs have recently
been linked to several human diseases including autism [21] and schizophrenia [41]. In addition to SVs
that cause disease, SVs segregating in a population perturb patterns of linkage disequilibrium and haplotype
structure. Thus, it is essential to catalog SVs in order to understand their consequences for human population
genetics. Incorrect identification of SVs in samples can lead to spurious genetic associations resulting from
the undetected SVs, erroneous merging of distinct variants in different samples, and failure to recognize
heterozygosity at a locus.
Finally, structural variants are also present in model organisms such as mouse and fruit fly. Identifying
these variants is important for animal models of human diseases.
2

Somatic Structural Variation and Cancer
Cancer is a disease driven by somatic mutations that accumulate during the lifetime of an individual. The
inheritance of mutations by daughter cells during mitosis and selection for advantageous mutations make
cancer a “microevolutionary process” [27, 23] within a population of cells. Decades of cytogenetic studies
have shown that somatic structural variants are a feature of many cancer genomes. These early studies,
particularly in leukemias and lymphoma, identified a number of recurrent chromosomal rearrangements
that are present in many patients with the same type of cancer. For example, a significant fraction of patients
with chronic myelogenous leukemia (CML) exhibit a translocation between chromosomes 9 and 22. The
breakpoints of this translocation lie in two genes, BCR and ABL, and the translocation results in the BCR-
ABL fusion gene that is directly implicated in the development of this cancer. In addition to fusion genes,
somatic SVs can also lead to altered expression of oncogenes and tumor suppressor genes due to both
genetic and epigenetic mechanisms [1]. For example, in Burkitt’s lymphoma, a translocation activates the
MYC oncogene by fusing it with a strong promoter.
In solid tumors, the situation is more complicated. Many solid tumors have genomes that are exten-
sively rearranged compared to the normal healthy genome from which they were derived [1]. These highly
rearranged genomes are thought to be a product of genome instability resulting from mutations in the DNA
repair machinery. This complex organization of cancer genomes obscures functional driver SVs in a back-
ground of passenger mutations. However, with the availability of higher-resolution genomics technologies,
recurrent fusion genes are also being found in solid tumors, such as prostate [43] and lung cancers [38].
These results suggest that additional events remain to be discovered [25]. Next-generation DNA sequencing
technologies provide the opportunity to reconstruct the organization of cancer genomes at single nucleotide
resolution. Projects including The Cancer Genome Atlas (TCGA) and International Cancer Genome Con-
sortium (ICGC) are using these technologies to measure somatic mutations in thousands of cancer genomes.
Mechanisms of Structural Variation
As additional genetic and somatic structural variants are characterized, there is increasing opportunity to
characterize the mechanisms that produce these variants. A distinguishing feature of the different mecha-
nisms is the amount of sequence similarity, or homology, at the breakpoints of the structural variant. One
extreme is little or no sequence similarity. These variants are thought to result from random (or near ran-
dom) double-stranded breaks in DNA. These breaks might occur due to exposure to external DNA damaging
agents. For example, ultraviolet radiation or various chemotherapy drugs produce double-stranded breaks.
Aberrant repair of these breaks result in structural variants. This mechanism is termed non-homologous
end-joining (NHEJ) [4, 5].
The opposite extreme is high sequence similarity at the breakpoints. This mechanism is termed non-
allelic homologous recombination (NAHR). This mechanism is similar to the normal biological process of
homologous recombination that occurs during meiosis and exchanges DNA between two homologous chro-
mosomes. But as the name states, NAHR is a rearrangement that occurs between homologous sequences that
are not the same allele on homologous chromosomes. Rather NAHR occurs between repetitive sequences
3

on the genome (Figure 1). The human genome contains numerous repetitive sequences ranging from Alu
elements of 300bp to segmental duplications, also called low copy repeats, of tens to hundreds of kbp [3].
Thus, there are numerous substrates for NAHR in the human genome, and not surprisingly numerous re-
ported structural variants that result from NAHR. For example, the 1000 Genomes Project, a large NIH
project to survey all classes of variation – SNPs through SV – in 1000 human genomes recently reported
that approximately 23% of deletions were a result of NAHR [24]. Importantly, due to technical limitations
in discovering NAHR-mediated SVs (see below), this percentage may be an underestimate.
There are other mechanisms for the formation of SVs. The division between homology mediated and
non-homologous mechanisms may not be so strict. NHEJ events sometimes have some degree of microho-
mology (e.g. 2-25bp of similarity) at their breakpoints. Other mechanisms such as fork stalling and template
switching (FoSTeS) have also been proposed. Some of these are reviewed in [39]. Finally, the relative con-
tribution of each of these mechanisms in generating germline SVs versus somatic SVs remains an active area
of investigation, with conflicting reports about the importance of repetitive sequences in somatic structural
variants found in cancer genomes [15, 8, 31, 4, 5].
3 Technologies for Measurement of Structural Variation
Structural variants vary widely in size and complexity, ranging from insertions/deletions of hundreds of nu-
cleotides to large scale chromosomal rearrangements. Large structural variants can be visualized directly on
chromosomes, through cytogenetic techniques such as chromosome painting, spectral karyotyping (SKY),
or fluorescent in situ hybridization (FISH). In fact, Sturtevant and Dobzhansky studied inversion polymor-
phisms in Drosophila in the 1920’s – well before the modern genomics era. However, SVs that are too
small to be directly observed on chromosomes are generally more difficult to detect and to characterize than
single nucleotide polymorphisms (SNPs). Much of the recent excitement surrounding structural variation
stems from improvements in genomics technologies that allow more complete measurements of SVs of all
types. These include microarrays and more recently next-generation DNA sequencing technologies. In this
section, we briefly describe these technologies.
Microarrays
The first genome-wide surveys of SVs in the human genome in 2004 utilized microarray-based techniques
such as array comparative genomic hybridization (aCGH). In aCGH, differentially fluorescently labeled
DNA from an individual, or test, genome and a reference genome are hybridized to an array of genomic
probes derived from the reference genome. Measurements of test:reference fluorescence ratio, called the
copy number ratio, at each probe identifies locations of the test genome that are present in higher or lower
copy in the reference genome. Microarrays containing hundreds of thousands of probes are available, and
thus one obtains copy number ratios at hundreds of thousands of locations. Since individual copy number
ratios are subject to various types of experimental error, computational techniques are needed to analyze
aCGH data. For further details about aCGH and aCGH analysis, please see REFERENCE Cancer Genomics
Chapter.
4

aCGH is equally applicable for measurement of germline SVs in normal genomes and somatic SVs in
cancer genomes. In fact, aCGH was originally developed for cancer genomics applications. aCGH is now
very affordable making it possible to detect copy number variants in large numbers of genomes at reasonable
cost. However, aCGH has two important limitations. First, because aCGH measures only differences in
the number of copies of a genomic region between a test and reference genome, aCGH detects only copy
number variants. Thus, aCGH is blind to copy-neutral, or balanced, variants such as inversions, or reciprocal
translocations. Moreover, aCGH requires that the genomic probes from the reference genome lie in non-
repetitive regions, making it difficult to detect SVs with breakpoints in repetitive regions, such as NAHR
events or the insertion/deletion of repetitive sequences.
Next-generation DNA sequencing technologies
DNA sequencing technology has advanced dramatically in recent years, and several “next-generation” DNA
sequencing technologies from companies such as Illumina, ABI, and 454 have significantly lowered the cost
of sequencing DNA. However, these technologies, and the Sanger sequencing technique they are replacing,
are severely limited in the length of a DNA molecule that can be sequenced. Present sequencing technologies
produce short sequences of DNA, called reads, that range from 25-1000 nucleotides, or base pairs (bp),
with the upper end of this range requiring technologies (e.g. Sanger and 454) that are considerably more
expensive. Much of the recent excitement in DNA sequencing has been in short read DNA sequencers
(e.g.llumina Genome Analyzer, Life Technologies SOLiD and Ion Torrent) that yield reads of only 25-150
nucleotides. These reads are much shorter than the one to two hundred millions bp of a typical human
chromosome. However, the large number of reads that are produced (hundreds of millions), results in a cost
per nucleotide that is several orders of magnitude lower than Sanger sequencing.
Many DNA sequencing technologies employ a paired end, or mate pair, sequencing protocol to increase
the effective read length. In this protocol two reads are generated from opposite ends of a longer DNA frag-
ment, or insert. With earlier Sanger sequencing protocols, the sizes of these DNA fragments were dictated
by the cloning vector that was used. Fragment, or insert, sizes of 2kb-150kb could be obtained by cloning
into bacterial plasmids or bacterial artificial chromosomes (BACs). With next-generation technologies, a va-
riety of techniques have been employed to generate paired reads. At present, the most efficient and effective
techniques produce paired reads from fragments of only a few hundred bp, although fragments of 2-3kb are
available. Thus, next-generation sequencing technologies have both limited read lengths and limited insert
sizes compared to Sanger sequencing.
There are two approaches to detecting SVs from next-generation DNA sequencing data (Figure 2). The
first is de novo assembly. In this approach, sophisticated algorithms are used to reconstruct the genome
sequence from overlaps between reads. The assembled genome sequence is then compared to the reference
genome, or the assembled genomes of other individuals, to identify all types of variants. If the genome
sequence is successfully assembled, this approach is the best for characterization of SVs. Unfortunately,
assembling a human genome de novo – i.e. with no prior information – of sufficient quality for struc-
tural variation studies remains difficult with limited read lengths. Currently, human genome assemblies are
highly fragmented, consisting of tens-hundreds of thousands of contigs, intermediate sized sequences of
5

thousands to tens of thousands of nucleotides. Moreover, the associations between some structural variants
and repetitive sequences implies that assemblies of finished (not draft quality) are necessary for comprehen-
sive coverage of structural variation. Improving de novo assembly is a very active research area (see [34],
but human genome assemblies of high enough quality for SV studies remain out of reach for inexpensive
short-read technologies.
The second approach to detect SVs in next-generation DNA sequencing data is a “resequencing” ap-
proach that leverages the extensive finishing efforts undertaken in the Human Genome Project. In a re-
sequencing approach, one finds differences between an individual genome and a closely related reference
genome whose sequence is known by aligning reads from the individual genome to the reference genome.
Differences (variants) between the genomes correspond to differences between the aligned reads and the
reference sequence. In the next section, we describe how to predict SVs using a resequencing approach.
New DNA Sequencing Technologies
Many of the challenges in reliable measurement of SVs described above are related to limitations in sequenc-
ing technologies. In particular, SVs with breakpoints in highly-repetitive sequences are beyond the abilities
of current technologies. New “third-generation” and single-molecule technologies promise additional ad-
vantages for structural variation discovery. These advantages include longer read lengths, easier sample
preparation, lower input DNA requirements, and higher throughput. For example, Pacific Biosciences re-
cently released their Single-Molecule Real Time (SMRT) sequencing, a technology that measures in real
time the incorporation of nucleotides by a single DNA polymerase molecule immobilized in a nanopore [9].
One application of this technology is strobe sequencing. A strobe read, or strobe, consists of multiple
subreads from a single contiguous molecule of DNA. These subreads are separated by a number of “dark”
nucleotides (called advances), whose identity is unknown (Figure 3). Thus far, Pacific Biosciences has
demonstrated strobes of lengths up to 20kb with 2-4 subreads each of 50-400bp. Additional improvements
are expected as technology matures. Strobes generalize the concept of paired reads by including more
than two reads from a single DNA fragment. Strobes provide long-range sequence information with low
input DNA requirements, a feature missing from current sequencing technologies. This additional infor-
mation is useful for detection and de novo assembly of complex SV that lie in highly repetitive regions, or
contain multiple breakpoints in a small region. However, the advantages of strobes are reduced by higher
single-nucleotide error rates. Thus, realizing the advantages of strobes requires new algorithms that exploit
information from multiple, spaced subreads to overcome high single-nucleotide error rates [33].
Sequencing technologies continues its rapid development. Improvements in the chemistry, imaging, and
manufacture of existing technologies are increasing their read lengths, insert lengths, and throughput. Ad-
ditional sequencing technologies are under active development. Nanopore-based technologies that directly
read the nucleotides of long molecules of DNA hold promise for a dramatic shift in DNA sequencing where
extremely long reads (tens of kb) are generated, making both de novo assembly and variant detection by
resequencing straightforward problems.
6
4 Resequencing strategies for structural variation
A resequencing strategy predicts SVs by alignments of sequence reads to the reference genome. There are
two main steps in any resequencing strategy: (1) alignments of reads; (2) prediction of SVs from alignments.
Resequencing approaches are straightforward in principle, but in practice sensitive and specific detection of
structural variation in human genomes is notoriously difficult [22, 2]. While some types of SVs are easy to
detect with next-generation sequencing technologies, other complex SVs are refractory to detection. This is
due to both technological limitations and biological features of SVs. DNA sequencing technologies produce
reads with sequencing errors, have limited read lengths and insert sizes, and have other sampling biases
(e.g. in GC-rich regions). Biologically, human SVs are: (i) enriched for repetitive sequences near their
breakpoints [14]; (ii) may overlap, have multiple states or complex architectures; and (iii) recurrent (but
not identical) variants may exist at the same locus [35, 28]. These properties mean that the alignment of
reads to the reference genome and the prediction of SVs from these alignments is not always an easy task.
Algorithms are required to make highly sensitive and specific predictions of SVs.
In this section we review the main issues in predicting SVs using a resequencing approach. We begin
with read alignment. Then we describe the three major approaches that are used to identify structural variants
from aligned reads: (i) split reads; (ii) depth of coverage analysis; and (iii) paired-end mapping.
Read alignment
Alignment of reads to a reference genome is a special case of sequence alignment, one of the most researched
problems in bioinformatics. However, the specialized task of aligning millions-billions of individual short
reads led to the development of new programs tailored to this task, such as Maq, BWA, Bowtie, BFAST, etc.
For further details of these and other programs, see REFERENCE Dan Li Chapter. A key decision in read
alignment for SV detection is whether to consider only reads with a single, best alignment to the reference
genome, or to also include reads with multiple high-quality alignments. Some read alignment programs will
output only a single alignment for each read, in some cases choosing an alignment randomly if there are
multiple alignments of equal score. If one uses only reads with a unique alignment, then there is limited
power to detect SVs whose breakpoints lie in repetitive regions, such as SVs resulting from NAHR. On the
other hand, if one allows reads whose alignment is ambiguous, then the problem of SV prediction requires
an algorithm to distinguish among the multiple possible alignments for each read. Many SV prediction
algorithms analyze only unique alignments, although several recent algorithms use ambiguous alignments.
A few of these are noted below.
Split reads
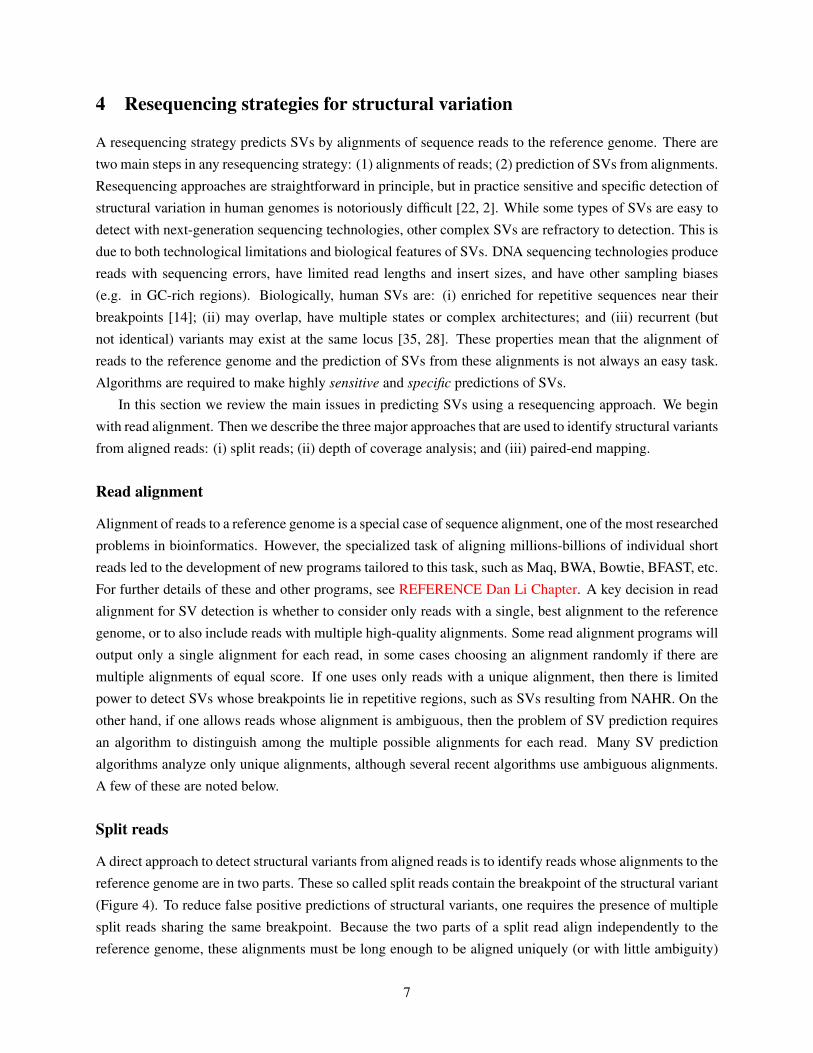
A direct approach to detect structural variants from aligned reads is to identify reads whose alignments to the
reference genome are in two parts. These so called split reads contain the breakpoint of the structural variant
(Figure 4). To reduce false positive predictions of structural variants, one requires the presence of multiple
split reads sharing the same breakpoint. Because the two parts of a split read align independently to the
reference genome, these alignments must be long enough to be aligned uniquely (or with little ambiguity)
7

to the reference. Thus, split read analysis is a feasible strategy only when the reads are sufficiently long.
For example, if one has a 36bp read containing the breakpoint of an SV at its midpoint, one must align
the two 18bp halves of the read to the reference genome. Finding unique alignments of an 18bp sequence
is often not possible. There are no reports of successful prediction of structural variants from split reads
alone using next generation DNA sequencing reads less that 50bp in length. Instead, split read methods
have been proposed that use paired reads, and require that one read in the pair has a full length alignment
to the reference. This alignment of the read from one end of the fragment is used to anchor the search for
alignments of the other split read of the fragment[46].
Depth of coverage
Depth of coverage (also called read depth) analysis detects differences in the number of reads that align to
intervals in the reference genome. Assuming that reads are sampled uniformly from the genome sequence,
the number of reads that contain a given nucleotide of the reference is, on average, c = NLG , where N is
the number of reads, L is the length of each read, and G is the length of the genome. This is the Lander-
Waterman model, and the parameter c, called the coverage, is a key parameter in a sequencing experience.
For example, recent cancer sequencing projects with Illumina technology have used “30X coverage” which
means that the number of reads and length of reads are chosen such that c = 30.
Now, if the individual genome contained a deletion of a segment of the human reference genome, the
coverage of this segment would be reduced by half – if the deletion was heterozygous – or reduced to
zero – if the deletion was homozygous (Figure 4). Similarly, if an interval of the reference genome was
duplicated, or amplified, in the individual genome, the coverage of this interval would increase in proportion
to the number of copies. Thus, the observed coverage of an interval of the reference genome, the depth of
coverage, gives an indication of the number of copies of this interval in the individual genome. Of course,
there are numerous additional factors to consider beyond this simple analysis. For example, since reads are
sampled at random from the genome, coverage is not constant, but rather follows a distribution with mean c.
A Poisson distribution is typically used as an approximation to this distribution, although other distributions
sometimes provide a better fit to the data. In addition, repetitive sequences in the reference genome and
biases in sequencing (e.g. different coverage of GC-rich regions) also affect depth of coverage calculations.
Nevertheless, there are several computational methods for depth of coverage analysis [7, 47]. Many of these
are largely similar to those used to analyze microarray copy number data. Further information is available
in REFERENCE Cancer Genomics Chapter.
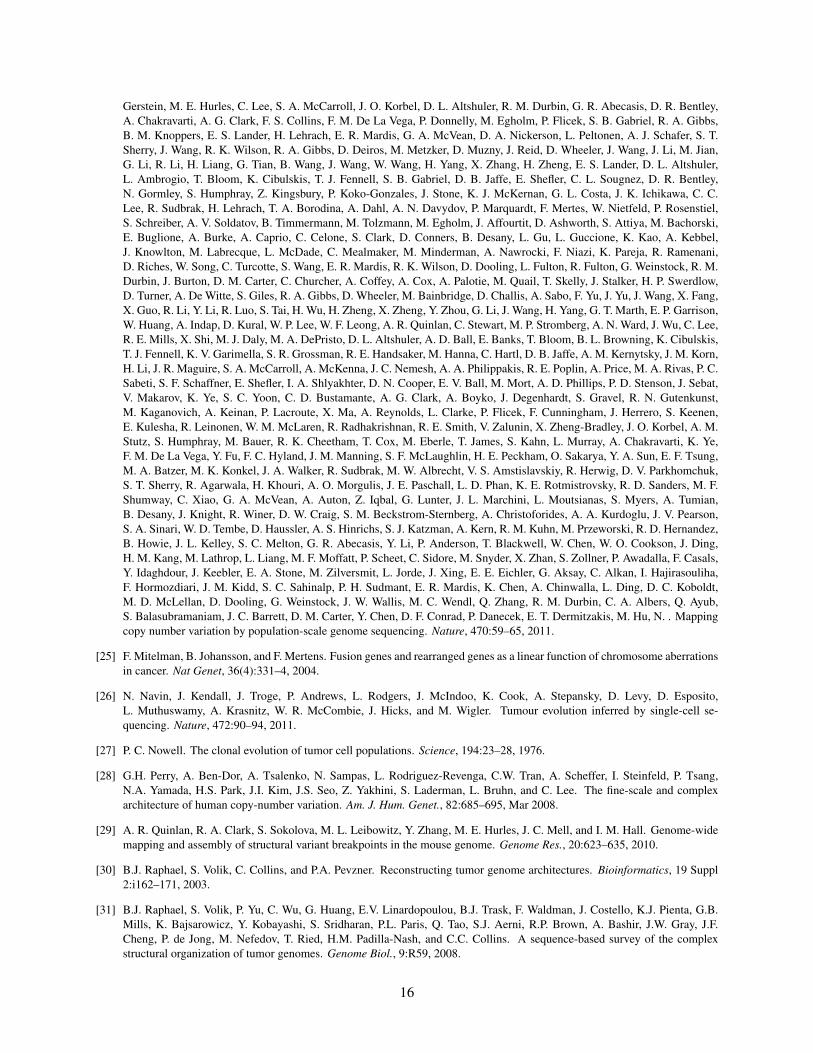
Paired-end sequencing and mapping
The most common approach for resequencing SVs is paired-end mapping (PEM) (Figure 5). Paired-end
mapping was used to identify somatic SVs in cancer genomes [45, 30] and the same idea has been ap-
plied to identify germline structural variants [44, 17]. While the early paired-end mapping studies used
older clone-based sequencing, paired-end mapping is now possible using various next-generation sequenc-
ing technologies.
8

In PEM, a paired-end sequencing protocol is used to obtain paired reads from opposite ends of a larger
DNA fragment, or clone, from a individual genome. These paired reads are then aligned to a reference
genome. Most paired reads result in concordant pairs where the distance between aligned reads is equal to
the fragment length. In contrast, discordant pairs have alignments with abnormal distance or that lie on dif-
ferent chromosomes. These suggest the presence of an SV or a sequencing error. For example, a discordant
pair whose distance between alignments is too long suggests a deletion in the individual genome (Figure 5),
while a discordant pair whose alignments are on different chromosomes suggests a translocation. Other
types of discordant pairs identify inversions, transpositions, or duplications that distinguish the individual
genome from the reference genome. Note that in general the length of any particular sequenced fragment
is not known. Rather, during the preparation of genomic DNA for sequencing, the DNA is fragmented and
fragments are size-selected to an appropriate target length. It is desirable for this size selection to be as strict
as possible, so that only fragments near the target length are sequenced. However, in practice the size selec-
tion procedure produces fragments whose lengths vary around the target length. Typically, the distribution
of fragment lengths is obtained empirically by examining the distances between all aligned paired reads, as
most fragments will correspond to a concordant pair (Figure 5).
To distinguish real SVs from sequencing errors, one looks for clusters of discordant pairs that indicate
the same SV. Numerous algorithms have been developed to predict SVs by finding clusters of discordant
pairs. Early algorithms used only those paired reads whose alignments to the reference genome were non-
ambiguous; i.e. there was only a single “best alignment” [6, 16, 37]. More sophisticated algorithms use
paired reads with multiple ambiguous alignments to the reference genome and use a variety of combinatorial
and statistical techniques to select among these alignments [11, 29, 18]. Finally, some approaches model
the fact that the human genome is diploid to avoid making inconsistent structural variant predictions [12].
All of the approaches above rely on predicting structural variants that are supported by multiple paired
reads. Some, but not all, of them are careful when determining whether a group of paired reads genuinely
support the same variant. We illustrate the issue here using the Geometric Analysis of Structural Variants
(GASV) method of [37]. A key feature of GASV is that it records both the information that the paired reads
reveal about the boundaries (breakpoints) of the structural variant and the uncertainty associated with this
measurement. Most types of SV, including deletions, inversions, and translocations have two breakpoints
a and b where the reference genome is cut. The segments adjacent to these coordinates are then pasted
together in a way that is particular to the type of SV. For example, a deletion is defined by coordinates a and
b in the reference genome such that the nucleotide at position a is joined to the nucleotide at position b in
the individual genome (Figure 6). Note that this is a simplification of the underlying biology, as there are
sometimes small insertions or deletions at breakpoints, but these small changes have limited effect on the
analysis of larger structural variants.
Now the discordant pairs that indicate an SV have the property that the locations of the read alignments
are near the breakpoints a and b. However, a paired read does not give independent information about the
breakpoint a and the breakpoint b. Rather, the breakpoints a and b are related by a linear inequality that
defines a polygon in 2D genome space called the breakpoint region (Figure 6). For example, suppose that
the pair of reads from a single fragment align to the same chromosome of the reference genome such the
9

read with lower coordinate starts at position x in the reference and the read with higher coordinate ends at
position y in the reference1. If the sequenced fragment has length L then the breakpoints a and b satisfy
the equation (a − x) + (y − b) = L. As described above, the size of any particular fragment is typically
unknown. Rather, one defines a minimum size Lmin and maximum size Lmax of a sequenced fragment,
perhaps according to the empirical fragment length distribution. Thus, we have the inequality
Lmin ≤ (a− x) + (y − b) ≤ Lmax.
This equation defines the unknown breakpoints a and b in terms of the known coordinates x and y of the
aligned reads and the length of sequenced fragments. The pairs of breakpoints (a, b) that satisfy this equation
form a polygon (specifically a trapezoid) in two-dimensional genome space. We define the breakpoint region
B of discordant pair (x, y) to be the breakpoints (a, b) satisfying the above equation.
This geometric representation provides a principled way to combine information across multiple paired-
reads: multiple paired-reads indicate the same variant if their corresponding breakpoint regions intersect.
The geometric representation also provides precise breakpoint localization by multiple paired reads; sep-
arates multiple measurements of the same variant from measurements of nearby or overlapping variants;
and facilitates robust comparisons across multiple samples and measurement technologies. Finally, the
approach is computationally efficient as it relies on computational geometry algorithms for polygon inter-
section. These scale to millions of discordant pairs that result from next-generation sequencing platforms.
While the algorithms above consider many of the issues in prediction of structural variants, there re-
mains room for improvement. Most notably, many algorithms still use only one of the possible signals of
structural variants: read depth, split reads, or paired reads. Improvements in specificity are likely possible
by integrating these multiple signals into a single prediction algorithm.
5 Representation of Structural Variants
Next generation DNA sequencing technologies are dramatically reducing the cost of sequence-based sur-
veys of structural variants, while oligonucleotide aCGH techniques are now used in studies profiling tens
of thousands of genomes. Large projects like the 1000 Genomes Project and The Cancer Genome Atlas
(TCGA) are performing paired-end sequencing and aCGH of many human genomes, and matched tumor
and normal genomes, respectively. At the same time, smaller or single investigator projects are using a
variety of paired-end sequencing approaches and/or microarray-based techniques with different trade-offs
in cost-per-sample vs. measurement resolution. Thus, in the near future there will be an enormous num-
ber of measurements of SVs, but using a wide range of technologies of varying resolution, sensitivity, and
specificity. This diversity of approaches will likely continue for some time as investigators explore tradeoffs
between the cost of measuring variants in one sample with high confidence versus surveying variants in
many samples with lower confidence per sample. For example, in cancer genome studies the goal of finding
recurrent mutations demands the survey of many genomes and thus large sample sizes might be preferred1For simplicity, we are ignoring the fact that the sequence of a read can align to either strand (forward or reverse) of the reference
genome. The strand of an alignment gives additional information about the location of the breakpoint. See [37] for further details.
10

over high coverage sequencing of one sample.
The problem of comparing variants across samples and/or measurement platforms is less studied than
the problem of detecting variants in a single sample. Standard practice remains to use heuristics that merge
predicted structural variants into the same variant in they overlap by a significant fraction (e.g. 50-70%)
on the reference genome. For example, the Database of Genomic Variations (DGV) [13], arguably the
most comprehensive repository of measured human structural variants, merges structural variant predictions
whose coordinates overlap by ≥ 70 % on the reference genome. Such heuristics are typically the only
approach available to databases of human structural variants because many early studies did not report in-
formation on the uncertainty (i.e. “error bars”) in the boundaries (breakpoints) of the variant. This situation
makes it difficult to explicitly separate multiple measurements of the same variant from measurements of
nearby variants or overlapping variants. This situation is now improving, and more recent programs record
both the information that the measurement reveals about the breakpoints of the structural variant and the un-
certainty associated with this measurement. Software that uses this uncertainty to classify and compare SVs
across samples and measurement platforms is also now available [37]. Such precision provides increased
confidence in associations between a structural variant and a disease, helps separate germline from somatic
structural variants in cancer genome sequencing projects, and aids in the study of rare recurrent variants that
might occur on a variety of genetic backgrounds.
6 Challenges for Cancer Genomics Studies
The study of somatic structural variation in cancer genomes presents additional challenges beyond those de-
scribed above for generic resequencing approaches. First, most cancer genomes are aneuploid, meaning that
the number of copies of regions of the genome are variable, due to duplications and deletions of segments of
the normal genome. High-resolution reconstructions of cancer genomes by paired read sequencing showed
that many rearrangements were too small to be detected by cytogenetics, and identified highly rearranged
genomic loci that encompass a complex intertwining of rearrangement and duplication. Such highly rear-
ranged loci are hypothesized to result from genome instability caused by defective DNA repair in cancer
cells, or from external DNA damage. An extreme example is the phenomenon of chromothripsis that results
from massive, simultaneous breakage and aberrant repair of many genomic loci [40]. Identifying all of the
SVs and thereby reconstructing the organization of cancer genomes can suggest that certain regions of the
genome are selected for their pathogenetic properties, and also lend insight into the mechanisms of genome
instability in tumors [1].
A second challenge is that cancer tissues are a heterogeneous mixture of cells with possibly different
numbers of mutations. This heterogeneity includes admixture between normal and cancer cells, as well as
subpopulations of tumor cells. Some of these subpopulations might contain important driver mutations, or
drug resistance mutations. Because of the amount of DNA required for current sequencing technologies,
most cancer genome sequencing studies do not sequence single tumor cells but rather sequence a mixture of
cells. Since the signal for detecting variants is proportional to the number of cells in the mixture that contain
the variant, presence of normal cells will reduce the power to detect somatic mutations. Further, the ability
11

to detect mutations that are rare in the tumor cell population will be even lower. Eventually, whole genome
sequencing of single cells will provide fascinating datasets to study cancer genome evolution, with some
recent hints of the discoveries to come in [26].
7 Future Prospects
This chapter described the challenges in identification and characterization of structural variants. With fur-
ther improvements in sequencing technologies and algorithms over the next few years, it will be possible to
systematically measure nearly all but the most complex variants in an individual genome. The most difficult
cases, such as variants mediately by homologous recombination between nearly identical sequences, might
remain inaccesible until significantly different types of DNA sequencing technologies become available.
Nevertheless, the fact that systematic identification of nearly all germline and somatic structural variants in
an individual genome is now possible will enable further progress in human and cancer genetics.
For genetic association studies, having complete lists of germline variants from many individuals means
that unexplained heritability for a trait cannot readily be blamed on lack of measurement of genetic in-
formation. Unfortunately, this does not necessarily imply that finding the genetic basis for specifc traits
will become easy. There remain other challenges, including the possiblity that combinations of variants,
interactions between genetic and environmental factors, or other epigenetic mechanisms, may contribute to
phenotype. See REFERENCE Moore chapter for further discussion of these issues. Finally, translating ge-
netic information about susceptibility to a disease or efficacy of particular treatments into improved medical
outcomes will require additional work. Some of these challenges in personalized medicine are described in
Chapter Reference XXX chapter.
The opportunities and challenges are similar in cancer genetics. Systematic measurement of all somatic
mutations will yield information that might guide treatments, and eventually lead to personalized oncol-
ogy. Current cancer treatments are limited by the non-specificity of most cancer drugs and by the fact that
cancer cells can evolve resistance to single drug treatments. Tailoring of treatment to the particular genetic
mutations in a tumor promises to revolutionize cancer therapy. There are already several examples of such
personalized treatments including the drug Gleevec that targets the BCR-ABL fusion gene in chronic myel-
ogenous leukemia (CML) and Iressa that targets the EGFR gene in lung cancer. Discovery of additional
cancer-specific drug targets requires not only technologies to globally survey somatic mutations in cancer
genomes, but also techniques (experimental and/or computational) to classify the subset of variants that are
functional, and then the further subset of these functional variants that are druggable.
The sequencing technologies and algorithms described in this chapter are laying the foundation for
personalized medicine, but much work remains to translate the information revealed by genome sequencing
into improved clinical practice.
12

Exercises
(1) Consider the chromosomal inversion in Figure 1. What signals in next-generation sequencing data can
be used to detect a chromosomal inversion?
Answer: Split reads or paired-end mapping. Read depth cannot be used because the inversion does not
alter the number of copies of a region in the reference genome.
(2) The human genome is diploid with two copies, maternal and paternal, of each chromosome. What
constraints does this place on prediction of germline structural variants?
Answer: Predicted structural variants must satisfy the constraint that outside of repetitive sequences
in the reference genome, there are at most two copies of each locus. For example there cannot be three
overlapping deletions of the same region, or a inversion whose breakpoints lie in a homozygous deletion.
13

References[1] D. G. Albertson, C. Collins, F. McCormick, and J. W. Gray. Chromosome aberrations in solid tumors. Nat Genet, 34(4):369–
76, 2003.
[2] C. Alkan, B. P. Coe, and E. E. Eichler. Genome structural variation discovery and genotyping. Nat. Rev. Genet., 12:363–376,2011.
[3] J. A. Bailey and E. E. Eichler. Primate segmental duplications: crucibles of evolution, diversity and disease. Nat. Rev. Genet.,7:552–564, 2006.
[4] Graham R Bignell, Thomas Santarius, Jessica C M Pole, Adam P Butler, Janet Perry, Erin Pleasance, Chris Greenman,Andrew Menzies, Sheila Taylor, Sarah Edkins, Peter Campbell, Michael Quail, Bob Plumb, Lucy Matthews, Kirsten McLay,Paul A W Edwards, Jane Rogers, Richard Wooster, P Andrew Futreal, and Michael R Stratton. Architectures of somaticgenomic rearrangement in human cancer amplicons at sequence-level resolution. Genome Res, 17(9):1296–1303, 2007.
[5] P.J. Campbell, P.J. Stephens, E.D. Pleasance, S. O’Meara, H. Li, T. Santarius, L.A. Stebbings, C. Leroy, S. Edkins, C. Hardy,J.W. Teague, A. Menzies, I. Goodhead, D.J. Turner, C.M. Clee, M.A. Quail, A. Cox, C. Brown, R. Durbin, M.E. Hurles, P.A.Edwards, G.R. Bignell, M.R. Stratton, and P.A. Futreal. Identification of somatically acquired rearrangements in cancer usinggenome-wide massively parallel paired-end sequencing. Nat. Genet., 40:722–729, Jun 2008.
[6] K. Chen, J. W. Wallis, M. D. McLellan, D. E. Larson, J. M. Kalicki, C. S. Pohl, S. D. McGrath, M. C. Wendl, Q. Zhang, D. P.Locke, X. Shi, R. S. Fulton, T. J. Ley, R. K. Wilson, L. Ding, and E. R. Mardis. BreakDancer: an algorithm for high-resolutionmapping of genomic structural variation. Nat. Methods, 6:677–681, 2009.
[7] D. Y. Chiang, G. Getz, D. B. Jaffe, M. J. O’Kelly, X. Zhao, S. L. Carter, C. Russ, C. Nusbaum, M. Meyerson, and E. S.Lander. High-resolution mapping of copy-number alterations with massively parallel sequencing. Nat. Methods, 6:99–103,2009.
[8] E. Darai-Ramqvist, A. Sandlund, S. Mller, G. Klein, S. Imreh, and M. Kost-Alimova. Segmental duplications and evolutionaryplasticity at tumor chromosome break-prone regions. Genome Res., 18:370–379, 2008.
[9] J. Eid, A. Fehr, J. Gray, K. Luong, J. Lyle, G. Otto, P. Peluso, D. Rank, P. Baybayan, B. Bettman, A. Bibillo, K. Bjornson,B. Chaudhuri, F. Christians, R. Cicero, S. Clark, R. Dalal, A. Dewinter, J. Dixon, M. Foquet, A. Gaertner, P. Hardenbol,C. Heiner, K. Hester, D. Holden, G. Kearns, X. Kong, R. Kuse, Y. Lacroix, S. Lin, P. Lundquist, C. Ma, P. Marks, M. Maxham,D. Murphy, I. Park, T. Pham, M. Phillips, J. Roy, R. Sebra, G. Shen, J. Sorenson, A. Tomaney, K. Travers, M. Trulson,J. Vieceli, J. Wegener, D. Wu, A. Yang, D. Zaccarin, P. Zhao, F. Zhong, J. Korlach, and S. Turner. Real-time DNA sequencingfrom single polymerase molecules. Science, 323:133–138, 2009.
[10] K.A. Frazer, D.G. Ballinger, D.R. Cox, D.A. Hinds, L.L. Stuve, R.A. Gibbs, J.W. Belmont, A. Boudreau, P. Hardenbol, S.M.Leal, S. Pasternak, D.A. Wheeler, T.D. Willis, F. Yu, H. Yang, C. Zeng, Y. Gao, H. Hu, W. Hu, C. Li, W. Lin, S. Liu, H. Pan,X. Tang, J. Wang, W. Wang, J. Yu, B. Zhang, Q. Zhang, H. Zhao, H. Zhao, J. Zhou, S.B. Gabriel, R. Barry, B. Blumenstiel,A. Camargo, M. Defelice, M. Faggart, M. Goyette, S. Gupta, J. Moore, H. Nguyen, R.C. Onofrio, M. Parkin, J. Roy, E. Stahl,E. Winchester, L. Ziaugra, D. Altshuler, Y. Shen, Z. Yao, W. Huang, X. Chu, Y. He, L. Jin, Y. Liu, Y. Shen, W. Sun, H. Wang,Y. Wang, Y. Wang, X. Xiong, L. Xu, M.M. Waye, S.K. Tsui, H. Xue, J.T. Wong, L.M. Galver, J.B. Fan, K. Gunderson,S.S. Murray, A.R. Oliphant, M.S. Chee, A. Montpetit, F. Chagnon, V. Ferretti, M. Leboeuf, J.F. Olivier, M.S. Phillips,S. Roumy, C. SallEe, A. Verner, T.J. Hudson, P.Y. Kwok, D. Cai, D.C. Koboldt, R.D. Miller, L. Pawlikowska, P. Taillon-Miller,M. Xiao, L.C. Tsui, W. Mak, Y.Q. Song, P.K. Tam, Y. Nakamura, T. Kawaguchi, T. Kitamoto, T. Morizono, A. Nagashima,Y. Ohnishi, A. Sekine, T. Tanaka, T. Tsunoda, P. Deloukas, C.P. Bird, M. Delgado, E.T. Dermitzakis, R. Gwilliam, S. Hunt,J. Morrison, D. Powell, B.E. Stranger, P. Whittaker, D.R. Bentley, M.J. Daly, P.I. de Bakker, J. Barrett, Y.R. Chretien, J. Maller,S. McCarroll, N. Patterson, I. Pe’er, A. Price, S. Purcell, D.J. Richter, P. Sabeti, R. Saxena, S.F. Schaffner, P.C. Sham,P. Varilly, D. Altshuler, L.D. Stein, L. Krishnan, A.V. Smith, M.K. Tello-Ruiz, G.A. Thorisson, A. Chakravarti, P.E. Chen,D.J. Cutler, C.S. Kashuk, S. Lin, G.R. Abecasis, W. Guan, Y. Li, H.M. Munro, Z.S. Qin, D.J. Thomas, G. McVean, A. Auton,L. Bottolo, N. Cardin, S. Eyheramendy, C. Freeman, J. Marchini, S. Myers, C. Spencer, M. Stephens, P. Donnelly, L.R.Cardon, G. Clarke, D.M. Evans, A.P. Morris, B.S. Weir, T. Tsunoda, J.C. Mullikin, S.T. Sherry, M. Feolo, A. Skol, H. Zhang,C. Zeng, H. Zhao, I. Matsuda, Y. Fukushima, D.R. Macer, E. Suda, C.N. Rotimi, C.A. Adebamowo, I. Ajayi, T. Aniagwu,P.A. Marshall, C. Nkwodimmah, C.D. Royal, M.F. Leppert, M. Dixon, A. Peiffer, R. Qiu, A. Kent, K. Kato, N. Niikawa,I.F. Adewole, B.M. Knoppers, M.W. Foster, E.W. Clayton, J. Watkin, R.A. Gibbs, J.W. Belmont, D. Muzny, L. Nazareth,E. Sodergren, G.M. Weinstock, D.A. Wheeler, I. Yakub, S.B. Gabriel, R.C. Onofrio, D.J. Richter, L. Ziaugra, B.W. Birren,M.J. Daly, D. Altshuler, R.K. Wilson, L.L. Fulton, J. Rogers, J. Burton, N.P. Carter, C.M. Clee, M. Griffiths, M.C. Jones,K. McLay, R.W. Plumb, M.T. Ross, S.K. Sims, D.L. Willey, Z. Chen, H. Han, L. Kang, M. Godbout, J.C. Wallenburg,
14

P. L’ArchevIque, G. Bellemare, K. Saeki, H. Wang, D. An, H. Fu, Q. Li, Z. Wang, R. Wang, A.L. Holden, L.D. Brooks, J.E.McEwen, M.S. Guyer, V.O. Wang, J.L. Peterson, M. Shi, J. Spiegel, L.M. Sung, L.F. Zacharia, F.S. Collins, K. Kennedy,R. Jamieson, and J. Stewart. A second generation human haplotype map of over 3.1 million SNPs. Nature, 449:851–861, Oct2007.
[11] F. Hormozdiari, C. Alkan, E. E. Eichler, and S. C. Sahinalp. Combinatorial algorithms for structural variation detection inhigh-throughput sequenced genomes. Genome Res., 2009.
[12] F. Hormozdiari, I. Hajirasouliha, P. Dao, F. Hach, D. Yorukoglu, C. Alkan, E. E. Eichler, and S. C. Sahinalp. Next-generationVariationHunter: combinatorial algorithms for transposon insertion discovery. Bioinformatics, 26:i350–357, Jun 2010.
[13] A.J. Iafrate, L. Feuk, M.N. Rivera, M.L. Listewnik, P.K. Donahoe, Y. Qi, S.W. Scherer, and C. Lee. Detection of large-scalevariation in the human genome. Nat. Genet., 36:949–951, 2004.
[14] J.M. Kidd, G.M. Cooper, W.F. Donahue, H.S. Hayden, N. Sampas, T. Graves, N. Hansen, B. Teague, C. Alkan, F. Antonacci,E. Haugen, T. Zerr, N.A. Yamada, P. Tsang, T.L. Newman, E. Tzn, Z. Cheng, H.M. Ebling, N. Tusneem, R. David, W. Gillett,K.A. Phelps, M. Weaver, D. Saranga, A. Brand, W. Tao, E. Gustafson, K. McKernan, L. Chen, M. Malig, J.D. Smith, J.M.Korn, S.A. McCarroll, D.A. Altshuler, D.A. Peiffer, M. Dorschner, J. Stamatoyannopoulos, D. Schwartz, D.A. Nickerson, J.C.Mullikin, R.K. Wilson, L. Bruhn, M.V. Olson, R. Kaul, D.R. Smith, and E.E. Eichler. Mapping and sequencing of structuralvariation from eight human genomes. Nature, 453:56–64, 2008.
[15] E. Kolomietz, M. S. Meyn, A. Pandita, and J. A. Squire. The role of Alu repeat clusters as mediators of recurrent chromosomalaberrations in tumors. Genes Chromosomes Cancer, 35:97–112, 2002.
[16] J. O. Korbel, A. Abyzov, X. J. Mu, N. Carriero, P. Cayting, Z. Zhang, M. Snyder, and M. B. Gerstein. PEMer: a computationalframework with simulation-based error models for inferring genomic structural variants from massive paired-end sequencingdata. Genome Biol., 10:R23, 2009.
[17] J. O. Korbel, A. E. Urban, J. P. Affourtit, B. Godwin, F. Grubert, J. F. Simons, P. M. Kim, D. Palejev, N. J. Carriero, L. Du,B. E. Taillon, Z. Chen, A. Tanzer, A. C. Saunders, J. Chi, F. Yang, N. P. Carter, M. E. Hurles, S. M. Weissman, T. T. Harkins,M. B. Gerstein, M. Egholm, and M. Snyder. Paired-end mapping reveals extensive structural variation in the human genome.Science, 318:420–426, 2007.
[18] S. Lee, E. Cheran, and M. Brudno. A robust framework for detecting structural variations in a genome. Bioinformatics,24:59–67, 2008.
[19] K. M. Lower, J. R. Hughes, M. De Gobbi, S. Henderson, V. Viprakasit, C. Fisher, A. Goriely, H. Ayyub, J. Sloane-Stanley,D. Vernimmen, C. Langford, D. Garrick, R. J. Gibbons, and D. R. Higgs. Adventitious changes in long-range gene expressioncaused by polymorphic structural variation and promoter competition. Proc. Natl. Acad. Sci. U.S.A., 106:21771–21776, 2009.
[20] T. A. Manolio, F. S. Collins, N. J. Cox, D. B. Goldstein, L. A. Hindorff, D. J. Hunter, M. I. McCarthy, E. M. Ramos, L. R.Cardon, A. Chakravarti, J. H. Cho, A. E. Guttmacher, A. Kong, L. Kruglyak, E. Mardis, C. N. Rotimi, M. Slatkin, D. Valle,A. S. Whittemore, M. Boehnke, A. G. Clark, E. E. Eichler, G. Gibson, J. L. Haines, T. F. Mackay, S. A. McCarroll, and P. M.Visscher. Finding the missing heritability of complex diseases. Nature, 461:747–753, 2009.
[21] C.R. Marshall, A. Noor, J.B. Vincent, A.C. Lionel, L. Feuk, J. Skaug, M. Shago, R. Moessner, D. Pinto, Y. Ren, B. Thiru-vahindrapduram, A. Fiebig, S. Schreiber, J. Friedman, C.E. Ketelaars, Y.J. Vos, C. Ficicioglu, S. Kirkpatrick, R. Nicolson,L. Sloman, A. Summers, C.A. Gibbons, A. Teebi, D. Chitayat, R. Weksberg, A. Thompson, C. Vardy, V. Crosbie, S. Lus-combe, R. Baatjes, L. Zwaigenbaum, W. Roberts, B. Fernandez, P. Szatmari, and S.W. Scherer. Structural variation ofchromosomes in autism spectrum disorder. Am. J. Hum. Genet., 82:477–488, Feb 2008.
[22] P. Medvedev, M. Stanciu, and M. Brudno. Computational methods for discovering structural variation with next-generationsequencing. Nat. Methods, 6:13–20, 2009.
[23] L. M. Merlo, J. W. Pepper, B. J. Reid, and C. C. Maley. Cancer as an evolutionary and ecological process. Nat. Rev. Cancer,6:924–935, 2006.
[24] R. E. Mills, K. Walter, C. Stewart, R. E. Handsaker, K. Chen, C. Alkan, A. Abyzov, S. C. Yoon, K. Ye, R. K. Cheetham,A. Chinwalla, D. F. Conrad, Y. Fu, F. Grubert, I. Hajirasouliha, F. Hormozdiari, L. M. Iakoucheva, Z. Iqbal, S. Kang, J. M.Kidd, M. K. Konkel, J. Korn, E. Khurana, D. Kural, H. Y. Lam, J. Leng, R. Li, Y. Li, C. Y. Lin, R. Luo, X. J. Mu, J. Nemesh,H. E. Peckham, T. Rausch, A. Scally, X. Shi, M. P. Stromberg, A. M. Stutz, A. E. Urban, J. A. Walker, J. Wu, Y. Zhang,Z. D. Zhang, M. A. Batzer, L. Ding, G. T. Marth, G. McVean, J. Sebat, M. Snyder, J. Wang, K. Ye, E. E. Eichler, M. B.
15
Gerstein, M. E. Hurles, C. Lee, S. A. McCarroll, J. O. Korbel, D. L. Altshuler, R. M. Durbin, G. R. Abecasis, D. R. Bentley,A. Chakravarti, A. G. Clark, F. S. Collins, F. M. De La Vega, P. Donnelly, M. Egholm, P. Flicek, S. B. Gabriel, R. A. Gibbs,B. M. Knoppers, E. S. Lander, H. Lehrach, E. R. Mardis, G. A. McVean, D. A. Nickerson, L. Peltonen, A. J. Schafer, S. T.Sherry, J. Wang, R. K. Wilson, R. A. Gibbs, D. Deiros, M. Metzker, D. Muzny, J. Reid, D. Wheeler, J. Wang, J. Li, M. Jian,G. Li, R. Li, H. Liang, G. Tian, B. Wang, J. Wang, W. Wang, H. Yang, X. Zhang, H. Zheng, E. S. Lander, D. L. Altshuler,L. Ambrogio, T. Bloom, K. Cibulskis, T. J. Fennell, S. B. Gabriel, D. B. Jaffe, E. Shefler, C. L. Sougnez, D. R. Bentley,N. Gormley, S. Humphray, Z. Kingsbury, P. Koko-Gonzales, J. Stone, K. J. McKernan, G. L. Costa, J. K. Ichikawa, C. C.Lee, R. Sudbrak, H. Lehrach, T. A. Borodina, A. Dahl, A. N. Davydov, P. Marquardt, F. Mertes, W. Nietfeld, P. Rosenstiel,S. Schreiber, A. V. Soldatov, B. Timmermann, M. Tolzmann, M. Egholm, J. Affourtit, D. Ashworth, S. Attiya, M. Bachorski,E. Buglione, A. Burke, A. Caprio, C. Celone, S. Clark, D. Conners, B. Desany, L. Gu, L. Guccione, K. Kao, A. Kebbel,J. Knowlton, M. Labrecque, L. McDade, C. Mealmaker, M. Minderman, A. Nawrocki, F. Niazi, K. Pareja, R. Ramenani,D. Riches, W. Song, C. Turcotte, S. Wang, E. R. Mardis, R. K. Wilson, D. Dooling, L. Fulton, R. Fulton, G. Weinstock, R. M.Durbin, J. Burton, D. M. Carter, C. Churcher, A. Coffey, A. Cox, A. Palotie, M. Quail, T. Skelly, J. Stalker, H. P. Swerdlow,D. Turner, A. De Witte, S. Giles, R. A. Gibbs, D. Wheeler, M. Bainbridge, D. Challis, A. Sabo, F. Yu, J. Yu, J. Wang, X. Fang,X. Guo, R. Li, Y. Li, R. Luo, S. Tai, H. Wu, H. Zheng, X. Zheng, Y. Zhou, G. Li, J. Wang, H. Yang, G. T. Marth, E. P. Garrison,W. Huang, A. Indap, D. Kural, W. P. Lee, W. F. Leong, A. R. Quinlan, C. Stewart, M. P. Stromberg, A. N. Ward, J. Wu, C. Lee,R. E. Mills, X. Shi, M. J. Daly, M. A. DePristo, D. L. Altshuler, A. D. Ball, E. Banks, T. Bloom, B. L. Browning, K. Cibulskis,T. J. Fennell, K. V. Garimella, S. R. Grossman, R. E. Handsaker, M. Hanna, C. Hartl, D. B. Jaffe, A. M. Kernytsky, J. M. Korn,H. Li, J. R. Maguire, S. A. McCarroll, A. McKenna, J. C. Nemesh, A. A. Philippakis, R. E. Poplin, A. Price, M. A. Rivas, P. C.Sabeti, S. F. Schaffner, E. Shefler, I. A. Shlyakhter, D. N. Cooper, E. V. Ball, M. Mort, A. D. Phillips, P. D. Stenson, J. Sebat,V. Makarov, K. Ye, S. C. Yoon, C. D. Bustamante, A. G. Clark, A. Boyko, J. Degenhardt, S. Gravel, R. N. Gutenkunst,M. Kaganovich, A. Keinan, P. Lacroute, X. Ma, A. Reynolds, L. Clarke, P. Flicek, F. Cunningham, J. Herrero, S. Keenen,E. Kulesha, R. Leinonen, W. M. McLaren, R. Radhakrishnan, R. E. Smith, V. Zalunin, X. Zheng-Bradley, J. O. Korbel, A. M.Stutz, S. Humphray, M. Bauer, R. K. Cheetham, T. Cox, M. Eberle, T. James, S. Kahn, L. Murray, A. Chakravarti, K. Ye,F. M. De La Vega, Y. Fu, F. C. Hyland, J. M. Manning, S. F. McLaughlin, H. E. Peckham, O. Sakarya, Y. A. Sun, E. F. Tsung,M. A. Batzer, M. K. Konkel, J. A. Walker, R. Sudbrak, M. W. Albrecht, V. S. Amstislavskiy, R. Herwig, D. V. Parkhomchuk,S. T. Sherry, R. Agarwala, H. Khouri, A. O. Morgulis, J. E. Paschall, L. D. Phan, K. E. Rotmistrovsky, R. D. Sanders, M. F.Shumway, C. Xiao, G. A. McVean, A. Auton, Z. Iqbal, G. Lunter, J. L. Marchini, L. Moutsianas, S. Myers, A. Tumian,B. Desany, J. Knight, R. Winer, D. W. Craig, S. M. Beckstrom-Sternberg, A. Christoforides, A. A. Kurdoglu, J. V. Pearson,S. A. Sinari, W. D. Tembe, D. Haussler, A. S. Hinrichs, S. J. Katzman, A. Kern, R. M. Kuhn, M. Przeworski, R. D. Hernandez,B. Howie, J. L. Kelley, S. C. Melton, G. R. Abecasis, Y. Li, P. Anderson, T. Blackwell, W. Chen, W. O. Cookson, J. Ding,H. M. Kang, M. Lathrop, L. Liang, M. F. Moffatt, P. Scheet, C. Sidore, M. Snyder, X. Zhan, S. Zollner, P. Awadalla, F. Casals,Y. Idaghdour, J. Keebler, E. A. Stone, M. Zilversmit, L. Jorde, J. Xing, E. E. Eichler, G. Aksay, C. Alkan, I. Hajirasouliha,F. Hormozdiari, J. M. Kidd, S. C. Sahinalp, P. H. Sudmant, E. R. Mardis, K. Chen, A. Chinwalla, L. Ding, D. C. Koboldt,M. D. McLellan, D. Dooling, G. Weinstock, J. W. Wallis, M. C. Wendl, Q. Zhang, R. M. Durbin, C. A. Albers, Q. Ayub,S. Balasubramaniam, J. C. Barrett, D. M. Carter, Y. Chen, D. F. Conrad, P. Danecek, E. T. Dermitzakis, M. Hu, N. . Mappingcopy number variation by population-scale genome sequencing. Nature, 470:59–65, 2011.
[25] F. Mitelman, B. Johansson, and F. Mertens. Fusion genes and rearranged genes as a linear function of chromosome aberrationsin cancer. Nat Genet, 36(4):331–4, 2004.
[26] N. Navin, J. Kendall, J. Troge, P. Andrews, L. Rodgers, J. McIndoo, K. Cook, A. Stepansky, D. Levy, D. Esposito,L. Muthuswamy, A. Krasnitz, W. R. McCombie, J. Hicks, and M. Wigler. Tumour evolution inferred by single-cell se-quencing. Nature, 472:90–94, 2011.
[27] P. C. Nowell. The clonal evolution of tumor cell populations. Science, 194:23–28, 1976.
[28] G.H. Perry, A. Ben-Dor, A. Tsalenko, N. Sampas, L. Rodriguez-Revenga, C.W. Tran, A. Scheffer, I. Steinfeld, P. Tsang,N.A. Yamada, H.S. Park, J.I. Kim, J.S. Seo, Z. Yakhini, S. Laderman, L. Bruhn, and C. Lee. The fine-scale and complexarchitecture of human copy-number variation. Am. J. Hum. Genet., 82:685–695, Mar 2008.
[29] A. R. Quinlan, R. A. Clark, S. Sokolova, M. L. Leibowitz, Y. Zhang, M. E. Hurles, J. C. Mell, and I. M. Hall. Genome-widemapping and assembly of structural variant breakpoints in the mouse genome. Genome Res., 20:623–635, 2010.
[30] B.J. Raphael, S. Volik, C. Collins, and P.A. Pevzner. Reconstructing tumor genome architectures. Bioinformatics, 19 Suppl2:i162–171, 2003.
[31] B.J. Raphael, S. Volik, P. Yu, C. Wu, G. Huang, E.V. Linardopoulou, B.J. Trask, F. Waldman, J. Costello, K.J. Pienta, G.B.Mills, K. Bajsarowicz, Y. Kobayashi, S. Sridharan, P.L. Paris, Q. Tao, S.J. Aerni, R.P. Brown, A. Bashir, J.W. Gray, J.F.Cheng, P. de Jong, M. Nefedov, T. Ried, H.M. Padilla-Nash, and C.C. Collins. A sequence-based survey of the complexstructural organization of tumor genomes. Genome Biol., 9:R59, 2008.
16

[32] R. Redon, S. Ishikawa, K.R. Fitch, L. Feuk, G.H. Perry, T.D. Andrews, H. Fiegler, M.H. Shapero, A.R. Carson, W. Chen,E.K. Cho, S. Dallaire, J.L. Freeman, J.R. Gonzlez, M. GratacUs, J. Huang, D. Kalaitzopoulos, D. Komura, J.R. MacDonald,C.R. Marshall, R. Mei, L. Montgomery, K. Nishimura, K. Okamura, F. Shen, M.J. Somerville, J. Tchinda, A. Valsesia,C. Woodwark, F. Yang, J. Zhang, T. Zerjal, J. Zhang, L. Armengol, D.F. Conrad, X. Estivill, C. Tyler-Smith, N.P. Carter,H. Aburatani, C. Lee, K.W. Jones, S.W. Scherer, and M.E. Hurles. Global variation in copy number in the human genome.Nature, 444:444–454, 2006.
[33] A. Ritz, A. Bashir, and B. J. Raphael. Structural variation analysis with strobe reads. Bioinformatics, 26:1291–1298, 2010.
[34] M. C. Schatz, A. L. Delcher, and S. L. Salzberg. Assembly of large genomes using second-generation sequencing. GenomeRes, 2010.
[35] S.W. Scherer, C. Lee, E. Birney, D.M. Altshuler, E.E. Eichler, N.P. Carter, M.E. Hurles, and L. Feuk. Challenges and standardsin integrating surveys of structural variation. Nat. Genet., 39:7–15, Jul 2007.
[36] Andrew J Sharp, Ze Cheng, and Evan E Eichler. Structural variation of the human genome. Annu Rev Genomics Hum Genet,7:407–442, 2006.
[37] S. Sindi, E. Helman, A. Bashir, and B. J. Raphael. A geometric approach for classification and comparison of structuralvariants. Bioinformatics, 25:i222–230, 2009.
[38] M. Soda, Y.L. Choi, M. Enomoto, S. Takada, Y. Yamashita, S. Ishikawa, S. Fujiwara, H. Watanabe, K. Kurashina,H. Hatanaka, M. Bando, S. Ohno, Y. Ishikawa, H. Aburatani, T. Niki, Y. Sohara, Y. Sugiyama, and H. Mano. Identifica-tion of the transforming EML4-ALK fusion gene in non-small-cell lung cancer. Nature, 448:561–566, Aug 2007.
[39] P. Stankiewicz and J. R. Lupski. Structural variation in the human genome and its role in disease. Annu. Rev. Med., 61:437–455, 2010.
[40] P. J. Stephens, C. D. Greenman, B. Fu, F. Yang, G. R. Bignell, L. J. Mudie, E. D. Pleasance, K. W. Lau, D. Beare, L. A.Stebbings, S. McLaren, M. L. Lin, D. J. McBride, I. Varela, S. Nik-Zainal, C. Leroy, M. Jia, A. Menzies, A. P. Butler, J. W.Teague, M. A. Quail, J. Burton, H. Swerdlow, N. P. Carter, L. A. Morsberger, C. Iacobuzio-Donahue, G. A. Follows, A. R.Green, A. M. Flanagan, M. R. Stratton, P. A. Futreal, and P. J. Campbell. Massive genomic rearrangement acquired in a singlecatastrophic event during cancer development. Cell, 144:27–40, 2011.
[41] J. L. Stone, M. C. O’Donovan, H. Gurling, G. K. Kirov, D. H. Blackwood, A. Corvin, N. J. Craddock, M. Gill, C. M. Hultman,P. Lichtenstein, A. McQuillin, C. N. Pato, D. M. Ruderfer, M. J. Owen, D. St Clair, P. F. Sullivan, P. Sklar, S. M. Purcell, J. L.Stone, D. M. Ruderfer, J. Korn, G. K. Kirov, S. Macgregor, A. McQuillin, D. W. Morris, C. T. O’Dushlaine, M. J. Daly, P. M.Visscher, P. A. Holmans, M. C. O’Donovan, P. F. Sullivan, P. Sklar, S. M. Purcell, H. Gurling, A. Corvin, D. H. Blackwood,N. J. Craddock, M. Gill, C. M. Hultman, G. K. Kirov, P. Lichtenstein, A. McQuillin, M. C. O’Donovan, M. J. Owen, C. N.Pato, S. M. Purcell, E. M. Scolnick, D. St Clair, J. L. Stone, P. F. Sullivan, P. Sklar, M. C. O’Donovan, G. K. Kirov, N. J.Craddock, P. A. Holmans, N. M. Williams, L. Georgieva, I. Nikolov, N. Norton, H. Williams, D. Toncheva, V. Milanova,M. J. Owen, C. M. Hultman, P. Lichtenstein, E. F. Thelander, P. Sullivan, D. W. Morris, C. T. O’Dushlaine, E. Kenny,J. L. Waddington, M. Gill, A. Corvin, A. McQuillin, K. Choudhury, S. Datta, J. Pimm, S. Thirumalai, V. Puri, R. Krasucki,J. Lawrence, D. Quested, N. Bass, D. Curtis, H. Gurling, C. Crombie, G. Fraser, S. L. Kwan, N. Walker, D. St Clair, D. H.Blackwood, W. J. Muir, K. A. McGhee, B. Pickard, P. Malloy, A. W. Maclean, M. Van Beck, P. M. Visscher, S. Macgregor,M. T. Pato, H. Medeiros, F. Middleton, C. Carvalho, C. Morley, A. Fanous, D. Conti, J. A. Knowles, C. P. Ferreira, A. Macedo,M. H. Azevedo, C. N. Pato, J. L. Stone, D. M. Ruderfer, J. Korn, S. A. McCarroll, M. Daly, S. M. Purcell, P. Sklar, S. M.Purcell, J. L. Stone, K. Chambert, D. M. Ruderfer, J. Korn, S. A. McCarroll, C. Gates, M. J. Daly, E. M. Scolnick, and P. Sklar.Rare chromosomal deletions and duplications increase risk of schizophrenia. Nature, 455:237–241, 2008.
[42] B. E. Stranger, M. S. Forrest, M. Dunning, C. E. Ingle, C. Beazley, N. Thorne, R. Redon, C. P. Bird, A. de Grassi, C. Lee,C. Tyler-Smith, N. Carter, S. W. Scherer, S. Tavare, P. Deloukas, M. E. Hurles, and E. T. Dermitzakis. Relative impact ofnucleotide and copy number variation on gene expression phenotypes. Science, 315:848–853, 2007.
[43] S. A. Tomlins, D. R. Rhodes, S. Perner, S. M. Dhanasekaran, R. Mehra, X. W. Sun, S. Varambally, X. Cao, J. Tchinda,R. Kuefer, C. Lee, J. E. Montie, R. B. Shah, K. J. Pienta, M. A. Rubin, and A. M. Chinnaiyan. Recurrent fusion of tmprss2and ets transcription factor genes in prostate cancer. Science, 310(5748):644–8, 2005.
[44] E. Tuzun, A. J. Sharp, J. A. Bailey, R. Kaul, V. A. Morrison, L. M. Pertz, E. Haugen, H. Hayden, D. Albertson, D. Pinkel,M. V. Olson, and E. E. Eichler. Fine-scale structural variation of the human genome. Nat Genet, 37(7):727–32, 2005.
17

[45] S. Volik, S. Zhao, K. Chin, J.H. Brebner, D.R. Herndon, Q. Tao, D. Kowbel, G. Huang, A. Lapuk, W.L. Kuo, G. Magrane,P. De Jong, J.W. Gray, and C. Collins. End-sequence profiling: sequence-based analysis of aberrant genomes. Proc. Natl.Acad. Sci. U.S.A., 100:7696–7701, Jun 2003.
[46] K. Ye, M. H. Schulz, Q. Long, R. Apweiler, and Z. Ning. Pindel: a pattern growth approach to detect break points of largedeletions and medium sized insertions from paired-end short reads. Bioinformatics, 25:2865–2871, 2009.
[47] S. Yoon, Z. Xuan, V. Makarov, K. Ye, and J. Sebat. Sensitive and accurate detection of copy number variants using read depthof coverage. Genome Res., 19:1586–1592, 2009.
18

!B#A# C#
B#A# C#
Inversion#Reference##genome#
Individual#genome#
Figure 1: An inversion resulting from non-allelic homologous recombination (NAHR) between two nearlyidentical segmental duplications (blue boxes) with opposite orientations (arrows). The inversion flips theorientation of the subsequence, or block, B in one genome relative to the other genome.
Genomic(DNA(
Next%genera*on,DNA,sequencing,
millions%billions,of,reads&~30%1000,nucleo*des,
…,GGTAGTTAG,…,
…,TATAATTAG,…,
…,AGCCATTAG,…,
…,CGTACCTAG,…,
…,CATTCAGTAG,…,
…,GGTAAACTAG,…,
Align,reads,to,reference&genome,and,iden*fy,variants,
De&novo&assembly(Resequencing(
Construct,genome,sequence,from,overlaps,between,reads,
Figure 2: Two major approaches to detect structural variants in an individual genome from next-generationsequencing data are de novo assembly and resequencing. In de novo assembly, the individual genomesequence is constructed by examining overlaps between reads. In resequencing approaches, reads fromthe individual genome are aligned to a closely related reference genome. Examination of the resultingalignments reveals differences between the individual genome and the reference genome.
!" #" $"
!"#$%&'( !"#$%&'( !"#$%&'(&')&*+%( &')&*+%(
Figure 3: A strobe with 3 subreads.
19
Reference''genome'
Individual'genome'
Breakpoint+b"Breakpoint+a"
reads'
aligned'reads'Re
ad+dep
th+
a" b" Genome+coordinate+
Figure 4: Identification of a deletion in an individual genome by split read analysis (middle), and by depthof coverage analysis (bottom).
Reference''genome'
Individual'genome'
Concordant'pair'
Discordant'pair'
paired'reads'
aligned'paired'reads'
Length'
Freq
uency'
Figure 5: Paired End Mapping (PEM). Fragments from an individual genome are sequenced from bothends and the resulting paired reads are aligned to a reference genome. Most paired reads correspond toconcordant pairs, where the distance between the alignment of each read agrees with the distribution offragment lengths (right). The remaining discordant pairs suggest structural variants (here a deletion) thatdistinguish the individual and reference genomes.
20

Lmin%≤" ≤ Lmax%
Lmin%
(x,y)%
Right%b
reakpo
int%%
Le4%breakpoint%
(a,b)%
y%a% b%(a%–%x)% +% (y%–%b)%
breakpoint%region%
x%
Figure 6: (Top) A discordant pair (arc) indicates a deletion with unknown breakpoints a and b locatedin orange blocks. Positions x, y and the minimum Lmin and maximum Lmax length of end-sequencedfragments constrain breakpoints (a, b) to lie within the indicated orange blocks, and are governed by theindicated linear inequalities. (B) A polygon in 2D genome space expresses the linear dependency betweenbreakpoints a and b and records the uncertainty in the location of the breakpoints
21

Normal'genome'
Selec-on'and''clonal'expansion'
Sequencing'of'heterogeneous'mixture'
soma-c'muta-on'
Figure 7: Mutation, selection, and clonal expansion in tumor development leads to genomic heterogeneitybetween cells in a tumor. Current DNA sequencing approaches sequence DNA from many cells and thusresult in a heterogenous mixture of mutations, with varying numbers of both passenger mutations (black)and driver mutations (red).
22