![PSA [Conclusion]](https://static.fdocuments.net/doc/165x107/554fb5f0b4c9057b298b53ec/psa-conclusion.jpg)
Structural Transformation and Employment...
32
BACKGROUND PAPER FOR THE WORLD DEVELOPMENT REPORT 2013 Structural Transformation and Employment Creation: The role of growth facilitation policies in Sub-Saharan Africa Christian Kingombe and Dirk Willem te Velde Overseas Development Institute
Transcript of Structural Transformation and Employment...

BACKGROUND PAPER FOR THE
WORLD DEVELOPMENT REPORT 2013
Structural Transformation and Employment Creation:
The role of growth facilitation policies in Sub-Saharan Africa
Christian Kingombe and Dirk Willem te Velde
Overseas Development Institute

Acknowledgements
This paper is a draft background paper for the WDR2013. We would like to thank Sylvia Tijmstra
and Justin Ram for providing helpful research assistance. We are also grateful to an anonymous
referee for helpful comments and suggestions.
Overseas Development Institute
111 Westminster Bridge Road
London SE1 7JD, UK
Tel: +44 (0)20 7922 0300
Fax: +44 (0)20 7922 0399
www.odi.org.uk
Disclaimer: The views presented in this paper
are those of the author(s) and do not
necessarily represent the views of ODI or our
partners.

Structural Transformation and Employment Creation
iii
Contents
Contents iii Tables, figures & boxes iv Abstract v
1 Introduction 1
2 Background on the role of SEZs in promoting structural change and employment 2
3 The effects of SEZs on job creation and structural transformation in sub-Saharan Africa 6
4 Policies related to Special Economic Zones 12
5 Conclusion and policy suggestions 17
6 References 18
Annex A Employment in EPZs 22 Annex B The effects of special economic zones on labour productivity in Kenyan manufacturing 24 Annex C: Employment declines in zones linked to building zones around temporary trade
preferences: the example of Kenya and Lesotho. 26
Structural Transformation and Employment Creation
iv
Tables, figures & boxes
Tables
Table 1: Employment in Special Economic Zones 6 Table 2: Exports by Special Economic Zones 7 Table 3: What factors and policies can situate SEZs as a tool for employment creation and
structural transformation 15 Table A1. EPZ employment in selected countries, 2002–06 (ranked by 2002 employment) 22 Table A2: Change in EPZ share of exports, selected economies (2002, 2006) 23 Table B1: EPZ and labour productivity in Kenyan manufacturing 25 Table C1 Zones and trade preferences 26
Figures
Figure 1: Labour productivity as % of OECD labour productivity 3 Figure 2: Achieving employment creation and structural transformation 5 Figure 3: Employment in African SEZs 7 Figure 4: SEZs, employment creation and structural transformation 11 Figure 5: The virtuous circle of social cohesion and well performing SEZs 16
Figure B1: The share of EPZ employment in Kenya manufacturing employment 24
Boxes
Box 1: Clustering in zones built around comparative advantage 12 Box 2: Best practices in market-friendly human resource development in Malaysia and Singapore 13
Structural Transformation and Employment Creation
v
Abstract
Employment creation and structural transformation are amongst the two major challenges facing
the countries of Sub-Saharan Africa at present. Based on the understanding that appropriate
growth policies will be able to address these challenges, this paper examines whether SEZs could
be an important ingredient of such strategies. So far many African SEZs have been unable to
create significant employment or foster structural change. However, there are some positive
exceptions with respect to employment creation in countries such as Mauritius, Kenya, Lesotho,
Madagascar and Ghana. The SEZs that have contributed to structural transformation are located
mainly outside Africa (e.g. Malaysia and Singapore) and these experiences show that it takes a
great deal of complementary policies to enhance the positive impacts.
We argue that SEZs may still play a more important role in SSA as long as SEZs are retooled to i)
facilitate growth adequately using good quality policies and adequate support institutions; ii)
emphasise the clustering aspects of zones and iii) are able to adapt to new global conditions. This
involves taking risks which may only pay off when policies can be implemented consistently
backed up by significant capacity and fit in with overall growth strategies.
The evidence on the success and failure of using SEZs as a growth and employment policy tool
seems to indicate that social cohesion, employment generation, and structural transformation are
often found together. We suggest there is a virtuous circle amongst social cohesion, good quality
growth policies and beneficial outcomes, which in turn increases social cohesion.
We also provide new econometric evidence which suggests that SEZs in Kenya have helped to
create some 40,000 manufacturing jobs and increased manufacturing labour productivity by some
20% in the decade to 2006 (or 2% per annum). This suggests that in principle it is possible for
SEZs to be both job creating and productivity enhancing, although there are also questions about
whether the transformative productivity effects can be sustained forever.

Structural Transformation and Employment Creation
1
1 Introduction
Employment creation and structural economic transformation are amongst the two major
challenges at the forefront of current African growth and development strategies. At the micro
level, employment creation provides opportunities for earnings and underpins increases in
household expenditures and secure livelihoods. At the meso and macro levels, development
occurs through the reallocation of labour across sectors towards sectors with the greatest growth
potential and the highest productivity. Jobs also facilitate social (e.g. female wage employment)
and political (seeking identity) transformations. However, it is not easy to achieve sustained
employment generation. This paper examines the role of growth policies in promoting
employment and specifically examines whether and how the establishment of special economic
zones (SEZs) can help to promote employment that can be sustained over time and which can
raise an economy’s productivity and have spill-over and linkage effects on the rest of the
economy, including through effects on export promotion technology and skills. It then makes the
link with social cohesion.
There is a well-established debate on the role of the state in steering development and governing
the market (e.g. Wade 1991) and this has recently gained in importance with respect to growth
policies. Recent developments in the theory and practice of growth identification and facilitation
(see symposium in Development Policy Review by Lin et al., 2011) suggest there is an important
role for the state in supporting growth. One of the growth policy tools considered in this debate is
the creation of SEZs consistent with a country’s comparative advantage in order to attract
investment. There is a rapidly growing literature on the performance of SEZs or export processing
zones (EPZs) (see e.g. Madani, 1999; ILO, 2008; Farole, 2011).
SEZs can provide adequate infrastructure and public sector services in a limited area when it is
not possible to provide these on an economy-wide basis, but there is no guarantee that this (i)
attracts investors and jobs; and (ii) has positive spill-over effects. In addition, the recent
emphasis on the success of SEZs in middle income countries (MICs) and on the new SEZs being
built by emerging markets in Africa is leading to a reassessment (Draper et al, 2011) of whether
SEZs can help to facilitate development transformations and whether and how SEZs are directly
related to social cohesion. Jobs in SEZs can lead to more social cohesion by fostering coordination
and progress amongst different groups in society, or they could polarise such groups by
segregating jobs into those in “enclaves” and those in the rest of the economy, which could affect
local perceptions of SEZs. At the same time social cohesion and better state-business
relationships will lead to better design and implementation of SEZs.
The structure of this paper is as follows: Section 2 provides background on the possible role of
SEZs in fostering a type of growth that can create employment and promote structural
transformation. Section 3 reviews the evidence on the extent of which SEZ can boost employment
and productivity based on a review of a dozen well-documented SEZs which reflect appropriately
the large variety in the performance of the rather large amount of SEZs. Section 4 discusses the
conditions under which SEZ policies are most effective. Section 5 concludes.

Structural Transformation and Employment Creation
2
2 Background on the role of SEZs in promoting structural change and employment
Structural transformation
Ensuring high and sustained economic growth rates combined with high levels of social
development in low income countries (LICs) is unlikely to be achieved without productivity
changes based on widespread economic diversification and structural transformation (Hall and
Jones, 1999; Lin et al, 2011; UNECA, 2011). The achievement of development goals and higher
living standards will therefore depend on the ability of countries to foster entrepreneurship and
promote innovation, including the spread, adaptation and adoption of pre-existing know-how and
techniques, services, processes and ways of working. Unfortunately, much of the growth in low
income countries over the last decade has not led to structural changes (see e.g. UNCTAD, 2011
for evidence specifically for LDCs).
Innovation and technological development involves a process of learning and building up
technological and human capabilities (Lall, 2001). This process is beset by market and co-
ordination failures; the process of addressing these challenges needs to be facilitated by the state
(as recently emphasised by Lin and Monga, 2011). The question is what works in practice,
especially in LICs where in addition to the what, the how matters too: politics (e.g. elite bargains),
capacity constraints and weak institutional contexts are also important considerations in
understanding whether state supported interventions help, and may help to explain the lack of
growth-enhancing innovation in LICs.
Employment-creation and labour productivity
ILO (2012) argues that the employment-intensity of growth in Africa has been low. Employment
growth was 3.1% over 2002-2007, and declined to 2.8% over 2008-2011. Labour productivity
growth in sub-Saharan Africa has been lower than in most other developing country regions over
the past decade, at around 2 per cent a year, the same as the world average. The gap in labour
productivity (output per worker) between SSA and developed countries has not narrowed since
1991 (see figure 1 and ILO, 2005 for earlier evidence). Of course there is wide variety in
performance across countries.
There is an active debate on the incidence and causes of labour productivity changes in Africa.
Much of aggregate productivity change happens within firms in advanced countries (Bartelsman et
al., 2009) implying that innovation can be fostered through firm upgrading. For example firm
upgrading could occur through managerial changes (Bloom and Van Reenen, 2007). Others argue
that productivity differentials are particularly large in developing countries (Hsieh and Klenow,
2009) not within but among firms within a sector, implying that productivity growth happens
through enabling entry and exit of firms. Recently, researchers McMillian and Rodrik (2011) and
IMF (2012) have highlighted the potential of aggregate productivity change through enabling
shifts of labour between sectors. McMillan and Rodrik (2011) argue that labour flows from low-
productivity activities to high-productivity activities are a key driver of structural change and
development. Importantly, they argue that since 1990 structural change has been growth
reducing in Africa. On the other hand, IMF (2012), examining more African countries and over a
longer time period, paints a more optimistic picture of structural transformation and productivity
change in African countries.

Structural Transformation and Employment Creation
3
For example, IMF (2012) argues that (i) Burkina Faso succeeded in raising average agricultural
productivity levels in recent years through good agricultural policy; (ii) Tanzania has succeeded in
rapid productivity growth and developing its manufacturing sector helped by structural reforms,
reductions in tariffs and non-tariff barriers, market deregulation and privatization, and large public
investments in infrastructure, including in the energy sector; (iii) Namibia has successfully
diversified away from non-renewable natural resources, through key interventions including the
development of export processing zones, industrial parks, small- and medium-size enterprise
(SME) development programmes, and active promotion and marketing of Namibia’s investment
opportunities to potential foreign investors.
Figure 1: Labour productivity as % of OECD labour productivity
Source: WDI (2012). GDP per employee (PPP dollars)
Labour productivity growth is a crucial element in the structural transformation of economic
societies. But broad-based growth based on job-creation is important in maintaining stability and
improving social cohesion. In the short-run, increased labour productivity could mean fewer jobs,
but in the long-run labour productivity improvements are essential for competitiveness and long-
run employment growth (Lall, 2001; ILO, 2005).
Employment-based growth policies
Employment-based growth policies are aimed at facilitating structural transformation and
employment-creation. There are three types.
First of all, standard growth policies will increase economic activity (see e.g. Commission on
Growth and Development, 2008) and hence create jobs. Growth involves attracting more
investment (factor accumulation) and promoting innovation (factor productivity) using innovation
and technology policy, industrial policy, trade policy, infrastructure, skills and competitiveness
policy and streamlining the administrative procedures. However, economic activity may be
insufficiently employment-based, especially as the employment elasticity of growth is declining
over time (ILO, 2011).
Structural Transformation and Employment Creation
4
Secondly, growth policies that attract relatively employment-intensive activities (compared to the
country average) or promote technological progress that makes labour more productive try to
increase the employment intensity of growth.
Finally, there are a set of other policies such as active labour market programmes (ALMPs) and
public works programmes which aim to increase employment. Kingombe (2011) discusses TVET
policy as an important component within the toolbox of various ALMPs.
There is an extensive literature on growth policies. For example, growth diagnostics (Hausmann et
al. 2005), investment climate support (WDR 2005) and competitiveness studies (Porter, 1998) all
try to identify policies that can enhance growth. The Commission on Growth and Development
(2008) report is a standard reference referring to five factors of growth important in successful
cases of growth: openness, leadership, macroeconomic stability, investment, market allocation.
Lin and Monga (2011) introduce a practical procedure to identify the sources of growth and
facilitate growth: a 6-step growth identification and facilitation procedure in which SEZs play a
direct role.
Step 1: Governments should select dynamically growing countries with a similar
endowment structure and with about 100% higher per capita income than their own
average. They must then identify tradeable industries that have grown well in those
countries for the previous 20 years.
Step 2: If some private domestic firms are already present in those industries, they
should identify constraints to technological upgrading or further firm entry, and take
action to remove such constraints.
Step 3: In industries where no domestic firms are present, policy-makers may try to
attract foreign direct investment (FDI) from countries listed in step 1, or organise new
firm-incubation programmes.
Step 4: In addition to the industries identified in step 1, the government should also
pay attention to spontaneous self-discovery by private enterprises and support the
scaling up of the successful private innovations in new industries.
Step 5: In countries with poor infrastructure and a bad business environment, special
economic zones or industrial parks may be used to overcome barriers to firm entry and
FDI and encourage the formation of industrial clusters.
Step 6: The government should be willing to compensate pioneer firms in the
industries identified above with tax incentives for a limited period, cofinancing for
investments, or access to foreign exchange.
A key challenge is to design and implement appropriate growth facilitation policies that can both
create employment and promote structural transformation, as visualised in Figure 2. Some
policies may promote innovation and transformation but not significant employment (e.g. high-
tech R&D), whilst in other cases they may create jobs of low quality (e.g. light manufacturing
assembly operations, although this could be more productive than the average of the rest) and
the sustainability of policies is questioned. Appropriate employment-based growth policies should
be able to achieve both. A major challenge is finding the key ingredients of such appropriate
policies.
Te Velde (2002) and Te Velde and Xenogiani (2007) argue that it is not straightforward to move
from the bottom left to the top right of the figure because co-ordination and market failures might
keep countries in a low-skill low investment trap. There is a need for consistent, active, strategic
and market friendly human resource policy to get out of this low-skill, low-income trap and
upgrade towards a high skill development path in the top right. For example, Costa Rica was able
to use FDI to upgrade on the basis of strategic investment and human resource policies, whilst its
neighbours were not.

Structural Transformation and Employment Creation
5
Figure 2: Achieving employment creation and structural transformation
Towards structural transformation Tow
ard
s m
ore
em
plo
ymen
t cr
eati
on
The role of special economic zones
The use of SEZs is one element in growth policies that could potentially have a net positive impact
on employment as well as foster structural transformation. Farole (2010) defines zones as
demarcated geographical areas within a country’s national boundaries where the regulation of
firms’ activity and the dedicated policies are differentiated from those applied to firms outside the
zone, and addressed to creating a policy environment and associated infrastructure that is
exporter friendly, for both domestic and foreign producers. There are various types of SEZs (for a
fuller classification, see e.g. Farole, 2011). The most common zones are export processing zones
(EPZs) which are fenced-in zones offering duty free trade and administrative services; in practice
EPZ firms can also be single factory schemes. At the other end of the spectrum, enterprise zones
or technology parks are aimed to fostering clusters of firms and support industries. Africa contains
these two extremes. For example, Malawi has a number of single factory EPZ schemes to avail of
US trade preferences for garments, while the Ebone tower in Mauritius is a purpose-built tower
hosting a number of ICT companies.
There are essentially two views on the role of SEZs. Many considered the creation of an SEZ
(Madani, 1999; Watson, 2001) a second best option when the first best option of free trade is not
achievable due to political economy reasons. However, Stein (2008) argues that SEZs should
instead be considered a viable policy instrument as part of a more general industrial policy
framework (Belloca and di Maio, 2011). In this view, geographical clustering through zone
development can be good for raising productivity. Clusters are geographic agglomerations of
companies, suppliers, service providers and institutions, linked across the supply chain.
Companies in clusters can become more specialised, productive and innovative with externalities
for the sector and economy as a whole (see e.g. Porter 1998).
In practice, the rationale for setting up SEZs rests on a combination of such arguments as
clustering and streamlined trade policies mixed with pragmatism of supporting economic activity
where the state sees an opportunity to help and feels the need to respond to pressures. Therefore
it is important to examine the impact of SEZs.
The key hypotheses for this paper include (i) SEZs can raise a country’s productivity and change
the economic structure and (ii) SEZs can create employment in a sustained way. Moreover (iii)
these aims are more likely to happen when SEZs are implemented in socially cohesive society with
extensive links between SEZs and the rest of the economy. The rest of this paper examines these
issues in greater detail.

Structural Transformation and Employment Creation
6
3 The effects of SEZs on job creation and structural transformation in sub-Saharan Africa
We explore and categorise available evidence on the role of SEZs in three areas: i) level and type
of jobs; ii) productivity and innovation; and iii) social cohesion.
Level and type of jobs
When SEZs are able to attract investment that would otherwise not have been able to come, they
create additional jobs. The available data on the employment impact suggests that there are
approximately 3,000 zones in 135 countries, accounting for over 68 million direct jobs and over
$500 billion of direct trade-related value added within zones (FIAS, 2008). Overall SEZs do not
play a large role in overall employment is most African countries. Some 1 million SEZ jobs were
found in 91 SEZs in 20 SSA countries which represents only 0.2% of national SSA employment
(table 1). Half of the EPZ employment in SSA is in South Africa, but a significant share of
employment in EPZs is also found in Mauritius, Lesotho, Kenya, Nigeria and Madagascar (ILO,
2007; and table A1). Figure 3 provides a number of country examples. There are interesting
exceptions and promising examples. For example, in Ghana, employment in SEZs increased from
4,000 in 1998 to 27,798 in 2010. The share of SEZ employment as a per cent of total formal
employment is around 3% in Tanzania and Ghana and around 1.5% in Kenya (where the share of
SEZs in manufacturing employment is reportedly 15%).
Table 1: Employment in Special Economic Zones
Direct Employment (millions)
Percentage of National Employment
Global 68.441 0.21%
Asia and the Pacific 61.089 2.30%
Americas 3.084 1.15%
Central / East Europe and Central Asia 1.59 0.00%
Middle East and North Africa 1.458 1.59%
Sub-Saharan Africa 1.04 0.20%
FIAS (2008) using data for 2006

Structural Transformation and Employment Creation
7
Figure 3: Employment in African SEZs
Source: Based on ILO and own research (data refer to, 2010 or earlier)
SEZs are associated with significant exports and investment. SEZs make up a significant share of
total exports (see table 2, and annex table A2). They also attract significant shares of FDI. This
suggests that SEZs attract jobs especially linked to the international economy. This can be done in
at least two differing ways: building on comparative advantage or utilising trade preferences.
Ghana’s experience is notable in that it used a zone to bring together cocoa and timber based
processing firms and build on its comparative advantage and promote exports. Many jobs in
African zones however are linked to trade preferences for garment assembly operations. Based on
ILO, WB and local data sources, jobs in SEZ in Africa are in textiles and garments (90% in
Mauritius and Madagascar, 33% in Kenya, 11% in Tanzania and Zimbabwe) and agro-processing
(60% in Ghana, 50% in Zimbabwe, 18% in Kenya), with other activities covering other light
manufacturing and services.
Table 2: Exports by Special Economic Zones
Zone Exports (US$ millions)
Percentage of Exports
Global 851,032 41%
Asia and the Pacific 510,666 41%
Americas 72,636 39%
Central and East Europe and Central Asia 89,666 39%
Middle East and North Africa 169 36%
Sub-Saharan Africa 8,605 49%
FIAS (2008) using data for 2006

Structural Transformation and Employment Creation
8
The additionality of employment could be questioned since significant employment generation
takes place in single factory schemes for which it is difficult to construct a counterfactual. Whilst
Ghana created quite a number of SEZ jobs, some 90% was due to single factory schemes in
Ghana and half in Kenya. On the other hand anecdotal evidence suggests that certain individual
investments are additional. For example, following persistent issues with the EPZ scheme, Mount
Meru Millers Limited moved its agro-processing activities to Uganda in 2011. While the firm
continues to buy sunflower seeds from Tanzanian farmers, the move of the processing facilities
reportedly led to the loss of hundreds of direct jobs.1
The employment impact of zones is directly linked to their overall economic performance. For
example in Burundi, although some experience in marketing and selling to Europe has been
gained and made available to other exporters, most benefits expected from the Zone Franche did
not materialize: there was no significant attraction of FDI, and only slight employment creation in
the Zone (Burundi IPR, 2009). By contrast, in Mauritius the EPZ Programme was at the heart of
the government's industrial development strategy in the 1970s and 1980s, and helped to attract
FDI inflows in labour-intensive manufacturing, mainly from Asia, and concentrated on knitwear
and garments manufacture. During this period the EPZ provided a significant amount of jobs,
contributed more value-added and earned more export revenue than sugar, which was the
primary engine of growth until then (IPR Mauritius, 2001). In Madagascar, EPZ activity grew at an
average rate of 20.2 percent between 1996 and 2001, textile exports expanded significantly
(thanks to the preferential access of clothing items to the American market within the AGOA), and
significant jobs were created as a result (DTIS Madagascar, 2003).
Productivity and innovation effects
SEZ can also be associated with productivity and innovation effects throughout the economy
through technological linkages (e.g. through demonstration effects on technology), skill linkages
(e.g. when former SEZ staff set up companies elsewhere), export linkages (does the SEZ help
exports by non-SEZ firms), and regulatory linkages (when SEZ regulation changes economy-wide
regulation). SEZs can have long-lasting consequences and lead to structural change when they
are associated with productivity and innovation effects.
The evidence on SEZ suggests there are a number of successful countries that have used zones to
upgrade their economies and change their export structures, but these come mainly from outside
Africa, e.g. Malaysia, Singapore, Costa Rica and Dominican Republic. For example, Johansson and
Nilsson (1997) use statistical methods to show that in the case of Malaysia the export generating
effect of the Malaysian EPZs is larger than the exports from the country’s EPZs, indicating the
presence of a catalytic effect. Moreover, these successful cases in Asia have put in place
deliberate activities to raise the innovation potential of SEZs (e.g. conditions to make it cost-
effective to use local suppliers, upgrading of domestic capabilities, encouraging labour circulation,
upgrading the investment climate).
There is a large literature on the transformational impact of SEZs in China (see e.g. Yeung et al.
2008). Zhihua Zeng (2011) suggests that SEZs and industrial clusters have made crucial
contributions to China’s economic success. They have also played important roles in bringing new
technologies to China and in adopting modern management practices. The Chinese experience
suggests that clustering and impetus for further reform are co-benefits from SEZs (Graham,
2004), in addition to static effect on exports and jobs. Zhihua Zeng (2010) argues that there are a
number of factors behind the Chinese model: strong commitment to reform and pragmatism from
top leadership; preferential policies and institutional autonomy; strong support and proactive
participation of governments: Foreign Direct Investment and the Chinese diaspora; technology
11 http://allafrica.com/stories/201106080422.html

Structural Transformation and Employment Creation
9
learning, innovation, upgrading, and strong links with the domestic economy; innovative cultures;
clear objectives, benchmarks, and intense competition; and locational advantages.
Whilst SEZs have coincided with changes in the export structure in successful Asian countries this
was less so in Africa, with the exception of Mauritius and perhaps Kenya. The success in Mauritius
is due to its efforts in the area of education, innovation, and institutional support (UNECA, 2011).
The EPZ sector had multiplier effects on the economy; in particular, it created demand for services
in packaging, consultancy, water, electricity, transport, mechanical workshops etc, and it led to
some backward linkages for the assembly sector. Domestic firms have been able to learn from
foreign firms. While EPZ exports in the 1980s were mainly from foreign firms, by 2000 these
exports were often from national firms. Such substitutability is important for the footloose
garment industry. Mauritian firms have also been somewhat successful in raising the quality of
garment products and in acquiring design and marketing capabilities (UNCTAD, 2001). Annex B
shows that EPZs have helped to raise labour productivity in Kenyan manufacturing by some 20%
in the decade to 2006, or 2% per annum (in addition to the increase in employment by some
40,000).
Whilst there were significant employment increases in SEZs in Ghana, granting free zone status to
individual firms located outside of designated zones may have reduced clustering effects and the
opportunities for spillovers (UNCTAD, 2003). The spillover effects in Madagascar are likely to be
limited as the Zone Franche companies primarily rely on imported material inputs and the
workforce predominantly consists of low-skilled female workers who do not tend to stay with the
firm for very long (Cling et al, 2005).
In conclusion, SEZs can have long-lasting innovation, productivity and transformational effects,
but this has mainly been the case in Asian countries which have put in place a set of deliberate
actions to enhance the positive spill-overs.
Social cohesion
The link between SEZs and social cohesion centres around a set of three tensions: (i) how do the
social conditions in SEZs compare with the rest of the economy; (ii) are SEZs a tool for attracting
FDI and exports, or are they seen as a social development tool for stimulating jobs and economic
activity in backward regions; and (iii) linked to (ii) are SEZs static enclaves or are they fully linked
dynamically into the rest of the economy benefitting all groups in society without political
protests?
On the first tension, Farole (2011) suggests SEZs tend to pay higher wages than the national
minimum wage and employ a relatively large female proportion. They are also less unionised and
some unsuccessful zones are segregated from the rest of the labour market. Building on evidence
from around the world, Amengual and Milberg (2008) find that wages tended to be higher among
EPZ workers than other sectors of the economy (Bangladesh, Costa Rica, Honduras, Madagascar,
and Sri Lanka). Workers in EPZs tend to work more hours (excessive, and often illegal overtime)
when compared with other sectors in the economy (Bangladesh, Madagascar, Sri Lanka). At an
absolute level, there are reports of violations of freedom of association in EPZs throughout the
world, but the evidence is inconclusive regarding the differences between conditions inside and
outside EPZs. Most studies find very few unions inside and outside of EPZs alike. Further, whilst
an ITUC report (2008) and a number of ICTFU (2004, 2003) reports found that the ILO’s core
labour standards are violated in Madagascar, Cling et al., 2007) argue that the situation within the
Zone Franche is not notably different than elsewhere in the country. So whilst it is important to
improve labour institutions when a country develops, it cannot be stated a priori that SEZs help or
hinder this process.

Structural Transformation and Employment Creation
10
On the second tension, McCallum (2011) asks how can we reconcile the “success” of the EPZ
model as an engine of FDI versus their “success” as instrument of social development? The case
of China and South Africa appear to suggest these are contrasting objectives. In China, EPZs have
grown in popularity across the economy, attracted many investors, and turned the government
further toward capitalist development, whilst at the same time restricting workers’ rights. In
South Africa, by contrast, where unions have retained power in government and have succeeded
in holding EPZ employers accountable to workers, the strategy has failed to produce noticeable
gains or attract sufficient investors. Whereas SEZs in China and maquilas in Honduras were set up
primarily in ports with the highest levels of existing industrialisation, South Africa tried to use
zones to catalyze social development in places with low levels of industrialisation, where FDI
would otherwise not necessarily go. Glick and Roubaud (2006) find that in Madagascar, growth in
Zone Franche contributes substantially to improved overall gender equity in earnings in the urban
economy.
Finally, with respect to the third tension, whilst SEZs are not important in quantitative terms in
most African countries with respect to employment, they are criticised for poor labour standards
especially when they are localised enclaves with little interaction with the rest of the economy. But
when they work well, and when there is significant interaction between SEZs and the local
economy, SEZs can generate significant employment and lead to upgrading. It seems that social
cohesion, employment creation, and structural change go hand in hand in the case of SEZs. The
experience of several Asian SEZs suggests mobility is good. There is a lot of interaction between
SEZs and the local economy in successful zones, e.g. encouraging mobility through transport links
in China’s Shenzhen SEZ (World Bank, 2009), or through supplier development programmes (as
in Singapore), but in much of Africa where the interaction with the local economy is less, or in
areas where SEZs are placed in lagging regions, the dynamic effects are much less. This also
applies to Latin American countries where the maquiladoras tend to have weak linkages with the
domestic economy (UNCTAD, 2011).
In Madagascar, there are strong links between EPZ firms and local suppliers. As a result, the
indirect to direct job ratio is relatively high. In 1997, it was estimated that 1.4 indirect jobs were
created for every direct Zone Franche (Cling and Letilly, 2001). A more recent study estimates an
indirect to direct job ratio of 0.7 (Cling, et al., 2005). Both compare favourably to the indirect to
direct job ratio in Mauritius, which an ILO study put at 0.25 in 1998 (Cling and Letilly, 2001). In
Mozambique there have been some inward linkages between Mozambican metallurgy service firms
in the Beleluane EPZ and a big Mozal smelter (Government of Mozambique, 2004).
Conclusion
This review suggests that the wide variety of zones world-wide have a mixed performance. Zones
in some countries have not progressed significantly on any of the indicators (e.g. Nigeria and
Senegal). The most successful zones in Africa include Ghana, Lesotho, Madagascar and Kenya, but
with the latter suffering from or at risk from declining preferences, and all are facing stagnation at
present, so some note of caution is required when describing them as successful. Whilst these
countries have used their zones to promote employment, albeit under severe challenges, they
mostly failed to use the zones for structural transformation although the evidence on the past role
of EPZs in Kenya was positive. Promising zones in Mauritius, Dominican Republic and Costa Rica
have helped to upgrade the country towards higher value added actions. Singapore and Malaysia
are examples of where zones (e.g. Jurong, Penang) have transformed the country with significant
job creation. For the successful cases it seems that social cohesion, employment creation, and
structural change go hand in hand.
Figure 4 presents a crude overview along the employment creation – structural transformation
scale. Countries such as Singapore, Malaysia and Costa Rica have been able to get out of the low
skill – low income trap and these countries also have a high score on social cohesion measures

Structural Transformation and Employment Creation
11
such as lack of political troubles. The same is true for African countries: countries with non or
weakly-functioning zones (e.g. Burundi, Nigeria, Senegal) have a much higher score on political
troubles (African Economic Outlook) than countries such as Ghana, Lesotho and Mauritius.
Figure 4: SEZs, employment creation and structural transformation
Towards structural transformation Tow
ard
s m
ore
em
plo
ymen
t cr
eati
on
SingaporeMalaysia
Costa RicaDominican RepublicMauritius
KenyaMadagascarGhanaLesotho
TanzaniaNigeriaMalawiSenegal

Structural Transformation and Employment Creation
12
4 Policies related to Special Economic Zones
In order to promote structural transformation as well as employment, we need to examine the key
ingredients behind growth policies that can attract (good quality) jobs, facilitate positive spill-over
effects through innovation and do not undermine social cohesion. Under what circumstances can
SEZs be a policy tool for countries to transform their economies structurally? For example, what
policies have been effective in enhancing the linkages between SEZs and the rest of the economy?
What institutional set-up and capacity is needed for this?
We suggest that countries need to think about 3 types of issues if they want to have effective
SEZs. They need to (i) find solutions to meeting global opportunities, (ii) regard SEZs as a
strategic tool, and (iii) consider lessons learned from some of the above mentioned best-practices
in implementation.
Do SEZs respond to global developments?
There are at least three types of SEZs that can successfully address global developments. First,
SEZs can be designed to make use of trade preferences, e.g. countries that receive trade
preferences in G20 countries (e.g. via US AGOA or EU’s EBA) could import materials and export
process goods whilst drawing preferences. This is often time bound and production may shift
when preferences change (e.g. the end of the MFA quotas for textiles and clothing), and hence
countries can use this method only temporarily as long as they are sufficiently flexible to respond
and when they do, they need to ensure they draw long lasting benefits from it (see annex C for
the effect of preferences). With tariffs declining the value of the SEZ benefits are also declining.
Most zones in sub Saharan Africa fall in this category, but others such as maquiladoras in Latin
America do as well.
This strategy comes with a risk. Cling et al (2007) suggest that EPZs which are focused only on
garment assembly can no longer be placed at the core of development and employment policies in
Africa after the end of MFA quotas. Mauritius, Madagascar and Kenya have already suffered
declines in recent years. For example, the value added in the EPZs in Madagascar dropped 5% in
2010, repeating the negative performance of 2009. The textile industry accounts for about 95% of
the firms in these zones, with ownership largely foreign – French, Mauritian and Chinese (AfDB et
al., 2011).
Box 1: Clustering and Special Economic Zones
A number of examples of successful SEZs centre around clusters that build on comparative advantage. Clusters fall into Schmitz’s definition of a cluster as a geographic and sectoral agglomeration of
enterprises. Clusters of firms can learn from each other and benefit from scale. Successful clusters from
the literature include: The Tema cluster in Ghana which builds on the agri-business sector; the Shenzhen cluster in China; Jurong Park in Singapore which e.g. built a petrochemical cluster; Penang in Malaysia which built a skills and technology park around electronics, and the Ebone Tower in Mauritius which builds on the offshore services market. Some of these clusters fit well in the country’s development stage or comparative advantage, others seem to be comparative advantage defying. Nadvi and Barrientos (2004) present evidence on the incomes and employment impacts of clusters.
Clusters are particularly useful if and when there are dense interactions amongst firms and support institutions, and these interactions may not occure just because of the close geographical proximity. From this perspective it may also be beneficial to create a SEZ for existing clusters that are already characterised by dense relationships amongst its stakeholders.

Structural Transformation and Employment Creation
13
The other two motivations for SEZs which can also aim to meet global demand and can do so from
a position of (i) comparative advantage conformity or (ii) comparative advantage defiance under
the right circumstances. For example, we discussed how in Ghana (the Tema SEZ) the main SEZ
is based on a clustering of agro-companies around the comparative advantage. With commodity
prices high and scarcity of natural resources increasing, countries that possess such natural
resources could build on the comparative advantage by building SEZs (see also box 1). This would
fall under what Justin Lin call comparative advantage conforming industrial policy.
Yet, comparative advantage defying SEZs could, under the right circumstances, also address
global opportunities; see e.g. the zones in Singapore and Malaysia which helped to put the
country on a technologically more advanced path. Employing SEZs to follow a comparative
advantage defying path requires significant implementation capacity and (additional) strategic
interventions. Singapore and Malaysia implemented alongside SEZs a set of human development,
incentive and technology measures, and involving a range of activities (box 2). This ensured that
these zones became a success even though they at first attracted activities that were new to their
economies. This could now apply to off-shored services which could be attracted to African
countries (e.g. Ghana, Rwanda and Mauritius).
Box 2: Best practices in market-friendly human resource development in Malaysia and Singapore
Malaysia has seen government initiatives for providing training, aimed at encouraging the role of the private sector and reducing the role of the government in training activities. Malaysia introduced (the
following policies in the 1990s:
1) Promoting private sector participation in human resource planning through the National Vocational Training Council.
2) Promoting the role of the private sector in the provision of training through tax deduction on
training expenses in approved institutions; the establishment of a Human Resource
Development Fund (HRDF) imposing a levy of 1% of employees’ wages which employers can partly reclaim for training budgets; as well as a liberalisation of regulation of private sector training. The performance of the HRDF was impressive, helping more than 5% of the workforce in the first three years.
3) Promoting the sharing of public and private sector training resources, through exchange of trainers or allowing the use of public training facilities (this was less successful).
The private sector in Malaysia has played an increasingly important role in (the planning of) training. The Malaysian Penang Skills Development Centre (PSDC) is a good practical example of coordinating public and private sectors with respect to post-secondary training. The PSDC was set up in 1989 in
response to a growing shortage of skilled labour in the skills-intensive operations (e.g. electronics and IT) of multinational enterprises (MNEs) in the free trade zones and industrial estates. Financed initially through a pooling of public (grants, training materials, equipment and trainers) and private (donations, loan of equipment, furniture, private training facilities) resources, it is now self-financing, offers courses at competitive rates and is officially recognised to offer technical and managerial skills training and
higher education. The centre is in the unique position of obtaining immediate feedback from the private
sector about course content and future training needs.
The Skills Development Fund in Singapore is another example of how private firms (including MNEs) can be engaged in more training. The Productivity and Standards Board (PSB), responsible for the fund, imposes a 1% levy (it was 4% before the economic crisis in 1986) on the payroll of employers for every worker earning less than a predetermined amount. This levy is distributed to firms that send their low-
earning employees to approved training courses. This has had a significant impact on skills upgrading in Singapore (an estimated 10% of the workforce has been to approved training courses, which has led to notable skills upgrading)
Source: Lall (1996); te Velde (2002)

Structural Transformation and Employment Creation
14
Do SEZ policies fit in overall development strategies?
The available evidence overwhelmingly supports the view that SEZs work best if they are seen as
an integral part of a country’s development strategy. For example, FIAS (2008) suggests that the
success of zone initiatives is largely determined by the choices made in the establishment of
policy frameworks, incentive packages, and various other provisions and bureaucratic procedures.
The experience suggests that maximizing the benefits of zones depends on the degree to which
they are integrated with their host economies and the overall trade and investment reform
agenda. In particular, when zones are designed to pilot legal and regulatory reforms within a
planned policy framework, they are more likely to reach their objectives. The establishment of a
successful EPZ programme does not require removing one or two obstacles, it requires removing
all of them simultaneously (Aggarwal, 2005).
Reinforcing the view that SEZs need to be seen as an integral part of a country’s development
strategy, Virgill (2009) emphasises the complementary role of EPZs to reform. EPZs were
emerging in countries where institutions such as the financial system, governance and corporate
governance were experiencing improvements suggesting that EPZs were complements to reform.
As EPZs did not emerge in the most distorted economies, EPZs can be an important complement
to further economic reform, however EPZs alone will not encourage entrepreneurial activity in an
economy; fuller reforms are necessary. Countries should focus on demonstration and failure,
network and knowledge externalities.
Omar and Stoever (2008) argue that EPZs alone do not lead to the structural transformation that
developing countries seek, but they can be a significant factor in a developing country
development strategy when managed right. They argue that investments in human resource
development and technology upgrading are necessary to support the emergence of local suppliers
and thus stimulate EPZs to move further along the life cycle trajectories.
The evidence suggests the following policies need to be taken into account when implementing
SEZs: Skills, technology, trade, business climate and other policies. Various type of other policies
can be regarded as complementary to SEZs in order to stimulate innovation through SEZs (Farole,
2011): linkage policies to incentivise local content (China, Ireland, Mozal), increasing domestic
capabilities (e.g. skills in Singapore and Malaysia Penang), labour circulation (placements in
Shenzhen, China; and Mauritius), investment climate reform outside the zone and exploiting the
infrastructure (e.g. building specialised infrastructure inside and to and from the zone). All of
these also help social cohesion by building bridges amongst various groups and sectors. At the
same time, a more socially cohesive society is less likely to strike and more likely to lead to
productive linkages.
SEZ implementation issues
There are a range of factors that need to be taken into account when implementing SEZs. For
example, the location matters. Baissac (2003) suggests that an EPZ policy should not be
developed to simply generate static benefits such as employment and foreign exchange earning in
an enclave system. In such a case, it is likely that the net benefits will be marginal and probably
negative. The EPZ scheme should not seek to achieve regional development objectives. To the
contrary, the scheme should seek to foster economic concentration around a well-developed
urban centre so as to attract the best layers of domestic capital, the most educated and
productive labour, and provide accessibility to urban infrastructure and amenities to foreign
investors. Thus the location needs to be such that it can reach the market destination with ease.
A further discussion surrounds clustering vis-a-vis single factory schemes. It is generally regarded
that clustering of firms in a zone has the potential for firms to enjoy agglomeration economies,

Structural Transformation and Employment Creation
15
whilst single factory schemes do not. Further the type of management agency for the zones also
matters, with FIAS arguing that the private sector is more efficient in supplying many types of
SEZs services.
Farole (2011) discussed management and implementation issues factors behind successful
implementation of SEZs. This includes (i) high level active and consistent government
commitments to zone programmes over at least 5-10 years; (ii) more private sector participation
where practically feasible; (iii) backed by an effective legal and regulatory framework; (iv)
improved capacity, budget and accountability of regulatory authorities; (v) backed up by effective
monitoring and evaluation.
Conclusions
In conclusion, governments wanting to use SEZs as a tool for both employment creation and
structural transformation need to (see also table 3):
1 Build up the capacity to respond appropriately to the global environment which is changing
constantly;
2 Consider SEZs only when they fit in a wider development strategy involving a range of
complementary policies designed by a range of stakeholders that interact contonuously; and
3 Implement SEZs with real purpose and consistency.
Table 3: What factors and policies can situate SEZs as a tool for employment creation and structural transformation
Responding to global developments
Place SEZs in growth strategies Best-practice implementation
Building on comparative advantage (e.g. agri-business, offshored services)
more likely to succeed especially when state capacity is lacking SEZs based on clustering more likely to succeed SEZs linked to trade preferences (e.g. garments and AGOA) are vulnerable Requires flexible approach, with good quality institutions and effective state-business relationships
Complementary policies required such as linkage policies and building of local
supply capabilities Active human resource development (skills and technology centres) Providing specialised infrastructure Promoting mobility Promoting labour institutions nationally Requires effective state-business relationships (and social cohesion)
SEZs near main markets or ports more likely to succeed
Zones in lagging regions less likely to succeed Consider adequate public / private mix in implementing zones Leadership and strong commitment from top Single factory schemes deny clustering benefits
There are clear links between the aims and objectives of various policies. For example policies
that promote linkages between zones and local firms are also policies that can capture technology
spillovers from zones and such linkages will normally promote social cohesion. At the same time,
a more social cohesive society is likely to be more supportive of fostering linkages.
Figure 5 expresses this virtuous circle amongst social cohesion, good quality growth policies,
beneficial outcomes and back to social cohesion. It is notoriously hard to measure social cohesion

Structural Transformation and Employment Creation
16
or social capital. In the context of formulating appropriate growth policies, Sen and Te Velde
(2009) argue that an effective state-business relationship (SBR) is needed. They measure
effective state-business relationships on the basis of capacity in the state, capacity in the private
sector, presence of formal links between state and business, and restraints on collusive behaviour,
for 20 African countries over 1970-2005. Using sophisticated econometric techniques, they find
that a higher score is associated with better scores on investment climate indicators and with
faster productivity growth.
Figure 5: The virtuous circle of social cohesion and well performing SEZs
In addition, Qureshi and Te Velde (2012) find that labour productivity is higher for members of
business associations, based on a sample of 1000+ firms in 7 African countries, which suggests
that better links can be good for firms. In both papers, the argument is that better state-business
interactions will improve the quality of policies which will affect performance. It is also noticeable
that the scores for SBRs are also greater for countries that have more successful zones. It
suggests that countries will have greater success in using SEZs when they also have better state-
business relations.
Structural Transformation and Employment Creation
17
5 Conclusion and policy suggestions
Sub-Saharan countries face the twin challenge of achieving both employment-creation and
structural transformation of their economies. Addressing these challenges requires appropriate
growth policies, and as part of this, SEZs could play an important role. However, in order for
zones to work in sub Saharan Africa they need to be retooled to i) ensure that they respond to the
latest global developments (e.g. increased demand for natural resource rich products, off-shored
services, etc); ii) are regarded as tools in a wider growth strategy which coincides with good
quality policies and support institutions; and iii) follow a set of best-practices such as emphasising
the clustering aspects of zones. All of this requires significant capacity of the state and a
consistent and coherent approach.
The evidence on zone development suggests that some zones (esp. in Asia) have worked whilst
many others (esp. in Africa) have failed. Nonetheless, some zones in SSA have attracted
significant employment, at least for some time (Madagascar, Mauritius, Ghana, Kenya, Lesotho),
although the transformational aspects have been largely absent with exceptions such as Mauritius
and perhaps Kenya. The observation based on a limited sample of SEZs that have used clustering
tended to be more successful is indicative that there is a need for SSA zones to focus more on the
clustering aspects as well as complementary reforms and innovation policies.
The use of SEZs as a growth tool seems to indicate that social cohesion, employment generation,
and structural transformation go hand in hand. For example, significant and sustained
employment generation only occurs when there is a strategy for the zone to contribute to
innovation and structural transformation, because zones without such a strategy will not succeed
in the long run and are vulnerable. Any SEZ strategy will need to ensure that zones are not
implemented as enclaves, but involve significant linkages between zone firms and local firms, and
use social standards that are similar to the rest of the economy. These factors together are
associated with social cohesion which in turn can lead to good growth policies and well-designed
SEZs.
This paper also provided new econometric evidence which suggests that SEZs in Kenya have
helped to create some 40,000 manufacturing jobs and increased manufacturing labour
productivity by around 20% in the decade to 2006, or 2% per annum. This suggests that in
principle it is possible for SEZs to be both job creating and productivity enhancing, although there
are also questions about whether the transformative effects can be sustained.
Structural Transformation and Employment Creation
18
6 References
AfDB, OECD, UNECA, and UNDP. 2011. African Economic Outlook Report 2011.
African Economic Outlook, http://www.africaneconomicoutlook.org/en/
Aggarwal, A., 2005. Performance of export processing zones: A comparative analysis of India, Sri Lanka and Bangladesh, mimeo, Indian Council for Research on International Economic Relations, February.
Amengual, Matthew; Milberg, William. "Economic development and working conditions in export processing zones: A survey of trends"; International Labour Office—Geneva: ILO, 2008 72 p.
http://ilo.org/public/french/dialogue/download/wp3englishfinal.pdf
Baissac, C. 2003. Maximising the Developmental Impact of EPZs: A Comparative Perspective in the African Context of Needed Accelerated Growth. A Presentation at the Johannesburg EPZ Symposium. October 15-16 2003. http://www.wepza.org/article7.html
Barrell, R. and D.W. te Velde (2000), ‘Catching-up of East German Labour Productivity in the 1990s’, German Economic Review, 1, pp. 271-297.
Bartelsman, E. J. Haltiwanger, and S. Scarpetta, (2009), “Measuring and Analyzing Cross-Country Differences in Firm Dynamics.” In Producer Dynamics: New Evidence from Micro Data, T. Dunne, J.
Bradford Jensen, and M. J. Robert, Cambridge.
Belloca, M., and Michele Di Maio. 2011. Survey of the literature on successful strategies and practices for export promotion by developing countries. International Growth Centre Working Paper 11/0248 June 2011.
Burundi IPR, 2009; http://www.unctad.org/templates/webflyer.asp?docid=12871&intItemID=2554&lang=1
Commission on Growth and Development; 2008. The Growth Report: Strategies for Sustained Growth and
Inclusive Development. World Bank Publications.
Cling, J. and Letilly, G., 2001. Export Processing Zones: A threatened instrument for global economy insertion? DIAL document de travail, DT/2001/17 (2001).
Cling, J.P., Razafindrakoto, M. and F. Roubaud (2005). "Export processing zones in Madagascar: a success story under threat?, "World Development, vol. 33(5), pages 785-803, May
Cling, J.P., Razafindrakoto, M. and F. Roubaud (2007). "Export Processing Zones in Madagascar: the impact of the dismantling of clothing quotas on employment and labour standards, "Working Papers
DT/2007/06, DIAL (Développement, Institutions et Mondialisation).
Draper, P. C. Grant, and D.W. te Velde and C. Kingombe. 2010. “The G20 and African growth”, SAIIA and ODI, October 2010.
Farole, Thomas. 2010a. Second Best? Investment Climate and Performance in Africa’s Special Economic
Zones. World Bank Policy Research Working Paper, 5447.
http://www-wds.worldbank.org/external/default/WDSContentServer/IW3P/IB/2010/10/18/000158349_201010181
02611/Rendered/PDF/WPS5447.pdf
Farole, Thomas. 2010b. Special Economic Zones. Performance, Policy and Practice with a Focus on Sub-Saharan Africa. Executive Summary (Washington, DC: World Bank).
Farole, Thomas. 2011. Special Economic Zones in Africa: Comparing Performance and Learning from Global Experiences (Washington, DC: World Bank).
Structural Transformation and Employment Creation
19
Farole, T., and Gokhan Akinci (eds.). 2011. Special Economic Zones. Progress, Emerging Challenges, and Future Directions. http://publications.worldbank.org/index.php?main_page=product_info&products_id=24138
FIAS, 2008. Special Economic Zones: Performance, Lessons Learned and Implication for Zone Development (Washington, DC: World Bank). http://www.naftz.org/resource/resmgr/docs/special_economic_zones_repor.pdf
Glick, P. and Roubaud, F., 2006. Export Processing Zone Expansion in Madagascar: What are the Labour Market and Gender Impacts? Journal of African Economies 15(4):722-56. (2006).
Graham, E., 2004. Do export processing zones attract FDI and its benefits: The experience from China, International Economics and Economic Policy, Vol. I, pp. 87–103, (2004).
Hall, Robert E. and Jones, Charles I. 1999. "Why Do Some Countries Produce So Much More Output Per Worker Than Others?," The Quarterly Journal of Economics, MIT Press, vol. 114(1), pages 83-116,
February.
Hsieh, C.-T. and P. J. Klenow (2009). "Misallocation and Manufacturing TFP in China and India," Quarterly Journal of Economics, vol. 124(4), pp. 1403-1448.
International Confederation of Free Trade Unions (ICFTU). 2004. Behind the Brand names. Working conditions and labour rights in export processing zones. http://www.icftu.org/www/PDF/EPZreportE.pdf
ICTFU. 2003. Export Processing Zones: Symbols of Exploitation and a Development Dead End. Brussels.
ILO. 2012. Global Employment Trends 2012. Preventing a Deeper Job Crisis. http://www.ilo.org/wcmsp5/groups/public/---dgreports/---dcomm/---publ/documents/publication/wcms_171571.pdf
ILO. 2008. Report of the InFocus Initiative on export processing zones (EPZs): Latest trends and policy developments in EPZs. http://www.ilo.org/wcmsp5/groups/public/---ed_norm/---
relconf/documents/meetingdocument/wcms_090223.pdf
ILO. 2006. Tripartite declaration of principles concerning multinational enterprises and social policy, 2006.
http://www.ilo.org/public/libdoc/ilo/2006/106B09_303_engl.pdf
ILO. 2005. World Employment Report 2004-05: Employment, productivity and poverty reduction. Geneva, ILO.
ILO. 2002. Employment and social policy in respect of export processing zones (EPZs), GB.285/ESP/5. Geneva.
ILO Resource Guide on export processing zones (EPZs).
http://www.ilo.org/public/english/support/lib/resource/subject/epz.htm
ILO. 1998. Labour and social issues relating to export processing zones : report for discussion at the Tripartite Meeting of Export Processing Zones-Operating Countries, Geneva, 1998 http://www.ilo.org/public/libdoc/ilo/1998/98B09_223_engl.pdf
IMF (2012), Regional Economic Outlook, Sub-Saharan Africa, Maintaining Growth in an Uncertain World. October. http://www.imf.org/external/pubs/ft/reo/2012/afr/eng/sreo1012.pdf
Johansson, H. and Nilsson, L. (1997), 'Export processing zones as catalysts', World Development, 25(12),
2115-28.
Kingombe, C.K.M. 2011. Lessons for Developing Countries from Experience with Technical and Vocational Education and Training. IGC-SL Working Paper, http://www.theigc.org/sites/default/files/christian_kingombe_paper.pdf

Structural Transformation and Employment Creation
20
Lall, S. (1996), 'Foreign Direct Investment Policies in the Asian NIEs' in Learning from the Asian Tigers, London
Lall, S. (2001), Indicators of the Relative Importance of IPRs in Developing Countries, Draft Report for UNCTAD.
Lin, J., C. Monga, DW. te Velde, S. Tendulkar, A. Amsden, K.Y. Amoako, H. Pack, W. Lim. 2011. ‘Growth Identification and Facilitation: The Role of the State in Dynamics of Structural Change’, Development
Policy Review, May 2011. http://onlinelibrary.wiley.com/doi/10.1111/j.1467-7679.2011.00534.x/abstract
Madani, D. 1999. ‘A Review of the Role and Impact of Export Processing Zones.’ Policy Research Working Paper 2238. Washington, DC: World Bank.
Mangieri, 2006. Kenyan Apparel beyond Agoa. UNC Chapel Hill. Duke.
McCallum, Jamie K. 2011. Export processing zones: Comparative data from China, Honduras, Nicaragua and
South Africa. Working Paper No.21 http://www.ilo.org/public/english/dialogue/ifpdial/downloads/papers/wp21.pdf
McMillan, M. and D. Rodrik. 2011. “Globalization, Structural Change and Productivity Growth.” NBER Working Paper Series, Vol. w17143. http://ssrn.com/abstract=1866102
Mozambique, Government of. 2004. Diagnostic Trade Integration Study 2004.
Nadvi, K. and S. Barrientos (2004), “Industrial clusters and poverty reduction”, Towards a methodology for poverty and social impact assessment of cluster development initiatives, UNIDO report,
http://www.unido.org/fileadmin/user_media/Services/PSD/Clusters_and_Networks/publications/industrialClustersandpoverty_NADVI.pdf
Omar, K., and W. A. Stoever, 2008. The role of technology and human capital in the EPZ life-cycle. UNCTAD. http://www.unctad.org/en/docs/iteiit20081a6_en.pdf
Porter, M. E. (1998) "The Competitive Advantage"; Simon & Schuster Ltd, 576 pages
Qureshi, M. and D.W. te Velde (2012), ‘State-Business Relations, Investment Climate Reform and Firm Productivity in Sub-Saharan Africa,, Journal of International Development, forthcoming
Sen, K. and Velde, D.W. te (2009) “State Business Relations and Economic Growth in Sub-Saharan Africa”, Journal of Development Studies 45 (8):1267-1283.
Stein, Howard, 2008, ’Africa, Industrial Policy and Export Processing Zones: Lessons from Asia’, paper prepared for Africa Task Force Meeting, Addis Ababa, Ethiopia 10-11 July.
UNCTAD. 2001. International Poilcy Review Mauritius, 2001.
UNCTAD. 2003. Export processing zones at risk? The WTO rules on subsidies: what options for the future?
http://www.unctad.org/templates/webflyer.asp?docid=3154&intItemID=2261&lang=1
UNCTAD. 2004. FDI in Services – a growing business for EPZs. UNCTAD Investment Brief Number 2 2004. http://www.unctad.org/en/docs/webiteiia200417_en.pdf
UNCTAD, 2008. Export Competitiveness and Development in LDCs: Policies, Issues and Priorities for Least Developed Countries for Action During and Beyond UNCTAD XII (Geneva: United National Conference on Trade and Development).
UNECA, 2011, Industrial Policies for the Structural Transformation of African Economies: Options and Best
Practices (Addis Ababa: United Nations Commission for Africa).

Structural Transformation and Employment Creation
21
Velde, D.W. te (2002), ‘Government Policies for Inward Foreign Direct Investment in Developing Countries: Implications for Human Capital Formation and Income Inequality’, OECD Development Centre Technical Paper No. 193.
Velde, D.W. te and T. Xenogiani (2007), ‘Foreign Direct Investment and International Skill Inequality’, Oxford Development Studies, March 2007.
Virgill, N.A.V. 2009. Export Processing Zones: Tools of Development or Reform Delay? A dissertation
submitted in partial fulfillment of the requirements for the degree of Doctor of Philosophy at George Mason University.
Watson, Peter, 2001. Export Processing Zones: Has Africa Missed the Boat? Not Yet’, World Bank Africa Region Working Paper Series, 17.
World Bank. 2009. World Development Report 2009: Reshaping Economic Geography.
World Bank. 2005. World Development Report 2005. A Better Investment Climate for Everyone.
Yeung et al. 2008. China’s Special Economic Zones at 30.” Eurasian Geography and Economics 2009 50 (2).
Zhihua Zeng, D. 2011. How Do Special Economic Zones and Industrial Clusters Drive China’s Rapid Development? http://www-wds.worldbank.org/external/default/WDSContentServer/WDSP/IB/2011/03/01/000158349_20110301083120/Rendered/PDF/WPS5583.pdf
Zhihua Zeng, Douglas (2010) Building engines for growth and competitiveness in China: experience with special economic zones and industrial clusters. http://www.worldbank.icebox.ingenta.com/
Structural Transformation and Employment Creation
22
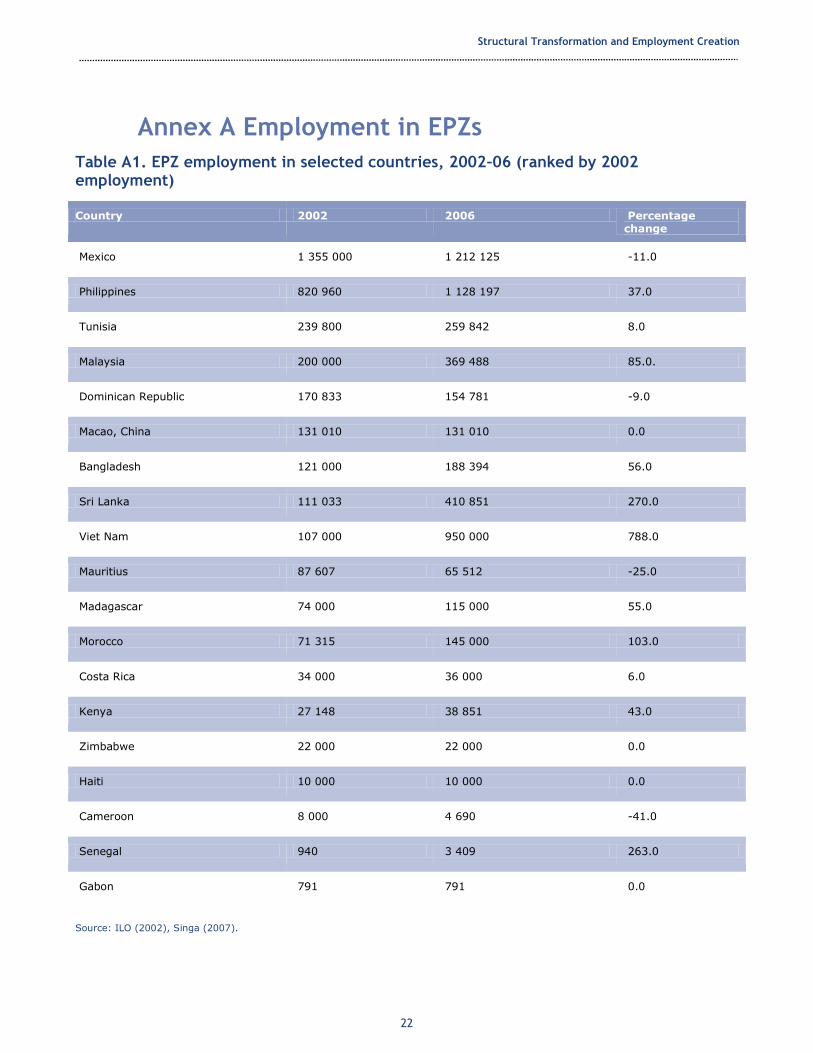
Annex A Employment in EPZs
Table A1. EPZ employment in selected countries, 2002–06 (ranked by 2002 employment)
Country 2002 2006 Percentage change
Mexico 1 355 000 1 212 125 -11.0
Philippines 820 960 1 128 197 37.0
Tunisia 239 800 259 842 8.0
Malaysia 200 000 369 488 85.0.
Dominican Republic 170 833 154 781 -9.0
Macao, China 131 010 131 010 0.0
Bangladesh 121 000 188 394 56.0
Sri Lanka 111 033 410 851 270.0
Viet Nam 107 000 950 000 788.0
Mauritius 87 607 65 512 -25.0
Madagascar 74 000 115 000 55.0
Morocco 71 315 145 000 103.0
Costa Rica 34 000 36 000 6.0
Kenya 27 148 38 851 43.0
Zimbabwe 22 000 22 000 0.0
Haiti 10 000 10 000 0.0
Cameroon 8 000 4 690 -41.0
Senegal 940 3 409 263.0
Gabon 791 791 0.0
Source: ILO (2002), Singa (2007).
Structural Transformation and Employment Creation
23
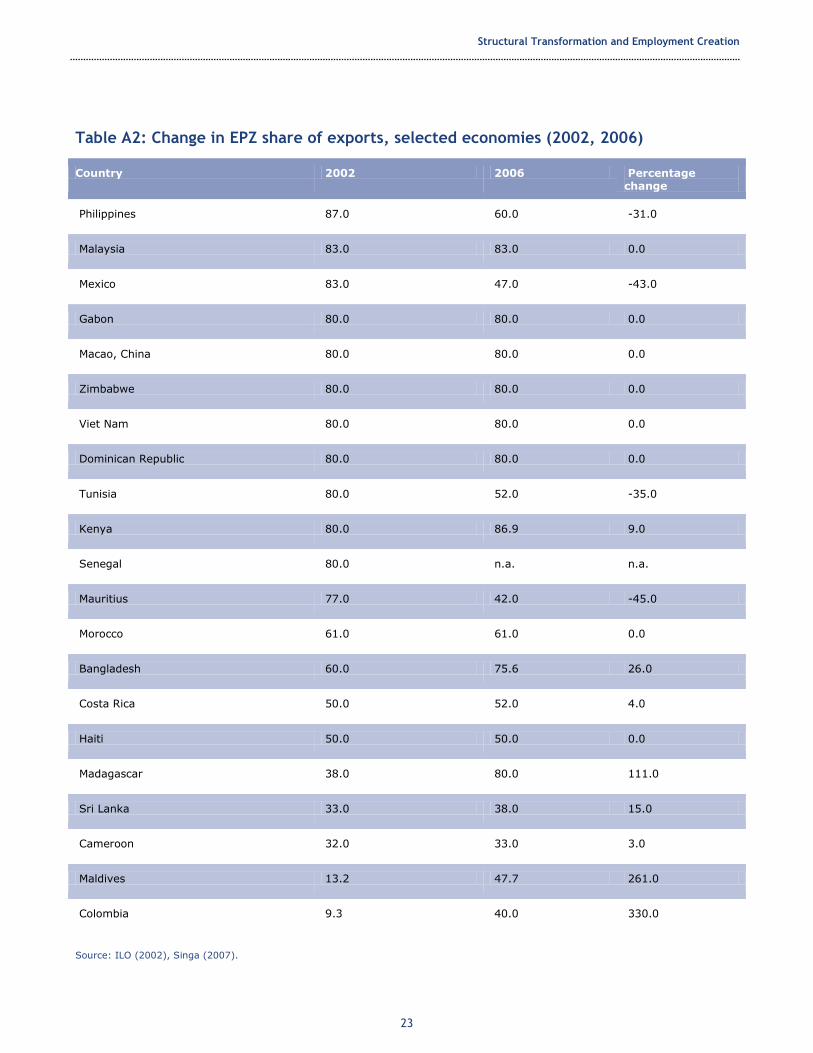
Table A2: Change in EPZ share of exports, selected economies (2002, 2006)
Country 2002 2006 Percentage change
Philippines 87.0 60.0 -31.0
Malaysia 83.0 83.0 0.0
Mexico 83.0 47.0 -43.0
Gabon 80.0 80.0 0.0
Macao, China 80.0 80.0 0.0
Zimbabwe 80.0 80.0 0.0
Viet Nam 80.0 80.0 0.0
Dominican Republic 80.0 80.0 0.0
Tunisia 80.0 52.0 -35.0
Kenya 80.0 86.9 9.0
Senegal 80.0 n.a. n.a.
Mauritius 77.0 42.0 -45.0
Morocco 61.0 61.0 0.0
Bangladesh 60.0 75.6 26.0
Costa Rica 50.0 52.0 4.0
Haiti 50.0 50.0 0.0
Madagascar 38.0 80.0 111.0
Sri Lanka 33.0 38.0 15.0
Cameroon 32.0 33.0 3.0
Maldives 13.2 47.7 261.0
Colombia 9.3 40.0 330.0
Source: ILO (2002), Singa (2007).

Structural Transformation and Employment Creation
24
Annex B The effects of special economic zones on labour productivity in Kenyan manufacturing
We follow Barrell and Te Velde (2000) who use a two-factor CES production function with
employment (L) and capital (K)
1
))(1()(),( ttLttt KLKLf (1)
Where LtLt ln is a function of labour efficiency units, and the parameter ρ < 1. The labour
efficiency index can be interpreted as accumulated human capital or the skill-specific technology
level. The elasticity of substitution between L and K is =1/(1-). In neo-classical theory, the
technology level changes exogenously. However, it is perfectly possible to have shifts in the
pattern of technical change (endogenous technical change), dependent on such factors as EPZ.
For example, EPZs help to attract high productivity firms that can also act as a pool of knowledge
for other firms so that EPZs can lead to greater labour productivity through greater spillovers and
through aggregation. We model the effects of EPZs on the market for skills as follows:
tLLLtLtLt EPZ21;ln ; (2)
and using the first-order condition that factor productivity equals the real factor price we can
derive a formula for labour demand (and also capital demand which we not show):
itLL
i
i
t
t EPZtP
w
Y
L
)1()1(ln)ln(ln 21 (3)
We take data from UNIDO for manufacturing employment, wages and value added, and use the
WDI GDP price deflator, and use Kenya’s EPZA publications for data on employment in EPZs (we
have data for 1993, and 1998 to 2007, with extrapolated data for 1994-1997, and zero before
1993) to estimate the share of employment in EPZs. The data are plotted in figure 1 and show
there has been a considerable increase in the share since the start in 1993.
Figure B1: The share of EPZ employment in Kenya manufacturing employment
Sources: EPZA and UNIDO
Structural Transformation and Employment Creation
25
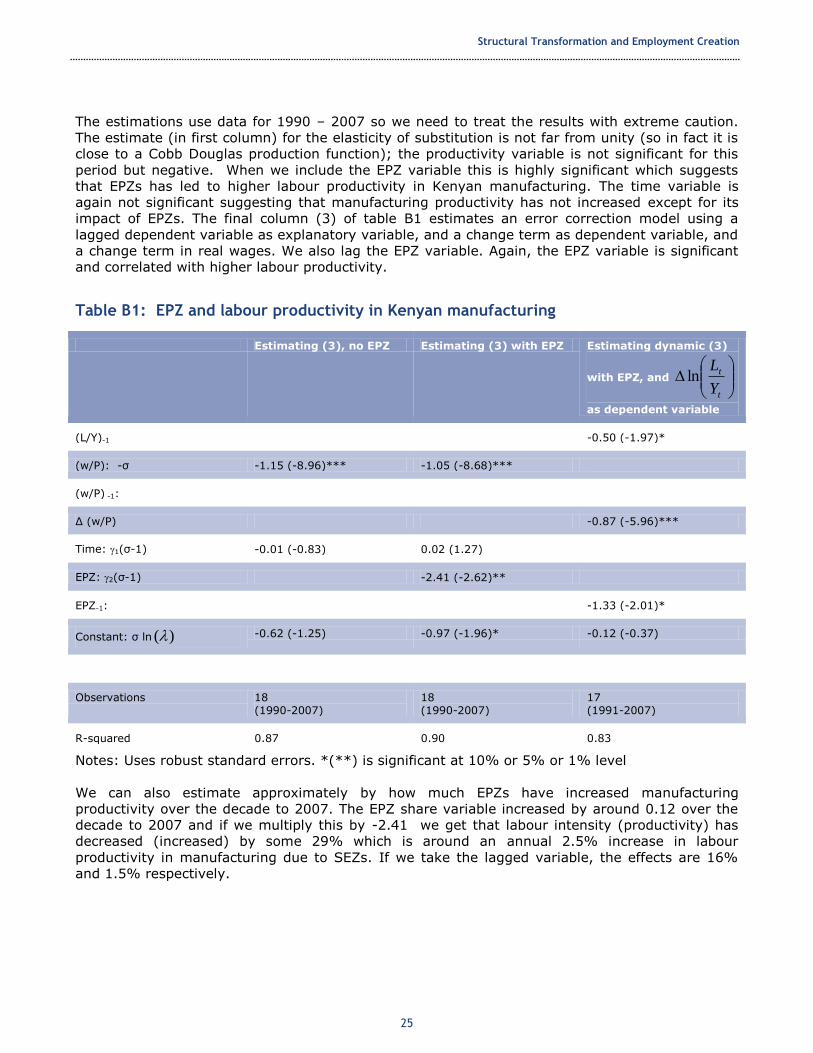
The estimations use data for 1990 – 2007 so we need to treat the results with extreme caution.
The estimate (in first column) for the elasticity of substitution is not far from unity (so in fact it is
close to a Cobb Douglas production function); the productivity variable is not significant for this
period but negative. When we include the EPZ variable this is highly significant which suggests
that EPZs has led to higher labour productivity in Kenyan manufacturing. The time variable is
again not significant suggesting that manufacturing productivity has not increased except for its
impact of EPZs. The final column (3) of table B1 estimates an error correction model using a
lagged dependent variable as explanatory variable, and a change term as dependent variable, and
a change term in real wages. We also lag the EPZ variable. Again, the EPZ variable is significant
and correlated with higher labour productivity.
Table B1: EPZ and labour productivity in Kenyan manufacturing
Estimating (3), no EPZ Estimating (3) with EPZ Estimating dynamic (3)
with EPZ, and
t
t
Y
Lln
as dependent variable
(L/Y)-1 -0.50 (-1.97)*
(w/P): -σ -1.15 (-8.96)*** -1.05 (-8.68)***
(w/P) -1:
Δ (w/P) -0.87 (-5.96)***
Time: 1(σ-1) -0.01 (-0.83) 0.02 (1.27)
EPZ: 2(σ-1) -2.41 (-2.62)**
EPZ-1: -1.33 (-2.01)*
Constant: σ ln )( -0.62 (-1.25) -0.97 (-1.96)* -0.12 (-0.37)
Observations 18 (1990-2007)
18 (1990-2007)
17 (1991-2007)
R-squared 0.87 0.90 0.83
Notes: Uses robust standard errors. *(**) is significant at 10% or 5% or 1% level
We can also estimate approximately by how much EPZs have increased manufacturing
productivity over the decade to 2007. The EPZ share variable increased by around 0.12 over the
decade to 2007 and if we multiply this by -2.41 we get that labour intensity (productivity) has
decreased (increased) by some 29% which is around an annual 2.5% increase in labour
productivity in manufacturing due to SEZs. If we take the lagged variable, the effects are 16%
and 1.5% respectively.
Structural Transformation and Employment Creation
26
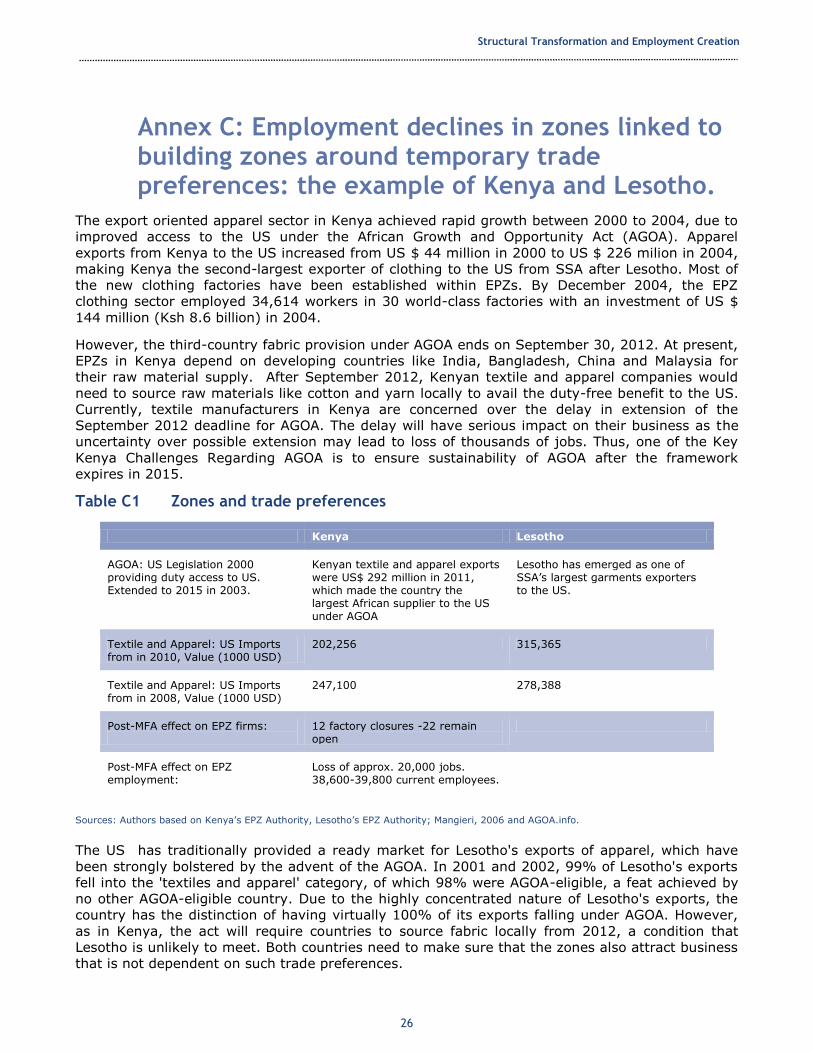
Annex C: Employment declines in zones linked to building zones around temporary trade preferences: the example of Kenya and Lesotho.
The export oriented apparel sector in Kenya achieved rapid growth between 2000 to 2004, due to
improved access to the US under the African Growth and Opportunity Act (AGOA). Apparel
exports from Kenya to the US increased from US $ 44 million in 2000 to US $ 226 milion in 2004,
making Kenya the second-largest exporter of clothing to the US from SSA after Lesotho. Most of
the new clothing factories have been established within EPZs. By December 2004, the EPZ
clothing sector employed 34,614 workers in 30 world-class factories with an investment of US $
144 million (Ksh 8.6 billion) in 2004.
However, the third-country fabric provision under AGOA ends on September 30, 2012. At present,
EPZs in Kenya depend on developing countries like India, Bangladesh, China and Malaysia for
their raw material supply. After September 2012, Kenyan textile and apparel companies would
need to source raw materials like cotton and yarn locally to avail the duty-free benefit to the US.
Currently, textile manufacturers in Kenya are concerned over the delay in extension of the
September 2012 deadline for AGOA. The delay will have serious impact on their business as the
uncertainty over possible extension may lead to loss of thousands of jobs. Thus, one of the Key
Kenya Challenges Regarding AGOA is to ensure sustainability of AGOA after the framework
expires in 2015.
Table C1 Zones and trade preferences
Kenya Lesotho
AGOA: US Legislation 2000 providing duty access to US. Extended to 2015 in 2003.
Kenyan textile and apparel exports were US$ 292 million in 2011, which made the country the largest African supplier to the US under AGOA
Lesotho has emerged as one of SSA’s largest garments exporters to the US.
Textile and Apparel: US Imports from in 2010, Value (1000 USD)
202,256 315,365
Textile and Apparel: US Imports from in 2008, Value (1000 USD)
247,100 278,388
Post-MFA effect on EPZ firms:
12 factory closures -22 remain open
Post-MFA effect on EPZ employment:
Loss of approx. 20,000 jobs. 38,600-39,800 current employees.
Sources: Authors based on Kenya’s EPZ Authority, Lesotho’s EPZ Authority; Mangieri, 2006 and AGOA.info.
The US has traditionally provided a ready market for Lesotho's exports of apparel, which have
been strongly bolstered by the advent of the AGOA. In 2001 and 2002, 99% of Lesotho's exports
fell into the 'textiles and apparel' category, of which 98% were AGOA-eligible, a feat achieved by
no other AGOA-eligible country. Due to the highly concentrated nature of Lesotho's exports, the
country has the distinction of having virtually 100% of its exports falling under AGOA. However,
as in Kenya, the act will require countries to source fabric locally from 2012, a condition that
Lesotho is unlikely to meet. Both countries need to make sure that the zones also attract business
that is not dependent on such trade preferences.