Structural reform, monetary policy and financial deepening ...
30
Economic and Financial Review Economic and Financial Review Volume 36 Number 2 Article 1 6-1-1998 Structural reform, monetary policy and financial deepening: the Structural reform, monetary policy and financial deepening: the Nigerian experience Nigerian experience Joseph O. Nnanna Mela Dogo Follow this and additional works at: https://dc.cbn.gov.ng/efr Recommended Citation Recommended Citation Nnanna, J.O and Dogo, M (1998). Structural reform, monetary policy and financial deepening: the Nigerian experience. Economic and Financial Review, 36(2), 1-29. This Article is brought to you for free and open access by CBN Institutional Repository. It has been accepted for inclusion in Economic and Financial Review by an authorized editor of CBN Institutional Repository. For more information, please contact [email protected].
Transcript of Structural reform, monetary policy and financial deepening ...

Economic and Financial Review Economic and Financial Review
Volume 36 Number 2 Article 1
6-1-1998
Structural reform, monetary policy and financial deepening: the Structural reform, monetary policy and financial deepening: the
Nigerian experience Nigerian experience
Joseph O. Nnanna
Mela Dogo
Follow this and additional works at: https://dc.cbn.gov.ng/efr
Recommended Citation Recommended Citation Nnanna, J.O and Dogo, M (1998). Structural reform, monetary policy and financial deepening: the Nigerian experience. Economic and Financial Review, 36(2), 1-29.
This Article is brought to you for free and open access by CBN Institutional Repository. It has been accepted for inclusion in Economic and Financial Review by an authorized editor of CBN Institutional Repository. For more information, please contact [email protected].

CBN ECONOMJC & FINANCIAL REVIEW VOL. 36 NO. 2 1-29
STRUCTURAL REFORM, MONETARY POLICY AND FINANCIAL DEEPENING: THE NIGERIAN EXPERIENCE
By
0. JOSEPH NNANNA, Ph.D. and MELA DOG01
An attempt has been made in this study to gauge by means of robust statistical am:ilyses, the magnitude of the changes which have occurred in the Nigerian financial system since the introduction of structural reforms in the mid 1980s. The empirical analyses carried out in this study have confirmed
that the monetary authorities have largely succeeded in their objective to deepen the Nigerian financial system despite the emergence of distress in the banking industry and the consequent liquidation of 31 banks. Contrary to dominant public belief, past policies of financial repression aimed at encouraging domestic investments by suppressing interest ratP. produced the opposite result. Negative real interest rate regime did not encourage greater domestic investment. Rather it influenced banks, to be more risk averse, Conversely, when interest rate regime tended to be more market oriented and less negative in real terms, bank lending increased and domestic investments and national savings expanded. Overall, the reform measures have been largely successful. This finding represents sufficient evidence that, if and when, the Central Bank of Nigeria is granted legal and operational autonomy, it can, given the flexibility, strike a happy medium between financial liberalism and occasional intervention aimed at correcting market failures arising.from information asymmetry.
1 The authors are Special Assistant/Acting Director, and Senior Economist at the Governor's Office Department respectively. They are grateful to Dr. G. E. Ukpong, Dr. O.A. Okorie and Mr. C.N.O. Mordi of the Research Department for their useful comments and to Mr. Chimezie Okeugo, Senior Supervisor, Governor's Office Department for his assistance in data collection and collation and Mr. I. I. lhesiaba for his secretarial assistance. The views expressed in this paper are essentially those of the authors and do not represent those of the Management of the Central Bank of Nigeria,

Nnanna I Dogo 2
I. INTRODUCTION With the rapid globalization of financial markets, concern has heightened
over declines in the level of savings, investment and f,inancial deepening in many developing countries, particularly, those of Sub-Saharan Africa (SSA). This concern has exerted pressures on national monetary authorities to re-examine and re-evaluate their domestic monetary policies with a view to finding probable solutions. In Nigeria, the Structural Adjustment Programme was introduced in 1986 to among other things, correct the structural imbalances in the Nigerian economy and to liberalize the financial and payment systems. In this connection, interest rates were de-regulated, the process of licensing new banks simplified, and the Nigerian Deposit Insurance Corporation was established to reinforce confidence in the banking industry.
Since 1986, the government through the Central Bank of Nigeria, has adopted numerous monetary, and structural policies aimed at deepening the financial system, and reducing the level of financial repression in the banking industry. These measures include inter alia: the licensing of new banks in order to enthrone the market principle of free entry and free exit into the banking industry, the introduction and strict enforcement of prudential guidelines and mass disqualification of "unfit and improper" personnel in the management of banks. Others include the abolition of sectoral credit allocation and interest rate ceilings, phased elimination of mandatory stabilization security requirement, deregulation of interest rate regime and the ten- fold increase in minimum paid-up capital requirement by banks aimed at strengthening the operational viability of the banks; and the mass liquidation of distress banks in order to eliminate contagion effects.
Despite the introduction of these reforms, bank failures have occurred resulting in loss of public confidence in the system, while the economy grew marginally. The questions now being asked are: what are the impact of the financial sector reforms on gross national savings, domestic investments and overall deepening of the Nigerian financial system? Is there a significant difference between the average level of savings, domestic investment and monetization of the economy during the period before the introduction of the reform measures (1976 to 1986)1, vis-a-vis, the post-reform period (1987 to 1997)? In other words, is there any significant difference in the savings/investment

3 CBN ECONOMIC & FINANCIAL REVIEW VOL. 36 NO. 2
pattern of Nigerians and the lending preferences of the banks during the J>re- and post-reform periods in Nigeria?
The purpose of this paper therefore, is to empirically evaluate, the degree of financial deepening in Nigeria since the onset of financial reforms in 1986 when the number of ban_!cs rose from 41 to 120 in 1993 before dropping to 115 in 19972• We shall also endeavor to ascertain if indeed any significant difference has occurred between the two periods. Operationally, the study shall rely on the statistical inference of means test methodology in testing tlie several indicator variables whicq have been selected a priori in order to ascert<!in if financial deepening has actually occurred since the financial sector reforms began in Nigeria. The analysis is divided into two periods - namely, the period before the financial reforms, covering 1976 to 1986, and the financial reform period, covering 1987 to 1997. We decided to include 1986 in the pre-reform period, because the reforms which were introducea in late 1986 did suffer from implementation lag, prior to its commencement.
· The rest of the paper is organized into three sections. Following this introduction is the review of literature in section two. Section three gives a general specification of the model and the expectations from the estimates. In section four, we present the analytical data, the results of the analysis and their implications for future policy. This is followed by the concluding statement.
11. LITERATURE REVIEW The concept of financial deepening is usually employed to explain a state
of an atomized financial system or a financial system which is largely free from financial repression. Under such a liberalized system, it is expected that the market will determine the behavior of lenders and borrowers. Similarly, financial deepening is characterized by the presence of several financial instruments; less use of cash, diminishing velocity of money, positive real interest rates, high degree of liquidity, competitiveness and specialization in financial functions and institutions; high and stable ratios of money supply3 (M, M
2, M
3, etc.) to the gross domestic product (GDP); low premiums between
saving and lending rates, rising ratio of private domestic savings to income, Mckinnon (1973) and high financial inter-relations ratio as measured by the

Nnannt, I Dogo 4
relative intensity of financial relations within a country at a given date
(Goldsmith 1966). Consequently, the raison d'etre for financial sector reform
is to strengthen and enhance the level of financial deepening in the system, which in tum will enhance and sustain economic growth and development.
Consequently, Mckinnon (1973) and Shaw (1973 ), have observed that
financial repression is correlated to sluggish growth in developing countries.
Such economies are typically characterized by high and volatile inflation and
distorted interest and exchange rate structures, low savings and investments
and low level of financial intermediation, as interest rates do not reflect the
cost of capital. Various explanations have been posited in the literature on what
determines national savings, domestic investments and financial deepening
in an economy. Overall, there seem to be a consensus that interest rates
play an important role in the determination of these variables. In general, it is well
settled in the literature that, under a free market system, the interaction of the
forces of demand for and supply of loanable funds determine the level of savings and investments in the economy. All things being equal, people will
save or invest more at high and positive real rates of interest than otherwise.
Of course, this condition does not prevail in financially repressed economic regimes.
Empirical Studies from developing countries particularly, Sub-Saharan
Africa (SSA) show that savings and investments are determined by per-capita
income, cost of capital, expected rate of inflation, savings, tax rate, expenditure
policies, macroeconomic and political environment (Calamitis et al, 1996 and
Hadjimichael et al, 1996). In Nigeria, the intellectual influence of the Keynesian investment theory and the Mckinnon-Shaw (1973) savings-investment hypothesis have been very apparent in the formulation and practice of monetary policy.
However, in a study by Ndekwu (1988), it was observed that, high interest
rates on saving deposits stimulates the supply of savings to the banking
system, while the high cost of borrowing discourages the level of investments. Ndekwu dismissed the Mckinnon-Shaw hypothesis, saying,
that the evidence from Nigeria does not support it. Reviewing the result of a study by Soyinbo and Adekanye, Uchendu ( 1993) opined that, the report
5 CBN ECONOMIC & FINANCIAL REVIEW VOL 36 NO. 2
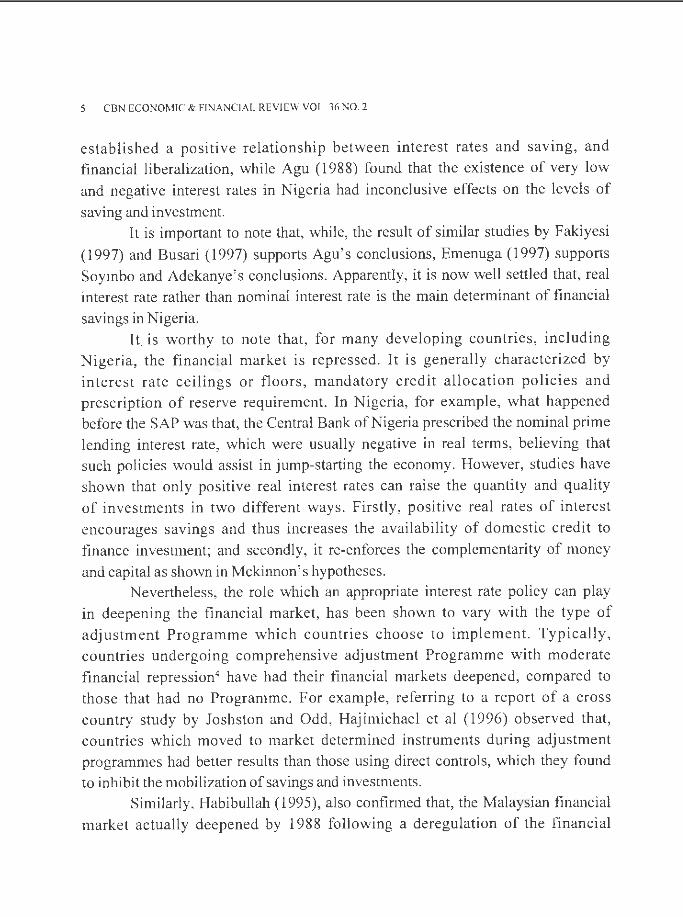
established a positive relationship between interest rates and saving, and financial liberalization, while Agu (1988) found that the existence of very low
and negative interest rates in Nigeria had inconclusive effects on the levels of
saving and investment. It is important to note that, while, the result of similar studies by Fakiyesi
( 1997) and B usari (1997) supports Agu' s conclusions, Emenuga (1997) supports Soyinbo and Adekanye's conclusions. Apparently, it is now well settled that, real interest rate rather than nominal interest rate is the main determinant of financial
savings in Nigeria. It. is worthy to note that, for many developing countries, including
Nigeria, the financial market is repressed. It is generally characterized by interest rate ceilings or floors, mandatory credit allocation policies and prescription of reserve requirement. In Nigeria, for example, what happened before the SAP was that, the Central Bank of Nigeria prescribed the nominal prime lending interest rate, which were usually negative in real terms, believing that such policies would assist in jump-starting the economy. However, studies have shown that only positive real interest rates can raise the quantity and quality of investments in two different ways. Firstly, positive real rates of interest
encourages savings and thus increases the availability of domestic credit to finance investment; and secondly, it re-enforces the complementarity of money
and capital as shown in Mckinnon' s hypotheses. Nevertheless, the role which an appropriate interest rate policy can play
in deepening the financial market, has been shown to vary with the type of adjustment Programme which countries choose to implement. Typically, countries undergoing comprehensive adjustment Programme with moderate
financial repression4 have had their financial markets deepened, compared to those that had no Programme. For example, referring to a report of a cross
country study by Joshston and Odd, Hajimichael et al (1996) observed that, countries which moved to market determined instruments during adjustment programmes had better results than those using direct controls, which they found to inhibit the mobilization of savings and investments.
Similarly, Habibullah (1995), also confirmed that, the Malaysian financial market actually deepened by 1988 following a deregulation of the financial
Nnanna I Dogo 6
system in 1985. He observed that, the ratio of broad money supply (M3) to gross domestic product (GDP) increased from 0.56 in 1978 to 0.93 percent in 1988. Broad money per capita also rose from 1544 Ringgit in 1978 to 4607 Ringgit in 1988; while the number of persons per banking office dropped from 25,789 in 1978 to 18,142 in 1988. Per capita bank deposits and bank assets to gross national product ratios also rose significantly. Financial deepening in Malaysia was said to have increased the volume of transactions in new financial instruments and the emergence of non-bank financial intermediaries offering interest bearing financial instruments with varying maturity dates and interest rates, the use of technological innovations to facilitate financial transactions and an encouraged capital market.
Similarly in Ghana, the implementation of financial sector reforms between 1983 to I 991 resulted in increases in gross domestic savings by 8.7 percent, domestic investments by 12. 1 percent and contributed to the further deepening of the Ghanaian gross domestic savings as ratio of GDP from 3 percent in I 983 to 12. 5 percent in 1988. Domestic investments as ratio of GDP rose from 3.7 percent in 1983 to 14.2 percent in 1988 and 15.9 percent in 1994; while the money supply (M2) to GDP ratio improved from 38. I percent in 1983 to 43 percent in I 988 and 46.2 percent in 1994, (Hadjimichael et al 1996). Inflation also declined and the budget situation improved during the same period. Indeed, there is a general consensus that, complete liberalization of the financial market within a comprehensive adjustment Programme framework is ideal for achieving financial deepening, (Hadjimichael et al , 1996; Tseng, Wanda et al, 1991; Stiglitz, I 996, and Ogun and Bakare, 1997). In their study of the Asian tigers, Stiglitz and Uy (1996), found that, the liberalization of the financial market contributed to the rapid growth of the economies of these countries and that, government intervened in the liberalization process only to correct market imperfections. Intervention therefore, may be justified because, in the real world, markets are not perfect and information is asymmetric, therefore, portfolio decisions are made not purely on market terms. The existence of information asymmetry creates a possibility of credit going to unviable beneficiaries (adverse selection) or irresponsible beneficiaries (moral hazards) or people who want the benefits without sharing in the costs, (free-riders).

7 CBN ECONOMIC & FINANCIAL REVIEW VOL. 36 NO. 2
Shaw (1973) is also of the view that, distortions in financial prices,
including interest and foreign exchange rates, reduce the real rate of growth
and retard the development process. He argued that, a new effective strategy
of deepening the financial market will be to liberalize it. Financial liberalization
will deepen the financial market thus easing it of strain on taxation and reducing the demand for foreign savings, especially, where the credit providing
financial institutions are risk averse. Deepening the financial market not only stops and reverses capital flight but it also diverts savings from unproductive uses. In addition, the evidence suggests that, where the financial market is
deepened, real interest rates tend to be positive and the difference between lending and deposit rates reduces, in addition to the narrowing of the gap in rates in the organized and unorganized financial markets.
The liberalization of financial markets will therefore open the way to superior allocation of savings by widening and di versifying the markets in
which savers and investors compete freely for loanable funds. In fact, Mckinnon (1973) and Shaw (1973) emphasized the role of financial deepening in increasing the rate of domestic savings and investments in a developing
economy, and argued that, where financial deepening contributes to increases in the expected profitability of capital, it is also to be expected that it will encourage investments and economic growth.
11.2 STATEMENT OF HYPOTHESIS As a re-statement, this study is to ascertain if the Nigerian economy has
attained a higher level of financial deepening during the post-liberalization period. I
If "YES" what caused it? If "NO", what factors militated against it? From the findings, we hope to ascertain whether or not the monetary authorities have achieved their policy objectives by embarking on the reform measures.
Developments in the Nigerian Financial system since the commencement of the financial sector reform have been mixed. The rapid expansion in the number of banks and the branch network of the banks have produced mixed results. It has improved the ratio of banks per capita and has equally, triggered
banking distress, which has shaken the confidence of the public. With the reform, it is generally assumed that the level of financial intermediation
has also increased.

Nnanna I Dogo 8
Generally, the question whether or not the reform has made any significant
difference in Nigeria's financial system, is essentially, an empirical question,
which this study seeks to ascertain. In this connection, the null hypothesis (H0)
could be stated thus: that there is no difference between the pre-reform period, vis-avis the post-reform period. This can be expressed symbolically thus:
H (MU - MU ) = 0 or there is no significant difference between O Pre-refonn - post-refonn
the mean values in the two periods.
where H0
:MUpre-refonn mean values of selected variables during the pre-reform period while
H ·MU mean value of the same selected variables 0 • post-reform
during the post-reform period.
The Alternate hypothesis (HA), is HA:(MU 1
, >/MU , ) =/= 0. essentially pos -re,onn pre-n:ionn
implies that the selected mean values of the variables5 in the post-reform period are significantly different from the mean values of variables6 in the prereform era. Using a two-tail T-test, we shall reject the null hypothesis if we
found that the mean value of the calculated T is less than or greater than the mean value of T- from the table, at five percent level of significance.
III. THE MODEL III. 1 Model specification and expectation
We specify below three reduced form single equation behavioral models,
within a partial equilibrium framework for the level of gross domestic savings (GNS), domestic investments (DIV.), and financial deepening, proxied by the ratio of broad money to gross domestic product (GDP). The different relationships are specified as follows-IIl.1.1 Domestic Savings Functions
For our model, domestic savings represent the residual of what was not consumed out of income and is posited to be influenced by real per capita
income (PCii1), financial savings (FSi
1), last year's gross national savings
(GNS1_1), and the real rate of return, proxied by the real savings rate, (Savrati
1),
Uchendu (1993), Hadjimichael et al. (1996). The function is specified thus:-

9 CBN ECONOMlC & FINANCIAL REVIEW VOL. 36 NO. 2
GNS/GDP = f (PCI, GNS1.p FS, Savrat) ...... . ....... 3.1
In logarithmic transformation form:-Log(GNS/GDP;1) = a0 + a, log(PCI;i)+~ log (FS/GDP)+'½ log (GNS1)+
a4log(Savrat) + U11 ........ 3.2
where the parameters estimated represent the rate of change or elasticity in gross national savings with respect to per capita income (a1), financial savings (a
2), last year's gross national savings (a3), and real savings rate (a4). Their
expected signs are as follows:- a,, ~''½•and a4 >O;
111.1.2 Domestic Investment Function Domestic investments in Nigeria is posited to be determined by
financial savings to GDP ratio (FS/GDP;1), previous year's gross national
savings (GNS1_/GDP), private sector credit to GDP ratio (PSC/GDP;i), real
lending rates, (RLENDRA) and rate of inflation (lnfla;1) The general form of
the model is expressed as follows:
DIV /GDP11=f(FS/GDP;1,PSC/GDP;1, RLENDRA;1,
INFLAit, GNS1_/GDP)
In linear logarithmic form,
......... 3.3
log(DIV./GDP;,) = b0 + b 1Log(FS/GDP11) + b2Log(PSC/GDP,,) + biRLENDRA;1) +
b4Log(INFLA) + bsLog(GNS,jGDP) + Uit ......... 3.4
where the coefficients b 1, b2, b3, and bs >O; b3, & b4 <0.
111.1.3 Financial Deepening Function Financial deepening (MS/GDP) depends on financial savings (FS/GDP),
private sector credit to GDP ratio, (PSC/GDP), value of cheques cleared to GDP, (CHEQV A/GDP,,), value of cheques to money supply (CHEQV A/MS2),
the rate of inflation (INFLA) and real lending rates (RLENDRA;1). The model
is-:given as:

Nnanna I Dogo 10
MS /GDP. =ffRLENDRA. ,FS/GDP.1CHEQV A/GDP.
1,CHEQV A/MS2,
2 II \ II I I
INFLA PSC/GDP.,) .. ........ 3.5 it' Jt
In linear logarithmic equation form: Log(MS/GDPi
1)= C
0 + C,(RLENDRA) + C2Log(FS/GDP) +
C3 Log(CHEQV A/GDP)+ C
4Log(CHEQV A/MS2i1,) + C5Log (INFLA;1,) +
C6
Log PSC/GDP., + U . . ....... 3.6 II II
In order to enhance the robustness of the empirical analyses, the result of the regression was further compared and supplemented with the evidence from the statistical inference from the means test hypothesis that was performed.
111.2 Data Sources and Estimation Procedure Data used in the study were obtained from Central Bank of Nigeria
publications, supplemented with sources from the Federal Office of Statistics. The study used time-series data for the period 1976 to 1997. Financial deepening is proxied by the ratio of money supply to GDP, value of cheques to GDP, value of cheques to money supply, ratio of private sector credit to GDP, financial savings, persons per banking office, bank assets to GDP and Bank loans and advances. Though we would have preferred the use of a much broader concept of financial deepening like Goldsmith's Financial inter-relations ratio (FIR), however, due to data limitations, we could not do it. In addition, we do not think that the Nigerian financial market has developed beyond our current definition of M2, such that M
2 does not capture all the developments
in the market. All data has been standardized to talce care of changes in the general level
of prices (i.e. the real, and not nominal value was used in the analysis). The equations were estimated using stepwise least squares regression method and their logarithmic transfonnations taken, since it gives better estimates of the coefficients, as well as the elasticity of the variables.

11 CBN ECONOMIC & FINANCIAL REVIEW VOL. 36 NO. 2
IV. FINDINGS AND CONCLUSION
IV.I Findings From the' results of the empirical analysis presented in Table I and charts
1-3, we can draw the following preliminary conclusions as to what happened during each of the two periods.
IV.1.1 Analysis of Trends in Real Savings, Investments and Financial Deepening in pre-reform. 1976-1986.
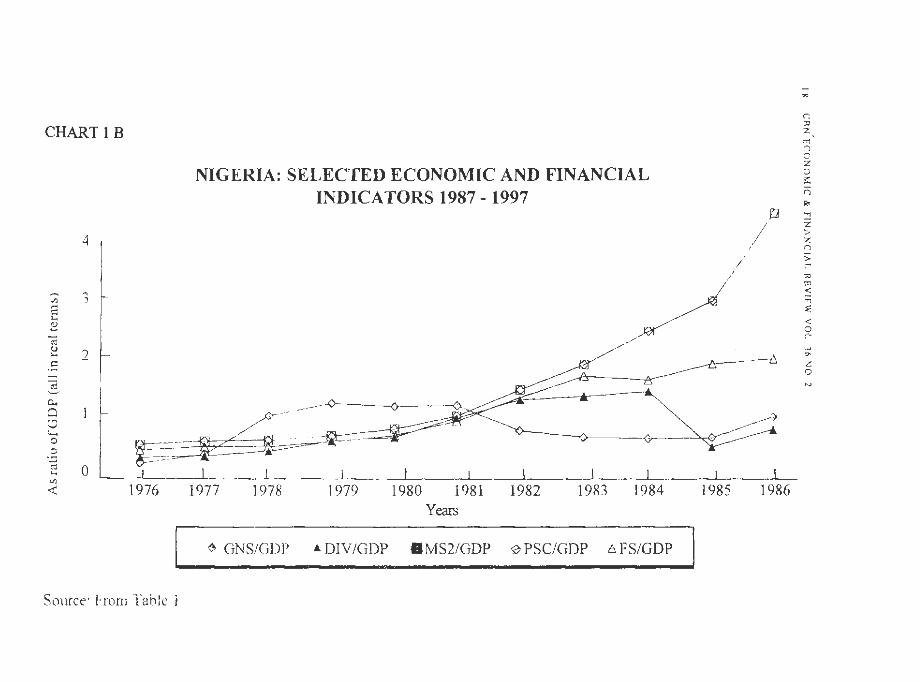
( 1) The dominant feature of the pre-reform period was that the ratio of gross national savings, (GNS/GDP or S), was persistently below that of domestic investments,(DIVGDP or 1), giving negative resource gap, (RESOGAP or R), for most of the period, except for 1979 and 1980. The resource gap was financed mainly from external borrowing. Domestic investments were low, despite the numerous provisions for capital programmes in our national development plans during the period. Evidently, the repressed negative real rate of interest was also not helpful in boosting domestic investments, (see Table I column (N) for real saving rate (RSAVRA) and column (L) for real prime lending rates, (RLENDRA). ( see chart 2 ) ). (ii) The depth of the Nigerian financial market remained fairly shallow up to 1983, when it began to deepen gradually. This can be seen in the low ratios of the money supply to GDP, ( M/GDP or M), financial savings to GDP, (FS/GDP or F), value of cheques to GDP, (CHEQVA/GDPor D), high number of persons per bimking office (POP/BKS or P), low Bank assets per capita (ASSET/GDP or H) and money supply plus certificates of deposits
to GDP (FINDEEP/GDP or J). (see Table I and chart 1 ).
(iii) Abstracting from the value of domestic credit to GDP (LOAS/GDP or A) it is clear that, the banks were lending less despite the various sectoral credit allocation policies which were introduced during the period. Basically, the policy of financial repression which was intended to boost domestic investment via low interest rate, produced the opposite results (see Table 1 ).

Nnanna I Dogo 12
IV.1.2 Analysis of Trends in Real Savings, Investments and Financial Deepening in post-reform period, 1987-1997.
Conversely, the essential features of the post-reform era are as follows: (i) The gross national savings ratio were higher than domestic investments during the post-reform period, except for 1993 - 1995, when the reform policies of the financial sector were either abandoned or regulation re-introduced. The positive resource gap were higher in post than pre-reform periods. (see Table I and Chart 1).
(ii) The financial deepening index of money supply (M/GDP or M), grew from 0.5 in 1987 to 9.6 in 1990, 11.6 in 1996 and 46.5 in 1997. This was due to some of the positive impact of the financial sector reforms on the financial market which led to developments of new financial institutions and instruments, thus providing more opportunities to savers and investors in the economy. Other factors include the relatively low level of deficit financing (DEFICIT or B) in the early 1990s, the falling rate of inflation, (INFLA or K), improved investor confidence in the ability of the market to allocate funds efficiently as reflected in the increased value of the ratio of private sector credit to GDP, (PSC/GDP or C). Furthermore, there were increases in the value of cheques cleared, (CHEQV A/GDP or D), financial savings, (FS/GDP or F), and Bank assets per capita (ASSET/GDP or H). Others are declines in the number of persons per banking office (POP/BKS or P) and in the value of cheques to money supply( CHEQV AIMS2 of V)- (see Table I & chart 1).
(iii) The evidence supports the relative deepening of the Nigerian financial market, during the post-reform period than in the pre-reform era. However, the pattern of domestic investments is not distinctively clear, we found that gross domestic investments in Nigeria fell into four main growth patterns, namely:-
a) A period of mild growth for most part of the pre-reform period, when nominal interest rates were regulated and credit sectorally allocated by the monetary authorities based on government directives. The average growth rate in domestic investment was 0.97 compared to l .92 per cent in the post-reform period. (see Table I).

13 CBN ECONOMIC & FINANCIAL REVIEW VOL. 36 NO. 2
b) A period of high growth between 1987 to 1990, when the reforms were being implemented with some degree of commitment and consistency, interest rates more or less based on market conditions and the monetary authorities intervened only to correct market failure. Such interventions were made by means of imposing statutory limits.
c) A period of decline from 1991 to 1996, following the return to guided de-regulation and
d) A partial resumption of growth in 1997, (see Table I c.olumn 1) following the implementation of policies on distressed banks and the relatively more liberalized interest and exchange rate policies.
It is pertinent to note that, the period of high growth in domestic investment coincided with the structural reforms which started between 1986 to 1988, and sustained in various forms through the 1990s. While the periods of declines also coincided with the era of controls, (1981-1986, 1995-1996), when domestic investment ratio fell drastically. However, with the implementation of reforms in the banking system and a return to guided deregulation, the ratios started to rise again by 1997, (see Table 1 and chart 3).
The financial deepening index of money supply plus certificates of deposits -to- GDP ratio (FINDEEP/GDP or J) demonstrated moderate growth before reforms, but increased markedly during the post-reform period. For example, it grew from 0.50 in 1976 to 3.9 in 1981, 5.0 in 1987, 10.2 in 1990 and 46.9 in 1997. Furthermore, the number of bank branches also witnessed phenomenal growth of 71 per cent between 1987 to 1997. The number of persons per banking office (POP/BNKS or P) reduced from an average of 1.5 between 1976-1986 to 0.7 in the post reform era, while bank assets to GDP (ASSET/GDP of H) rose from 3.3 to 14.3 during the two periods. Real savings rate also rose from minus 5 to positive 9.0 per cent and real lending rates from minus 7.5 to 1 1.2 per cent .in the two periods respectively. In addition, the value of cheques to money supply also rose from 2.72 to 6.88 and financial savings from 1.0 to 3.2 per cents, during the periods under review.
In summary, we conclude that though gross national savings ( GNS/GDP or S) increased markedly during the post-reform period, the
Nnanna I Dogo 14
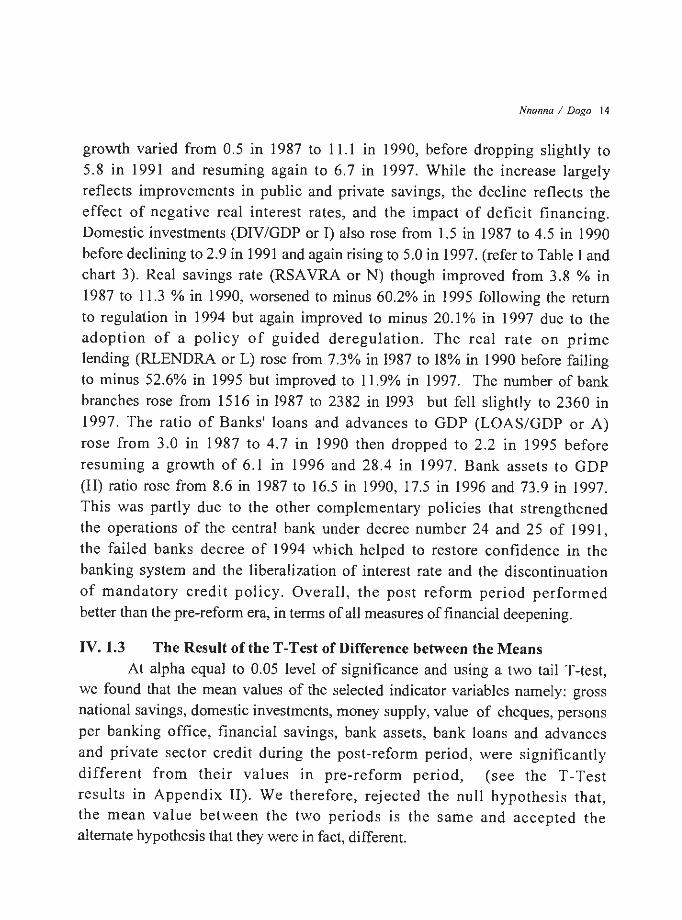
growth varied from 0.5 in 1987 to 11. l in 1990, before dropping slightly to 5.8 in 1991 and resuming again to 6.7 in 1997. While the increase largely reflects improvements in public and private savings, the decline reflects the effect of negative real interest rates, and the impact of deficit financing. Domestic investments (DIV /GDP or I) also rose from 1.5 in 1987 to 4.5 in 1990 before declining to 2.9 in 1991 and again rising to 5.0 in 1997. (refer to Table I and chart 3). Real savings rate (RSAVRA or N) though improved from 3.8 % in
1987 to 11.3 % in 1990, worsened to minus 60.2% in 1995 following the return to regulation in 1994 but again improved to minus 20.1 % in 1997 due to the adoption of a policy of guided deregulation. The real rate on prime lending (RLENDRA or L) rose from 7.3% in 1987 to 18% in 1990 before failing to minus 52.6% in 1995 but improved to 11.9% in I 997. The number of bank branches rose from 1516 in 1987 to 2382 in 1993 but fell slightly to 2360 in 1997. The ratio of Banks' loans and advances to GDP (LOAS/GDP or A) rose from 3.0 in 1987 to 4. 7 in 1990 then dropped to 2.2 in I 995 before resuming a growth of 6.1 in 1996 and 28.4 in 1997. Bank assets to GDP (H) ratio rose from 8.6 in 1987 to 16.5 in 1990, 17.5 in 1996 and 73.9 in 1997. This was partly due to the other complementary policies that strengthened the operations of the central bank under decree number 24 and 25 of I 991, the failed banks decree of 1994 which helped to restore confidence in the banking system and the liberalization of interest rate and the discontinuation of mandatory credit policy. Overall, the post reform period performed better than the pre-reform era, in terms of all measures of financial deepening.
IV.1.3 The Result of the T-Test of Difference between the Means At alpha equal to 0.05 level of significance and using a two tail T-test,
we found that the mean values of the selected indicator variables namely: gross national savings, domestic investments, money supply, value of cheques, persons per banking office, financial savings, bank assets, bank loans and advances and private sector credit during the post-reform period, were significantly different from their values in pre-reform period, (see the T-Test results in Appendix II). We therefore, rejected the null hypothesis that, the mean value between the two periods is the same and accepted the alternate hypothesis that they were in fact, different.

15 CBN ECONOMIC & FTNANCIAL REVJEW VOL. 36 NO. 2
The T-test result support our preliminary conclusions from the ratio analysis (see table one) and from the trends in charts 1-3, which is further complemented by the regression results. They show that, Nigeria's financial sector reforms started in 1986 did in fact, achieve some measure of deepening of the Nigerian financial market.
The evidence further suggest that, the liberalization of the Nigerian financial sector have, in spite of the distress in the banking system, produced some positive results on these variables, though the impact could have been greater, if the monetary authorities had operational independence and flexibility to intervene decisively on timely basis.
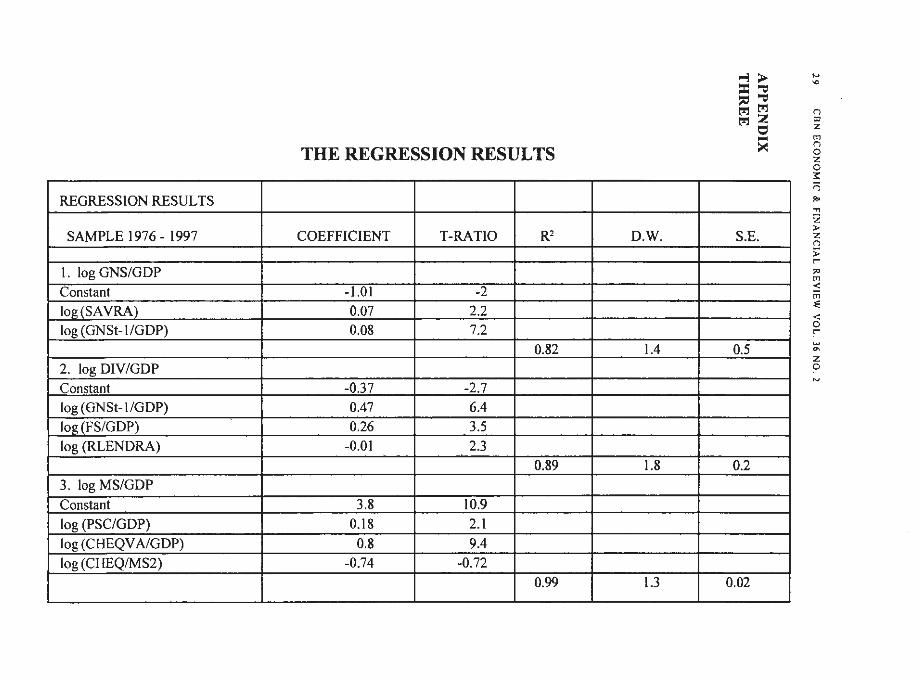
IV. 1.4 The Regression Results The stepwise regression in appendix III, show the following results
for Nigeria. First, that gross national savings (GNS/GDP) are mobilized by policies
aimed at enhancing the per capita income real savings rate (SAVRA) and increasing the stock of previous year's savings, (GNS,_/GDP). Second, Domestic Investments (DIV /GDP) in Nigeria are determined by policies that promote financial savings (FS/GDP), raise the stock of previous year's savings (GNS
1_/GDP) and can
induce real positive rates of interest. Third, that the Nigerian Financial Market is deepened through the libralisation of credit and improvements in the payment systems which can enhance the transmission mechanism of monetary policy. Policies meant to encourage savings and or investments, will contribute towards a deeper financial market, if those policies can lead to positive real interest rates, a dynamic private sector that is constantly engaged in economic activities which can raise the stock of savings as well as promote the use of cheques and financial savings in the economy. These set of policies are better implemented through a comprehensive and well coordinated economic adjustment package like the proposed Medium-Term Economic Programme for Nigeria.
On the whole, while the savings and financial deepening regression results showed positive serial correlation ( i.e. DW < 1.5), the investment result had a Durbin-Watson of 1.8, which is within the acceptable region. The independent variables in each of the three equations explains more than eighty

Nnanna I Dogo 16
per cent of changes in Savings, investments and financial deepening, as given by the value of the coefficient of determination. The-result thus complements
our T-test and ratio analysis, already discussed above.
IV.2 Conclusion Our empirical analysis has confirmed the relevance of the alternate
operational hypothesis, that the financial and monetary policy reforms which were introduced in 1986 have indeed, achieved the desired objective of deepening the Nigerian financial system. Among other things, it has strengthened and deepened the interbank market, led to increased use of cheques and money market instruments, and increased monetary velocity. Furthermore, the reforms have enhanced the mobilization of savings, expanded bank lending to the domestic economy and improved per capita banking ratio significantly.
The distress in the banking system which came in the wake of the reform measures was largely due to managerial inadequacies and macroeconomic instability and therefore, cannot be attributed to the financial system reforms per se. Overall, available statistical evidence strongly suggest that the financial sector and monetary reforms, in spite of the distress in the banking industry, have in fact, produced some significant positive results. Though, the impact could have been greater if the monetary authority had the legal and operational autonomy and flexibility to intervene decisively and on timely basis in the system.

CHART 1 A
0.3
0.2
oj
:.I ~ 0.1
~ Cl-,
O 0 0 '--0
.:3 iii .... Vl
-<(
-0.1
NIGERIA: SELECTED ECONOMIC AND FINANCIAL INDICATORS 1976- 1986
1976 1977 1978 1979 1980 1981 1982 Years
1983 1984
$ GNS/GDP ~DIV/GDP B MS2/GDP • PSC/GDP .6 FS/GDP
Source: From Table l
-....
--··.-
1985 1986
'CHART I B
~ 0.. 0 '.., V :..... 0 0
3
2
NIGERIA: SELECTED ECONOMIC AND FINANCIAL INDICATORS 1987 - 1997
--·--<>---------<)----v
I
~ .... "'
~ :c~z~*- ~ 0 ~-~-___. _ _ ____, ____ __,___ __ __._ __ __.._ __ _,__ __ _._ _ ___.c.._ __ ...__ __ .___
< 1976 1977 1978 1979 1980 1981 1982 1983 1984 1985 1986 Years
~ GNS/GDP £ DIV/GDP 8MS2/GDP 0 PSC/GDP 6 FS/GDP
Source: From Table i
-.. r. ,,, z. m n C z 0 :,:: ri Ro> .., z > 7. n > r-;;o m < m :!: < 0 r
z 0

CHART2A
20
0
i3 :J -20 e 0 .... 0
2 Gil ~
-40
NIGERIA: MOVEMENTS IN REAL SAVINGS, INVESTMENTS AND GROWTH IN GDP 1976 - 1986
1976 1977 1978 1979 1980 1981 1982 1983 1984 Years
• RSAVRA <> RLENDRA • REALGDP
Source: From Table 1
1985 1986
.,
" <> .. <>

CHART2B
40
20
0
,fl ~ -20 0 ..
0 .... 0 -40
! -60
-80
NIGERIA: MOVE1VIENTS IN REAL SAYINGS, INVESTMENTS AND GROWTH IN GDP 1987 - 1997
_ __j___ _ _ . · - J _ _ __.__ ------ ~..___ __ ...__ _ __._ ___ __J_ _ _ ~ - --~- ~-
1987 l 988 1989 1990 1991 1992 1993 1994 1995 1996 1997 Years
• RSAVRA • RLENDRA a REALGDP Source: From Table 1
... 0
...

CHART3
1.2
0.8
..d 0.6 ~ 0 ;...
0 <+-<
0.4 0 ,., .., ell 0.2 ~
0
NIGERIA: TRENDS IN SAVINGS AND INVESTMENTS, 1976 ~ 1997
-0. 2 .._.__.,______._ _ _._____._ _ _.____,__-'--__;'------'---'----'---'--__._....,___~___._---'----'------'----'---'----1976 1977 1978 1979 1980 1981 1982 1983 1984 1985 1986 1987 1988 1989 1990 1991 1992 1993 1994 1995 1996 1997
Years
• GNS (p DIV
Source: From Table l

..., Iv
n 0,
NIGERIAN SELECTED ECONOMIC AND FINANCIAL INDICATORS 1976 - 1997 z r,; n 0
s F H p V R N L G y I( z M C E A D 0 1976 0.392 0.432 0282 0.128 0.120 0002 0.121 0350 0.()01 0.0495 1.608 4.000 -0.79 -17.2 -15.2 4.2 16.8 11.10 21.20 :::: 1977 0.541 0.637 0.480 0.230 0.175 0002 0.216 0.596 0.001 0.750 1.584 2.169 -1.46 -lt.4 -9.4 6.2 27.1 12.60 15.40 n 1978 0.331 0.536 0.521 0.318 0.203 0011 0.291 0.644 0.001 0.792 1.655 4.312 -5.06 -11.6 -9.6 5.4 24.6 7.50 16.60 p,, 1979 0.953 0.845 0.920 0.502 0.390 0017 0.446 1.097 0.002 1.292 1.595 2384 1.32 -6.8 -4.3 7.7 44.4 13.20 11.80
1980 1.175 l.138 1.512 0.755 0.606 0 200 0.714 1.817 0.(1()2 1.932 1.618 1.581 0.42 -J.9 -2.4 9.7 60.6 12.00 9.90 "Tl 1981 0.381 0.831 1.053 0.656 0.446 0 156 0.633 1.454 0.002 1.325 1.670 l.910 -9.37 · -14.9 -13.2 3.4 27.8 7.80 2090 z 198:! 0.771 2.020 3.127 2.103 1.389 I.Z58 2.128 4.810 0.006 J.867 1.482 1.367 -9.54 -0.2 2.6 9.1 80.3 4.60 7 70 > z 1983 0.234 0.528 1.259 0.802 0.613 0558 0.818 2.012 0.002 1.519 l.313 3.588 -6.78 -15.7 -13.2 2.9 28.5 3.00 23 20 n 1984 0.107 0.217 0.866 0.519 0 441 0.485 0.529 l.387 0.001 1.026 I.Z49 5.500 -4.29 -JO.I -27.l 1.6 17.2 210 39.60 > 1985 1.040 1.470 5.281 3.615 1304 3694 l694 9.764 0.005 7.336 1.227 0.462 -2.47 4.0 3.8 12.5 137.5 2.30 5.50 r-1986 -0.388 1.907 5.407 4.522 J.628 8074 4.818 12.528 0.008 7.449 1.235 0.659 -12.38 4.1 5.1 13.2 137.8 10.60 5.40 ';<l Mean O.!O 0.97 2.06 1.29 1.0] 1.]1 1.,1 3.31 0.00 2.53 U8 2.72 -4.58 -9.43 -7.45 6.90 54.80 7.89 16.11 r,;
< s M C F E A H D p V R ~ L G y I(
r,; 1987 0.495 1.478 4.451 l.536 2.590 13.978 2995 8611 0.007 5 006 . 1.138 1.589 -10.04 3.8 . 7.3 6.9 105.3 S.50 10.20 ~ 1988 0.468 0.415 1.436 1.000 0.130 4.735 0.819 2.524 0.002 1.571 0.932 6.264 1.93 -23.8 -21.8 2.0 361 7.10 38.30 < 1989 1.760 0.539 1.353 0.905 0.697 7.030 0.779 2.547 0.002 1.470 0.777 7.082 49.94 -24.5 -14.1 2.0 58 9 6.70 40.90 0 1990 II 091 4.518 9.572 5398 4.373 43.938 4.720 16.460 0.013 10.162 0.613 0.982 49.34 11.3 18.0 12.1 361.4 8.50 7.50
r-1991 5 846 2.880 6.717 J 684 3.065 26.679 3 204 li.636 0.011 7.042 0.505 2.046 38.58 I 3 7.0 7.3 !SI.SI 12.40 13 00
.., °' 1992 1.661 1126 2.905 1.379 1235 tpos 1.252 S.249 0.005 2.996 0.499 7.965 14.80 -28.4 -14.7 2.2 120.8 7.20 44.SO z 1993 0.819 1• 94 3.552 l.707 1.538 11.68} 1.314 5315 0.006 3.625 0.510 9.010 -36.Se -31.5 -18. I 1.8 122.2 15.40 54 20 0 1994 0.634 1477 4.652 2.124 1.884 1 t.270 1.B60 6.208 0.009 -1.721 0.533 11.281 -48.32 -43.S -36.0 1.8 162.9 7.90 57 00 '-> 1995 0.471 1209 3.918 2.154 LJ86 9.515 2.231 6.170 0.010 3.971 0.548 18.496 8.41 -60.2 -52.6 1.4 280.1 O.SO 72.80
1996 1.191 0.156 11.848 6.331 3 966 22.885 6.101 17.521 0.036 I t.976 0.627 8.843 19.55 -19.2 -9.J 36 978.7 l.90 29 30 1997 6.582 4 971 46.476 32.019 13 778 65.429 28.405 73.921 0.119 46.900 0.650 2.171 1J 69 0. 1 11.7 Ill 3657.9 5.00 8 so Mean 2.820 1.924 8.807 S.476 121 20.86 4.88. 14.29 0.01995 9.04 0.67 6.88 9.22 -20.06 •I I.IS 4.94 557.80 7.10 14.20
Source!!: I. Cenlral Bank ofNiseria S1-11tiscal BuUetin., June 1996 2. Central Bank of Nigeria Major Econom•c and Financial Indicators. April 1997 J. Central Bank of Nigeria. Annual Reporu 1997 4 Feder1..l omce of Suuistict, Socio-Economic Profile ofNigcri~ 1996
KEY
Loans 10 GDP= LOASIGOP or A Broad money supply IO GOP= MS21GDP or M ~sourcegap = Resogap or R Feder>] go,_. Budge1 deficit lo GDP= Deficit or B Real commercial banks rate on savin.g.s deposits== RSavra or N Rate of inflation = INFLA or K Private sector credit to GDP = PSCIGDP or C Number of PenorlS per Banking offic:e = POP/BKS or P Bank ass.ea per capita""' A.isetlGDP or H Value of cheques lo GDP =CHEQVNGOP = D Value of cheques to money suppply = CHEQV AIMS2 or V Financial saving.s w GDP= FS/GDP or F Saving GDP ratio~ GNSIGOP or S Rc•I gro'tl'th in the economy== Real GDP or G External debt 10 GDP ratio= EDS/GOP or E Domestic investmencs to GDP ,.,. DIV/GDP or J Red commerdal banks prime ltnding rate.,.. RLENDRA or L Per capita income,.. PClR or Y
finandal deepening index proxied by MS2 plus ccrtificale.s of deposiu or J

23 CBN ECONOMIC & FINANCIAL REVIEW VOL. 36 NO. 2
NOTES
1. Technically, the reform measures were designed to run for a period of two
years.
2. CBN 1997 Annual Report and Statement of Accounts, p. 17
3. We would have preferred a more comprehensive measure of financial
deepening, like Goldsmith's Financial Inter-relations Ratio, but for dearth of data. May be such a study can be considered as one of the areas for further research.
4. Some of the effects of a repressed financial market include low flow of loanable funds through the banking system; arbitrary differential interest
rate structure based on preferential system of borrowers; high inflation and illiquid banks thus making it difficult for the market to financially
deepen and impaired self financing by enterprises and households, due to the negative real rates of yields on financial assets, as currency and
liquid assets are accumulated as hedge against inflation.
5. The selection of the variables was not done randomly, rather the inclusion of each variable was dictated by theoretical underpinning and availability
of data.
6. or 95 % confidence interval.

Nnanna I Dogo 24
REFERENCES
Abel and Bernanke(l 995) Macroeconomics: Canadian Edition, Addison
Wiley, Canada.
Adewumi, Wole (1997) "Management of Financial Sector Reform: Nigerian Experience" in Ariyo (1997),135-158.
Agu, C. C. (1988) Nigerian Banking Structure and Performance: The Banking Systems Controls in Economic Development, Africa_Publishers , Onitsha, 22-30
Ajayi, S. 1. (1978) Money m a Developing Economy: A Portfolio Approach to Money Supply Determination in Nigeria, Ibadan University Press.
Andrew Solimano ( 1996) "National Savings and Investment: Paradigms, Puzzles, Policies" World Bank Research Observer (WBRO) II, (I), 87-117.
Ariyo, Ademola [ed.] (1997) Economic Reform and Macroeconomics Management, Ibadan, Nigeria.
Babalola, J.A and F.O. Odoko(l996) 'The Performance and future of Mandatory Allocation of Credit to Selected Sectors in the Nigerian Economy" CBNEFR, 34(3), 675-690.
Boamah, Daniel (1996) "National savings and Investment in the Barbados Economy" Central Bank of Barbados Economic Review, 23,(1) 46-52.
Busari, Oladapo (1997) "Interest Rate Management and the Performance of the Nigerian Economy: An Appraisal" in Ariyo, ed., (1997), Economic Reform and Macroeconomic Management in Nigeria, 25-35
Calamitis, et al (1996) "National Savings and Investment in Sub-Saharan Africa: Cross-Country Analysis" IMF Occasional Paper, 1996.
Chete, Louis (1997) "Raising Domestic Savings" in Phillips and S.Titilola (eds..),- Nigeria in 2010 Nigerian Institute of Social and Economic Research, Ibadan, 301-311.

25 CON ECONOMIC & FINANCIAL REVIEW VOL. 36 NO. 2
Emenuga, C. (l 997) "Investment Climate in Nigeria: An Appraisal" in Ariyo,
ed., (1997), Economic Reform and Macroeconomic Management m
Nigeria, 325-338
fakiyesi, 'T .. ( 1997) "Interest Rate Management in Nigeria: An Overview"
in Ariyo, ed., (1997), Economic Reform and Macroeconomic
Management in Nigeria. 11-23.
Fakiycsi, O.M. ( 1998) "The Performance of the Nigerian Financial Sector
since 1986" in Nigerian Economic Society, (l 998), Rekindling
Investment for Economic Development in Nigeria, 1998 Annual
Conference proceedings, 127-143.
Fry, M. J. (1980) "National savings, Investment, Growth and the Cost of
Financial Repression" World Development, .8, 3-17-327.
Goacher, David J. ( 1986) An Introduction to Monetary Economics,
Financial Training Publications, London, 72-73).
Goldsmith, R. (1966), The Determinants of Financial Structure,
Development Centre of the OECD, Paris.
----------- ( 1966) The Financial Development of Mexico, Development
Centre of the OECD, Pairs.
Habibullah, M.S. (1995) "The Demand for M3 in a Financial Deepening
Developing Economy: The Malaysian Experience", Nigerian
Journal of Economic and Social Studies, 37,2-3, 97-105
Hadjimichael et al. (l 996) Adjustment in Sub-Saharan Africa, IMF
Occasional Paper# 143.
Mckinnon, R. I. (l 973) "Money and Capital in Economic Development"
(Washington DC. Brooking Institution), USA.
Ndekwu, E. (1988) "Domestic credit, Money Supply and Monetary Policy"
in Phillips, A.O. and E. C. Ndekwu (eds.) Economic Policy and
Development in Nigeria, Ibadan. Also see Ndekwu, E. (I 995)

Nnanna I Dogo 26
"Monetary Policy and the liberalization of the financial sector" in lwayemi, A. (ed.), (1995) Macroeconomic Policy Analysis in an open Developing Economy: A case Study ofNigeria, Ibadan, 371-394
Ogiogio, G.O. ( 1989) "Response of financial Intermediaries to Interest Rate Differentials and Application for Monet~ry Policy Administration in Nigeria" African Review of Money, Finance and Ban.king, No. 1
Ogun and Bakare (1997), "Financial liberalization process in Nigeria: An impact Analysis" in Ariyo, Ademola [ed.] (l 997) Economic Reform and Macroeconomics Management, Ibadan. 135-174.
Ogwuma, P.A. (1997) "The Budget Process and the Central Bank's Role·· in NCEMA Policy Analysis Series, 3, (1 ). 133-139.
Ojo, M.0 ( 1997) "A Review and Appraisal of Monetary and Other Policies in the 1997 Federal Budget" in NCEMA Policy Analysis Series, (1)47-64
Shaw, E. S. (1973) Financial Deepening in Economic Development, Oxford University Press, New York.
Stiglitz, Joseph E. Marifou Uy (1996) "Financial Markets, Public Policy and East Asian Miracle", World Bank Research Observer, 11 (2) 249-276.
Tseng, Wanda and Robert Coker (1991), "Financial Liberalization, Money Demand and Monetary Policy in Asian Countries" IMF Occasional Paper# 84.
Uchendu, Okorie (1993) "Interest Rate Policy, National Savings and Investments in Nigeria" CBNEFR, 30,(1)34-52.
Vittas Dimitris and Yoon Je Cho (I 996) "Credit Policies Lessons from Japan and Korea" WBRO, II (2) 277-297.

27 CBN ECONOMIC & FINANCIAL REVIEW VOL. 36 NO. 2
APPENDIX ONE: List of the Variables. The following were the main variables( all in real terms) used in the
model:-
(i) GNS = Gross National savings (ii) DIV. Domestic Investments (ii) MS2
= Broad Money Supply (iv) INFLA Rate of inflation (v) Savrat = Rate paid on saving deposits. (vi) Lenrat = Rate charged on prime lending. (vii) PCI = Per Capita Income (viii) GDP = Gross Domestic Product at 1984 factor cost. (ix) Cheq = Cheques (x) Pop = Population (xi) Deficit = Federal Government Fiscal Deficit (xii) EDS = External Debt Stock (xiii) FS = Narrow money plus Saving and time deposits.
(xiv) LOADVS = Commercial Bank loans and Advances
(xv) T-1 = Value in the Previous year or Lagged.
(ix) Uit = Error term of regression

SINO. VARIABLE MEAN 1976-1986 1987 - 1997
1. GNS/GDP 0.01 0.03
2. DIV/GDP 0.01 0.02
3. MS2/GDP 0.02 0.09
4. CHEQVA/MS2 0.03 0.07
5. PSC 0,0] 0.055
6. EDS 0.01 0.21
7. PS/GDP O.oI 0.03
8. POP/BKS 1.48 0.67
9. LOAS/GDP 0.01 0.05
10. ASSET/GDP 0.03 0.14
11. CHEQVO/GDJ 0.0007 0.001
12. CHEQVA/GDI 0.00003 0.0002 13. FINDEEP or 0.025 0.09
(MS2 + CDs)
T - TEST RESULT
VARIANCE 1976-1986 1987 - 1997
0.0002 0.001
0.00 0.00
0.0005 0.016
0.0003 0.0003
0.0002 0.0008
0.0006 0.034
0.0002 0.001
0.03 0.04
0.0003 0.006
0.002 0.05
0 0
0 0
0.0007 0.016
a= 0.05 => a /2=0.025 T = 2.228
PEARSON PROB (T <=tx/2 CORRELATION 2 - tail
0.17 0.01
0.41 0.00
0.74 0.04
0.48 0.00
0.78 0.04
0.75 0.00
0.76 0.00
0.29 0.00
0.80 0.03
0.81 0.04
(0.00) 0.00
0.79 0.00
0.74 0.04
T - stat
(3.7)
(5 .8)
(2.4)
(4.0)
(2.4)
(4.2)
(4.2)
(11.4)
(2.5)
(2.4)
(4.0)
(156.0)
(2.4)
(')
tll z m (") 0 z 0 );::
i=i • z CJ ...., z > z (')
>
;o m < m :E < 0 r
z 0
REGRESSION RESULTS
SAMPLE 1976 - 1997
l. log GNS/GDP Constant log(SAVRA) log (GNSt-1/GDP)
2. log DIV/GDP Constant log (GNSt-1/GDP) log (FS/GDP) log (RLENDRA)
3. log MS/GDP Constant log (PSC/GDP) log (CHEQV A/GDP) log (CHEQ/MS2)
THE REGRESSION RESULTS
COEFFICIENT T-RATIO R2
-1.01 -2
0.07 2.2 0.08 7.2
0.82
-0.37 -2.7 0.47 6.4 0.26 3.5
-0.01 2.3 0.89
3.8 10.9 0.18 2.1 0.8 9.4
-0.74 -0.72 0.99
D.W.
1.4
1.8
1.3
S.E.
0.5
0.2
0.02
r; a, z tT1 r; 0 z 0 s: ;=; ~
"Tl
z > z n > ,.. :a tT1 < m ~
< 0 ,..
z 0