Structural Health Monitoring of Railroad Wheelsyongming.faculty.asu.edu/paper/Microsoft Word -...
22
Structural Health Monitoring of Railroad Wheels Using Wheel Impact Load Detectors Brant Stratman, Yongming Liu, Sankaran Mahadevan* Vanderbilt University, Nashville, TN 37235, USA Abstract This paper proposes two quantitative criteria for removing railroad wheels from service, based on real-time structural health monitoring trends that are developed using data collected from trains while in-service. The data is collected using Wheel Impact Load Detectors (WILDs). These impact load trends are able to distinguish wheels with a high probability of failure from high impact wheels with a low probability of failure. The trends indicate the critical wheels that actually need to be removed, while at the same time allowing wheels that aren’t critical to remain in service. As a result, the safety of the railroad will be much improved by being able to identify and remove wheels that have high likelihood of causing catastrophic failures. 1 Introduction Traditional inspection techniques used in the railroad industry, such as drive-by inspections where all of the wheels on the train are glanced at while an inspection vehicle drives by, are not as accurate and reliable as more rigorous and quantitative inspection methods. Many damaged wheels aren’t found, while many useable wheels are removed when they could remain in service. By using Wheel Impact Load Detectors (WILDs), structural health monitoring trends can be developed based on the wheel impact data which indicates the actual condition of the wheels. The trends can indicate the critical * Corresponding author, Tel.: 615-322-3040; Fax: 615-322-3365; Email:[email protected]
Transcript of Structural Health Monitoring of Railroad Wheelsyongming.faculty.asu.edu/paper/Microsoft Word -...

Structural Health Monitoring of Railroad Wheels Using Wheel Impact Load Detectors
Brant Stratman, Yongming Liu, Sankaran Mahadevan*
Vanderbilt University, Nashville, TN 37235, USA
Abstract
This paper proposes two quantitative criteria for removing railroad wheels from
service, based on real-time structural health monitoring trends that are developed using
data collected from trains while in-service. The data is collected using Wheel Impact
Load Detectors (WILDs). These impact load trends are able to distinguish wheels with a
high probability of failure from high impact wheels with a low probability of failure. The
trends indicate the critical wheels that actually need to be removed, while at the same
time allowing wheels that aren’t critical to remain in service. As a result, the safety of
the railroad will be much improved by being able to identify and remove wheels that
have high likelihood of causing catastrophic failures.
1 Introduction
Traditional inspection techniques used in the railroad industry, such as drive-by
inspections where all of the wheels on the train are glanced at while an inspection vehicle
drives by, are not as accurate and reliable as more rigorous and quantitative inspection
methods. Many damaged wheels aren’t found, while many useable wheels are removed
when they could remain in service. By using Wheel Impact Load Detectors (WILDs),
structural health monitoring trends can be developed based on the wheel impact data
which indicates the actual condition of the wheels. The trends can indicate the critical
* Corresponding author, Tel.: 615-322-3040; Fax: 615-322-3365; Email:[email protected]

2
wheels that actually need to be removed, while at the same time allowing wheels that
aren’t critical to remain in service.
The WILD system is composed of a series of strain gages welded to the rail. The
strain gages quantify the force applied to the rail through a mathematical relationship
between the applied load and the deflection of the foot of the rail. These impact forces
are used to monitor locomotive and rail car wheel health to ensure safe train operations.
The use of WILDs by railroads has resulted in the removal of high impact wheels
that damage bearings, lading, rail, other mechanical components, and the wheels
themselves. Although wheels with extremely high impacts are rare on a percentage basis,
small percentages do not equate to small effects. For example, high impact wheels have
been observed to increase the surface crack growth rate on a rail by a factor of nearly 100
times than that under non-impact loading conditions1. Also, it has been shown in a
numerical study that dynamic impacts have a detrimental effect on concrete sleeper
health by increasing the risk of crack initiation2.
High impact wheels are wheels that have an impact force of 90,000 pounds or
greater. High impact wheels are most often wheels that have a flat spot on the tread
surface, known as a slid flat. Slid flats are generally caused when a hand break is left
engaged while the train is in motion; because the wheel cannot rotate, the friction
between the wheel and rail causes the surface of the wheel to become flat instead of
round. Other high impact wheels are caused by major defects in the tread surface; these
high impact wheels have a higher probability of leading to catastrophic failure than slid
flat wheels. It is assumed that derailment is a worst case scenario, but that financial loss
begins well before the vehicle derails due to the high impacts between the wheel and rail.

3
It has been observed that some high impact wheels can remain in service for a
couple of years before failure, while others fail almost immediately3. This indicates that
the high impact force alone is not responsible for wheel failures. Only high impact
wheels that have a defect present pose a significant risk of failure. It has been reported
that the crack growth rate of metallic materials under impact fatigue is significantly
higher than under non-impact fatigue4,5.
Currently the Association of American Railroads’ (AAR) wheel impact load limit
for wayside detectors is 90,000 pounds6. Early experience with wheel impact load
detectors showed that a large percentage of high impact wheels were not condemnable
under AAR rules7, although such detectors were effective at finding high impact wheels.
Many of the most catastrophic wheel failure modes, namely shattered rim failures
and vertical split rim failures, occur below the 90,000 pound condemning limit making
the WILD system ineffective when looking at individual impacts.
This paper proposes two additional criteria for removal of wheels with high
likelihood of failure, based on two real-time structural health monitoring trends that were
developed using data collected from in-service trains. These impact trends are able to
distinguish wheels with a high probability of failure from high impact wheels with a low
probability of failure. As a result, the safety of the railroad will be much improved by
being able to identify and remove wheels that have the highest likelihood of causing
catastrophic failures.
2 Wheel Impact Load Detectors A Wheel Impact Load Detector (WILD) is used to manage the wheel impact load
spectrum for targeted removals of defective wheels from service. The WILD continually

4
monitors locomotive and rail car wheel health to ensure safe train operations. WILDs
scan millions of wheels per day throughout the international rail industry.
The installation of WILDs requires no radical modification of the existing track
structure. A series of strain gage load circuits, micro-welded directly to the neutral axis
of a rail, create an instrumented zone for the measurement of vertical forces exerted by
each wheel of a passing train. Signal processors, housed in a nearby unit, electronically
analyze the data to isolate wheel tread irregularities (see Figure 1). If any wheel
generates a force that exceeds a tailored alarming threshold, a report identifies that wheel
for action. A low-level alarm identifies cars for service at the next available opportunity;
a mid-level alarm limits a train's maximum speed until the car can be set aside for the
wheel to be removed; and a high-level alarm directs a train to stop as quickly and safely
as possible to avoid a potential derailment. These reports are usually distributed in real-
time to such interested parties as rail traffic control centers and car shops.
There are two widely used noncontact methods of quantifying the extent of
damage on the wheel8: strain-based systems, and accelerometer based systems. The
strain-based system quantifies the force applied to the rail through a mathematical
relationship between the applied load and the deflection of the foot of the rail. Strain in
the rail foot is used as a direct measure of the load at the rail head. The accelerometer
based system uses accelerometers placed on the rail to infer the extent of damage on the
wheels from the accelerometer’s output. In some cases, the accelerometer output is
converted to a force. The strain-based system is used for load measurements in this
study.

5
Figure 1 Schematic of a WILD site.
One setup for a strain gauge-based wheel impact monitor consists of 11 strain
gauge cribs, per rail9,10,11. The gauges are bonded beneath the foot of the rail and the
applied force was determined from the shear strain. Some overviews of a typical strain
gauge wheel detection system can be found in1,10,11. Fundamentally, the system consists
of strain gauges instrumented as shown in Figure 2, on both sides of the rail web with the
middle of the strain bridge being in the center of a crib.
Figure 2 Rail web schematic; full-bridge setup.
300mm
Front Side
Neutral axis
1 2
3 4

6
The stain gauges are then wired into a full-bridge circuit where both sides of the web are
taken into account to nullify the effects of any off-center strikes. According to the
arrangement as shown in Figure 2, the output of the bridge is then defined by the
following equation:
( ) ( ) ( ) ( ) ( )[ ] CFVttttGF
tFout ⋅
−+−= 4321
4εεεε (1)
where Fout(t) is the output force and εn(t) are the respective dynamic output strains; both
are functions of time. GF is the gauge factor as specified by the manufacturer of the
strain gauges, V is the input excitation voltage, and CF is a calibration factor.
Traditionally, CF is simply obtained by quasi-statically loading the instrumented
structure prior to testing.
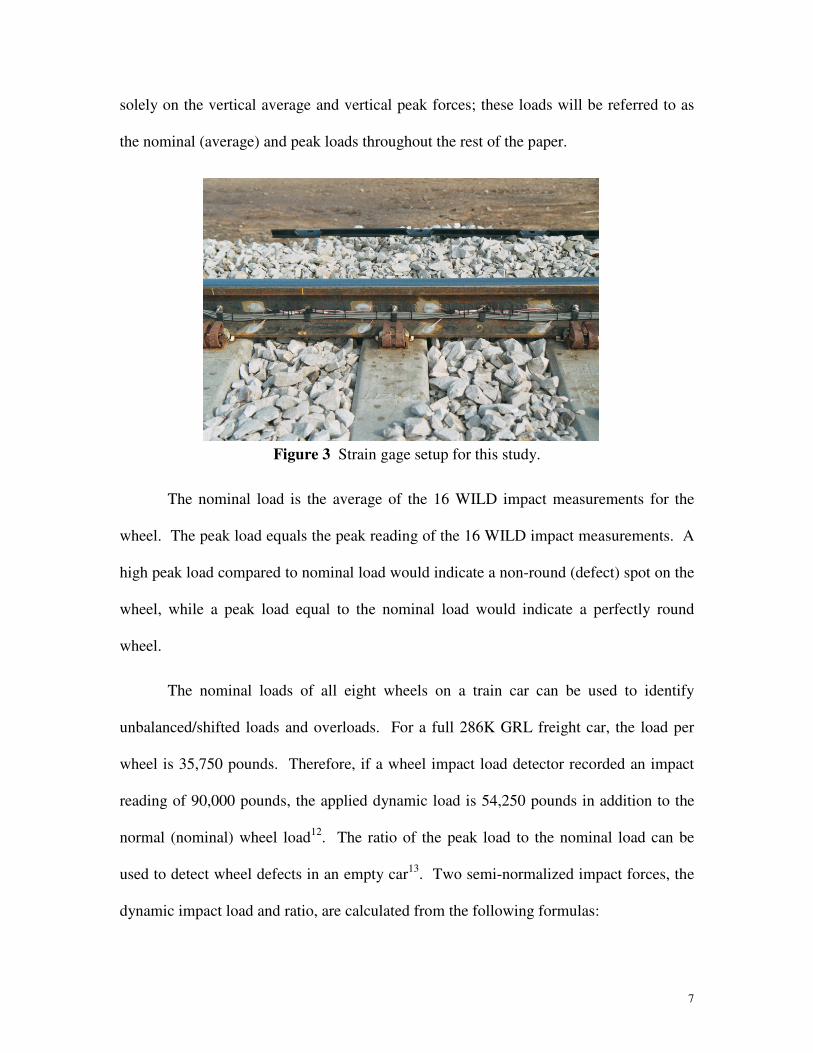
For the work presented in this paper each WILD site was made up of 128 strain
gages; 32 strain gages for vertical force measurements and 32 strain gages for lateral
forces measurements, per rail. In this setup two strain gages are required to give one
vertical force measurement and two strain gages are required to give one lateral force
measurement (Figure 3).
Each WILD site collected 16 vertical force values and 16 lateral force values per
rail (according to the instrumented zones in Figure 1); the strain gages were spaced for
maximum exposure to all wheel sizes. For most wheel sizes the force between the wheel
and rail was collected for 90% of the wheel revolution.
In order to reduce data storage space the 16 vertical and 16 lateral force values for
each rail were used to calculate a vertical average force, vertical peak force, lateral
average force, and lateral peak force measurement for each wheel. This paper focuses
7
solely on the vertical average and vertical peak forces; these loads will be referred to as
the nominal (average) and peak loads throughout the rest of the paper.
Figure 3 Strain gage setup for this study.
The nominal load is the average of the 16 WILD impact measurements for the
wheel. The peak load equals the peak reading of the 16 WILD impact measurements. A
high peak load compared to nominal load would indicate a non-round (defect) spot on the
wheel, while a peak load equal to the nominal load would indicate a perfectly round
wheel.
The nominal loads of all eight wheels on a train car can be used to identify
unbalanced/shifted loads and overloads. For a full 286K GRL freight car, the load per
wheel is 35,750 pounds. Therefore, if a wheel impact load detector recorded an impact
reading of 90,000 pounds, the applied dynamic load is 54,250 pounds in addition to the
normal (nominal) wheel load12. The ratio of the peak load to the nominal load can be
used to detect wheel defects in an empty car13. Two semi-normalized impact forces, the
dynamic impact load and ratio, are calculated from the following formulas:

8
( ) ( )load nominalloadpeak loadimpact Dynamic −= (2)
( )
( )load nominal
loadpeak Ratio = (3)
The dynamic impact load and ratio are referred to as semi-normalized impact
forces because they cancel out the effect the weight has on the impact reading. For
example, a wheel carrying more weight will have a higher peak load simply because
there is more force on the wheel. Similarly, a train moving at a higher speed will have a
higher peak load simply because there is more force on the wheel. Since the dynamic
impact load and ratio cancel out the effect the weight of the car has on impact reading,
but the speed of the train still affects their readings, these are considered only semi-
normalized impact values.
3 Wheel Failures and Failure Modes
In recent years, higher train speeds and increased axle loads have led to larger
wheel/rail contact forces. Also, efforts have been made to optimize wheel and rail
design. This evolution tends to change the major wheel rim damage from wear to
fatigue14. Unlike the slow deterioration process of wear, fatigue causes abrupt fractures
in wheels or tread surface material loss.
Railroad wheels may fail in different ways corresponding to different failure
mechanisms15,16,17. Shattered rims and vertical split rims account for the majority of
wheel failures in North America.
Shattered rim defects are the result of large fatigue cracks that propagate roughly
parallel to the wheel tread surface19,18. They form and grow ½ to ¾ inch (12-20 mm)

9
below the tread surface19. They can grow up to a length of several hundred millimeters.
Ekberg et al reported that a shattered rim can initiate from both inclusions and non-
inclusion locations20. An examination of shattered rim fracture surfaces normally reveals
a clamshell pattern as seen in Figure 4. If service damage is not too extensive, the crack
initiation site is often clearly visible.
Figure 4 Typical Shattered Rim; arrow points to origin.
Once shattered rims initiate in the wheel rim, propagation occurs rapidly under
normal wheel loading. Studies have shown that to initiate cracking a large load, such as
an impact, may be required21,22,23. Shattered rims tend to occur in either relatively new
wheels or those close to their condemning limit.
Vertical split rims are another type of wheel failure that is believed to be related
to high impact loads. A vertical split rim is believed to be due to strength failure; the
failure is a sudden failure characterized by vertical crack propagation where the tread
surface of the wheel is detached.
A large amount of scatter has been observed in the fatigue life distribution of
railroad wheels, ranging from several months to several decades (Figure 5).

10
0
0.2
0.4
0.6
0.8
1
5 6 7 8 9 10
Fatigue life (log(N))
Pro
bab
ility
Field data
0
0.05
0.1
0.15
0.2
0.25
0.3
5 6 7 8 9 10
Fatigue life (log(N))
Fre
qu
en
cy
Field data
Figure 5 Empirical CDF and frequency histogram of wheel field data.
In Figure 5, it is seen that the field data has two ranges of fatigue life distribution.
This phenomenon can be clearly seen in the frequency diagram (Figure 5(b)). It also can
be seen that the number of wheels experiencing premature failure is only a small fraction
of wheels (around 10%) and does not greatly affect the overall mean fatigue life.
However, their effects are significant at the tail region, which affects the reliability
evaluation.
Berge24 and Stone and Geoffrey25 suggest that the large stress, perhaps due to
wheel/rail impact or material discontinuity, has important effect on the shattered rim
failure. Also, the large on-tread brake loading and the thermal stresses arising from on-
tread friction braking will reduce the fatigue life of railroad wheels26. The observed
premature fatigue failure (earlier failure modal in Figure 5(b)) is possibly due to the
above mentioned factors or their combinations, such as initial defects, brake loading, and
thermal loading.
From the discussion of the failure modes and the fatigue failure life data, and also
from Figure 5, it is clear that catastrophic wheel failures can occur suddenly at any point
during the wheels’ lifetime. For this reason, the railroad industry will benefit from real-
a) CDF b) Frequency histogram

11
time structural health monitoring trends that are based on wheel impact data and monitor
wheels throughout their entire lifetime. The following sections of the paper develop two
such trends.
4 Comparison between High Impact Wheels and Failed Wheels
Currently, wheel impact load detectors are used only to identify wheels with
impacts greater than 90,000 pounds. A review of the lab database of a major North
American railroad revealed that impacts for wheels were beginning to increase over time,
even though the forces were still far below the action level of 90,000 pounds. The rises
in wheel impacts were caused by the progression of a crack which created an out-of-
round condition to the wheel3. This observation prompted research to find some
predictive characteristics, distinguishable from high impact wheels, which would identify
a wheel in real-time with a high probability of failing.
An initial investigation of the wheel impact data found that failed wheels and their
mate wheels had significantly different impact readings. Thus, one possible approach is
to remove wheels with significantly different impact readings from their mate wheels.
However, in the case of high impact wheels, since they are generally wheels with a slid
flat, both wheels on the axle have high impacts. Further analysis of the data determined
that removing wheels based on difference from mate wheel impact is not a cost efficient
method for identifying wheels with a high probability of failure because this is not a
unique enough characteristic among the wheel population; based on the analysis,
approximately 2400 wheelsets per day, in North America, have a significant impact
difference between the two wheels on the wheelset.

12
A more rigorous analysis is performed in this paper comparing high impact
wheels and failed wheels and has identified distinguishing characteristics between them.
The result of the statistical summary comparing high impact wheels with failed wheels is
shown in Table 1.
Table 1 Failed wheels get worse significantly faster than high impact wheels.
Av
era
ge
Ma
xim
um
Dy
na
mic
(k
ips)
Av
era
ge
Ma
xim
um
Ra
tio
Av
era
ge
dy
na
mic
(in
clu
des
lo
ad
ed
an
d e
mp
ty)
bef
ore
loa
d i
ncr
ease
(k
ips)
Wee
ks
ab
ov
e a
dy
na
mic
im
pa
ct o
f
20
kip
s
Len
gth
of
tim
e fr
om
av
era
ge
dy
na
mic
to
pea
k i
mp
act
(w
eek
s)
High Impact Wheels 63.31 6.44 13.40 41.00 30.05
Failed Wheels 44.53 4.02 13.35 14.75 4.15
From Table 1 it is seen that high impact wheels are actually worse than broken
wheels in every category except length of time to peak impact (the shaded cells indicate
which wheels are worse in each category). It is seen that high impact wheels have higher
impact readings for a longer period of time than broken wheels, however broken wheels
get worse much faster. This sudden increase indicates rapid crack growth leading to
failure.
It is also important to note that some trains run 100 miles/week while others run
2,000 miles/week. Therefore an analysis was conducted in order to observe whether
wheels that failed were on more active trains. This analysis determined whether failed
wheels’ impacts actually increased more rapidly (fewer revolutions) than high impact
wheels, or if they simply were on more activate trains giving the illusion that they

13
increase more rapidly. The result of the statistical summary comparing high impact
wheels with failed wheels is given in Table 2.
Table 2 Mileage comparison between failed wheels and high impact wheels.
Mil
eag
e f
rom
wh
ee
l m
ou
nt
da
te u
nti
l d
ev
iati
on
fro
m
av
era
ge i
mp
ac
t (m
ile
s)
Mil
eag
e f
rom
wh
ee
l tu
rne
d
da
te u
nti
l d
ev
iati
on
fro
m
av
era
ge i
mp
ac
t (m
ile
s)
Mil
eag
e f
rom
av
era
ge
d
yn
am
ic t
o p
ea
k im
pac
t (m
ile
s)
To
tal
mile
ag
e f
rom
wh
ee
l m
ou
nt
da
te u
nti
l p
ea
k
imp
ac
t (m
iles
)
To
tal
mile
ag
e f
rom
wh
ee
l tu
rne
d d
ate
un
til p
eak
im
pa
ct
(mil
es
)
Av
era
ge
mil
es
pe
r ye
ar
(mil
es
)
High Impact Wheels 356046.0 89911.1 26868.42 395755.1 124000.0 45713.7 Failed Wheels 341814.4 146050.0 3900.00 346604.5 151525.1 41590.4
From Table 2 it is seen that the mileage analysis agrees with the time analysis;
broken wheels’ impacts increase much more rapidly than high impact wheels. It is also
important to observe in Table 2 that high impact wheels and broken wheels, on average,
travel relatively the same distance per year. It is therefore concluded in this study that
since high impact wheels and broken wheels travel the same distance in the same amount
of time on average, then using time intervals is appropriate for developing the structural
health monitoring trends.
5 Structural Health Monitoring Trends Using Wheel Impact Load Detectors
Two trends are developed that could be used to monitor wheels in real-time. The
two trends identify wheels that suddenly get worse, thus providing a way to differentiate
wheels with a high probability of failure from high impact wheels. In general, high
impact wheels appear to degrade in a gradual manner, as seen in Figure 6.

14
From Figure 6 it is seen that wheels generally have an up-down-up impact trend,
which is caused by the train’s loaded/empty cycle for moving cargo. This means that
when a train is carrying cargo the impact is higher than when the train is empty, hence the
up-down-up impact trend. When a defect in a wheel starts to grow, the authors found that
the impacts will increase regardless of whether or not a train is carrying cargo. These
defect growth trends can be seen in Figures 7 and 8, when consecutive impacts increase
rather than following the up-down-up trend.
Figure 6 High impact wheels generally increase impact readings slowly over time.
5.1 First Structural Health Monitoring Trend
The first trend developed is designed to capture wheels that were running at a
high dynamic impact but increased greatly over a short period of time. This trend
differentiates wheels with a high probability of failure from high impact wheels since
0
10
20
30
40
50
60
70
4/2
0/2
003
6/9
/2003
7/2
9/2
003
9/1
7/2
003
11/6
/2003
12/2
6/2
003
2/1
4/2
004
4/4
/2004
5/2
4/2
004
Time
Dyn
am
ic (
kip
s)
High Impact Wheel Dynamic
Mate Wheel Dynamic
15
high impact wheels’ impacts increase slowly over time. Generally all of the wheels
caught by the first trend have peak impacts greater than 90,000 pounds so they are
already condemnable by AAR standards.
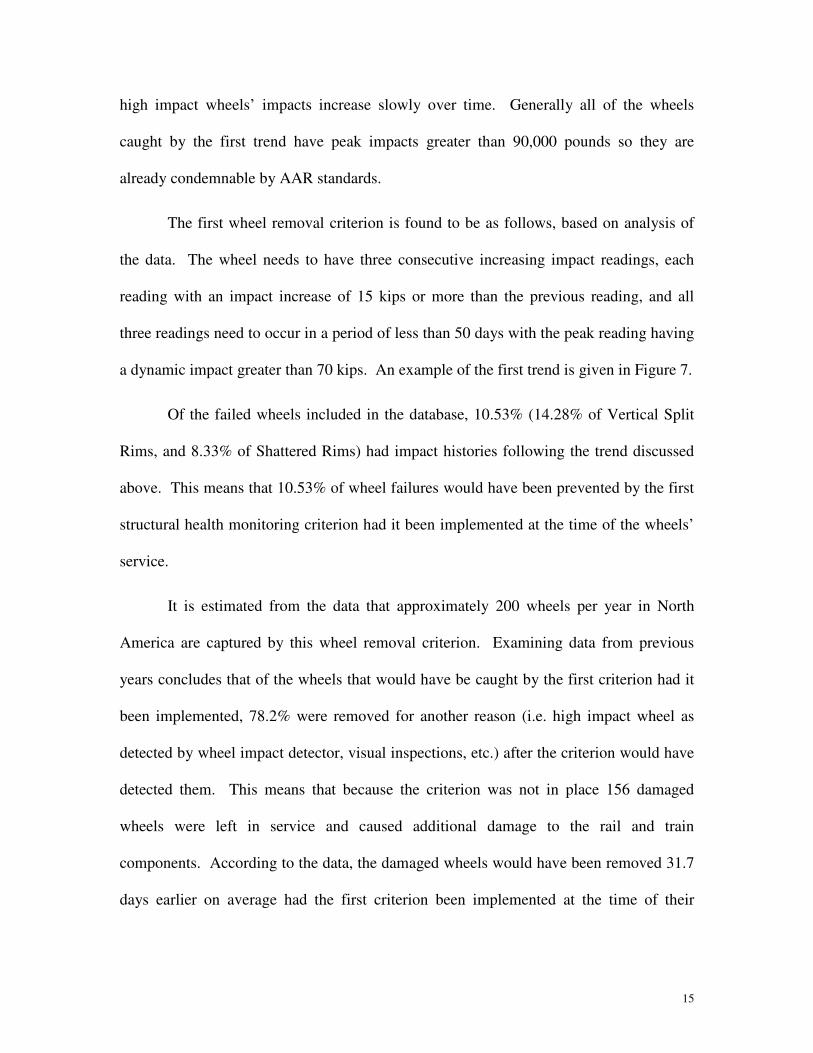
The first wheel removal criterion is found to be as follows, based on analysis of
the data. The wheel needs to have three consecutive increasing impact readings, each
reading with an impact increase of 15 kips or more than the previous reading, and all
three readings need to occur in a period of less than 50 days with the peak reading having
a dynamic impact greater than 70 kips. An example of the first trend is given in Figure 7.
Of the failed wheels included in the database, 10.53% (14.28% of Vertical Split
Rims, and 8.33% of Shattered Rims) had impact histories following the trend discussed
above. This means that 10.53% of wheel failures would have been prevented by the first
structural health monitoring criterion had it been implemented at the time of the wheels’
service.
It is estimated from the data that approximately 200 wheels per year in North
America are captured by this wheel removal criterion. Examining data from previous
years concludes that of the wheels that would have be caught by the first criterion had it
been implemented, 78.2% were removed for another reason (i.e. high impact wheel as
detected by wheel impact detector, visual inspections, etc.) after the criterion would have
detected them. This means that because the criterion was not in place 156 damaged
wheels were left in service and caused additional damage to the rail and train
components. According to the data, the damaged wheels would have been removed 31.7
days earlier on average had the first criterion been implemented at the time of their

16
operation, which in effect would prevent 31.7 days of additional damage from those
individual wheels.
Implementing this criterion would increase the number of removed wheels by
approximately only 44 wheels/year; this equals the 200 wheels/year that are detected by
the criterion minus the 156 wheels/year that would be removed regardless of whether the
criterion was in place or not.
Figure 7 An example of the first trend showing rapid increase in impact readings.
The number of shattered rims has been estimated to be around 700 wheels per
year in North America12; implementing the proposed criterion would prevent 8.33% of
those. This means approximately 58 shattered rim failures per year will be prevented by
increasing the number of wheels removed per year by only 44 wheels. As discussed
above, actually the trend detects approximately 200 wheels/year, approximately 58 of
0
10
20
30
40
50
60
70
80
90
100
110
3/1
2/2
00
3
4/1
2/2
00
3
5/1
2/2
00
3
6/1
2/2
00
3
7/1
2/2
00
3
8/1
2/2
00
3
9/1
2/2
00
3
10
/12
/20
03
11
/12
/20
03
12
/12
/20
03
1/1
2/2
00
4
2/1
2/2
00
4
3/1
2/2
00
4
4/1
2/2
00
4
5/1
2/2
00
4
Time
Dy
na
mic
(k
ips
)
Failed Wheel Dynamic
Mate Wheel Dynamic
17
which are shattered rims, but because some of the shattered rims wouldn’t have been
detected until after they failed the proposed criterion actually prevents more shattered
rims than additional wheels it would require to be removed. It is important to note that
included in the 200 wheels detected by the trend each year are a significant number of
vertical split rim failures that will also be prevented.
The average cost of a wheelset (including new and refurbished wheelsets) is
approximately $830. Therefore, the additional 44 wheelsets that would be removed by
this tread would cost North American railroads approximately $36,520. Considering the
damage these failed wheels cause to the rail and train components, and their high
probability of causing derailments, implementing this trend would be financially
beneficial and at the same time increase the safety of the railroad.
5.2 Second Structural Health Monitoring Trend The second trend is developed to capture wheels that are running in a normal
impact reading range, and suddenly increase in a very short period of time. Wheels
following the second trend have a dynamic impact history that looks nothing like the
dynamic impact history of a high impact wheel.
The second criterion for wheel removal is found to be as follows, based on
analysis of the data. The wheel needs to have three consecutive increasing impact
readings, each reading with an impact increase of 2 kips or more than the previous
reading with an average increase of 10 kips or more for the three readings, and all three
readings need to occur in a period of less than or equal to 20 days with the peak reading
have a dynamic impact greater than 40 kips, no reading 30 days prior the initial impact

18
deviation reading can have an impact reading greater than 5 kips or less than 15 kips from
the initial deviation dynamic value. An example of the second trend is given in Figure 8.
Of the failed wheels included in the database, 5.26% (8.33% of Shattered Rims)
had impact histories following the trend discussed above. This means that 5.26% of
wheel failures would have been prevented by the second structural health monitoring
criterion had it been implemented at the time of the wheels’ service.
Figure 8 An example of the second trend showing sudden increase in impact readings.
It is estimated from the data that approximately 1400 wheels per year in North
America are captured by this wheel removal criterion. Examining data from previous
years concludes that of the wheels that would have be caught by the second criterion had
it been implemented, 47.5% were removed for another reason after the criterion would
have detected them. This means that because the criterion was not in place 665 damaged
0
10
20
30
40
50
3/1
5/2
003
4/1
5/2
003
5/1
5/2
003
6/1
5/2
003
7/1
5/2
003
8/1
5/2
003
9/1
5/2
003
10/1
5/2
003
11/1
5/2
003
12/1
5/2
003
Time
Dynam
ic (kip
s)
Failed Wheel Dynamic
Mate Wheel Dynamic

19
wheels were left in service and caused additional damage to the rail and train
components. According to the data, the damaged wheels would have been removed 66.6
days earlier on average had the second criterion been implemented at the time of their
operation, which in effect would prevent 66.6 days of additional damage from those
individual wheels. Implementing this criterion would increase the number of removed
wheels by approximately 735 wheels/year, thereby preventing damage from these wheels
to the train and rail components.
The average cost of a wheelset (including new and refurbished wheelsets) is
approximately $830, and the average cost of a derailment is approximately $340,000.
This means only two derailment preventions per year from the 1400 wheels following
this trend would cover the cost of the additional 735 removed wheelsets detected by this
criterion, and at the same time would increase the safety of the railroad. In addition,
when the additional damage to the rail and train that is prevented from this criterion is
included in the cost analysis it is clear that this structural health monitoring trend
provides a cost efficient criterion for removing wheels.
From the above discussions it is clear that both criteria are cost efficient methods
for removing wheels. Even so, when implementing the two criteria together the cost
efficiency is further increased; a very small percentage (0.57%) of the wheelsets are
identified by both criteria. The combined implementation of the two criteria will result in
approximately 775 removed wheelsets per year. This slight overlap in wheel detection
reduces the increase in removals by 4 wheelsets/year; making the two trends, when
implemented together, an even more cost efficient method for removing wheels.

20
6 Conclusion
Traditionally, wheels are removed based on drive-by visual inspection and the
90,000 pound high impact condemning limit. Unfortunately many damaged wheels are
not found with the drive-by inspection method, while many useable wheels are removed
when they could remain in service. The structural health monitoring trends developed in
this paper provide a quantitative decision method based on the wheel impact data which
indicates the actual condition of the wheels. Therefore the trends indicate the critical
wheels that actually need to be removed, while at the same time allowing wheels that
aren’t in critical condition to remain in service.
The two wheel removal criteria proposed in this paper will remove 15.8%
(16.67% of Shattered Rims, and 14.28% of Vertical Split Rims) of wheels with a high
probability of failing by indicating that the wheels are about to fail before they actually
fail. The two criteria will increase the number of wheels removed, for the accumulation
of railroads in North America, by approximately 775 wheelsets/year. Considering the
damage these failed wheels cause to the rail and train components, and their high
probability of causing derailments, implementing these criteria would be financially
beneficial while at the same time increase the safety of the railroad.
7 Acknowledgments
The research reported in this paper was supported by funds from Union Pacific
Railroad and Meridian Railroad (Research Agreement No. 18140, Monitors: Rex Beck
and Todd Snyder). The support is gratefully acknowledged.

21
References 1 Lee, M.L. and Chiu W.K. (2005). A comparative study on impact force prediction on a railway track-like structure. Structural Health Monitoring, Vol. 4, No. 4, 355-376. 2 Gustavson, R. (2000). Static and dynamic finite element analysis of concrete sleepers. Licentiate of Engineering Thesis, Chalmers University of Technology, Division of Concrete Structures, Göteborg. 3 Union Pacific’s Lab Database. 4 Tanaka, T., Kinoshita, K. and Nakayama, H. (1992). Effect of loading time on high cycle range impact fatigue strength and impact fatigue crack growth. JSME International
Journal, Series 1, 35(1), 108-116. 5 Cheng, Y., Chen, D. and Nogata, F. (1994). Fatigue behaviour of a rail steel under low and high loading rates. Fatigue and Fracture of Engineering Materials and Structures, 17(1), 113-118. 6 Association of American Railroads, 2005 Field Manual of the AAR Interchange Rules, Rule 41, AAR, Washington, DC. 7 S. Kalay and A. Tajaddini, “Condemning Wheels Due to Impact Loads: Preliminary Survey – Six Railroads Experience,” AAR Report R-754, February, 1990. 8 Barke D, Chiu WK. Structural Health Monitoring in the Railway Industry: A Review. Structural Health Monitoring 2005; 4(1):81-93. 9 Johansson, A. and Nielsen, J. (2001). Railway wheel out-of-roundness – Influence of wheel-rail contact forces and track response. 13
th International Wheelset Conference,
Rome. 10 Kalay, S., Tajaddini, A. and Stone, D.H. (1992). Detecting wheel tread surface anomalies. Rail Transportation – 1992 American Society of Mechanical Engineers, Rail Transportation Division (Publication) RTD, ASME, New York, NY, USA: 165-174. 11 Partington, W. (1993). Wheel impact load monitoring. Proceedings of the Institution of
Civil Engineers – Transport, 100(4): 243-245. 12 Lonsdale, C., Pilch, J. and Dedmon S. (2002). Stress effects of wheel impact loads. –unknown-. 13 Bladon, K. (2003). Barke, D.W. (ed.), Function of Wayside Wheel Impact Monitors, Adelaide, Australia. 14 Tournay, H.M. and Mulder, J.M., “The transition from the wear to the stress regime”, Wear, Vol.191, pp.107-112, 1996. 15 Stone, D.H. and Moyar G.J., “Wheel shelling and spalling – an interpretive review”, in Rail Transportation 1989, ASME, pp.19-31, 1989. 16 Marais, J.J, “Wheel failures on heavy haul freight wheels due to subsurface effects”, Proc 12
th International Wheelset Congress, Qingdao, China, pp. 306-314, 1998.
17 Mutton, P.J., Epp, C.J. and Dudek, J., “Rolling contact fatigue in railway wheels under high axle loads”, Wear, Vol. 144, pp. 139-152, 1991. 18 Giammarise, A. W., and Gilmore, R. S. “Wheel Quality: A North American Locomotive Builder’s Perspective”, GE Research & Development Center, CRD140, Sep, 2001. 19 Stone, D.H., Majumder, G. and Bowaj, V.S. (2002). Shattered rim wheel defects and the effect of lateral loads and brake heating on their growth. ASME International

22
Mechanical Engineering Congress & Exposition, Nov 17-22 2002, New Orleans, Louisiana: 1-4. 20 Ekberg, A., E. Kabo, and H. Andersson., “An engineering model for prediction of rolling contact fatigue of railway wheels”, Fatigue & Fracture of Engineering Materials
and Structures, Vol. 25, pp. 899-909, 2002. 21 Stone, D.H. (2000). Wheel shattered rims – and interpretive review. Wheels and Axles,
Cost Effective Engineering. ImechE Seminar Publication: 75-84. 22 Beretta, S., Roberti, A., Ghidini, A. and Donzella G. Deep shelling in railway wheels. Proceedings, 13th International Wheelset Congress, Rome, Sept 2001, Paper 23. 23 Stone, D.H., Kalay, S.F., and Lonsdale, C.P. Effect of wheel impact loading on shattered rims. Proceedings, 13th International Wheelset Congress, Rome, Sept 2001, Paper 2. 24 Berge, S., “Shattered Rim Fracture Research”, Proceedings of 2000 Brenco Rail Conference, LaQuinta, California, October 19-20, 2000. 25 Stone, D.H., and Geoffrey, E.D., “The Effect of Discontinuity Size on the Initiation of Shattered Rim Defects,” ASME Transportation Division- Vol. 19, pp. 7-14, ASME Spring 2000. 26 Gordon, J., and Perlman, A. B., “Estimation of Residual Stresses in Railroad Commuter Car Wheels Following Manufacture”, Proceedings, International Mechanical
Engineering Congress and Exhibition, ASME RTD Vol. 15, pp.13 – 18, 1998.