
Structural Evaluation and Life Cycle Assessment by Kyoung ...
196
i Structural Evaluation and Life Cycle Assessment of a Transparent Composite Facade System Using Biofiber Composites and Recyclable Polymers by Kyoung-Hee Kim A dissertation submitted in partial fulfillment of the requirements for the degree of Doctor of Philosophy (Architecture) in The University of Michigan 2009 Doctoral Committee: Professor Harry Giles, Co-Chair Professor Richard E. Robertson, Co-Chair Professor Jean D. Wineman Associate Professor Gregory A. Keoleian
Transcript of Structural Evaluation and Life Cycle Assessment by Kyoung ...

i i
Structural Evaluation and Life Cycle Assessment of a Transparent Composite Facade System
Using Biofiber Composites and Recyclable Polymers
by
Kyoung-Hee Kim
A dissertation submitted in partial fulfillment of the requirements for the degree of
Doctor of Philosophy (Architecture)
in The University of Michigan 2009
Doctoral Committee:
Professor Harry Giles, Co-Chair Professor Richard E. Robertson, Co-Chair Professor Jean D. Wineman Associate Professor Gregory A. Keoleian

© Kyoung-Hee Kim 2009
All Rights Reserved

ii
Dedication
This dissertation is dedicated to my mom,
Byung-Im Choi,
who has instilled in me academic passion and emotional strength.

iii
Acknowledgements
I would like to take this opportunity to express my thanks to everyone who
contributed directly and indirectly to my thesis. First and foremost, I would like to thank
my committee members, especially Professor Harry Giles for his support, patience, and
tremendous counsel as my academic advisor and for sharing his knowledge of the field
with me; Professor Richard Robertson for his constant guidance and critical
encouragement; Gregory Keoleian for his theoretical insight and constructive advice on
my research and Professor Jean Wineman for her steadfast support and infinite wisdom
throughout my graduate studies.
There are several individuals I wish to thank for helping me complete my doctoral
training: Dr. Jong Jin Kim for his powerful words of encouragement and advice about
research methodology; Mark Krecic and Gerald Weston who provided valuable technical
advice and physical assistance when constructing the testing platforms and testing
samples; Dr. Theodore Provder and Sarjak Amin at the Coatings Research Institute at
Eastern Michigan University, who lent their equipment and shared their technical
expertise; Julianna Lieu for her assistance with the metal work; Jeremy Freeman,
Stephanie Driver, Josh Bard, Steve Jelinek, and Erin Putalik at the architecture
department, Eric Heininger and Carrie Bayer at the department of Materials Science and
Engineering, Michelle Cho, Katie Kerfoot, Brandon Cox, John Stepowski, and
Shangchao Lin at the department of Mechanical Engineering, and Han Zhang, Thomas
DiCorcia, Sarah Ann Popp, and Mitsuyo Yamamoto at the School of Natural Resources
and Environment for their support and inspirational work with the 2006 EPA-P3 research;
Jong-Kuk Kim for his invaluable help with conducting final experiments.

iv
I am thankful to the architecture department at the University of Michigan to
provide me continuous financial support and teaching opportunity. I would also like to
thank the faculty, staff, and my colleagues at the architecture department for their advice,
assistance, and encouragement.
Finally, I would like to express my heartfelt gratitude to my beloved family: my
parents and parents-in-laws, who have supported me while I worked to accomplish my
goal, my husband, Yau Shun Hui, and our two sons, Anthony and Henry, who have
tolerated my absence and distraction for many years and who have given me joy and rest
when it was needed. Without you, I would not be here. Thank you.

v
TABLE OF CONTENTS
Dedication .......................................................................................................................... ii
Acknowledgements .......................................................................................................... iii
List of Figures................................................................................................................... ix
List of Tables ................................................................................................................... xii
List of Appendices.......................................................................................................... xiv
Abstract............................................................................................................................ xv
Chapter 1 ........................................................................................................................... 1
Introduction....................................................................................................................... 1
1.1 Background of the Study .......................................................................................... 1
1.2 Statement of the Problem.......................................................................................... 2
1.3 Research Objectives.................................................................................................. 4
1.4 Significance of the Research..................................................................................... 5
Chapter 2 ........................................................................................................................... 7
Literature Review ............................................................................................................. 7
2.1 Previous Studies on Composite Panel Systems for Building Applications .............. 8
2.2 Transparent Composite Façade System.................................................................. 11
2.2.1 Recyclable Polymers as Skin Materials............................................................ 12
2.2.2 Biofiber Composites as Core Materials............................................................ 21
2.1.3 Bio-Coatings ..................................................................................................... 27
2.2.3 Existing System Review................................................................................... 27
2.3 Structural Evaluation Framework........................................................................... 30
2.3.1 Strength and Stiffness ....................................................................................... 30

vi
2.3.2 Impact Performance.......................................................................................... 36
2.4 Environmental Performance Evaluation Framework ............................................. 40
2.4.1 Framework of the Life Cycle Assessment (LCA) ............................................ 40
2.4.2 LCA Application to a Building Window System............................................. 44
2.5 Conclusions............................................................................................................. 45
Chapter 3 ......................................................................................................................... 48
Structural Performance Evaluation of a TCFS ........................................................... 48
3.1 Structural Design of a TCFS................................................................................... 48
3.1.1 Strength and Deflection Requirements of a TCFS ........................................... 48
3.1.2 Design Load Verification ................................................................................. 49
3.1.3 Structural Properties of a TCFS........................................................................ 51
3.1.4 Bending Stress and Deflection Check of a TCFS Panel................................... 54
3.1.5 Structural Design Conclusions ......................................................................... 55
3.2 Installation of a New Testing Facility..................................................................... 56
3.2.1 Overview of Testing Facility Design................................................................ 56
3.2.2 Structural Analysis of Testing Frame ............................................................... 58
3.2.3 Fabrication of Testing Frame............................................................................ 62
3.2.4 Frame Installation Conclusions ........................................................................ 63
3.3 Static Performance.................................................................................................. 64
3.3.1 Static Testing Apparatus and Specimens.......................................................... 64
3.3.2 Static Testing Procedure ................................................................................... 66
3.3.3 Static Testing Result ......................................................................................... 67
3.3.4 Finite Element Analysis.................................................................................... 79
3.3.5 Static Performance Evaluation Conclusion ...................................................... 84
3.4 Impact Performance Evaluation.............................................................................. 85
3.4.1 Impact Testing Apparatus and Specimens........................................................ 85
3.4.2 Impact Testing Procedure ................................................................................. 87
3.4.3 Impact Testing Results ..................................................................................... 89
3.4.4 Impact Testing Conclusions ............................................................................. 98
3.5 Charpy Impact Performance ................................................................................... 99

vii
3.5.1 Charpy Impact Tester and Specimens .............................................................. 99
3.5.2 Charpy Impact Testing Procedure .................................................................. 101
3.5.3 Charpy Impact Testing Result ........................................................................ 101
3.5.4 Charpy Impact Testing Conclusion ................................................................ 102
3.6 Conclusions........................................................................................................... 103
Chapter 4 ....................................................................................................................... 105
Life Cycle Assessment (LCA) ...................................................................................... 105
4.1 Goal and Scope Definition.................................................................................... 105
4.1.1 Goal and Scope ............................................................................................... 105
4.1.2 System Boundaries ......................................................................................... 106
4.1.3 Functional Unit ............................................................................................... 107
4.1.4 Assumptions and Limitations ......................................................................... 110
4.2 Life Cycle Inventory (LCI)................................................................................... 113
4.2.1 Energy Inputs.................................................................................................. 114
4.2.3 Environmental Emissions ............................................................................... 120
4.3 Life Cycle Impact Assessment (LCIA) ................................................................ 121
4.4 Sensitivity Analysis .............................................................................................. 123
4.4.1 Pre-use Phase: Improved life expectancy ....................................................... 124
4.4.2 Post-Use Phase: Recycling as an Alternative to Incineration......................... 125
4.5 LCA Conclusions.................................................................................................. 127
Chapter 5 ....................................................................................................................... 132
Conclusions and Future Work..................................................................................... 132
5.1 Structural Conclusions.......................................................................................... 132
5.1.1 Problem Statement.......................................................................................... 132
5.1.2 Summary of Research Activities .................................................................... 132
5.1.2 Structure Conclusions and Recommendations ............................................... 134
5.1.4 Study Limitations and Future Work ............................................................... 137
5.2 LCA Conclusions.................................................................................................. 137
5.2.1 Problem Statement.......................................................................................... 137
viii
5.2.2 Summary of Research Activities .................................................................... 138
5.2.3 LCA Conclusions and Recommendation........................................................ 139
5.2.4 Study Limitations and Future Work ............................................................... 140
APPENDICES............................................................................................................... 142
BIBLIOGRAPHY......................................................................................................... 171

ix
List of Figures
Figure 1.2.1 Simplified Sectional View of TCFS.......................................................... 4
Figure 1.3.1 Overview of Research Areas..................................................................... 6
Figure 2.1.1 Composite Construction of Spacecraft (a) ................................................ 9
Figure 2.2.1.1 Impact Resistance of PC, PMMA, and Glass.......................................... 14
Figure 2.2.1.2 Creep Modulus of SAN at Various Time and Stress Levels................... 15
Figure 2.2.1.3 Yellowness Index (a) and Haze of PC and PMMA................................. 16
Figure 2.2.2.1 Overview of Biofiber Composite Material Components ........................ 22
Figure 2.2.2.2 E-modulus Comparison of Biofiber Composites .................................... 23
Figure 2.2.2.3 Discoloration of Jute Composites after Outdoor Exposure..................... 24
Figure 2.2.2.4 Pictorial Ratings of Microbial Degradation: ........................................... 26
Figure 2.2.3.1 ClearShade IGU Assembly and Application in Mexico City.................. 28
Figure 2.2.3.2 ClearShade IGU Energy Performance Values ........................................ 29
Figure 2.2.3.3 Louvers-Integrated IGU: Summer (left) and Winter (right) ................... 30
Figure 2.3.1.1 Transformed Section for Equivalent Moment......................................... 32
Figure 2.3.1.1 An Effective Thickness Calculation Diagram......................................... 36
Figure 2.3.2.1 Shot Bag Impactor for Simulating Human Body Impacts ...................... 37
Figure 2.3.2.2 Shot-Bag Impact Modes.......................................................................... 38
Figure 2.3.2.3 Human Engineering Data ........................................................................ 38
Figure 2.3.2.4 Charpy Impact Machine and Specimen Set-Up ...................................... 39
Figure 2.3.2.5 Fracture Patterns of Laminated Glass (a) and Tempered Glass (b) ........ 40
Figure 2.4.1.1 LCA Procedure in accordance with ISO 14040 ...................................... 41
Figure 2.4.1.3 System Boundary Example of an LCA for a Plastic Sheet ..................... 42
Figure 2.4.1.3 Flow Diagram of Life Cycle Inventory Analysis .................................... 43
Figure 3.1.2.1 An Office Building Enclosed with TCFSs Located in Detroit, MI......... 50
Figure 3.1.2.2 Varying Wind Loads across the Building Façade ................................... 51
x
Figure 3.1.3.1 Transformed Section Using the E-modulus of PMMA........................... 52
Figure 3.1.3.2 Plan (a) and Section (b) Details of a TCFS ............................................. 53
Figure 3.2.1.1 Overview of Testing Frames ................................................................... 57
Figure 3.2.2.1 Sectional Properties of Testing Frames................................................... 59
Figure 3.2.2.2 Impact Load (34 kN) Set-Up in STAAD.Pro.......................................... 60
Figure 3.2.2.3 Bending Moment Diagram Under Impact Load...................................... 61
Figure 3.2.2.4 Axial Fore Diagram Under Impact Load ................................................ 61
Figure 3.2.2.5 Displacement Diagram Under Impact Load............................................ 62
Figure 3.2.3.1 Fabrication Process of Testing Frames ................................................... 63
Figure 3.3.1.1 Static Test Set-Up.................................................................................... 64
Figure 3.3.1.2 Installation Position of Loading Jack and Displacement Gauges ........... 65
Figure 3.3.1.3 Two-edge (a) and Four-edge (b) Supported Conditions ......................... 65
Figure 3.3.2.1 TCFS (a) and Laminated Glass (b) Test Set-Up ..................................... 66
Figure 3.3.3.1 Bending Stresses Comparison of a TCFS ............................................... 68
Figure 3.3.3.2 Radius of Curvature (ρ) and Displacement (δ)........................................ 69
Figure 3.3.3.3 Displacement Comparison of a TCFS..................................................... 70
Figure 3.3.3.4 Bending Stress Comparison of Laminated Glass .................................... 71
Figure 3.3.3.5 Displacement Comparison of Laminated Glass ...................................... 72
Figure 3.3.3.6 Bending Stress Comparison of Fully Tempered Glass ........................... 73
Figure 3.3.3.7 Displacement Comparison of Fully Tempered Glass.............................. 74
Figure 3.3.3.8 Structural Properties of TCFS that Affects Bending Stiffnesss .............. 76
Figure 3.3.3.9 Bending Stress Comparisons of a TCFS ................................................. 77
Figure 3.3.3.10 Displacement Comparisons of a TCFS ................................................... 78
Figure 3.3.4.1 Model Set-Up in STAAD.Pro ................................................................. 80
Figure 3.3.4.2 STAAD.Pro Results of a Two-Edge Supported TCFS ........................... 81
Figure 3.3.4.3 STAAD.Pro Results of a Four-Edge Supported TCFS ........................... 82
Figure 3.4.1.1 Overview of Impact Test Frames (a) and Drop Height (b) ..................... 86
Figure 3.4.1.2 Overview of Impact Test Instrumentation............................................... 87
Figure 3.4.2.1 Impact Test Set-Up: Fully Tempered Glass (a) and TCFS (b)................ 88
Figure 3.4.3.1 Breakage Modes of Laminated Glass...................................................... 90
Figure 3.4.3.2 Displacement (a) and Strain (b) Output of Laminated Glass .................. 91

xi
Figure 3.4.3.3 Breakage Modes of Fully Tempered Glass ............................................. 92
Figure 3.4.3.4 Displacement and Strain Outputs of Fully Tempered Glass ................... 93
Figure 3.4.3.5 Fracture Patterns (a) of PMMA Skin at 457 mm Drop Height ............... 95
Figure 3.4.3.6 Post Breakage Modes of TCFS at 457 mm Drop Height ........................ 96
Figure 3.4.3.7 Displacement (a) and Strain (b) Output of TCFS.................................... 97
Figure 3.4.3.8 Displacement Comparisons between Glass and TCFS ........................... 98
Figure 3.5.1.1 Charpy Impact Tester (a) and Specimen Set-Up Plan View (b) ........... 100
Figure 3.5.2.1 Broken PMMA After Calibrating the Charpy Impact Tester................ 101
Figure 3.5.3.1 Charpy Impact Strength as a Fuction of Time ...................................... 102
Figure 4.1.2.1 Overview of the System Boundaries of the LCA.................................. 107
Figure 4.1.3.1 Functional Unit (FU) of TCFS and GCWS........................................... 108
Figure 4.1.3.2 Material Mass Per TCFS and GCWS.................................................... 109
Figure 4.1.3.3 Material Mass Input Composition Per Functional Unit ........................ 110
Figure 4.1.4.1 Travelling Distance Between Builidng Site and Suppliers ................... 111
Figure 4.2.1.1 Embodied Energy Distributions of TCFS and GCWS Per FU ............. 114
Figure 4.2.1.2 An Office Building Set-Up in eQUEST................................................ 116
Figure 4.2.1.3 Use Phase Energy of TCFS and GCWS Per FU ................................... 118
Figure 4.2.1.4 Total Life Cycle Energy Input of TCFS and GCWS Per FU................ 120
Figure 4.2.3.1 CO2 Emissions of TCFS and GCWS Per FU ....................................... 121
Figure 4.3.1 Global Warming Potential of TCFS and GCWS Per FU ...................... 122
Figure 4.4.1.1 Sensitivity Analysis Results for Pre-Use Phase .................................... 125
Figure 4.4.2.1 Sensitivity Analysis Results for Post-Use Phase................................... 126
Figure 4.5.1 LCA and Sensitivity Analysis Comparisons ......................................... 130

xii xii
List of Tables
Table 2.2.1.1 Material Density of PC, PMMA, and Glass ............................................. 13
Table 2.2.1.2 E-modulus of PC, PMMA, and Glass based on Tensile Test ................... 13
Table 2.2.1.3 Coefficient of Thermal Expansion of PC, PMMA, and Glass ................. 17
Table 2.2.1.5 Water Absorption of PC, PMMA, and Glass ........................................... 18
Table 2.2.1.6 Flammability of PC, PMMA, and Glass................................................... 18
Table 2.2.1.7 U-factor of PC, PMMA, and Glass........................................................... 19
Table 2.2.1.8 SHGC of PC, PMMA, and Glass.............................................................. 20
Table 2.2.1.9 VLT of PC, PMMA, and Glass ................................................................ 20
Table 2.2.1.10 Embodied Energy of PC, PMMA, and Glass ........................................... 21
Table 2.2.2.1 Mechanical Properties of Biofiber Composites .................................... 23
Table 2.2.2.2 Weathering of Biofiber Composites ......................................................... 24
Table 2.2.2.3 Water Absorption of Different Biofiber composites ................................ 25
Table 2.3.1.1 Tabulated Values for Four-Edge Supported Plates .................................. 34
Table 2.3.1.2 Formulas for Four-Edge Supported Plates ............................................... 35
Table 3.1.3.1 Sectional Properties of a TCFS Panel....................................................... 52
Table 3.1.4.1 Material Properties of TCFS Components ............................................... 54
Table 3.1.4.2 Summary of Stress and Deflection of a TCFS.......................................... 55
Table 3.3.3.1 Bending Stress Comparison of a TCFS .................................................... 68
Table 3.3.3.2 Displacement Comparison of a TCFS ...................................................... 69
Table 3.3.3.3 Bending Stress Comparison of Laminated Glass ..................................... 71
Table 3.3.3.4 Displacement Comparison of Laminated Glass ....................................... 72
Table 3.3.3.5 Bending Stress Comparison of Fully Tempered Glass............................. 73
Table 3.3.3.6 Displacement Comparison of Fully Tempered Glass............................... 74
Table 3.3.3.7 Bending Stress Comparisons of a TCFS .................................................. 77
Table 3.3.3.8 Displacement Comparisons of a TCFS.................................................... 78

xiii
Table 3.3.4.1 Material Properties of PMMA Skin and Cardboard Core ........................ 80
Table 3.3.4.2 Stress and Displacement Comparisons..................................................... 81
Table 3.3.4.3 Stress and Displacement Comparisons..................................................... 83
Table 3.5.3.1 Measured and Charpy Impact Strength of PMMA................................. 102
Table 4.1.3.1 Functional Unit (FU) of TCFS and GCWS for Baseline LCA............... 107
Table 4.1.3.2 Material Inputs of TCFS and GCWS Per Functional Unit (FU) ............ 109
Table 4.1.4.1 Major Assumptions and Limitations of the LCA study.......................... 112
Table 4.2.1 Life Cycle Inventory Data for Energy Inputs and GHG Emissions ....... 113
Table 4.2.1.1 Pre-Use Phase Energy of TCFS and GCWS per FU .............................. 115
Table 4.2.1.2 Office Building Information for eQUEST Simulation ........................... 116
Table 4.2.1.3 Site Energy Consumed by End Uses of TCFS and GCWS Per FU........ 117
Table 4.2.1.4 Primary Energy Conumption of TCFS and GCWS Per FU ................... 118
Table 4.2.1.5 Post-Use Energy Consumption of TCFS and GCWS per FU ................ 119
Table 4.2.1.6 Total Life Cycle Energy Input of TCFS and GCWS Per FU ................. 119
Table 4.2.3.1 Pollutant Emissions of TCFS and GCWS Per FU.................................. 121
Table 4.3.1 Global Warming Potential for 100-Year Time Horizon......................... 121
Table 4.3.2 Global Warming Potential of TCFS and GCWS Per FU ....................... 123
Table 4.4.1 Key Factors for Sensitivity Analysis ...................................................... 123
Table 4.4.1.1 Sensitivity Analysis Results for Pre-Use Phase...................................... 124
Table 4.4.2.1 Sensitivity Analysis Results for Post-Use Phase .................................... 126
Table 4.5.1 LCA and Sensitivity Analysis Comparisions ......................................... 129
Table 4.5.2 Summarized Comparisions of LCA and Sensitivity Analysis................ 131

xiv xiv
List of Appendices
Appendix A Material Properties ................................................................................... 143
Appendix B Characteristics of Polymers and Glass ..................................................... 144
Appendix C Biofiber Composites vs. Synthetic Fiber Composites.............................. 145
Appendix D Wind Load Calculation in accordance with ASCE 7-02 ......................... 146
Appendix E Joint Shear Testing ................................................................................... 148
Appendix F LRFD for Testing Frame Members ......................................................... 150
Appendix G Charpy Impact Testing Report Provided By Bodycote Testing Group ... 154
Appendix H Energy Use and Environmental Emission Inventory Data ...................... 163
Appendix I Energy Performance Value Verification Process ..................................... 166

xv
Abstract
Structural Evaluation and Life Cycle Assessment of a Transparent Composite Facade System
Using Biofiber Composites and Recyclable Polymers
By
Kyoung-Hee Kim
Co-Chairs: Harry Giles and Richard E. Robertson
A composite façade system concept was developed at the University of Michigan
by Professor Harry Giles that considered the use of various transparent and composite
materials in building construction. Particular aspects of this transparent composite façade
system (TCFS) were investigated in this dissertation and involved the use of recyclable
polymers and biofiber composites. This dissertation addresses research questions related
to structural and environmental performance of the transparent composite façade system
(TCFS) compared to a glass curtain wall system (GCWS). In order to better understand
the context for the TCFS and establish performance evaluation methods, an extensive
literature review was conducted focusing on material performance, structural

xvi
performance requirements, life cycle assessment (LCA) techniques, composite panel
principles, product surveys and building codes. Structural design criteria were established
for the TCFS with respect to the strength and stiffness requirements of the International
Building Code (IBC). A new testing frame was fabricated and installed at the
architectural department of the University of Michigan to conduct static and impact tests
in accordance with Safety Performance Specifications and Methods of Test (ANSI Z97.1).
Initial static tests were carried out to measure bending stiffness of TCFS specimens in
order to compare the results with theoretical predictions. Impact tests were also carried
out to examine whether TCFS specimens conformed to the safety glazing criteria
specified in ANSI Z97.1. In addition, a comparative LCA of a TCFS and a GCWS was
performed on each system to assess their respective environmental implications.
Structural testing results indicated that the bending stiffness according to simple
beam theory is in agreement with measured stiffness under two-edge supported
conditions. Impact tests demonstrated that TCFS specimens satisfy the Class B of the
safety glazing requirements of ANSI Z97.1. Comparative LCA results showed that the
total life cycle energy of the TCFS was estimated to be 93% of that of the uncoated
GCWS and the total emission of kg CO2 equivalent for the TCFS was determined as
89% of the uncoated GCWS. The impact associated with transportation and the end-of-
life management was estimated to be insignificant in this study.

1
Chapter 1
Introduction
1.1 Background of the Study
At present, the US has only 5% of the world’s population but is responsible for a
quarter of the total world energy consumption and CO2 emissions (EIA, 2007, p. 5-6).
Buildings in the residential and commercial sectors in the US consume 40% of total
energy, 72% of total electricity, and 40% of raw materials while generating 39% of the
US’s CO2 emissions (DOE, 2007, p. 5). 136 tons of construction and demolition (C and
D) waste were generated in the US in 1996 which accounted for more than 40% of total
municipal solid waste in US landfills (Franklin Associates Prairie Village, 1998, p. 2-11,
3-1, 3-10). Further, depending on building type and design life, energy consumption
associated with fabricating building materials vary from 10% for typical office buildings
(Scheuer, Keoleian, & Reppe, 2003) up to 40% for medium density housing over their
total life cycle (Thormark, 2006). Buildings are, therefore, prime candidates for reducing
energy and materials consumption, as well as lowering the environmental impact
associated with building material production, operation, and disposal. Possible
opportunities for improving the current situation include enhanced building energy
performance, on-site energy generation using renewable energy resources, sustainable
construction methods and waste management, and the use of recycled materials.
There is increasing interest in the application of new materials in contemporary
buildings in the pursuit of more creative forms and lightweight materials. Polymers,
which offer great potential applications for buildings, have been used in manufacturing
industries for some time. However, the long term durability of polymers in outdoor
applications still needs to be improved. With advances in polymer technology, new

2
applications are opening up where polymers are used in conjunction with various
reinforcements and coatings. TCFS were originally developed with the intention of
creating new possibilities for building enclosures and at the same time addressing
improvements in building use energy, recyclability and use of renewable sources as a
means by which to reduce the energy and landfill waste noted above. TCFS incorporate
recyclable polymers and biofiber composites made out of renewable fiber reinforcements,
as an alternative to conventional glazing systems for buildings. It is recognized that since
polymers are recyclable, and their thermal conductivity (0.2 W/m-K) is five times less
than that of glass (1 W/m-K), they offer great potential to be used in buildings to reduce
waste and energy use. This researcher investigated the performance of these new
materials in a typical TCFS application according to standard assessment methods and
compared its performance with that of a typical glass façade system.
1.2 Statement of the Problem
The building envelope as a mediator between dynamic external climates and static
indoor conditions is subjected to various factors depending on the region in which the
building is located, including heat, ultraviolet (UV) radiation, moisture, sound, wind, and
seismic situations. While the use of opaque walls primarily focuses on security, privacy,
and energy conservation, glazing walls provide daylighting, natural ventilation, and
visual transparency. Glass is the most commonly used material in glazing systems, and
various structural, thermal, acoustic, visual, and detailing issues have been continuously
challenged in order to achieve high performance buildings.
The structural attributes of glass material are of concern because of impact
resistance. Glass fails catastrophically when it is subjected to excessive bending stress,
thermal shock, or imposed strain (Institution of Structural Engineers (ISE), 1999, p. 22).
Further, when fully tempered glass is used in a glazing wall to provide higher strength,
the inclusion of nickel sulphide can cause spontaneous breakage long after installation
due to its slow growth within the glass over time (Loughran, 1999, p. 15). This continues
to be a problem unless the glass is subjected to a heat soaking process prior to installation.
The use of extra-large windows is still challenging due to handling and installation issues,

3
and requires more metal frames to hold the glass, adding more material and weight to the
building.
In addition to these structural challenges, the environmental impact of using a
glass façade system is of increasing concern. Glass windows are responsible for $40
billion in energy loss in US buildings annually (Selkowitch, 2008, p. 6). Various coating
such as low-e and reflective coatings, solar control films, surface treatment (frit), and/or
laminated glass with high performance interlayer are widely available to create energy
efficient windows. However, these methods are beginning to limit the benefit of winter
sun and daylight for buildings in cold climates, adding energy consumption during
heating seasons (Carmody, Selkowitz, Lee, Arasteh, & Willmert, 2004, p. 14). Certain
reflective coatings can cause glare for occupants of other buildings (Carmody, Selkowitz,
Lee, Arasteh, & Willmert, 2004, p. 88). Therefore, glazing systems need to be more
carefully considered for location, use, and solar orientation, the studies of which are not
addressed in this research.
Glazing systems are structurally and environmentally challenging, and therefore,
research on alternative glazing systems is essential to increase the knowledge base of
structural and energy performance of the building envelope. The research investigation
focused on studying the performance characteristics of recyclable polymers, which also
possess greater impact resistance compared to glass. A transparent composite façade
system (TCFS) incorporates a stiff layered panel system through composite interaction
between a core and skin configuration, similar to most composite honeycomb panel
systems used in lightweight construction. In this instance, a biofiber composites core is
bonded between two polymer skins, and offers ecological advantages due to its
renewability, recyclability, and biodegradability. The TCFS referred to here, uses a
transparent recyclable polymer skin and opaque biofiber composites core, and was
investigated for its structural integrity and environmental impact. Figure 1.2.1 illustrates a
simplified sectional view of a TCFS showing heat transfer characteristics depending on
the sun’s position.

4
Figure 1.2.1 Simplified Sectional View of TCFS
1.3 Research Objectives
The primary objectives of this research are to explore the influence of recyclable
polymer and biofiber composites material properties on the performance of TCFS and to
establish a simple structural design procedure for building applications. The structural
investigations also include static and impact load testing. Life Cycle Assessments (LCA)
are carried out on a TCFS and a glass curtain wall system (GCWS) to compare their
relative environmental impact
This study specifically addresses the following research questions:
1) Building Materials Investigation
a. How do polymers differ from glass with respect to their material properties?
What are the pros and cons of each?
b. What are the mechanical properties of polymers and biofiber composites?
2) Structural Design of Transparent Composite Façade System (TCFS)
a. What are the structural principles of a composite panel system?
b. What are the structural design criteria and design procedures for a TCFS?
3) Structural Performance Evaluation of TCFS
0 °F
75 °F
Biofiber composites core
70 °F
Recyclable polymer skin
Recyclable polymer skin
90 °F
Summer Winter
Biofiber composites core
5
a. What is the stiffness of TCFS and are theoretical predictions consistent
with experimental results?
b. What is the impact behavior of a TCFS system?
4) Comparative Life Cycle Assessment (LCA)
a. What is the life cycle energy consumption and corresponding CO2
emissions of TCFS compared to GCWS?
b. To what extent does the prediction of product life influence the overall life
cycle assessment?
Figure 1.3.1 shows the outline of a research method and procedure to achieve the
discussed research objectives.
1.4 Significance of the Research
This research investigates some of the key performance characteristics of
emerging materials in buildings and carries out baseline comparisons with a typical glass
wall system towards assessing any advantages provided by an alternative polymer- and
biofiber composites-based glazing system. The primary assessment criteria for this
research are related to renewable, recyclable and biodegradable materials that will
contribute to reducing energy consumption, waste generation, and environmental
pollution. In particular, biofiber composites have the potential to contribute towards
greater agricultural diversity, as a non-crop based renewable material, through their
extensive use in future building products.
In addition, research on the structural and environmental attributes of TCFS will
enhance the knowledge base for building envelope and green building practice including
the use of lightweight sustainable materials. The LCA methodology used in this research
will also contribute towards a better understanding of how the LCA method can better
quantify the overall energy performance of a building envelope by considering the entire
life cycle.

6
Figure 1.3.1 Overview of Research Areas
Research Objectives
Mechanical properties Scratch resistance Water absorption Thermal expansion Weatherability Flammability Embodied energy
Structural Impact Thermal Moisture Environmental Existing product review
Evaluation of structural properties of TCFS in the areas of:
Strength Stiffness Impact resistance Charpy impact resistance
And comparison with the performance of a GCWS
LCA of a TCFS: Life cycle inventory (LCI) Life cycle impact assessment
(LCIA) Life cycle result interpretation
And comparison with the performance of a GCWS
Experimental/Analytical Methods Analytical Method
Research Method: Experimental/Analytical Methods
Building Material Performance Building Façade Performance Sustainability
Literature Review
Strength Stiffness Flexural behavior Impact resistance
Embodied energy Energy consumption Environmental impacts
Structural Performance Sustainability
Results and Discussion
Conclusions
Life cycle assessment
(LCA) technique LCA application to a
glazing system
7
Chapter 2
Literature Review
Glass has been used as a load bearing material in building façades since the mid-
20th century (ISE, 1999, p. 145). As the popularity of a glass façade in buildings
continues to rise (Sutherland, 2008, p. 122), the structural safety and the environmental
performance of a glass façade system increase in importance. Two major structural
challenges of a glass façade system are its low impact resistance and brittleness, while
heat loss and gain through a glass wall is another challenge from an environmental
perspective.
In the past, the opaque parts of a building—such as the walls and roofing
members—were made of composite panel construction. These panels composed of
various skin and core materials are favored in the architecture industry due to their
beneficial structural and thermal properties (Hough, 1980; Chong & Hartsock, 1993;
Pokharel & Mahendran, 2003; Boni, Franscino, & Almeida, 2003). Many studies have
been focused on investigating the structural behaviors of composite panels under static
and dynamic loads using analytical, numerical, and experimental methods. The extensive
research conducted on opaque composite panels is beneficial to the research of a
transparent composite façade system (TCFS) because it helps understanding inherent
structural and thermal potentials of a TCFS and similar research methodologies can be
employed to measure the performance metrics of a TCFS.
A less stiff transparent polymer has been configured to a very stiff material by
sandwiching with a biofiber composites core, which formed a transparent composite
façade system (TCFS). A TCFS was designed as a stiffer, safer, energy-efficient and
lightweight alternative to glass for building façade applications. To measure whether
these goals were met, it is necessary to understand the performance of existing glass

8
systems. The three structural performance metrics that are examined in this research are
strength, stiffness and impact behavior. The sustainability metrics specifically focus on
energy consumption and CO2 emissions and are analytically investigated using the life
cycle assessment technique. The final two sections of this chapter establish a theoretical
framework to measure the aforementioned façade performance.
2.1 Previous Studies on Composite Panel Systems for Building Application
The first practical application of composite panels was for World War II aircrafts,
and later, these same types of panels were used on the Apollo spacecraft (Davis (Ed.),
2001, p. 1). The double sandwich shell in the Apollo spacecraft was primarily used for
weight reduction and strong and stiff construction (Davis (Ed.), 2001, p. 1). The shell of
the Apollo spacecraft, as shown in Figure 2.1.1, consisted of two layers of thin composite
panels that were connected by spacers. The outer layer was composed of a 0.038 mm
thick plastic honeycomb core sandwiched between two 0.021~0.51 mm thick steel facing
sheets. The construction of the inner layer was similar, except the skin was made of a thin
aluminum panel rather than a sheet of steel facing. Since the 1960s, composite panels
have been widely used in industrial and commercial buildings, with the first architectural
application in the Sainsbury Centre for Visual Arts in Norwich, UK, which was designed
by Foster Associates in 1977 (Davis (Ed.), 2001, p. 45). The size of each panel was 1.8 m
x 1.2 m and 55 mm thick, and all four sides of the panel were prefinished with extruded
frames in order to provide fixing mechanisms and a weatherproofing membrane against
an aluminum back-up carrier system (Brookes, 1990, p. 161).
Composite panels have been proven to offer a high strength- and stiffness-to-
weight ratio. Many researchers have studied the structural behaviors of composite panels
used for building applications. The majority of the research that has been conducted has
focused on defining simplified design equations or numerical simulation methods to
provide time efficient, accurate tools that were validated through experimental results.
The studies also have focused on the global and local buckling behaviors of a composite
panel system. For building applications, the skin material, which must be relatively
strong and durable, is often made of such products as a concrete panel, a piece of cold-
formed steel or sheet metal, medium density fiber board, or glass fiber reinforced gypsum

9
board. The core material in composite panels, which is relatively less strong and stiff than
the skin material, ranges in content from a low-density rigid foam core to corrugated
metal.
Figure 2.1.1 Composite Construction of Spacecraft (a) and Sainsbury Centre for Visual Art (b)
From “Lightweight Sandwich Construction,” by Davies (Ed.), 2001, p. 1 & 186. “Cladding of Buildings,” by Brookes, 1990, p. 161.
Hough (1980) investigated the structural attributes of a composite panel used for
floor and wall applications. The panels were made out of recycled metal cans that were
bonded to steel sheets with epoxy. He compared the theoretical deflections resulting from
both bending and shear stiffness by using the simple bending experiment and adjusting
the theoretical equations based on the experimental results. The study concluded that the
metal can composite panel provided greater span capability with a lower self-weight
compared to a typical floor system. Despite these favorable results, economic and
fabrication challenges arose due to the high cost of epoxy at the time of the study.
Gentle and Lacey (1990) studied the structural and insulating properties of a
composite panel designed as an emergency shelter application and which consisted of a
medium density board (MDF) skin and a core made of expanded polystyrene (PS) cups.
The expanded polystyrene cups were glued to the MDF skins with a PVA adhesive, and
then the cavity between the cups was injected with polyurethane (PU) foam. The simple
bending test conduced on the PU foam composite panel revealed that the 100 mm thick
composite panel provided a higher strength-to-weight ratio compared to a 38 mm thick
Aluminum split carrier system bolted to main steel truss structure
Neoprene gaskets double as rain-water channels
Captive bolt fixes panel back to carrier system
Polyurethane foam core
1800 x 1200 x 75 mm superplastic aluminum panel
(b) (a)
Steel faceplate thickness: 0.21-0.51 mmAluminum core thickness: 0.38 mm
Inner aluminum sandwich shell
Outer steel sandwich shell face thickness: 0.21-0.51 mm
Heat shield fusible plastic honeycomb
Honeycomb core

10
solid board. The thermal test showed that the panel’s thermal conductivity (0.15 W/m-K)
was comparable to a double brick wall with a PU foam-filled cavity. In order to enhance
the economical and ecological performance of the composite panel, the researchers
proposed future studies regarding the automated manufacturing process and methods to
reduce the amount of PU foam used.
Similarly, Chong and Hartsock (1993) used theoretical and experimental methods
to research the flexural behaviors of a composite panel made of cold-formed steel facings
with a rigid insulation core. The simplified design equations were validated through
experiments that could be used in the design and optimization phases of a corrugated
steel composite panel.
Pokharel and Mahendran (2003) examined the local buckling problems of steel
facings and the effects of a rigid foam core under axial loadings. The researchers
investigated a buckling coefficient which varied depending on the composite panel’s
width-to-thickness ratio and its material properties. The researchers proposed simplified
buckling formulae that were validated through the experimental results. Due to these
favorable results, the researchers recommended that the formulae be adopted during the
design stage of the load-bearing wall application.
Benayoune et al. (2006) examined the structural behaviors of precast concrete
sandwich panels (PCSP) under eccentric axial loads. A PCSP is composed of a concrete
panel facing joined with shear connectors, and the space surrounding the shear
connectors is infilled with insulated board. The researchers carried out experiments
focusing on the load bearing capacity of the PCSP by investigating load vs. displacement,
load vs. strain, cracking patterns on the concrete skin and other breaking modes. The
study concluded that the experimental results were in agreement with the finite element
method (FEM) analysis, thus recommending FEM as an efficient tool for use during the
design phase of a PCSP.
In addition to studies focusing on composite panels with rigid foam cores, a
number of researchers have studied composite panels with open cell cores. Open cell
geometric cores such as honeycomb, corrugated, truss type (pyramidal truss or tetrahedral
truss) and textile cellular type have been widely adopted in the aeronautics field due to
high strength- and stiffness-to-weight ratios and excellent energy absorption. The studies
11
on open cell core composite panels are highly academic, mostly dealing with FEM
validation through experiments. Except for the panels with a honeycomb core, those open
cell composite panels are not practical for building applications due to the complex
fabrication process.
Boni and Almeida (2003) utilized experimental and FEM methods to examine the
flexural behaviors of a panel made out of glass reinforced epoxy skins and a honeycomb
core. To carry out the FEM analyses, the researchers studied two methods of computer
simulation; one was to use 2D plate elements for both the facings and the honeycomb
core, and the other was to use 3D solid elements for the core and 2D elements for the
facing. The FEM simulations were compared with the experimental measurements, and
the results of both the FEM simulations using the 2D plate and 3D solid elements agreed
with the experimental measurements. For the global behavior assessment of a composite
panel, the researchers recommended the simplified FEM method using 2D elements
because it provides simpler computations and takes less time compared to the FEM
method using 3D elements.
Valdevit, Wei, Mercer, Zok, and Evans (2005) studied the buckling behaviors of a
steel composite panel and correlated the experimental measurements with the FEM
simulations under transverse and longitudinal loads. The composite panel was made out
of stainless steel facings welded to a corrugated core. The experimental results showed
agreement with the FEM analysis for the composite panel which behaved linear-
elastically without buckling both the steel facing and the core.
2.2 Transparent Composite Façade System
In the aerospace and automobile industries where weight reduction and a
streamlined design are the primary design criteria, polymers have become more widely
used than glass as a glazing material due to its ease of formability, lighter weight and
higher impact resistance (Katsamberis, Browall, Iacovangelo, Neumann & Morgner,
1997). Durability in buildings, however, is one of the major criteria for building material
selection, and glass has been the preferred transparent material for a building façade
despite its low impact resistance and brittleness. The advancement of polymer and
coating technologies has led to the development of a polymer that is significantly more

12
durable and scratch resistant, thus making it suitable for outdoor use for building façade
applications (Sheffield Plastics, 2008; Cyro Industries, 2001). As a result, a composite
construction consisting of a polymer skin and biofiber composite core—transparent
composite façade system (TCFS)—was configured to provide a stiffer, safer, energy
efficient and lightweight alterative to a glass façade system. This new glazing system
spurred studies that evaluated the material performance of polymer and biofiber
composites as a cladding material. The polymer skin has a sustainable characteristic due
to its recyclability, which can help to reduce the environmental impact associated with
raw material depletion and disposal. To further promote sustainable practices, a TCFS
panel’s core material consists of lightweight biofiber composites made of renewable and
recycled materials.
Recyclable polymers, a class of thermoplastics, were selected as a facing material
for the TCFS for their aforementioned benefits of being impact resistant, lightweight and
sustainable. Transparent polymers were reviewed with respect to their mechanical
properties, weatherability, thermal movement, scratch resistance, vapor permeability,
flammability, energy performance and embodied energy. The results of material
performance of polymers were then compared with those of glass. Biofiber composites
consisting of natural fibers and polyester resin were chosen for the core of the TCFS due
to their sustainability and aesthetic quality. The core materials were examined for their
mechanical properties, weatherability, water absorption, resistance to microbial attack,
and embodied energy. The aforementioned material characteristics of biofiber composites
were compared with glass reinforced composites. Bio-based coatings made out of
renewable resources were also briefly reviewed as a sustainable coating material used to
enhance the long-term durability of biofiber composites.
2.2.1 Recyclable Polymers as Skin Materials
Advancements in polymer and coating technology led to the development of an
outdoor use glazing grade that indicates suitable UV and scratch resistance. Four
potential recyclable polymers, commonly called thermoplastics, were reviewed for
building applications: polycarbonate (PC), polyethylene terephthalate (PET or nylon),
polymethylmethacrylate (PMMA, acrylic, or Plexiglas), and polypropylene (PP).

13
Appendix A summarizes each material’s mechanical properties, durability, energy
performance, and environmental attributes in comparison with glass. Mechanical
properties, which determine the strength and stiffness of materials, include E-modulus,
yield and ultimate strength and Poison’s ratio. Durability, which identifies a product’s
service life, includes weatherability, scratch resistance, and vapor permeability. Energy
performance, which contributes to determining a building’s energy consumption,
includes heat transmittance (U-factor), solar heat gain coefficient (SHGC), and visual
light transmittance (VLT). Environmental attributes are defined by the embodied energy
and recyclability of materials. Appendix B explains the advantages and disadvantages of
the four polymers used as glazing materials when compared to glass. The following
section explores PCs and PMMAs in greater detail in order to verify their material
performance compared to glass when used as a glazing application. Most of the data
gathered about material performance was based on published product data and scholarly
work.
(1) Mechanical Properties
A. Density: Density is determined by the mass of a material divided by its volume. As
shown in Table 2.2.1.1, the density of PC and PMMA is less than half the density of glass.
Table 2.2.1.1 Material Density of PC, PMMA, and Glass E-modulus g/cm3
PC (Makrolon GP) 1.19 PMMA (Acrylite FF) 1.19 Glass 2.44 – 2.5
From “Makrolon GP Product Data,” by Sheffield Plastics Inc., 2003, p. 1. “Physical Properties of Acrylite FF,” by Cyro Industries, 2001, p. 6. “Materials and Design,” by Ashby and Johnson, 2005, p. 228.
B. E-modulus: E-modulus (E) is the ratio of tensile stress to strain established in a uni-
axial tension test (i.e., E = σ/ε). Stress (σ) is the ratio of the applied load to the cross sectional
area of a specimen (σ = F/A) and strain (ε) is the ratio of the deformation to the original length of
a specimen (ε = ΔL/L). Table 2.2.1.2 shows that glass is approximately 25 times stiffer than
PMMA.
Table 2.2.1.2 E-modulus of PC, PMMA, and Glass based on Tensile Test E-modulus MPa
PC (Makrolon GP) 2344 PMMA (Acrylite FF) 2800 Glass 68000 - 72000
From “Makrolon GP Product Data,” by Sheffield Plastics Inc., 2003, p. 1. “Physical Properties of Acrylite FF,” by Cyro Industries, 2001, p. 6. “Materials and Design,” by Ashby and Johnson, 2005, p. 228.

14
C. Impact resistance: Impact resistance is the ability of a material to resist fracture
under an impact load. In accordance with ASTM D 4272 Standard Test Method for Total Energy
Impact of Plastic Films by Dart Drop, 6 mm thick PMMA can resist 9.5 N-m of impact energy,
and 6 mm thick tempered glass can resist 4.1 N-m. Because of its higher impact resistance and
lighter weight, PMMA windows are preferred over glass windows in the aircraft industry. Figure
2.2.1.1 compares the impact resistance between PC, PMMA, and glass.
Figure 2.2.1.1 Impact Resistance of PC, PMMA, and Glass From “Makrolon AR product data,” by Sheffield Plastics Inc., 2003, p. 2.
D. Tensile creep modulus: One disadvantage of using polymer materials is the
effect of long term creep deformation. Creep is the long-term deformation of a material
as a function of stress intensity and the duration of time that the material is subjected to a
given level of stress. The tensile creep modulus, which is measured in accordance with
ASTM D 2990 Standard Test Methods for Tensile, Compressive, and Flexural Creep and
Creep-Rupture of Plastics, is the ratio of applied tensile stress to total creep strain over a
given period of time. Typical published tensile creep modulus values for PC (extrusion
grade) and PMMA (extrusion grade) when subjected to 1000 hours of constant loading
are between 1430 MPa and 1580 MPa respectively. This results in a reduction of the E-
modulus to approximately 40%. However, it is important to note that building façade are
less susceptible to creep since the stress created by their self weight is relatively small for
a vertical façade application. Therefore, it is postulated that the creep modulus of
polymers in a façade application will likely be similar to that of the original tensile
modulus. Figure 2.2.1.2 shows an example of the creep characteristics for styrene
acrylonitrile (SAN) as a function of time and stress levels.
1 10 100 1000
1/4" thick tempered glass
1/4" thick PMMA
1/4" thick PC6mm thick PC
6mm thick PMMA
6mm thick tempered glass
1 10 100 1000Impact energy (N-m)

15
0
500
1000
1500
2000
2500
3000
3500
4000
0 1000 2000 3000 4000 5000
Cre
ep m
odul
us (
MP
a)
30MPa
34MPa
38MPa
42MPa
hr
Figure 2.2.1.2 Creep Modulus of SAN at Various Time and Stress Levels
From “ASTM D 2990 Standard Test Methods for Tensile, Compressive, and Flexural Creep and Creep-Rupture of Plastics,” by ASTM, 2001, p. 10.
(2) Weatherability
Polymers offer relatively low durability and weatherability under exposure to the
natural environment compared to glass (Schmauder, Nauenburg, Kruse & Ickes, 2006).
UV radiation, temperature, water, air contaminants and biological factors all play roles in
determining the durability and weatherability of plastics (Wypych (Ed.), 1999, p. 60). UV
radiation causes the deterioration of mechanical toughness and optical clarity −
Yellowness Index (YI) and % Haze (Wypych (Ed.), 1999, p. 60; Plastics Institutes of
America, 2001, p. 1356). In order to prevent UV degradation, UV-resistant additives and
fillers as well as UV-protective coatings and films are applied to plastic materials
(Margolis, 2006, p. 354; Plastics Institutes of America, 2001, p. 1355). The weathering
performance of an uncoated PMMA and a coated PC undergoes significantly less change
in color (YI) and optical properties (% Haze) after 10 years of UV exposure, as opposed
to uncoated plastics (Altuglas, 2001, p. 8; Hayes and Bonadies, 2007, p.25). ASTM D
1925 Standard Test Method for Yellowness Index of Plastics is used in the plastics
industry to measure discoloration levels under UV exposure. The yellowness becomes
visibly detectable when the YI is greater than YI-8 (Altuglas, 2005). The light-
transmitting properties of plastics are measured in accordance to ASTM D 1003 Haze
and Luminous Transmittance of Transparent Plastics, and materials with greater than
Stress increases
Postulated creep modulus under self weight of plastics
16
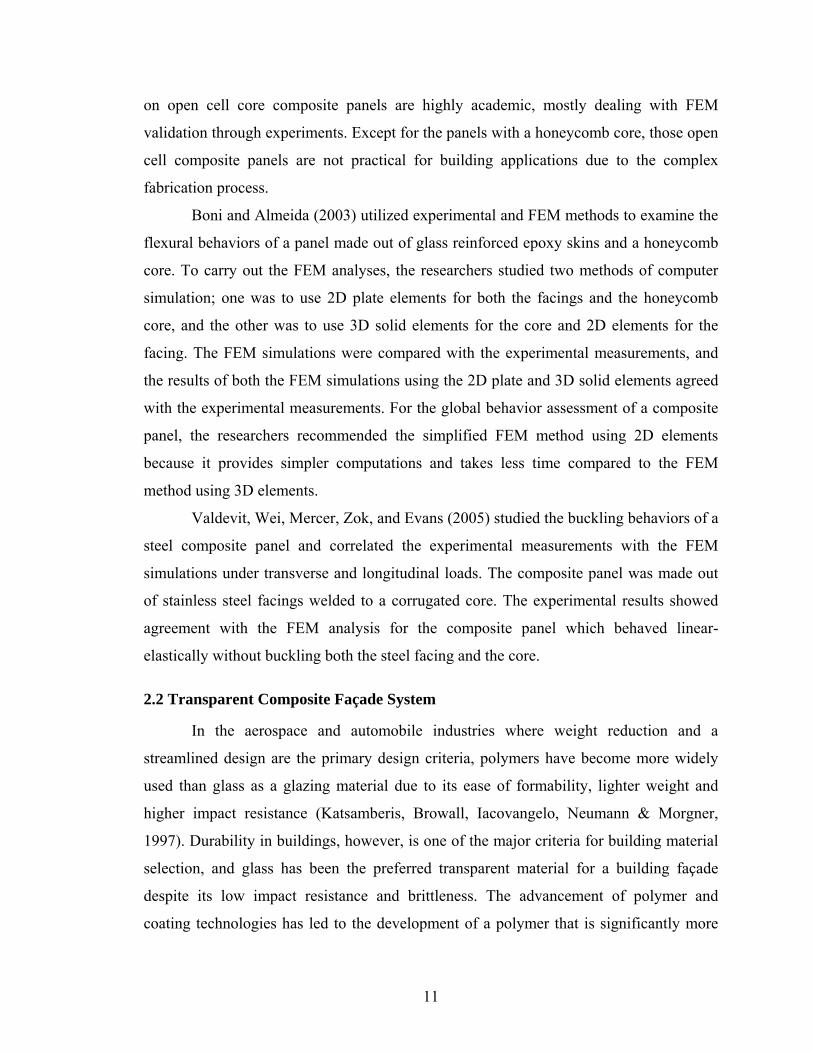
30% haze are considered diffusing materials (ASTM, 2007). Figure 2.2.1.3 demonstrates
that coated plastics provide greater light transmission over time compared to uncoated
PCs.
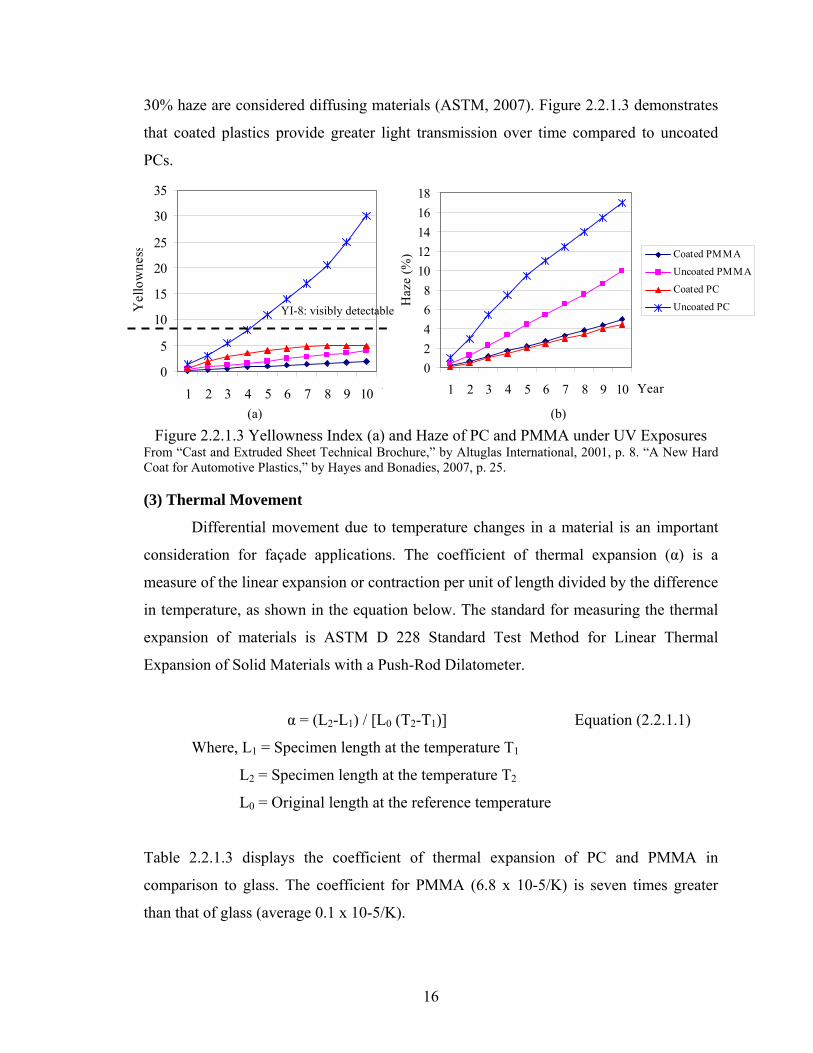
Figure 2.2.1.3 Yellowness Index (a) and Haze of PC and PMMA under UV Exposures From “Cast and Extruded Sheet Technical Brochure,” by Altuglas International, 2001, p. 8. “A New Hard Coat for Automotive Plastics,” by Hayes and Bonadies, 2007, p. 25. (3) Thermal Movement
Differential movement due to temperature changes in a material is an important
consideration for façade applications. The coefficient of thermal expansion (α) is a
measure of the linear expansion or contraction per unit of length divided by the difference
in temperature, as shown in the equation below. The standard for measuring the thermal
expansion of materials is ASTM D 228 Standard Test Method for Linear Thermal
Expansion of Solid Materials with a Push-Rod Dilatometer.
α = (L2-L1) / [L0 (T2-T1)] Equation (2.2.1.1)
Where, L1 = Specimen length at the temperature T1
L2 = Specimen length at the temperature T2
L0 = Original length at the reference temperature
Table 2.2.1.3 displays the coefficient of thermal expansion of PC and PMMA in
comparison to glass. The coefficient for PMMA (6.8 x 10⁻⁵/K) is seven times greater
than that of glass (average 0.1 x 10⁻⁵/K).
0
5
10
15
20
25
30
35
1 2 3 4 5 6 7 8 9 10 Y
Yel
low
ness
(a) (b)
0
2
4
6
8
10
12
14
16
18
1 2 3 4 5 6 7 8 9 10 YearH
aze
(%) Coated PMMA
Uncoated PMMA
Coated PC
Uncoated PCYI-8: visibly detectable
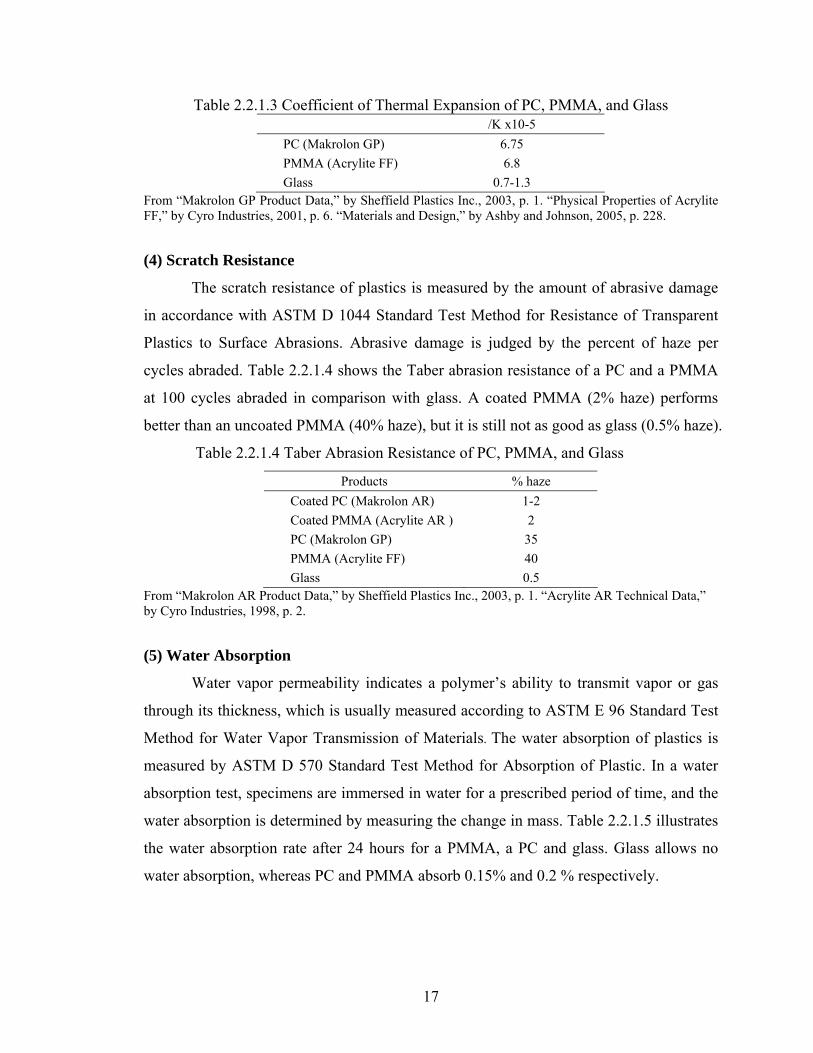
17
Table 2.2.1.3 Coefficient of Thermal Expansion of PC, PMMA, and Glass /K x10-5
PC (Makrolon GP) 6.75
PMMA (Acrylite FF) 6.8
Glass 0.7-1.3 From “Makrolon GP Product Data,” by Sheffield Plastics Inc., 2003, p. 1. “Physical Properties of Acrylite FF,” by Cyro Industries, 2001, p. 6. “Materials and Design,” by Ashby and Johnson, 2005, p. 228.
(4) Scratch Resistance
The scratch resistance of plastics is measured by the amount of abrasive damage
in accordance with ASTM D 1044 Standard Test Method for Resistance of Transparent
Plastics to Surface Abrasions. Abrasive damage is judged by the percent of haze per
cycles abraded. Table 2.2.1.4 shows the Taber abrasion resistance of a PC and a PMMA
at 100 cycles abraded in comparison with glass. A coated PMMA (2% haze) performs
better than an uncoated PMMA (40% haze), but it is still not as good as glass (0.5% haze).
Table 2.2.1.4 Taber Abrasion Resistance of PC, PMMA, and Glass
Products % haze
Coated PC (Makrolon AR) 1-2
Coated PMMA (Acrylite AR ) 2
PC (Makrolon GP) 35
PMMA (Acrylite FF) 40
Glass 0.5 From “Makrolon AR Product Data,” by Sheffield Plastics Inc., 2003, p. 1. “Acrylite AR Technical Data,” by Cyro Industries, 1998, p. 2.
(5) Water Absorption
Water vapor permeability indicates a polymer’s ability to transmit vapor or gas
through its thickness, which is usually measured according to ASTM E 96 Standard Test
Method for Water Vapor Transmission of Materials. The water absorption of plastics is
measured by ASTM D 570 Standard Test Method for Absorption of Plastic. In a water
absorption test, specimens are immersed in water for a prescribed period of time, and the
water absorption is determined by measuring the change in mass. Table 2.2.1.5 illustrates
the water absorption rate after 24 hours for a PMMA, a PC and glass. Glass allows no
water absorption, whereas PC and PMMA absorb 0.15% and 0.2 % respectively.

18
Table 2.2.1.5 Water Absorption of PC, PMMA, and Glass
Products Water absorption
(%) PC (Makrolon GP) 0.15
PMMA (Acrylite FF) 0.2
Glass 0 From “Makrolon GP Product Data,” by Sheffield Plastics Inc., 2003, p. 1. “Physical Properties of Acrylite FF,” by Cyro Industries, 2001, p. 6. “Materials and Design,” by Ashby and Johnson, 2005, p. 228.
(6) Flammability
For a glazing application, plastics are required to meet a self-ignition temperature
of 343ºC or greater when tested according to ASTM D 1929 Standard Test Method for
Determining Ignition Temperature of Plastics (IBC, 2003, p. 538). In addition, plastic
glazing must provide a smoke density rating of less than 75% according to ASTM D
2843 Standard Test Method for Density of Smoke from the Burning or Decomposition of
Plastics (IBC, 2003, p. 538). At the same time, plastic glazing must also conform to the
combustibility classification of either class CC1 or class CC2 when tested according to
ASTM D 635 Standard Test Method for Rate of Burning and/or Extent and Time of
Burning of Plastics in a Horizontal Position (IBC, 2003, p. 538). In order to be in class
CC1, plastics must limit the burning extent to 25 mm or less for the intended thickness to
be used, and in order to qualify for the CC2 classification, plastics must provide a
burning rate of 25 mm/min or less. Table 2.2.1.6 shows that, for the specific tests carried
out, PC, PMMA, and Glass all conform to the flammability requirements of the ASTM
codes. However, full compliance with the International Building Code (IBC) will need to
be checked on a case-by-case basis, depending on the location, application and fire rating
classification by occupancy group. The IBC further limits the installation of plastic
glazing to a maximum area of 50% of a building’s façade and with special provisions for
different applications which is beyond the scope of this review (IBC, 2003, p. 540).
Table 2.2.1.6 Flammability of PC, PMMA, and Glass
Thickness Self-Ignition Temp.
ASTM D 1929 Smoke Density Rating (%)
ASTM D 2843 Burning Rate ASTM D 635
PC (Makrolon GP) 6 mm 554 ºC 62.8% Class CC1 PMMA (Acrylite FF) 6 mm 455 ºC 6.4% Class CC2
Glass (Clear) 6 mm incombustible incombustible incombustible From “Wisconsin Building Products Evaluation,” by Wisconsin Department of Commerce, 2000, p. 4. “Physical Properties of Acrylite FF,” by Cyro Industries, 2001, p. 6. “Materials and Design,” by Ashby and Johnson, 2005, p. 228.

19
(7) Energy Performance (Heat Transmittance [U-factor], Solar Heat Gain
Coefficient [SGHC] and Visible Light Transmittance [VLT])
A building’s energy performance is related to the heat transmittance (U-factor),
solar heat gain coefficient (SHGC) and visible light transmittance (VLT) of a glazing
system. The thermal performance of a glazing system is attributable to the heat transfer
caused by temperature differences and the amount of solar energy that is able to penetrate
through the glazing. Generally, polymer materials have a better U-factor and a higher
SHGC and VLT compared to glass.
A. U-factor: Heat transmittance (U-factor) is the combined effect of heat transfer
consisting of conduction, convection, and radiation. Thermal conductivity (k) is a unique
material property that is measured by the amount of energy flowing through a unit area,
in unit time, where there is a unit temperature difference between the two sides of the
surface (W/m2-K). Convection coefficients, often referred to as air film coefficients, are
determined by the effects of temperatures and wind speeds on glazing surfaces. The
American Society of Heating, Refrigerating and Air-conditioning Engineers (ASHRAE)
defines an inside convection coefficient to be 1.35 W/m2-K based on a stagnant air
condition with an indoor temperature of 21 ºC and an outside convection coefficient of 26
W/m2-K based on an outside wind speed of 5.5 m/s with a temperature of -18 ºC. The
radiation effect is determined by indoor and outdoor temperatures and material emissivity.
The U-factor of PMMA (5.16 W/M2-K) is slightly better than that of glass (5.81 W/m2-
K). Table 2.2.1.7 summarizes the U-factor of PC, PMMA, and Glass with a thickness of
6 mm.
Table 2.2.1.7 U-factor of PC, PMMA, and Glass
Product Thickness
mm W/m2-K
PC (Lexan XL) 6 5.185
PMMA (Plexiglass) 6 5.167
Glass (clear) 6 5.818 From “Window (version 5.2) [Computer software],” by Lawrence Berkeley National Laboratory, 2001.

20
B. SHGC: The solar heat gain coefficient (SHGC) is the fraction of heat from the
sun that a window admits. It is expressed as a number between 0 and 1. The lower a
window’s SHGC, the less heat it transmits. SHGC combines transmitted, absorbed, and
reemitted solar energy. Equation 2.2.1.2 includes the directly transmitted portion τs and
the absorbed and reemitted portion Niαs.
SHGC = τs + Niαs (2.2.1.2)
Where, τs = the solar transmittance
Ni = the inward-flowing fraction of absorbed radiation
αs = the solar absorptance of a single-pane fenestration system
PMMA (SHGC-0.85) transmits slightly higher solar energy compared to glass (SHGC-
0.81). Table 2.2.1.8 shows the SHGC of a PC, a PMMA and clear glass with a thickness
of 6 mm.
Table 2.2.1.8 SHGC of PC, PMMA, and Glass
Product Thickness
mm SHGC
PC (Lexan) 6 0.813
PMMA (Plexiglas) 6 0.858
Glass (clear) 6 0.816 From “Window (version 5.2) [Computer software],” by Lawrence Berkeley National Laboratory, 2001.
C. VLT: Visible light transmittance (VLT) is a measure of the fraction of visible
light transmitted through a window. It is expressed as a number between 0 and 1. The
higher a window’s VLT, the more visible light it transmits. A PMMA transmits slightly
more visible light (92%) than clear glass (84%) due to its optical clarity. Table 2.2.1.9
compares the VLT of a PC, a PMMA and clear glass with a 6 mm thickness.
Table 2.2.1.9 VLT of PC, PMMA, and Glass
Product Thickness inch (mm)
% VLT
PC (Lexan) 6 81
PMMA (Plexiglas) 6 92
Glass (clear) 6 84 From “Window (version 5.2) [Computer software],” by Lawrence Berkeley National Laboratory, 2001.

21
(8) Embodied Energy
Embodied energy is a measure of the energy used to manufacture a product,
including raw material extraction, manufacturing, fabrication and transportation.
Typically, a 1 kg PMMA sheet consumes 135 MJ of embodied energy whereas 1 kg of
float glass consumes approximately 15 MJ (Huberman & Pearlmutter 2008; Yasantha
Abeysundraa, Babela, Gheewalab & Sharpa, 2007; Chen, Burnett & Chau, 2000;
SimaPro 7.1 database). PMMA and PC consume approximately nine times more
embodied energy compared to glass of the same weight. However, when the volumes are
the same for all three materials, PMMA and PC consume only about four times more
embodied energy than that of glass due to their lighter density. Table 2.2.1.10 compares
the embodied energy of these glazing materials.
Table 2.2.1.10 Embodied Energy of PC, PMMA, and Glass
Product Embodied energy
per unit weight Embodied energy per unit volume
PC (extrusion grade) 130 MJ/kg 156,000 MJ/m3
PMMA (extrusion grade) 135 MJ/kg 160,650 MJ/m3
Float glass 15 MJ/kg 38,400 MJ/m3 From “A Life Cycle Energy Analysis of Building Materials in the Negev Desert,” by Huberman and Pearlmutter, 2008. p. 842. “Environmental, Economic and Social Analysis of Materials for Doors and Windows in Sri Lanka,” by Abeysundra, Babela, Gheewalab & Sharpa, 2007, p. 2145. “Analysis of Embodied Energy Use in the Residential Building of Hong Kong,” by Chen, Burnett, and Chau, 2000, p. 328. “SimaPro (version 7.1) [computer software],” by Pre Consultants.
2.2.2 Biofiber Composites as Core Materials
Biofiber composites are composed of a synthetic or bio-based polymer matrix
reinforced with natural fibers (Mohanty, Misra, & Drzal [eds.], 2005, p. 4-5). Examples
of the natural fibers typically used are: bamboo, china reed, cotton lint, jute, kenaf, flax,
sisal, hemp and coir (Mohanty, Misra, & Drzal [eds.], 2005, p. 7). Synthetic polymers
include polypropylene, polyester and epoxy, whereas bio-based polymers include
cellulose plastic, starch-based polymer and polylactic acid (PLLA) (Mohanty, Misra, &
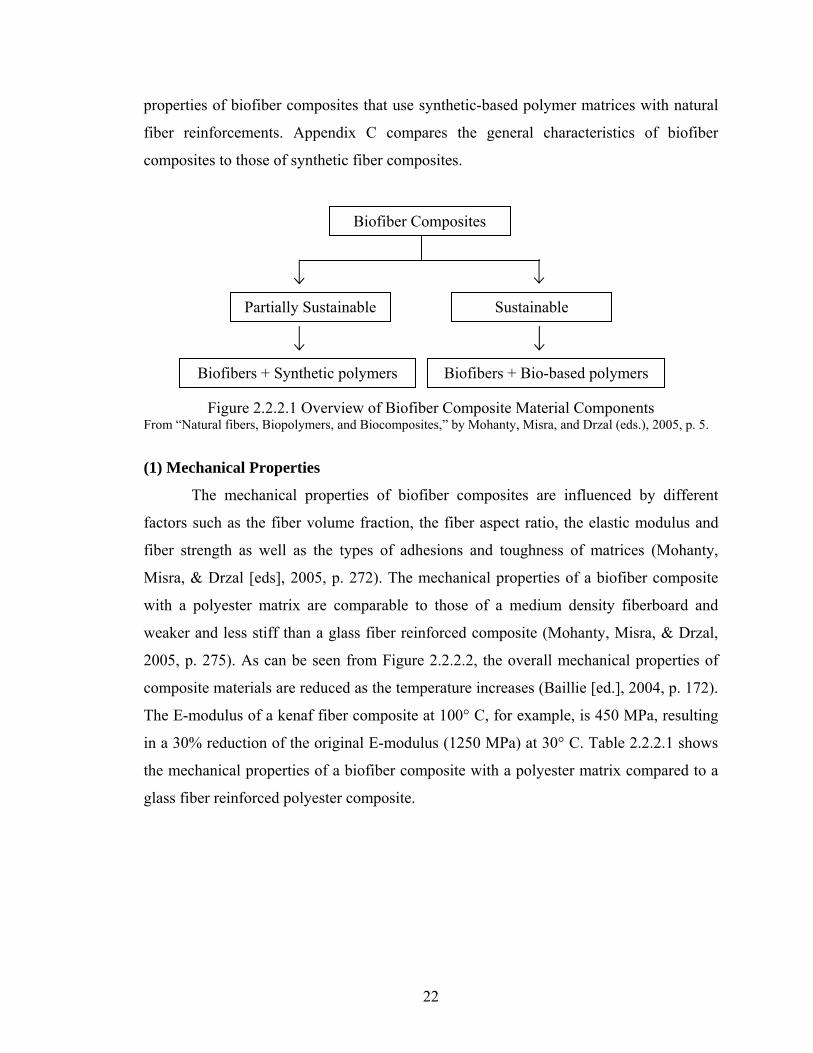
Drzal [eds.], 2005, p. 251-253). Figure 2.2.2.1 shows an overview of biofiber composites.
Studies showed that bio-based polymer composites are more susceptible to heat and
moisture compared to synthetic-based polymer composites, resulting in the degradation
of mechanical properties that are not suitable for long-term structural application (Ram,
1997 as cited in Ballie [ed.], 2004, p. 102). Therefore, this section focuses on the material
22
properties of biofiber composites that use synthetic-based polymer matrices with natural
fiber reinforcements. Appendix C compares the general characteristics of biofiber
composites to those of synthetic fiber composites.
Figure 2.2.2.1 Overview of Biofiber Composite Material Components From “Natural fibers, Biopolymers, and Biocomposites,” by Mohanty, Misra, and Drzal (eds.), 2005, p. 5.
(1) Mechanical Properties
The mechanical properties of biofiber composites are influenced by different
factors such as the fiber volume fraction, the fiber aspect ratio, the elastic modulus and
fiber strength as well as the types of adhesions and toughness of matrices (Mohanty,
Misra, & Drzal [eds], 2005, p. 272). The mechanical properties of a biofiber composite
with a polyester matrix are comparable to those of a medium density fiberboard and
weaker and less stiff than a glass fiber reinforced composite (Mohanty, Misra, & Drzal,
2005, p. 275). As can be seen from Figure 2.2.2.2, the overall mechanical properties of
composite materials are reduced as the temperature increases (Baillie [ed.], 2004, p. 172).
The E-modulus of a kenaf fiber composite at 100° C, for example, is 450 MPa, resulting
in a 30% reduction of the original E-modulus (1250 MPa) at 30° C. Table 2.2.2.1 shows
the mechanical properties of a biofiber composite with a polyester matrix compared to a
glass fiber reinforced polyester composite.
Biofiber Composites
Partially Sustainable Sustainable
Biofibers + Synthetic polymers Biofibers + Bio-based polymers

23
Table 2.2.2.1 Mechanical Properties of Biofiber Composites
Composites Density g/cm3
Tensile strength MPa
Flexural strength MPa
E-modulus MPa
Sisal + Polyester 1.051 40 77 2130
Jute + Polyester 1.218 66 94 4420
Coir + Polyester 1.412 41 41 1600
Glass fiber + Polyester 1.60 163 362 26000 From “Natural fibers, Biopolymers, and Biocomposites,” by Mohanty, Misra, and Drzal (eds.), 2005, p. 272 & 275.
Figure 2.2.2.2 E-modulus Comparison of Biofiber Composites and Glass Fiber Composites at Varying Temperatures
From “Green Composites,” by Caroline Baillie (ed.), 2004, p. 175.
(2) Weatherability
Weathering effects on biofiber composites exposed to outdoor environments
include discoloration, surface deterioration and reduction in strength (Mohanty, Misra, &
Drzal [eds.], 2005, p. 273). The exposed surface of the biofiber composite is subject to
color fading while the unexposed surface develops black spots with hyphae-like
structures (Mohanty, Misra, & Drzal [eds.], 2005, p. 273). The combined effects of
biofiber fibrillation and lignin degradation reduce the tensile and flexural strength by
50% (Mohanty, Misra, & Drzal [eds.], 2005, p. 273). Glass fiber composites, on the other
hand, undergo less change in color and strength compared to biofiber composites
(Mohanty, Misra, & Drzal [eds.], 2005, p. 273). Polyurethane-coating and/or UV-
stabilized resin can be applied to biofiber composites in order to minimize discoloration
and strength reduction (Mohanty, Misra, & Drzal [eds.], 2005, p. 273). Table 2.2.2.2
summarizes the weathering effects of biofiber composites and glass fiber composites
0
5000
10000
15000
20000
25000
30000
0 20 40 60 80
E-m
odul
s (M
pa)
Temp. (ºC)
Jute +Polyester
glass fiber+ polyester

24
after 2 years of exposure to an outdoor environment in Roorkee, India. Discoloration of
biofiber composites due to exposure to the outdoors is shown in Figure 2.2.2.3.
Table 2.2.2.2 Weathering of Biofiber Composites Jute fiber composites Glass fiber composites
2 years of natural exposure
in Roorkee-India
Color fading on the exposed surface Black spots on the edge and black color
on the unexposed surface Reduction of tensile and flexural
strength by >50%
Less color change on both exposed and unexposed surfaces
Reduction of tensile and flexural strength by ~5-15%
From “Natural fibers, Biopolymers, and Biocomposites,” by Mohanty, Misra, & Drzal (eds.), 2005, p. 273.
Figure 2.2.2.3 Discoloration of Jute Composites after Two Years of Outdoor Exposure;
Fresh (a), exposed side after two years outdoors (b) and unexposed side after two years outdoors(c). From “Natural fibers, Biopolymers, and Biocomposites,” by Mohanty, Misra, and Drzal (eds.), 2005, p. 274.
(3) Water Absorption
The amount of water absorption in biofiber composites is greater than that of
synthetic fiber composites because there is a substantial number of voids present in
laminates between natural fibers and polymer matrices, resulting in dimensional changes
(Mohanty, Misra, & Drzal, 2005, p. 272-273). When immersed in water, the strength of a
biofiber composite is reduced to 11~38% (Mohanty, Misra, & Drzal, 2005, p. 273).
Interfacial voids between the natural fibers and matrix are due to the irregular surface
characteristics and morphology of the fibers, but they can be minimized by chemically
treating the surface of the biofibers during the fabrication process (Mohanty, Misra, &
Drzal, 2005, p. 229). Table 2.2.2.3 describes the dimensional changes of various biofiber
composites after being immersed in water for 24 hours at room temperature. Since
a b c

25
polymers tend to absorb more water as the temperature rises (Shah, 2007, p. 264), it is
presumed that biofiber composites will admit more water as the water temperature goes
up.
Table 2.2.2.3 Water Absorption of Different Biofiber composites
Water absorption
24 hrs. (%) Swelling in thickness
24 hrs. (%)
Sisal + Polyester 3-4 5
Jute + Polyester 1.09 Negligible
Coir + Polyester 3-4 5-6
Glass fiber + Polyester 1.03 Negligible From “Constr. Buiod. Master., Singh, B. et al., 9, 39, 1995 Cited in Natural fibers, Biopolymers, and
Biocomposites,” by Mohanty, Misra, and Drzal (eds.), 2005, p. 272 & 275.
(4) Microbial Attack
A building material’s durability can also be negatively affected by
microorganisms, eventually leading to structural failure. Considerable research has been
conducted on how wood preservatives and wood products provide microbial resistance,
but little data is available about biofiber composites. The test method used for
determining the microbial resistance of coated biofiber composites is ASTM D 3273
Standard Test Method for Resistance to Growth of Mold on the Surface of Interior
Coatings in an Environmental Chamber. The major detrimental effects of microbial
attack on biofiber composites include the degradation of mechanical properties and a
change in aesthetic quality (Shah, 2007, p. 140). The microbial resistance is measured
based on the degree of discoloration and disfiguration of a material’s surface (ASTM D
3274, 2007. p. 1). The Federation Society of Coating Technology provides pictorial
standards with ratings from 0 (minor degradation) to 10 (100% disfigurement), depending
upon the surface defects (ASTM D 3274, 2007, p. 1 & 3). Figure 2.2.2.4 shows examples
of different levels of disfigurement and their ratings.
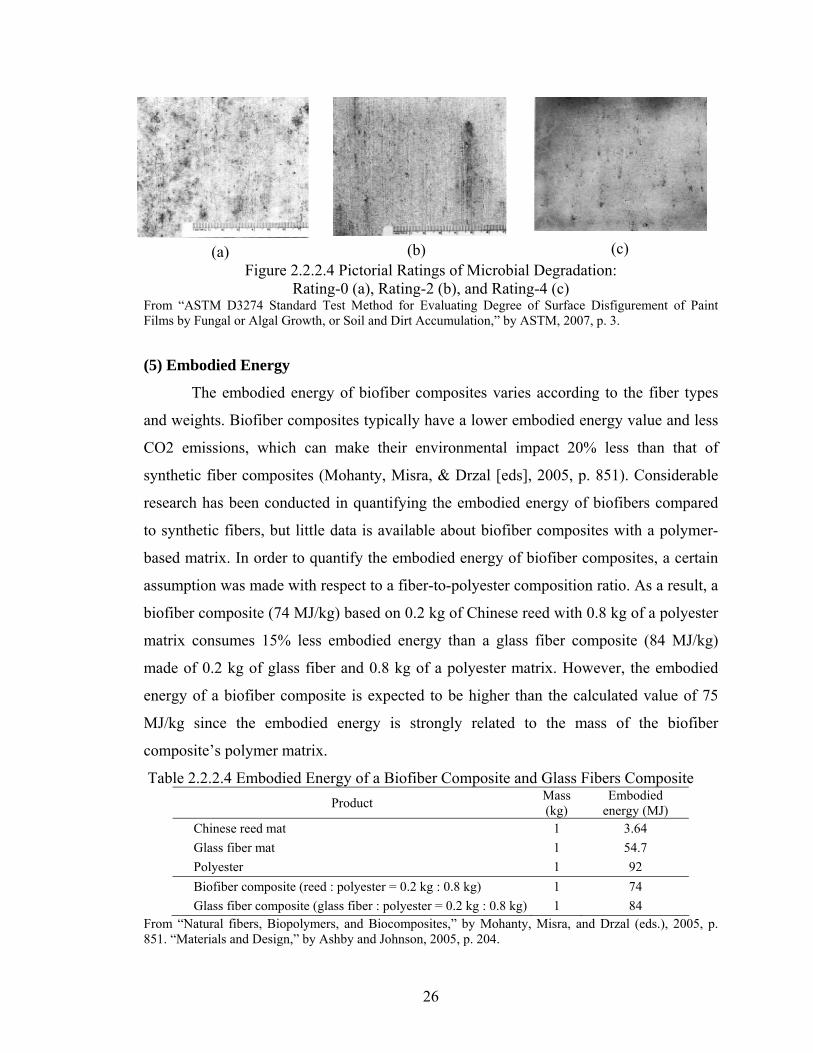
26
Figure 2.2.2.4 Pictorial Ratings of Microbial Degradation: Rating-0 (a), Rating-2 (b), and Rating-4 (c)
From “ASTM D3274 Standard Test Method for Evaluating Degree of Surface Disfigurement of Paint Films by Fungal or Algal Growth, or Soil and Dirt Accumulation,” by ASTM, 2007, p. 3.
(5) Embodied Energy
The embodied energy of biofiber composites varies according to the fiber types
and weights. Biofiber composites typically have a lower embodied energy value and less
CO2 emissions, which can make their environmental impact 20% less than that of
synthetic fiber composites (Mohanty, Misra, & Drzal [eds], 2005, p. 851). Considerable
research has been conducted in quantifying the embodied energy of biofibers compared
to synthetic fibers, but little data is available about biofiber composites with a polymer-
based matrix. In order to quantify the embodied energy of biofiber composites, a certain
assumption was made with respect to a fiber-to-polyester composition ratio. As a result, a
biofiber composite (74 MJ/kg) based on 0.2 kg of Chinese reed with 0.8 kg of a polyester
matrix consumes 15% less embodied energy than a glass fiber composite (84 MJ/kg)
made of 0.2 kg of glass fiber and 0.8 kg of a polyester matrix. However, the embodied
energy of a biofiber composite is expected to be higher than the calculated value of 75
MJ/kg since the embodied energy is strongly related to the mass of the biofiber
composite’s polymer matrix.
Table 2.2.2.4 Embodied Energy of a Biofiber Composite and Glass Fibers Composite
Product Mass (kg)
Embodied energy (MJ)
Chinese reed mat 1 3.64
Glass fiber mat 1 54.7
Polyester 1 92
Biofiber composite (reed : polyester = 0.2 kg : 0.8 kg) 1 74
Glass fiber composite (glass fiber : polyester = 0.2 kg : 0.8 kg) 1 84 From “Natural fibers, Biopolymers, and Biocomposites,” by Mohanty, Misra, and Drzal (eds.), 2005, p. 851. “Materials and Design,” by Ashby and Johnson, 2005, p. 204.
(a) (b) (c)
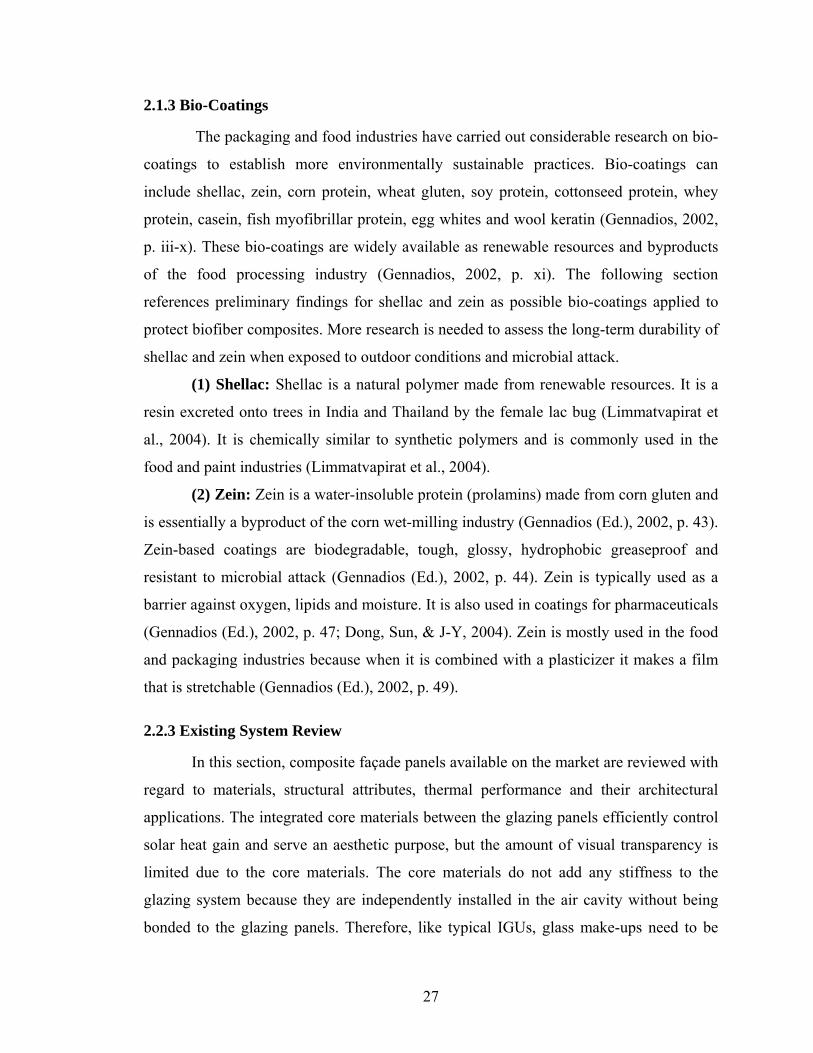
27
2.1.3 Bio-Coatings
The packaging and food industries have carried out considerable research on bio-
coatings to establish more environmentally sustainable practices. Bio-coatings can
include shellac, zein, corn protein, wheat gluten, soy protein, cottonseed protein, whey
protein, casein, fish myofibrillar protein, egg whites and wool keratin (Gennadios, 2002,
p. iii-x). These bio-coatings are widely available as renewable resources and byproducts
of the food processing industry (Gennadios, 2002, p. xi). The following section
references preliminary findings for shellac and zein as possible bio-coatings applied to
protect biofiber composites. More research is needed to assess the long-term durability of
shellac and zein when exposed to outdoor conditions and microbial attack.
(1) Shellac: Shellac is a natural polymer made from renewable resources. It is a
resin excreted onto trees in India and Thailand by the female lac bug (Limmatvapirat et
al., 2004). It is chemically similar to synthetic polymers and is commonly used in the
food and paint industries (Limmatvapirat et al., 2004).
(2) Zein: Zein is a water-insoluble protein (prolamins) made from corn gluten and
is essentially a byproduct of the corn wet-milling industry (Gennadios (Ed.), 2002, p. 43).
Zein-based coatings are biodegradable, tough, glossy, hydrophobic greaseproof and
resistant to microbial attack (Gennadios (Ed.), 2002, p. 44). Zein is typically used as a
barrier against oxygen, lipids and moisture. It is also used in coatings for pharmaceuticals
(Gennadios (Ed.), 2002, p. 47; Dong, Sun, & J-Y, 2004). Zein is mostly used in the food
and packaging industries because when it is combined with a plasticizer it makes a film
that is stretchable (Gennadios (Ed.), 2002, p. 49).
2.2.3 Existing System Review
In this section, composite façade panels available on the market are reviewed with
regard to materials, structural attributes, thermal performance and their architectural
applications. The integrated core materials between the glazing panels efficiently control
solar heat gain and serve an aesthetic purpose, but the amount of visual transparency is
limited due to the core materials. The core materials do not add any stiffness to the
glazing system because they are independently installed in the air cavity without being
bonded to the glazing panels. Therefore, like typical IGUs, glass make-ups need to be

28
calculated according to the ASTM E1300 Standard Practice for Determining Load
Resistance of Glass in Buildings (ASTM, 2006). The embodied energy was estimated
using the material components of the glazing panel of 1.2 m by 3.0 m. ClearShade IGU,
manufactured by a Panelite Inc., and Okasolar by Okalux Inc. were used to understand
their fundamental façade performance.
(1) Panelite: Panelite is a translucent honeycomb panel developed by New York-
based architects. ClearShade IGU (insulated glass unit), which was developed for outdoor
use, is made out of glass skins with an independent honeycomb polycarbonate core in the
air cavity. The glass skin offers long-term durability and the polycarbonate honeycomb
core acts as a shading device by limiting solar heat gain and daylight transmittance. A
typical ClearShade IGU consists of a 6 mm outboard, a 12 mm thick honeycomb core and
a 6 mm inboard, and the polycarbonate honeycomb core is normally 6 mm diameter and
12 mm thick. The glass skin can be available with up to 15 mm thickness depending on
the wind load and panel size, and reinforced glass is also available for use in hurricane-
prone regions. The span capability of the panel is determined according to ASTM E1300
depending on the design load, glass thickness, number of supported edges and deflection
requirements. The maximum panel size available is 1346 mm wide by 3048 mm high.
The embodied energy of a 1.2 m wide by 3.0 m high panel consisting of a 6 mm glass
inboard, a 12 mm polycarbonate honeycomb core and a 6 mm glass outboard, for
example, is estimated to be 1500 MJ based on the material mass (kg) input to fabricate
the unit (SimaPro, 2007). The polycarbonate honeycomb core accounts for a minimum
amount of impact on the embodied energy due to its small mass input. Figure 2.2.3.1
shows the layered construction for ClearShade IGU and its application to an external
building envelope in Mexico.
Figure 2.2.3.1 ClearShade IGU Assembly and Application in Mexico City, Mexico From “Panelite Brochure,” by Panelite, 2008, p. 9.
[A] Tubular honeycomb core [B] Glass facings [C] Core+Facings+Spacer/Seal= Hermetically sealed unit

29
To illustrate its thermal performance which influences the operation energy of a
building during its use phase, a ClearShade IGU consisting of a 6mm-thick glass skin and
a 12mm-thick clear tubular core provides a U-factor of 2.67 W/m2-K and a variable
SHGC of 0.17 to 0.5 depending on the sun’s angle (Panelite, 2001, p. 12). Figure 2.2.3.2
shows the U-factor and dynamic solar shading coefficients of a ClearSharde IGU without
low-e coating and with low-e coating respectively.
Figure 2.2.3.2 ClearShade IGU Energy Performance Values From “Panelite Brochure,” by Panelite, 2008, p. 12.
(2) Okalux
Okalux products consist of a glass skin and different shading elements such as
wood strips, wire mesh, capillary tubes and Venetian blinds installed in the air cavity.
According to their product performance description, Okalux products offer good light
diffusion, solar heat gain reduction, and thermal insulation. In particular, Okasolar, as
shown in Figure 2.2.3.3, has sun shading louvers in the glass cavity that offers both light
transmission and shading coefficients as high as SHGC- of 0.32 in winter and SHGC-
0.16 in summer. The aluminum louvers are suspended in a 22 mm thick glass cavity, and
typically span 1000 mm. Like a ClearShade IGU, an Okalux panel’s glass thickness is
determined in accordance with ASTM E1300, depending on the design load, size of the
panel and number of supported edges (ASTM, 2007). The maximum available panel size
is 3000 mm wide by 4500 mm high. The estimated embodied energy of a 1.2 m x 3.0 m
panel with aluminum louvers is approximately 3000 MJ, which is higher than the
ClearShade IGU due to the greater mass input of energy-intensive aluminum louvers.
Performance Value
ClearShade IGU without low-e
coating
ClearShade IGU with low-e
coating
VLT 0.48 0.48
SHGC Variable values Variable values
U-value (W/m2-K)
2.67 1.65
SHGC of PANELITE IGU
0
0.1
0.2
0.3
0.4
0.5
0.6
8 9 10 11 12 13 14 15time
SHG
C
0
10
20
30
40
50
60
70
80
SHGC
Sun Angle
Sun
Ang
le

30
Figure 2.2.3.3 Louvers-Integrated IGU: Summer (left) and Winter (right) Conditions
From “Okasolar W: Glazing with Integral Sun Control Louvers,” by Okalux, 2008, p. 1.
2.3 Structural Evaluation Framework
This section discusses a theoretical framework to measure façade performance
with respect to strength, stiffness and impact resistance under static and impact loads.
The fundamental structural requirements for a façade system involve its strength and
stiffness. Both strength and stiffness are a function of material properties, sectional
geometry, span length, type of support and loading types. Flexural strength refers to the
ability of a member to resist internal stresses without rupturing or being crushed under an
external bending force, whereas stiffness refers to the ability of a member to resist
excessive deformation. In addition to strength and stiffness, understanding the impact
behaviors is also important because impact performance is directly related to the
structural integrity and safety requirements of a façade system. Therefore, this section
reviews the theoretical framework used to determine the strength, stiffness and safety
performance of a façade system.
2.3.1 Strength and Stiffness
(1) Simply Supported Beam
Simple beam theory, in accordance to Roark’s formulas (Young & Budynas, 2002,
p. 190 & 192), was reviewed to calculate the maximum bending stress and deflection of a
composite beam with a two-edge support within the elastic range. The transformed
section method (Gere, 2006, p. 403) was used to compute the sectional properties of a
composite beam. Depending on the span and depth ratio, the deflection of a composite
beam would consist of bending deflection and shear deflection, and the shear deflection
Summer Elevation of Sun 60º
Winter Elevation of Sun 28º

31
of a composite beam in a typical application (i.e., relatively long spans with thin sections)
contributes to less than 2% of the total deflection (Bitzer, 1997, p. 49). Therefore, this
section focuses on defining the flexural deflection of a composite beam. Equations
2.3.1.1 through 2.3.1.4 show the formulas used to calculate the bending stress and
deflection of a simple beam with a point load (P) and a uniformly distributed load (w)
respectively. Equations 2.3.1.5 and 2.3.1.6 provide the equations to calculate the sectional
properties (I [moment of inertia] and S [sectional modulus]) of a composite section using
a transformed section method.
A. A simple beam with a point load (P)
Bending stress: I
My (2.3.1.1)
Deflection: EI
Pl
48
3
(2.3.1.2)
Where, M = bending moment (= Pl/4)
P = point load
y = distance from the neutral axis to the extreme fiber of a section (= t/2)
l = span
E = E-modulus
I = moment of inertia (= bt3/12)
b = width of a composite panel
t = thickness of a composite panel
B. A simple beam with a uniformly distributed load (w)
P
l
l
w
b
t
b
t

32
Bending Stress: I
My (2.3.1.3)
Deflection: EI
wl
384
5 4
(2.3.1.4)
Where, M = bending moment (= wl2/8)
w = uniformly distributed load
y = distance from the neutral axis to the extreme fiber of a section (= t/2)
l = span
E = E-modulus
I = moment of inertia (refer to Equation 2.1.1.5)
b = width of a composite panel
t = thickness of a composite panel
C. Transformed Section Method
The moment of inertia (Itotal) of the composite section is computed by
converting the width of the core into the width of the skin material using the
modular ratio (n) as shown in Figure 2.3.1.1. The modular ratio (n) is the ratio of
the E-modulus of the core to the E-modulus of the skin. Equation 2.3.1.5 shows the
moment of inertia calculation of the transformed section.
Figure 2.3.1.1 Transformed Section for Equivalent Moment of Inertia Calculation; Original Section (a) and Transformed Section (b)
corecoreskintotal IAdIII 22
122
)()(2
32
cccsss
tnbtttb (2.3.1.5)
bs
bc
bs
nbc
(a) (b)
tc
ts
ts
tc
ts
ts
N.A N.At t

33
Where, bs = width of skin
ts = thickness of skin
bc = width of core
tc = thickness of core
t = total thickness of a composite section
Es = E-modulus of skin material
Ec = E-modulus of skin material
n = modular ratio (= Ec/Es)
(2) Simply Supported Plate
Simple plate theory, according to Roark’s formulas (Young & Budynas,
2002, p. 502), was reviewed to calculate the bending stress and deflection of a plate
with a composite section. Because Roark’s plate theory is only applicable to a plate
with uniform thickness and homogeneous materials (Young & Budynas, 2002, p.
427), the theory was modified by using effective thickness. The effective thickness
is essentially computed by transforming a composite section with varied
thicknesses and/or made of different materials into a single plate’s thickness
asserting the plate’s thickness were of uniform thickness and made of
homogeneous materials as shown in Figure 2.3.1.1. Equations 2.3.1.6 and 2.3.1.7
show the maximum deflection and bending stress of a four-edge supported plate
with a composite section, and Table 2.3.1.1 provides the tabulated values used in
Equations 2.3.1.6 and 2.3.1.7.
A. A simple plate under a uniformly distributed load over an entire plate
b
t
a
b
supported
supported
supported
supported
w w
w w

34
Bending Stress 2
2
max
efft
wb (2.3.1.6)
Deflection 3
4
max
effEt
wby
(2.3.1.7)
Where,
α, β, γ = tabulated value as a function of the aspect ratio of the plate
a = width of a composite panel
b = height of a composite panel
w = uniformly distributed load
E = E-modulus
t = thickness of a composite panel
teff = effective thickness (refer to Equation 2.3.1.5)
Table 2.3.1.1 Tabulated Values for Four-Edge Supported Plates
under a Uniformly Distributed Load over an Entire Area a/b 1.0 1.2 1.4 1.6 1.8 2.0 3.0 4.0 5.0 unlimited Β 0.2874 0.3762 0.4530 0.5172 0.5688 0.6102 0.7134 0.7410 0.7476 0.7500 Α 0.0444 0.0616 0.0770 0.0906 0.1017 0.1110 0.1335 0.1400 0.1417 0.1421 Γ 0.420 0.455 0.478 0.491 0.499 0.503 0.505 0.502 0.501 0.500
From “Roark’s Formulas for Stress and Strain,” by Young & Budynas, 2003, p. 502
B. A simple plate under a uniformly distributed load over a central area
Under a uniformly distributed load over a local area, the maximum bending stress
and the deflection at the center of the plate are calculated using the following equations
(2.3.1.8 & 2.3.1.9) and the tabulated values are provided in Table 2.3.1.2.
b
teff
a
b
supported
supported
supported
supported
a1 b1
W

35
Bending stress:
0'2max
2ln)1(
2
3
r
b
t
P
eff
(2.3.1.8)
Deflection: 3
2
max
effEt
Pby
(2.3.1.9)
where, α,β,γ = tabulated value as a function of the aspect ratio of the plate
a = width of a composite panel
b = height of a composite panel
a1 = width of a loaded area
b2 = height of a loaded area
W = uniformly distributed load over a rectangular area
E = E-modulus
teff = effective thickness (refer to Equation 2.3.1.10)
v = Poisson’s ratio
r’0 = √(1.6r20 + teff
2) – 0.675teff if r0 < 0.5teff, and r’0 = r0 if r0 ≥ 0.5teff
Table 2.3.1.2 Formulas for Four-Edge Supported Plates under a Uniformly Distributed Load over a Central Area
From “Roark’s Formulas for Stress and Strain,” by Young & Budynas, 2003, p. 502.
C. Effective Thickness (teff) Calculation
The effective thickness of a composite section is computed using a section
of a monolithic plate, assuming that the moment of inertia (I) of a composite (a)
and transformed section (b) is the same as that of the monolithic plate (c) as shown
in Figure 2.3.1.1. Equation 2.3.1.10 shows an effective thickness calculation based
on the same width (bs) of the facing material.
a/b 1.0 1.2 1.4 1.6 1.8 2.0 3.0 4.0 5.0 unlimited Β 0.2874 0.3762 0.4530 0.5172 0.5688 0.6102 0.7134 0.7410 0.7476 0.7500 Α 0.0444 0.0616 0.0770 0.0906 0.1017 0.1110 0.1335 0.1400 0.1417 0.1421 Γ 0.420 0.455 0.478 0.491 0.499 0.503 0.505 0.502 0.501 0.500

36
Figure 2.3.1.1 An Effective Thickness Calculation Diagram from Transformed Sections to a Monolithic Section
12122
)()(2
332effscccs
ss
tbtnbtttbI
3
1 32
2
)(24
x
cccsseff b
tnbtttt (2.3.1.10)
2.3.2 Impact Performance
A glass window is typically the most vulnerable building material due to its low
impact resistance. In order to provide adequate safety against human body impact, a
performance-based safety glazing standard, ANSI Z97.1, is used in the United States to
comply with the various safety standard categories for glazing products. This section
provides a theoretical framework of experiments under impact loads to determine the
impact behaviors of a TCFS, which is discussed in Chapter 3.
(1) Impact Testing Apparatus and Specimen
ANSI Z97.1-2004 – the American National Standard for Safety Glazing Materials
Used in Buildings – specifies impact testing procedures. The testing apparatus in ANSI
Z97.1 consists of a metal frame, an impactor and a traction and release system. ANSI
Z97.1 specifies that testing frames must use 76 mm x 127 mm x 6 mm steel angles (or
other sections and materials of equal or greater rigidity) with either welded or bolted
connections to minimize the deflection, racking and twisting of the testing frames. The
impactor is a leather bag filled with number 7-1/2 lead shot weighing 45 kg, which is
bs
nbc
Transformed section (b)
tc
ts
ts
N.A t
bs
Monolithic section (c)
N.A teff
bs
bc
Original section (a)
tc
ts
ts
N.A t

37
connected from the upper swivel-fixture to the lower swivel by a steel cable. Testing
specimens are 609 mm x 762 mm for the limited size or 863 mm x 1930 mm for the
unlimited size, depending on the panel size intended for its final application.
(2) Human Impact Simulator and Impact Energy
Two types of impactors are internationally prescribed for a safety glazing test: a
shot bag and a weighted double tire. Foss (1999) explains that the shot bag simulates a
human head and body more accurately than does a weighted double tire. Figure 2.3.2.1
illustrates how a shot bag is analogous to human body impact.
Figure 2.3.2.1 Shot Bag Impactor for Simulating Human Body Impacts From "Safety Glass Testing: Human Head Impactor Simulation by Dynamic Transient Analysis," by Foss, 1999, p. 446.
In an accidental impact situation, the human body undergoes inelastic impact,
resulting in a loss of kinetic energy (Toakley, 1966). The shot bag impactor specified by
ANSI Z97.1 rebounds to about 50% of the original arc (Jacob, 2001), resulting in an
inelastic collision in which part of the kinetic energy is transferred into the deformation
of the impactor and another part is absorbed by the specimen. Figure 2.3.2.2 depicts the
impact modes of shot-bags with perfectly elastic, inelastic and perfectly inelastic
behaviors. The shaded impactors in Figure 2.3.2.2 indicate the impactor’s final positions
after striking the vertical specimen. A maximum potential energy of 1,355 N-m is
specified in ANSI Z97.1 based on a drop height of 1.2 m and a 45 kg impactor, which is
the equivalent amount of impact energy created by a 45 kg boy running at 6.7 m/s. Figure
2.3.2.3 shows different impact energies depending on the velocity and weight of the
impactor.
Strain gauge
Strain gauge
Strain gauge
Accelerometer Strain gauge

38
(a) Perfectly elastic (b) Inelastic (c) Perfectly inelastic
Figure 2.3.2.2 Shot-Bag Impact Modes indicates the final position of the impactor.
Figure 2.3.2.3 Human Engineering Data From "ANSI Z97.1 American National Standard for Safety Glazing Materials Used in Buildings - Safety Performance Specifications and Methods of Test," by American National Standard, 2004, p. 37.
(3) Safety Glazing Classifications
ANSI Z97.1 specifies three classifications for safety glazing related to an
impactor’s drop height and the post-breakage modes of a specimen: Class A for a 1,219
mm-drop height, Class B for a 457 mm-drop height and Class C for a 304 mm-drop
height. Six types of glazing materials are referred to as safety glazing in ANSI Z97.1:
laminated glass, fully tempered glass, wired glass, polymer safety glazing, organic coated
glass and a safety insulating unit. In order to pass the safety requirements of ANSI Z97.1,
a sheet of laminated glass must either not fracture when dropped from a specified drop
height, or if it does fracture, the broken pieces must adhere to an interlayer, and there
Specified impact energyof 1355 N-m

39
should be no opening large enough for a 76 mm diameter sphere to freely pass through.
Fully tempered glass must either not fracture when dropped from a specified class drop
height, or if it cracks, the ten largest pieces should not be heavier than the weight of 64.5
cm2 of the specimen. In accordance with ANSI Z97.1, polymer with an E-modulus of less
than 5,171 MPa and a Rockwell hardness of less than M are specified as safety glazing
materials regardless of post-breakage modes. The Charpy impact test specifications
stipulate that the test must be conducted after 2000 hours of UV exposure and that the
weathered surfaces of the specimens should be placed on the opposite side of the impact
hammer to avoid direct contact with the hammer’s striking edge. The impact strength of
aged polymers must maintain more than 75% of the Charpy impact strength of the
original specimen to meet the safety requirements of ANSI Z97.1. Figure 2.3.2.4
demonstrates a Charpy impact machine and specimen set-up as per ASTM D 6110
Standard Test Methods for Determining the Charpy Impact Resistance of Notched
Specimens of Plastics.
Figure 2.3.2.4 Charpy Impact Machine and Specimen Set-Up From "ASTM D 6110 Standard Test Methods for Determining the Charpy Impact Resistance of Notched Specimens of Plastics," by ASTM, 2006, p. 3 & 4.
Figure 2.3.2.5 demonstrates the post-breakage patterns of a 6 mm-thick sheet of
laminated glass and tempered glass. While broken laminated glass is shown to adhere to
an interlayer, tempered glass breaks into granules. Many of the fractured clumps of
tempered glass tend to break into sharp, dagger-like shapes rather than rounded clusters,
as shown in the figure below (Jacob, 2001). Therefore, further study is required to more
accurately assess the safety of the post-breakage patterns of fully tempered glass.
Striking Edge Radius 3.17 ± 0.12 mm
Span: 101.6 ± 0.5 mm
Specimen Support
Specimen
99.3 ± 0.03 mm
9.317 ± 0.12 mm
Radius
Anvil
Point of Impact
90º Weathering surface (on the opposite side of the hammer)

40
Figure 2.3.2.5 Fracture Patterns of Laminated Glass (a), Tempered Glass (b), and Shards of Tempered Glass (c)
From “Investigation of Repeatability and Reproducibility of the Shot Bag Impactor,” by Oketani, Kikuta, and Aratani, 2001, p. 679 & 680.
2.4 Environmental Performance Evaluation Framework
Buildings are responsible for 40% of the US’s total energy use and CO2
emissions (DOE, 2007, p. 5). Due to their high energy consumption, there is a growing
effort to promote environmentally sustainable buildings, which has led to the
development of a number of assessment tools such as the Life Cycle Assessment (LCA)
and Leadership in Energy and Environmental Design (LEED). The LCA measures
environmental impacts resulting from all stages of the life cycle of products or activities
in a holistic way (Baillie, 2004, p. 23), and LEED evaluates environmental performance
from a whole-building perspective by awarding points for satisfying the performance
criteria (USGBC, 2003, p. 3). For this study, the researcher chose to use the LCA
technique to measure the environmental performance of a glazing system because this
method offers a comprehensive examination of the environmental impacts associated
with each stage of a building’s life cycle, from material production to the end-of-life
management.
2.4.1 Framework of the Life Cycle Assessment (LCA)
In essence, an LCA focuses on the examination, identification and evaluation of
the environmental implications of a product and its assembly process "from cradle to
grave" (Graedel, 1998, p. 18). Various terminologies have been used to represent
environmental impact assessments that are synonymous with what LCA accomplishes,
(a) (b) (c)

41
such as "cradle-to-grave analysis," "ecobalance," "ecoprofile," "life cycle balance,"
"resource and environmental profile analysis," "product line analysis," and "integrated
substance chain analysis" (Baillie, 2004, p. 23). However, in 1997, the ISO 14040 series
of standards was introduced, which led to the consistent use of LCA terminology in
various fields (Baillie, 2004, p. 23). An LCA procedure starts with the goal and scope
definition and continues to inventory analysis, impact assessment, and finally,
interpretation of the results. Figure 2.4.1.1 depicts the LCA framework in accordance
with the ISO 14040 guidelines.
Figure 2.4.1.1 LCA Procedure in accordance with ISO 14040 From “Environmental Management− Life Cycle Assessment− Principles and Framework,” by ISO, 2006, p. 4.
(1) Goal and Scope Definition
The first phase of the LCA framework under ISO 14040 is to describe the reasons
for carrying out the study and to define the scope of work with respect to the functional
unit, system boundaries, assumptions and limitations of the study and the data quality to
ensure accurate and reliable results. A functional unit is defined by the functional
requirements of a product system for a certain period of time. For example, the functional
unit for a glass window can be defined as the area covered by a glass window for a
specified service period. System boundaries are usually defined by whether an LCA
study constitutes a complete analysis (e.g., cradle-to-grave) or partial analysis (e.g., gate-

42
to-grave) (Baillie, 2004, p. 28). Figure 2.4.1.2 illustrates a general material and process
flow diagram that demonstrates a cradle-to-grave system boundary.
Figure 2.4.1.3 System Boundary Example of an LCA for a Plastic Sheet used for a Glazing Application; Material and Process Flow Diagram (Cradle-to-Grave)
(2) Life Cycle Inventory Analysis
The second phase of the LCA framework under ISO 14040 is the life cycle
inventory analysis, which involves data collection to calculate material use, energy input
and pollutant emissions during the entire life cycle of a product or process. These data
can be obtained from companies engaged in product fabrication and processing activities
as well as from published databases. Material use and primary energy consumption are
calculated as a form of kg/functional unit and MJ/functional unit respectively, and
pollutant emissions are expressed in terms of kg/functional unit. Figure 2.4.1.3 shows a
life cycle inventory flow diagram published by the Society of Environmental Toxicology
and Chemistry (SETAC).
Disposal Manufacture, Assembly, &
Packaging
Use/Service Materials Production
Extraction
Refinery
Polymer-ization
Extrusion
Use
Landfilling
Incinerating
Crude Oil/Nat. Gas
Recycling Assembly
Raw Material Extraction & Acquisition
Production of Chemical
Feedstocks
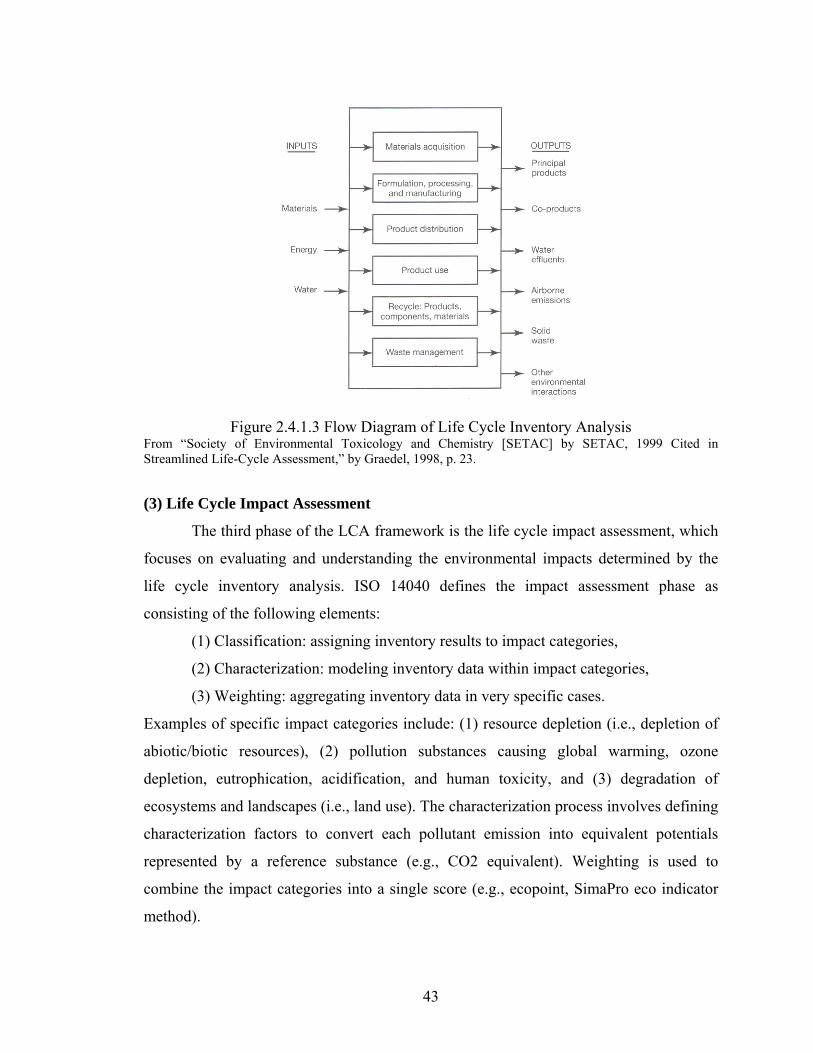
43
Figure 2.4.1.3 Flow Diagram of Life Cycle Inventory Analysis From “Society of Environmental Toxicology and Chemistry [SETAC] by SETAC, 1999 Cited in Streamlined Life-Cycle Assessment,” by Graedel, 1998, p. 23.
(3) Life Cycle Impact Assessment
The third phase of the LCA framework is the life cycle impact assessment, which
focuses on evaluating and understanding the environmental impacts determined by the
life cycle inventory analysis. ISO 14040 defines the impact assessment phase as
consisting of the following elements:
(1) Classification: assigning inventory results to impact categories,
(2) Characterization: modeling inventory data within impact categories,
(3) Weighting: aggregating inventory data in very specific cases.
Examples of specific impact categories include: (1) resource depletion (i.e., depletion of
abiotic/biotic resources), (2) pollution substances causing global warming, ozone
depletion, eutrophication, acidification, and human toxicity, and (3) degradation of
ecosystems and landscapes (i.e., land use). The characterization process involves defining
characterization factors to convert each pollutant emission into equivalent potentials
represented by a reference substance (e.g., CO2 equivalent). Weighting is used to
combine the impact categories into a single score (e.g., ecopoint, SimaPro eco indicator
method).
44
(4) Life Cycle Result Interpretation
The fourth phase of an LCA is the interpretation of the results, where the findings
from the inventory analysis and the impact assessment are combined in order to reach
conclusions and make recommendations. A sensitivity analysis can be carried out in
order to understand how model parameters influence the LCA results or how critical
uncertain parameters help to reduce environmental impacts.
2.4.2 LCA Application to a Building Window System
An LCA technique has been used to assess the life cycles of various industrial
products, but there are a limited number of studies that focused on a building’s window
system. Weir and Muneer (1996) performed a comparative LCA of a window system
using different inert gasses. They investigated the embodied energy and CO2 emissions
associated with fabricating a window system that consists of an insulated glass unit (IGU),
inert gas (air, argon, krypton and xenon), a timber frame and aluminum components. The
LCA study showed that the xenon-filled IGU consumed the most embodied energy,
followed by the argon-filled IGU and finally the krypton-filled IGU. These results were
mainly attributed to the energy-intensive process of producing inert gasses. The
environmental impact of these IGUs, however, will change when their use phase is
included, because building are designed for long-term durability and an inert gas-filled
IGU will consume less building operational energy due to its superior U-factor.
Citherlet, Di Guglielmo, and Gay’s (2000) study took all stages of a window’s life
cycle into consideration. They conducted a comparative LCA by combing four variables:
window types, building types (office, school and dwelling), façade orientation (East/West,
South and North) and different climates zones. Eight different window systems were
configured with and/or without incorporating hard low-e coating and inert argon gas to
create different U-values so that their energy efficiency could be examined depending on
building type, orientation and site location. The study concluded that the high
performance window (hard coating with an argon gas-filled cavity) consumes more
energy during its pre-use phase (from extraction to product fabrication), but this
difference is reduced when it saves energy during the use phase because of its superior U-
value compared to a typical window (without coating and argon gas). The study results,
45
however, somewhat are limited in that most of environmental impacts typically takes
place in the use phase and the design life of the buildings and service span of the window
system were not specified. The researchers speculated that the high performance window
would consume more lighting energy than a typical window due to its relatively low
visible light transmittance (VLT). Although higher VLT allows more sunlight and saves
lighting energy consumption, this may require operable blinds for glare controls, which
add environmental impact associated with production, maintenance and disposal of the
blinds.
Whereas the aforementioned studies focused on the environmental impacts of
window systems, Abeysundra, Gheewala, and Sharp’s (2007) study considered the
environmental impacts of two types of window frames—one made from wood, and the
other from aluminum. Results indicated that, compared to the wood-framed window, the
aluminum-framed window created higher environmental impacts due to the energy-
intensive process involved in aluminum fabrication. However, this study was not
conclusive because only the energy associated with material production was considered.
2.5 Conclusions
The first part of this chapter reviewed studies on composite panel systems for
building applications and research methodologies. The second part involved assessing the
material performance of recyclable polymers and biofiber composites in a transparent
composite façade system (TCFS) in order to establish whether they are feasible materials
to be used in outdoor environments. The final part of the study considered the structural
framework to measure the performance metrics of stiffness, strength and impact
resistance. An LCA technique to measure energy consumption and CO2 emission was
discussed, and previous studies conducting an LCA for building glazing systems were
also explained.
Section 2.1 discussed previous studies of composite panels made of various skin
and core materials for building applications. Research focused on defining the structural
behaviors of a composite panel through experimental and theoretical methods. Cores that
are adhered to a strong skin material are made of wide range of less stiff and lightweight
materials and configurations, and provide flexural and shear stiffness, impact resistance

46
and buckling resistance of the skin material. Composite panels can have either solid cores
or open cell cores, depending on their structural and thermal requirements. Most studies
on the composite panel focused on validating the analytical calculations and numerical
simulations through experiments to provide a time-efficient and accurate tool that can be
used during the design phase. The products available in the markets using a composite
panel concept were also discussed in section 2.2. The glass panels integrated with
shading louvers in the air cavity provides long-term durability for outdoor application
while at the same time optimizing building energy performance. However, the cavity-
installed core does not offer complete visual transparency and there are still challenges
associated with the glass panel size and span capability of the products. The embodied
energy of the façade system greatly depended on the types and the mass amount of the
core material.
A transparent composite façade system (TCFS) made out of a polymer skin and
biofiber composite core was newly configured, and the material performance of polymer
and biofiber composites for outdoor use was verified as discussed in Section 2.2. The use
of polymers in a glazing application has certain advantages over glass in the areas of
weight reduction, impact resistance, thermal conductivity, optical clarity and design
flexibility. For the construction of a composite panel system, biofiber composites provide
sufficient mechanical properties and environmental benefits as a core material. The use of
a polymer skin and biofiber composite core is expected to show lower weatherability
when exposed to outdoor environments compared to glass. Due to the vapor permeability
of polymers, moisture can migrate into the cavity of a composite panel through the
polymer skin, which potentially produces mold growth on the biofiber composite core
and condensation in the cavity. Possible ways to improve the current materials’
performance is to seal both the polymer skins and the biofiber composite core with a
protective coating in order to prevent vapor permeation, water contact and discoloration.
At present, silicon hard coat technology is available for use on polymer materials, which
provides UV, abrasion and vapor resistance. Bio-based coatings made from renewable
organic resources provide the necessary durability for a biofiber composite core, but
further research regarding this specific application should be carried out to access the
long-term performance of the bio-based coatings when exposed to UV, heat and moisture.

47
In order to avoid stresses induced by thermal movement, a façade system joint
configuration will need to be carefully designed to accommodate thermal movements.
Long-term stress levels in plastics significantly affect long-term creep strain, but this may
not be a major issue for a vertical façade application since the long term gravity stress is
low and the higher wind loads are transient. The PCs and PMMAs meet the flammability
requirements of the International Building Code, but future research is needed to verify
the overall fire performance of both the polymer skins and the biofiber composite core of
a TCFS.
Elastic simple beam and plate theories were reviewed in section 2.3 to compute
the strength and stiffness of a composite panel construction. The transformed section
method and effective thickness calculation was reviewed to estimate the sectional
properties (e.g. moment of inertia [I] and sectional modulus [b]) of a composite section.
The ANSI Z97.1 was also reviewed to verify safety glazing requirements and impact test
specifications and used as a basis on which to fabricate a new test frame and carry out
impact tests, as is described in Chapter 3.
The Life cycle assessment (LCA) method was reviewed in accordance with ISO
14040 in section 2.4 in order to measure the environmental performance of glazing
façade systems during their life cycles. The first phase of an LCA—goal and scope
definition—requires defining the functional unit, system boundary, study assumptions,
and data quality. The life cycle inventory analysis, which is the second phase of an LCA,
involves extensive data collection in order to calculate the total resource and energy
consumption and the environmental emissions for a defined functional unit. The last
phase of an LCA—life cycle impact assessment—consists of classifying impact
categories and relating various types of pollutant emissions to a single substance. The
previous studies concerning the LCA application for window systems provided limited
information on their environmental impacts from the whole life cycle perspective because
most studies did not explicitly discuss the impacts associated with the use phase and the
end-of-life management.

48
Chapter 3
Structural Performance Evaluation of a TCFS
Chapter 3 focuses on establishing a structural design method for a transparent
composite façade system (TCFS) and conducting structural static and impact testing in
order to evaluate a TCFS safety classification in relation to ANSI Z97.1. This chapter
also provides recommendations for the design of a TCFS, based on the results of the
above analysis and tests and compares this with the design criteria of the International
Building Code (IBC 2003). A new test frame was designed and fabricated in accordance
with the requirements of ANSI Z97.1 for purposes of conducting both static and impact
tests.
3.1 Structural Design of a TCFS
3.1.1 Strength and Deflection Requirements of a TCFS
A building façade system must resist design loads without material failure and
without excessive deformation. Due to the lack of any structural performance design
criteria for TCFSs, similar deflection and strength criteria were set, based on equivalent
parameters specified in IBC 2003. According to IBC strength requirements, structural
systems must provide adequate safety by not exceeding their strength limit under factored
loads (Load and Resistance Factor Design [LRFD]) or they must not exceed allowable
stress levels under working or service loads (Allowable Stress Design [ASD]). With
regard to deflection requirements, current US building codes provide limited guidance on
allowable deflections for a glazing system. For example, IBC 2003 limits the lateral
deflection of glazing framing members and the edges of a glass panel to the lesser of
1/175 times the shorter span or 19 mm while ASTM E 1300-2007 limits the edge of glass
to be 1/175 times the shorter span. The rationale for the deflection of a frame being
49
limited to 19 mm is likely to ensure a suitable support connection between a frame and
the edge of a glazing panel (IBC, p. 515) and as such will be a suitable criterion for a
TCFS panel. Therefore, the researcher uses 19 mm as a maximum allowable deflection of
a TCFS panel. For the allowable bending stress criteria of a TCFS, the researcher used an
ASD approach to verify the bending stress of a TCFS panel and examine a suitable safety
factor for the TCFS design. Safety factor (N) is characterized as the ratio of allowable
stress to working stress (N = allowable stress/working stress). A tensile member of steel,
for example, uses a safety factor of 1.67 to calculate allowable stress (ASIC ASD, 2006,
p. 16.1-46) whereas the allowable stress of glass is determined based on statistical
analysis (ASTM E 1300, 2007, p. 3). A safety factor of concrete for flexural design is
approximately 1.77 based on a ratio of load factor to load resistance factor (Nawy, 2005,
p. 81). Plastic, however, has no guidance on safety factors for glazing application due to
the lack of long term established practical experience. Therefore, the research uses a
factor of 2 according to the Baker’s weighted safety factor to estimate the allowable
stress of plastics (Baker, 1956, p. 91 cited in Nawy, 2005, p. 78).
3.1.2 Design Load Verification
A façade system is subject to dead and various types of live load such wind,
seismic, thermal expansion induced forces and impact. For the purposes of this research
the scope of applicable loads were limited to the dead load, wind loads and impact forces
to establish a design method for initial sizing and the evaluation of the performance of a
TCFS that would satisfy the performance criteria of IBC 2003. Thermal and seismic
forces can be accommodated through suitable connection details, similar to glazing
systems design practice. Dead load is determined from the self weight of the façade
system components, and wind load is established from code values, and in some
specialized cases from the results of wind tunnel measurements. A typical 10-story office
building located in Detroit, Michigan was used as a baseline model to establish suitable
wind loads on a TCFS. The building configuration and dimensions are as shown in
Figure 3.1.2.1. The size of each TCFS is 4.8 m wide by 4 m high and consists of a vision
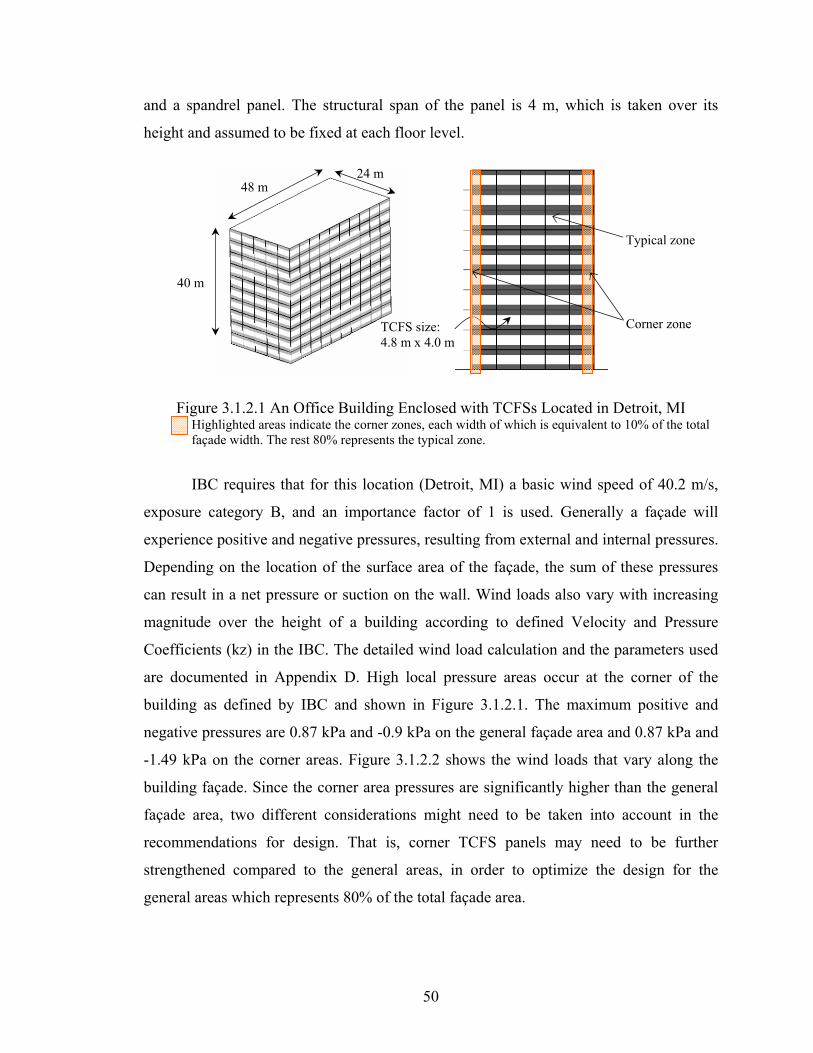
50
and a spandrel panel. The structural span of the panel is 4 m, which is taken over its
height and assumed to be fixed at each floor level.
Figure 3.1.2.1 An Office Building Enclosed with TCFSs Located in Detroit, MI Highlighted areas indicate the corner zones, each width of which is equivalent to 10% of the total façade width. The rest 80% represents the typical zone.
IBC requires that for this location (Detroit, MI) a basic wind speed of 40.2 m/s,
exposure category B, and an importance factor of 1 is used. Generally a façade will
experience positive and negative pressures, resulting from external and internal pressures.
Depending on the location of the surface area of the façade, the sum of these pressures
can result in a net pressure or suction on the wall. Wind loads also vary with increasing
magnitude over the height of a building according to defined Velocity and Pressure
Coefficients (kz) in the IBC. The detailed wind load calculation and the parameters used
are documented in Appendix D. High local pressure areas occur at the corner of the
building as defined by IBC and shown in Figure 3.1.2.1. The maximum positive and
negative pressures are 0.87 kPa and -0.9 kPa on the general façade area and 0.87 kPa and
-1.49 kPa on the corner areas. Figure 3.1.2.2 shows the wind loads that vary along the
building façade. Since the corner area pressures are significantly higher than the general
façade area, two different considerations might need to be taken into account in the
recommendations for design. That is, corner TCFS panels may need to be further
strengthened compared to the general areas, in order to optimize the design for the
general areas which represents 80% of the total façade area.
TCFS size: 4.8 m x 4.0 m
48 m 24 m
40 m
Typical zone
Corner zone

51
Figure 3.1.2.2 Varying Wind Loads across the Building Façade
3.1.3 Structural Properties of a TCFS
This section focuses on verifying the sectional properties of a TCFS to confirm
whether the current design of the TCFS specimens meets the structural requirements
established in Section 3.1.1. A TCFS panel is composed of a cardboard core that is
sandwiched between two PMMA skins and connected by epoxy adhesives. Transformed
section method (Gere, 2006, p. 403) was employed to verify the sectional properties of a
TCFS panel with respect to its moment of inertia (I) and sectional modulus (S), assuming
that the joint completely transfers the shear load to the cardboard core. Since the E-
modulus of cardboard is different from that of PMMA, the thickness of the core is
reduced by the E-modulus ratio of cardboard (800 MPa) to PMMA (3300 MPa), which
results in a modular ratio (n) of 0.25 (800 MPa/3300 MPa). Figures 3.1.3.1 shows how
the transformed section is obtained based on the transformed section method using the E-
modulus of PMMA.
( p )( p ) ( 9 ps )
0
4
8
12
16
20
24
28
32
36
40
-2.00 -1.00 0.00 1.00wind loadings (kPa)
build
ing
heig
ht (
m)
typical & corner zones(pressure)
corner zone (suction)
typical zone (suction)
0.87 kPa-1.49 kPa -0.9 kPa
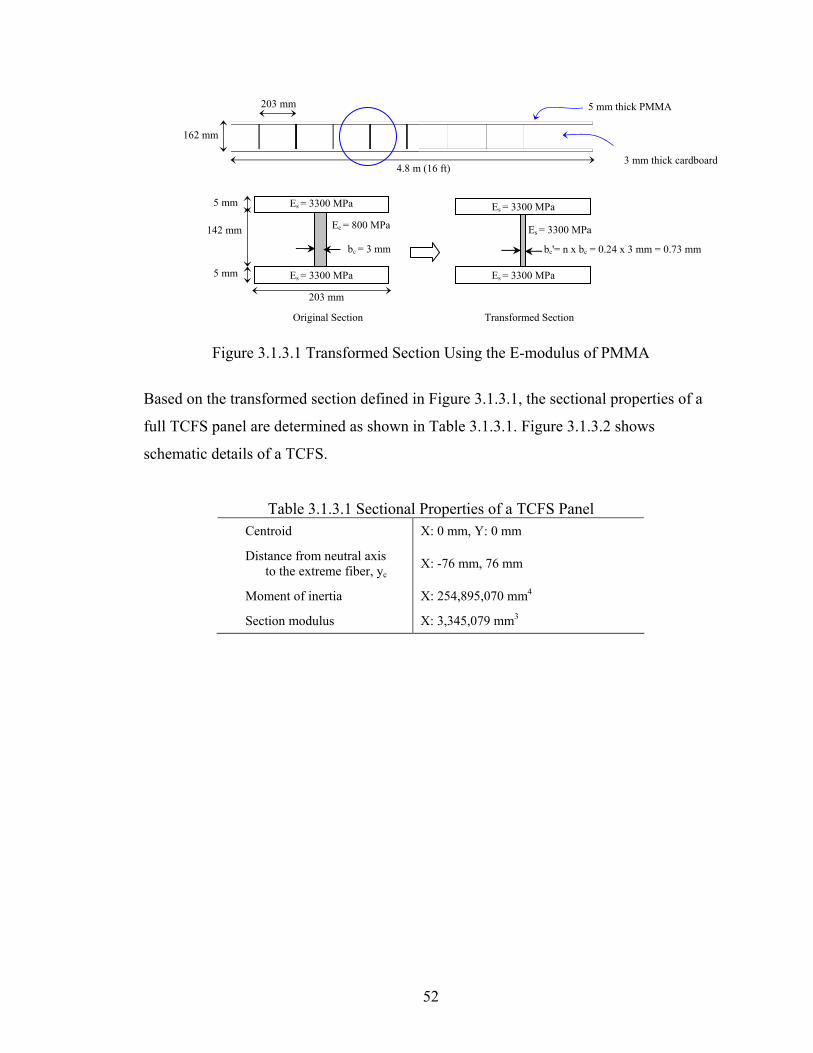
52
Figure 3.1.3.1 Transformed Section Using the E-modulus of PMMA
Based on the transformed section defined in Figure 3.1.3.1, the sectional properties of a
full TCFS panel are determined as shown in Table 3.1.3.1. Figure 3.1.3.2 shows
schematic details of a TCFS.
Table 3.1.3.1 Sectional Properties of a TCFS Panel Centroid X: 0 mm, Y: 0 mm
Distance from neutral axis to the extreme fiber, yc
X: -76 mm, 76 mm
Moment of inertia X: 254,895,070 mm4
Section modulus X: 3,345,079 mm3
3 mm thick cardboard 4.8 m (16 ft)
162 mm
5 mm thick PMMA
Es = 3300 MPa
Es = 3300 MPa
Ec = 800 MPa
Es = 3300 MPa
Es = 3300 MPa
Es = 3300 MPa
bc'= n x bc = 0.24 x 3 mm = 0.73 mm bc = 3 mm
203 mm
203 mm
142 mm
5 mm
5 mm
Original Section Transformed Section

53
Figure 3.1.3.2 Plan (a) and Section (b) Details of a TCFS
TCFS panel TCFS panel
TCFS panel
TCFS panel
(a)
(b)
Frame as required for the corner zone where higher wind loads occur
Frame as required to support the self weight

54
3.1.4 Bending Stress and Deflection Check of a TCFS Panel
Based on the sectional properties as defined in section 3.1.3, the actual defections and
bending stresses of a TCFS panel were calculated and compared with the structural
design criteria established in section 3.1.1. As shown in Table 3.1.4.1, the material
properties of PMMA (Acrylite FF) were referenced from the published product data. The
yield strength is 117 MPa, thus resulting in allowable stress of 58.5 MPa (allowable stress
= yield strength / safety factor of 2) as established in section 3.1.1.
Table 3.1.4.1 Material Properties of TCFS Components
Density g/ cm3
Flexural E-modulus, MPa
Ultimate Tensile Strength, MPa
Yield Flexural Strength, MPa
PMMA (Acrylite FF)
1.19 3300 124 117
From “Physical Properties of Acrylite FF,” by Cyro Industries, 2001, p. 6. (1) A TCFS Panel
The stress of a TCFS panel located at the typical zone (Figure 3.1.2.1) is 2.4 MPa
with a deflection of 16 mm, and the panel located at the corner zone (Figure 3.1.2.1) has
a bending stress of 4.0 MPa and a deflection of 26 mm respectively using the following
equations. Equations 3.1.4.1(a) through (4) describe the stress and deflection calculation
of a TCFS panel at the typical and corner zone.
A. Stress and deflection of a TCFS panel at the typical zone:
σ = S
M= 2.4 MPa < 58.5 MPa Equation 3.1.4.1 (a)
δ = EI
wl
384
5 4
= 16 mm < 19 mm Equation 3.1.4.1 (b)
B. Stress and deflection of a TCFS panel at the corner zone:
σ = S
M= 4.0 MPa < 58.5 MPa Equation 3.1.4.1 (c)
(safety factor of 17 based on the ultimate stress 69 MPa)
δ = EI
wl
384
5 4
= 26 mm ≈ L/165 Equation 3.1.4.1 (d)
Where,

55
M = bending moment calculated by wl2 /8
(typical zone- 9,568575 N-m; corner zone- 15,841,308 N-mm)
S = sectional modulus as noted in Table 3.1.3.1 (= 3,954,661 mm3)
w = uniformly distributed load at typical zone calculated by
wind load (0.9 kPa) multiplied by the width of the TCFS panel
(typical zone- 4.14 N/mm; corner zone: 6.16 N/mm)
l = shorter span of the TCFS panel (= 4300 mm)
E = E-modulus of PMMA (= 3300 MPa)
I = moment of inertia as given in Table 3.1.3.1(= 351,569,448 mm4)
The TCFS panel located at the typical zone meets structural criteria of allowable
stress and deflection. The panel at corner zone resulted in higher deflection (23 mm) than
the established value (19 mm) while the bending stress maintained an allowable stress
level. Table 3.1.4.2 summarizes the comparison of calculated values and established
requirements. Under The horizontal shear stresses at the contact area where the cardboard
core meets the PMMA skin were calculated to be minimal. Shear stress calculations and
experimental results of the shear testing are presented in Appendix E.
Table 3.1.4.2 Summary of Stress and Deflection of a TCFS Typical zone Corner zone Requirements
Stress Deflection Stress Deflection Stress Deflection
TCFS panel
2.4 MPa 16 mm 4.0 MPa 23 mm 58.5 MPa 19 mm
3.1.5 Structural Design Conclusions
A façade system must meet strength and stiffness requirements in order to resist
design loads and provide serviceability. This chapter reviewed the IBC 2003 to establish
the structural design criteria for a TCFS. The design wind loads were determined by the
analytical process described in IBC 2003 and a model of a 10-story office building
enclosed with TCFSs was used to establish the structural design criteria for a TCFS. As a
result, the maximum deflection of a TCFS panel under the wind load is limited to be 19
mm to provide a rigid connection between the edge of a TCFS and the edge spacer frame.
Allowable bending stress of a PMMA skin is estimated to be 58.5 MPa calculated from

56
the allowable stress (119 MPa) divided by the safety factor of 2 according to Baker’s
weighted safety factor. The expected maximum bending stress under wind, however, was
calculated to be 1/17th of the allowable stress (or safety factor of 17) as the deflection
criterion limits the sectional properties of the façade panel rather than the strength
requirement. The deflection of the TCFS at the corner zone, however, deflects slightly
more than the requirements, but it is presumed to be acceptable for visual perception due
to the greater depth to deflection ratio (152 mm: 19 mm).
3.2 Installation of a New Testing Facility
3.2.1 Overview of Testing Facility Design
A new testing facility was designed, fabricated, and installed at the architecture
department of the University of Michigan to evaluate the structural performance of a
TCFS. The primary design intent of the testing frame is to provide two test platforms to
conduct both static and impact tests. The testing frames should also be able to carry out
bending tests for two-edge supported and four-edge supported specimens under static
loads. The design must also consider the rigidity of the testing frame to avoid any
vibration or racking during impact testing. ANSI Z97.1 standards were adopted for the
design of the testing facility.
The vertical static testing apparatus, as shown in Figure 3.2.1.1.(a) consists of two
vertical main frames(A), a specimen holder frame (B), and a loading frame (C). The
vertical main frames (A) have holes along their length to adjust the height of the loading
frame (C). The static loading jack (D) is installed in the middle of the loading frame (C).
The rectangular specimen holder frame (B) can be demounted from the main vertical
frames (A) so it can be placed horizontally for static tests as noted in Figure 3.2.1.1 (a).
The two-edge and four-edge supported specimens can be tested by adding or removing
the shims (E) underneath panels in the specimen holder. The impact testing apparatus as
shown in Figure 3.2.1.1 (b) consists of a main vertical frame (A), a specimen holder (B),
an impactor (F), a traction and release system (G), and a safety screen (H). The specimen
holder (B) is vertically installed within the vertical frames (A), and the impactor (F) is
mounted from the loading frame (C) to simulate a pendulum impact. The traction and
release system (G) is used to precisely operate the impactor at specified drop heights. A

57
removable safety screen (H) made of polycarbonate limit the dispersion of the specimens
under impact testing. Figure 3.2.1.1 illustrates the testing facility used for both static and
impact tests.
Figure 3.2.1.1 Overview of Testing Frames: Static Test Set-Up (a) and Impact Test Set-Up (b)
Specimen holder (C); Horizontal application
Vertical main frame (A); Pre-existing
Static loading jack (D)
Loading frame (B) to install loading jack; Pre-existing
Specimen holder (C); Vertical application
Vertical main frame (A); Pre-existing
Impactor (E) Safety screen (F)
Loading frame (B)
Release and tracking system (G)
(b)
(a)
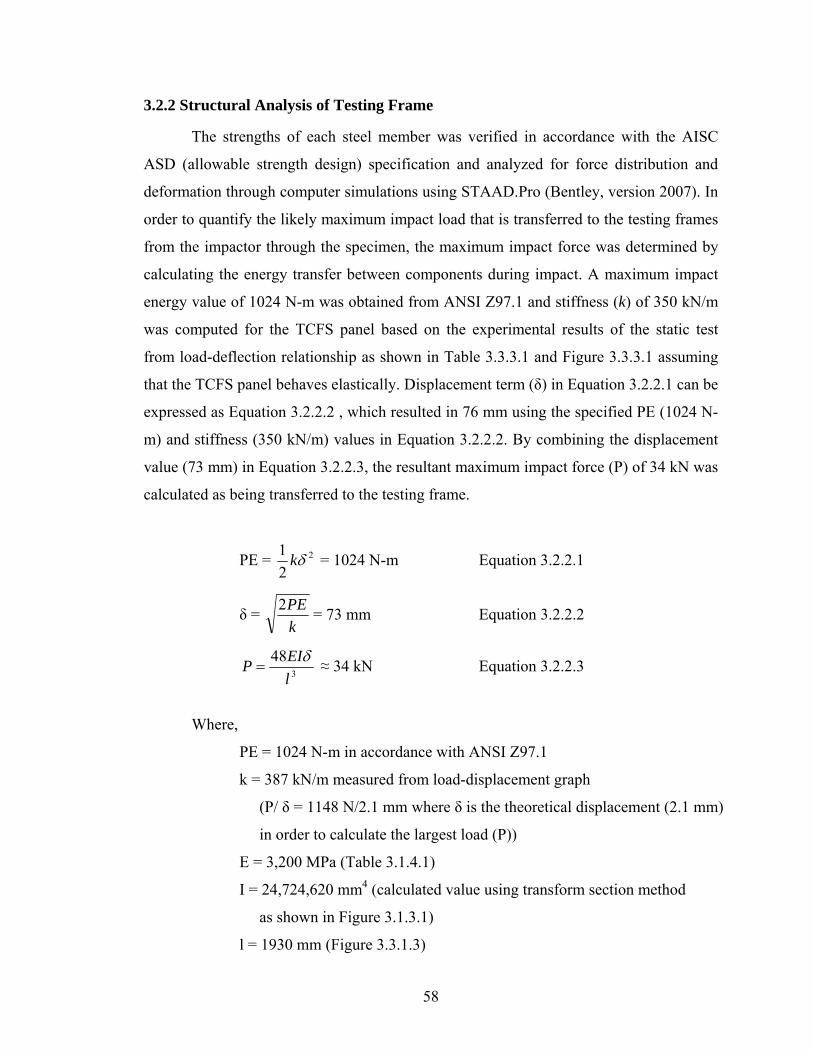
58
3.2.2 Structural Analysis of Testing Frame
The strengths of each steel member was verified in accordance with the AISC
ASD (allowable strength design) specification and analyzed for force distribution and
deformation through computer simulations using STAAD.Pro (Bentley, version 2007). In
order to quantify the likely maximum impact load that is transferred to the testing frames
from the impactor through the specimen, the maximum impact force was determined by
calculating the energy transfer between components during impact. A maximum impact
energy value of 1024 N-m was obtained from ANSI Z97.1 and stiffness (k) of 350 kN/m
was computed for the TCFS panel based on the experimental results of the static test
from load-deflection relationship as shown in Table 3.3.3.1 and Figure 3.3.3.1 assuming
that the TCFS panel behaves elastically. Displacement term (δ) in Equation 3.2.2.1 can be
expressed as Equation 3.2.2.2 , which resulted in 76 mm using the specified PE (1024 N-
m) and stiffness (350 kN/m) values in Equation 3.2.2.2. By combining the displacement
value (73 mm) in Equation 3.2.2.3, the resultant maximum impact force (P) of 34 kN was
calculated as being transferred to the testing frame.
PE = 2
2
1 k = 1024 N-m Equation 3.2.2.1
δ = k
PE2= 73 mm Equation 3.2.2.2
3
48
l
EIP
≈ 34 kN Equation 3.2.2.3
Where,
PE = 1024 N-m in accordance with ANSI Z97.1
k = 387 kN/m measured from load-displacement graph
(P/ δ = 1148 N/2.1 mm where δ is the theoretical displacement (2.1 mm)
in order to calculate the largest load (P))
E = 3,200 MPa (Table 3.1.4.1)
I = 24,724,620 mm4 (calculated value using transform section method
as shown in Figure 3.1.3.1)
l = 1930 mm (Figure 3.3.1.3)

59
(1) Analytical Method using AISC Specification
According to the AISC specification the testing frames are either categorized as
flexural or compressive members depending on their structural behavior. The specimen
holder frames were fabricated from C (channel) and L (angle) shapes. Based on the
width- and height-to-thickness ratios, the flexural members are classified as compact
sections and the compressive members are classified as non-compact sections. Critical
yielding and buckling stresses were calculated in accordance with AISC specification,
and the results indicated that all frame members have no risk of yielding or buckling
under the impact load. The details of the calculation process are presented in Appendix F.
Figure 3.2.2.1 shows the member size of the testing frames.
Figure 3.2.2.1 Sectional Properties of Testing Frames
Vertical Beam
Horizontal Beam
Diagonal column
Horizontal beam (Flexural member)
Vertical beam (Flexural member)
127 mm
50 mm
76 mm
127 mm
Diagonal column (Compressive member)
127 mm
76 mm
6 mm
6 mm
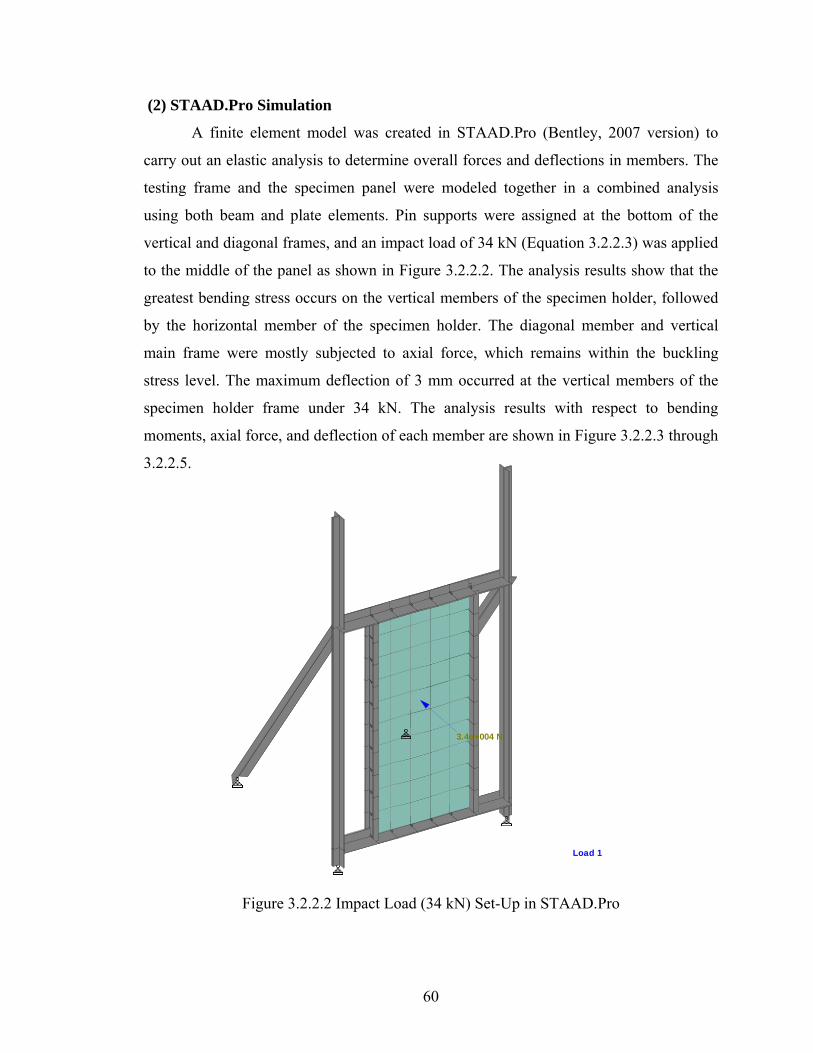
60
3.4e+004 N
Load 1
(2) STAAD.Pro Simulation
A finite element model was created in STAAD.Pro (Bentley, 2007 version) to
carry out an elastic analysis to determine overall forces and deflections in members. The
testing frame and the specimen panel were modeled together in a combined analysis
using both beam and plate elements. Pin supports were assigned at the bottom of the
vertical and diagonal frames, and an impact load of 34 kN (Equation 3.2.2.3) was applied
to the middle of the panel as shown in Figure 3.2.2.2. The analysis results show that the
greatest bending stress occurs on the vertical members of the specimen holder, followed
by the horizontal member of the specimen holder. The diagonal member and vertical
main frame were mostly subjected to axial force, which remains within the buckling
stress level. The maximum deflection of 3 mm occurred at the vertical members of the
specimen holder frame under 34 kN. The analysis results with respect to bending
moments, axial force, and deflection of each member are shown in Figure 3.2.2.3 through
3.2.2.5.
Figure 3.2.2.2 Impact Load (34 kN) Set-Up in STAAD.Pro

61
Bending ZLoad 1 : Bending YLoad 1 :
Axial ForceLoad 1 :
Figure 3.2.2.3 Bending Moment Diagram Under Impact Load
Figure 3.2.2.4 Axial Fore Diagram Under Impact Load

62
Figure 3.2.2.5 Displacement Diagram Under Impact Load
3.2.3 Fabrication of Testing Frame
After an analytical calculation of the testing frames was completed, fabrication
drawings were prepared for the manufacture of the frame members. The fabrication
process included steel procurement, material preparation (cutting, grinding, and welding
of steel), surface protection of steel members (primer and paint application of steel), and
final assembly of the steel frames using bolting. Figure 3.2.3.1 illustrates the fabrication
process of the testing frames.

63
Figure 3.2.3.1 Fabrication Process of Testing Frames
3.2.4 Frame Installation Conclusions
A new testing frame was fabricated and installed in order to carry out static and
impact testing. Prior to fabrication of the frames, ANSI Z97.1 standards were reviewed to
understand the structural requirements of the impact testing frames. Analytical
calculations of the testing frame were performed to access the stresses and displacements
of each member. Analysis results confirmed that the testing frames would withstand the
impact forces during the impact testing with minimum deflections.
Steel Member Preparation
Primer Application
Paint Application
Pre-installation
Final Installation
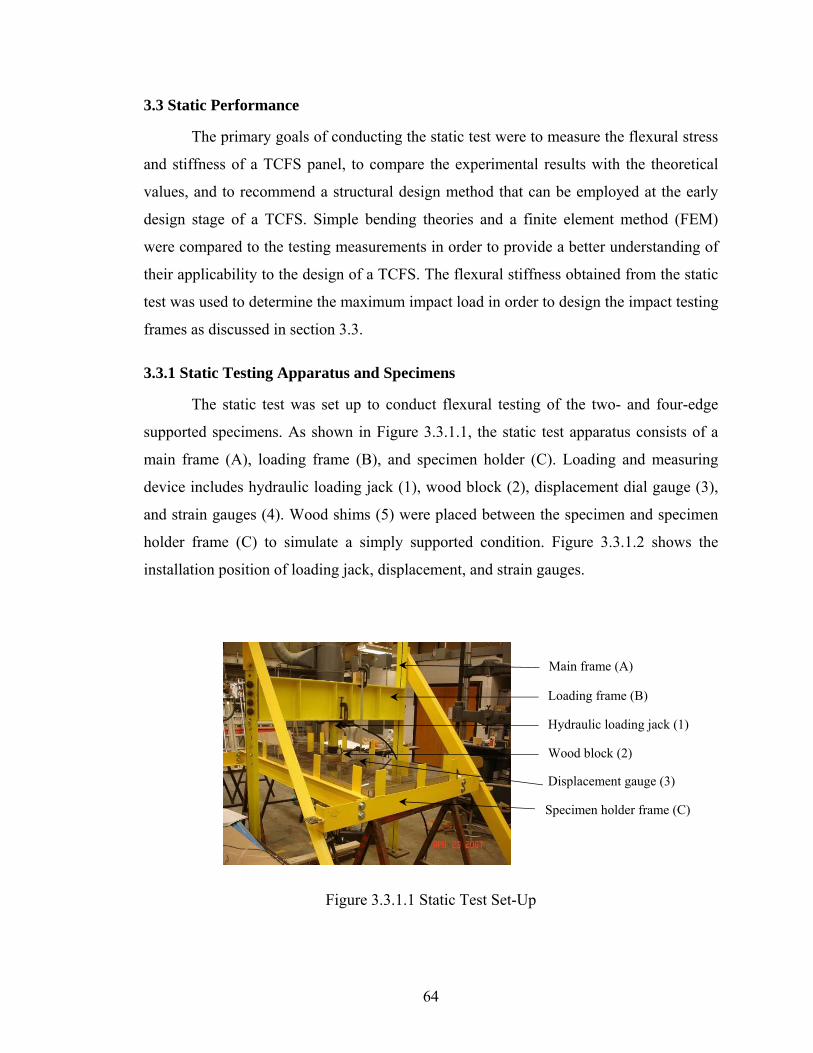
64
3.3 Static Performance
The primary goals of conducting the static test were to measure the flexural stress
and stiffness of a TCFS panel, to compare the experimental results with the theoretical
values, and to recommend a structural design method that can be employed at the early
design stage of a TCFS. Simple bending theories and a finite element method (FEM)
were compared to the testing measurements in order to provide a better understanding of
their applicability to the design of a TCFS. The flexural stiffness obtained from the static
test was used to determine the maximum impact load in order to design the impact testing
frames as discussed in section 3.3.
3.3.1 Static Testing Apparatus and Specimens
The static test was set up to conduct flexural testing of the two- and four-edge
supported specimens. As shown in Figure 3.3.1.1, the static test apparatus consists of a
main frame (A), loading frame (B), and specimen holder (C). Loading and measuring
device includes hydraulic loading jack (1), wood block (2), displacement dial gauge (3),
and strain gauges (4). Wood shims (5) were placed between the specimen and specimen
holder frame (C) to simulate a simply supported condition. Figure 3.3.1.2 shows the
installation position of loading jack, displacement, and strain gauges.
Figure 3.3.1.1 Static Test Set-Up
Loading frame (B)
Hydraulic loading jack (1)
Wood block (2)
Displacement gauge (3)
Main frame (A)
Specimen holder frame (C)

65
Figure 3.3.1.2 Installation Position of Loading Jack and Displacement and Strain Gauges: Top view (a) and bottom view (b)
The size of the specimen was 863 mm x 1930 mm, and they were panels of 6 mm
-thick laminated glass, 6 mm-thick fully tempered glass, and 111 mm-thick TCFS. Wood
shims were used to create different two- or four-edge support variations. Figure 3.3.1.3
shows diagrams of simply supported two- and four-edge conditions and section of edge
details of the specimens.
.
Figure 3.3.1.3 Two-edge (a) and Four-edge (b) Supported Conditions and Edge Support Details: Laminated Glass, Fully Tempered Glass (d), and Transparent
Composite Façade Panel (e)
(a) (b)
Longitudinal strain gauge (4)
Transverse strain gauge (4)
Loading Jack (1) with Wood block (2) (75 mm x75 mm)
Displacement gauge (3)
Supported edge (S)
(a)
(b)
Supported edge
S
S
S
S
(c)
(d)
(e)
Specimen
Specimen
100 mm x 100 mm Wood Block

66
3.3.2 Static Testing Procedure
Preparation for the test began with placing the specimen horizontally in the
specimen holder. Wooden shims were placed between the specimen holder frame and the
edges of the specimen in order to create different boundary conditions as shown in Figure
3.3.1.3. A hydraulic jack was clamped to the horizontal loading frame above the
specimen (Figure 3.3.1.2 (a)), and deflection gauge was positioned at the mid span of the
specimen to measure the flexural deflection at the center of the specimen (Figure 3.3.1.2
(b)). Two strain gauges were vertically and horizontally attached to the center of a
specimen on the tension side to measure longitudinal and transverse strains. A wooden
block (100 mm x 100 mm) was located at the middle of the specimen as a point load and
placed between the hydraulic jack and the specimen to distribute a point load across the
width of the specimen (Figure 3.3.1.3 (c)).
The hydraulic jack applied concentrated loads increments of 0.24 kPa. The
magnitudes of the loads as well as their corresponding deflections and strains were
recorded at each incremental increase in load. The TCFS specimen was first tested with
two- and then with four-edge supported conditions. Next, a sheet of laminated glass was
tested, and then a sheet of tempered glass was tested. The static test on the glass
specimens was limited to a maximum load of 1.7 kN to avoid specimen breakage. Figure
3.3.2.1 shows the static test set-up for the (a) TCFS and (b) laminated glass.
Figure 3.3.2.1 TCFS (a) and Laminated Glass (b) Test Set-Up with Four-Edge Supported Condition
(a) (b)

67
3.3.3 Static Testing Results
(1) TCFS panel with two-edge supported
A flexural test of the two-edge supported TCFS panel was carried out according
to the procedure described in the previous section. Loads of 0.11 kN were applied
incrementally until a maximum load of 1.11 kN was reached. The flexural strains were
recorded at the same intervals and multiplied by the E-modulus of PMMA. The bending
stresses were estimated based on the strain and displacement measurements and
compared with the simple beam theory. The maximum bending stress of the PMMA skin
was measured to be 1.3 MPa based on a longitudinal strain of 400 µm/m using Equation
3.3.3.1. The maximum bending stress using Equation 3.3.3.2 by substituting the
measured displacements resulted in 1.7 MPa. As can be seen from Table 3.3.3.1 and
Figure 3.3.3.1 shows, the measurements and simple beam theory yielded similar bending
stresses.
σ = Ef x ε Equation 3.3.3.1
Where, σ = bending stress (MPa)
Ef = flexural modulus according to the product data (= 3300 MPa)
ε = longitudinal strain from measurements
I
My Equation 3.3.3.2
Where, I = E
Pl
48
3
(substituting δ with the displacement measurements)
Where, P = point load (N)
l = unsupported span of specimen (1930 mm)
E = E-modulus (3300 MPa)
δ = measured displacement
M = bending moment (M = Pl2/4)
y = distance from neural axis to the extreme fiber of a section (55 mm)

68
Table 3.3.3.1 Bending Stress Comparison between Experiment and Simple Beam Theory for a TCFS
Measurements Bending Stress (kPa)
Load (N) Longitudinal Strain (mm/mm)
Displacement (mm)
Based on the strain gauge
measurements using Eq. 3.3.3.1
Based on the displacement
measurements using Eq. 3.3.3.2
Simple beam theory
using Eq. 3.1.4.1.(c)
115 0.000038 0.20 124 120 117 230 0.000077 0.51 255 300 235 345 0.000115 0.81 381 480 352 460 0.000253 1.12 836 659 470 575 0.000200 1.45 662 854 587 690 0.000235 1.75 778 1034 704 805 0.000275 2.06 910 1214 822 920 0.000318 2.34 1051 1379 939 1035 0.000357 2.59 1182 1529 1057 1150 0.000400 2.95 1324 1744 1174
Figure 3.3.3.1 Bending Stresses Comparison between Experiment and Simple Beam Theory for a TCFS
Displacements were calculated using the curvature of radius (ρ) and displacement
(δ) relationship in a simple beam using Equation 3.3.3.3 by substituting the measured
strains (Gere, 2007, p. 308). The corresponding maximum deflection by the
measurements and simple beam theory was approximately 3 mm respectively. As noted
in Table 3.3.3.2 and Figure 3.3.3.3, the measured and calculated displacements show
agreement. The flexural stiffness of the TCFS panel was 350 N/mm, which was obtained
0200400600800
100012001400160018002000
0 500 1000 1500
load (N)
bend
ing
stre
ss (
kPa) Based on strain
measurement
Based on deflectionmeasurement
Simple beam theory

69
from the linear load-deflection relationship based on experiment results (third column in
Table 3.3.3.2).
δ = ρ (1-cos θ) Equation 3.3.3.3
Where, δ = displacement (mm)
ρ = radius of curvature = y/ε (substituting ε with the strain measurements)
Sin θ = L/2/ ρ (where L = 1930 mm)
Figure 3.3.3.2 Radius of Curvature (ρ) and Displacement (δ) in Pure Bending of a Simple Beam
From “Mechanics of Materials,” by Gere, 2006, p. 308.
Table 3.3.3.2 Displacement Comparison between Experiment and Simple Beam Theory for a TCFS
Measurements Displacement (mm)
Load (N) Longitudinal Strain (mm/mm)
Displacement (mm)
Based on the strain gauge
measurements using Eq. 3.3.3.1.(c)
Based on the displacement
measurements
Simple beam theory
using Eq. 3.1.4.1.(d)
115 0.000038 0.20 0.32 0.20 0.21 230 0.000077 0.51 0.62 0.51 0.42 345 0.000115 0.81 0.93 0.81 0.63 460 0.000253 1.12 0.75 1.12 0.84 575 0.000200 1.45 1.48 1.45 1.05 690 0.000235 1.75 1.82 1.75 1.26 805 0.000275 2.06 2.12 2.06 1.47 920 0.000318 2.34 2.398 2.34 1.68 1035 0.000357 2.59 2.698 2.59 1.89 1150 0.000400 2.95 2.98 2.95 2.10
O
θθ ρ ρ
δ

70
Figure 3.3.3.3 Displacement Comparison between Experiment and Simple Beam Theory for a TCFS
(2) Glass specimens with four-edge supported
Under the flexural test of the four-edge supported specimens, 0.11 kN (25 lb) load
increments were applied until the maximum load of 2.1 kN was reached. The test on the
laminated glass was stopped at a safety factor of 2 to keep stress below the allowable
stress level to avoid breakage and weakening of the glass. Bending stress and
displacement of laminated glass are compared between the experimental measurement
and theoretical prediction using simple plate theory (Young & Budynas, 2002, p.502). As
noted in Table 3.3.3.3 and Figure 3.3.3.4, the bending stress determined based on the
strain measurements (using Equation 3.3.3.1) showed agreement with the calculated
stress using Equation 3.3.3.3. Both measured and calculated displacement (using
Equation 3.3.3.4) yielded similar results (Table 3.3.3.4 and Figure 3.3.3.5). The
maximum bending stress under the applied load of 445 N was 20 MPa, which is below
the specified allowable stress (ASTM E1300, 2007, p. 2), and the corresponding
displacement was 5 mm.
2t
W Equation 3.3.3.3
3
2
Et
Wb Equation 3.3.3.4
Where, β = 1.59 from Table 26.1c (Young & Budynas, 2002, p.502)
0.00
0.50
1.00
1.50
2.00
2.50
3.00
3.50
0 500 1000 1500
load (N)
disp
lace
men
t (m
m) Based on strain
measurement
Based on displacementmeasurement (mm)
Simple beam theory

71
α = 0.18 from Table 26.1b (Young & Budynas, 2002, p.502)
W = applied load as shown in Table 3.3.3.3
E = 70,000 MPa (glass); 3,200 MPa (PMMA) as given in Table 2.2.1.1
b = shorter span of 864 mm
t = 5.9 mm for laminated glass due to the semi-composite action due to
laminated interlayer; 6.4 mm for fully tempered glass; 70 mm for a TCFS
calculated based on moment of inertia given in Table 3.1.3.1 (I = bt3/12)
Table 3.3.3.3 Bending Stress Comparison between Experiment and Simple Plate Theory for Laminated Glass
Measurements Bending Stress (MPa)
Load (N) Longitudinal Strain (mm/mm)
Transverse Strain (mm/mm)
Based on the strain gauge measurements
using Eq. 3.3.3.1
Based on simple plate
theory using Eq. 3.3.3.2
Allowable stress of heat strengthened
glass according to ASTM E
1300
44 0.000020 0.000041 1 2 89 0.000050 0.000057 4 4
133 0.000075 0.000073 5 6 178 0.000100 0.000089 7 8 222 0.000126 0.000105 9 10 52 267 0.000153 0.000123 11 12 311 0.000180 0.000143 13 14 356 0.000203 0.000160 14 16 400 0.000228 0.000175 16 18 445 0.000253 0.000193 18 20
Figure 3.3.3.4 Bending Stress Comparison between Experiment and Simple Plate Theory for Laminated Glass
0.00
1.00
2.00
3.00
4.00
5.00
6.00
0 50 100 150 200 250 300 350 400 450 loads (N)
disp
lace
men
t (m
m)
Displacementmeasurement
Simple platetheory

72
Table 3.3.3.4 Displacement Comparison between Experiment and Simple Beam Theory for Laminated Glass
Displacements (mm)
Load (N) Measurement Simple plate theory
44 0.20 0.42 89 0.71 0.84 133 1.37 1.26 178 1.93 1.68 222 2.54 2.10 267 3.07 2.52 311 3.63 2.94 356 4.06 3.36 400 4.55 3.78 445 5.03 4.20
Figure 3.3.3.5 Displacement Comparison between Experiment and Simple Plate Theory for Laminated Glass
Since the higher bending stress occurred along the shorter span, only transverse
strains of fully tempered glass were measured as shown in Table 3.3.3.5. As indicated in
Tables 3.3.3.5 and 3.3.3.6 and Figures 3.3.3.6 and 3.3.3.7, both the bending stress and
displacement yielded similar results between experiment and theoretical calculation. The
maximum bending stress of fully tempered glass under the final load was 18 MPa with
the corresponding deflection of 4 mm.

73
Table 3.3.3.5 Bending Stress Comparison between Experiment and Simple Plate Theory for Fully Tempered Glass
Measurements Bending Stress (MPa)
Load (N) Longitudinal Strain (mm/mm)
Transverse Strain (mm/mm)
Based on the strain gauge
measurements using Eq. 3.3.3.1
Based on simple plate theory using Eq. 3.3.3.2
Allowable stress of fully tempered glass according
to ASTM E 1300
44 - 0.000020 1 2 89 - 0.000045 3 4
133 - 0.000065 5 5 178 - 0.000090 6 7 222 - 0.000113 8 9 10.4 267 - 0.000138 10 11 311 - 0.000158 11 12 356 - 0.000180 13 14 400 - 0.000203 14 16 445 - 0.000226 16 18
Figure 3.3.3.6 Bending Stress Comparison between Experiment and Simple Plate Theory for Fully Tempered Glass
0
5
10
15
20
0 50 100 150 200 250 300 350 400 450 loads (N)
Ben
ding
Str
ess
(MPa
)
Based on strainmeasurement
Simple platetheory

74
Table 3.3.3.6 Displacement Comparison between Experiment and Simple Beam Theory for Fully Tempered Glass
Displacements (mm) Load (N)
Measurement Simple plate theory 44 0.38 0.34 89 0.86 0.68 133 1.35 1.03 178 1.75 1.37 222 2.16 1.71 267 2.59 2.05 311 3.02 2.39 356 3.43 2.74 400 3.81 3.08 445 4.27 3.42
Figure 3.3.3.7 Displacement Comparison between Experiment and Simple Plate Theory for Fully Tempered Glass
(3) TCFS panel with four-edge supported
The static test of a TCFS panel with four-edge supported showed that the bending
stress and deflection of the TCFS panel were far less than of the glass panels at the given
load. The four-edge supported TCFS panel yielded much less bending stress and
deflection compared to the two-edge supported TCFS. The tests also revealed that the
flexural stiffness of the four-edge supported TCFS panel is around 700 kN/m, which is
2.5 times stiffer than the two-side supported TCFS (387 kN/m) as shown in Figure
3.3.3.7. The theoretical predictions using simple plate theory and experimental
measurements of the four-edge supported TCFS were compared as shown in Figure
3.3.3.7. Theoretical values of bending stress and deflection of the TCFS panel were
computed using simple plate theory, and compared with the experimental measurements.
0.00
1.00
2.00
3.00
4.00
5.00
0 50 100 150 200 250 300 350 400 450 loads (N)
disp
lace
men
t (m
m)
Displacementmeasurement
Simple platetheory

75
The comparison indicated that the modified plate theory predicted less bending stress and
deflection compared to the measurements. This was due to the fact that the open cell
structure of the TCFS core reduced the torsional stiffness that weakened the bending
stiffness (Figure 3.3.3.8 (a)). The PMMA skin was likely subjected to the shear lag and
the effective widths of the PMMA skin undermined the shear stiffness, resulting in the
greater bending deformation (Figure 3.3.3.8 (b)). It is also postulated that the microscopic
material failure at bonding area between the cardboard core and PMMA skin may cause
semi-composite action that reduces the bending stiffness (Figure 3.3.3.8 (c)). The groove
cut on the PMMA skin and notches of the cardboard core may result in reduction in
bending stiffness due to the reduced sectional stiffness (Figure 3.3.3.8 (d)).
By considering these factors, a modified simple design equation was derived to
estimate the strength and stiffness of the TCFS panel. Adjustment factors were computed
by substituting measurement values to theoretical calculations. Equation 3.3.3.5 and
3.3.3.6 shows a modified equation with the adjustment factors of A and B. As can be seen
Table 3.3.3.7 and Figure 3.3.3.9 and Figure 3.3.3.10, close agreement was observed
between the experimental data and the predicted values using modified equations.
2t
WB Equation 3.3.3.5
3
2
Et
Wb Equation 3.3.3.6
Where, B = stress adjustment factor of 2.7
β = 1.59 from Table 26.1c (Young & Budynas, 2002, p.502)
A = deflection adjustment factor of 7.15
α = 0.18 from Table 26.1b (Young & Budynas, 2002, p.502)
W = applied load as shown in Table 3.3.3.7
E = 3,300 MPa (PMMA) as given in Table 2.2.1.1
b = shorter span of 864 mm
t = 70 mm based on moment of inertia given in Table 3.1.3.1
(I = bt3/12, t = (1/3) √ (12I/b), where I is given in Table 3.1.3.1)

76
Figure 3.3.3.8 Structural Properties of TCFS that Affects Bending Stiffnesss: Torsional Stiffness (a), Shear Lag (b), Non-Composite Action (c),
and Reduced Sectional Stiffness (d)
Notches
Groove cuts on PMMA skin
Microscopic joint failure
Effective width for shear stress in TCFS section
(a)
(b)
(c)
(d)
Greater deflection due to semi-composite action resulted from microscopic joint failure
Shear stress distribution according to simple theory

77
Table 3.3.3.7 Bending Stress Comparisons between Experiment and Simple Plate Theory for a TCFS Panel
Measurements Bending Stress (MPa)
Load (N) Longitudinal
Strain (mm/mm) Transverse
Strain (mm/mm)
Based on the strain gauge
measurements using Eq. 3.3.3.1
Based on adjusted simple
plate theory using Eq. 3.3.3.5
Based on simple plate
theory using Eq. 3.3.3.3
230 0.0000050 0.0000255 0.08 0.20 0.07 345 0.0000075 0.0000425 0.14 0.30 0.11 460 0.0000175 0.0000900 0.30 0.40 0.15 575 0.0000225 0.0001450 0.48 0.50 0.19 690 0.0000300 0.0001950 0.64 0.60 0.22 805 0.0000400 0.0002370 0.78 0.70 0.26 920 0.0000500 0.0002650 0.87 0.80 0.30 1035 0.0000600 0.0003000 0.99 0.90 0.34 1150 0.0000725 0.0003300 1.09 1.00 0.37 1265 0.0000850 0.0003570 1.18 1.10 0.41 1380 0.0000975 0.0003875 1.28 1.20 0.45 1495 0.0001100 0.0004150 1.37 1.31 0.48 1610 0.0001250 0.0004420 1.46 1.41 0.52 1725 0.0001420 0.0004700 1.55 1.51 0.56 1840 0.0001550 0.0004950 1.63 1.61 0.60 1955 0.0001875 0.0005150 1.70 1.71 0.63 2070 0.0002200 0.0005350 1.77 1.81 0.67
Figure 3.3.3.9 Bending Stress Comparisons between Experiment and Simple Plate Theory for a TCFS Panel
0.00
0.20
0.40
0.60
0.80
1.00
1.20
1.40
1.60
1.80
2.00
0 500 1000 1500 2000 2500 load (N)
stre
ss (
MP
a) Strain measurement
Adjusted plate theory
Simple plate theory

78
Table 3.3.3.8 Displacement Comparisons between Experiment and Simple Beam Theory for a TCFS Panel
Displacements (mm)
Load (N) Measurement
Adjusted simple theory using Eq. 3.3.3.6
Simple plate theory using Eq. 3.3.3.2
230 0.08 0.23 0.03 345 0.13 0.34 0.05 460 0.28 0.46 0.06 575 0.43 0.57 0.08 690 0.56 0.69 0.10 805 0.69 0.80 0.11 920 0.81 0.92 0.13 1035 0.94 1.03 0.14 1150 1.09 1.15 0.16 1265 1.19 1.26 0.18 1380 1.35 1.38 0.19 1495 1.45 1.49 0.21 1610 1.57 1.61 0.22 1725 1.70 1.72 0.24 1840 1.85 1.84 0.26 1955 1.97 1.95 0.27 2070 2.08 2.07 0.29
Figure 3.3.3.10 Displacement Comparisons between Experiment and Simple Plate Theory for a TCFS Panel
0
0.5
1
1.5
2
2.5
0 500 1000 1500 2000 2500load (N)
disp
lace
men
t (m
m)
DisplacementmeasurementAdjusted simpleplate theorySimple plate theory

79
3.3.4 Finite Element Analysis
One of the primary goals of this research was to establish a general structural
design guideline for a TCFS by analytically and experimentally investigating its
structural performance. It has been shown from the experiments in Section 3.3.3 that the
simple plate theory requires adjustment to account for the effects of the open cell core
structures in a TCFS. Therefore, this section focuses on using a finite element method to
define load-deformation behaviors of a TCFS under static loads, which take into account
the effects of open cell geometry. These results are then compared with the experimental
data. A numerical study was conducted using STAAD.Pro (version 2007), a general
purpose finite element method (FEM) software. A simple finite model set-up for both a
simple beam and a plate is described in Figure 3.3.4.1. The size of the TCFS is 864 mm x
1930 mm x 106 mm, and the PMMA skin and cardboard core are 5 mm thick and 3 mm
thick respectively. The skin and core was modeled with plate elements in STAAD.Pro,
and the mesh was sized to approximately 25 mm x 25 mm. The boundary conditions
consisted of a pin support and a roller support. The pin support was assigned at one
shorter edge of the TCFS, restraining the following degree of freedom (DOF): UX = UY =
UZ = 0, where U is the transitional displacement about the respective axis. The roller
support was used at the other shorter edge of the pin support, restraining UY = UZ = 0.
For the four-edge supported TCFS, the roller support restraining UZ = 0 was used along
the longer sides of the TCFS. The two-edge and four-edge supported TCFS were loaded
at midspan with a magnitude of 1150 N and 2070 N respectively over a patch area of 75
mm by 75 mm, and the load was increased by 115 N to be consistent with the
experiments of the two-edge and four-edge supported TCFSs.
The material properties of the PMMA skin were obtained from the product data of
Acrylite FF provided by CYRO Industries. The E-modulus of the cardboard core was
measured from the tensile tests performed by the researcher. The Poisson’s ratio of the
cardboard is assumed to be 0.35, and the shear modulus was calculated using the equation:
G = E/2(1+ ν). Table 3.3.4.1 shows the material properties used in the FEM analysis.
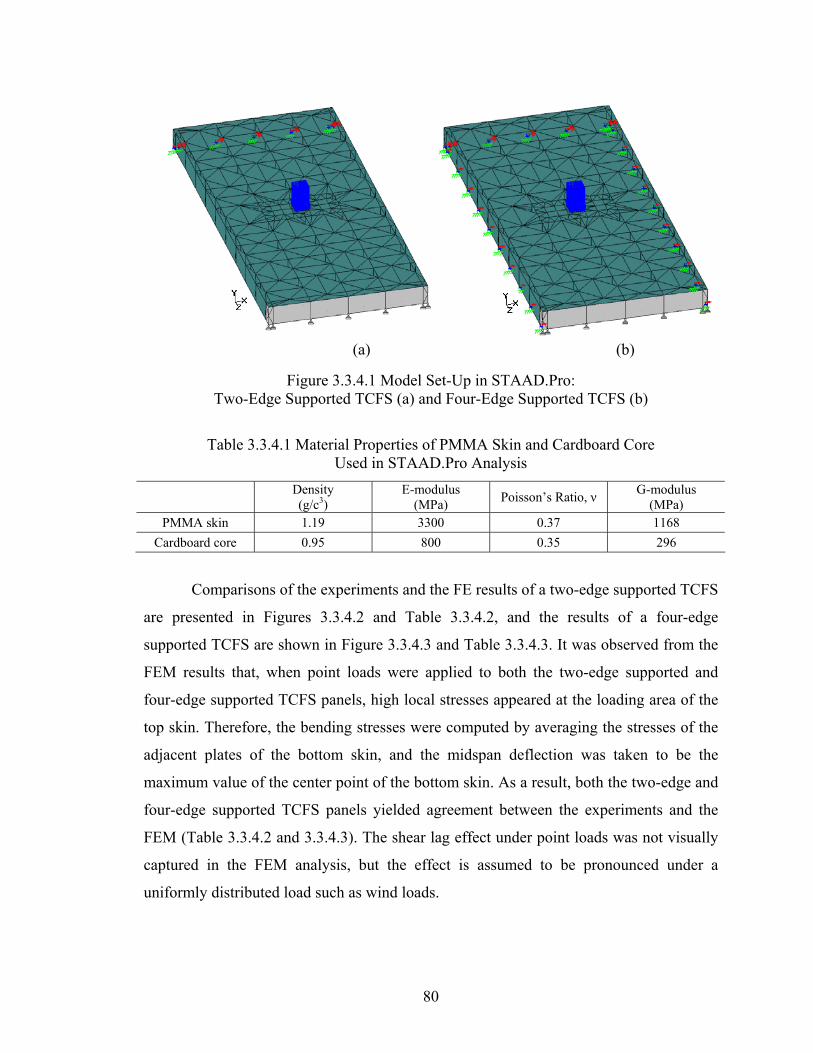
80
Figure 3.3.4.1 Model Set-Up in STAAD.Pro: Two-Edge Supported TCFS (a) and Four-Edge Supported TCFS (b)
Table 3.3.4.1 Material Properties of PMMA Skin and Cardboard Core Used in STAAD.Pro Analysis
Density (g/c3)
E-modulus (MPa)
Poisson’s Ratio, ν G-modulus
(MPa) PMMA skin 1.19 3300 0.37 1168
Cardboard core 0.95 800 0.35 296
Comparisons of the experiments and the FE results of a two-edge supported TCFS
are presented in Figures 3.3.4.2 and Table 3.3.4.2, and the results of a four-edge
supported TCFS are shown in Figure 3.3.4.3 and Table 3.3.4.3. It was observed from the
FEM results that, when point loads were applied to both the two-edge supported and
four-edge supported TCFS panels, high local stresses appeared at the loading area of the
top skin. Therefore, the bending stresses were computed by averaging the stresses of the
adjacent plates of the bottom skin, and the midspan deflection was taken to be the
maximum value of the center point of the bottom skin. As a result, both the two-edge and
four-edge supported TCFS panels yielded agreement between the experiments and the
FEM (Table 3.3.4.2 and 3.3.4.3). The shear lag effect under point loads was not visually
captured in the FEM analysis, but the effect is assumed to be pronounced under a
uniformly distributed load such as wind loads.
(a) (b)

81
Figure 3.3.4.2 STAAD.Pro Results of a Two-Edge Supported TCFS; Principal Stress Distribution (a) and Displacement (b)
Table 3.3.4.2 Stress and Displacement Comparisons between Experiment and FEM for a Two-Edge Supported TCFS Panel
Bending Stress
(MPa) Displacement
(mm) Load (N) Experiment STAAD. Pro Experiment STAAD. Pro
115 0.25 0.26 0.61 0.61 230 0.38 0.39 0.89 0.91 345 0.50 0.51 1.19 1.22 460 0.66 0.65 1.52 1.52 575 0.78 0.79 1.83 1.83 690 0.91 0.92 2.16 2.13 805 1.05 1.05 2.49 2.41 920 1.18 1.19 2.77 2.72
1035 1.32 1.32 3.12 3.02
(a)
(b)

82
Figure 3.3.4.3 STAAD.Pro Results of a Four-Edge Supported TCFS; Displacement (a), Principal Stress on the Top Skin (b) and Principal Stress on the Bottom Skin (c)
(a)
(b) (c)

83
Table 3.3.4.3 Stress and Displacement Comparisons between Experiment and FEM for a Four-Edge Supported TCFS Panel
Figure 3.3.4.4 Stress (a) and Displacement (b) Comparisons between Experiment and FEM for a Four-Edge Supported TCFS Panel
Bending Stress
(MPa) Displacement
(mm) Load (N) Experiment STAAD. Pro Experiment STAAD. Pro
230 0.08 0.20 0.08 0.23 345 0.14 0.31 0.13 0.34 460 0.30 0.41 0.28 0.46 575 0.48 0.51 0.43 0.57 690 0.64 0.62 0.56 0.69 805 0.78 0.72 0.69 0.80 920 0.87 0.82 0.81 0.91
1035 0.99 0.92 0.94 1.03 1150 1.09 1.02 1.09 1.14 1265 1.18 1.13 1.19 1.26 1380 1.28 1.23 1.35 1.37 1495 1.37 1.33 1.45 1.47 1610 1.46 1.43 1.57 1.57 1725 1.55 1.54 1.70 1.69 1840 1.63 1.64 1.85 1.80 1955 1.70 1.74 1.97 1.92 2070 1.77 1.85 2.08 2.03
0.0
0.5
1.0
1.5
2.0
0 500 1000 1500 2000 2500Load (N)
Ben
ding
Str
ess
(Mpa
) Strainmeasurement
FEM
0.0
0.5
1.0
1.5
2.0
2.5
0 500 1000 1500 2000 2500Load (N)
Dis
plac
emen
t (m
m)
Displacementmeasurement
FEM

84
3.3.5 Static Performance Evaluation Conclusion
A simplified analytical method that could be used in the pre-design phase of a
TCFS was investigated and compared to the empirical measurements. The two-edge
supported bending test revealed the accuracy of simple beam theory, and the composite
section method was used to calculate the sectional properties of the TCFS. For the four-
edge supported TCFS, the theoretical values calculated from simple plate theory
predicted that the panel was stiffer than the empirical measurements showed. Modified
simple plate equations were established by taking into consideration the two-way
stiffness and open cell geometry of the TCFS panel. It is postulated that the open cell
structure of the cardboard core reduces the torsional stiffness and shear lag effect that
undermines the overall bending stiffness thus increasing the bending stiffness. The
adjustment factors that were applied to the simple plate equations considered these
aspects, and their validity was confirmed based on the experimental measurements. As a
result, the modified simple plate theory was in agreement with the experimental
measurements. However, these modified equations may be applicable to design a TCFS
panel that contains similar aspect ratios and open cell geometries of the studied TCFS
panel. A FEM was carried out to evaluate its accuracy by validating against the
experimental results, and the results showed agreement with the testing data. It can be
concluded that simple beam theory and FEM analysis are suitable for the structural
design of a TCFS, and further research on extensive tests is recommended to provide a
reliable plate theory that can be used for different open cell geometries and types of a
TCFS panel.

85
3.4 Impact Performance Evaluation
According to the ANSI Z97.1 standard, safety glazing materials refer to laminated
glass, tempered glass, organic coated glass, plastic glazing, and fire resistant wired glass.
Plastic glazing material include single sheets of plastic, laminated plastic, and fiber
reinforced plastic. These materials provide safety properties that “reduce or minimize the
likelihood of cutting and piercing injuries when the glazing materials are broken by
human contact” (ANSI, 2004, p. 11). However, compositions of geometric and material
variations within composite panels made from plastic skins and biofiber composite cores
are not contained within any ANSI Z97.1 category, therefore this research includes a
procedure for testing and evaluating composite panels that aligns with the methods
specified in ANSI Z97.1. The purpose of this procedure is to quantify the impact
behavior of a TCFS panel, by establishing an equivalent safety glazing classification to
ANSI Z97.1, and to provide recommendations for enhanced impact resistance, based on
the results of the impact tests.
3.4.1 Impact Testing Apparatus and Specimens
The impact testing apparatus consists of a main frame (A), a loading frame (B), a
specimen holder frame (C), an impactor (D), a traction and release system (E), and a
safety screen (F) as shown in Figure 3.4.1.1. The testing frame utilized L5 x 3x 1/4 and
C5 x 6.7 to provide the required strength and stiffness called for “steel angles 3 inches by
5 inches by 0.25 inches or other sections and materials of equal or greater rigidity” in
ANSI Z97.1 specification. The specimen holder frame (C) which was made from steel
angles and channels, was installed vertically into the main frame (A). Clamping plates
(C1) were intermittently welded to the specimen holder frame (C) every 457 mm in order
to hold the specimen firmly in place against the frame. A 100 lb shot-bag impactor was
manufactured according to clause “the leather bag shall be filled with lead shot of 2.4 ±
0.1 mm diameter and the exterior surface shall be completely covered with glass filament
reinforced pressure sensitive polyester adhesive tape” of ANSI Z97.1. The impactor was
suspended from the loading frame (B) using an 1828 mm long cable (G), which was able
to attain a maximum drop height of 1,220 mm. The underside of the impactor was tied to
a polyester rope, and the rope was drawn over a pulley at the top of a wood frame. This
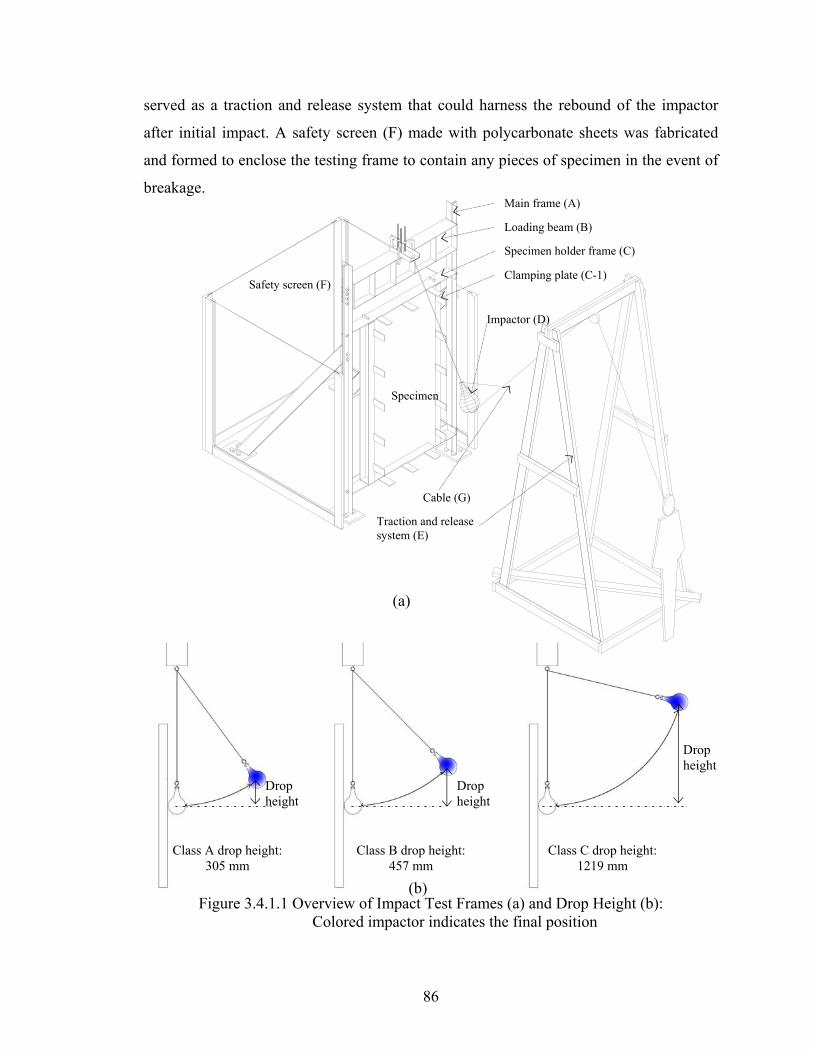
86
served as a traction and release system that could harness the rebound of the impactor
after initial impact. A safety screen (F) made with polycarbonate sheets was fabricated
and formed to enclose the testing frame to contain any pieces of specimen in the event of
breakage.
Figure 3.4.1.1 Overview of Impact Test Frames (a) and Drop Height (b): Colored impactor indicates the final position
(b)
Class A drop height: 305 mm
Class B drop height: 457 mm
Class C drop height: 1219 mm
Drop height
Drop height
Drop height
Specimen holder frame (C)
Main frame (A)
Impactor (D)
Safety screen (F)
Specimen
Loading beam (B)
Clamping plate (C-1)
Cable (G)
Traction and release system (E)
(a)
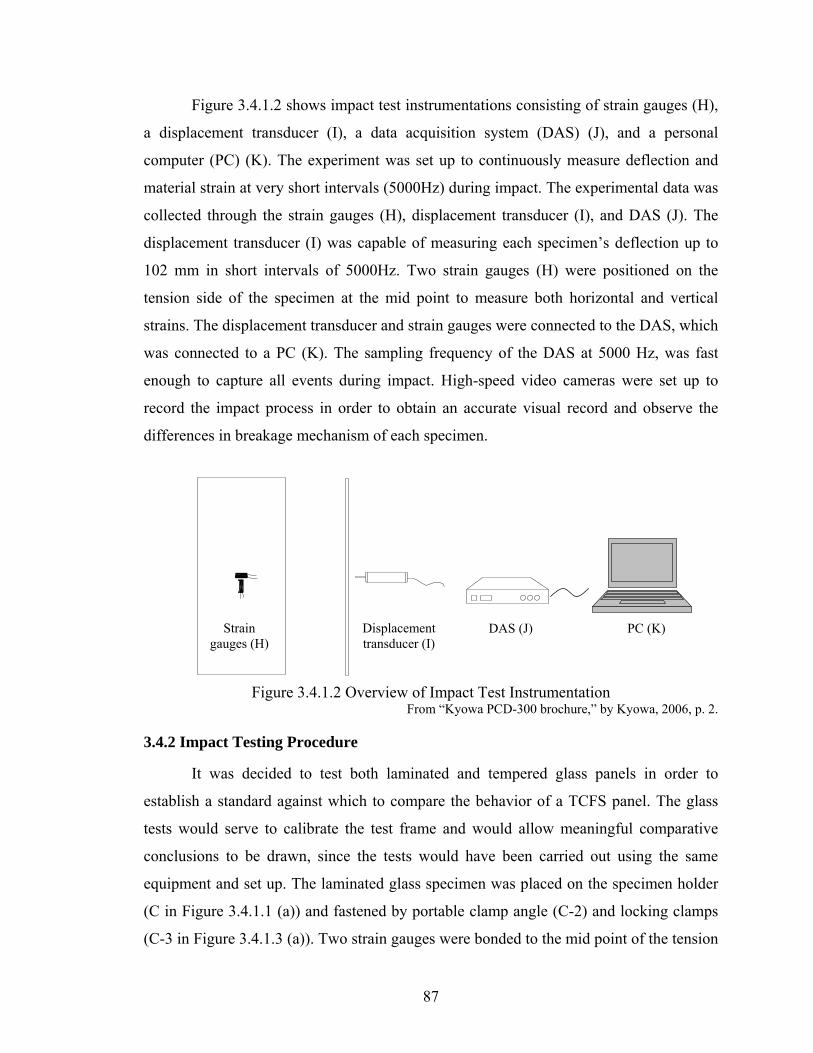
87
Figure 3.4.1.2 shows impact test instrumentations consisting of strain gauges (H),
a displacement transducer (I), a data acquisition system (DAS) (J), and a personal
computer (PC) (K). The experiment was set up to continuously measure deflection and
material strain at very short intervals (5000Hz) during impact. The experimental data was
collected through the strain gauges (H), displacement transducer (I), and DAS (J). The
displacement transducer (I) was capable of measuring each specimen’s deflection up to
102 mm in short intervals of 5000Hz. Two strain gauges (H) were positioned on the
tension side of the specimen at the mid point to measure both horizontal and vertical
strains. The displacement transducer and strain gauges were connected to the DAS, which
was connected to a PC (K). The sampling frequency of the DAS at 5000 Hz, was fast
enough to capture all events during impact. High-speed video cameras were set up to
record the impact process in order to obtain an accurate visual record and observe the
differences in breakage mechanism of each specimen.
Figure 3.4.1.2 Overview of Impact Test Instrumentation From “Kyowa PCD-300 brochure,” by Kyowa, 2006, p. 2.
3.4.2 Impact Testing Procedure
It was decided to test both laminated and tempered glass panels in order to
establish a standard against which to compare the behavior of a TCFS panel. The glass
tests would serve to calibrate the test frame and would allow meaningful comparative
conclusions to be drawn, since the tests would have been carried out using the same
equipment and set up. The laminated glass specimen was placed on the specimen holder
(C in Figure 3.4.1.1 (a)) and fastened by portable clamp angle (C-2) and locking clamps
(C-3 in Figure 3.4.1.3 (a)). Two strain gauges were bonded to the mid point of the tension
Strain gauges (H)
Displacement transducer (I)
DAS (J) PC (K)

88
side and the displacement transducer was installed at the mid span of the compression
side, which were connected to the DAS and computer (Figure 3.4.1.2). The shot-bag
impactor, suspended from the loading frame, was pulled up to the required drop height
and locked until the DAS was activated. The impactor was released and at the same time
the DAS was activated. After completion of the impact test on the laminated glass, the
tempered glass was tested following the same procedure. The breakage modes of the
laminated and fully tempered glass panels confirmed that the testing frame yielded
accurate impact results, and therefore, the calibration process was completed. The TCFS
specimen was then placed in the specimen holder frame and locked with the clamp angles.
Two strain gauges and the displacement transducer was installed at the mid point of the
TCFS panel and connected to the DAS and computer. The impactor was released from
the drop height of 457 mm and strains and displacements were recorded. Photographs and
video recordings were taken to document the breakage modes and impact behaviors of
the TCFS and glass samples. Figure 3.4.2.1 illustrates the impact test set-up for the
tempered glass and TCFS samples.
Figure 3.4.2.1 Impact Test Set-Up: Fully Tempered Glass (a) and TCFS (b)
(a) (b)

89
3.4.3 Impact Testing Results
Both the laminated and tempered glass failed the impact test at the initial drop
height of 457 mm and the breakage modes of the laminated and fully tempered glass
were verified according to the ANSI Z97.1 specification.
(1) Glass Specimens
Laminated Glass: A drop height of 305 mm caused small cracks in the laminated glass
(Figure 3.4.3.1 (a)). The test was repeated at a drop height of 457 mm and the cracks
became more fully extended, although the specimen did not collapse and remained intact
because of its polymer interlayer (Figure 3.4.3.1 (b)). The maximum displacement under
the drop height of 305 mm was approximately 2.8 mm at 0.04 s and the displacement
returned to zero after impact (Figure 3.4.3.2 (a)). The maximum displacement under the
drop height of 457 mm was measured to be 55 mm at 0.07 s and the permanent
displacement of 4.8 mm was recorded after impact (Figure 3.4.3.2 (a)). The strain gauges
on the tension side of the laminated glass were broken by glass cracks upon impact and
thus the strain was not accurately recorded (Figure 3.4.3.2 (b)). Figure 3.4.3.1 shows the
post breakage mode of the laminated glass at a drop height of 305 mm and 457 mm and
Figure 3.4.3.2 shows a displacement versus time history.

90
+
Figure 3.4.3.1 Breakage Modes of Laminated Glass at the Drop Height of 305 mm (a) and 457 mm (b)
305 mm
(b)
457 mm
(a)

91
Figure 3.4.3.2 Displacement (a) and Strain (b) Output of Laminated Glass
time (seconds)
stra
in (µ
m/m
)
stra
in (µ
m/m
)
-1000
0
1000
2000
3000
4000
5000
6000
0 0.5 1 1.5 2
stra
in (µ
m/m
)
time (seconds)
-1000
0
1000
2000
3000
4000
5000
6000
0 0.5 1 1.5 2
time (seconds)
-10
0
10
20
30
40
50
60
0 0.5 1 1.5 2
disp
lace
men
t (m
m)
305 mm drop height457 mm drop height
(a)
(b)

92
B. Tempered Glass
Unlike the laminated glass sample, the tempered glass did not fail under the first
impact at a height of 457 mm (Figure 3.4.3.3 (a)), but it failed upon the second impact
from a lesser height (Figure 3.4.3.3 (b)). The specimen mostly broke into small granules,
but some pieces formed bigger shards (Figure 3.4.3.5). The peak deflection measured was
54 mm (2 1/8 inch) at 0.07 s, and the strain recorded upon first impact and second impact
was 2800 μm/m and 5100 μm/m respectively. Figure 3.4.3.3 and 3.4.3.4 depicts the post
breakage patterns of the tempered glass and its dynamic displacement and strain outputs.
Figure 3.4.3.3 Breakage Modes of Fully Tempered Glass: First Impact at the Drop Height of 457 mm (a) and Second Impact at the Reduced Drop Height (b)
457 mm
Lesser height than 457 mm
(a)
(b)
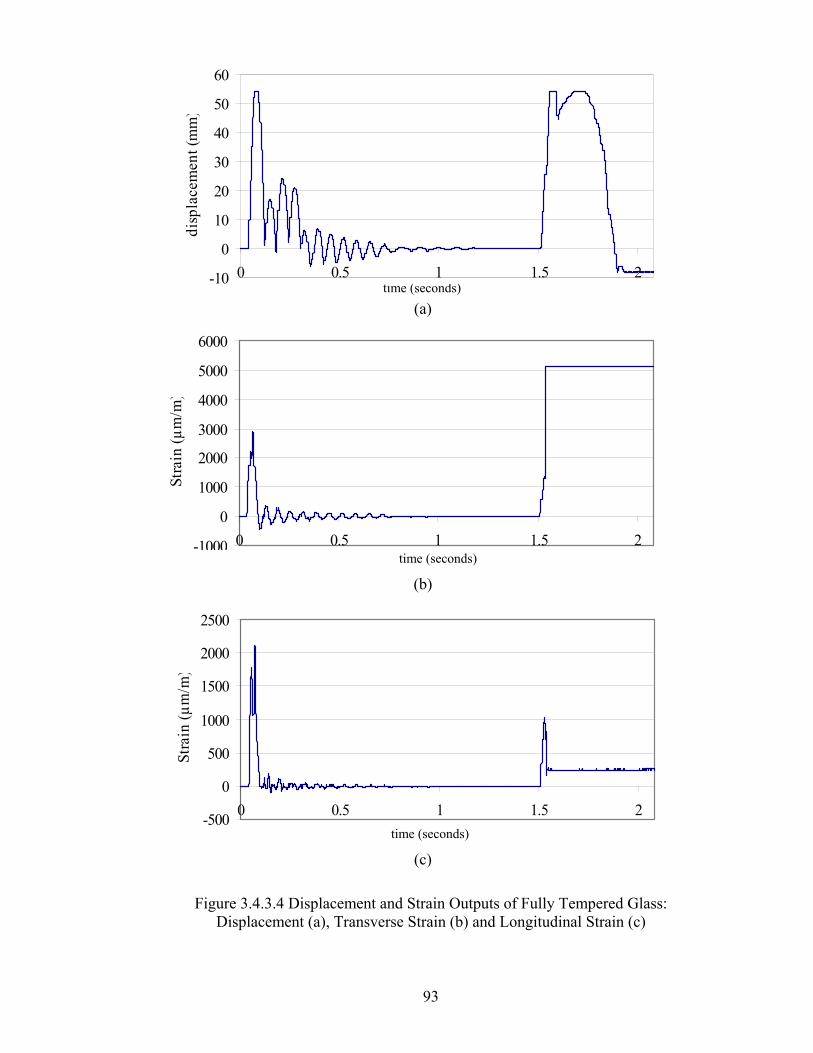
93
Figure 3.4.3.4 Displacement and Strain Outputs of Fully Tempered Glass: Displacement (a), Transverse Strain (b) and Longitudinal Strain (c)
-500
0
500
1000
1500
2000
2500
0 0.5 1 1.5 2
Stra
in (µ
m/m
)
time (seconds)
(c)
-1000
0
1000
2000
3000
4000
5000
6000
0 0.5 1 1.5 2
Stra
in (µ
m/m
)
time (seconds)
(b)
time (seconds) -10
0
10
20
30
40
50
60
0 0.5 1 1.5 2
disp
lace
men
t (m
m)
(a)

94
(2) TCFS Specimen
The TCFS panel demonstrated different impact behaviors compared to the glass
specimens. Most damage occurred local to the impact point, in a type of ‘punching’
failure which included cracks on the PMMA skins, debonding between the cardboard
core and the PMMA skins, as well as material shear failure in the cardboard core. Upon
impact, a circular crack with a diameter of 400 mm formed on the facing PMMA skin
(Figure 3.4.3.5 (a) and (c)). A diagonal crack measuring 1,200 mm developed on the rear
PMMA skin, which originated from the middle of one vertical edge and extended to the
top of the other vertical edge (Figure 3.4.3.5 (a) and (b)). The deboning between the skin
and core occurred on both sides of the panel near the impact point (Figure 3.4.3.6 (d) and
(e)), but the PMMA skins remained intact. The epoxy adhesive attaching the PMMA skin
to the cardboard core was subjected to longitudinal shear failure, resulting in deboning
between the PMMA and cardboard core. The cardboard core underwent transverse shear
failure at the middle and the corner of the core cells (Figure 3.4.3.6 (d) and (e)),
accompanying the debonding between the PMMA and cardboard core. The notched
cardboard used to create an egg crate core was also presumed to be a weak point,
resulting in material failure due to the transverse shear (Figure 3.4.3.6 (d)). Crushing on
the cardboard core was also occurred at the impact point (Figure 3.4.3.6 (f)). The fracture
patterns of the PMMA skin and post-breakage modes are highlighted in Figure 3.4.3.6
and 3.4.3.6. The top and bottom of the panel showed no structural failure. The TCFS
panel overall deformed in the direction of the impact with a permanent deformation of 25
mm. The maximum displacement at the point of impact was approximately 51 mm at
0.07 s and the corresponding strain was 4,900 μm/m as shown in Figure 3.4.3.7.

95
Figure 3.4.3.5 Fracture Patterns (a) of PMMA Skin at 457 mm Drop Height: Diagonal Crack on Back Skin (b) and Circular Crack on Front Skin (c)
(b)
(a)
(c)

96
Figure 3.4.3.6 Post Breakage Modes of TCFS at 457 mm Drop Height:
Transverse Shear Failure at Cardboard Core ((d) and (e), Longitudinal Shear Failure at Adhesive Joint ((d), (e), and (f)) and Crumbling of Cardboard Core (f)
(d)
(e)
(f)

97
Figure 3.4.3.7 Displacement (a) and Strain ((b) anc (c)) Output of TCFS:
Displacement (a), Transverse Strain (b) and Longitudinal Strain (c)
-500
0
500
1000
1500
2000
2500
3000
3500
0 0.5 1 1.5 2
stra
in (µ
m/m
)
time (seconds)
-10
0
10
20
30
40
50
60
0 0.5 1 1.5 2
disp
lace
men
t (m
m)
(c)
time (seconds)
-1000
0
1000
2000
3000
4000
5000
6000
0 0.5 1 1.5 2
stra
in (µ
m/m
)
time (seconds)
(a)
(b)

98
Figure 3.4.3.8 shows the energy absorbing characteristics of the glass and TCFS
panels. The displacement comparisons revealed that the TCFS panel appears to be stiffer
than glass under impact and therefore, results in absorbing less impact energy.
Figure 3.4.3.8 Displacement Comparisons between Glass and TCFS
3.4.4 Impact Testing Conclusions
It was observed that the laminated glass panel (2 x 3 mm heat strengthened glass)
complied with the Class B safety standards of ANSI Z97.1, and the tempered glass panel
(6 mm thick) was able to withstand the initial drop of 457 mm without failure, and
therefore it complied with the Class B safety standards of ANSI Z97.1. However, since it
failed upon a second impact from a lesser height than that required for Class B standard,
it might be concluded that it in fact should have failed the Class B safety standard. This
calls into question the procedure of ANSI Z97.1 which allows for a singular impact force
to establish compliance. However, an initial impact may well have caused the panel to
weaken without any obvious visual indication of this. It is therefore suggested that test
panels should be tested with a second (and perhaps third) impact of the same magnitude
(or at least say 50% of the initial magnitude) to ensure adequate continuing strength after
initial impact. This is further verified by the ability of the laminated glass to withstand a
-20
-10
0
10
20
30
40
50
60
0 0.5 1 1.5 2 2.5
disp
lace
men
t (m
m)
lam. glass
F.T. glass
TCFS
time (seconds)

99
greater level of impact without failure and as such tempered glass ought to be subjected
to ‘secondary’ testing to ensure consistent results with laminated glass. The calibration
process of the impact testing frame using glass specimens revealed that the newly
developed testing facility conformed to the ANSI Z97.1 specification. When dropped
from a height of 457 mm, circular and diagonal cracks occurred on both the TCFS
panel’s front and rear PMMA skins. Despite the cracking, holes large enough for a 76
mm (3 inch) diameter sphere to freely pass though were not formed. Debonding between
the PMMA skins and the cardboard core occurred, but the PMMA skins and cardboard
core remained intact. The epoxy adhesives underwent longitudinal shear, causing the skin
and core to debond. The resultant breakage modes under impact concluded that the TCFS
meets the Class B requirements of ANSI Z97.1. Time history and displacement output
indicated that the TCFS absorbs less impact energy than glass panels, but it is postulated
that the TCFS panel provides greater residual strength, which would make the TCFS
more resistant to second and third impacts.
3.5 Charpy Impact Performance
The primary purpose of the Charpy impact testing was to verify whether the
PMMA skin of the TCFS maintain their safety characteristics after prolonged exposure to
outdoor environment in accordance with ANSI Z97.1, which requires that weathered
plastics or glass with an organic coating must maintain an impact strength of more than
75% of their initial strength. To test this, the plastics must undergo an accelerated
weathering process followed by impact testing.
3.5.1 Charpy Impact Tester and Specimens
The Charpy impact test on PMMA specimens was carried out in accordance with
ASTM D 6110 Standard Test Methods for Determining the Charpy Impact Resistance of
Notched Specimens of Plastics. The testing was performed by the Bodycote Testing
Group. The Charpy impact test is required to exert a maximum impact energy of 6.78
Nm- from a swing pendulum. Prior to the Charpy impact test, three specimens of PMMA
sheet were exposed to an accelerated weatherometer (QUV) for 2,400 hours according to
ASTM G154 Standard Practice for Operating Fluorescent Light Apparatus for UV
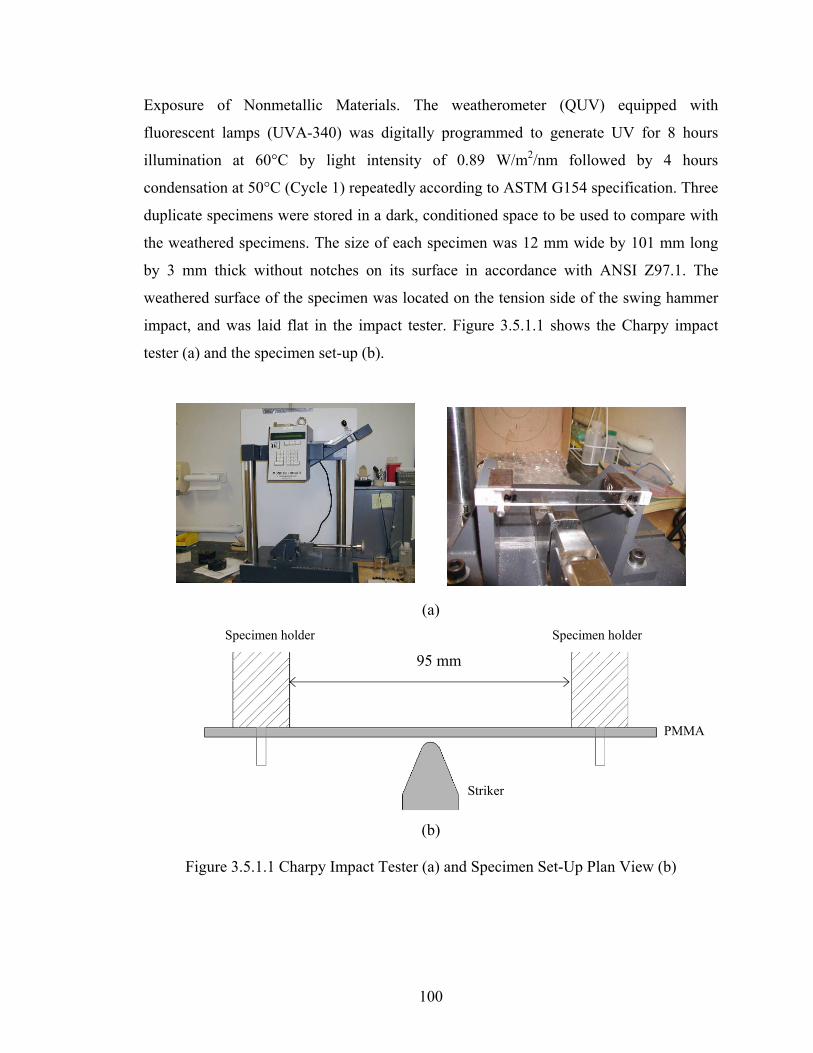
100
Exposure of Nonmetallic Materials. The weatherometer (QUV) equipped with
fluorescent lamps (UVA-340) was digitally programmed to generate UV for 8 hours
illumination at 60°C by light intensity of 0.89 W/m2/nm followed by 4 hours
condensation at 50°C (Cycle 1) repeatedly according to ASTM G154 specification. Three
duplicate specimens were stored in a dark, conditioned space to be used to compare with
the weathered specimens. The size of each specimen was 12 mm wide by 101 mm long
by 3 mm thick without notches on its surface in accordance with ANSI Z97.1. The
weathered surface of the specimen was located on the tension side of the swing hammer
impact, and was laid flat in the impact tester. Figure 3.5.1.1 shows the Charpy impact
tester (a) and the specimen set-up (b).
(a)
(b)
Figure 3.5.1.1 Charpy Impact Tester (a) and Specimen Set-Up Plan View (b)
95 mm
Striker
PMMA
Specimen holder Specimen holder

101
3.5.2 Charpy Impact Testing Procedure
The Charpy impact test machine was calibrated using a non-weathered PMMA
sample. After the machine was calibrated, each specimen was tested using repeated
impacts, with incremental increases in height of the swing hammer until a specimen
broke. Each specimen’s impact strength was recorded in kg-cm/cm. Prior to testing, all
specimens were conditioned to 24°C and 50% RH for 40 hours. Figure 3.5.2.1 shows the
broken PMMA after testing.
Figure 3.5.2.1 Broken PMMA After Calibrating the Charpy Impact Tester
3.5.3 Charpy Impact Testing Result
The average value of impact strength was determined for the three non-weathered
specimens and another average value was determined for the weathered specimens. The
average values of the two sets of specimens were then compared and the results are as
follows. The average impact strength of the non-weathered PMMA (uncoated) was 6.22
± 0.0784 kg-cm/cm and the average impact strength of the weathered specimen was
4.14±0.174 kg-cm/cm. The impact strength of the PMMA after 2,400 hours of outdoor
exposure was approximately 64% of its original strength. This did not meet the ANSI
Z97.1 requirement that a weathered material must have greater than 75% of its original
strength to be certified as a safety glazing.
Since the weathered samples were exposed to a greater length of time (2400 hours)
compared to the ANSI Z97.1 requirement (2400 hours), the results were more severe than
might have been the case at the standard measure. In order to assess the impact strength
at 2,000 hours of weathering exposure, the impact resistance at 2,000 hours was
interpolated between zero and the impact strength of 4.14 kg-cm/cm at 2,400 hours,
assuming that the impact resistance degrades according to a linear distribution over time.
On this basis, the estimated impact strength at 2,000 hours was approximately 6.46 kg-
cm/cm (1.186 lbs-ft/inch), which equates to 80% of the original strength (4.98 kg-cm/cm).
Therefore, a preliminary conclusion might be that PMMA meets the ANSI Z97.1

102
requirements for Charpy impact resistance. Further tests at the standard measure will
need to be conducted in the future to verify this prediction. Table 3.5.3.1 and Figure
3.5.3.1 shows the impact strength of the weathered specimens after 2,000 hours of
exposure in relation to the measured strength at 0 hours and 2,400 hours of exposure. A
complete report prepared by Bodycote Testing Group is presented in Appendix G.
Table 3.5.3.1 Measured and Charpy Impact Strength of PMMA Impact resistance
Non-weathered PMMA 6.22 kg-cm/cm
Weathered PMMA at 2,400 hours 4.14 kg-cm/cm
Figure 3.5.3.1 Charpy Impact Strength as a Fuction of Time
3.5.4 Charpy Impact Testing Conclusion
The purpose of the Charpy impact test was to verify the reduction in impact
strength of PMMA after 2,000 hours of accelerated weathering conditions. The results
show that the weathered PMMA meets the ANSI Z97.1 requirement of maintaining at
least 75% of the panel’s original strength. Therefore, it is concluded that the particular
PMMA material tested conforms to the safety glazing requirements of the ANSI Z97.1
standard. However, additional tests will need to be carried out at the standard measure to
validate this prediction.
0
1
2
3
4
5
6
7
0 500 1000 1500 2000 2500 3000
time (hours)
impa
ct s
tren
gth
(kg-
cm/c
m)
Measured value at 0 hour exposure
Measured value at 2,400 hours exposure
Postulated value at 2,000 hours exposure

103
3.6 Conclusions
Adequate strength and stiffness performance characteristics are important
structural requirements for a façade system. The current building codes and standards do
not provide strength and stiffness criteria for a TCFS. The International Building Code
(IBC 2003) was used as a basis on which to evaluate the structural requirements for a
TCFS and from this, the strength and stiffness requirements were established. A new
testing frame was fabricated and used to carry out static and impact tests. The objective
of the static test was to compare the measured results with theory-based values and
provide simple equations that could be used at the initial design phase of a TCFS. As a
result, bending tests with a two-edge supported TCFS panel showed good accuracy with
the calculated values using simple beam theory. In the case of a four-edge supported
TCFS panel, the model needed to be modified to create an ‘effective depth’ that accounts
for the two-way stiffness of the TCFS panel, as well as the open cellular configuration
that reduces torsional stiffness. An equivalent ‘effective depth’ was determined for a
typical panel arrangement, by back substituting from two way action plate theory. In
order to fully verify the ‘effective depth’ approach, additional parametric finite element
simulations and testing would need to be carried out to test this method in order for it to
be applicable to different cellular configurations where ‘effective depth’ of a TCFS will
be a function of panel depth, skin and core thickness, core web spacing, core and skin
elastic modulus material properties. This will allow simple beam theory to be
comprehensively suitable for the initial design of a TCFS. For simplicity, adjustment
factors accounting for the factors that influence the effective depth were calculated based
on the experimental results. The adjusted simple plate theory shows agreement with the
experimental data, and therefore, can be used to compute the flexural stress and
deflection of composite panels that have aspect ratios and open cell geometrics that are
similar to the studied TCFS panel. Stress and deflection outputs from the FEM analysis
showed agreement with the experimental results for both the two-edge and four-edge
supported TCFSs.
In addition to the static test, a pendulum impact test was carried out to investigate
the impact behavior of a TCFS panel. Failure modes revealed that the TCFS panel
complied with the safety glazing specification for a drop height of 457 mm, which is

104
equivalent to Class B of ANSI Z97.1. The Charpy impact test results indicate that the
TCFS panel tested provides adequate impact strength after exposure to outdoor
environments. Following recommendations for improvement in the structural
composition and assembly of TCFS panels can be drawn from the impact test results. In
order to avoid cracks and enhance the impact resistance of the TCFS panel, grooves
should not be made on the PMMA surface. Also, the use of an adhesive that is less brittle
than epoxy would likely provide more resilience and thus increase the impact resistance
against the longitudinal shear. However, this would reduce overall panel stiffness.
Another area that could be improved concerns the core material. The results of the impact
test indicated that the cardboard sheared quite easily, and therefore, the use of a core
material with greater shear strength is recommended in order to minimize human injury
upon impact. Additional impact testing of a TCFS panel at a 1,219 mm ANSI Z97.1
Class A drop height could also be carried out in order to identify whether the panel can
resist a greater impact. An impact test on a full-sized TCFS panel with edge connections
is recommended to assess both global and local impact behavior.

105
Chapter 4
Life Cycle Assessment (LCA)
In accordance with ISO 14040 Environmental management – Life cycle assessment –
Principles and framework, the LCA study in this chapter consists of four phases: (1) goal
and scope definition, (2) life cycle inventory analysis (LCI), (3) life cycle impact
assessment (LCIA), (4) life cycle result interpretation. The Semipro 7.1 database serves
as the primary source for obtaining the life cycle inventory data.
4.1 Goal and Scope Definition
4.1.1 Goal and Scope
The main goal of the LCA study is to investigate the environmental impact of a
TCFS relative to that of a GCWS by conducting a comparative life cycle assessment. The
study focuses on identifying both systems’ environmental impacts over their service life,
determining at which phases contribute the greatest environmental impacts, comparing
their overall environmental performance, and identifying methods to reduce the
environmental impact caused by facade systems.
In order to accomplish these goals, the scope of this LCA study includes a life
cycle inventory analysis (LCI), life cycle impact assessment (LCIA), and life cycle result
interpretation for façade systems. The LCA examines environmental impacts during the
whole life cycle which is divided into three phases: pre-use, use, and post-use. TCFS and
GCWS have a number of important differences in their material composition, system size,
and durability. These differences must be considered in order to determine the functional
unit, which is discussed in greater detail in section 4.1.3. Inventory data associated with
material processing and activities during each life cycle phase is obtained from the
SimaPro 7.1 database and the amount of energy consumption associated with the use

106
phase of each façade system is identified by LBNL software (eQUEST 3.6, THERM 5,
and WINDOW 5). However, certain aspects of the system could not be modeled due to
data unavailability. A TCFS does not contain energy performance coating (e.g. low-e)
and therefore, an uncoated GCWS is used as its counterpart. A coated GCWS is included
in LCA study to understand the energy efficiency of a coating compared to the uncoated
GCWS. Detailed assumptions and limitations of the LCA study are addressed in section
4.1.4.
4.1.2 System Boundaries
ISO 14040 defines a system boundary as a “set of criteria specifying which unit
processes are part of a product system,” and a unit process is defined as the “smallest
element considered in the life cycle inventory analysis for which input and output data
are quantified” (ISO, p.5, 2004). As can be seen in Figure 4.1.2.1, the processes
examined in this study consider three life cycle phases: pre-use, use, and post-use.
The processes that typically occur during the pre-use phase of a façade system
include raw material extraction, material processing, product assembly, packaging,
transportation, and installation. However, due to data unavailability, only raw material
extraction, material processing, and transportation are considered in this study. The use
phase of a façade system typically involves operating, maintaining and replacing system
components over the service life of a building. However, in this study the environmental
impacts associated with maintenance and replacement are not inventoried due to a lack of
LCA data. The post-use phase investigates the processes of dismantling, transporting, and
disposing of a façade system. The study only measures the environmental impacts
associated with transportation and the end-of-life disposal. Dismantling is not modeled
due to data limitation. Figure 4.1.2.1 shows a summary of the system boundaries for the
LCA study.

107
Figure 4.1.2.1 Overview of the System Boundaries of the LCA
4.1.3 Functional Unit
A functional unit is defined as “quantified performance of a product system for
use as a reference unit” (ISO, p.4, 2004). Because a TCFS and GCWS each have
different sizes and life spans, the functional unit (FU) for the LCA study is determined to
be a façade area of 4.0 m high by 4.9 m wide (13 ft x 16 ft), and which encloses a
building for a 40-year service life. The expected life spans of TCFS panels and GCWS
panels are estimated to be 10 years and 20 years respectively. This indicates that, over a
building’s 40-year service life, a TCFS panel has to be replaced four times while a
GCWS panel has to be replaced only twice. It is also presumed that the metal frames for
both façade systems do not require replacement over the 40-year service life of the
building. Table 4.1.3.1 summarizes the service life of each façade system for this LCA
study. Figure 4.1.3.1 shows how four units of a TCFS and sixteen units of a GCWS
enclose the same amount of a building façade area over a 40-year span.
Table 4.1.3.1 Functional Unit (FU) of TCFS and GCWS for Baseline LCA Life Span of Façade Systems
TCFS Panel
GCWS Panel
Metal Frame
Design Life of a Building
Façade Area Covered
Baseline LCA 10 years 20 years 40 years 40 years 19.11 m2
[Use Phase] Operation
[Post-Use Phase] Recycling/Landfilling/
Transportation
Raw Materials
Energy
Emissions IN
PU
T
OU
TP
UT
[Pre-Use Phase] Raw Material Extraction/
Material Production/ Transportation
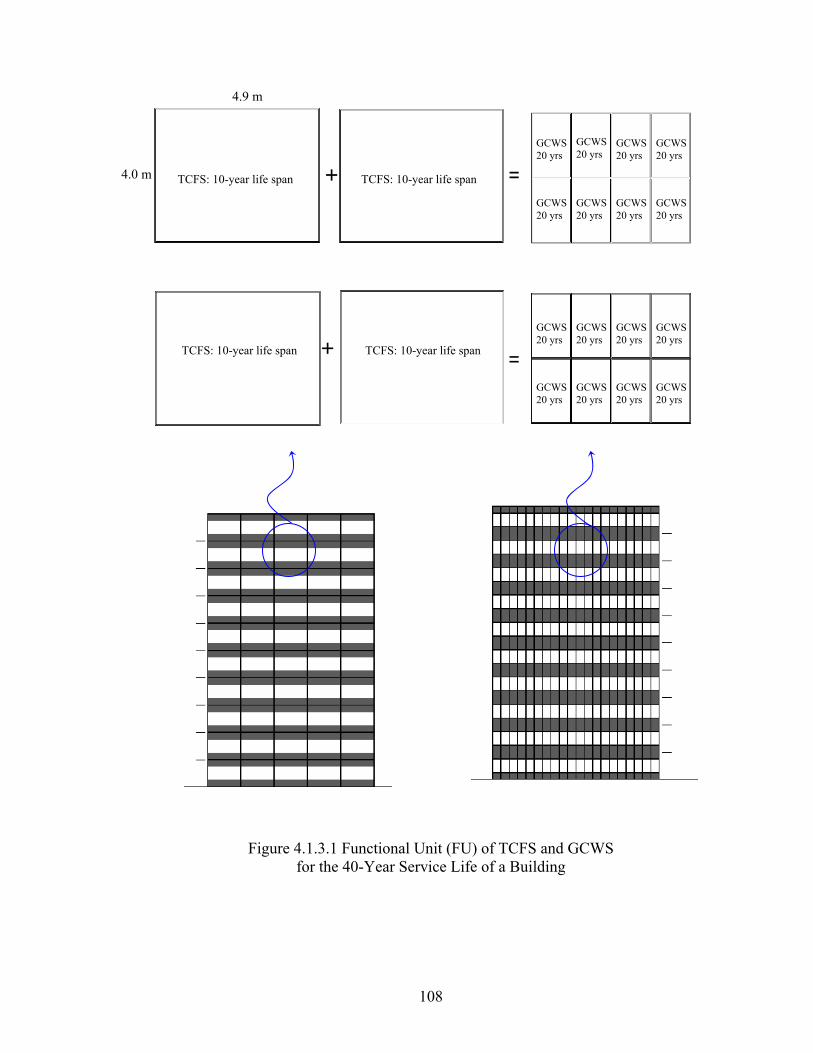
108
Figure 4.1.3.1 Functional Unit (FU) of TCFS and GCWS for the 40-Year Service Life of a Building
=
+ =
GCWS 20 yrs
GCWS 20 yrs
GCWS 20 yrs
GCWS 20 yrs
GCWS 20 yrs
GCWS 20 yrs
GCWS 20 yrs
GCWS 20 yrs
4.9 m
4.0 m TCFS: 10-year life span
+ =
GCWS 20 yrs
GCWS 20 yrs
GCWS 20 yrs
GCWS 20 yrs
GCWS 20 yrs
GCWS 20 yrs
GCWS 20 yrs
GCWS 20 yrs
TCFS: 10-year life span
TCFS: 10-year life span TCFS: 10-year life span

109
As shown in Figure 4.1.3.2, the material mass of each façade system is calculated
based on the system details that were determined in section 3.1. The material mass per
TCFS and GCWS is 300 kg and 980 kg respectively, and the mass input of the GCWS is
three times greater than that of the TCFS mainly due to glass weight.
Figure 4.1.3.2 Material Mass Per TCFS and GCWS
The total material input of each façade system for the FU is calculated by
multiplying the individual mass (Figure 4.1.3.2) with the required number of
replacements over the service life of a building and adding 5% for material wastage
estimated in product fabrication. The resulting total material inputs of a TCFS and
GCWS per FU are 1,273 kg and 2,217 kg respectively as shown in Table 4.1.3.2. It
should be noted that, despite fewer projected replacements of the GCWS over the service
life of a building, the mass of a GCWS is still 35% greater than that of a TCFS panel.
Figure 4.1.3.3 presents the total material input composition for each system per FU.
Table 4.1.3.2 Material Inputs of TCFS and GCWS Per Functional Unit (FU) TCFS GCSW
Material Components Material
Mass (kg)5%
Wastage Total (kg)
Material Mass (kg)
5% Wastage
Total (kg)
PMMA 876 49 -
Biofiber Composites 185 9 -
Epoxy 4 0 -
Aluminum 53 3 164 8
Silicone 37 2 36 2
EPDM 15 1 13 1
Glass - - 1,899 95
Total Input (kg) 1,170 64 1,234 2,112 106 2,217
0
200
400
600
800
1000
1200
TCFS GCWS
wei
ght (
kg)
GLASS
EPDM
SILICONE
AL
EPOXY
CARD
PM MA
Mas
s (k
g)

110
Figure 4.1.3.3 Material Mass Input Composition Per Functional Unit
4.1.4 Assumptions and Limitations
The LCA study makes two assumptions: that a TCFS can fulfill the same tasks as
a GCWS and that the lifespan of a TCFS is half that of a GCWS. To facilitate the
assessment of environmental burdens and to directly compare the two façade systems,
boundary conditions such as building lifespan, building construction type, system
installation method, maintenance frequency, and human comfort are assumed to be
constant. The origin and production of the materials and the assembly of the product are
assumed to occur within a radius of 1600 km from the building site. The transportation
distance for the end-of- life disposal is assumed to be 50 km from the building site.
Figure 4.1.4.1 shows the estimated traveling distance from the product supplier and
building site.
The limitations of the LCA study are related to the system boundaries and the
scope of the study. Due to data unavailability, certain fabrication processes such as
lamination, tempering, extrusion, surface treatment, and product assembly are not
inventoried. The environmental impacts associated with transportation are assessed based
on the traveling distance and the weight of the façade system, neglecting the volume of
the façade system. Due to the lack of LCA data, certain materials were either excluded or
replaced with materials that represent similar characteristics. The polyvinyl butyral (PVB)
interlayer of laminated glass, screws, and desiccant are not included due to their
negligible weight and data unavailability. Landfilling inventory data of PMMA and
cardboard were replaced with that of construction waste to landfill due to data
0
500
1000
1500
2000
2500
TCFS GCWS
mas
s (k
g)
GLASS
EPDM
SILICONE
AL
EPOXY
CARD
PMMA

111
unavailability. Details of major assumptions and limitations of the LCA study are
presented in Table 4.1.4.1.
Figure 4.1.4.1 Travelling Distance between Building Site and Suppliers: (a) Building ~ PMMA fabricator, (b) Building ~ Glass Fabricator and (c) Building ~ Alum.

112
Table 4.1.4.1 Major Assumptions and Limitations of the LCA study Life Cycle
Phase TCFS GCWS
Pre-Use Phase
The inventory data of biofiber composites is represented by the cardboard data; Aluminum without recycled content is inventoried; The aluminum extrusion process is not included; 5% material loss is assumed to occur during product fabrication; None of the environmental burdens associated with product fabrication and assembly are inventoried due to data unavailability; Material finishes such as bio-coatings and paintings are neglected due to data unavailability; The environmental burdens associated with transportation in the pre-use phase are calculated based on a total travel distance of 1600 km.
The data of the heat treated glass are represented by float annealed glass data; The production of coating and PVB interlayer are not included; The PIB primary seal and glazing tape in an IGU is analyzed using silicone data; The desiccant in the aluminum spacer and screws are neglected due to negligible weights; Aluminum without recycled content is considered; The aluminum extrusion process is not included; 5% material loss is assumed to occur during product fabrication; None of the environmental burdens associated with IGU assembly are inventoried due to data unavailability; The environmental burdens associated with transportation in the pre-use phase are calculated based on a total travel distance of 1600 km.
Use Phase
The environmental impacts of the use phase of each façade system are examined based on a building’s energy consumption over an operation period of 40 years; A TCFS panel is assumed to be replaced twice as often as a GCWS panel; The environmental attributes associated with maintenance and replacement are not included due to data unavailability.
Post-Use Phase
Basic end-of-life scenario is 100% landfill of the TCFS panel with 100% recycling of the metal frames; The environmental impact associated with demolition of the façade system is not included due to data unavailability; The transportation distance is assumed to be 50 km.
Basic end-of-life scenario is 100% landfill of the GCWS panel with 100% recycling of the metal frame; The environmental impact associated with demolition of the façade system is not included due to data unavailability; Transportation distance is assumed to be 50 km.
General Notes
The production of capital goods is excluded. The environmental impact associated with transportation is based on ton – km. Thus, the volume of the materials is not considered when calculating the environmental impact of transportation. Returning an empty truck is not included in the inventory analysis. Since the LCIA addresses only the energy and green house gas that are specified in the goal and scope, the LCIA in this chapter is not a complete assessment of all environmental issues of the product systems studied. Inventory data were obtained from the SimaPro 7.1 database.

113
4.2 Life Cycle Inventory (LCI)
The environmental burdens associated with unit processes during each life cycle
phase of a façade system were inventoried. The required energy input and pollutant
emissions associated with production of 1 kg of material of the façade systems,
transporting materials for 1 km using a 16-ton truck, generating 1 kWh of electricity and
1 Btu of natural gas (including extraction, production, and delivery), and landfilling and
recycling 1 kg of material components are summarized in Table 4.2.1. The LCI data used
in the LCA study are obtained from the SimaPro 7.1 database. Detailed inventory data of
materials and process is presented in Appendix H.
Table 4.2.1 Life Cycle Inventory Data for Energy Inputs and Green House Gas Emissions Energy Greenhouse Gas Emissions
Embodied Energy (MJ)
CO2 (kg)
CH4 (kg)
CF4 (kg)
C2F6 (kg)
PMMA (1 kg) 135 6.85E+00 2.44E-02 0.00E+00 0.00E+00
Cardboard (1 kg) 10 7.09E-01 8.92E-04 0.00E+00 0.00E+00
Epoxy (1 kg) 235 1.10E+00 0.00E+00 0.00E+00 0.00E+00
Steel (1 kg) 30 9.00E-01 1.63E-04 1.69E-09 2.11E-10
Aluminum (1 kg) 169 9.96E+00 2.24E-02 3.60E-04 4.20E-05
Silicone (1 kg) 44 1.16E+00 7.85E-03 0.00E+00 0.00E+00
EPDM (1 kg) 89 2.96E+00 9.94E-03 8.28E-08 9.20E-08
Float Glass (1 kg) 14 9.68E-01 2.32E-03 1.69E-07 1.88E-08
Pre-Use Phase
Transportation (1 km) 3 2.28E-01 2.77E-04 0.00E+00 0.00E+00
Electricity (1 MJ) 3.72 2.98E-01 6.49E-03 0.00E+00 0.00E+00 Use Phase
Natural Gas (1 MJ) 1.15 5.58E-02 1.60E-04 0.00E+00 0.00E+00
Construction Waste (1 kg) Landfilled
0.008 5.32E-04 7.37E-07 1.07E-11 1.19E-12
PMMA (1 kg) Recycled -42.92 -3.37E-01 8.28E-05 0.00E+00 0.00E+00
Cardboard (1 kg) Recycled
-1.25 -5.55E-01 1.31E-03 -6.88E-09 -7.64E-10
Glass (1 kg) Recycled -3.15 -3.76E-01 -4.44E-06 0.00E+00 0.00E+00
Post-Use Phase
Aluminum (1 kg) Recycled
-104.04 -9.33E+00 -1.57E-02 -2.52E-04 -2.80E-05

114
4.2.1 Energy Inputs
4.2.1.1 Pre-use phase
The pre-use phase energy consists of embodied energy from material processing
and transportation energy. The total embodied energy of each façade system is calculated
by multiplying the embodied energy required to produce 1 kg of each material by the
total mass input per functional unit. The amount of transportation energy is measured by
multiplying the functional unit mass times the total traveling distance of 1600 km.
The analysis shows that fabrication of a TCFS panel (148,000 MJ/FU) is two
times as energy intensive when compared to a GCWS panel (72,000 MJ/FU) per FU, due
to the large amount of PMMA usage (900 kg/FU) and the energy intensity of material
production and PMMA sheet fabrication (embodied energy of 135 MJ/kg). The TCFS
and product transportation account for 141,000 MJ (95%) and 7,500 MJ (5%) of the total
energy usage, whereas the GCWS panel, GCWS frames, and product transportation
account for 31, 200MJ (45%), 30,000 MJ (41%), 10,000 MJ (14%) respectively. The
GCWS frame is responsible for 41% of the total energy use because of the energy
intensive production of the aluminum (169 MJ/kg). The energy associated with
transporting the TCFS (7,500 MJ) is lower than that of the GCWS (10,100 MJ) due to its
lighter weight. Table 4.2.1.1 and Figure 4.2.1.1 show the embodied energy of 1kg of
material and the total pre-use phase energy of each façade system per functional unit.
Figure 4.2.1.1 Embodied Energy Distributions of TCFS and GCWS Per FU
0
20,000
40,000
60,000
80,000
100,000
120,000
140,000
160,000
TCFS GCWS
ener
gy (M
J)
Transportation
Glass
EPDM+Silicone
Aluminum
Epoxy
Cardboard
PMMA

115
Table 4.2.1.1 Pre-Use Phase Energy of TCFS and GCWS per FU
TCFS Embodied Energy
(MJ/kg) Total Embodied Energy
(MJ)
PMMA 135 124,928
Cardboard 10 1,911
Epoxy 235 1,044
Aluminum 169 9,464
Silicone 44 1,727
EPDM 89 1,357 Transportation
(4 trips at 1600 km) 3 7,488
Total 147,919
GCWS Embodied Energy
(MJ/kg) Total Embodied Energy
(MJ)
Float glass coated 15 28,950
Aluminum 124 29,241
Silicone 44 1,670
EPDM 89 1,179 Transportation
(2 trips at 1600 km) 3 10,138
Total 71,178
4.2.1.2. Use phase
The operational energy of a building is classified as the site energy and primary
energy. Site energy refers to the energy consumed by end uses such as space heating and
cooling, and primary energy is the site energy combined with the life cycle energy of fuel
that accounts for fuel upstream, energy production, and delivery. The primary conversion
factor, which is the ratio of the primary energy to the delivered site energy, is obtained
from the SimaPro 7.1 database.
The site energy consumed during the use phase of a TCFS and GCWS is
determined by performing a building energy simulation. A 10-story office building
located in Detroit, Michigan is used as the study’s model, and energy simulation software
(eQUEST: the QUick Energy Simulation Tool) is used to calculate the site energy
associated with cooling, heating, and lighting a building. The site energy consumption is
affected by various factors: climate, site orientation, building size, HVAC (heating,
ventilation, and air conditioning) system, building operation schedule, building envelope
construction, window-to-wall ratio, air infiltration, U-factor (heat transmission), solar
heat gain coefficient (SHGC), and visible light transmittance (VLT) (ASHRAE, p. 124,

116
2001). The energy performance values (U-factor, SHGC, and VLT) are input parameters
in the eQUEST simulation to model. The difference in the energy usage between a TCFS
and GCWS, Appendix I shows how the U-factor, SHGC, and VLT for each façade
system are calculated using WINDOW 5 and THERM 5 software. Table 4.2.1.2 outlines
the parameters used in the eQUEST simulation and Figure 4.2.1.2 shows a building set-
up in eQUEST.
Table 4.2.1.2 Office Building Information for eQUEST Simulation Building Parameters Values Location Detroit, MI Service life 40 years Building footprint 160 m x 80 m Number of floor 10 Floor-to-floor height 4 m Floor-to-ceiling height 2.7 m Daylighting control Yes
Building envelope construction Curtain wall construction with vision and spandrel glazing
Window-to-wall ratio 50% Wall infiltration rate 0.038 CFM/ft2
Figure 4.2.1.2 An Office Building Set-Up in eQUEST
Appendix I presents the eQUEST output of annual energy consumption for each
façade system. In order to estimate the site energy per façade system with a 40-year
service life, the annual energy consumption is multiplied by the number of years of

117
service life (40 years) and divided by the number of façade units that covers the building
(300 units). The resulting energy consumption of each façade system for the FU is shown
in Table 4.2.1.4. In order to quantify the total energy consumption, natural gas (Btu) and
electricity (kWh) are converted into the same energy unit (MJ) by using conversion
factors of 1 MBtu = 1055 MJ and 1 kWh = 3.6 MJ. By this calculation, a TCFS consumes
approximately 400,000 MJ and an uncoated GCWS consumes 470,000 MJ, indicating
that the TCFS consumes 18% less energy than the uncoated GCWS during the 40-year
service life of a building. A coated GCWS, however, consumes 24% less energy than the
uncoated GCWS. The baseline of the LCA study is to compare the TCFS (uncoated) and
GCWS (uncoated). The additional analysis of coated GCWS is added to understand the
effect of high performance coating on the use phase energy. Table 4.2.1.3 shows the total
site energy consumed during the 40-year service life of the model building.
Table 4.2.1.3 Site Energy Consumed by End Uses of TCFS and GCWS Per FU
Energy type End uses TCFS Uncoated GCWS
Coated GCWS
Natural gas Heating (1,000,000 Btu) 189 224 148 Cooling (1,000 kWh) 20 30 21
Electricity Lighting (1,000 kWh) 33 32 32
Energy Type Energy Use (MJ) TCFS Uncoated GCWS
Coated GCWS
Natural gas Heating (MJ) 198,903 236,714 155,929 Cooling (MJ 73,916 110,053 77,705
Electricity Lighting (MJ) 122,554 118,888 120,067
Total (MJ) 395,373 465,655 353,701
In order to calculate the primary energy required to provide the calculated site
energy, the primary conversion factor of 1:3.72 for electricity and 1:1.15 for natural gas
based on the SimaPro 7.1 database is multiplied to each of the identified site energy
values. For example, 3.72 MJ of primary energy is required to supply 1 MJ of site energy
used for cooling and lighting (electricity), whereas 1.15 MJ of primary energy is needed
to supply 1 MJ of the site energy from space heating (natural gas). As a result, the total
primary energy of a TCFS and an uncoated GCWS is approximately 960,000 MJ and
1,113,000 MJ respectively, indicating that the primary energy of a TCFS is 15% less than
that of an uncoated GCWS. A coated GCWS (915,000 MJ) consumes 18% less primary

118
energy than that of an uncoated GCWS (1, 1130,000 MJ). Table 4.2.1.4 and Figure
4.2.1.3 compare the differences in primary energy use for a TCFS and a GCWS.
Table 4.2.1.4 Primary Energy Consumption of TCFS and GCWS Per FU
Energy Type End Uses TCFS Uncoated GCWS
Coated GCWS
Natural gas Heating (MJ) 228,738 272,221 179,318 Cooling (MJ 274,968 409,396 289,062
Electricity Lighting (MJ) 455,900 442,265 446,651
Total (MJ) 959,606 1,123,882 915,032
Figure 4.2.1.3 Use Phase Energy of TCFS and GCWS Per FU
4.2.1.3 Post-Use Phase
Incineration or recycling materials at the end of a product’s life cycle provides
energy or material recovery, and in this regard, the energy consumption is indicated as a
negative value. Landfilling, on the other hand, requires life cycle energy to process waste
treatment and therefore, is expressed as a positive value. For the disposal scenario of a
TCFS and GCWS, it is assumed that both TCFS and GCWS are landfilled. By
considering the landfill scenario as a baseline LCA, the sensitivity analysis using
recycling scenario can provide more meaningful result to make a recommendation for the
end of product management. As Table 4.2.1.5 indicates, a TCFS consumes 1,700 MJ and
a GCWS requires 2,700 MJ, and major energy is attributed to the transportation for both
systems. Energy required for landfilling the TCFS and GCWS panels is obtained from the
SimaPro 7.1 database.
0
200,000
400,000
600,000
800,000
1,000,000
1,200,000
TCFS UncoatedGCWS
CoatedGCWS
(M
J) Lighting (MJ)
Cooling (MJ)
Heating (MJ)

119
Table 4.2.1.5 Post-Use Energy Consumption of TCFS and GCWS per FU
Façade System End of Life ScenarioRequired Energy
(MJ/kg) Total Post-Use
Energy (MJ/FU)
TCFS Landfilled 0.007 8
Transportation (4 trips at 50 km)
3 1,736 TCFS
Total 1,744
GCWS Landfilled 0.007 15
Transportation (2 trips at 50 km)
3 2,696 GCWS
Total 2,711
4.2.1.4 Total Life Cycle Energy Comparison
A comparison between the life cycle energy input of a TCFS and GCWS is
presented in Table 4.2.1.6 and Figure 4.2.1.4. The total life cycle energy of a TCFS
(1,110,000 MJ) consumes 7% less energy than that of an uncoated GCWS (1,200,000 MJ)
over a 40-year service life. A coated GCWS (989,000 MJ) consumes 18% less energy
than an uncoated GCWS (1,200,000 MJ) for the same period. For a TCFS, energy
consumption during the pre-use phase accounts for 13% of the system’s total life cycle
energy, while the energy consumed during the use phase is responsible for 87%. The
energy in the pre-use phase of an uncoated GCWS accounts for 6% of the system’s total
life cycle energy while the use phase’s energy (primary energy) accounts for
approximately 94%. The post-use phase for both a TCFS and GCWS consumes least
energy as energy required energy for landfilling is minimal.
Table 4.2.1.6 Total Life Cycle Energy Input of TCFS and GCWS Per FU TCFS Uncoated GCWS Coated GCWS
Pre-Use (MJ) 147,919 (13%) 71,178 (6%) 71,178 (7%)
Use (MJ) 959,606 (87%) 1,123,882 (94%) 915,032 (93%)
Post-Use (MJ) 1,744 (0.16%) 2,711 (0.24%) 2,711 (0.28%)
Total (MJ) 1,109,269 (100%) 1,197,771 (100%) 988,921 (100%)

120
Figure 4.2.1.4 Total Life Cycle Energy Input of TCFS and GCWS Per FU
4.2.3 Environmental Emissions
The greenhouse gas (GHG) emissions that are released during the life cycle stages
of a TCFS and GCWS are examined. The primary GHGs inventoried in this section are
Carbon Dioxide (CO2), Methane (CH4), Tetrafluoromethane (CF4), and
Hexafluoroethane (C2F6), all of which contribute to global warming. The results of the
analysis show that a TCFS (77,000 kg) creates 10,000 kg less CO2 than an uncoated
GCWS (87,000 kg). A coated GCWS (72,000 kg) releases 15,000 kg less CO2 than an
uncoated GCWS (87,000 kg) and 10,000 kg less than a TCFS. During the pre-use phase,
the TCFS generates approximately 7,600 kg of CO2, which is 1.7 times that of a GCWS
(4,500 kg of CO2). In the pre-use phase of a TCFS, manufacturing the PMMA (6,300 kg
of CO2) accounts for 83% of the system’s total CO2 emissions while transportation (500
kg) contributes 7%. For a GCWS, the major activities causing CO2 emissions during the
pre-use phase are manufacturing glass (2,000 kg) and aluminum (1,700 kg) and
transportation (800 kg). A small amount of CF4 and C2F6 is also found in the pre-use
phases of both the TCFS and GCWS due to the production of aluminum. For the use
phase, the CO2 emissions of a TCFS (70,000 kg) are 15% less than that of an uncoated
GCWS (82,000 kg). For the post-use phase, both TCFS (17 kg) and GCWS (27 kg) has
very little CO2 emission mainly from the transportation. In sum, the pre-use phase of a
TCFS and GCWS contributes 10% and 5% of the total CO2 emissions respectively. The
use phase is the dominant phase for CO2 emissions for both a TCFS and an uncoated
GCWS, accounting for 90% and 95% of their total CO2 emissions. The CO2 emissions
0
200,000
400,000
600,000
800,000
1,000,000
1,200,000
1,400,000
TCFS Uncoated GCWS Coated GCWS
ener
gy in
put (
MJ)
Pre-use
Use
Post-use

121
during the post-use phase for both a TCFS and GCWS are relatively insignificant when
landfilled end of life cycle management is considered. Table 4.2.3.1 and Figure 4.2.3.1
show the GHG emissions of each façade system throughout their life cycles.
Table 4.2.3.1 Pollutant Emissions of TCFS and GCWS Per FU TCFS Uncoated GCWS Coated GCWS
CO2 (kg)
CH4 (kg)
CF4 (kg)
C2F6 (kg)
CO2 (kg)
CH4 (kg)
CF4 (kg)
C2F6 (kg)
CO2 (kg)
CH4 (kg)
CF4 (kg)
C2F6(kg)
Pre-Use 7.64E+03
(10%) 2.51E+01
1.99E-02
2.32E-03
4.54E+03(5%)
9.90E+00
6.24E-02
7.28E-03
4.54E+03 (6%)
9.90E+00
6.24E-02
7.28E-03
Use 6.97E+04
(90%) 1.31E+03
0.00E+00
0.00E+00
8.15E+04(95%)
1.52E+03
0.00E+00
0.00E+00
6.77E+04 (94%)
1.31E+03
0.00E+00
0.00E+00
Post-Use 1.70E+01 (0.02%)
2.08E-02
1.53E-08
1.70E-09
2.65E+01(0.03%)
3.23E-02
2.37E-08
2.64E-09
2.65E+01 (0.04%)
3.23E-02
2.37E-08
2.64E-09
Total 7.74E+04 (100%)
1.34E+03
1.99E-02
2.32E-03
8.61E+04(100%)
1.53E+03
6.24E-02
7.28E-03
7.23E+04 (100%)
1.32E+03
6.24E-02
7.28E-03
Figure 4.2.3.1 CO2 Emissions of TCFS and GCWS Per FU
4.3 Life Cycle Impact Assessment (LCIA)
Global warming potential (GWP) uses CO2 as the reference gas and each GWP is
converted into the equivalent weight (kg) of CO2 accordingly to Intergovernmental Panel
on Climate Change (IPCC) 2007. For example, 1 kg of Methane (CH4) creates the same
GWP as 21 kg of CO2. Table 4.3.1 shows the global warming potential and the
characterization factor of each GHG substance.
Table 4.3.1 Global Warming Potential for 100-Year Time Horizon
0
20,000
40,000
60,000
80,000
100,000
TCFS Uncoated GCWS Coated GCWS
CO
2 (k
g)
Pre-Use
Use
Post-Use

122
Industrial Designation Chemical Formula Global Warming Potential for 100-year Time Horizon
Carbon dioxide CO2 1 kg CO2 equivalent Methane CH4 21 kg CO2 equivalent
PFC-14 CF4 6,500 kg CO2 equivalent
PFC-116 C2F6 9,200 kg CO2 equivalent From “IPCC Technical Paper on 4AR,” by Intergovernmental Panel on Climate Change, 2007, p. 212.
The results of this analysis show that, although a TCFS creates approximately 1.5
times the GWP of a GCWS in the pre-use phase, the total life cycle GWP of a TCFS
(108,000 kg CO2 equivalent) is 11% less than that of an uncoated GCWS (122,000 kg
CO2 equivalent). The total GWP of a coated GCWS (103,000 kg CO2 equivalent) is
19,000 kg less than that of the uncoated GCWS, which is mainly due to a lower amount
of CO2 emissions during its use phase. The use phase of a TCFS accounts for 92% of the
GWP from its total life cycle, followed by the pre-use phase (8%) and post-use phase
(<1%). The use phase of the uncoated GCWS accounts for 95% of the total GWP,
followed by the pre-use phase (5%) and the post-use phase (<1%). In both façade systems,
the use phase generates the greatest environmental impact per functional unit, and the
post-use phase has little impact on GWP generation. Table 4.3.2 and Figure 4.3.1
illustrates the GWP of each façade system over a 40-year service life.
Figure 4.3.1 Global Warming Potential of TCFS and GCWS Per FU
0
20,000
40,000
60,000
80,000
100,000
120,000
140,000
TCFS Uncoated GCWS Coated GCWS
kg C
O2
equi
vale
nt
Pre-use
Use
Post-use
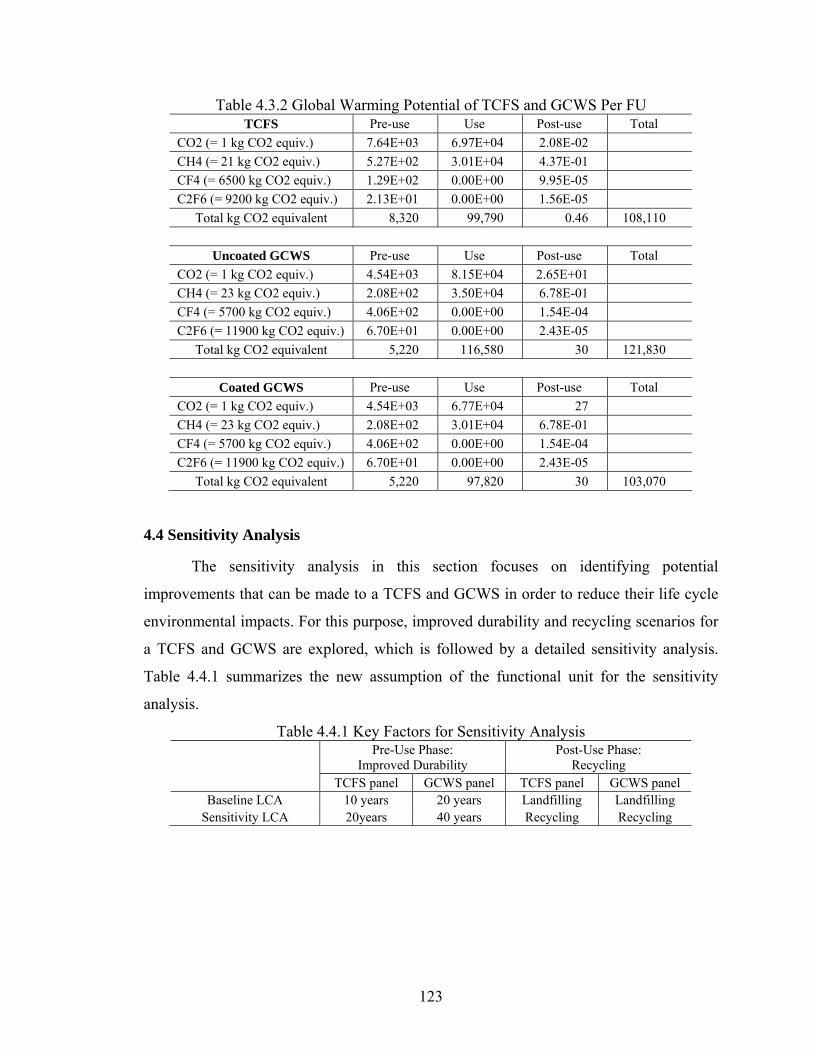
123
Table 4.3.2 Global Warming Potential of TCFS and GCWS Per FU TCFS Pre-use Use Post-use Total
CO2 (= 1 kg CO2 equiv.) 7.64E+03 6.97E+04 2.08E-02
CH4 (= 21 kg CO2 equiv.) 5.27E+02 3.01E+04 4.37E-01
CF4 (= 6500 kg CO2 equiv.) 1.29E+02 0.00E+00 9.95E-05
C2F6 (= 9200 kg CO2 equiv.) 2.13E+01 0.00E+00 1.56E-05
Total kg CO2 equivalent 8,320 99,790 0.46 108,110
Uncoated GCWS Pre-use Use Post-use Total
CO2 (= 1 kg CO2 equiv.) 4.54E+03 8.15E+04 2.65E+01
CH4 (= 23 kg CO2 equiv.) 2.08E+02 3.50E+04 6.78E-01
CF4 (= 5700 kg CO2 equiv.) 4.06E+02 0.00E+00 1.54E-04
C2F6 (= 11900 kg CO2 equiv.) 6.70E+01 0.00E+00 2.43E-05
Total kg CO2 equivalent 5,220 116,580 30 121,830
Coated GCWS Pre-use Use Post-use Total
CO2 (= 1 kg CO2 equiv.) 4.54E+03 6.77E+04 27
CH4 (= 23 kg CO2 equiv.) 2.08E+02 3.01E+04 6.78E-01
CF4 (= 5700 kg CO2 equiv.) 4.06E+02 0.00E+00 1.54E-04
C2F6 (= 11900 kg CO2 equiv.) 6.70E+01 0.00E+00 2.43E-05
Total kg CO2 equivalent 5,220 97,820 30 103,070
4.4 Sensitivity Analysis
The sensitivity analysis in this section focuses on identifying potential
improvements that can be made to a TCFS and GCWS in order to reduce their life cycle
environmental impacts. For this purpose, improved durability and recycling scenarios for
a TCFS and GCWS are explored, which is followed by a detailed sensitivity analysis.
Table 4.4.1 summarizes the new assumption of the functional unit for the sensitivity
analysis.
Table 4.4.1 Key Factors for Sensitivity Analysis Pre-Use Phase:
Improved Durability Post-Use Phase:
Recycling TCFS panel GCWS panel TCFS panel GCWS panel
Baseline LCA 10 years 20 years Landfilling Landfilling Sensitivity LCA 20years 40 years Recycling Recycling

124
4.4.1 Pre-use Phase: Improved Life Expectancy
The energy input and pollutant output during the pre-use phase of a façade system
is directly related to the system’s durability and weight. The LCA in the previous section
indicated that the pre-use phase of a TCFS is responsible for 13% of the total life cycle
energy and 9% of the total GWP emissions over a 40-year building service life. The first
sensitivity analysis in this section regards enhancing the durability of both a TCFS and
GCWS. While the life spans of a TCFS and GCWS were projected in the LCA study to
be 10 years and 20 years respectively, the sensitivity analysis in this section uses the
expected maximum service life of 20 years and 40 years. This means that, CGWS would
not need to be replaced and a TCFS panel would require two replacements to meet the
40-year service life of a building.
The sensitivity analysis results show that a TCFS still consumes more energy and
produces more CO2 emissions compared to a GCWS. However, with improved durability,
the 20-year life span of a TCFS (72,000 MJ) reduces the original pre-use energy (148,000
MJ) by approximately 50%, which is mainly due to the decreased use of PMMA. The 40-
year life span of a GCWS (50,000 MJ) reduces the original pre-use energy (71,000 MJ)
by approximately 32% due to the reduction in glass use. The projected figures of the
improved TCFS and GCWS during their pre-use phase result in GWP reductions by 50%
(4,100 kg CO2 equivalent) and 30% (1,500 kg CO2 equivalent) respectively. Table
4.4.1.1 and Figure 4.4.1.1 show the sensitivity analysis results associated with the pre-use
phase, taking into consideration the actual and improved maximum life spans.
Table 4.4.1.1 Sensitivity Analysis Results for Pre-Use Phase Baseline LCA Sensitivity Analysis
Pre-Use Phase TCFS 10 years
GCWS 20 years
TCFS 20 years
GCWS 40 years
Pre-Use Energy (MJ) 147,920 71,180 73,960 50,210
Pre-Use GWP (kg CO2 equivalent) 8,320 5,220 4,160 3,750

125
Figure 4.4.1.1 Sensitivity Analysis Results for Pre-Use Phase: Pre-Use Energy Consumption (a) and CO2 Equivalent (b)
4.4.2 Post-Use Phase: Recycling as an Alternative to Incineration
Sensitivity analysis focuses on recycling at the end-of-product life for both TCFS
and GCWS in order to assess the environmental benefits over landfilling (in the baseline
LCA). The results indicate that recycling a TCFS reduces both energy input (-26,900 MJ)
and the GWP (-940 kg CO2 equivalent) compared to landfilling. Major energy and GWP
reduction of recycling the TCFS resulted from the recycling the PMMA panel (-45
MJ/kg). The energy saved through recycling the aluminum (-104 MJ/kg) significantly
impacts the amount of energy recovery and GWP releases for a GCWS. Table 4.4.2.1 and
0
20,000
40,000
60,000
80,000
100,000
120,000
140,000
160,000
10 years 20 years 20 years 40 years
TCFS GCWS TCFS GCWS
pre-
use
ener
gy (
MJ)
Baseline LCA Sensitivity Analysis
0
1,000
2,000
3,000
4,000
5,000
6,000
7,000
8,000
9,000
10 years 20 years 20 years 40 years
TCFS GCWS TCFS GCWS
pre-
use
kg C
O2
equi
vale
nt
Baseline LCA Sensitivity Analysis
(a)
(b)

126
Figure 4.4.2.1 shows the environmental profiles of different disposal scenarios for each
façade system.
Table 4.4.2.1 Sensitivity Analysis Results for Post-Use Phase Baseline LCA Sensitivity Analysis
Post-Use Phase TCFS Panel Landfilled
GCWS Landfilled
TCFS Recycled
GCWS Recycled
Post-Use Energy (MJ) 1,740 2,710 -26,900 -19,800 Post-Use GWP (kg CO2 equivalent) 0.46 30 -943 -2,200
Figure 4.4.2.1 Sensitivity Analysis Results for Post-Use Phase: Post-Use Energy Consumption (a) and CO2 Equivalent (b)
-2500
-2000
-1500
-1000
-500
0
500
post
-use
CO
2 eq
uiva
lent
10 years 20 years 20 years 40 years
TCFS GCWS TCFS GCWS
Baseline LCA Sensitivity Analysis
-30,000
-25,000
-20,000
-15,000
-10,000
-5,000
0
5,000
post
-use
ene
rgy
(MJ)
10 years 20 years 20 years 40 years
TCFS GCWS TCFS GCWS
(a)
(b)
Baseline LCA Sensitivity Analysis

127
4.5 LCA Conclusions
A comparative LCA was performed in order to understand the environmental
profile of a TCFS relative to that of a GCWS by assessing energy input and global
warming potential (GWP) over a 40-year service life of a building. Environmental
aspects were analyzed in the pre-use, use, and post-use phases of each façade system’s
life cycle. For the baseline LCA study, the life span of a TCFS and a GCWS was
estimated to be 10 years and 20 years respectively, and the façade area to be covered by
the façade system was assumed to be 4.3 m by 4.6 m. The pre-use phase examined the
environmental impacts associated with raw material extraction, material processing, and
transportation. The use phase inventoried the environmental impacts related to the
building’s operation–heating, cooling, and lighting–over a 40-year operational period.
Building energy simulation using eQUEST was carried out to determine the annual
energy consumption of a building, and the energy performance values of each façade
system were used as input parameters. The post-use phase focused on environmental
impacts associated with a system’s end-of-life management and the environmental
impacts from landfilling both the TCFS and GCWS were investigated as a baseline LCA
study. Inventory data of each façade system were obtained from the SimaPro 7.1 database.
The LCA results showed that a TCFS provided better environmental performance
than an uncoated GCWS by consuming 7% less energy and 11% less GWP over a
building’s 40-year service life. The most significant energy input and environmental
emissions occurred during the use phase for both a TCFS and GCWS, where a TCFS
consumed approximately 960,000 MJ and an uncoated GCWS consumed approximately
112,000 MJ. A GCWS with high performance low-e coating provided 17% energy
reduction compared to a GCWS without low-e coating during the 40 years use phase.
However, further validation on the energy performance values of the glazing systems
should be carried out as they are highly sensitive to the overall environmental
performance. The pre-use phase was the second largest phase in terms of energy
consumption and GWP for both a TCFS and GCWS. Production of PMMA (135 MJ/kg;
7 kg CO2 equivalent/kg) and an aluminum frame (169 MJ/kg; 13 kg CO2 equivalent/kg)
played dominant roles in increasing the environmental impacts during the pre-use phase.
Landfilling the TCFS and GCWS at the post-use phase represented a relatively small
128
fraction (<1%) of their total life cycle energy and GWP. The environmental impacts
associated with the transportation of both the TCFS and GCWS have a minimal impact
on the environment relative to the total life cycle energy and GWP.
A sensitivity analysis was carried out to understand how critical uncertain
parameters influence overall environmental impacts. New assumptions about the
functional unit were made with respect to product durability and recycling the TCFS and
GCWS at the end-of-life disposal scenario. The sensitivity analysis showed that a TCFS
(1,000,0000 MJ) uses 150,000 MJ (13%) less life cycle energy compared to an uncoated
GCWS (1,150,000 MJ). A coated GCWS (950,000 MJ) consumes 230,000 MJ (18%) less
life cycle energy than an uncoated GCWS (1,180,000 MJ). Similarly, the sensitivity
analysis also revealed that the TCFS (103,000 kg CO2 equivalent) releases 19,000 kg
CO2 equivalent (13%) less emissions compared to an uncoated GCWS (122,000 kg CO2
equivalent). The coated GCWS (990,000 kg CO2 equivalent) exhibits 23,000 kg CO2
equivalent (16%) less than that of the uncoated GCWS. Extending the life span and
recycling at the post-use phase helps to reduce energy and GWP emissions for the both
TCFS and GCWS. The extended durability of materials is more sensitive to the TCFS.
Recycling at the end of product’s life influenced the total life cycle energy and GWP by
less than 1%. For both the baseline LCA and the sensitivity analysis, the use phase of a
TCFS and GCWS remains the principal phase for energy consumption and CO2
emissions over a 40-year service life, and the TCFS impacts the environment less than
the uncoated GCWS. Table 4.5.1 and Figure 4.5.1 provide quantitative comparisons of
energy input and GWP of the baseline LCA and sensitivity analysis for each façade
system.

129
Table 4.5.1 LCA and Sensitivity Analysis Comparisions TCFS Uncoated GCWS Coated GCWS
Energy (MJ) LCA Sensitivity1 LCA Sensitivity1 LCA Sensitivity1
Pre-Use Energy 148,000 74,000 71,200 50,200 71,200 50,200 Use Energy 959,600 959,600 1,123,900 1,123,900 915,000 915,000 Post-Use Energy 1,740 -26,900 2,710 -19,800 2,710 -19,800
Total Energy (MJ) 1,109,340 1,006,700 1,197,810 1,154,300 988,910 945,400
TCFS Uncoated GCWS Coated GCWS GWP
(kg CO2 equivalent) LCA Sensitivity1 LCA Sensitivity1 LCA Sensitivity1
Pre-Use GWP 8,320 4,160 5,220 3,750 5,220 3,750 Use GWP 99,790 99,790 116,580 116,580 97,820 97,820
Post-Use GWP 0.46 -940 30 -2,200 30 -2,200 Total GWP
(kg CO2 equivalent) 108,110 103,010 121,830 118,130 103,070 99,370
Tables below show % distribution of each analysis by life cycle stage: for example, for the LCA of
the TCFS, pre-use, use, and post-use energy account for 13%, 87%, and 0.16% of the total life cycle energy.
TCFS Uncoated GCWS Coated GCWS Energy (MJ) LCA Sensitivity1 LCA Sensitivity1 LCA Sensitivity1
Pre-Use Energy 13% 7% 6% 4% 7% 5%
Use Energy 87% 95% 94% 97% 93% 97%
Post-Use Energy 0.16% -3% 0.23% -2% 0.27% -2%
Total energy (MJ) 100% 100% 100% 100% 100% 100%
Improved durability and recycling of the TCFS save energy by 10%. Durability is an important factor for the TCFS.
TCFS Uncoated GCWS Coated GCWS Energy (MJ) LCA Sensitivity1 LCA Sensitivity1 LCA Sensitivity1
Pre-Use Energy - -100% - -42% - -42%
Use Energy - - -
Post-Use Energy - -106% - -114% - -114%
Total Energy (MJ) - -10% - -4% - -5%
Total energy use of the TCFS in the baseline LCA is 93% of that of the uncoated GCWS and for the sensitivity analysis, the total energy of the TCFS accounts for 87% of the uncoated GCWS.
TCFS Uncoated GCWS Coated GCWS Energy (MJ) LCA Sensitivity1 LCA Sensitivity1 LCA Sensitivity1
Pre-use energy 208% 147% - - - -
Use energy 85% 85% - - 81% 81%
Post-use energy 64% 136% - - - -
Total energy (MJ) 93% 87% - - 83% 82%
Note: Sensitivity1 analysis focuses on improved durability and recycling at the end of product life cycle.

130
LCALCALCA SensitivitySensitivitySensitivity 0
20,000
40,000
60,000
80,000
100,000
120,000
140,000
TCFS Uncoated GCWS Coated GCWS
life
cycl
e G
WP
(kg
CO
2 eq
uiva
lent
)
Figure 4.5.1 LCA and Sensitivity Analysis Comparisons
Following recommendations can be made based on the baseline LCA and
sensitivity analysis. Materials with low energy and greater durability are recommended at
the initial design phase of a façade system, and the greater improvement was realized in
the TCFS. Improving energy performance values (U-factor, SHGC, and VLT) of a
glazing system is strongly recommended, and further validation process on the
performance values should be carried out as they are highly sensitive to the life cycle
energy and environmental impact.
Although the environmental impact of the post-use phase is relatively
insignificant, recycling materials is recommended over landfilling or incineration in order
to recover energy and avoid pollutant emissions resulted from the incineration process.
Minimizing the travel distance and material weight helps reduce the negative
environmental impacts associated with the transportation process. Table 4.5.2
summarizes the key findings of the LCA study.
11% less emission
13% less emission
LCALCALCA SensitivitySensitivitySensitivity 0
200,000
400,000
600,000
800,000
1,000,000
1,200,000
1,400,000
TCFS Uncoated GCWS Coated GCWS
life
cycl
e en
ergy
inpu
t (M
J)
7% less energy
13% less energy
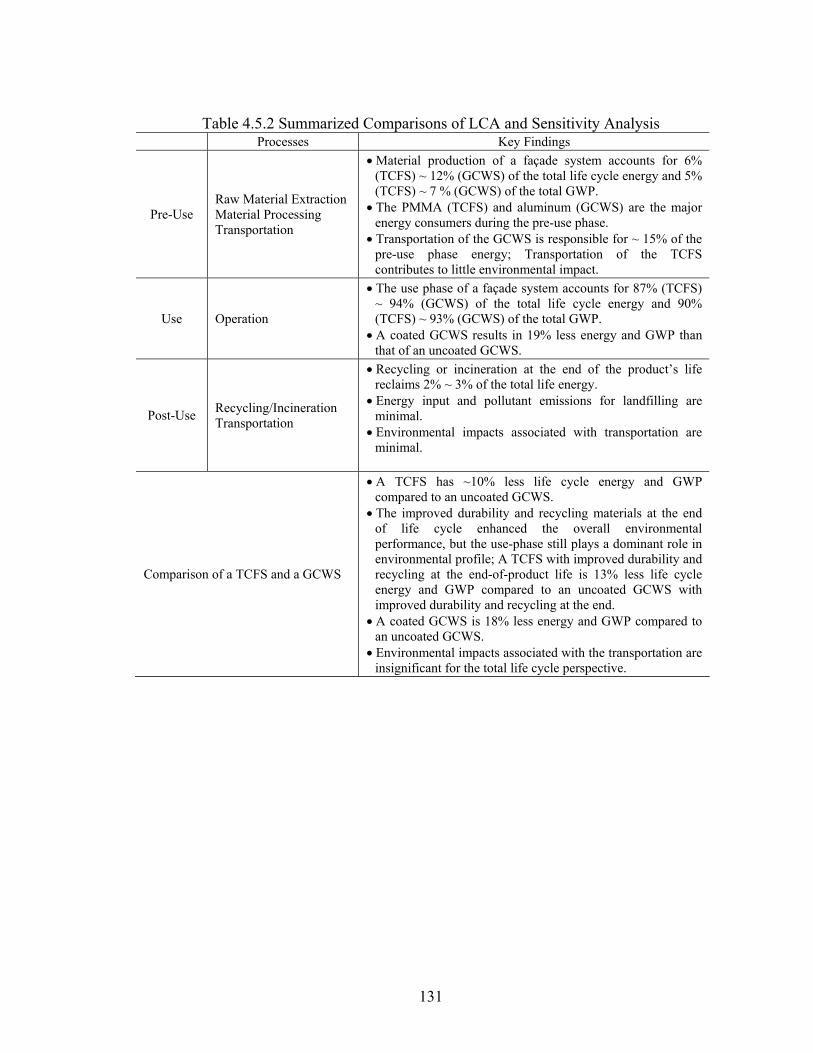
131
Table 4.5.2 Summarized Comparisons of LCA and Sensitivity Analysis
Processes Key Findings
Pre-Use Raw Material Extraction Material Processing Transportation
Material production of a façade system accounts for 6% (TCFS) ~ 12% (GCWS) of the total life cycle energy and 5% (TCFS) ~ 7 % (GCWS) of the total GWP.
The PMMA (TCFS) and aluminum (GCWS) are the major energy consumers during the pre-use phase.
Transportation of the GCWS is responsible for ~ 15% of the pre-use phase energy; Transportation of the TCFS contributes to little environmental impact.
Use Operation
The use phase of a façade system accounts for 87% (TCFS) ~ 94% (GCWS) of the total life cycle energy and 90% (TCFS) ~ 93% (GCWS) of the total GWP.
A coated GCWS results in 19% less energy and GWP than that of an uncoated GCWS.
Post-Use Recycling/Incineration Transportation
Recycling or incineration at the end of the product’s life reclaims 2% ~ 3% of the total life energy.
Energy input and pollutant emissions for landfilling are minimal.
Environmental impacts associated with transportation are minimal.
Comparison of a TCFS and a GCWS
A TCFS has ~10% less life cycle energy and GWP compared to an uncoated GCWS.
The improved durability and recycling materials at the end of life cycle enhanced the overall environmental performance, but the use-phase still plays a dominant role in environmental profile; A TCFS with improved durability and recycling at the end-of-product life is 13% less life cycle energy and GWP compared to an uncoated GCWS with improved durability and recycling at the end.
A coated GCWS is 18% less energy and GWP compared to an uncoated GCWS.
Environmental impacts associated with the transportation are insignificant for the total life cycle perspective.

132
Chapter 5
Conclusions and Future Work
5.1 Structural Conclusions
5.1.1 Problem Statement
The high demand for transparency in contemporary buildings has caused a need
for improved structural strength and safety performance in glazing materials. Glass has
been a common glazing material for centuries, but its brittleness and catastrophic impact
behaviors are still challenging structural attributes. The heavier weight of glass and the
need for intermediate mullions in a glass facade impose additional weight to a primary
structure. In order to address these shortcomings, a transparent composite façade system
(TCFS) was designed as an alternative to a glass wall. The TCFS is a composite panel
system made out of a polymer skin and biofiber composite core. The primary objective of
this study was to explore the structural characteristics of a TCFS by measuring its
structural performance comparing it to that of a glass façade system. The structural
performance metrics in this study were characterized by strength, stiffness and impact
safety performance.
5.1.2 Summary of Research Activities
Previous studies related to composite panel systems were reviewed in Section 2.1
in order to understand the structural principles and inherent benefits of a composite panel
system for use in building applications. Two hybrid glass products consisting of glass
skins and cavity-integrated shading devices were reviewed with respect to materials,
structural span capability, thermal values and embodied energy. The purpose of product
surveys was to understand the unique performance and design features of a TCFS. In
Section 2.2, a feasibility study of polymers and biofiber composites designed for outdoor

133
use was carried out, and the performance of each material was discussed and compared
with both glass and glass fiber reinforced composites. A theoretical framework to
measure the structural performance of a composite panel under static and impact loading
conditions was discussed in Section 2.3. Simple bending theories incorporating a
transformed section method and the effective thickness for a composite panel were
reviewed. ANSI Z97.1 was referenced to set up an experimental work plan to carry out
pendulum impact tests and to understand the safety requirements and classifications of
glazing materials.
In Section 3.1, the structural design criteria (i.e., strength and stiffness) of a TCFS
were established in accordance with the International Building Code. A new testing
frame was designed, fabricated and installed at the University of Michigan to carry out
both the static and impact tests (Section 3.2). The primary objective of the static testing
was to measure the bending stiffness and stress of a TCFS panel and compare the
measurements with the theoretical predictions in order to provide a simple design
equation that can be used to estimate a bending stress and displacement during the initial
design stage of a TCFS. The static testing of TCFS and glass panels consisted of two-
edge support and four-edge support tests, and the test results were compared with simple
bending theories, as discussed in Section 2.3 (Section 3.3). A finite element (FE) analysis
of a TCFS under static loads was performed and validated by comparing the analysis’
outcome to the experimental results.
After the static test was performed, pendulum impact tests were conducted, the
results of which were discussed in Section 3.4. The objective of the impact testing was to
determine the safety classification, understand post-breakage behaviors and propose
recommendations to enhance the impact resistance of a TCFS. Before testing the TCFS,
the impact test frame was calibrated using glass specimens. The TCFS and glass panels
were each instrumented with a displacement transducer and strain gauges to record time
history structural responses. A high speed camera was set up to record global impact
behaviors of each specimen during the impact test. The impact results of a TCFS were
then compared with those of the glass panels.

134
5.1.2 Structure Conclusions and Recommendations
Previous studies of a composite panel system in Section 2.1 concluded that
composite panels made of a strong, stiff skin material bonded to various types of
lightweight core material offer high stiffness- and strength-to-weight ratios, as well as
greater impact resistance. The majority of the studies focused on defining simplified
design methods (either simple equations or numerical simulation methods), which were
validated against test results to provide time efficient, accurate tools that could be used
during the initial design stage of a composite panel. It was observed from the product
survey that the shading device-integrated insulated glass unit (IGU) is required to meet an
ASTM 1300 standard like a typical IGU, and it provides a dynamic solar control ability
to improve building energy consumption. Its embodied energy was greatly affected by
the material type of the mass input of the shading device. The feasibility study in Section
2.2 revealed that the polymer skin provided lighter in weight, higher impact resistance,
lower thermal conductivity, greater optical clarity and increased design flexibility
compared to glass, and the biofiber composites core had adequate mechanical properties.
Polymers and biofiber composites, however, are prone to weathering effects under UV
and moisture, and therefore, it is recommended that protective coatings are applied to
enhance the long-term durability and vapor migration of the polymers and biofiber
composites. PCs and PMMAs meet the flammability requirements of the International
Building Code, but it is recommended that future research is carried out to evaluate the
overall fire performance of the polymer skins and the biofiber composite core of a TCFS.
The coefficient of thermal expansion of polymers is greater than typical building
materials, and therefore, special attention to the joint details of a TCFS is required to
allow for its thermal movement. In Section 2.3, the review of simple beam and plate
theories concluded that the simple bending theory for the composite panel require a
transformed section method and effective thickness calculation because the simple
bending theory only applies to a homogeneous section made of isotropic material.
The strength and stiffness criteria of a TCFS were established according to the
International Building Code and the specifications of a TCFS met these structural
requirements (Section 3.1). The lateral displacement of a TCFS under wind loads was
135
limited to 19 mm in order to provide a rigid connection between the edge of the panel and
the metal spacer. The allowable stress of the TCFS was defined according to Baker’s
weighted factor, which is based on the yield stress divided by a safety factor of two. A
10-story office building was used as a study model to determine the wind load according
to IBC 2003 and to define the actual displacement and bending stress of a TCFS. As a
result, a 151 mm thick TCFS section (5 mm PMMA skin + 141 mm cardboard core + 5
mm PMMA skin) provided an acceptable deflection and stress level under the design
load based on a 4.1 m floor-to-floor height. As discussed in Section 3.2, a maximum
impact design load was verified based on the static testing results of a TCFS that
measured the load-displacement behavior. Hand calculation and FEM analysis
concluded that the newly installed test frame met the strength and stiffness requirements
necessary to conduct impact tests.
The two-edge supported simple beam test indicated that the measurements of a
TCFS were in agreement with the values calculated by using the simple beam theory
(Section 3.3). However, the four-edge supported static test showed disagreement between
the measurements and the theoretical predictions: the simple plate theory predicted a
stiffer panel than was actually measured in the TCFS panel. This is due to the fact that the
simple plate theory did not account for the shear lag effect present in a TCFS. The open
cell core of a TCFS reduces the torsional stiffness, which creates higher flexural stresses
at the skin where the core web meets. It is also speculated that microscopic joint failures
during the bending test may have occurred between the PMMA skin and cardboard core,
resulting in undermining a full composite action. To account for this, a modified simple
plate theory was proposed by incorporating adjustments to the simple plate equations.
This equation, however, is only applicable to composite panels that have similar aspect
ratios, sizes and core geometries to the studied TCFS panel. Therefore, another major
recommendation stemming from this study is to carry out an extensive experimental
investigation on a four-edge supported TCFS to provide a reliable plate theory that deals
with applications with various core types and panel sizes. The main advantage of FEM is
that it provides a visual representation of the shear lag effect and help structural
optimization of core geometries.

136
As discussed in Section 3.4, in place of impact testing, a thorough review of the
ANSI Z97.1 specifications was conducted, and the calibration process of the impact
testing frame was performed using the glass samples before executing the impact test of
the TCFS specimen. The breakage mode of the glass samples confirmed that the newly
developed testing frame conformed to the ANSI Z97.1 requirement. It was observed that
the laminate glass sheet did not develop a hole larger than the size specified when the
impact pendulum was dropped from a height of 457 mm, and therefore, it conformed to
the Class B safety classification of ANSI Z97.1. The tempered glass panel (6 mm thick)
was able to withstand the initial drop of 457 mm without failure, but it failed at the 2nd
impact at a lower drop height. The fully tempered glass also complied with the Class B
safety classification according to broken particles weight requirement of ANSI Z97.1.
Under the impact test of the TCFS specimen at the drop height of 457 mm, the PMMA
skin developed circular and diagonal fractures on both the front and rear skins near the
point of impact. The cardboard core underwent shear and material failure. Debonding
occurred at the epoxy joints, but the broken PMMA skins were still in contact with the
cardboard core. It was observed from the time history and displacement measurements
that the TCFS panel absorbed less impact energy than did the glass panels, but it is
postulated that the TCFS provides greater residual strength after impact. The Charpy
impact test was conducted to verify whether the PMMA skin maintained a certain impact
resistance after exposure to weathering conditions. The Charpy test confirmed that the
PMMA conformed to the safety glazing requirements of the ANSI Z97.1 standard.
Therefore, it is concluded that the TCFS conforms to the Class B requirements of the
safety glazing criteria of ANSI Z97.1. Some speculations and recommendations can be
made from the impact tests regarding the scope and safety criteria of the ANSI Z97.1
standard. Based on the results of the impact test, the initial impact was found to reduce
the structural properties of the fully tempered glass. The results suggest that the ANSI
Z97.1 standard should stipulate that a specimen must be subjected to a second or even
third impact in order to measure the residual strength, and credit would be given to a
tested panel that could withstand additional impact. By doing this, human injury could
potentially be minimized by guaranteeing the impact strength and improving the residual
strength of the glazing material.

137
5.1.4 Study Limitations and Future Work
The simplified plate equation for the four-edge supported TCFS discussed in
section 3.3 is specific to the current studies, and therefore it is recommended that further
experiments be carried out concerning the flexural stiffness in relation to various core
typologies, core cell sizes and panel sizes. A series of adjustment factors in modified
simple plate equations can be established, which accounts for the shear lag effects and
torsional stiffness of the composite sections of a TCFS.
Since section 3.4 focused on defining the safety classification of a TCFS panel
that was restrained at four edges, a large scale impact test including joint details is
recommended in order to investigate post-breakage modes at the interface between the
panels and to establish a solid understanding of the impact performance of a two-edge
supported TCFS. Further, additional impact testing at the 1219 mm-drop height is
recommended to better understand the impact behaviors of a TCFS and to make
recommendations on the material thickness, core size, core geometry and panel size of a
TCFS.
Further studies on fabrication methods for a TCFS are recommended in order to
enhance the panels’ structural integrity and quality during the fabrication process. For
this study, a laser cutter and CNC router were used to fabricate the skin and core
components. However, an automated method for product assembly and application of the
different adhesives could alter the static and impact performance of a TCFS.
5.2 LCA Conclusions
5.2.1 Problem Statement
Buildings are responsible for 40% of the energy consumption and 39% of the
CO2 emissions in the US, and typical glazed facades play key roles in building energy
loss due to their lower thermal performance. High performance glass such as low-e
coated or heat reflective glass offers better thermal performance, preventing undesired
heat loss or gain during a building operation phase. However, the coatings used on these
types of glass may not be as effective in certain climate zones, and create a glare problem
for adjacent buildings. A TCFS provides a sustainable alternative to high performance
glass because the biofiber composite core acts as a shading device while the airspace

138
between the polymer skins provides adequate insulation. The material selection criteria of
the skin and core of a TCFS are also more sustainable because they are recyclable and
renewable. A life cycle assessment (LCA) method was selected as a sustainability
measuring tool because it examines the environmental impacts associated with all of the
life cycle stages of a product. The environmental performance of a façade system in this
study was characterized by the energy consumption and CO2 emissions produced by a
TCFS through all stages of its life.
5.2.2 Summary of Research Activities
The theoretical framework of an LCA in accordance with ISO 14040 was
reviewed and its application to a window system was discussed in section 2.4. In Chapter
4, a comparative life cycle assessment (LCA) technique was employed to measure the
environmental impacts of two façade systems—a transparent composite façade system
(TCFS) versus a glass curtain wall system (GCWS)—with respect to energy use and
greenhouse gas emissions over the model building’s 40-year service life.
The studied boundary of the façade system was divided into three stages (pre-use,
use and post-use), and an LCA inventory was taken for each stage. The pre-use phase
inventory included measuring the energy input and pollutant emissions associated with
raw material extraction and processing, material production and transportation. The use
phase measured the operational energy and pollutant emissions associated with heating,
cooling, and lighting a building over its 40-year service life. The post-use phase focused
on assessing the energy input and emissions attributed to the product’s end-of-life
management and transportation.
The functional unit of the TCFS was assumed to be a 10 year service life for a
façade area that is 4.9 m wide by 4.1 m high whereas, for a GCWS with the same façade
area, the life span was assumed to be 20 years. The details of each façade system that
were developed to meet the structural design criteria established in Section 3.1 were used
to calculate the mass input (kg) required per functional unit. As with the previous studies,
10-story office building located in Detroit, MI was used as the study’s model. The
distance between product suppliers and the building site was assumed to be 1,600 km,
and the distance between the building site and the landfill was assumed to be 50 km. Life

139
cycle inventory data was obtained from the SimaPro 7.1 database, and eQUEST, a
building energy simulation tool, was used to quantify the annual energy usage of the
model building. A coated GCWS (high performance low-e coating) was also included in
the simulation study in order to better understand the energy saved from the low-e
coating.
5.2.3 LCA Conclusions and Recommendation
The baseline LCA study revealed that the total life cycle energy of the TCFS was
estimated to be 93% of that of the uncoated GCWS, and the total emission of kg CO2
equivalent for the TCFS was determined to be 89% of the GCWS. The pre-use phase of
the TCFS accounted for twice the embodied energy of the GCWS because of the energy-
intensiveness of producing PMMA. The energy consumption was highest during the use
phase for both the TCFS and GCWS; it consumed 87% and 95% respectively of their
total life cycle energy. For the post-use phase, the resulting energy and greenhouse gas
emissions associated with landfilling were insignificant (<1%). The environmental
impacts associated with transportation was also estimated to be minimal (<1%).
A sensitivity analysis focusing on product durability and recycling disposal
scenarios improved the overall life cycle performance of the TCFS by 5% and the
uncoated GCWS by 3%. The energy saved from the high performance low-e coating
resulted in approximately a 17% reduction in the total life cycle energy. The results
indicated that the total life cycle energy of the TCFS was 87% of that of the uncoated
GCWS, and the emissions of the TCFS were 87% of the total emissions of the uncoated
GCWS.
In warm climate zones, the life cycle energy of a TCFS is speculated to be
significantly lower than the uncoated GCWS because the TCFS is able to block intense
sunlight due to the shading properties of the biofiber composite core. If the core geometry
of the TCFS is reconfigured so that the opening of the core cell is closed off while still
admitting an adequate amount of daylighting, its use-phase energy consumption is
postulated be comparable to that of a high performance low-e coated GCWS. Although at
present a low-e coating on a polymer surface is not available in the market, a low-e

140
coated TCFS would greatly enhance both the U-factor and SGHC, resulting in reducing
costs and saving energy.
The major recommendations for further research are to carry out a parametric
study of a TCFS to determine the optimum core geometries for different climate zones
and building orientations. It is a well-known principle of glazing systems that, for cold
climate zones, the U-factor should be minimized while the SHGC and VLT should be
optimized. For a warm climate, on the other hand, reducing the SHGC of a TCFS is more
critical than enhancing its U-factor. When selecting building materials, durability should
be a priority in order to avoid energy consumption associated with fabricating,
transporting and installing replacements. Environmental impacts can be further reduced
by using materials with low embodied energy that incorporate energy efficient fabrication
processes and technologies. Using lightweight materials requires smaller primary
structural members, resulting in cost savings and reduced energy consumption.
Minimizing the travel distance can also lessen the negative impacts on the environment,
and improving the efficiency of the grid electricity generation lowers the carbon intensity
associated with the power generation.
5.2.4 Study Limitations and Future Work
It has been shown that SHGC dominates a building’s energy consumption in
warm climates and U-factor plays a key role in cold climates. Considering this, the
performance values of a TCFS will vary depending on its sectional and material attributes.
A parametric study would address these variations by determining the effects of design
parameters (i.e., core cell size, typology) on a building’s energy performance in different
climates. The parametric study would also be of great value to designers for the purpose
of providing a climate-responsive design guideline and a wide range of core typologies
that could optimize building energy performance.
The building energy performance presented in this research was based on a single
SHGC value of a TCFS which was numerically computed as per NFRC 200, and
therefore, the building energy usage calculated in this study may change when a dynamic
SHGC is used. In order to measure the dynamic SHGC, further experimental studies are

141
essential to define the range of SHGC throughout a day, a year and in climates with
unique characteristics (i.e., different seasons and different sun angles).
Future LCA studies should include the environmental impacts associated with the
assembly fabrication, installation, maintenance, replacement, and dismantling of a TCFS
in an effort to allow for a holistic environmental assessment. Since the environmental
performance of a façade system is highly dependant on building types, orientations, and
site locations, additional LCAs as a function of the aforementioned parameters of
building type (e.g. a residential building, office building), façade orientation, and a
different climate zone, could be performed in order to recommend climate-responsive
design guidelines for TCFS panels used in different applications.
A life cycle cost analysis should be calculated to ensure that a TCFS is
economically as viable as a GCWS. This study will likely involve extensive cost data
collection for raw material, material manufacturing, product fabrication, transportation
and installation. These data would likely be gathered through contacting relevant parties
directly and through published literature. For the use and post-use phases, the economic
study should be relatively explicit because the cost collection will be based mainly on
operational, disposal, environmental, and transportation costs.

142
APPENDICES

143
Appendix A Material Properties
Table A Material Properties of Polymers and Glass
Transparent recyclable materials
Thermoplastic
PolycarbonatePC
Polyesters PET
PolypropylenePP
Polymethylmethacrylate
PMMA
Glass
Mechanical Properties
Density (ρ) Mg/m^3 1.14-1.21 1-1.40 0.89-0.92 1.16-1.22 2.44-2.5
E-modulus (E) GPa 2.21-2.44 0.3-0.41 0.9-1.55 2.24-3.8 68-72
Poison’s Ratio (ν) dimensionless 0.38-0.42 0.34 0.43 0.37-0.43 0.2
Yield Strength (σy) MPa 58.6 - 70.0 1.30 - 72.2 20.7-37.2 45.0 - 86.0 31-35
Ultimate Strength (σult) MPa 65.0 - 72.4 9.70 - 53.0 17.2 - 31.0 30.3 - 100 31-35
Elongation at yield % 6.00 - 50.0 20.0 - 50.0 5.00 - 37.0 - 0
Elongation at break % 10.0 - 125 50.0 - 900 10.0 - 600 3.50 - 40.0 0
Thermal Properties
Thermal Conductivity W/m-K 0.19-0.22 0.15-0.30 0.11-0.17 0.08-0.25 0.7-1.3
Specific heat capacity J/kg-K 1535-1634 1160-1587 21870-1956 1485-1606 850-950
Coeff. of thermal exp. 10^-6/K 120.1-136.8 99-180 122-180 72-162 9-9.5
Melting point C 220-225 150 - 223 138 - 164 130-157 800-1730
Service Temp. C -40-120 -30-130 85.2 -50-100 -270-250
Environmental Attributes
Energy content MJ/Kg 120-130 89-95 76-84 97-105 20-25
Recycle potential High High High High High
Other Attributes Compared to Other Polymers
UV resistant No No No Yes Yes
Impact resistant Yes No Yes No No
Fatigue resistant No No No No Yes
Flame resistant No No No No Yes
Wear resistant No No No No Yes
Resilient Yes Yes Yes No No
Cost $/kg 3.8-4.0 1.25-2.5 0.9-1.0 1.7-2.45 0.68-1
From “Materials and Design” by Ashby, M. and Johnson, K., 2005; www.matweb.com

144
Appendix B Characteristics of Polymers and Glass
Table B Characteristics of Polymers and Glass
Pros Cons
PC Easy to bond and connect Easy to manufacture curved forms High creep resistant High impact resistant High service temperature Recyclable Lightweight
High processing temperature Expensive Low heat/flame resistant Low UV resistant Low weatherability Susceptible to moisture absorption Low abrasion resistant
PET Tough and rigid Ease of manufacturing Recyclable Lightweight
Low resistant to acids and bases Low heat/flame resistant Low solvent resistant
PMMA Easy to bond and connect Easy to manufacture curved forms High UV resistant Recyclable Lightweight
Brittle Low weatherability Low heat/flame resistance Susceptible to moisture absorption
PP Ease of manufacturing Low coefficient of friction High moisture resistant High fatigue resistant High abrasion resistant High service temperature High chemical resistant High flexural strength High impact r Recyclable Lightweight
Low UV resistant Low weatherability Low heat/flame resistance Low bond ability Low solvent resistant
Glass UV resistant Recyclable Low embodied energy High service temperature High heat resistant
Heavy weight High heat conductivity Brittle Expensive to manufacture curved sheet
From “Industrial plastics,” by E. Lokensgard, 2004.

145
Appendix C Biocomposites vs. Synthetic Fiber Composites
Table C Characteristics of Biocomposites Synthetic Fiber Composites
From “Natural fibers, biopolymers, and biocomposites,” by Mohanty, A., Misra, M., & Drzal, L (Eds.),
2005; “Bio-based polymers and composites’” by Wool and Sun, 2005.
Biocomposites Synthetic fiber composites
Fiber Matrix Fiber Matrix
Material Flax Jute Hemp Straws Sisal Leaf fiber Grass fiber Kenaf
Bio-based thermoplastic from renewable resourceso Cellulose plastic o Starch plastic o Poly lactic acid o Poly hydroxyl
alkanoate Bio-based thermoset
plastic from renewable and petroleum resourceso Bio-based
polyurethane o Bio-based epoxy o Sorona
Glass fiber Carbon fiber
Thermoplastics o Polypropylene o Thermoplastic
polyester o Nylon o Polycarbonate
Thermoset resins
o Polyester o Epoxy o Phenolic o Polyurethane o Melamine
Advantages Low cost Low density High specific strength High specific
modulus Excellent tensile and
flexural properties Good acoustic and
thermal insulation Low embodied
energy Enhanced energy
recovery Low CO2 emissions Biodegradable
Enhanced energy recovery
Low CO2 emissions Biodegradability
Low cost High specific
strength High specific
modulus High moisture
resistance Chemical resistance Resistance to bacteria
growth
Versatile Low cost
Disadvantages Susceptible to moisture absorption
Susceptible to microbial attack
Surface treatment required to achieve good matrix adhesion
Susceptible to moisture absorption
Susceptible to microbial attack
Uneven deformation under unidirectional reinforcement
Unsafe Unhealthy
High pollutant emission
Use of non-renewable resources
146
Appendix D Wind Load Calculation in accordance with ASCE 7-02
Velocity pressure (qz) is calculated using the following equation and parameters given in
ASCE 7-02, thus resulting in 0.904 kPa.
qz = 0.00256 Kz Kzt Kd V2 I (Equation D-1)
Where,
qz = velocity pressure at height, z (assuming 40 m), as given in Eq. 6-15, p. 31
Kz = velocity pressure exposure coefficient evaluated at 40 m, 1.08 as given in
Table 6-3, p. 75
Kzt = topographic factor, 1 as given in Figure 6-4, p. 47-48
Kd = wind directionality factor. 0.85 as given in Table 6-4, p.76
V= basic wind speed in Michigan, 145 km/hr
I = importance factor, 1 as given in Table 6-1, p.73
The design pressure for components and cladding is calculated using the following
equation and parameters given in ASCE 7-02.
p = q (GCp) - qi (GCpi) (Equation D-2)
Where,
p = pressure on component for building with h > 18.3 m. as given in Eq. 6-23, p. 33.
q = qz for windward wall calculated at height z above the ground, 0.904 kPa as
calculated above.
qi = qz value at mean roof height, h, for leeward wall, side walls, and roof.
GCpi = internal pressure coefficient. ±0.18 as given in Fig. 6-5, p.49.
GCp = external pressure coefficient as given in Fig. 6-17, p. 67.

147
Figure D-1 External Pressure Coefficient, G Cp
Source: ASCE7-02, Fig. 6-17, page 67
Table D-1 External Pressure Coefficient (G Cp) from the Figure Above
Typical zone (Zone 4) Corner zone (Zone 5) Wall component
Effective facade area
GCp -GCp GCp -GCp
Mullion Panel
19.32 19.32
0.68 0.68
-0.75 -0.75
0.68 0.68
-1.22 -1.22
Therefore, resulting design wind load in typical and corner zone becomes -0.848 kPa and
-1.256 kPa respectively.
Figure D-2 Final Design Wind Load
Façade pressure (kPa)
Zone 4 Zone 5 z (m)
Windward Leeward Windward Leeward
40 0.775 0.840 0.775 1.256
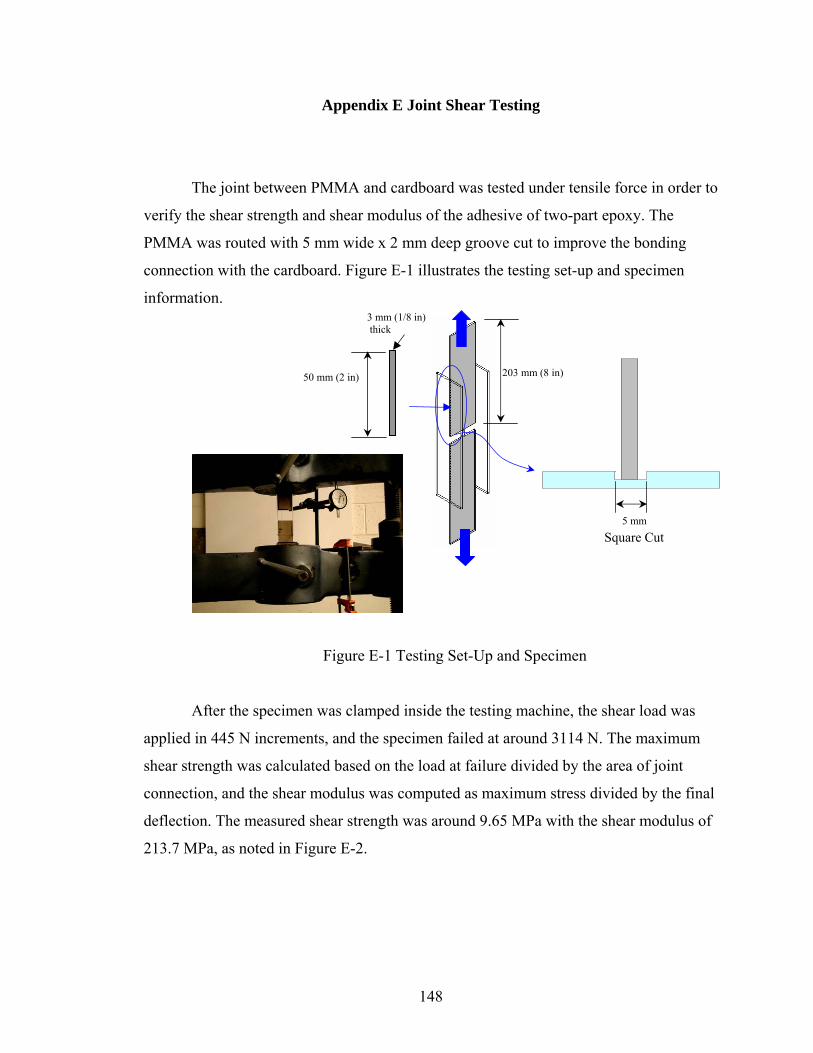
148
Appendix E Joint Shear Testing
The joint between PMMA and cardboard was tested under tensile force in order to
verify the shear strength and shear modulus of the adhesive of two-part epoxy. The
PMMA was routed with 5 mm wide x 2 mm deep groove cut to improve the bonding
connection with the cardboard. Figure E-1 illustrates the testing set-up and specimen
information.
Figure E-1 Testing Set-Up and Specimen
After the specimen was clamped inside the testing machine, the shear load was
applied in 445 N increments, and the specimen failed at around 3114 N. The maximum
shear strength was calculated based on the load at failure divided by the area of joint
connection, and the shear modulus was computed as maximum stress divided by the final
deflection. The measured shear strength was around 9.65 MPa with the shear modulus of
213.7 MPa, as noted in Figure E-2.
5 mm
Square Cut
50 mm (2 in)
3 mm (1/8 in) thick
203 mm (8 in)

149
Table E-1 Experimental Measurement of Load vs. Strain
Deflection (mm) Increment (mm) Load (N) Strain (%) Shear Stress (MPa)
0 0 0 0 0.00 0.762 0.762 44500 0.75 1.38 1.6764 0.9144 89000 1.65 2.76 2.5146 0.8382 133500 2.48 4.14 2.921 0.4064 178000 2.88 5.52 3.556 0.635 222500 3.5 6.89 4.064 0.508 267000 4 8.27 4.572 0.508 311500 4.5 9.65
Figure E-2 Shear Stress vs. Strain Curve
After a tensile test was conducted, a peel-off test was performed to confirm the peel-off
strength under the twist loading. Clear peel-off along the groove cut was found at the
joint area, and material failure of the cardboard occurred, as shown in Figure E-3.
Figure E-3 Material Failure at the Cardboard (left) After Shear Test and the Joint Failure (right) after Peel-Off test
0.00
2.00
4.00
6.00
8.00
10.00
12.00
0 1 2 3 4 5strain (%)
She
ar s
tres
s (M
Pa)

150
Appendix F LRFD for Testing Frame Members
1. Flexural member in accordance with load resistance factor design (LRFD)
A. Vertical frame of the specimen holder: bending and torsional-buckling moment check
A.1 Yielding
Nominal flexural strength (Mn) = Mp = FyZx = 22.24 kN-mm
Design flexural strength = Mn x Ωf = 20.14 kN-mm > 8.09 kN-mm (Pass)
Where, Fy = specified minimum yield stress (248MPa),
Zx = plastic section modulus about the x-axis (58174 mm3),
Ωf = resistance factor of 0.90 (LRFD).
A.2 Lateral-Torsional Buckling
Lateral-torsional buckling does not apply due to Lb = Lp as per ASCI (ASCI: p.
16.1-47). Where, Lb =distance between braces, and Lp = limiting laterally
unbraced length for limit state of yielding.
1.9m
W=7N/mm x 1.6
I: 3113411mm4 S: 48997mm3
Z: 58174mm3
Vertical beam
1.9m
Peak impact load of 6kips at the center of specimen
75mm
125mm

151
A.3 Result: There is no risk of yielding or buckling of the steel channel under the
design load. Expected deflection would be 2.794 mm using simple beam theory.
B. Horizontal frame of the specimen holder– bending and buckling moment check
The single leg angle needs to check with respect to the yielding, lateral-torsional
and leg local buckling. Critical moment describes as follows.
B.1 Yielding
Nominal flexural strength (Mn) = 1.5My = 8.33 kN-mm
Design flexural strength = Mn x Ωf = 7.50 kN-mm > 5.46 kN-mm (Pass)
Where, My = 5.55 kN-mm, and Ωf = resistance factor of 0.90 (LRFD).
B.2 Lateral-Torsional Buckling
Lateral-torsional buckling moment of the unequal-leg angles can be calculated
using the following equation.
I: 2118618mm4 S: 24744mm3
Horizontal beam
864 mm
330 mm 330 mm
6.67 kN x 1.6 6.67 kN x 1.6
Peak impact load of 6kips at the center of specimen
125mm
75mm
19mm

152
mmkNr
Lt
L
CEIMe w
zw
bz
53.14052.0
9.42
22
< 5.46kN-mm (Pass)
Where
Cb= lateral-torsional buckling modification factor as per AISC (= 1),
L = laterally unbraced length (= 864 mm),
Iz = minor principal axis moment of inertia (= 586886 mm4),
rz = radius of gyration for the minor principal axis (= 0.853),
t = angle leg thickness (= 6 mm),
βw = sectional property for unequal leg angles as per AISC (= -2.99)
B.3 Leg Local Buckling
For the compact section, leg local buckling does not apply as per AISC.
B.4 Result: The steel angle of the vertical specimen holder is not subjected to
yield or local buckling under the design load. Expected deflection is 2mm.
2. Compressive member in accordance with load resistance factor design (LRFD)
C. Diagonal angle – compressive strength for buckling of members
Slenderness ratio (KL/r) = 2565 mm/1.51 = 66.88
A: 1329 mm2 I: 2118618 mm4 S: 24744 mm3
r: 38 mm
Diagonal beam
11.12 kN x 1.6
6.67 kN
8.3 ft
5 ft
75mm
125mm
2.5 m 2..0 m
1.5 m

153
C.1 Compressive strength for flexural buckling of members
The nominal compressive strength (Pn) = FcrAg = 77.0 kN
The design compressive strength = Pn x Ωc = 69.4 kN > 17.8 kips (Pass)
When, yF
E
r
KL71.4 = 66.88 ≤ 133.68
y
F
F
cr FF e
y
658.0 122.7 MPa
Where,
2
2
r
KL
EFe
319.2 MPa
and Ωc= resistance factor of 0.90 (LRFD)
C.2 Result: There is no risk of buckling at the unequal leg angle under the actual
load.

154
Appendix G Charpy Impact Testing Report Provided By Bodycote Testing Group

155

156

157

158

159
160

161

162

163
Table H Energy Use and Environmental Emission per 1kg Material, Transportation, Energy Generation, and 1kg Recycling or Incineration
Substance Compartment Unit PMMA sheet Cardboard Epoxy Coated glass Uncoated glass
1 kg 1 kg 1 kg 1 kg 1kg
Coal, 18MJ per kg, in ground Energy resource kg 4.97E-01 1.36E-02 0.00E+00 1.71E-01 1.60E-01
Gas, natural, 36.6 MJ per m3, in ground Energy resource m3 2.25E+00 1.21E-02 5.78E-01 2.41E-01 2.29E-01
Gas, petroleum, 35 MJ per m3, in ground Energy resource kg 0.00E+00 0.00E+00 0.00E+00 1.84E-03 1.72E-03
Oil, crude, 42.6 MJ per kg, in ground Energy resource kg 1.01E+00 2.12E-01 5.05E+00 2.68E-02 2.51E-02
CO2 Air kg 6.85E+00 7.09E-01 1.10E+00 9.96E-01 9.68E-01
CH4 (=23kg CO2 equiv.) Air kg 2.44E-02 8.92E-04 0.00E+00 2.38E-03 2.32E-03
CF4(=5700kg CO2 equiv.) Air kg 0.00E+00 0.00E+00 0.00E+00 1.83E-07 1.69E-07
C2F6 (=11900kg CO2 equiv) Air kg 0.00E+00 0.00E+00 0.00E+00 2.04E-08 1.88E-08
Coal Energy MJ 8.95E+00 3.95E-01 0.00E+00 4.95E+00 4.63E+00
Natural gas Energy MJ 8.25E+01 4.23E-01 2.02E+01 8.44E+00 8.00E+00
Crude oil Energy MJ 4.32E+01 9.03E+00 2.15E+02 1.14E+00 1.07E+00
Total primary energy Energy MJ 1.35E+02 9.85E+00 2.35E+02 1.45E+01 1.37E+01
Ap
pen
dix H
En
ergy Use an
d E
nviron
men
tal Em
ission Inven
tory Data
163

164
Table H Energy Use and Environmental Emission per 1kg Material, Transportation, Energy Generation, and 1kg Recycling or Incineration (continued)
Substance
Al, 15% recycled
Construction steel
EPDM gasket Silicone Truck 16t Electricity NG
1 kg 1kg 1kg 1kg 1 tkm 1kWh 1 MJ
Coal, 18MJ per kg, in ground 2.20E+00 8.64E-01 5.68E-01 1.66E-01 8.80E-04 2.04E-01 3.30E-04
Gas, natural, 36.6 MJ per m3, in ground 3.91E-01 1.74E-02 6.22E-02 4.90E-01 3.34E-03 2.79E-04 3.09E-02
Gas, petroleum, 35 MJ per m3, in ground 0.00E+00 0.00E+00 6.50E-02 0.00E+00 0.00E+00 0.00E+00 0.00E+00
Oil, crude, 42.6 MJ per kg, in ground 1.10E+00 9.37E-02 1.60E+00 5.20E-01 6.91E-02 9.83E-04 2.92E-04
CO2 8.13E+00 9.00E-01 2.96E+00 1.16E+00 2.28E-01 2.98E-01 5.58E-02
CH4 (= 23kg CO2 equiv.) 1.50E-02 1.63E-04 9.94E-03 7.85E-03 2.77E-04 6.49E-03 1.60E-04
CF4 (= 5700kg CO2 equiv.) 2.78E-04 1.69E-09 8.28E-08 0.00E+00 0.00E+00 0.00E+00 0.00E+00
C2F6 (= 11900kg CO2 equiv) 3.09E-05 2.11E-10 9.20E-08 0.00E+00 0.00E+00 0.00E+00 0.00E+00
Coal 6.37E+01 2.51E+01 1.65E+01 4.81E+00 2.55E-02 5.91E+00 9.57E-03
Natural gas 1.37E+01 6.09E-01 2.18E+00 1.72E+01 1.17E-01 9.76E-03 1.08E+00
Crude oil 4.70E+01 3.99E+00 7.04E+01 2.22E+01 2.94E+00 4.19E-02 1.24E-02
Total primary energy 1.24E+02 2.97E+01 8.91E+01 4.41E+01 3.09E+00 5.96E+00 1.10E+00
164

165
Table H Energy Use and Environmental Emission per 1kg Material, Transportation, Energy Generation, and 1kg Recycling or Incineration (continued)
Substance Plastic.
Incineration Cardboard
incineration Plastic
recycling Cardboard recycling
Glass recycling Steel recycling Aluminum recycling
1kg 1kg 1kg 1kg 1kg 1kg 1kg
Coal, 18MJ per kg, in ground 1.08E-02 9.26E-04 4.93E-01 1.52E-02 -4.06E-02 -3.54E-01 -2.62E+00
Gas, natural, 36.6 MJ per m3, in ground 3.79E-03 2.52E-03 -9.43E-01 2.64E-01 1.09E-01 -9.22E-03 -4.06E-01
Gas, petroleum, 35 MJ per m3, in ground 3.90E-04 0 0.00E+00 0.00E+00 0 0 0.00E+00
Oil, crude, 42.6 MJ per kg, in ground 5.70E-03 3.51E-03 -5.68E-01 -3.99E-02 -1.55E-01 -2.31E-02 -1.20E+00
CO2 2.54E+00 1.61E-02 -3.37E-01 -5.55E-01 -3.76E-01 -7.94E-01 -9.33E+00
CH4 (= 23kg CO2 equiv.) 1.11E-04 3.60E-05 8.28E-05 1.31E-03 -4.44E-06 -1.99E-03 -1.57E-02
CF4 (= 5700kg CO2 equiv.) 2.95E-09 9.30E-05 0.00E+00 -6.88E-09 0.00E+00 -7.93E-09 -2.52E-04
C2F6 (= 11900kg CO2 equiv) 3.28E-10 3.00E-08 0.00E+00 -7.64E-10 0.00E+00 -8.81E-10 -2.80E-05
Coal 3.14E-01 2.69E-02 1.43E+01 4.40E-01 -1.18E+00 -1.03E+01 -7.61E+01
Natural gas 1.33E-01 8.82E-02 -3.30E+01 9.24E+00 3.82E+00 -3.23E-01 -1.42E+01
Crude oil 2.43E-01 1.50E-01 -2.42E+01 -1.70E+00 -6.60E+00 -9.84E-01 -5.11E+01
Total primary energy 6.89E-01 2.65E-01 -4.29E+01 7.98E+00 -3.97E+00 -1.16E+01 -1.41E+02
165

166
Appendix I Energy Performance Value Verification Process
Figure I-1 TCFS Sectional Details:
U-factor Verification Using THERM 5 in accordance with NFRC 100
U-factor at the head of a TCFS: 4.88 W/m2-K U-factor at the edge of a TCFS: 2.27 W/m2-K
U-factor at the core of TCFS: 2.55 W/m2-K
U-factor at the sill of TCFS: 3.86 W/m2-K U-factor at the edge of TCFS: 2.1 W/m2-K

167
Figure I-2 TCFS Plan Details: U-factor Verification Using THERM 5 in accordance with NFRC 100
Figure H-3 SHGC and VLT Verification using WINDOW 5 in accordance with NFRC 200
U-factor at the jamb of TCFS: 3.7 W/m2-K U-factor at the edge of TCFS: 3.0 W/m2-K

168
Table I-1 Energy Performance Values of TCFS and GCWS
U-factor
(W/m2-K) SHGC VLT
TCFS 2.589 0.302 0.305
Uncoated GCWS 2.986 0.615 0.656
Coated GCWS 1.862 0.313 0.484
Figure I-4 eQUEST Output of TCFS

169
.2 Uncoated GCWS (Clear 6mm + A.S. + Clear 6mm)
Figure I-5 eQUEST Output of Uncoated GCWS: (6 mm clear glass + 12 mm air space + 6 mm clear glass)

170
L3.3 Coated GCWS (Clear 6mm with VRE1559 + A.S. + Clear 6mm)
Figure I-6 eQUEST Output of Coated GCWS: (6 mm clear glass with VRE1559 + 12 mm air space + 6 mm clear glass)

171
BIBLIOGRAPHY

172
Abeysundra, U., Babel, S., Gheewala, S. & Sharp, A. (2007). Environmental, economic and social analysis of materials for doors and windows in Sri Lanka, Building and Environment, 42, 2141-2149. American Architectural Manufacturers Association (AAMA). (1996). Maximum allowable deflection of framing systems for building cladding components at design wind loads (AAMA TIR-A11-1996). Illinois; AAMA. American Institute of Steel Construction. (2006). Steel construction manual (13th ed.). Chicago: American Institute of Steel Construction, Inc. American National Standard. (2004). ANSI Z97.1-04: American national standard for safety glazing materials used in buildings – safety performance specifications and methods of test. New York: ANSI. American Society of Civil Engineers (ASCE). (2002). Minimum design loads for buildings and other structures (ASCE 7-02). VA: Structural Engineering Institute. American Society of Heating, Refrigerating and Air-conditioning Engineers, Inc. (1997). ASHRAE handbook - fundamentals (I-P ed.). Atlanta: ASHRAE, Inc. American Society for Testing and Materials. (2006). ASTM D228-06: Standard test method for linear thermal expansion of solid materials with a push-rod dilatometer. Philadelphia: ASTM. American Society for Testing and Materials. (1998). ASTM D570-98: Standard test method for water absorption of plastics. Philadelphia: ASTM. American Society for Testing and Materials. (2003). ASTM D635-03: Standard test method for rate of burning and/or extent and time of burning of plastics in a horizontal position. Philadelphia: ASTM. American Society for Testing and Materials. (1999). ASTM D1044-99: Standard test method for resistance of transparent plastics to surface abrasion. Philadelphia: ASTM. American Society for Testing and Materials. (2004). ASTM D 2843-04 Standard Test Method for Density of Smoke from the Burning or Decomposition of Plastics. Philadelphia: ASTM. American Society for Testing and Materials. (2001). ASTM D2990-01: Standard test method for tensile, compressive, and flexural creep and creep-rupture of plastics. Philadelphia: ASTM. American Society for Testing and Materials. (2000). ASTM D3273-00: Standard test method for resistance to growth of mold on the surface of interior coatings in an environmental chamber. Philadelphia: ASTM.
173
American Society for Testing and Materials. (1995). ASTM D 3274-95: Standard Test Method for Evaluating Degree of Surface Disfigurement of Paint Films by Microbial (Fungal or Algal) Growth or Soil and Dirt Accumulation. Philadelphia: ASTM. American Society for Testing and Materials. (2003). ASTM D3801-03: Standard test method for comparative burning characteristics of solid plastics in a vertical position. Philadelphia: ASTM. American Society for Testing and Materials. (2006). ASTM D6110-06: Standard test Methods for determining the Charpy impact resistance of notched specimens of plastics. Philadelphia: ASTM. American Society for Testing and Materials. (2007). ASTM E 84-07: Standard Test Method for Surface Burning Characteristics of Building Materials. Philadelphia: ASTM. American Society for Testing and Materials. (2000). ASTM E96-00: Standard test method for water vapor transmission of materials. Philadelphia: ASTM. Ashby, M., & Johnson, K. (2005). Materials and design. London: Elsevier. Baillie, C. (Ed.). (2004). Green composites: Polymer composites and the environment. Abington, Cambridge: Woodhead Publishing. Bayer Sheet Europe. (2004), Technical information: Makrolon and Vivak environmental aspects. June 2005, from http://www.proplastik.eu/File/lati/Environmental%20Aspects.pdf?PHPSESSID=71ef8d3caae1e34e9fa6e028a362271f. Bentley. (2007). STAAD.Pro (Version 2007) [Computer software]. Exton, PA: Bentley. Benayoune, A., Aziz, A., Samad, A., Trikha, D.N., Abdullah Abang Ali, A., Ashrabov, A.A. (2006). Structural behaviour of eccentrically loaded precast sandwich panels, Construction and Building Materials, 20(9), 713-724. Bitzer, Tom. (1997). Honeycomb technology: Materials, design, manufacturing, applications, and testing. New York: Chapman & Hall. Carmody, J., Selkowitz, S., Lee, E., Arasteh, D., & Willmert, T. (2004). Window systems for high-performance buildings. New York: Norton. Chen, T.Y., Burnett, J., & Chau, C.K. (2001). Analysis of embodied energy use in the residential building of Hong Kong. Journal of Energy, 26, 323-340. Chong, Ken P., & Hartsock, John A. (1993). Structural analysis and design of sandwich panels with cold-formed steel facings, Thin-Walled Structures, 16(1-4), 199-218.

174
Citherlet, S., Di Guglielmo, F., & Gay, J. (2000). Window and advanced glazing systems life cycle assessment, Energy and Buildings, 32, 225-234. Corbie`re-Nicollier, T.B., Lundquist, L., Leterrier, Y., Ma°nson, J.-A.E., & Jolliet, Y.O. (2001). Life cycle assessment of biofibres replacing glass fibres as reinforcement in plastics. Journal of Resources, Conservation, and Recycling, 33, 267-287. Datta, G. (2001). Effect of fixed horizontal louver shading devices on thermal performance of building by TRNSYS simulation. Journal of Renewable Energy, 21, 497 – 507. Davies, J.M. (Ed.). (2001). Lightweight composite construction. Boston: Wiley-Blackwell. Department of Energy (DOE). (2007). 2007 Buildings energy data book. February 2007, from http://buildingsdatabook.eren.doe.gov/. Dong, J., Sun, Q., & J-Y, W. (2004). Basic study of corn protein, zein, as a biomaterial in tissue engineering, surface morphology and biocompatibility. Journal of Biomaterials, 25, 4691-4697. Energy Information Administration. (1995). Measuring energy efficiency in the United States’ economy: A beginning. October 1995, from http://tonto.eia.doe.gov/ftproot/consumption/0555952.pdf. Energy Information Administration. (2007). International energy outlook. Retrieved May 2007, from www.eia.doe.gov/oiaf/ieo/index.html. Foss, R. (1999). Safety glass testing: Human head impactor simulation by dynamic transient analysis. Proceedings of 7th glass processing days. 1, 444-450. Franklin Associates and Prairie Village. (1998). Characterization of building-related construction and demolition debris in the United States (EPA530-R-99-034). Retrieved June 1998, from http://www.epa.gov/epaoswer/hazwaste/sqg/c&d-rpt.pdf. Gennadios A. (Ed.). 2002. Protein-based films and coatings. Boca Raton, FL: CRC press. Gentle, C. R., & Lacey, M. R. (1999). Design of a novel insulated construction material Materials & Design, 20(6), 311-315. Gere, J. (2006). Mechanics of materials (6th ed.). Ontario: Thomson. GE Plastics. (n.d.). Oxygen and water permeability. from http://kbam.geampod.com/KBAM/Reflection/Assets/10620.pdf. Glass Association of North America (GANA). (2004). Glazing manual. Kansas; GANA.

175
Graedel, T. E. (1998). Streamlined life-cycle assessment. Englewood Cliffs, NJ: Prentice Hall. Institute of Structural Engineers. (1999). Structural use of glass in buildings. London: SETO. International Code Council. (2003) International building code. New York: American Institute of Architects. Joshi, S.V., Drzal, L.T., Mohanty, A.K., & Arora, S. (2003). Are natural fiber composites environmentally superior to glass fiber reinforced composites?. Journal of Composites, Part A (35), 371-376. Harrison, J. (2000). Seasonally selective passive solar shading system. United States Patent Number 6,105,318, from http://www.uspto.gov/patft/index.html. Hayes, R. and Bonadies, A.M. (2007). A new hard coats for automotive plastics. Finishing Today, 83(12), 24-27.
Hough, R. (1980) Sandwich panels from recycled drink cans—A structural appraisal. Building and Environment, 15(1), 57-61. Huberman, N., Pearlmutter, D. (2008). A life-cycle energy analysis of building materials in the Negev desert. Journal of Energy and Buildings, 40, 837-848. Hylton, D.C. (2000). Understanding plastics testing. Cincinnati: Hanser. International Organization of Standards. (2006). ISO 14040:2006 environmental management – life cycle assessment – principle and frame work. Ireland: National Standard Authority of Ireland. Jacob, L. (2001). A critical review of impact testing and classification of safety glass for use in buildings. Proceedings of 9th glass processing days. 1, 268-273. Jaillon L., Poon, C.S., & Chian, Y.H. (in press). Quantifying the waste reduction potential of using prefabrication in building construction in Hong Kong. Journal of Waste Management. Joshi, S. V., Drzal, L. T., Mohanty, A. K., Arora, S. (2003). Are natural fiber composites environmentally superior to glass reinforced composites?. Science and Technology, 63, 1377–1385. Katsamberis, D., Browall, K., Iacovangelo, C., Neumann, M., & Morgner, H. (1997). Highly durable coatings for automotive polycarbonate glazing. Journal of Progress in Organic Coatings, 34, 130-134.

176
Kuenzi, E.W. (1961). Structural sandwich design criteria. US Forest Products Laboratory Report No. 2161, Madison: Forest Products Laboratory. Lawrence Berkeley National Laboratory. (2001). Window (Version 5.2) [Computer software]. Berkeley, CA: LBNL. Lawrence Berkeley National Laboratory. (2006). THERM (Version 5.2) [Computer software]. Berkeley, CA: LBNL. Lawrence Berkeley National Laboratory. (2001). eQUEST (Version 3.6) [Computer software]. Berkeley, CA: LBNL. Limmatvapirat, S., Limmatvapirat, C., Luangtana-anan M., Nunthanid, J., Oguchi, T., Tozuka, Y., et al. (2004). Modification of physicochemical and mechanical properties of shellac by partial hydrolysis. International Journal of Pharmaceutics, 278, 41-49. Lokensgard, E. (2004). Industrial plastics. Clifton Park: Thomson Learning. Loughran, P. (2003). Falling glass: Problems and solutions in contemporary architecture. Basel, Switzerland: Birkhauser. Lívio Boni, T., & Almeida S. (2008). Laterally supported sandwich panels subjected to large deflections—Part 1: Test apparatus design and experimental results Thin-Walled Structures, 46(4), 413-422. Margolis, J. (2006). Engineering plastics handbook. New York: McGraw – Hill. McGuire, R.G., & Hagenmaier R.D. (1996). Shellac coatings for grapefruits that favor biological control of penicillium digitatumby candida oleophila. Biological Control, 7, 100-106. Mohanty, A., Misra, M., & Drzal, L (Eds.). (2005). Natural fibers, biopolymers, and biocomposites. Boca Raton, FL: CRC press. National Fenestration Rating Council, Inc. (2004). NFRC 100-2004: Procedure for determining fenestration product U-factors. MD: National Fenestration Rating Council. http: nfrc.org. National Fenestration Rating Council, Inc. (2004). NFRC 201-2004: Procedure for interim standard test method for measuring the solar heat gain coefficient of fenestration systems using calorimetry hot box methods. MD: National Fenestration Rating Council. from http: nfrc.org. Office of Solid Wastes and Emergency Response. (2003). Municipal solid waste in the United States: 2001 facts and figures, EPA530-R-03-011, from http://www.epa.gov/epaoswer/non-hw/muncpl/pubs/msw2001.pdf.

177
Oketani, Y., Kikuta, M., & Aratani, S.(2001). Investigation of repeatability and reproducibility of the shot bag impactor. Proceedings of 9th glass processing days, 1, 676-681. from www.glassfiles.com. Papaefthimiou, S., Syrrakou, E., & Yianoulis, P. (2006). Energy performance assessment of an electrochromic window, Thin Solid Films, 502, 257-264. Pappu, A., Saxena, M., & Asolekar, S.R. (2006). Solid wastes generation in India and their recycling potential in building materials. Journal of Building and Environment, 42, 2311-2320. Pokharel, N., & Mahendran, M. (2003) Experimental investigation and design of sandwich panels subject to local buckling effects, Journal of Constructional Steel Research, 59(12), 1533-1552. Pollack, H. (1967). Applied physics. Englewood cliffs, New Jersey:Prentice-Hall, Inc. Rathbun, H.J., Zok, F.W., & Evans, A.G. (2005). Strength optimization of metallic sandwich panels subject to bending, International Journal of Solids and Structures, 42(26), 6643-6661. Robbins, D.H. (1976). Comparative testing of anthropomorphic dummy and a standardized impactor for glazing materials. UM-HSRI document number 35897, MI: University of Michigan Highway Safety Research Institute. Rosato, D.V., Schott, N.R., and Rosato M.G. (Eds.). (2001). Plastics Engineering Manufacturing and Data Handbook. Norwell, MA: Kluwer Academia Publishers. Ryntz, R., Bauer, D.R., Fraser, K., & Glogovsky, T. ( 2001). Plastics and coatings: durability, stabilization, testing. Cincinnati: Hanser Gardner Publications. Scheuer, C., Keoleian, G., & Reppe, P. (2003). Life cycle energy and environmental performance of a new university building: modeling challenges and design implications. Energy and Buildings, 35, 1049-1064. Schmauder, T., Nauenburg, K-D., Kruse, K., & Ickes, G. (2006). Hard coatings by plasma CVD on polycarbonate for automotive and optical applications. Thin Solid Films, 502, 270-274. Selkowitz, S. (2008). Fenestration solution for zero energy buildings. Presented at the Building Enclosure Science and Technology (BEST) conference, Minneapolis, MN, from http://www.aia.org/SiteObjects/files/BEST_Selkowitz_6_2008.pdf. Shah, V. (2007). Handbook of Plastics Testing and Failure Analysis. NJ: Wiley.

178
Sutherland, R.J.M. (2008). Materials and structural techniques. The Structural Engineer, 86(14), 118-123. The Institute of Structural Engineers. (1999). Structural use of glass in buildings. London: SETO. Thormark, C. (2006). The effect of material choice on the total energy need and recycling potential of a building, Building and Environment, 41, 1019-1026. Toakely, A. R. (1977). Stresses and safety levels for glass liable to human impact. Building and Environment, 12, 87-95. Trinnaman, J. & Clarke, A. (2004). 2004 Survey of energy resources. London: Elsevier. Troitzsch, J. (2004). Plastics flammability handbook. Cincinnati: Hanser. Valdevit, L., Wei, Z., Mercer, C., Zok, F.W., & Evans, A.G. Structural performance of near-optimal sandwich panels with corrugated cores, International Journal of Solids and Structures, 43(16), 4888-4905. Wypych, G. (Ed.). (1999). Weathering of plastics: Testing to Mirror Real Life Performance (Plastics & Elastomers). Norwich, NY: Plastics Design Library. Wool, R., & Sun, S. (2005). Bio-based polymers and composites. San Diego: Elsevier Academic Press. Xu S., Jayaraman K., Morin C., & Pecqueux N. (2008). Life cycle assessment of wood-fiber-reincored polypropylene composites. Journal of material processing technology, 198, 168-177. Yasantha Abeysundraa, U.G, Babela, S., Gheewalab, S., & Sharpa, A. (2007). Environmental, economic and social analysis of materials for doors and windows in Sri Lanka. Building Environment, 42, 2141-2149. Young, H., & Freedman, R. (2000). Sears and Zemansky’s University physics (10th ed.). San Francisco: Addison-Wesley. Young, W., & Budynas, R. (2002). Roark’s formulas for stress and strain (7th ed.). New York: McGraw-Hill Companies, Inc. Weir, G. & Muneer, T. (1998). Energy and environmental impact analysis of double-glazed windows, Energy Conversion and Management, 39, 243-256.
179
Product data downloaded from online: Cyro. (1998). Acrylite AR technical data. Retrieved 1998, from http://cyro.com/NR/rdonlyres/516E2495-C963-4337-814F-EF0C9F9C7388/0/1970ACRYLITEARTechData.pdf Cyro. (2001). Acrylite FF technical data. Retrieved 2001, from http://cyro.com/NR/rdonlyres/3728C0E9-BE9A-4C19-932F-586C2937EC12/0/1121DFFPhysicalProperties.pdf Sheffield plastics inc. (2008). Makrolon GP product data. Retrieved 2008, from http://www.sheffieldplastics.com/web_docs/PDS004_GP.pdf Sheffield plastics inc. (2003). Makrolon AR product data. Retrieved 2003, from http://www.sheffieldplastics.com/web_docs/PDS001_AR.pdf Retrieved October 3, 2000, from http://www.commerce.state.wi.us/SBdocs/SB-CommercialBuildingsXProductEvaluations200426-l.pdf Bayer. (2003). Makrolon AR technical data. Retried 2003, from http://www.sheffieldplastics.com/web_docs/7955AR_DS.pdf Material Property Data. (n.d.), from http://www.matweb.com/Search/MaterialGroupSearch.aspx?GroupID=282 GE Plastics. (1997). Lexan MR10 product data. Retrieved January, 1997, from http://www.southernsteelwindows.co.nz/images/MR10%20Data%20Sheet.pdf GE Plastics. (1997). Polymers for great outdoors. Retrieved August, 1997, from http://kbam.geampod.com/KBAM/Reflection/Assets/8700.pdf Altuglas. (2000). Tuffak XL weatherable polycarbonate sheet. Retrieved from June, 2000, from http://www.plexiglas.com/literature/pdf/95.pdf Bayer. (2003). Flame inhibiting product data. Retried March, 2003, from http://www.professionalplastics.com/professionalplastics/content/FI5000.pdf
PaneliteLLC. (n.d.) Panelite brochure, from http://www.e-panelite.com/downloads/PANELITE_BROCHURE.pdf Altuglas product brochure, from www.altuglas.com/literature/pdf