
Structural Change and U - Stanford University · Structural Change and U.S ... controlling for any...
24
Structural Change and U.S. Energy Use: Recent Patterns By Hillard G. Huntington* EMF OP 65 July 2009 forthcoming Energy Journal * Executive Director, Energy Modeling Forum, Stanford University, Stanford, CA 94305-4026; email: [email protected] . The author acknowledges very helpful comments from Gilbert Metcalf and two anonymous referees but assumes full responsibility for the views and any errors or omissions. Energy Modeling Forum Stanford University Stanford, CA 94305-4026
Transcript of Structural Change and U - Stanford University · Structural Change and U.S ... controlling for any...

Structural Change and U.S. Energy Use:
Recent Patterns
By Hillard G. Huntington*
EMF OP 65 July 2009
forthcoming Energy Journal
* Executive Director, Energy Modeling Forum, Stanford University, Stanford, CA 94305-4026; email: [email protected]. The author acknowledges very helpful comments from Gilbert Metcalf and two anonymous referees but assumes full responsibility for the views and any errors or omissions.
Energy Modeling Forum Stanford University
Stanford, CA 94305-4026

Structural Change and U.S. Energy Use: Recent Patterns
Abstract
The role of structural change in energy use patterns is evaluated using a recently developed data set based upon the NAICS codes for the United States. Shifts between 65 industries in the commercial, industrial and transportation sectors account for almost 40 percent of the reduction in the US economy’s aggregate energy intensity over the 1997-2006 period. Excluding the transportation industries, these shifts account for 54 percent of the total effect. These estimates are more than twice the magnitude of those due to shifts between five major sectors of the economy. Since all these estimates use the preferred Fisher index, the results are more likely due to the most recently available data than to methodological issues like the decomposition approach.

Structural Change and U.S. Energy Use: Recent Patterns
1. INTRODUCTION
Structural economic change has been a cornerstone of economic growth over many
decades.1 During the industrialization process, countries experience steadily declining
agricultural shares, steadily rising services shares, and a reversal of manufacturing shares where
expansions are followed by retractions. Developing economies at various stages of
industrialization are now embarking rapidly on this process. Until the recent financial meltdown,
only six economies experienced negative growth in 2006.2 Continuance of these trends will
have major implications for world energy supplies and greenhouse gas concentrations. As they
strive for economic maturation, these nations will look to the experiences of certain high-income
countries, like the United States.
Unfortunately, the U.S. experience is far from transparent, reflecting some very
significant data hindrances on economic structure and energy use. Aggregate energy intensity
(relative to GDP) in the U.S. economy declined by 27 percent over the 1985-2004 period. The
U.S. Department of Energy conducted an extensive analysis of the issue and concluded that
shifts in the composition of the U.S. economy caused a 17 percent decline over this period, while
the remaining 10 percent was achieved by improving energy intensity within individual
subsectors or industries.3 These results contrast with a recent study by Metcalf (2008), who
concluded that the evidence clearly placed the emphasis on the improvements made within each
sector rather than on the shifts away from energy-intensive sectors. 1 Chenery (1960). 2 International Monetary Fund World Economic Outlook data set. These six countries are Equatorial Guinea, Eritrea, Grenada, Ivory Coast, Timor-Leste and Zimbabwe. 3 This conclusion, the underlying analysis and the data set are documented and easily accessed at the following U.S. Department of Energy website: http://www1.eere.energy.gov/ba/pba/intensityindicators/total_energy.html.

Alternative perspectives on these trends can have significant implications for the
potential of energy policy to influence future energy efficiency trends. Energy-saving programs
are more likely to influence energy trends within a sector, while changes due to shifts in
economic and demographic structure are more likely to be independent of energy policy
mandates. This issue has become important in evaluating the role of California’s government
mandates in shaping the remarkable downward trend in electricity intensity in that state (e.g., see
Sudarshan and Sweeney, 2008).
This dichotomy in findings is interesting because both the DOE and Metcalf studies used
the same decomposition approach, the Fisher Ideal index. Thus, differences appear to be data
driven rather than methodology driven. The Metcalf study measured most activities in value
added or personal consumption expenditure from the National Income and Products Account,
although vehicle miles traveled was used for the transportation sector. In contrast, the
Department of Energy study used a mixture of information on normal climate, type of home
units, residential and commercial floor space, freight ton-miles, vehicles miles traveled, and
value added, depending upon the sector.4 Energy analysts often find physical or engineering
measures more appropriate than economic measures for representing energy service demands.
Thus, one could dismiss the discrepancy as simply reflecting these different attitudes on how to
define and measure the activity variables.
A second possibility is that the two studies may be measuring structural change quite
differently. Differentiating activity effects from improved technology within a sector is an
inherently ambiguous process. The appropriate detail level will depend upon the country, time
period and purpose of the analysis as well as data availability. Metcalf admits that his
decomposition is relatively broad, as he focuses on only the shifts between the four major energy 4 Later sections discuss the DOE approach in greater detail.
2

sectors rather than individual industries.5 His approach might be termed, “sectoral
decomposition,” because his focus rests on each major energy-using sector as an activity. The
Department of Energy study instead provides substantially more detail at the industry or
commercial floorspace by building type level. Their approach might be termed, “industrial or
sub-sector decomposition” because it explores shifting activities at a much more disaggregated
level.
This paper addresses the second explanation and finds results that are more similar to the
Department of Energy’s findings that structural economic change at the industrial level can be a
powerful explanation for changes in aggregate energy intensity. The implication is that factors
that are relatively independent of energy policy mandates appear to be a very important
contributor to these trends. A principal new development is the application of the Fisher Ideal
index to some recent data collected by a single source, the U.S. Bureau of Economic Analysis,
covering both economic and energy data. Although this data currently covers only the last
decade, the results are particularly germane to the central issue addressed by these other
researchers.
This study organizes a database6 that covers U.S. trends on five broad sectors for the
period following World War Two and on 65 different industries for the last decade. Section 2
briefly describes the decomposition method. Section 3 discusses results based upon a five-sector
analysis that closely follows the Metcalf approach. Section 4 emphasizes a much more
disaggregated perspective based upon 65 different North American Industry Classification
System (NAICS) industries. The BEA switched from older Standard Industrial Classification
(SIC) system to NAICS codes in order to be more compatible with the International Standard
5 He argues that more decomposition does not alter his results. Unfortunately, this argument does not hold for the more detailed data set described in section 4 of this paper. 6 All data is available from the author upon request.
3

Industrial Classification System (ISIC) used by the United Nations. The NAICS codes also
improve their representation of the economy’s structure for distinguishing goods, services and
information sectors in the economy. Section 5 highlights the key conclusions and remaining
issues for future research.
2. DECOMPOSITION APPROACH
There have now been a number of empirical studies documenting the role of structural
changes in shaping the demand for energy and the trends in energy intensity over time7. Studies
have separated structural shift from intensity trends within a sector for a number of countries and
over many different time periods. Over time, the techniques used to separate the effect of
structural change from other factors influencing aggregate energy intensity have improved.8
Nonetheless, one of the major shortcomings of these studies has been the difficulty in collecting
internally consistent data that is sufficiently detailed and that cover trends of more than one or
two decades. Reliable time series data that are routinely published from official sources without
proprietary restrictions are critical for understanding the evolution of these trends.
Aggregate energy intensity, usually defined as energy use divided by the economy’s real
gross domestic product, can be decomposed into activity shifts and within-activity intensity
effects. Activity shifts measure the change in the economy’s intensity due to the changing
composition of activities within the economy. Activities that grow faster (slower) than real GDP
become more (less) important. If the expanding sectors have sharply different energy intensities
than the sectors that are being replaced, the energy-GDP ratio will change even without any
reductions within each sector. The within-activity intensity effects, in contrast, measure changes
7 Ang and Zhang (2000) provide an extensive survey of the numerous studies on this topic. 8 Greening et al (1997) compare many of these approaches and their biases caused by an inexact decomposition of the two trends.
4

due to the energy intensity within each sector. Within-activity intensity effects result by
controlling for any adjustments in the economy’s structure. If energy intensities decline by 70
and 90 percent over a given period in two separate sectors with equal activity weights, the
combined within-sector effect for these sectors would be an 80 percent decrease.
Define the within-activity intensity trends as e, an array indicating a set of sectoral energy
intensities for multiple sectors in each year of the sample period. Next, define the relative
activity shifts as s, an array indicating how each sectoral activity moves relative to some
aggregate economic activity as real GDP. Aggregate energy intensity (E) can then be computed
across all activities as:
∑ ⋅= seE ( ’)
Since both e and s change between years, analysts need a reliable method to decompose the
contribution of each effect by establishing appropriate weights.9 This issue is not trivial, as
witnessed by the multiple studies supporting one approach over another.
All trends in this analysis are decomposed into Fisher indices as described by Boyd and
Roop (2004).10 The Laspeyres indices use the previous period’s intensity or relative activity
shift to aggregate across all sectors, and the Paasche indices use the current period’s intensity or
shift. The Fisher indices are the square root of the product of the Laspeyres and Paasche indices.
They provide an exact decomposition because the product of the activity-shift and within-activity
indices equals the aggregate energy index for the economy, with no remaining, unexplained
“interaction” effect that must be arbitrarily assigned to one or the other effect. Fisher indices are
9 Algebraically, letting E and Y refer to energy and output, e can be defined as Eit/Yit for sector i and year t, and s can be defined at Yit/ΣYit. 10 Please see the referenced paper for a formal development of the Fisher index-number approach and some of its advantages.
5

the approach usually applied to separating price and real product effects in the National Income
and Product Accounts (U.S. Bureau of Economic Analysis, 2006).
The Fisher index does not require a common output variable for all activities. It
measures activity as a trend relative to real GDP but does not require it to be a share or percent of
the total. Residential energy use can be measured relative to the number of households,
commercial energy use can be measured relative to building floor space, and non-personal
transportation can be measured relative to freight miles. This characteristic is an important
advantage when energy analysts want to measure energy efficiency changes relative to physical
or engineering activity levels rather than purely monetary measures like real value added or real
gross output.
3. ECONOMY SINCE 1949
Decomposition of long-term energy trends is particularly useful for developing insights
about the transformation of the energy system and its relationship to important problems like
global climate change. Data availability and reliability, however, represent a major hindrance to
very detailed industry assessments over long time periods. As a useful precursor to the more
detailed evaluation in the next section, this section evaluates trends for the 1949-2006 period
based upon five major sectors: agriculture, non-agricultural industrial, commercial,
transportation and residential.
3.1 Sectoral Data
The analysis decomposes the trends since 1949 for five major activities using the most
readily available public data that is updated routinely. US Energy Information Administration
6

(2007) reports total delivered energy in quadrillion British thermal units per year (Btu/yr) for
residential, commercial, industrial and transportation energy end-use sectors. The industrial
sector was disaggregated further into agriculture and all industry excluding agriculture. The US
Department of Agriculture’s Economic Research Service reports an index for energy inputs in
U.S. agriculture, which was converted to Btus on the basis of estimates provided by Miranowski
(2005).11 These estimates for the agricultural sector were subtracted from total industrial energy
use.
Commercial, agricultural and industrial (excluding agricultural) activities are real GDP in
those sectors.12 Real GDP (2000$) is computed by multiplying nominal GDP in 2000 by the
chain-type quantity indexes for value added (2000=100). There are no value added indicators
for the residential or personal transportation sectors. Residential activity is defined as real
personal consumption expenditures,13 while transportation activity is defined as highway vehicle
miles traveled for all vehicle types.14
Real GDP (2000$) for the commercial sector is the sum of private, service-related GDP
and federal, state and local government. This output variable is the activity associated with the
commercial sector’s energy consumption. For the industrial sector, real GDP is available from
1949 for agriculture, manufacturing, construction and mining. Agriculture was separated from
the remaining three industrial sectors to represent agriculture and other industry, consistent with
the disaggregation of energy use described above.
11 Missing values for 2005-2006 in this index were replaced by the 2004 value and can be easily updated as current data becomes available. Modest changes for agriculture energy use in these years have very little effect on the results presented in this paper. See U.S. Report of the President (2008), Table B-100, for current estimates from the US Department of Agriculture. 12 GDP by industry is available from US Bureau of Economic Analysis at http://www.bea.gov/industry/iedguide. htm#gpo. 13 Real personal consumption expenditures are available at http://www.bea.gov/national/. 14 US Department of Transportation, Federal Highway Statistics, Office of Highway Policy Information, http://www.fhwa.dot.gov/policy/ohpi/qftravel.htm.
7

The definitions used for sector activities are much closer to those used by Metcalf than by
the U.S. Department of Energy. This choice reflects the availability of public, non-proprietary
data at the sectoral level that can be updated easily with each year. The DOE definitions require
the analysis to begin with very detailed subsector activities and aggregate these trends into a
composite activity index comprised of these various components. Although their strategy is a
useful approach, it requires combining many different data sets using different definitions and
interpolating between years for missing data.
For example, the residential sector is adjusted for household size and calibrated to census
degree-day weather data, after it has been disaggregated into 20 separate components comprised
of four census regions for each of five housing types (single-family detached units, single-family
attached units, mobile homes, multi-family homes of 2-4 units, and larger multi-family homes
with more than 4 units). The commercial sector activity is calibrated again to weather degree-
days and relates directly to commercial floor space for 8 building types based upon F.W. Dodge
data that is not publicly available on an updated basis. Industrial activity is primarily value
added and thus similar to the approach used in the next section.
3.2 Results
The five-sector decomposition focuses upon structural economic change at a very broad
level where activity shifts primarily capture the replacement of goods-producing by service-
producing industries. These shifts are often due as much to changes in demand within the
economy as they are to industrial relocation and outsourcing based upon relative regional costs
(Schettkat and Yocarini 2006).
Table 1 summarizes aggregate energy intensity trends for the United States over the
1949-2006 period where sectoral activity-shift and within-sector intensity effects are measured
8

for five major sectors: residential, agricultural, non-agricultural industrial, commercial and
transportation. Through 2006, aggregate energy intensity declined by 1.40 percent per year, with
a very modest 13.5 percent of the total effect due to sectoral shifts within the economy (0.19
percent per year). The aggregate intensity fell nearly five times faster after 1972 than before the
first oil price shock.15 Both activity-shift and within-sector intensity experienced these sharp
declines, but the shift effect contributed a relatively modest amount of the total effect in either
period.
Economy-wide impacts, however, can be sensitive to different measures of sectoral
activity. In particular, the choice of residential sector activity can be very dramatic. Table 2
compares results for the aggregate effects for within-sectors and across-sectors adjustments,
based upon different activity definitions for the residential sector. The shift effect accounts for
only 13.8 percent of the total economy’s aggregate energy intensity decline when residential
energy consumption is measured relative to personal consumption expenditures (PCE). It is
relatively small in this case, because PCE grows almost as rapidly as real GDP. This measure
was used by Metcalf in his study.
The shift effect is modestly more pronounced when residential activity is measured by
PCE for housing services16 but it exceeds one-third of the total effect when measured relative to
the value of household time or the population. The DOE approach for measuring residential
sector activity probably falls between those based upon PCE and the latter set of estimates,
although their approach could not be calibrated with our data, as discussed previously. The
value of household time was computed as the product of nonwork hours, the after-tax wage rate
15 Although the break after 1972 dominates in this analysis, it should be emphasized that the major break in energy and carbon dioxide intensity trends actually occurs around World War One for the United States (Huntington 2000). 16 U.S. Bureau of Economic Analysis, National Economic Accounts, available at http://bea.doc.gov/national/index. htm. Boyd and Laitner (2001) suggested the use of this variable for measuring household activity.
9

(valued in 2000$) and population.17 Following Prescott (2004), non-work hours per week were
computed as 100 – (work hours) and a 40 percent marginal tax rate was assumed. Since
household time and population grow much more slowly than real GDP, there appears to be a
much larger shift away from the real GDP growth rate for these measures.
Although some measures of residential sector activity increase the relative importance of
activity shifts, the overarching conclusion is that one must understand the changes due to within-
sector intensity changes in order to comprehend changes in the aggregate energy intensity over
either period. But, are these within-sector intensity changes reflecting improved energy-using
technologies and processes within each industry or shifts between industries within the same
sector? A priori, one does not know the relative strengths of the excluded shifts between
industries. Some energy-intensive industries may decline in relative importance over time, while
other energy-intensive industries may grow.
The next section will develop additional insights from a more detailed decomposition
over a shorter period, 1997-2006. Since household and personal transportation services do not
produce output that is sold in markets, these activities will be excluded in these estimates.
Table 3 compares the post-1971 with the post-1996 periods for the remaining three sectors.
It does not appear that activity shifts are any more dominant in these results simply
because the analysis covers a shorter period. Within-sector efficiency improvements may
require a much longer adjustment period to allow new capital-stock vintages to replace older
equipment. Activity shifts, in contrast, can materialize much more quickly. These shifts,
however, have often operated much less consistently in other studies (Ang and Zhang, 2000) and
can contribute to increasing as well as decreasing energy intensity trends. Table 3 shows faster
17 For average weekly hours and average hourly earnings for the total, non-agricultural work force, see Economic Report of the President (2008, Table B-46). For US population estimates, see US Energy Information Administration (2007, Table D.1).
10

annual declines in the shorter 1997-2006 period for aggregate, activity-shift and within-sector
trends, but a very similar contribution to the total effect from shifts between sectors (19.1
percent).
4. THE ECONOMY OVER THE LAST DECADE
4.1 Industry Data
Aggregate energy intensity was disaggregated for a shorter, 1997-2006 period18 using
data provided by the U.S. Bureau of Economic Analysis (BEA). This decomposition focuses
explicitly on those activities included in the National Income and Product Accounts (NIPA) and
that contribute directly to Gross Domestic Product (GDP), the denominator in the energy
intensity measure. For this reason, residential and personal highway transportation activities are
excluded because households do not sell the household activities that use energy in their homes
or in their personal passenger vehicles. The BEA data covers 65 different industries that include
two-digit NAICS sectors for the manufacturing sector as well as activities in other industrial
sectors and in the private commercial and government sectors. (See Appendix Table A.1.)
Unlike many previous studies, sectoral activity is measured as real value added rather than
sector-specific activities such as freight miles traveled or commercial floor space. When
measured this way and inverted, the energy intensities reflect energy productivity effects, which
are not total factor productivity effects because they ignore the productivity contributions of
other inputs.
Real value added (2000$) was extracted for 1997-2006 from the BEA website at:
http://www.bea.gov/industry/iedguide.htm#gpo. The relative economic importance of each 18 Structural shifts and energy intensity trends began to change dramatically in 1997 and 1998 (Boyd and Laitner, 2001).
11

industry was adjusted by excluding output that was "unallocated" to any individual sector.
Consistency between the energy and output data was deemed as critically important. The source
did not report energy consumption in caloric heat (Btu) values, the standard measure in most
energy decomposition studies.19 However, real energy inputs (2000 $) could be derived from
reported fuel and power quantity indices, which adjust energy expenditures for the change in
energy prices between one year and another. Energy inputs for 2000 were set equal to nominal
expenditures in 2000. Real energy inputs for other years in the 1997-2006 period equal the
change in real energy inputs from their 2000 levels times these benchmark values.20 Thus,
energy inputs in the year 2001 were computed as the 2000 input level times the change in the
real energy quantity index between 2000 and 2001.
This price-weighted measure has an important advantage, because it controls for the
changing quality of energy consumption over time. It weights the more expensive electricity use
more than fossil fuel use. The economy’s electrification expands quality-adjusted energy more
rapidly than caloric heat energy, because a Btu unit of electricity can be used for many purposes
that a Btu unit of direct fossil fuel cannot. The BEA price-based energy consumption index
increases by a total of 7.5 percent over the 1997-2006 period, resulting in an 18.8 percent decline
in aggregate energy intensity. (See Appendix Table A.1). That estimate appears slightly lower
but still comparable to the 8.2 percent increase for energy consumption when fuel consumption
by sector (excluding residential) is based upon delivered prices, as reported by the US Energy
19 Official government energy data does not allow reliable time series for industry-level energy consumption to be constructed, because some years are reported in the older SIC codes and more recent years in the newer NAIC codes. Bridging tables could have been used, but any imprecision in applying them might have introduced errors of unknown direction and magnitude. 20 The data constraint for this section is real energy use by sector, which is computed by BEA for the NAICS codes only for the 1997-2006 period. The output series extend back to 1977.
12

Information Administration (EIA, 2007). Energy consumption in heat-content terms (Btus), by
contrast, increases more slowly by 3.9 percent in the same data set for this period.
Focusing upon quality-adjusted units is similar to the approach of reporting separate
caloric heat trends for electricity and fossil fuels (Boyd et al, 1987). In either case,
electrification has an important separate role in economic activity that cannot be captured simply
by measuring the change in physical Btus.
Having a common data source on energy and economic activities is an important
difference from many previous studies that have decomposed energy intensity trends. Problems
in defining sectors consistently across energy and economic variables often emerge and are
seldom explicitly acknowledged. As a result, large errors may emerge, despite the use of the
most precise index-number procedure. Reclassification of the economic sectors from SIC to
NAICS codes further complicates efforts to develop consistent classifications across both
variables for any reasonable length of time. Using the NAICS code, however, appears consistent
with policy decisions to measure economic activity by industry by codes that appear more
relevant for today’s economy. This choice also facilitates future data updates.
4.2 Results
Table 4 summarizes aggregate energy intensity trends for the United States over the
1997-2006 period where sectoral activity shift and within-industry intensity effects are measured
for 65 industries that comprise total GDP. Although the decline in aggregate energy intensity is
similar to the 1972-2006 period in Table 1, the industry-shift effects are about twice the size of
the sectoral-shift effects estimated above. The aggregate energy intensity declined by 2.1
percent per year, with 39% due to activity shifts within the economy (0.83 percent per year).
The remaining within-intensity trends (61 percent) still account for more than half of the total
13
effect, confirming the findings of previous studies (Ang and Zhang, 2000), but they now
represent a much smaller share than when based upon shifts between major energy-using sectors.
Replacing sectoral decomposition with industrial decomposition represents an important
improvement when evaluating the U.S. within-sector experience.
The remaining columns in this table provide further insights into the energy intensity
trends in the U.S. economy. Manufacturing shows pronounced declines in activity shifts and
within-sector intensities, culminating in a very strong decline in its aggregate intensity (5.57
percent per year). Non-personal transportation activities, on the other hand, show a much
slower decline in aggregate intensity (2.93 percent per year), largely because transportation
activities are relatively energy intensive and have been gaining relative to GDP. These latter
shifts operate against the shifts away from energy-intensive industries in the other major sectors.
In this analysis, non-personal transportation includes air, rail, water, truck, transit, ground-
passenger, and other transportation services including support activities. Warehousing and
storage has also been added to this group because these activities are strongly oriented towards
transportation services.
The table also emphasizes the important role of activity shifts within the commercial
sector, which includes federal, state and local governments. More than 90 percent of the decline
in the aggregate energy intensity in the commercial sector can be attributed to shifts between
industries relative to total GDP. These industries comprise a very large segment of the whole
economy, accounting for about 75 percent of economic output compared to manufacturing’s 15
percent.
One might want to exclude transportation from the other sectors, because activity shifts
were increasing rather than decreasing aggregate energy intensity. Structural change accounts
14

for more than half (54%) of the aggregate energy intensity decline in the remaining, non-
transportation sectors.
5. CONCLUSION
Prior to 1972, energy intensity in the US economy was declining by about 0.4 percent per
year. If household activity is measured by personal consumption expenditures, this decline was
due mainly to changes in energy intensity within each broad sector, an effect called within-sector
intensity changes in this analysis. After 1972, the economy’s declining energy intensity
accelerated to more than 2 percent per year, with only about 13 percent due to shifts between the
five major, broad sectors of the economy. There is some evidence that the structural shift effect
has increased after 1997, but its contribution to the total economy’s effect is still relatively mild,
about 20%.
Expanding the decomposition from 5 broad sectors to 65 different industries in the
industrial, commercial and non-personal transportation sectors alters this conclusion
substantially. Economywide, the structural effect is about twice as large as when it was based
upon the five broad sectors. Excluding the transportation industries, structural shifts at the
industry level over the last decade have accounted for more than half (54.3 percent) of the
economy’s aggregate energy intensity decline. Although energy-using equipment and services
will become more energy efficient in the future, these developments by themselves are a very
incomplete explanation for energy intensity trends in a growing economy.
Researchers have several important topics to address in future studies. First, economists
think that the data-collection efforts surrounding the NAICS classification system will provide
sharper insights about mature economies and their transformation towards services and
15
information products. As these data sets expand, so too will the need to extract critical lessons
from these sources. And second, evaluating these structural changes and their relationship to
economic expansion and development will be critical for projecting future energy demand and
greenhouse gas emissions. The econometric results reported by Metcalf (2008) and Sue Wing
(2008) are an important start in this direction. So, too, are Mulder and de Groot’s (2007)’s
efforts to place the energy productivity trends in the context of the productivity for other inputs
like labor. The ability to discern input-substitution responses from multi-productivity
improvements is important for understanding the cost-effectiveness of energy-saving policies as
well as the future demand for energy.
16

Table 1. Five-Sector Decomposition of Energy Intensity Trends, 1949-2006 1949-2006 1949-1972 1972-2006Per Annum Change
Aggregate Intensity -1.40% -0.43% -2.05%Activity Shift -0.19% -0.05% -0.28%Within Intensity -1.21% -0.38% -1.77%
Relative Importance (%) Shift Contribution 13.5% 11.2% 13.8%
Table 2. Five-Sector Decomposition with Different Residential Activity, 1972-2006
PCEPCE,
housing Households Population Household
TimePer Annum Change
Aggregate Intensity -2.05% -2.05% -2.05% -2.05% -2.05%Activity Shift -0.28% -0.38% -0.62% -0.73% -0.69%Within Intensity -1.77% -1.67% -1.43% -1.32% -1.36%
Relative Importance (%) Shift Contribution 13.8% 18.7% 30.3% 35.6% 33.7%
Table 3. Three-Sector Decomposition of Energy Intensity Trends 1972-2006 1997-2006Per Annum Change
Aggregate Intensity -2.31% -3.04%Activity Shift -0.41% -0.58%Within Intensity -1.90% -2.46%
Relative Importance (%) Shift Contribution 17.8% 19.1%
Excludes residential and personal transportation sectors.
17

Table 4. 65-Industry Decomposition of Energy Intensity Trends, 1997-2006
GDP
Industrial Non
Manu-facturing
Manu- facturing Transportation Services
Non- Transportation
Per Annum Change Aggregate Intensity -2.12% -2.87% -5.57% -2.93% -0.73% -1.98%Activity Shift -0.83% -1.66% -2.18% 0.75% -0.68% -1.08%Within Intensity -1.29% -1.21% -3.39% -3.68% -0.05% -0.91%
Relative Importance (%) Shift Contribution* 39.1% 57.8% 39.1% (0.257) 92.7% 54.3%
Share of GDP, 2000 100.0% 6.7% 14.5% 3.1% 75.7% 96.9%
* Parenthesis indicates that shifts increase energy intensity.
18
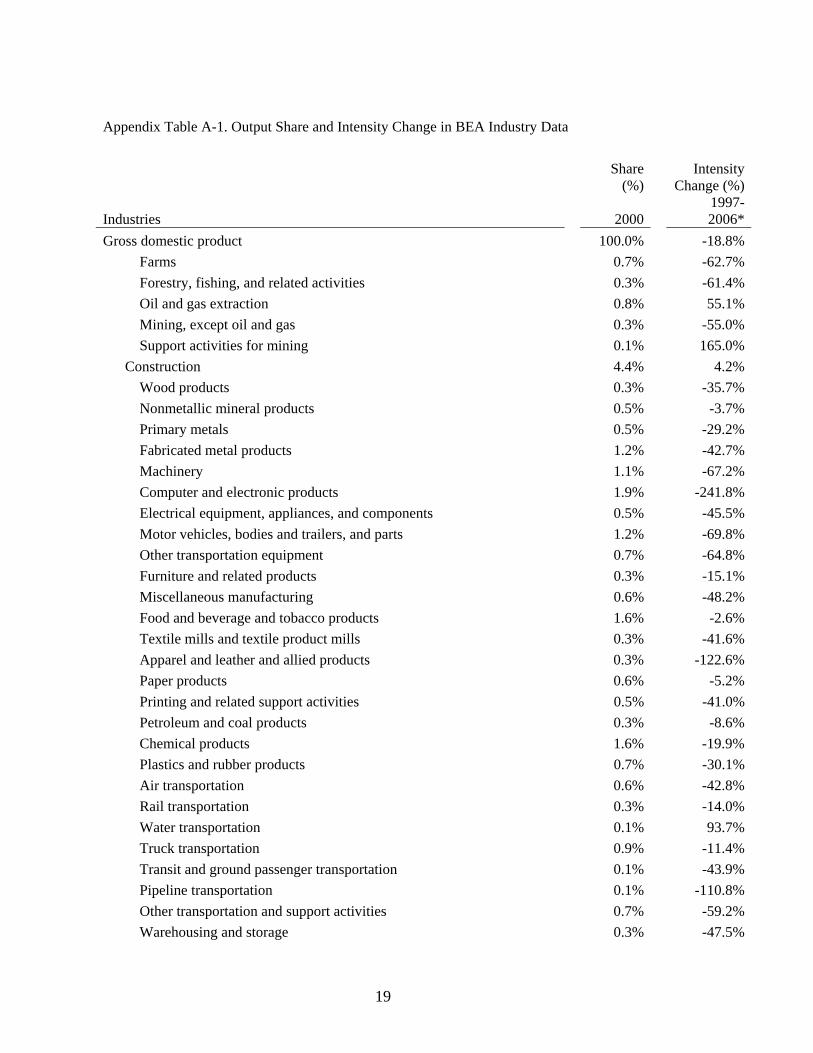
Appendix Table A-1. Output Share and Intensity Change in BEA Industry Data
Share
(%) Intensity
Change (%)
Industries 2000 1997-2006*
Gross domestic product 100.0% -18.8% Farms 0.7% -62.7% Forestry, fishing, and related activities 0.3% -61.4% Oil and gas extraction 0.8% 55.1% Mining, except oil and gas 0.3% -55.0% Support activities for mining 0.1% 165.0% Construction 4.4% 4.2% Wood products 0.3% -35.7% Nonmetallic mineral products 0.5% -3.7% Primary metals 0.5% -29.2% Fabricated metal products 1.2% -42.7% Machinery 1.1% -67.2% Computer and electronic products 1.9% -241.8% Electrical equipment, appliances, and components 0.5% -45.5% Motor vehicles, bodies and trailers, and parts 1.2% -69.8% Other transportation equipment 0.7% -64.8% Furniture and related products 0.3% -15.1% Miscellaneous manufacturing 0.6% -48.2% Food and beverage and tobacco products 1.6% -2.6% Textile mills and textile product mills 0.3% -41.6% Apparel and leather and allied products 0.3% -122.6% Paper products 0.6% -5.2% Printing and related support activities 0.5% -41.0% Petroleum and coal products 0.3% -8.6% Chemical products 1.6% -19.9% Plastics and rubber products 0.7% -30.1% Air transportation 0.6% -42.8% Rail transportation 0.3% -14.0% Water transportation 0.1% 93.7% Truck transportation 0.9% -11.4% Transit and ground passenger transportation 0.1% -43.9% Pipeline transportation 0.1% -110.8% Other transportation and support activities 0.7% -59.2% Warehousing and storage 0.3% -47.5%
19

Wholesale trade 6.0% -20.6% Retail trade 6.7% -21.1% Publishing industries (includes software) 1.2% -97.5% Motion picture and sound recording industries 0.3% -30.4% Broadcasting and telecommunications 2.8% -39.6% Information and data processing services 0.4% -35.6% Federal Reserve banks, credit intermediation, and related activities 3.2% -87.6% Securities, commodity contracts, and investments 1.7% -88.5% Insurance carriers and related activities 2.4% 105.9% Funds, trusts, and other financial vehicles 0.2% 34.4% Real estate /1/ 11.0% 39.7% Rental and leasing services and lessors of intangible assets 1.1% 16.1% Legal services 1.4% 12.0% Computer systems design and related services 1.3% -55.8% Miscellaneous professional, scientific, and technical services 4.2% 1.3% Management of companies and enterprises 1.9% -2.3% Administrative and support services 2.6% 16.6% Waste management and remediation services 0.3% 9.0% Educational services 0.8% -4.4% Ambulatory health care services 3.1% 2.5% Hospitals and nursing and residential care facilities 2.4% 3.9% Social assistance 0.5% -26.2% Performing arts, spectator sports, museums, and related activities 0.4% -45.4% Amusements, gambling, and recreation industries 0.5% -43.8% Accommodation 0.9% -0.5% Food services and drinking places 1.7% -15.2% Other services, except government 2.3% 11.3% Utilities 1.9% -29.6% General government 3.2% 22.0% Government enterprises 0.6% 47.9% General government 7.7% 0.4% Government enterprises 0.7% 24.9% * Intensity changes are computed as logarithmic differences rather than simple percent changes.
20

REFERENCES
Ang, B. W. and F. Zhang (2000), “A Survey of Index Decomposition Analysis in Energy and
Environmental Studies,” Energy 25(12): 1149-1176.
Boyd, G., J. F. McDonald, M. Ross, and D. A. Hanson (1987). “Separating the Changing
Composition of U.S. Manufacturing Production from Energy Efficiency Improvements: A
Divisia Index Approach.” The Energy Journal 8(2): 77-96.
Boyd, Gale and John Laitner (2001). “Recent Trends in the U.S. Energy Intensity: An Index
Number Analysis,” presentation at the 24th Annual IAEE International Conference,
Houston, TX, April 25-27. (Reprinted in International Association for Energy Economics
Newsletter, 2001, 2nd Quarter: 4-9).
Boyd, Gale A. and Joseph M. Roop (2004), “A Note on the Fisher Ideal Index Decomposition
for Structural Change in Energy Intensity,” The Energy Journal, 25(1): 87-101.
Chenery, Hollis (1960), “Patterns of Industrial Growth,” American Economic Review, 50 (4):
624-654.
Economic Report of the President (2008). Washington, DC: US Government Printing Office,
February.
Greening, L.A., W.B. Davis, L. Schipper and M. Krhushch (1997), “Comparison of Six
Decomposition Methods: Application to Aggregate Energy Intensity for Manufacturing in
10 OECD Countries,” Energy Economics 19 (3): 375–390.
Huntington, Hillard G. (2005), “U.S. Carbon Emissions, Technological Progress and Economic
Growth Since 1870,” International Journal of Global Energy Issues, 23(4): 292-306.
Metcalf, Gilbert E. (2008), “An Empirical Analysis of Energy Intensity and Its Determinants at
the State Level,” The Energy Journal 29(3): 1-26.
21

Miranowski, John (2005), “Energy Consumption in US Agriculture,” in Agriculture as a
Producer and Consumer of Energy, edited by J.L. Outlaw, K.J. Collins and J.A. Duffield,
CABI Publishing, Cambridge, MA, pp. 68-111.
Mulder, Peter and Henri L.F. de Groot (2007), “Sectoral Energy- and Labour-Productivity
Convergence,” Environmental and Resource Economics 36: 85-112.
Prescott, Edward C. (2004). “Why Do Americans Work So Much More Than Europeans?”
National Bureau of Economic Research Working Paper 10316, February,
http://www.nber.org/papers/w10316.
Schettkat, Ronald and Lara Yocarini (2006), “The Shift to Services Employment: A Review of
the Literature,” Structural Change and Economic Dynamics 17(2) 127-147.
Sudarshan, Anant and James Sweeney (2008). “Deconstructing the `Rosenfeld Curve',” Precourt
Institute for Energy Efficiency, Stanford University, working paper.
Sue Wing, I. (2008). “Explaining the Declining Energy Intensity of the U.S. Economy,”
Resource and Energy Economics 30: 21–49.
U.S. Bureau of Economic Analysis (2006). “A Guide to the National Income and Product
Accounts of the United States,” September. Washington, D.C. Available at
http://www.bea.gov/bea/mp_national.htm.
U.S. Council of Economic Advisors (2008), Economic Report of the President, United States
Government Printing Office, Washington, D.C.
U.S. Energy Information Administration (2007), Annual Energy Review. U.S. Department of
Energy, Washington, D.C.
22


