Structural Aspects of Competitiveness - Startseite6f34fd8e-6018-42b6-b360-744e567ca3a1/... · TIG2...
33
Wiener Institut für Internationale Wirtschaftsvergleiche The Vienna Institute for International Economic Studies www.wiiw.ac.at Structural Aspects of Competitiveness Julia Woerz Conference on European Economic Integration Vienna 2007
Transcript of Structural Aspects of Competitiveness - Startseite6f34fd8e-6018-42b6-b360-744e567ca3a1/... · TIG2...
Wiener Institut für Internationale Wirtschaftsvergleiche
The Vienna Institute forInternational EconomicStudies
www.wiiw.ac.at
Structural Aspects of Competitiveness
Julia Woerz
Conference on European Economic IntegrationVienna 2007

2
Outline
General remarks about competitiveness
Indicators of competitiveness
- Traditional
- Structural
- Location factors
Determinants of competitivenessConclusions
3
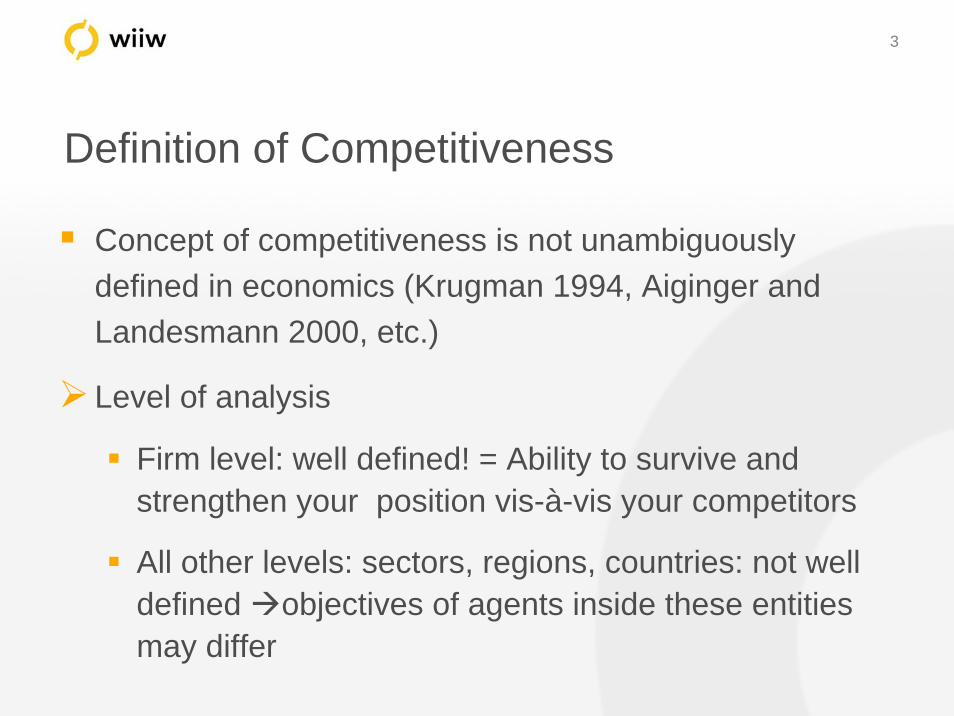
Definition of Competitiveness
Concept of competitiveness is not unambiguously defined in economics (Krugman 1994, Aiginger and Landesmann 2000, etc.)
Level of analysis
Firm level: well defined! = Ability to survive and strengthen your position vis-à-vis your competitors
All other levels: sectors, regions, countries: not well defined objectives of agents inside these entities may differ

4
Definition of Competitiveness
OECD (Hatzichronoglou 1996):
‘... the ability of companies, industries, regions, nations or supranational regions to generate, while being exposed to international competition, relatively high factor income and factor employment levels on a sustainable basis.’
EU: output growth and high rates of employment in a sustainable environment

5
Competitiveness
Ability to sell goods and services
Ability to grow
Ability to attract FDI

6
Indicators of CompetitivenessTraditional Indicators:- Trade balances - Market shares in export markets- Price and cost indicators
Structural Indicators:- Industry and product composition- Trade specialization- Quality indicators
Location factors:- Infrastructure, human capital- Business environment- Investor perceptions

7EU 15Advanced OECDNMS 10Russia
Turkey, Mexico1st Tigers2nd TigersChina, India

8
Global Convergence
05000
1000015000200002500030000350004000045000
EU15
EU12
advO
ECD
catc
hOEC
D
USA JP
N
RU
S
CH
N
IND
TIG
1
TIG
2
0.0
2.0
4.0
6.0
8.0
10.0
12.0GDP p.c. (USD) GDP (bio USD) GDP growth

9
Economic and export structure 2005
Source: World Bank: World Development Indicators, 2007.
AgricultureManu-
facturing ServicesGoods& Services
Manufactured Goods Services
in % of GDPEU15 1.8 17.5 71.7 36.3 61.1 22.9EU12 4.9 20.4 61.1 51.2 66.9 17.2advOECD 2.1 15.8 66.6 34.4 42.8 18.9catchOECD 6.4 16.6 68.4 29.1 68.3 12.8USA 1.3 14.2 76.7 10.1 57.6 29.4JPN 1.7 21.0 68.1 13.4 77.6 15.6RUS 5.6 17.9 56.4 35.1 17.2 9.2CHN 12.6 33.5 39.9 37.5 83.7 8.9IND 18.3 15.7 54.4 20.5 56.4 19.7TIG1 2.5 24.4 62.9 89.7 75.1 16.5TIG2 11.8 29.6 43.7 62.6 61.2 13.2
in % of total exports
Export StructureEconomic Structure
in % of gross value added
10
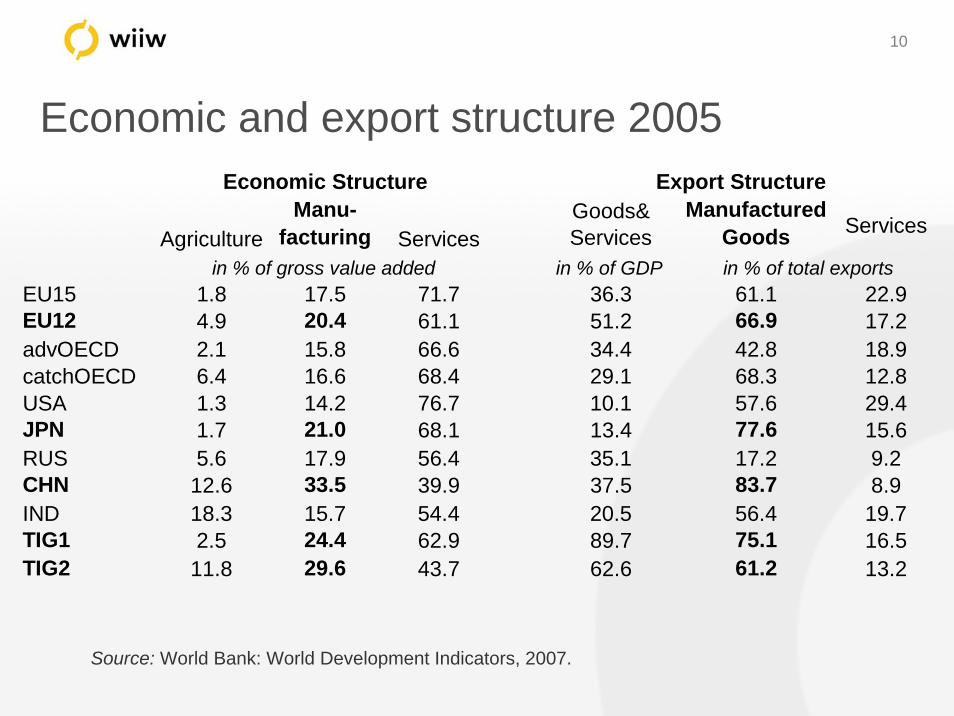
Economic and export structure 2005
Source: World Bank: World Development Indicators, 2007.
AgricultureManu-
facturing ServicesGoods& Services
Manufactured Goods Services
in % of GDPEU15 1.8 17.5 71.7 36.3 61.1 22.9EU12 4.9 20.4 61.1 51.2 66.9 17.2advOECD 2.1 15.8 66.6 34.4 42.8 18.9catchOECD 6.4 16.6 68.4 29.1 68.3 12.8USA 1.3 14.2 76.7 10.1 57.6 29.4JPN 1.7 21.0 68.1 13.4 77.6 15.6RUS 5.6 17.9 56.4 35.1 17.2 9.2CHN 12.6 33.5 39.9 37.5 83.7 8.9IND 18.3 15.7 54.4 20.5 56.4 19.7TIG1 2.5 24.4 62.9 89.7 75.1 16.5TIG2 11.8 29.6 43.7 62.6 61.2 13.2
in % of total exports
Export StructureEconomic Structure
in % of gross value added

11
Economic and export structure 2005
Source: World Bank: World Development Indicators, 2007.
AgricultureManu-
facturing ServicesGoods& Services
Manufactured Goods Services
in % of GDPEU15 1.8 17.5 71.7 36.3 61.1 22.9EU12 4.9 20.4 61.1 51.2 66.9 17.2advOECD 2.1 15.8 66.6 34.4 42.8 18.9catchOECD 6.4 16.6 68.4 29.1 68.3 12.8USA 1.3 14.2 76.7 10.1 57.6 29.4JPN 1.7 21.0 68.1 13.4 77.6 15.6RUS 5.6 17.9 56.4 35.1 17.2 9.2CHN 12.6 33.5 39.9 37.5 83.7 8.9IND 18.3 15.7 54.4 20.5 56.4 19.7TIG1 2.5 24.4 62.9 89.7 75.1 16.5TIG2 11.8 29.6 43.7 62.6 61.2 13.2
Economic Structure Export Structure
in % of gross value added in % of total exports

12
Location Factors
13
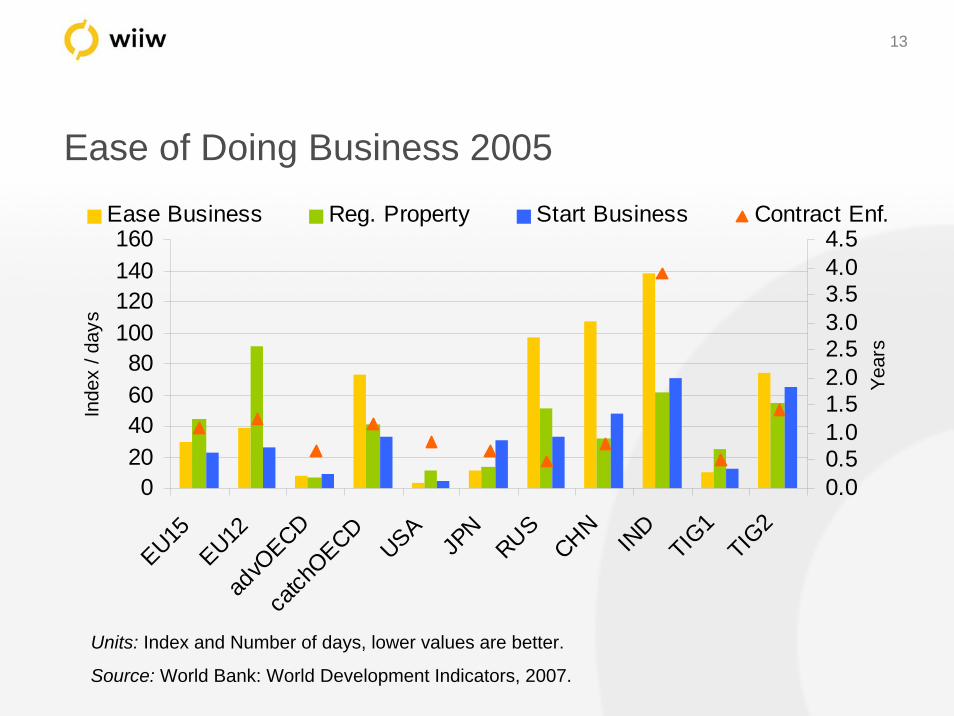
Ease of Doing Business 2005
Units: Index and Number of days, lower values are better.
Source: World Bank: World Development Indicators, 2007.
020406080
100120140160
EU15EU12
advO
ECDca
tchOECD
USA
JPN
RUSCHN
IND
TIG1
TIG2
Inde
x / d
ays
0.00.51.01.52.02.53.03.54.04.5
Year
s
Ease Business Reg. Property Start Business Contract Enf.

14
Major business constraints, Governance 2005
Units: per cent of managers perceiving this as constraint, lower values are better.
Source: World Bank: World Development Indicators, 2007.
05
101520253035
EU15
EU12ad
vOECD
catch
OECD
USA
JPN
RUS
CHN
IND
TIG1
TIG2
Corruption Courts Policy Uncertainty
15
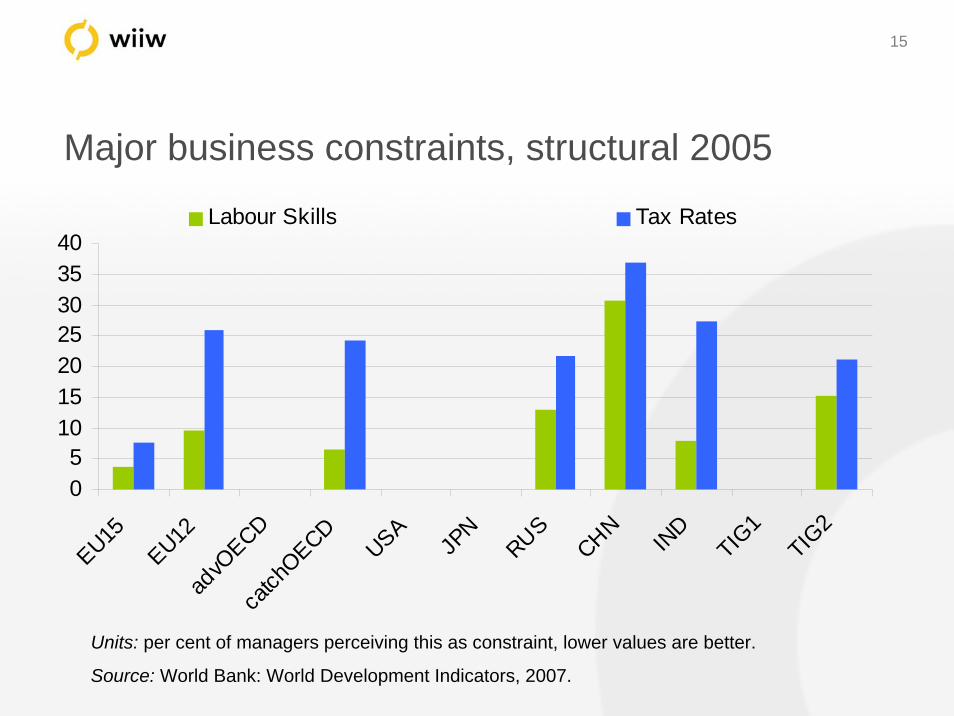
Major business constraints, structural 2005
Units: per cent of managers perceiving this as constraint, lower values are better.
Source: World Bank: World Development Indicators, 2007.
05
10152025303540
EU15
EU12ad
vOECD
catch
OECD
USA
JPN
RUS
CHN
IND
TIG1
TIG2
Labour Skills Tax Rates

16
Structural Features: ICT & High Tech, 2005
Units: ICT Expenditure in % of GDP, HT Export in % of total exports
Source: World Bank: World Development Indicators, 2007.
05
1015202530354045
EU15
EU12ad
vOECD
catch
OECD
USA
JPN
RUS
CHN
IND
TIG1
TIG2
ICT expenditure HT Exports

17
Traditional & Structural Indicators
18
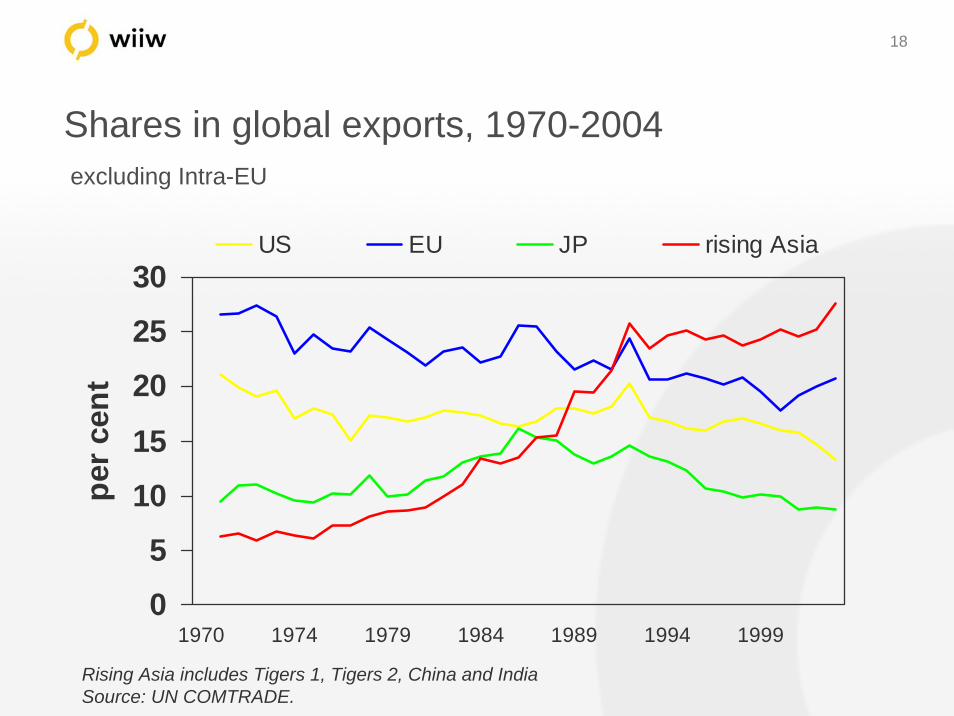
Shares in global exports, 1970-2004excluding Intra-EU
0
5
10
15
20
25
30
1970 1974 1979 1984 1989 1994 1999
per c
ent
US EU JP rising Asia
Rising Asia includes Tigers 1, Tigers 2, China and IndiaSource: UN COMTRADE.
19
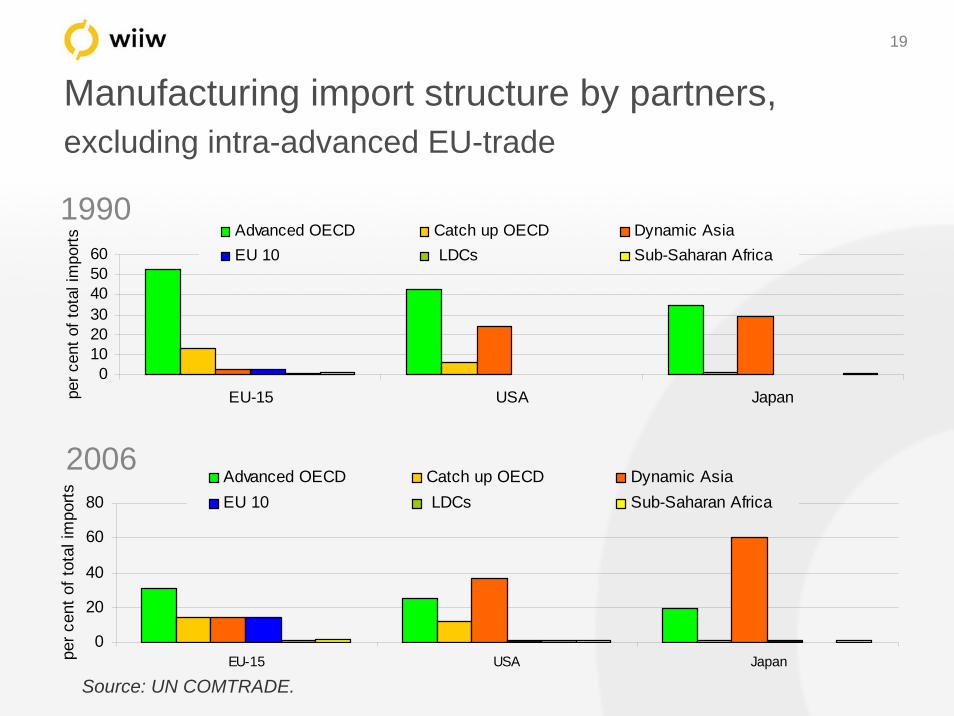
Manufacturing import structure by partners, excluding intra-advanced EU-trade
1990
2006
0102030405060
EU-15 USA Japanper c
ent o
f tot
al im
ports
Advanced OECD Catch up OECD Dynamic AsiaEU 10 LDCs Sub-Saharan Africa
0
20
40
60
80
EU-15 USA Japanper c
ent o
f tot
al im
ports
Advanced OECD Catch up OECD Dynamic AsiaEU 10 LDCs Sub-Saharan Africa
Source: UN COMTRADE.

20
Shares of CHINA in imports of EU-North, USA and Japan (%)
0.0
5.0
10.0
15.0
20.0
25.0
30.0
35.0
1 2 3 4 5 1 2 3 4 5 1 2 3 4 5
1990 1995 2000 2005
42.7 5545.3
EU-North USA Japan
technology: 1: low tech industries, 2: medium-low industries, 3: medium-high industries, 4: high industries, 5: office machinery and computers, Source: wiiw

21
Shares of EU10, Cohesion and Tigers 1 in imports of EU-North, USA and Japan (%)
0.0
5.0
10.0
15.0
20.0
25.0
30.0
1 2 3 4 5 1 2 3 4 5 1 2 3 4 5
1990 1995 2000 2005EU-North USA JAPAN
technology: 1: low tech industries, 2: medium-low industries, 3: medium-high industries, 4: high techindustries, 5: office machinery and computers; Source: wiiw

22
Global Trade in Goods, 2005Billion USD
Importer
Exporter
EU 2
5
Oth
er E
urop
e
Rus
sia
Oth
er C
IS
Uni
ted
Stat
es
Can
ada
Latin
Am
eric
a
Japa
n
Chi
na
Oth
er A
sia
AUS&
NZL
Mid
dle
East
Afric
a
EU 25
Other Europe
Russia
Other CIS
United States
Canada
Latin America
Japan
China
Other Asia
AUS&NZL
Middle East
Africa400-500
300-400
200-300
100-200
0-100
23
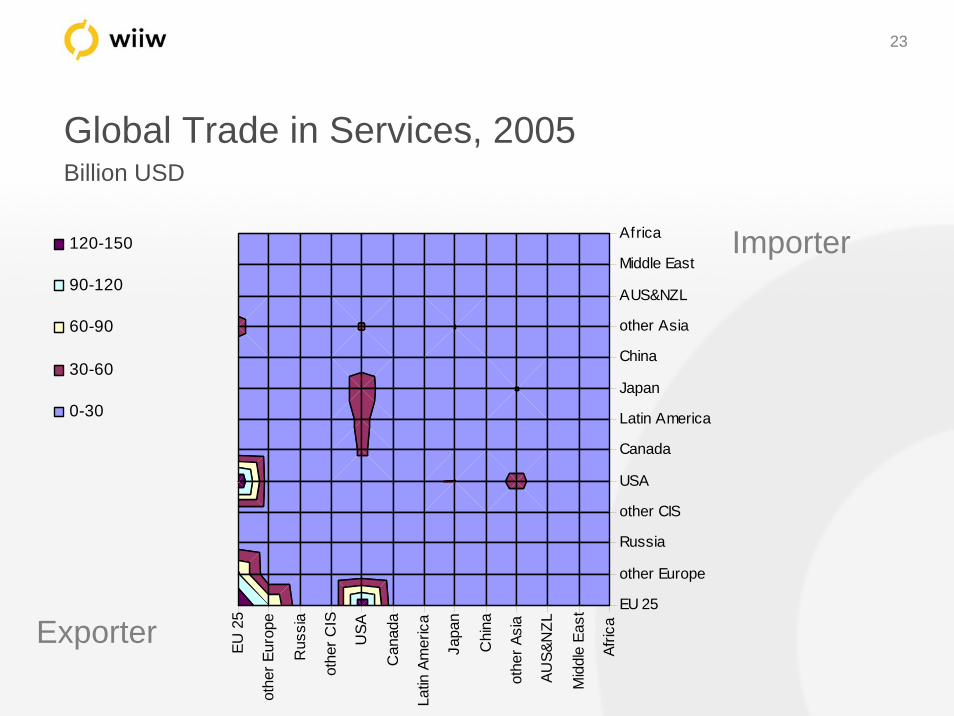
Global Trade in Services, 2005Billion USD
EU 2
5
othe
r Eur
ope
Rus
sia
othe
r CIS
USA
Can
ada
Latin
Am
eric
a
Japa
n
Chi
na
othe
r Asi
a
AUS&
NZL
Mid
dle
East
Afric
aEU 25
other Europe
Russia
other CIS
USA
Canada
Latin America
Japan
China
other Asia
AUS&NZL
Middle East
Africa120-150
90-120
60-90
30-60
0-30
Importer
Exporter
24
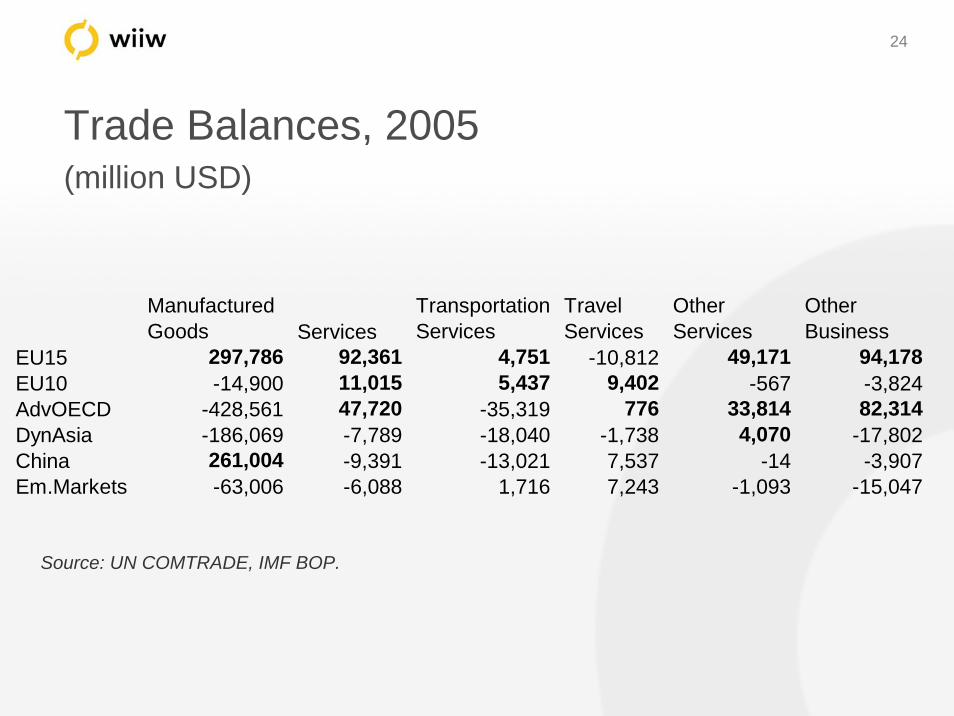
Trade Balances, 2005(million USD)
Source: UN COMTRADE, IMF BOP.
Manufactured Goods Services
Transportation Services
Travel Services
Other Services
Other Business
EU15 297,786 92,361 4,751 -10,812 49,171 94,178EU10 -14,900 11,015 5,437 9,402 -567 -3,824 AdvOECD -428,561 47,720 -35,319 776 33,814 82,314DynAsia -186,069 -7,789 -18,040 -1,738 4,070 -17,802 China 261,004 -9,391 -13,021 7,537 -14 -3,907 Em.Markets -63,006 -6,088 1,716 7,243 -1,093 -15,047

25
Market Shares, 1995 and 2005
Goods
Services
Source: UN COMTRADE, IMF BOP.
0.00
0.10
0.20
0.30
0.40
0.50
EU15 EU10 AdvOECD DynAsia CHN EmergingMarkets
1995 2005
0.00
0.10
0.20
0.30
0.40
0.50
EU15 EU10 AdvOECD DynAsia CHN EmergingMarkets
1995 2005

26
Revealed Comparative Advantages in Services, 2005
Source: IMF BOP, wiiw calculations.
Transportation Services
Travel Services Other Services
Other Business
EU15 0.12 -0.17 -0.15 0.04EU10 0.41 0.30 -0.89 -0.33 AdvOECD -0.11 -0.12 0.35 0.15DynAsia -0.07 -0.04 0.16 -0.18 China -0.34 0.45 -0.03 -0.04 Em.Markets 0.36 0.46 -0.69 -0.43

27
Determinants of service sector competitivenessin EU10
kit
ki
kit
kit
kit
kit
kit
kit
SkillsOpen
SizeULCLPRCA
εγββ
βββα
++++
++++=
54
321
LP … labour productivity growth in euro
ULC … unit labour costs
Size … size of an industry in terms of employment
Open … openness of the respective industry
Skill … skill intensity of the industry
t … time (year), k … countries, i …service items

28
Determinants of service sector competitivenessin EU15 (1) (2) (3)
Labour Productiv 0.038 0.014 0.0960.38 0.14 0.87
Unit Labour Costs 0.206 *** 0.192 *** 0.203 ***2.95 2.83 2.91
Size of industry -0.151 *** -0.115 *** -0.090 ***-4.17 -3.2 -2.41
Openness 0.280 *** 0.335 *** 0.335 *** 10.78 11.96 11.15Sector dummies:Communication 1.009 *** 1.037 ***
4.38 4.4Construction 1.033 *** 1.064 ***
4.48 4.54Insurance 0.552 *** 0.680 *** 2.28 2.63Computer&Information 0.521 *** 0.587 *** 2.26 2.29tertiary education share 0.011
0.3white collar, high skill workers share 0.033 1.17overall R2 0.11 0.30 0.34Observations 782 782 720Obs. per group 91 91 91
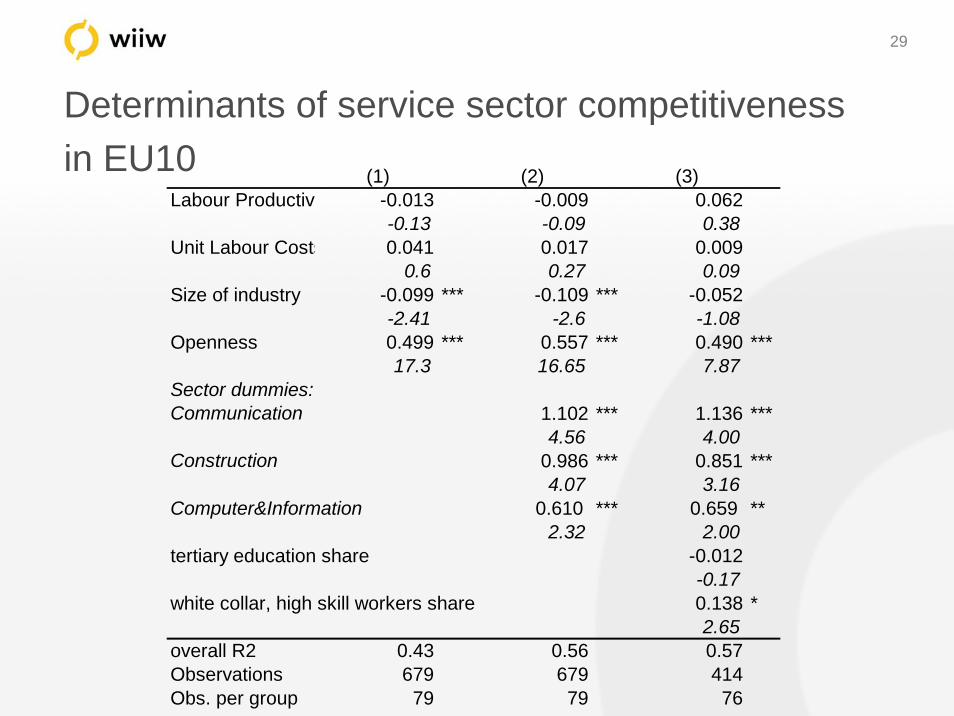
29
Determinants of service sector competitivenessin EU10 (1) (2) (3)
Labour Productiv -0.013 -0.009 0.062-0.13 -0.09 0.38
Unit Labour Costs 0.041 0.017 0.0090.6 0.27 0.09
Size of industry -0.099 *** -0.109 *** -0.052-2.41 -2.6 -1.08
Openness 0.499 *** 0.557 *** 0.490 ***17.3 16.65 7.87
Sector dummies:Communication 1.102 *** 1.136 ***
4.56 4.00Construction 0.986 *** 0.851 ***
4.07 3.16Computer&Information 0.610 *** 0.659 **
2.32 2.00tertiary education share -0.012
-0.17white collar, high skill workers share 0.138 *
2.65overall R2 0.43 0.56 0.57Observations 679 679 414Obs. per group 79 79 76

30
Conclusions
The world has changed dramatically over the past decadesAsia’s share in world merchandise trade has risen strongly Trade in services concentrated predominantly in EU The most export oriented countries still show a relative dominance of the manufacturing sector

31
What determines competitiveness?
Mostly structural featuresLess so locational / soft factorsAsia (China + Tigers 2) and EU10 show good structural characteristics, high competitiveness in manufacturing despite low rankings in business environmentThey also show a good performance in low- and high tech industries
32
What determines competitiveness?
Determinants differ between competitiveness in goods versus servicesCost factors (unit labour costs and labour productivity) play a stronger role for goodsFor services, soft factors appear to be more important, also general export orientation matters stronglySome service sectors are more competitive than others: communication, construction, computer&information services.

Wiener Institut für Internationale Wirtschaftsvergleiche
The Vienna Institute forInternational EconomicStudies
www.wiiw.ac.at
Structural Aspects of Competitiveness
Julia Woerz
Conference on European Economic IntegrationVienna 2007