Structural and Functional Studies of AT Rich DNA Ligands ...
331
UNIVERSITAT POLITÈCNICA DE CATALUNYA DOCTORAL THESIS Structural and Functional Studies of AT-Rich DNA Ligands and Their Effect on Trypanosoma brucei Author: Supervisors: Cinthia Raquel MILLAN ELIAS Dr. J. Lourdes CAMPOS Dr. Núria SAPERAS A thesis submitted for the degree of Doctor of Philosophy at the Universitat Politècnica de Catalunya Doctoral Program: Polymers and Biopolymers Department of Chemical Engineering MACROM Group ETSEIB Barcelona, July 2017
Transcript of Structural and Functional Studies of AT Rich DNA Ligands ...

UNIVERSITAT POLITÈCNICA DE CATALUNYA
DOCTORAL THESIS
Structural and Functional Studies of AT-Rich DNA Ligands and Their Effect on Trypanosoma brucei
Author: Supervisors:
Cinthia Raquel
MILLAN ELIAS
Dr. J. Lourdes CAMPOS
Dr. Núria SAPERAS
A thesis submitted for the degree of Doctor of Philosophy
at the Universitat Politècnica de Catalunya
Doctoral Program: Polymers and Biopolymers
Department of Chemical Engineering
MACROM Group
ETSEIB
Barcelona, July 2017


Dedicated to my sisters,
from whom I have learned to fight for my big dreams.


"Almost all aspects of life are engineered at the molecular level, and
without understanding molecules we can only have a very sketchy
understanding of life itself."
Francis Crick


i
ACKNOWLEDGEMENTS
First of all, I would like to thank my supervisors, Dr. Lourdes Campos for all the
guidance, unlimited support and patience, encouragement and advice she has always
been able to provide throughout my time as her student; and to Dr. Núria Saperas, for
her invaluable guidance and immense support every day, she always encouraged me to
do it better. I can affirm that I have been very lucky to have two supervisors who
always cared and showed their interest in my research and work, and who have been
available to provide their guidance in every stage of the development of this thesis,
making it possible for me to achieve my goals.
I would also like to thank Dr. Juan Antonio Subirana and all the members of the
MACROM group: David, Sonia and Fabiola. A special recognition to Raquel and Paco,
for sharing with me their knowledge and experience in protein purification and
crystallography. I want to thank them both for the support they provided every time I
needed it, their helpful advises, but also their friendship. It was a pleasure to work with
you both. I admire you so much.
I want to express my gratitude to Dr. Harry de Koning for giving me the opportunity to
be a part of his group at the University of Glasgow and for introducing me to the
world of parasites. I want to thank him for the valuable suggestions and his
thoughtful guidance that made my stay in Glasgow so remarkable and successful. This
thesis would not have been possible without his help. I would like to acknowledge the
members of Dr. de Koning’s research lab: Anne, Jane, Manal, Amani, Lauren, Gordon,
and Daniel, and a very special thanks to my dear friends Gustavo and Khalid,
for sharing their knowledge with me, for being patient and for their support during
my experiments. I am so grateful to all them who have contributed to make my
experience in Glasgow unforgettable and fulfilling.
I would like to thank our thoughtful collaborators. To Dr. Christophe Dardonville, as his
continuous interest helped me enormously during the development of Chapter 4. I
would like to thank him for his valuable help during my short stay in Madrid and

i i
during the last two years, having always a prompt response to my numerous questions.
To Laura Lagartera, for the time she dedicated me, and her invaluable support with the
SPR experiments. To Dr. Leandro Lemgruber for performing amazing TEM images and
providing all those useful insights.
Thanks to all the generous and kind people I have met in the Chemical Engineering
Department of the ETSEIB and EEBE: Dr. Juan Jesús Pérez, Dr. Ma. Teresa Casas, Dr.
Lourdes Franco, Dr. Alfonso Rodríguez, Dr. Luis J. del Valle, Dr. Jordi Puiggali, Manolo,
Neudys, Ana, Silvana, Angélica and Georgina. To the great international group of
students we have formed during the last year: Jordi, Guillem, Hamidreza, Reza, Amir,
Anna, Maricruz, Brenda, with a special mention to Ina, for me, the best leader this
group could have, and Max, for his special and kind way to see this life.
Thanks to the best friends I could have: Grey and Dany, you are the best partners for
the most unforgettable adventures I can have; to my favourite Catalans Mary and
Pablo; to my old-school friends Melissa, Anilú, Paulina and Polette; to Fátima and
Claudia; to my dear Daniel; to my mother from Barcelona, Lilia; to Luz, for being
always there for me, for showing me your support and for having the right words; and
to my best friend José Angel, for everything he has done for me, for his trust and
support, for making me laugh no matter what, and for being next to me through this
years. I love you all very much. I would also like to thank Chris, for changing my life.
And finally, I want to show my infinite gratitude to my amazing family, the most
important part of my life. To my parents Rosy and Edgardo, for the unconditional love
and the enormous support they have always given me throughout my life, for giving
me the freedom and courage to pursue my ambitions, for making me who I am. I will
always carry a part of you everywhere I go. To Rosiel and Riza, for being the best
sisters I could have had, for always pushing me to be a better person, for being my
mentors, my role models, and my inspiration to be better every day, thank you very
much. To my wonderful, amazing and funny nephews, Ruben and Leonardo, for giving
me the chance to feel love in ways I didn’t know existed. Life is continuous research.

i i i
ABSTRACT
Adenine (A) and thymine (T) rich sequences confer unique properties to DNA, such as
high polymorphism and flexibility. The abundance of AT-rich DNA in several pathogens’
genomes and the ability of specific molecules to selectively target AT base pairs have
prompted studies on ligands that interact with the minor groove of high AT content
DNA. Of special interest are kinetoplastid parasites, such as Trypanosoma brucei, the
causative agent of sleeping sickness, which are distinguished by the presence of a very
AT-rich mitochondrial DNA structure called kinetoplast.
Minor groove binding ligands have offered critical information on DNA molecular
recognition, providing clinically useful strategies against diseases. Thus, the binding
affinity and structural characteristics of AT-rich oligonucleotides in complex with
different ligands, specifically with HMG proteins and bisimidazolinium compounds, has
been chosen as the object of study.
The ‘High Mobility Group’ (HMG) is a family of architectural proteins that bind to DNA
and influence a myriad of essential cellular processes. This research work has focused
in two HMG subfamilies: HMGA and HMGB. They bind to the minor groove of the DNA
by means of different binding motifs: AT-hook (HMGA) and HMG-box (HMGB). An
HMGA1a fragment containing AT-hook II and III, HMGB1 box B and HMGB1 box AB
have been expressed and purified. High and similar binding affinity to an AT-rich DNA
sequence containing [AATAAT_ATTATT] has been found by surface plasmon resonance
(SPR)–biosensor experiments for both proteins. A complex of the HMGB1 box B with
d[CCAATAATCGCGATTATTGG]2 was crystallized. The diffraction patterns of the crystal
at 2.68 Å resolution presented well-defined spots revealing two diffraction orientations.
On the other hand, a series of diphenyl-based bis(2-iminoimidazolidine) derivatives of
FR60 [4-((4,5-dihydro-1H-imidazol-2-yl)amino)-N-(4-((4,5-dihydro-1H-imidazol-2-yl)
amino)phenyl)benzamide] have been proved to be high affinity DNA binders with a
preference for AT over GC-rich DNA, showing slight selectivity towards sequences
containing [AATT] versus [(AT)4] or [AATAAT_ATTATT]. Furthermore, competition assays

iv
have demonstrated that JNI18 competes with HMGA1a and HMGB1 for binding to
DNA and it is able to displace the proteins from their DNA binding sites. This last
interaction is of prime importance, as related proteins have been found to be essential
in kinetoplastid parasites.
The structure of the bis(2-aminoimidazoline) compound CDIV32 [4,4'-bis(1-hydroxy
imidazolinylamino)diphenylamine] with the oligonucleotide d[AAATTT]2 partially solved
at 3.10 Å resolution, displays DNA columns of stacked oligonucleotides forming a
pseudo-continuous helix packed in a crossed column configuration of DNA helices that
are at ∼90° to each other. The presence of the drug CDIV32 modulates the
organization of duplexes.
The crystal structure of the complex of the oligonucleotide d[AAATTT]2 with the lead
compound FR60, solved at atomic resolution of 1.25 Å (PDB-ID: 5LIT) by X-ray
crystallography, is constituted of stacked oligonucleotides organized as infinite
continuous parallel columns, packed in a pseudo-tetragonal configuration. The
structure revealed that the drug interacts with the central [AATT] region, covers the
minor groove of DNA, displaces bound water and interacts with neighboring DNA
molecules as a cross-linking agent.
Finally, a functional analysis has been performed on the effect of different bis(2-
aminoimidazolines) on Trypanosoma brucei, which has a kDNA with higher than 70%
AT base pair content. The main objective was to assess whether parasite DNA was a
target for these compounds inside the cell. The in vitro effect of these drugs against T.
brucei was evaluated. By a combination of flow cytometry and imaging techniques
such as fluorescence microscopy and transmission electron microscopy, it was
demonstrated that these compounds have a clear effect on the S-phase of T. brucei
cell cycle by inflicting specific damage on the kinetoplast. It can be concluded that the
studied DNA binding bis(2-aminoimidazoline) compounds FR60 and JNI18 are powerful
trypanocides that act directly on the kinetoplast DNA. As the compounds show 100%
curative activity in a mouse model of T. b. rhodesiense infection, they are potentially
an effective chemotherapeutic agent for the treatment of sleeping sickness.

v
RESUMEN
Las secuencias ricas en adeninas (A) y timinas (T) le confieren al ADN propiedades
únicas como un alto polimorfismo y flexibilidad. La abundancia de ADN rico en AT en el
genoma de varios patógenos y la selectividad de unión a secuencias AT que presentan
ciertas moléculas, han llevado al estudio de ligandos que interactúan con el surco
estrecho de DNA con alto contenido en AT. De especial interés son los parásitos
kinetoplástidos, como el Trypanosoma brucei, agente causante de la enfermedad del
sueño, los cuales se distinguen por la presencia de una estructura de ADN mitocondrial
muy rica en AT llamada kinetoplasto.
Los ligandos de unión al surco estrecho han ofrecido información primordial sobre el
reconocimiento molecular del ADN, proporcionando estrategias clínicamente útiles
para combatir enfermedades. Por ello, se ha elegido como objeto de estudio la afinidad
de unión y las características estructurales de complejos de oligonucleótidos ricos en
AT con diferentes ligandos, específicamente con proteínas HMG y con compuestos
bisimidazolinio.
Las HMG (High Mobility Group) son una familia de proteínas arquitectónicas que se
unen al ADN e influyen en numerosos procesos celulares esenciales. Este trabajo de
investigación se ha centrado en dos subfamilias de las HMG: las HMGA y las HMGB.
Ambas se unen al surco estrecho del ADN pero mediante diferentes motivos de unión:
AT-hook (HMGA) y HMG-box (HMGB). Se ha expresado y purificado un fragmento de
HMGA1a que contiene los AT-hook II y III, así como la HMGB1 box B y la HMGB1 box
AB. Por medio de experimentos de resonancia de plasmón superficial (SPR), se ha
encontrado para ambas proteínas una afinidad de unión alta y similar hacia un
oligonucleótido rico en AT conteniendo la secuencia [AATAAT_ATTATT]. Se cristalizó un
complejo de la HMGB1 box B con el oligonucleótido d[CCAATAATCGCGATTATTGG]2. Los
diagramas de difracción del cristal a una resolución de 2.68 Å presentaban reflexiones
bien definidas que indicaban dos orientaciones preferenciales en el cristal.
vi
Por otra parte, una serie de derivados difenilo bisimidazolinio basados en el compuesto
FR60 [4-((4,5-dihidro-1H-imidazol-2-il)amino)-N-(4-((4,5-dihidro-1H-imidazol-2-il)
amino)fenil)benzamida] han demostrado ser ligandos de alta afinidad por secuencias
AT con respecto a GC, mostrando cierta preferencia hacia secuencias que contienen
[AATT] comparado con [(AT)4] o [AATAAT_ATTATT]. Además, los ensayos de competencia
han demostrado que el JNI18 compite con la HMGA1a y la HMGB1 en su unión al ADN
y es capaz de desplazar a dichas proteínas de sus sitios de unión al ADN. Esta última
interacción es de especial relevancia, ya que se han encontrado proteínas relacionadas
que son esenciales en parásitos kinetoplástidos.
La estructura del compuesto de bis(2-aminoimidazolinio) CDIV32 [4,4'-bis (1-hidroxi
imidazolinilaminio)difenilamina] con el oligonucleótido d[AAATTT]2 ha sido
parcialmente resuelta a una resolución de 3.10 Å. Se encontraron columnas de
oligonucleótidos apilados formando una hélice pseudo-continua, empaquetada en una
configuración de columnas cruzadas perpendicularmente. La presencia del fármaco
CDIV32 modula la organización de las hélices de ADN.
Por medio de cristalografía de rayos X se ha resuelto la estructura del complejo
formado por el oligonucleótido d[AAATTT]2 y el compuesto líder FR60 a resolución
atómica de 1.25 Å (PDB-ID: 5LIT). Se encontraron los oligonucleótidos apilados
organizados en columnas infinitas y paralelas en una configuración pseudo-tetragonal.
La estructura reveló que el fármaco interacciona con la región central [AATT], ocupa el
surco estrecho del ADN, desplaza las moléculas de agua presentes e interactúa con
moléculas de ADN vecinas como un agente entrecruzador.
Finalmente, se ha realizado un análisis funcional del efecto de diferentes compuestos
bis(2-aminoimidazolinio) en Trypanosoma brucei, el cual posee un kDNA con un
contenido de AT superior al 70%. El objetivo principal ha sido evaluar si el ADN del
parásito es una diana para estos compuestos dentro de la célula. Para ello se ha
estudiado su efecto in vitro mediante una combinación de citometría de flujo y
técnicas como microscopía de fluorescencia y microscopía electrónica de transmisión.
Los resultados permitieron demostrar que estos compuestos tienen un efecto claro

vi i
sobre la fase S del ciclo celular de T. brucei al dañar específicamente el kinetoplasto. Se
ha podido concluir que los compuestos bis(2-aminoimidazolinio) FR60 y JNI18 son
potentes tripanocidas que actúan directamente sobre el ADN del kinetoplasto. Ya que
los compuestos muestran una actividad curativa del 100% en un modelo de ratón
infectado por T. b. rhodesiense, representan un agente quimioterapéutico potencial-
mente eficaz para el tratamiento de la enfermedad del sueño.


CONTENTS
ix
CONTENTS
ACKNOWLEDGEMENTS .................................................................................................................. iABSTRACT ....................................................................................................................................... iiiRESUMEN .......................................................................................................................................... vCONTENTS ....................................................................................................................................... ixLIST OF FIGURES .......................................................................................................................... xvLIST OF TABLES .......................................................................................................................... xxixABBREVIATIONS ........................................................................................................................ xxxi
CHAPTER 1. INTRODUCTION1.1 The DNA .................................................................................................................................. 31.2 DNA Structure ....................................................................................................................... 3
1.2.1 Base Paring and Stacking .......................................................................................... 51.2.2 Minor and Major Groove ............................................................................................ 61.2.3 DNA Parameters ........................................................................................................... 81.2.4 DNA Double Helix Forms .......................................................................................... 111.2.5 DNA Structural Scales ............................................................................................... 15
1.3 AT-Rich DNA ........................................................................................................................ 171.3.1 Non-coding DNA ........................................................................................................ 181.3.2 AT-Rich Organisms .................................................................................................... 191.3.3 Importance of AT-Rich Regions in Target Site Recognition .......................... 20
1.4 DNA-Ligand Binding ......................................................................................................... 211.5 DNA-Protein Interactions ................................................................................................ 21
1.5.1 HMG proteins .............................................................................................................. 221.5.1.1 HMGA .................................................................................................................... 241.5.1.2 HMGB .................................................................................................................... 30
1.6 DNA-Drug Interactions ..................................................................................................... 381.6.1 Types of DNA-Binding Drugs .................................................................................. 38
1.6.1.1 Minor Groove Binding Drugs (MGBD) .......................................................... 40

CONTENTS
x
1.6.2 Structure-Based DNA-Targeting Strategies for Drug Discovery ................... 431.6.3 DNA-Binders Targeting Parasitic Diseases .......................................................... 45
1.7 Human African Trypanosomiasis ................................................................................... 471.7.1 Trypanosoma brucei ................................................................................................... 491.7.2 The Kinetoplast ........................................................................................................... 53
1.7.2.1 HMG-box proteins in Trypanosoma brucei ................................................. 581.7.3 Current Treatment ...................................................................................................... 591.7.4 Dicationic MGBD as Antitrypanosomal Agents ................................................. 61
1.8 Objective of the Work ....................................................................................................... 67
CHAPTER 2. MATERIALS AND METHODS2.1 Production and Purification of Recombinant HMG Proteins in E. coli ............... 71
2.1.1 Expression of HMGA1a(∆50-91) ........................................................................... 722.1.2 Purification of HMGA1a(∆50-91) ......................................................................... 762.1.3 Expression of HMGB1 proteins .............................................................................. 792.1.4 Purification of the HMGB1 proteins ..................................................................... 82
2.2 Electrophoretic Techniques ............................................................................................. 852.2.1 SDS Polyacrylamide Gel Electrophoresis (SDS-PAGE) ...................................... 852.2.2 Acetic Acid-Urea Polyacrylamide Gel Electrophoresis (AU-PAGE) ............... 902.2.3 Electrophoretic Mobility Shift Assay (EMSA) ..................................................... 922.2.4 Agarose Gel Electrophoresis .................................................................................... 942.2.5 DNA Supercoiling Assays ......................................................................................... 96
2.3 N-phenylbenzamide Bis(2-aminoimidazoline) Derivatives .................................... 972.4 DNA Oligonucleotides ....................................................................................................... 992.5 Crystallization of Macromolecules ............................................................................ 102
2.5.1 Crystallization Fundaments and Parameters .................................................... 1032.5.2 Crystallization Method: Vapor Diffusion Technique ...................................... 1102.5.3 Crystal Selection and Cryo-Crystallography ..................................................... 112
2.6 X-Ray Crystallography ................................................................................................... 1132.6.1 Crystalline Structure ............................................................................................... 1142.6.2 Fundamentals of X-Ray Crystallography ........................................................... 116

CONTENTS
xi
2.6.2.1 Bragg’s Law ........................................................................................................ 1182.6.2.2 Ewald Sphere ..................................................................................................... 120
2.6.3 Single-Crystal X-Ray Diffraction ......................................................................... 1212.7 Structure Determination ............................................................................................... 124
2.7.1 Data Processing ........................................................................................................ 1242.7.2 Phasing: Molecular Replacement Method ........................................................ 1262.7.3 Structure Refinement .............................................................................................. 1292.7.4 Structure Validation ................................................................................................ 131
2.8 SPR-Biosensor Assays .................................................................................................... 1312.9 Effect of Bisimidazolinium Diphenyl Compounds on Trypanosoma brucei .... 136
2.9.1 Strains and Cultures ................................................................................................ 1372.9.2 Drug Sensitivity Assays ........................................................................................... 138
2.9.2.1 Alamar Blue Assay in BF T. brucei ............................................................... 1382.9.2.2 Alamar Blue Assay in BS T. congolense ..................................................... 139
2.9.3 Drug Sensitivity Assay using Cell Count ............................................................ 1392.9.4 Assessment of Cell Cycle Progression in T. brucei .......................................... 140
2.9.4.1 Fluorescence Microscopy ............................................................................... 1402.9.4.2 Flow Cytometry ................................................................................................. 140
2.9.5 Mitochondrial Membrane Potential Assay ........................................................ 1412.9.6 Cellular Localization of Compounds in BF T. brucei ....................................... 1422.9.7 Transmission Electron Microscopy Analysis ..................................................... 1432.9.8 PCR Amplification of Kinetoplast DNA Markers .............................................. 144
CHAPTER 3. HMG PROTEINS3.1 Obtaining HMG proteins ............................................................................................... 151
3.1.1 Expression and Purification of HMGA1a(∆50-91) .......................................... 1513.1.2 Expression and Purification of HMGB1 Proteins ............................................. 155
3.2 Interaction of HMGA1a(∆50-91) Protein with AT-rich DNA ............................. 1603.2.1 Supercoiling Induced by HMGA1a Proteins ...................................................... 1613.2.2 HMGA1a(∆50-91) Crystallography Assays ....................................................... 1633.2.3 DNA-HMGA1a(∆50-91) Protein Binding Analysis by SPR ........................... 164

CONTENTS
xi i
3.3 Interaction of HMGB1 Protein with AT-rich DNA ................................................. 1653.3.1 DNA-HMGB1 Crystallography Assays ................................................................ 166
3.3.1.1 HMGB1 Box B – d[AATAAATTTATT]2 ........................................................... 1683.3.1.2 HMGB1 Box B – d[CCAATAATCGCGATTATTGG]2 ..................................... 1703.3.1.3 Electrophoretic Verification of the Presence of HMGB Protein in the
Diffracted Crystals ........................................................................................... 1723.3.2 DNA-HMGB1 Protein Binding Analysis .............................................................. 172
3.4 GENERAL DISCUSSION .................................................................................................. 174
CHAPTER 4. BIS(2-AMINOIMIDAZOLINE) COMPOUNDS4.1 Interaction of Minor Groove Binding Drugs with AT-Rich DNA ........................ 1794.2 DNA-MGBD Binding Analysis by SPR ........................................................................ 1794.3 DNA Binding Competition Assay: HMG Proteins vs Bis(2-aminoimidazoline)
Derivatives ......................................................................................................................... 1844.4 DNA-Bis(2-aminoimidazoline) Crystallography Assays ....................................... 185
4.4.1 Structure of CDIV32 – d[AAATTT]2 ...................................................................... 1864.4.2 Structure of FR60 – d[AAATTT]2 ........................................................................... 189
4.5 GENERAL DISCUSSION .................................................................................................. 196
CHAPTER 5. EFFECT OF THE BIS(2-AMINOIMIDAZOLINES) ON
TRYPANOSOMA BRUCEI5.1 In vitro Activity of Bis(2-aminoimidazoline) Compounds Against
Trypanosomes.. ................................................................................................................. 2015.1.1 Drug sensitivity in Trypanosoma brucei ............................................................. 2015.1.2 Drug sensitivity in Trypanosoma congolense ................................................... 202
5.2 In vitro Efficacy and Effect of Bis(2-aminoimidazoline) Compounds on
Trypanosome Growth ..................................................................................................... 2035.3 Cell Cycle Analysis of Bis(2-aminoimidazoline)-Exposed Trypanosoma
brucei…… ........................................................................................................................... 2055.4 Cellular Localization of the Compound JNI18 ........................................................ 211

CONTENTS
xi i i
5.5 Effect of the Bis(2-aminoimidazoline) Derivatives on the Mitochondrial
Membrane Potential of T. brucei ................................................................................ 2135.6 PCR Amplification of Kinetoplast DNA Markers .................................................... 2155.7 Effect of Compounds FR60 and JNI18 on the Kinetoplast Network ................ 2175.8 In vivo Activity in a Mouse Model of First Stage HAT .......................................... 2195.9 GENERAL DISCUSSION .................................................................................................. 220
CONCLUSIONS .............................................................................................................. 225
PUBLICATION RELATED TO THIS THESIS ............................................................... 229
APPENDIXES…. ............................................................................................................. 233Appendix A ................................................................................................................................. 233Appendix B ................................................................................................................................. 235Appendix C ................................................................................................................................. 237Appendix D ................................................................................................................................. 238Appendix E .................................................................................................................................. 242Appendix F .................................................................................................................................. 246Appendix G ................................................................................................................................. 256
REFERENCES…. ............................................................................................................. 259


LIST OF FIGURES
Chapter 1 1
xv
L IST OF FIGURES
Figure1-1. Schemes of (a) the three elements of a nucleotide and (b) the DNA double
helix. ............................................................................................................................................... 4
Figure 1-2. Chemical structures and classification of the DNA nucleobases. Red dotted
lines show the hydrogen bonds between adenine and thymine (AT) and guanine
and cytosine (GC). ....................................................................................................................... 5
Figure 1-3. The minor and major grooves for B-form DNA for the base pairs GC (left)
and AT (right). A, acceptor; D, donor; H, hydrogen; and M, methyl.. ........................... 7
Figure 1-4. (a) Torsion angles for backbone conformations of the i th nucleotide in
polynucleotide chains. (b) DNA sugar group and its torsion angles ν0, ν1, ν2, ν3, and
ν4. ..................................................................................................................................................... 9
Figure 1-5. Base pair parameters classification by rotations and translations. (a) Local
base pair parameters, (b) local base pair helical parameters, and (c) local base pair
step parameters. ........................................................................................................................ 10
Figure 1-6. Top and side views illustrating the characteristic features of regular helical
structures of DNA forms A, B and Z. Generated by parameters reported in (Lu &
Olson, 2003). ............................................................................................................................... 12
Figure 1-7. Structures of anti and syn guanine nucleoside conformations. ...................... 14
Figure 1-8. The four structural scales in DNA. ........................................................................... 16
Figure 1-9. Schematic representation of the HMGA human protein-coding gens. Black
arrows indicate the direction of the gene in the chromosome and their boxes
illustrate their respective exons. Dark blue boxes represent the exons transcribed
in mRNA and code for HMGA proteins. AT-hooks are shown in green and acidic C-
terminal region in red. Adapted from Fusco & Fedele, 2007. ....................................... 25

LIST OF FIGURES
xvi
Figure 1-10. Amino acid alignment of human HMGA proteins. Unique sequences are
indicated by lowercase letters. AT-hook central invariant repeat R-G-R-P is shown
in green boxes and C-terminal acid tail in purple boxes. BLAST
[http://blast.ncbi.nlm.nih.gov/Blast.cgi#]. .......................................................................... 26
Figure 1-11. Top and front views of AT-hook interactions with DNA. (a) NMR structure
of the complex of DNA dodecamer and the II AT-hook (PDB ID: 2EZD). (b) Crystal
structure of a complex of AT-rich oligonucleotide with the III AT-hook of HMGA
(PDB ID: 3UXW). The DNA dodecamers (a) GGGAAATTCCTC and (b) CGAATTAATTCG
shown as partially transparent objects are drawn with Pymol. .................................. 27
Figure 1-12. HMGA proteins interactions with (a) DNA, (b) other proteins such as
transcription factors (TF), and (c) the chromatin structure. Fusco & Fedele, 2007.
........................................................................................................................................................ 28
Figure 1-13. Amino acid alignment of human HMGB proteins. Residues contained in
HMG-boxes are highlighted in brownish and C-terminal acid tail in purple. [*]
Residues identical in all sequences in the alignment; [:] conserved substitutions;
and [.] semi-conserved substitutions. Alignment created by UniProt
[http://www.uniprot.org/align/]. ........................................................................................... 31
Figure 1-14. Domain structures of HMGB1 protein. Schematic representation of the
HMGB proteins and the α-helices within the HMG-boxes A (orange; PDB ID: 1AAB)
and B (blue; PDB ID: 1HME) as determined by NMR microscopy (Hardman, et al.
1995; Weir et al., 1993). ......................................................................................................... 32
Figure 1-15. HMGBs intranuclear activity. (a) HMGB bends DNA and enhances the
binding of specific transcription factors. (b) HMGB-TF1 complex binds and bends
DNA and HMGB-TF1-DNA may promote the binding with other TFs. (c) HMGB
induces chromatin unfolding by displacing histone H1. (d) HMGB promotes
formation of complex nucleoprotein structures. Nucleosome structures are
illustrated in grey cylinders. TF1/TF2 are examples of transcription factors (green

LIST OF FIGURES
Chapter 1 1
xvi i
and purple), NP1-3 are nuclear proteins (mint, aqua and pink). H1 in red simulate
a histone. ..................................................................................................................................... 34
Figure 1-16. Crystal structures of HMG-box bound to DNA. (a) The domain structure of
mature TFAM in complex with a mitochondrial DNA fragment. HMG-box motifs,
shown in blue and green, are forming a complex with the 28 base pair DNA (grey),
and bending the DNA into a U-turn (Ngo et al., 2011; PDB ID: 3TMM). (b) The two
near-symmetric box A domains (purple and cyan) of HMGB1 protein collaborate
to bend the AT-rich DNA decamer (orange) (Sánchez-Giraldo et al., 2015; PDB ID:
1CKT). DNA sequences are given below each structure. ................................................ 36
Figure 1-17. Diverse structures of minor groove binding drugs. .......................................... 41
Figure 1-18. Crystal structures of MGBD with all-AT DNA. (a) Asymmetric unit of the
crystal containing pentamidine-d[ATATATATAT]2 complex. The drug interacts
through the minor groove at the centre of the sequence. (Moreno et al., 2010;
PDB ID: 3EY0). (b) The different crystallographic units of the CD27-d[AAAATTTT]2
complex . The black lozenge indicates one of the dyad axes (Acosta-Reyes et al.,
2014; PDB ID: 4OCD). .............................................................................................................. 43
Figure 1-19. Distribution of human African trypanosomiasis worldwide in 2015.
Number of reported cases caused by (a) Trypanosoma brucei gambiense and (b)
Trypanosoma brucei rhodesiense. Data source: World Health Organization. .......... 47
Figure 1-20. Trypanosome cell architecture. A simplified schematic representation of
the location of the major organelles of the trypanosome cell. Adapted from
Matthews, 2005. ....................................................................................................................... 50
Figure 1-21. A generalized life cycle of Trypanosoma brucei. CNS: central nervous
system. Adapted from Langousis & Hill, 2014. ................................................................. 51
Figure 1-22. Cell cycle regulation in Trypanosoma brucei. Duplication of the major
organelles and structures during the cell cycle is illustrated, indicating the stages

LIST OF FIGURES
xvi i i
G1, S phase, G2 and M (mitosis). Kinetoplast (K) is shown in red ovals and nucleus
(N) in blue sphere. ..................................................................................................................... 52
Figure 1-23. Kinetoplast DNA network structure. (a) Electron micrograph of the
periphery of an isolated kDNA network. Loops represent interlocked minicircles
(arrowhead indicates a clear example). Scale bar 500 nm. (b) Schematic
representation of the minicircles’ organization. 1. Segment of an isolated network
showing interlocked minicircles in a planar array. 2. Section through a condensed
network disk-shaped in vivo showing stretched-out minicircles. The double-
headed arrow indicates the thickness of the disk, which is about half the
perimeter of a minicircle. Adapted from Lukes et al., 2002. ........................................ 54
Figure 1-24. The kDNA replication model of Trypanosoma brucei showing the location
of replication proteins and minicircle replication intermediates. Pol, DNA
polymerase; PAK, proline, alanine and lysine-rich; Topo, topoisomerase; SSE1,
structure-specific endonuclease 1; UMSBP, universal minicircle sequence-binding
protein. Adapted from Englund et al., 2005. ..................................................................... 55
Figure 1-25. Mitochondrial inner-membrane potential in T. brucei. The ATP synthase is
composed of Fo, which is embedded in the IM and translocates protons, and F1,
which can either synthesize or hydrolyze ATP. The ATP–ADP carrier (AAC)
mediates the exchange of ATP and ADP across the IM. (a) In the procyclic form,
the electron transport machinery generates ΔΨ to drive ATP synthesis, in addition
to protein import and metabolite transport (not shown). (b) In the bloodstream
form, the ATP synthase runs backwards and uses ATP hydrolysis to pump protons
across the IM to generate ΔΨ. (c) In Dk or Ak trypanosomes, the Fo portion of the
ATP synthase is missing (e.g. owing to a lack of the kDNA encoded subunit, A6),
but the F1 portion hydrolyzes ATP to ADP in the matrix. The exchange of ADP−3
with ATP−4 from the cytosol establishes ΔΨ. Adapted from Jensen et al, 2008. . 57
Figure 1-26. The HMG box-containing proteins TbKAP6 and HMGB1. Schematic
comparison of two tandem HMG-boxes in TbKAP6 with those of human HMGB1.
HMG-box A: green box; HMG-box B: blue box; C-terminal acidic tails: hatched

LIST OF FIGURES
Chapter 1 1
xix
lines. Structure comparison (below each diagram) of the HMG boxes A and B of
TbKAP6 constructed by SWISS-MODEL workspace [http://swissmodel.expasy.org/]
(Wang, et al., 2014); and HMGB1 box A (green; PDB ID: 1AAB) and box B (blue;
PDB ID: 1HME) as determined by NMR microscopy (Hardman, et al. 1995; Weir et
al., 1993). ..................................................................................................................................... 58
Figure 1-27. Amino acid alignment of the two HMG-boxes of TbKAP6 and the box B of
HMGB1. Adapted from Wang, et al., 2014. ....................................................................... 59
Figure 1-28. Chemical structures of the established drugs used in chemotherapy of HAT.
Pentamidine and suramin are effective at early stage, while melarsoprol,
nifurtimox and eflornithine are used as at late stage of HAT. ..................................... 61
Figure 2-1. Scheme of HMGA1a(∆50-91) compared to the full-length protein HMGA1a.
The AT-hook DNA-binding domains are shown in green. ............................................. 72
Figure 2-2. Scheme of the plasmid used to expressed HMGA1a(∆50-91). Figure created
by Savvy SVG plasmid map generating program [http://www.bioinformatics.org/
savvy/]. ......................................................................................................................................... 73
Figure 2-3. Scheme of the plasmid pGEX-2T encoding the GST-fusion protein HMGB1
(left). Figure created by Savvy SVG plasmid map generating program
[http://www.bioinformatics.org/savvy/]. Schematic representation of the HMGB1
proteins studied (right): Box AB and Box B. ...................................................................... 80
Figure 2-4. Scheme of a supercoiling assay. ............................................................................... 96
Figure 2-5. General scheme for DNA-ligand crystallization ................................................ 102
Figure 2-6. Schematic representation of a 2D phase diagram for the crystallization of
macromolecules showing the compound solubility as function of precipitant.
Labile and metastable zones, where nucleation and crystal growth respectively
occur, are indicated. ............................................................................................................... 104

LIST OF FIGURES
xx
Figure 2-7. Schematic representation of the vapor diffusion crystallization set-ups used:
hanging-drop and sitting-drop. This technique has two liquid phases: (1) the
droplet, containing a crystallization solution with the macromolecule and (2) the
reservoir, which contains the precipitant solution. A third gaseous phase is used
to carry out vapor diffusion. ................................................................................................ 111
Figure 2-8. Diagram of a cryo-crystallography system (left) and a cryo-loop with a
crystal mounted (right) .......................................................................................................... 113
Figure 2-9. The unit cell is the simplest repeating unit in a crystal. It is determined by
three vectors, which are described by six parameters: the lengths of the cell (a, b,
c) and the angles between them (α, β, γ). ....................................................................... 114
Figure 2-10. Schematic representation of the asymmetric unit as a group of atoms.
After applying a set of symmetry operations the unit cell is obtained; when this
cell is regularly repeated, the crystal is generated. ....................................................... 115
Figure 2-11. Bragg's law determines the angles for coherent scattering. Angle 2θ is the
scattering angle, λ is the wavelength and d is the interplanar distance. The lower
beam travels an extra path 2dsinθ for which constructive interference occurs if
the path is a multiple of the wavelength (nλ) ................................................................ 119
Figure 2-12. Ewald's Sphere of radius 1/λ. In reciprocal space, the lattice nodes that lie
on the sphere satisfy that the diffraction vector ΔS is the difference between the
incident wave vector Si and the diffracted vector S0. This establishes the
relationship between the wavelength of the incident radiation (wave vector) with
the reciprocal lattice of the crystal and the diffraction angle 2θ ............................ 121
Figure 2-13. The principle of surface plasmon resonance (SPR). ........................................ 133
Figure 2-14. Scheme of a streptavidin-biotin immobilization of a DNA hairpin used
during SPR experiments. ....................................................................................................... 133
Figure 2-15. Schematic illustration of a SPR sensorgram. The bars below the
sensorgram curve indicate the solutions that pass over the sensor surface. ........ 134

LIST OF FIGURES
Chapter 1 1
xxi
Figure 2-16. Conversion of resazurin to resorufin by viable cells results in a fluorescent
product. The fluorescence produced is proportional to the number of viable cells.
...................................................................................................................................................... 138
Figure 2-17. 96-well microplate diagram. Arrow explains the way the drugs are doubly
diluted down two rows across the plate. DF; drug free, negative control. ............ 139
Figure 3-1. AU–PAGE showing induction of the HMGA1a(∆50-91) protein expression.
...................................................................................................................................................... 151
Figure 3-2. (a) Cation-exchange chromatogram and (b) AU-PAGE analysis of
HMGA1a(∆50-91) protein. Sample P corresponds to the pellet obtained in a
previous-to-load centrifugation of S, which is the protein sample loaded into the
column. B, buffer containing 600 mM NaCl, 25 mM Tris-HCl, ph7. ........................ 152
Figure 3-3. AU-PAGE of HMGA1a(∆50-91) concentrated samples after cation-
exchange chromatography. .................................................................................................. 153
Figure 3-4. (a) Size-exclusion chromatogram and (b) AU-PAGE analysis of the fractions
from the main peak. S corresponds to the HMGA1a(∆50-91) protein sample
loaded into the column. ........................................................................................................ 154
Figure 3-5. AU-PAGE of HMGA1a(∆50-91) final samples. ................................................... 154
Figure 3-6. SDS–PAGE of the induction of GST-fusion HMGB1 proteins expression. MW,
molecular weight marker MW-SDS-6 Dalton Mark™ VI (Sigma). ............................. 156
Figure 3-7. SDS-PAGE gels of the fractions eluted from the affinity column
corresponding to (a) the GST-HMGB1 Box B fusion protein and (b) the GST-
HMGB1 Box AB fusion protein. MW, molecular weight marker; FT, flow through;
W, column wash; THW, thrombin buffer wash; FTc, flow through after tag
cleavage; El, E2 and E3, eluted fractions; Beads, sample from microparticles of the
column matrix taken at the end of the elution as a control. ..................................... 157

LIST OF FIGURES
xxi i
Figure 3-8. Cation-exchange chromatogram (left) and SDS-PAGE analysis of the
fractions from the main peak (right). MW, molecular weight marker; S, HMGB1
protein sample loaded into the column. .......................................................................... 158
Figure 3-9. Size-exclusion chromatogram of (a) HMGB1 Box B protein sample and (b)
HMGB1 Box AB protein sample. ......................................................................................... 159
Figure 3-10. SDS-PAGE of HMGB1 protein (Box B and Box AB) concentrated samples
after size-exclusion chromatography. MW, molecular weight marker MW-SDS-6
Dalton Mark™ VI (Sigma). ..................................................................................................... 160
Figure 3-11. Supercoiling activity of the HMGA1a(∆50-91) in the presence of different
salt concentrations: (1) 150 mM NaCl (high ionic strength), (2) 100 mM NaCl
(medium ionic strength) and (3) 50 mM NaCl (low ionic strength). DNA/protein
molar ratio is specified for each sample. SC, supercoiled DNA; OC, nicked form
(open circular DNA). ............................................................................................................... 161
Figure 3-12. Supercoiling activities at high ionic strength of two fragments of the
HMGA1a(∆50-91) and the complete protein lacking the acidic tail HMGA1a(∆1-
90). DNA/protein molar ratio is specified for each sample. SC, supercoiled DNA;
OC, nicked form (open circular DNA). ............................................................................... 162
Figure 3-13. EMSA assays of HMGA1a(∆50-91) in complex with AT-rich
oligonucleotides: (1) d[CCAATAATCGCGATTATTGG]2, (2) d[ATTATTAATAAT]2, (3)
d[AATATATATATT]2 and (4) d[AAATATATTT]2. ................................................................... 164
Figure 3-14. (a) SPR sensorgrams of HMGA1a (10 nM to 10 µM) binding to dsDNA
biotin-GGGAATAATCGCGATTATTCCCCAATAATCGCGATTATT in HEPES 1 at 25°C. (b)
Binding curve for interaction of HMGA1a(∆50-91) with target DNA and fitting
curve for a two-site affinity model. Graphs were created with Prism 5.0 (GraphPad
Software). .................................................................................................................................. 165
Figure 3-15. EMSA assays of a HMGB1 protein fragments in complex with AT-rich
oligonucleotides: (1) d[CCAATAATCGCGATTATTGG]2, (10) d[AATAATCGCGATTATT]2
LIST OF FIGURES
Chapter 1 1
xxi i i
and (14) d[AATAAATTTATTT]2. HMGB1 box A, residues 7-80; box B, residues 93-
165; and box AB residues 1-165 of HMGB1 protein. HMGB1a box A sample was
provided by a member of MACROM research group. ................................................... 167
Figure 3-16. Crystal 4C4-2 image and diffraction pattern of oligonucleotide (7)
d[AATAAATTTATT]2 with HMGB1 box B. Crystallization conditions are detailed
below the image. ..................................................................................................................... 169
Figure 3-17. Image of the crystal IG5-6 of oligonucleotide (7) d[AATAAATTTATT]2 with
HMGB1 box B (left). Its diffraction pattern corresponds to a mixture of fiber-like
diffraction and defined spots at low resolution. Crystallization conditions are
detailed below the image. .................................................................................................... 169
Figure 3-18. Image of crystal NC5-1 and diffraction pattern of oligonucleotide (1)
d[CCAATAATCGCGATTATTGG]2 with HMGB1 box B. Crystallization conditions and
an image of the crystal in the loop taken at the moment of the diffraction are
also shown. Arrows indicate the crystal diffracted. The patterns on the left show
two orientations of diffraction that are at ∼90° to each other. ............................... 170
Figure 3-19. SDS-PAGE of crystals of HMGB1 box B with DNA. Sample of HMGB1 box
B were used as control (50 and 100 ng). ......................................................................... 172
Figure 3-20. (a) SPR sensorgrams of HMGB1 box AB (10 nM to 10 µM) binding to
dsDNA biotin-GGGAATAATCGCGATTATTCCCCAATAATCGCGATTATT hairpin in
HEPES 1 at 25°C and (b) Binding curve for interaction of HMGB1 box AB with
target DNA and fitting curve for a two-site affinity model. Graphs were created
with Prism 5.0 (GraphPad Software). ................................................................................ 173
Figure 4-1. Binding screening by SPR of bis(2-aminoimidazoline) compounds to biotin-
GGGAATAATCGCGATTATTCCCCAATAATCGCGATTATT hairpin in HEPES 1 at 25°C.
...................................................................................................................................................... 180
Figure 4-2. (a) SPR sensorgrams for binding of drug FR60 to dsDNA biotin-
GGGAATAATCGCGATTATTCCCCAATAATCGCGATTATT in HEPES 1 at 25°C, using

LIST OF FIGURES
xxiv
increasing concentrations of the ligand in the range of 0.25-57.6 µM. (b) Binding
curve for interaction of FR60 with target DNA and fitting curve for a two-site
affinity model. .......................................................................................................................... 181
Figure 4-3. (a) SPR sensorgrams for binding of drug CDIV32 to dsDNA biotin-
GGGAATAATCGCGATTATTCCCCAATAATCGCGATTATT in HEPES 1 at 25°C, using
increasing concentrations of the ligand in the range of 0.25-57.6 µM. (b) Binding
curve for interaction of CDIV32 with target DNA and fitting curve for a two-site
affinity model. .......................................................................................................................... 181
Figure 4-4. SPR sensorgrams and binding curves for interaction of drug JNI18 with
hairpins (a) biotin-GGGAATAATCGCGATTATTCCCCAATAATCGCGATTATT; (b) biotin-
CGAATTCGTCTCCGAATTCG; (c) biotin-CATATATATCCCCATATATATG; and (d) biotin-
CGCGCGCGTTTTCGCGCGCG in HEPES 1 at 25°C, using increasing concentrations
of the ligand in the range of 0.25-57.6 µM. For the AT-rich sequences, the curve
was adjusted to a two-site affinity model and for the CG-rich sequence to a one-
site binding model. ................................................................................................................. 182
Figure 4-5. (a) SPR competition sensorgrams showing the inhibition of a fixed
concentration (2 µM) of HMGA1a1a(∆50-91) (Top left panel) and HMGB1 box AB
(top right panel) binding to dsDNA containing [AATAAT_ATTATT] oligonucleotide
in the presence of increasing concentration of JNI18. Drug concentration range
from 0.05 to 200 µM (for HMGA1a[∆50-91]) and 0.05 to 400 µM (for HMGB1). (b)
Inhibition curves and IC50 values for inhibition of binding of HMGA1a(∆50-91)
(lower left panel) and HMGB1 box AB (lower right panel) to dsDNA by
compound JNI18. ................................................................................................................... 184
Figure 4-6. Crystals of d[AAATTT]2 with drug CDIV32 with different morphologies. .... 186
Figure 4-7. Image of crystal DB.5-4-1 and diffraction pattern of oligonucleotide (15)
d[AAATTT]2 with drug CDIV32. Crystallization conditions and an image of the
crystal in the loop taken at the moment of the diffraction are also shown. Arrows
indicate the crystal diffracted. ............................................................................................ 187

LIST OF FIGURES
Chapter 1 1
xxv
Figure 4-8. View of the packing of the model, where the crossed columns organization
and the asymmetric unit are visible. ................................................................................. 188
Figure 4-9. View of the electron density map at 1σ and difference map at 3σ of the
stacked oligonucleotides d[AAATTT]2 in crossed columns at 3.10 Å resolution. The
virtual step A-T between oligonucleotides has an helical twist of about -25°. ... 189
Figure 4-10. Image of crystal F6-1 and diffraction pattern of oligonucleotide (15)
d[AAATTT]2 with drug FR60. Crystallization conditions are also shown. ................ 189
Figure 4-11. View of the different crystallographic units of the complex. The black
lozenge indicates the dyad axes. Four independent single oligonucleotides chains
are shown; two of them (blue-green) form the central duplex and the other two
single strands (orange and red) form two different DNA duplexes with their
symmetrical chain. Three crystallographically independent drug molecules are
indicated in different colours. Drug F (pink), Drugs E (green) and G (blue). (b)
Hydrogen bonds formed by the drugs with the minor-groove atoms of the DNA
duplexes show similar interactions. The orientation of the aromatic rings in the
central drug (F, pink) differs from to the other two drugs. Drug E and G have two
possible inverted positions in the groove; for clarity only one of them is shown.
Image prepared with PyMOL (http://www.pymol.org). ................................................ 190
Figure 4-12. (a) View of the electron density map at 1σ of the stacked oligonucleotides
d[AAATTT]2 at 1,25 Å resolution. (b) OMIT 2Fo–Fc electron-density map (1 σ level)
of the three drugs in the complex. Drug F is at the top, followed by E and G below.
The bottom two frames show a superposition of the three drugs in two
perpendicular views. Image prepared with the program CCP4mg (McNicholas et al.
2011). ......................................................................................................................................... 191
Figure 4-13. Schematic representation of interactions between F and G or E drugs and
d[AAATTT]2. In the crystal, drugs G and E may be found in two alternative
positions, up and down, which are structurally identical. Symmetric chains are
indicated with apostrophe. ................................................................................................... 193

LIST OF FIGURES
xxvi
Figure 4-14. Packing of a layer of A-B duplexes. An enlarged view of the interactions
of drug F with the neighbouring phosphates of symmetrical DNA chains is shown
at the left. Images prepared with the program CCP4mg (McNicholas et al. 2011).
...................................................................................................................................................... 194
Figure 4-15. Views of the pseudo-tetragonal crystal packing of d[AAATTT]2 and the
drug FR60. Image prepared with PyMOL (http://www.pymol.org). ........................... 195
Figure 4-16. End-to-end interaction helical twist (ωT) angles of a single stacked
oligonucleotide column. The virtual step T-A between oligos A-B and D-D’ form a
ωT of -21°, while between oligos A-B and C-C’ ωT. value is 29°. Image prepared
with PyMOL (http://www.pymol.org). ............................................................................... 196
Figure 5-1. Effect of the bis(2-aminoimidazoline) compounds on the growth curve of
bloodstream form T. brucei 427WT. Microscopic cell counts were performed in
duplicate using a haemocytometer. The results shown are the average of the
duplicate determinations. Phenylarsine oxide (PAO) 1 µM and untreated cells
(Drug Free Control) are taken as controls. ....................................................................... 203
Figure 5-2. Growth curves of untreated control (Drug Free) T. brucei 427WT and of
parallel cultures treated with compounds FR60, JNI18 and CDIV32 at 0.5, 1, 2.5
and 5× their EC50 values. Microscopic cell counts were performed in triplicate,
using a haemocytometer. Error bars show the standard error of the mean for three
independent determinations. ............................................................................................... 204
Figure 5-3. Percentage of T. brucei 427WT in each stage of the cell cycle after 24 h
incubated with the compounds FR60, JNI18 and CDIV32. Parasites were treated
with 1× and 5×EC50 values of each compound. Error bars show the standard error
of the mean for three independent determinations. G1: all cells have one
kinetoplast and one nucleus; G2: all cells have two kinetoplast and two nucleus; S
phase: DNA synthesis. Untreated cells (Drug Free) as control was included in each
assay. .......................................................................................................................................... 208

LIST OF FIGURES
Chapter 1 1
xxvi i
Figure 5-4. Classification of the DNA content analysis. Images taken by the Zeiss
Axioskop 2 fluorescent microscope of Tb427WT cells stained with DAPI. The
outline of all cells is shown by DIC imaging. Images were processed using the
program Fiji (ImageJ). N, nucleus; K, kinetoplast; E, early stage of division; L, late
stage of division,. .................................................................................................................... 209
Figure 5-5. DNA content of cells treated (a) 8 and (b) 24 h with compounds FR60,
JNI18 and CDIV32 at 1× and 5× EC50 as determined by fluorescence microscopy.
For each sample, about 500 cells were counted and scored in terms of nuclei and
kinetoplasts. N, nucleus; K, kinetoplast; 1N/2N, cells with one or two nuclei but
no observable kinetoplastid. E, early stage of division; L, late stage of division.. 210
Figure 5-6. Fluorescence localization of the JNI18 in Trypanosoma brucei 427WT cells.
Images were taken at 0, 3, 6 and 24 h of incubation with 5 µM compound JNI18.
All fluorescent images are shown with compound 2 (λ=450, blue channel), SYTOX
Green (λ=523, green channel), MitoTracker (λ=599, red channel), and merge,
where arbitrary colours were used to visualise the various dyes: blue for JNI18,
purple for SYTOX, yellow for Mitotracker. The outline of all cells is shown by
differential interference contrast (DIC) imaging. Images were acquired using a
DeltaVision imaging system and deconvolved using the ratio conservative method,
on SoftWoRx software. ......................................................................................................... 212
Figure 5-7. Effect of compounds FR60, JNI18 and CDIV32 on mitochondrial membrane
potential (Ψm) of T. b. brucei 427WT. The results shown are the mean of three
independent determinations; error bars depict standard errors. Untreated cells
(drug free), valinomycin (depolarization) and troglitazone (hyperpolarization) are
employed as controls. ............................................................................................................ 214
Figure 5-8. Superposed histograms of T. b. brucei 427WT mitochondrial membrane
potential (Ψm) assay after 12 h incubation for (a) the controls: drug free,
valinomycin and troglitazone and (b) with the compounds FR60, JNI18 and
CDIV32 at 5×EC50 concentrations. (c) Graph bar with Ψm percentage of cells
treated 12 h with the compounds with fluorescence above the 100 AU (50% of

LIST OF FIGURES
xxvi i i
untreated cells). The results shown are the mean of three independent
determinations; error bars depict standard errors. ........................................................ 215
Figure 5-9. PCR amplification of the maxicircles genes ND5, ND7 and ND4; minicircles
genes Type A and Type A –like; nuclearly encoded actin & TbAT-1 gene as a
positive control for a nuclearly-encoded single copy gene from Trypanosoma
brucei 427WT. Time of exposure with the compound JNI18 is indicated above of
each band. (-) Negative control (no DNA in the PCR sample). (+) Positive control
of Tb427-WT DNA. .................................................................................................................. 216
Figure 5-10. TEM images showing normal ultrastructure of untreated cells of Tb427WT
after 3 h (left panel) of experiment and 24 h (right panel). F, flagellum, FP,
flagellum pocket, k, kinetoplast. Images were observed in a Tecnai T20 (FEI) at 200
kV. ................................................................................................................................................ 217
Figure 5-11. TEM images showing cells of Tb427WT treated with (a) FR60 and (b)
JNI18 for 3 h. F, flagellum, k, kinetoplast. Images were observed in a Tecnai T20
(FEI) at 200 kV. Irregular structures in the kinetoplast are shown with arrows and
arrowheads, indicating kDNA damage. ............................................................................. 218
Figure 5-12. TEM images showing cells of Tb427WT treated with (a) FR60 and (b)
JNI18 for 24 h. F, flagellum, k, kinetoplast. Images were observed in a Tecnai T20
(FEI) at 200 kV. Irregular structures in the kinetoplast are shown with arrows and
arrowheads, indicating kDNA severe damage. ................................................................ 218

LIST OF TABLES
Chapter 1 1
xxix
L IST OF TABLES
Table 1-1. Atoms involved in the backbone and sugar torsion angles. ................................. 9Table 1-2. Structural parameters of DNA configurations. ...................................................... 13Table 1-3. The three HMG protein families and their main characteristics. ...................... 23Table 1-4. Approval drugs for treating HAT. ............................................................................... 60Table 1-5. In vitro activity of FR60 and derivatives against T. brucei s427 (wild type)
and B48 (resistant) strains. .................................................................................................... 64Table 1-6. In vitro antiprotozoal activity of CDIV32. ............................................................... 65Table 2-1. Relevant specification of HMG proteins studied. .................................................. 71Table 2-2. HMG proteins production main stages. ................................................................... 72Table 2-3. SDS-PAGE gel and buffers composition. .................................................................. 87Table 2-4. SDS-PAGE staining and unstaining solutions. ....................................................... 89Table 2-5. AU-PAGE gel and sample buffer composition. ....................................................... 91Table 2-6. AU-PAGE staining and destaining solutions. .......................................................... 92Table 2-7. EMSA Gel composition. ................................................................................................. 93Table 2-8. Reaction samples for a supercoiling assay. ............................................................. 97Table 2-9. Chemical structure of the bis(2-aminoimidazoline) compounds studied in
this work. ..................................................................................................................................... 98Table 2-10. Extinction coefficient (ε) at 260 nm, neutral pH and 25°C. ......................... 100Table 2-11. Extinction coefficients (ε) and concentration and specifications of
oligonucleotides used in this work. ................................................................................... 101Table 2-12. Bravais lattices. ........................................................................................................... 116Table 2-13. DNA hairpin sequences studied by SPR. .............................................................. 135Table 2-14. Fluorescence parameters of the compound JNI18 in DMSO. ........................ 142

LIST OF TABLES
xxx
Table 2-15. Oligonucleotide primer sequences used in this study. .................................... 145Table 3-1. Final HMGA1a(∆50-91) protein samples obtained during this work. ........... 155Table 3-2. Final HMGB1 protein samples obtained during this work. ............................... 160Table 3-3.Oligonucleotide sequences used for crystallographic assays with
HMGA1a(∆50-91) ................................................................................................................... 163Table 3-4. Oligonucleotide sequences used for crystallographic assays with HMGB1
proteins. ..................................................................................................................................... 166Table 4-1. DNA binding constants determined by SPR for dsDNA containing
AATAAT_ATTATT, AATT, (AT)4, and (CG)4 sequences. ...................................................... 183Table 4-2. Oligonucleotide sequences used for crystallographic assays with bis(2-
aminoimidazoline) compounds. .......................................................................................... 185Table 4-3. Data collection and refinement statistics of the crystal F6-1. ....................... 192Table 4-4. Hydrogen bonds formed by drug FR60 in the minor groove of d[AAATTT]2 and
interactions with neighbouring phosphates. .................................................................. 194Table 5-1. Activity of bis(2-aminoimidazoline) compounds against T. brucei 427WT and
the isometamidium-resistant strain ISMR1. ................................................................... 201Table 5-2. Activity of drug CDIV23 against T. brucei TbAT1-B48. ...................................... 202Table 5-3. Activity of bis(2-aminoimidazoline) compounds against T. congolense. ..... 202Table 5-4. Histograms of flow cytometric analysis of propidium iodide fluorescence
associated with Tb427WT trypanosomes treated with the bis(2-aminoimidazoline)
compounds. ............................................................................................................................... 206

ABBREVIATIONS
Chapter 1 1
xxxi
ABBREVIATIONS
A Adenine
AAC ATP–ADP Carrier
ADP Adenosine Diphosphate
Ak Akinetoplastidy
ampR Ampicillin resistance gene
APS Ammonium Persulfate
ATP Adenosine Triphosphate
AU Asymmetric Unit
AU-PAGE Acetic Acid – Urea Polyacrylamide Gel Electrophoresis
BBB Blood-Brain Barrier
BF Bloodstream Form
bp Base Pair
C Cytosine
CC Correlation Coeffcient
CC50 Half-Maximal Cytotoxic Concentration (Cytotoxic Concentration 50%)
CCP4 Collaborative Computational Project Number 4
CD27 4,4'-bis(imidazolinylamino)diphenylamine
CDIV32 4,4'-bis(1-hydroxyimidazolinylamino)diphenylamine
CHUD Chromatin Unfolding Domain
CNS Central Nervous System
CSIC The Spanish National Research Council (Spanish: Consejo Superior de Investigaciones Científicas)
DAMP Damage-Associated Molecular Patterns
DAPI 4′,6-diamidino-2-phenylindole

ABBREVIATIONS
xxxi i
Dk Dyskinetoplastidy
DMSO Dimethylsulfoxide
DNA Deoxyribonucleic Acid
dsDNA double-stranded DNA
dsRNA double-stranded RNA
EC50 Half-Maximal Effective Concentration (Effective Concentration 50%)
EDTA Ethylenediaminetetraacetic Acid
EMSA Electrophoretic Mobility Shift Assay
FBS Fetal Bovine Serum
FR60 4-((4,5-dihydro-1H-imidazol-2-yl)amino)-N-(4-((4,5-dihydro-1H-imidazol-2-yl)amino)phenyl)benzamide dihydrochloride
G Guanine
gRNA Small Guide RNA
GST Glutathione S-transferase
HASO Helical Arrangement of Stacked Oligonucleotides
HAT Human African Trypanosomiasis
HBSS Hanks' Balanced Salt Solution
HEK Human Embryonic Kidney
HEPES (4-(2-Hydroxyethyl)-1-piperazineethanesulfonic Acid
HMG High Mobility Group
IBMB Molecular Biology Institute of Barcelona
IC50 Half-Maximal Inhibitory Concentration (Inhibitory Concentration 50%)
IDP Intrinsically Disordered Proteins
IFN-ß Interferon ß
IM Inner Membrane

ABBREVIATIONS
Chapter 1 1
xxxi i i
IMS InterMembrane Space
IP Intraperitoneal
IPTG Isopropyl β-d-1-thiogalactopyranoside
ISM Isometamidium
JNI18 3-chloro-4-((4,5-dihydro-1H-imidazol-2-yl)amino)-N-(4-((4,5-dihydro-1H-imidazol-2-yl)amino)phenyl)benzamide
K Kinetoplast
KAP Kinetoplast-Associated Protein
kDNA Kinetoplast DNA, Kinetoplast
MAD Multi-wavelength Anomalous Diffraction
MAR Matrix-associated Region
MGBD Minor Groove Binding Drugs
MIR Multiple Isomorphous Replacement
MPD 2-Methyl-2,4-pentanediol (hexylene glycol)
MR Molecular Replacement
Mr Molecular Weight Range
mRNA Ribosomal RNA
mtDNA Mitochondrial DNA
MW Molecular Weight
N Nucleus/Nuclei
NBD Nucleosomal Binding Domain
NCS Non Crystallographic Symmetry
NECT Nifurtimox-Eflornithine Combination Treatment
NMR Nuclear Magnetic Resonance
OC Open Circular DNA
OM Outer Membrane

ABBREVIATIONS
xxxiv
PAGE Polyacrylamide Gel Electrophoresis
PAO Phenylarsine Oxide
PAO Phenylarsine Oxide
PCR Polymerase Chain Reaction
PDB Protein Data Bank
PEG Polyethylene Glycol
PI Propidium Iodide
PTM Post-Translational Modifications
r.m.s.d. Root Mean Square Deviation
RAGE Receptor for Advanced Glycation End-products
RNA Ribonucleic Acid
RU Resonance Unit (binding response)
SAD Single-wavelength Anomalous Diffraction
SAR Scaffold-associated Region
SC Supercoiled DNA
SDS Sodium Dodecyl Sulfate
SI Selectivity Index
SP Sulphopropyl
spp. Latin abbreviation for multiple species (Species Pluralis)
SPR Surface Plasmon Resonance
ssDNA Single-stranded DNA
T Thymine
TAC Tripartite Attachment Complex
TBP TATA Binding Protein
TCA Trichloroacetic Acid
TEMED N,N,N',N-Tetramethylethylenediamine

ABBREVIATIONS
Chapter 1 1
xxxv
TF Transcription Factors
TFA Trif luoroacetate
TFAM Mitochondrial Transcription Factor A
TMRE Tetramethylrhodamine Ethyl Ester
VDG Variable Surface Glycoprotein
WC Watson-Crick (Basepairing)
WHO World Health Organization
WT Wild Type


CHAPTER 1
INTRODUCTION


INTRODUCTION
3
1 .1 The DNA
Nucleic acids are biomolecules essential to all known forms of life. DNA
(deoxyribonucleic acid) carries the genetic information used in all vital processes of
every living organism, and transfers it from one generation to the next.
The discovery of the DNA structure led to a revolution in biological science and to the
foundation of molecular biology. The explanation of the structure of the DNA
contributed dramatically to establish the interrelationship of its biological and
chemical properties and functions, such as the elucidation of the genetic code (Crick et
al., 1961), and thus establishing it as the key molecule of heredity, developmental
biology and evolution.
Structural determination of macromolecules has evolved to reach atomic resolution
with the use of crystallography and single crystal diffraction, which has contributed
significantly to increase the knowledge of properties and functions of nucleic acids
over the last 60 years.
1 .2 DNA Structure
In molecular biology, DNA duplex, double-stranded DNA and double helix are used to
describe the structure of the deoxyribonucleic acid molecule. DNA structure was first
published by James Watson and Francis Crick (Watson & Crick, 1953) based upon the
crucial X-ray diffraction patterns of DNA obtained by Rosalind Franklin and Maurice
Wilkins. They described the double helix as two intertwined helical phosphate-sugar
backbones, with the heterocyclic DNA bases projecting inwards from each of the two
strands. The two chains are antiparallel (running in opposite directions) and are held
together by hydrogen bonds formed between complementary nitrogen base pairs.
DNA is the most important biopolymer for life and consists of repetitive units, called
nucleotides (deoxyribonucleotides). Nucleotides are composed of a phosphate group
linked by a phosphoester bond to a pentose (specifically a 2’-deoxyribose) that in turn
Chapter 1
4
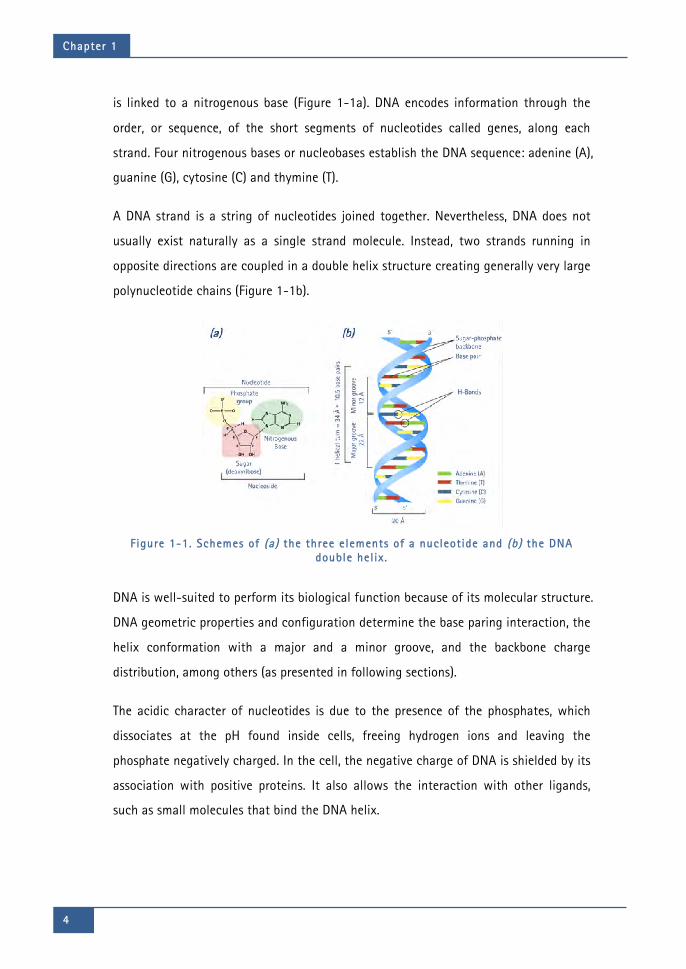
is linked to a nitrogenous base (Figure 1-1a). DNA encodes information through the
order, or sequence, of the short segments of nucleotides called genes, along each
strand. Four nitrogenous bases or nucleobases establish the DNA sequence: adenine (A),
guanine (G), cytosine (C) and thymine (T).
A DNA strand is a string of nucleotides joined together. Nevertheless, DNA does not
usually exist naturally as a single strand molecule. Instead, two strands running in
opposite directions are coupled in a double helix structure creating generally very large
polynucleotide chains (Figure 1-1b).
Figure 1-1. Schemes of (a) the three elements of a nucleotide and (b) the DNA
double hel ix .
DNA is well-suited to perform its biological function because of its molecular structure.
DNA geometric properties and configuration determine the base paring interaction, the
helix conformation with a major and a minor groove, and the backbone charge
distribution, among others (as presented in following sections).
The acidic character of nucleotides is due to the presence of the phosphates, which
dissociates at the pH found inside cells, freeing hydrogen ions and leaving the
phosphate negatively charged. In the cell, the negative charge of DNA is shielded by its
association with positive proteins. It also allows the interaction with other ligands,
such as small molecules that bind the DNA helix.

INTRODUCTION
5
1 .2.1 Base Paring and Stacking
The reasons behind the stability of the three-dimensional structure of DNA double
helix are mainly the base pairing between complementary strands and the stacking
between adjacent bases (Yakovchuk et al., 2006).
Figure 1-2. Chemical structures and classif ication of the DNA nucleobases. Red dotted l ines show the hydrogen bonds between adenine and thymine (AT) and
guanine and cytosine (GC).
DNA base pair complementarity is achieved by interactions between nucleobases.
These bases are heterocyclic compounds with the rings containing nitrogen and carbon
(Figure 1-2). Adenine and guanine belong to the purine group, while thymine and
cytosine are pyrimidines. Both types of molecules complement each other with the
opposing type of nucleobase, held together by hydrogen bonding. For an H-bond to
occur there must be a donor group (-NH2 or –NH) and an acceptor group with at least
one lone pair of electrons (C=O or N). Thus, the base complement adenine and thymine
(AT) shares two hydrogen bonds, while the base pair guanine and cytosine (CG) has
three hydrogen bonds (Yakovchuk et al., 2006) (Figure 1-2).
DNA denaturation occurs when hydrogen bonding between nucleotides is disrupted by
applying mechanical force, high temperature, or chemical treatment, among other
factors. This results in the separation of previously annealed strands into two single
strands. This permits the DNA strands to unzip for biologically important mechanisms

Chapter 1
6
such as DNA replication, transcription and DNA repair (Sicard et al., 2016). However,
this process is reversible. DNA can be recovered as the fully base-paired duplex.
Figure 1-2 shows the Watson-Crick (WC) base pairing, which is the most common base
pairing configuration. Nevertheless, there are different types of base pairing dictated
by specific hydrogen bonding patterns, such as the Hoogsteen base pair (Hoogsteen,
1963; Abrescia, 2002; Abrescia, 2004; Acosta-Reyes et al., 2015) and Wobble (Crick,
1966; Varani & McClain 2000), which can be formed under specific circumstances.
The base stacking is due to pi bonding (π-π), which involves interactions between
delocalized electrons in p-orbitals of the aromatic rings of the nucleobases. This
includes a combination of van der Waals and dipole-dipole interactions between the
bases. These hydrophobic, electrostatic interactions in which two or more bases are
positioned with the planes of their rings parallel are the other essential mode of
collaboration between bases in DNA. Undoubtedly, base stacking interactions are
important contributors to duplex stability and also significantly contribute to the
dependence of the duplex stability on its sequence, as well as its flexibility (Travers,
2004).
Pi stacking plays an important role in DNA crystal structures, stabilizing the typical
configuration of columns in a helical arrangement of stacked oligonucleotides (HASO)
(Campos et al., 2006). Base stacking interactions also contribute to the interactions
between small-molecules and proteins. As a result, pi-pi and cation-pi interactions are
important factors in rational drug design (Babine et al., 1997).
1 .2.2 Minor and Major Groove
In the duplex structure, the bases of one strand are paired with the complementary
ones and are localized in the cavity left between the two backbones. In the common
conformation of DNA, the backbones of the two strands exhibit two helical grooves
because of their antiparallel arrangement. They are closer together on one side of the
helix than on the other due to the glycosidic bond formed between the ribose group

INTRODUCTION
7
and a nitrogen base group in both nucleobases of the base pair, exposing different
parts of the nitrogenous bases.
The major and minor grooves are opposite to each other, and each runs continuously
along the entire length of the DNA molecule. The major groove has 22 Å of width while
the minor groove has12 Å. In B-DNA, the height of one helical turn measures 34 Å,
equivalent to 10.5 base pairs (see Figure 1-1b).
Figure 1-3. The minor and major grooves for B-form DNA for the base pairs GC ( left)
and AT (r ight) . A , acceptor; D, donor; H, hydrogen; and M, methyl .
The sides of each base pair are exposed so the minor and the major grooves generate
patterns of donors and acceptors for hydrogen bonds and van der Waals interactions
specific to each base pair (Figure 1-3). The codes of chemical groups A-A-D-H and its
reverse pattern, H-D-A-A in the major groove specify the identity of the GC and CG
pairs of bases respectively. Similarly, the patterns A-D-A-M and M-A-D-A uniquely
identify AT and TA base pairs, respectively. This allows DNA binding proteins involved in
biological processes to unequivocally recognize a DNA sequence. However, the minor
groove’s codes A-D-A and A-H-A don’t display such explicit information. Nevertheless,
it appears that minor groove electronegative potential may contribute significantly in
guiding proteins to their binding sites in the genome (Lindemose et al., 2011).
The grooves’ parameters change in every DNA type (see section 1.2.3). However,
changes are also function of the base paring and sequence composition. These
sequence specific variations and parameters of the DNA grooves play a vital role in
DNA-ligand identification.

Chapter 1
8
DNA-ligand interactions through the major groove mainly tend to associate with
proteins and through the minor groove with small molecules; since the minor groove is
assumed too narrow to accommodate protein structures without energetically costly
distortions. While the major groove dimensions remain very similar in free and bound
DNA, the minor groove is particularly variable in complexes (Oguey et al., 2010).
However, the importance of the minor groove in DNA-protein complexes has risen by
the increasing number of X-ray structures found (Morávek et al., 2002).
1 .2.3 DNA Parameters
In DNA, the 2-deoxirybose is a five-carbon sugar linked to the phosphate group by
phosphodiester bond to the third and fifth carbons of the adjacent sugars. This
irregular bonding to C3’ and C5’ confers specific orientation of the bases on each DNA
strand. Thus, a 5'-end of a strand means that only a phosphate group is attached to
the fifth carbon atom of the pentose sugar of that nucleotide. On the other hand, 3'-
end of a strand is when the third carbon atom of the pentose sugar of the terminal
nucleotide ends with a hydroxyl group. The antiparallel disposition between the two
strands of the DNA duplex confers its directionality: one strand runs 5’ to 3’ while the
other one runs 3’ to 5’. DNA can only be synthesized in vivo in the 5’ to 3’ direction.
DNA folding and structural conformation is determined by a set of backbone
parameters, including the six main chain torsion angles (α, β, γ, δ, ε, and ζ) around the
covalent bonds and one more (χ) related to the glycosidic bond (Figure 1-4a). The five
endocyclic torsion angles for the bonds of the sugar pucker are denoted by the symbols
ν0, ν1, ν2, ν3, and ν4, (Figure 1-4b). All these torsional angles confer a large number of
degrees of freedom to the DNA single strand, which are limited when the double helix
takes place. The permissible values depend on the adopted conformation (Schneider et
al., 1997; see section 1.2.4). The backbone torsion angles are defined in Table 1-1.
The sugar group occupies a crucial position in the nucleotide unit because it forms part
of both the backbone and the side chain. Since the sugar ring is non-planar and

INTRODUCTION
9
flexible, it can adopt different configurations, being the C3’-endo for A-DNA and the
C2’-endo for B-DNA the most common ones.
Figure 1-4. (a) Torsion angles for backbone conformations of the i th nucleotide in polynucleotide chains . (b) DNA sugar group and its torsion angles ν0, ν1, ν2, ν3, and
ν4.
The intrinsic flexibility of the DNA allows it to bend on local scales to facilitate
genome-based processes such as transcription, DNA repair and replication (Garcia et
al., 2007). Besides, in the highly packed state, genomic DNA is bent substantially to fit
into the volume of a cell or cell nucleus, employing small architectural proteins that
bend the DNA to compact the genome (Luijsterburg et al., 2008).
The mechanical properties that give DNA its flexibility are sequence dependent (Sarai,
et al., 1989). The physical and chemical properties of each nucleotide will define the
base step interactions with torsional and bending specific parameters.
Table 1-1. Atoms involved in the backbone and sugar torsion angles .
α : O3’(i-1) – P – O5’ – C5’ β : P – O5’ – C5’ – C4’ γ : O5’ – C5’ – C4’ – C3’ δ : C5’ – C4’ – C3’ – O3’
ε : C4’ – C3’ – O3’ – P(i+1) ζ : C3’ – O3’ – P(i+1) – O5’(i+1)
χpyrimidines : O4’ – C1’ – N1 – C2 χpurines : O4’ – C1’ – N9 – C4 ν0 : C2’ – C1’ – O4’ – C4’ ν1 : C3’ – C2’ – C1’ – O4’ ν2 : C4’ – C3’ – C2’ – C1’ ν3 : O4’ – C4’ – C3’ – C2’ ν4 : C1’ – O4’ – C4’ – C3’

Chapter 1
10
Figure 1-5. Base pair parameters classif ication by rotations and translations. (a) Local base pair parameters , (b) local base pair hel ical parameters , and (c) local base
pair step parameters .

INTRODUCTION
11
DNA capacity to adopt a particular conformation entails important biological
consequences (Travers, 2004). The formation of a DNA-protein complex not only can be
achieved by the recognition of a particular sequence, but also by the identification of
specific configurations of torsion and bending when nonspecific binding proteins have
preference for certain DNA structural features (Heddi et al., 2010).
DNA molecules do not have a perfect double helix. There are various structural
variations of the strands and helices according to every individual base pair, as well as
the neighboring base pairs along the duplex. The study of the morphology of the bases
allows the knowledge and identification of many features and deformations of nucleic
acids structures related to the sequence. In order to standardize those variations, a set
of parameters was defined according to the Cambridge convention (Dickerson, 1989;
Lu & Olson, 2003):
§ Parameters for individual base pairs:
- Local (or complementary) base pair parameters: the relative position and
orientation between bases of a base pair (Figure 1-5a).
- Local base pair helical parameters: the position and orientation of a rigid
body formed by one base pair (Figure 1-5b).
§ Parameters for local base pair step: the relative position and orientation from
one base pair to its adjacent (Figure 1-5c).
1 .2.4 DNA Double Helix Forms
Previous sections have described the most common DNA-form described by Watson
and Crick, called B-form. Nevertheless, there are other theoretical DNA conformations
such as A, C, D, Z. However, only forms A, B and Z exist within the cells of living
organisms (Figure 1-6).
The helical structure of DNA is variable and depends, among other factors, on the
nucleotide sequence, hydration, chemical modifications and superhelical tension.
Furthermore, the ionic character of the backbone makes the DNA especially sensitive to

Chapter 1
12
local environment, with DNA-ligand interactions that often lead to a change of
conformational state (Lu & Olson, 2003).
Figure 1-6. Top and side views i l lustrating the characterist ic features of regular
hel ical structures of DNA forms A, B and Z. Generated by parameters reported in (Lu & Olson, 2003) .
Table 1-2 lists the structural parameters for the three structural families of DNA helical
conformations. B-DNA is the term given for the canonical DNA helix and consists, as
mentioned before, in a double helix made of two antiparallel strands that are held
together via hydrogen bonding in the AT and GC base pairs. In B-DNA the distance
between the bases (rise) is 3.4 Å and the diameter of the helix is 20 Å (Figure 1-1b).
However, crystallographic studies of oligonucleotides had shown significant sequence-
dependent flexibility of the parameters on B-DNA helix listed in Table 1-2. The A- and
B-DNA families are right-handed (dextrorotatory) helices, while the Z-DNA family has
a left-handed orientation of the helix (levorotatory).
The A-DNA form has eleven base pairs per helical turn, a tilt of about 20 Å with
respect to the helical axis and an average rise of 2.55 Å, resulting in a shorter and
more compact helix where the base pairs are not perpendicular to the helix-axis as in
B-DNA. The major groove of A-DNA is narrower and deeper, while the minor groove is
wide and slightly shallower. The sugar pucker is C3' endo compared to C2' endo for B-

INTRODUCTION
13
DNA and the base pairs are shifted to the helix edge, which generate a 9 Å hole in the
centre of the helix.
In 1952, Rosalind Franklin discovered and named the A and B form, and she also
established that A-DNA conformation occurs in non-physiological dehydrating
conditions (Franklin & Gosling, 1953). This explains the incidence of A-DNA structures
found by X-ray crystallography; as such conditions are commonly used to form crystals.
However, A-DNA form has been identified as the most biologically active non-B-DNA
conformation.
Table 1-2. Structural parameters of DNA configurations.
Structural Parameter A-DNA B-DNA Z-DNA
Direction of helix rotation Right handed Right handed Left handed
Residue per helical turn 11 10.5 12
Axial rise per residue 2.55 Å 3.4 Å 3.7 Å
Pitch (length) of the helix 28 Å 33.2 Å 44.6 Å
Base pair tilt 20° -6° 7°
Rotation per residue 32.7° 34.3° -30°
Diameter of helix 23 Å 20 Å 18 Å
Configuration dA, dT, dC anti anti anti
of glycosidic bond dG anti anti syn
Sugar Pucker dA, dT, dC C3' endo C2' endo C2' endo
dG C3' endo C2' endo C3' endo
Values from Potaman & Sinden, 2013.
The B- to A-DNA conformational transition in vivo is reversible, cooperative and comes
from many different aspects including the sequence, the hydration level and the
interactions with enzymes, ions and ligands involved in biologically relevant reactions
(Whelan et al., 2014). This helical conformation occurs in double-stranded r ibonucleic
acids (dsRNAs), and in DNA-RNA hybrid double helices. Specific sequence repeats such
as 5’-CC-3’ and 5-’ACT-3’, that present predisposition to adopt an A-DNA have been
found (Feig & Pettitt, 1998). Other authors found preference for CG-rich sequences to
assume A-form most easily, attributed to the ability of cytosine to switch to C3’ endo
and have been confirmed by quantum mechanics calculations and nuclear magnetic
resonance study of 11-mer duplex (Tolstorukov et al., 2001). Added to this,

Chapter 1
14
experimental and theoretical studies have confirmed that some sequences as the A-
tracts can generate intermediate DNA conformations with specific structural
parameters like the *B-DNA (Hud & Plavec, 2003).
The third active form of duplex DNA has an outstandingly different, left-handed helical
structure with a pronounced zig-zag pattern in the phosphate-sugar backbone (Wang
et al., 1979). Z-DNA is formed by short stretches of alternating purines and pyrimidines,
particularly poly(dG-dC)2, in negatively supercoiled DNA, or at high salt concentrations.
The sugar of the G nucleotide is in the C3’ endo conformation, but the guanine base is
in the syn conformation, positioned the guanine back over the sugar ring; while in A-
and B-DNA guanine adopts the common and most favoured anti orientation (Figure
1-7). This syn conformation is the responsible for the laevorotatory structure. Z-DNA
has twelve bases per turn with a rise of 3.8 Å; the grooves, unlike A- and B-DNA, show
little difference in size.
Figure 1-7. Structures of anti and syn guanine nucleoside conformations.
Z-DNA only exists in a small amount of the DNA, and is difficult to study due to its
instability. Although its biological role has not been fully elucidated, proteins involved
in transcriptional activity that recognize and bind Z-DNA with great specificity have
been found (Oh et al, 2002).
The transition from B- to Z-DNA occurs, despite it is a higher energy conformation,
under physiological salt conditions when cytosine is methylated (Behe & Felsenfeld,
1981). This transition can also form an intermediate called B-to-Z junction box, which
is involved in the base pair extrusion (De Rosa et al., 2010; Martinez de Ilarduya et al.,
2010).

INTRODUCTION
15
1 .2.5 DNA Structural Scales
The elaborate three-dimensional shape of biomolecules can be explained at any of
several organization levels starting from the level of individual atoms until complex
organizations between two or more biopolymers. The DNA structural scale
classification is expressed in four levels: primary, secondary, tertiary and quaternary
(Figure 1-8).
Primary Structure
The primary structure of a nucleic acid describes the detailed atomic composition and
the chemical bonds connecting those atoms. Hence, DNA primary structure refers to
the exact sequence of nucleotides and the phosphodiester bonds that comprise the
chain starting from the 5’ end to the 3’ end.
Secondary Structure
The secondary structure defines the pattern of hydrogen bonds in a biomolecule. In
DNA, it is determined by the intramolecular H-bonds between the nucleobases of one
strand with its complementary one. This structural level described the double helix of
the DNA molecule formed by two strands of nucleotides in antiparallel position, held
together by the formation of the hydrogen bonds between nucleobases associated to
both strands, where the base pairing geometry and helical parameters variations can
create different arrangement of DNA as A, B, Z, and others (see section 1.2.4).
These interactions between bases occur only when a purine pairs a pyrimidine (see
section 1.2.1). Besides the canonical Watson-Crick base pairing, where CG base pairs
are bound by three hydrogen bonds whilst AT base pair forms two H-bonds, variations
between the base pairing conformation can generate alternate hydrogen bonding
patterns, such as the Wobble base pair and Hoogsteen base pair. Moreover, DNA can
adopt other secondary structures by the presence of mismatches or changes in the
complementarity between bases such as bulges, internal loops, hairpin loops and
junctions.

Chapter 1
16
Tertiary Structure
The tertiary structure of a DNA molecule comprehends its three-dimensional structure,
as defined by the atomic coordinates in space. The ability of DNA to fold into highly
compact and extremely ordered 3D forms leads to this structural scale.
Both linear and circular DNA molecules can rotate, twisting around each other, to
adjust to changes of various dynamic processes in the cell triggering supercoiled DNA,
which is the tertiary structure of DNA (Figure 1-8). Supercoiling, specifically the
negative one, can cause B-DNA to adopt a four-armed, cruciform structure that
resembles a Holliday junction, or stabilize three-stranded triplex DNA (Bochman et al.,
2012). Macro helices and other non-canonical structures like triplexes and
quadruplexes formed in telomeres are also included in the tertiary level of structure.
Figure 1-8. The four structural scales in DNA.

INTRODUCTION
17
The Quaternary Structure
The quaternary structure is the higher level of organization and it refers to the
interactions between two or more nucleic acid molecules, or between nucleic acid
molecules and proteins. The most commonly seen form of this DNA structural scale is
the interaction with the nuclear proteins histones to create nucleosomes when DNA
packing in eukaryotic chromatin takes place (Figure 1-8). DNA quaternary structures
change constantly according to the regions of genes needed to be transcript or during
DNA replication.
1 .3 AT-Rich DNA
High AT-content in the range of 70% or more is called AT-rich DNA. AT-rich sequences
can form motifs located strategically in the genome to perform a particular function.
These repeated sequences are present in the sites for DNA replication initiation in both
eukaryotic and prokaryotic replicons, as binding places or regulatory factors for the
appropriate replication initiation protein. The AT-rich fragment of the replication origin
represents the most ubiquitous conserved structural element identified in all replicons
(Rajewska et al., 2012). This AT-rich sequence contains the DNA unwinding element
(DUE), where the initial DNA helix destabilization (unwinding) occurs during the
process of replication initiation (Kowalski & Eddy, 1989; Carr & Kaguni, 2001).
The AT-rich regions constantly play an important role in the regulation of gene
transcription through the ability to influence transcription factors (TFs) and chromatin
proteins. The TATA box is an AT-rich DNA sequence found in the promoter region of
genes that facilitates easy unwinding and bending of the DNA double helix during the
process of transcription by the TATA binding protein (TBP; Roeder, 1996). The matrix
attachment regions (MARs) are AT-rich DNA sequences that could facilitate dynamic
processes in chromatin structure allowing accessibility to transcription factors at their
binding sites (Hart & Laemmli, 1998; Petersen el al., 2002), such as the transcriptional
regulation protein SATB1, which recognizes and binds specific regions of MARs in order
to fold chromatin into loop domains (Yasui et al., 2002; De Belle et al., 1998).

Chapter 1
18
H1 histone preferentially binds AT-rich DNA to repress their transcription and
therewith to contribute to chromatin condensation (Roque el al., 2004, Flickinger,
2015). The chromatin proteins called HMGA (High mobility group A) are able to bind
DNA in AT-rich regions and regulate gene expression by acting as architectural
proteins (see section 1.5.1.1; Baldassarre et al., 2005).
In spite of the identification of many AT-rich motifs, the fully knowledge about the AT-
rich regions is limited. Nevertheless, it is important to emphasize the strong
relationship between the two main functions of the AT-rich sequences in the genome:
the protein recognition and the structural peculiarities. These structural distinctions
have been specially studied within the A-tracts. Formed by four adenine and/or
thymine nucleotides, the A-tracts are a universal DNA element in regulatory regions of
many organisms (Haran & Mohanty, 2009). When they are inserted in phase with the
helical periodicity, these motifs present a narrow minor groove and an unusual DNA
form due to its flexibility, giving rise to a global curvature of the DNA double helix and
increasing stability of the DNA complexes with architectural proteins (Hizver et al.,
2001; Tolstorukov et al., 2005).
1 .3.1 Non-coding DNA
Firstly called “junk DNA” because its supposed lack of biological functions for the
organism, the non-coding DNA are sequences in the genome that do not encode
protein sequences. Although the functions of the non-coding sequences are not
completely clear yet, researchers have shown that a large fraction of this DNA is
transcribed and plays an important role in the regulation of differential gene
expression by the transcription of non-coding RNAs (Mattick, 2009). Other sections of
non-coding DNA provide regulatory sites (i.e., binding sites where transcriptional
proteins can bind to enhance or inhibit transcription), or act as structural elements
involved with chromatin and other architectural DNA components (Narlikar &
Ovcharenko, 2009).

INTRODUCTION
19
Non-coding DNA corresponds to the vast majority of the entire genome and is
composed by repeated sequences, usually regions that contain an above average
number of adenine and thymine bases (Campos et al., 2006).
The distinctive features of AT-rich DNA are based on its structural and mechanical
properties. The low thermodynamic stability of AT-rich regions causes the relatively
easy melting of the double helix, but provides also flexibility and high degree of
polymorphism.
1 .3.2 AT-Rich Organisms
The ratio between the four nucleotides in organism genomes is not equal and the shifts
to very high AT or CG content levels can occur in many different proportions for every
living system. Hence, Dictyostelium discoideum is an example of AT-biased genome
with 78% of AT content, while Streptomyces ceolicolor A3(2) with only 28% of AT
content is an example of a CG-rich genome. Shifts to very high AT or GC levels can
occur in several distinct branches of the tree of life. The underlying reasons for these
shifts therefore may be of different origin (Szafranski at al., 2005).
The singular properties of the AT-rich DNA and the necessity to understand the
unknown biological functions of certain AT-rich sequences encourage our interest on
organisms with high AT content. This includes various parasites, like the human malaria
parasite Plasmodium falciparum, which has a genome with extremely high AT content
(80%) and numerous repetitive sequences (Gardner et al., 2002). Another example are
species of kinetoplastid parasites, such as the genus Trypanosoma present a kinetoplast
(see section 1.7.2) with high content of adenines and thymines (around 70%).
The reason why the DNA of these organisms is constituted mainly by AT is not clear.
Comparison of the genomes of P. falciparum and D. discoideum shows that the slightly
higher AT content of P. falciparum genome compared to D. discoideum (80.1 versus
77.4%) is not achieved by increased AT richness in intergenic regions. Instead, both the
shift of the nucleotide usage in coding regions to AT-rich codons and the longer

Chapter 1
20
intergenic regions make an equal contribution to the higher AT content in this
organism (Szafranski at al., 2005).
1 .3.3 Importance of AT-Rich Regions in Target Site
Recognition
Previous sections have listed several AT-rich regions that are implicated in gene
regulation and DNA folding processes. Those regions act as specific binding sites for
certain proteins and their accessibility is crucial to achieve the protein-DNA binding
and thus, the right performance of DNA functions. Therefore, the ability to disrupt or to
direct changes in gene activity and replication functions can be performed by other
molecules such as drugs that specifically target these sequences.
An example is the nucleosome disruption by the DNA binding drug DAPI (Fitzgerald &
Anderson, 1999). DAPI specificity for AT sites creates a DNA-drug interaction that
prevents the nucleosome from forming on the DNA bending, leading to a histone-free
DNA during the assembly reaction. Opposite structural changes in the chromatin
structure are caused by distamycin A, a drug that preferentially binds to AT-rich DNA
(Radic, Lundgren, & Hamkalo, 1987). In this case, the drug distamycin A induces the
compaction of the chromatin by two mechanisms: linker DNA bending and
internucleosomal angle contraction. Changes in chromatin packing may directly affect
protein binding, altering the recognition of genes towards transcription factors
(Majumder & Dasgupta, 2011).
Some other AT-rich DNA-protein interactions could be not favourable for the cell
health. This research works focuses on the subfamily of proteins HMGA, which binds
preferentially to AT-rich DNA regions of the chromatin and their overexpression is a
hallmark of several metastatic cancers (Hock et al., 2007) (explained in detail in
section 1.5.1.1). Studies on the use of drugs to directly interfere with the DNA-HMGA
binding have found that the drugs distamycin (Smith & Buchmueller, 2011) and
netropsin (Miao et al., 2008) cause a displacement of HMGA protein motifs from the
DNA, acting as competitors for the same binding site. Furthermore, the DNA-

INTRODUCTION
21
intercalator drug cisplastin seems to enhance sensitivity in mouse embryonic stem cells
with high expression levels of HMGA1 proteins (Baldassarre et al., 2005).
One of the main focuses of this research work is the study of the DNA as a biological
target for antiparasitic drugs, particularly against Trypanosoma brucei, the causative
agent of African sleeping sickness. The kinetoplast of this parasite is particularly AT-
rich, with about 73% of AT content (Chen & Donelson, 1980) and thus, presents a
likely target for diamidines who bind the minor groove of parasitic DNA (Scott et al.,
2016). DNA-binders with preference for AT sequences as the aromatic dications
pentamidine, diminazene, furamidine and several derivatives are being used against
different strains of T. brucei, showing high efficiency but, in some cases, toxic side
effects (Wilson et al., 2008; Scott et al., 2016).
1 .4 DNA-Ligand Binding
In DNA-ligand binding studies, the ligand can be a drug (small molecule), an ion or a
protein, which binds to the DNA duplex. The interaction between the DNA and the
ligand may be function of charge, hydrophobicity or structural features, and occurs
generally by intermolecular forces, such as ionic bonds, hydrogen bonds and van der
Waals forces. When the DNA-ligand binding occurs, it may induce conformational
changes in the DNA, the ligand or both.
The tendency or strength of a ligand to interact with its binding sites can be measured
in terms of a binding affinity. In addition to the DNA and the ligand, the solvent plays
a very important role in binding recognition and affinity since it provides the
environment to drive or reject the binding (Baron, et al., 2010).
1 .5 DNA-Protein Interactions
DNA-protein interactions control a number of important cellular processes:
transcription factors modulate the process of transcription; various enzymes including
polymerases and topoisomerases are present during replication and transcription; and

Chapter 1
22
chromosomal proteins such as histones or HMG proteins are involved in chromosome
packaging.
Some DNA-protein interactions are mediated by DNA flexibility, particularly when
architectural proteins are involved. Factors like temperature and nucleotide sequence
contribute in the DNA intrinsic flexibility (Driessen et al., 2014; Geggier & Vologodskii,
2010).
The binding can occur to specific sequences or through non-specific DNA-binding
proteins, and they could present affinity for either single or double stranded DNA.
Nevertheless, all DNA-binding proteins are composed of domains where the binding
takes place. Most of the binding proteins interact with the major groove of the DNA
helix. However, the HMG proteins bind to the minor groove of the double helix.
Basically every biological function of DNA depends on site-specific DNA-binding
proteins finding their targets (Halford & Marko, 2004).
1 .5.1 HMG proteins
The ‘High Mobility Group’ (HMG) is a family of ubiquitous and abundant non-histone
nuclear proteins. The main function of HMG proteins is to coordinate and facilitate
DNA-directed nuclear processes by producing structural changes in the structure of
DNA and in the organization of the chromatin fiber (Bustin, 1999; Reeves, 2010).
Discovered in the early 1970s, the HMG proteins receive their name according to their
electrophoretic mobility in polyacrylamide gels. They were characterized by having low
molecular weight and high content of positively charged amino acids (Goodwin, 1973).
According to their DNA binding motifs, HMG proteins are classified into three families
(Table 1-3): HMGA, HMGB and HMGN, previously called HMG-I/Y, HMG-1/2 and HMG-
14/17 respectively. The members of each family are ubiquitously and abundantly
expressed in most eukaryotic cells. Although they display different binding domains
and structures, all of them act as architectural factors (Štros, 2010).
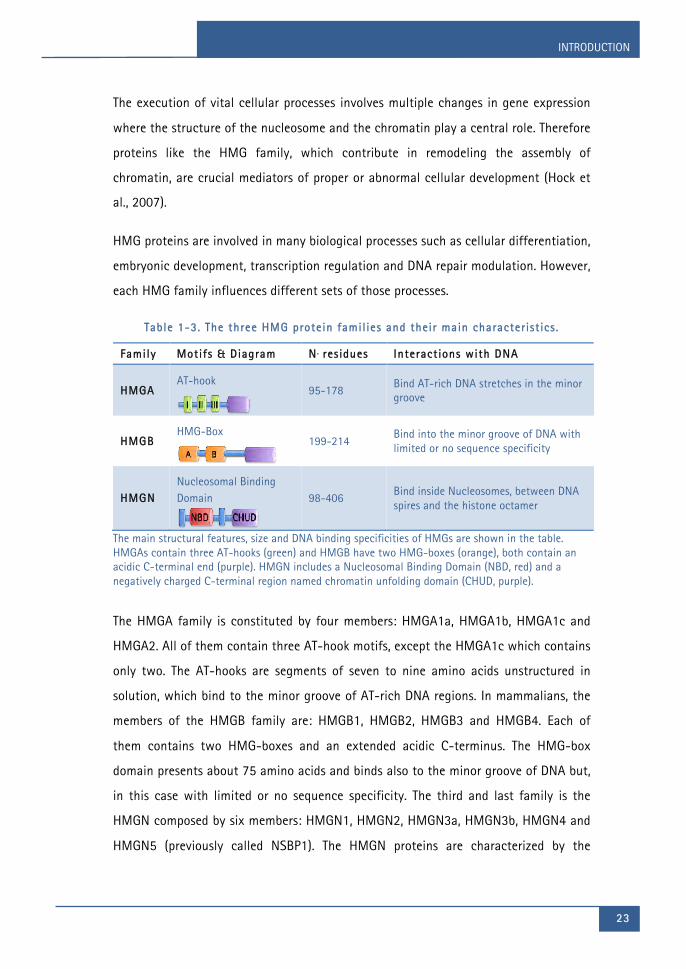
INTRODUCTION
23
The execution of vital cellular processes involves multiple changes in gene expression
where the structure of the nucleosome and the chromatin play a central role. Therefore
proteins like the HMG family, which contribute in remodeling the assembly of
chromatin, are crucial mediators of proper or abnormal cellular development (Hock et
al., 2007).
HMG proteins are involved in many biological processes such as cellular differentiation,
embryonic development, transcription regulation and DNA repair modulation. However,
each HMG family influences different sets of those processes.
Table 1-3. The three HMG protein famil ies and their main characterist ics .
Family Motifs & Diagram N o residues Interactions with DNA
HMGA AT-hook
95-178 Bind AT-rich DNA stretches in the minor groove
HMGB HMG-Box
199-214 Bind into the minor groove of DNA with limited or no sequence specificity
HMGN Nucleosomal Binding Domain
98-406 Bind inside Nucleosomes, between DNA spires and the histone octamer
The main structural features, size and DNA binding specificities of HMGs are shown in the table. HMGAs contain three AT-hooks (green) and HMGB have two HMG-boxes (orange), both contain an acidic C-terminal end (purple). HMGN includes a Nucleosomal Binding Domain (NBD, red) and a negatively charged C-terminal region named chromatin unfolding domain (CHUD, purple).
The HMGA family is constituted by four members: HMGA1a, HMGA1b, HMGA1c and
HMGA2. All of them contain three AT-hook motifs, except the HMGA1c which contains
only two. The AT-hooks are segments of seven to nine amino acids unstructured in
solution, which bind to the minor groove of AT-rich DNA regions. In mammalians, the
members of the HMGB family are: HMGB1, HMGB2, HMGB3 and HMGB4. Each of
them contains two HMG-boxes and an extended acidic C-terminus. The HMG-box
domain presents about 75 amino acids and binds also to the minor groove of DNA but,
in this case with limited or no sequence specificity. The third and last family is the
HMGN composed by six members: HMGN1, HMGN2, HMGN3a, HMGN3b, HMGN4 and
HMGN5 (previously called NSBP1). The HMGN proteins are characterized by the

Chapter 1
24
presence of a positively charged nucleosomal binding domain (NBD) with 30 amino
acids through which they bind specifically to the nucleosome core.
HMG proteins interactions with DNA and other proteins are highly regulated by
extensive post-translational modifications (PTMs). Essential participants in the
performance of nuclear functions, PTMs in HMG proteins include phosphorylation,
acetylation, methylation, glycosylation and ADP-ribosylation (Zhang & Wang, 2010).
The mechanisms by which HMG proteins alter the chromatin structure vary according
to each member of the family. HMGAs and HMGBs can facilitate the binding of
additional proteins (as TFs) by DNA bending activity (Reeves, 2001; Bianchi & Agresti,
2005). On the other hand, the DNA-HMGN complex is able to either prevent or assist
the access of modulating factors to chromatin (Lim et al., 2005). HMGA proteins as
HMGNs, bind to nucleosomes and as part of regulatory multiprotein complexes can
modulate the nucleosome flexibility, compacting or unfolding the chromatin. HMGA
competes with histone H1 for binding sites in the chromatin. The interactions HMGA-
H1-nucleosome provide flexibility to the chromatin structure affecting its functions
(Bianchi & Agresti, 2005).
As specific modulators of chromatin, HMG proteins impact various cellular functions
and affect the development and diseases. HMGs are present during embryonic
development and most of them are gradually down-regulated until their absence or
low expression in adult tissues (Fusco & Fedele, 2007). Overexpression of HMG proteins
alters the cellular phenotype and may lead to anomalies such as developmental defects,
diseases and cancer. Hence, high levels of expression of some HMGAs and HMGBs
represent a feature (biomarker) of malignant tumours and are strongly related to
neoplastic cell transformation (Fusco & Fedele, 2007; Shah & Resar, 2012).
1.5.1.1 HMGA
The human high mobility group A (HMGA) proteins comprise two types of proteins
(HMGA1 and HMGA2) produced by different genes. The first group includes three
proteins encoded by alternative splicing of the same gen: the two abundant variants

INTRODUCTION
25
HMGA1a and HMGA1b, and one unusual variant, the HMGA1c. The HMGA2 protein is
encoded by a different gene (Figure 1-9).
The HMGA1a protein is composed of 107 amino acids, HMGA1b has 96, HMGA1c 179
and HMGA2 comprises 109 residues. All HMGAs have a similar structure and are
conserved during evolution. Each protein contains three domains named AT-hooks
(except HMGA1c which only has two), through which they bind the minor groove of
DNA, and an acidic carboxy-terminal tail which role is still unknown although it may
be important in modulating protein-protein interactions (Cleynen & van de Ven, 2008)
(Figure 1-9). AT-hook motifs bind AT-rich sequences but, rather than be sequence-
specific DNA binding proteins, the HMGA proteins recognize particular structures of
the DNA helix.
Figure 1-9. Schematic representation of the HMGA human protein-coding gens. Black arrows indicate the direction of the gene in the chromosome and their boxes i l lustrate their respective exons. Dark blue boxes represent the exons transcribed in
mRNA and code for HMGA proteins . AT-hooks are shown in green and acidic C-terminal region in red. Adapted from Fusco & Fedele , 2007.
Figure 1-10 shows the primary structure of the HMGA proteins. The AT-hook motif is a
positively charged nine amino acid tract with a central repeat Pro-Arg-Gly-Arg-Pro
(AT-hook I contains a glycine instead of the first proline), flanked by flexible and
positively charged residues. Furthermore, at their C-terminal end, the HMGA proteins,
except for HMGA1c, have a high content of negatively charged acidic residues.
Secondary and tertiary structures of HMGAs in solution are not defined since they
belong to the intrinsically disordered proteins (IDP) group, that is to say, they lack a

Chapter 1
26
fixed or ordered three-dimensional structure. However, the central element of the AT-
hook induces structure formation upon binding with DNA (Slama-Schwok et al., 2000).
In reality, the structural changes are induced in both, protein and DNA when the
interaction occurs (Dunker et al, 2008).
Figure 1-10. Amino acid al ignment of human HMGA proteins . Unique sequences are indicated by lowercase letters . AT-hook central invariant repeat R-G-R-P is shown
in green boxes and C-terminal acid tai l in purple boxes. BLAST [http://blast .ncbi .nlm.nih.gov/Blast .cgi#] .
Hence, the study of DNA-HMGA interactions through structural studies has been
challenging. A couple of decades ago, NMR studies have revealed the structure of a
complex between a truncated form of HMGA protein (from the residue 51 to the 90),
containing the II and III AT-hook motifs with the DNA dodecamer GGGAAATTCCTC
(Figure 1-11a). There, it was shown how the central fragment RGR (Arg-Gly-Arg) of the
AT-hook adopts an ordered and well-defined conformation that adapts perfectly to the
minor groove of the oligonucleotide (Geierstanger et al., 1994; Huth et al., 1997). For a
better understanding of the complex stabilization, the AT-hook motif structure can be
divided into three segments: the central RGR core with an extended conformation deep
in the minor groove, the residues lysine and arginine at either end of the central core
provide electrostatic and hydrophobic interactions with the DNA backbone, and in the
II (but not the III) domain, the six C-terminal residues next to the core interact with
the backbone on the edge of the minor groove (Huth et al., 1997).
However, it was not until 2012 when a member of our research group (MACROM),
could crystallize and solve the first crystal structure of an AT-hook (Fonfría-Subirós et

INTRODUCTION
27
al., 2012). The structure shows the III AT-hook peptide in complex with the AT-rich
oligonucleotide CGAATTAATTCG and exhibits in detail the interaction of the AT-hook
domain in the minor groove of the double helix (Figure 1-11b). The inner PRGRP
sequence of the AT-hook peptide interacts with one of the AATT regions of the DNA
dodecamer and fully occupies its minor groove. In the binding region, the minor groove
is 4 -5 Å wider than the free minor groove.
Figure 1-11. Top and front views of AT-hook interactions with DNA. (a) NMR
structure of the complex of DNA dodecamer and the I I AT-hook (PDB ID: 2EZD). (b) Crystal structure of a complex of AT-r ich ol igonucleotide with the I I I AT-hook of
HMGA (PDB ID: 3UXW). The DNA dodecamers (a) GGGAAATTCCTC and (b) CGAATTAATTCG shown as partial ly transparent objects are drawn with Pymol .
HMGA proteins act as architectural elements positively and negatively regulating the
transcription of a variety of genes by changing the DNA conformation or by interacting
with several transcription factors (Ozturk et al, 2014). In this way, they are involved in
multiple nuclear processes including cell growth, proliferation, differentiation and
induction of apoptosis (Fujikane et al., 2016). The mechanism of action of the HMGA
proteins according to the substrates with which they interact, can be summarized in
the following list:
§ HMGAs direct interactions with DNA. They can bind to specific structures in
preferably AT-rich sequences of DNA, changing its conformation and

Chapter 1
28
consequently facilitating the binding of transcription factors, giving rise to
multiprotein stereospecific complexes bound to DNA (Figure 1-12a).
§ HMGAs direct interactions with TFs. They can bind to a variety of
transcription factors, changing its conformation and thus enhancing its DNA
binding affinity (Figure 1-12b).
§ HMGAs interactions with chromatin. They can be associated with specific
segments of genomic AT-rich DNA that have affinity for nuclear MAR and
SAR (matrix- and scaffold-associated regions), and de-represses transcription
by displacement of histone H1 from the chromatin structure (Figure 1-12c).
§ HMGAs as co-factor in virus integration and expression. They can facilitate
the integration of the double-stranded linear cDNA copies of virus genomes
into host cell chromosomes (Li et al., 2000).
Figure 1-12. HMGA proteins interactions with (a) DNA, (b) other proteins such as transcription factors (TF) , and (c) the chromatin structure. Fusco & Fedele , 2007.
The first example of HMGA interactions was described with the interferonß (IFN-ß)
promoter. HMGA1 stimulates the binding of a specific isoform of the activating
transcription factor 2 [ATF-2(195)] but also inhibits the binding of ATF-2(192) to the
IFN- ß gene promoter (Du & Maniatis, 1994). The activation of the ATF-2(195) is
stimulated by the bending of the DNA caused by the HMGA.

INTRODUCTION
29
Another kind of interactions with DNA occurs when HMGA proteins alter the
chromatin structure by forming a higher order transcriptional complex
“enhanceosome”. After binding DNA, the HMGA is able to coordinate the assembly of
additional TFs, altering the expression of specific target genes (Shah & Resar, 2012).
Both HMGA1 and HMGA2 genes are highly and ubiquitously expressed during
embryogenesis in undifferentiated or rapidly proliferating cells, and very low expressed
or non-expressed in normal adult tissues (Reeves, 2001; Macrì et al., 2016).
HMGA proteins may play a significant role in human disorders, particularly in
tumorogenesis. After the embryogenesis, there is a generalized de-repression of
HMGA1 and frequently HMGA2 expression in tumor cells. Overexpression of HMGA1
has been found in various types of malignant epithelial tumors in organs such as
prostate, colorectum, lung, breast, pancreatic, gastric, cervical and thyroid (Shah &
Resar, 2012). In every instance, a correlation between the concentration of HMGA1
and the degree of malignancy or metastatic potential has been found (Fedele & Fusco,
2010). HMGA2 overexpression is also observed in breast cancer, sarcomas, pancreatic
neoplasms, oral squamous cell carcinomas, and non-small cell lung cancer (Cleynen &
van de Ven, 2008). The strong and consistent association between levels of expression
of HMGA proteins and human cancers arising from diverse tissues suggests them as
potential biomarkers for neoplastic transformations (Shah & Resar, 2012).
Aberrant expression of HMGA proteins is related to other human pathologies besides
cancer. Examples of serious diseases where HMGA proteins play important roles are
type 2 diabetes mellitus (Chiefari et al., 2011), obesity (Anand & Chada, 2000) and
idiopathic pulmonary fibrosis (Pandit et al., 2010). Moreover, HMGA1 proteins are
critical cellular factors required for the formation of functional HIV-1 preintegration
complexes, its integration in the host genome and the viral gene transcription (Slama-
Schwok et al., 2000).
The canonical HMGA proteins are not only expressed in mammalians, but also in other
vertebrates such as the African clawed frog Xenopus laevis. This species has two allelic
isoforms, α and β, of the Xlhmga2 protein, homologous to human HMGA2 (Benini et

Chapter 1
30
al., 2006; Macrì et al., 2016), and the gene Xhmgax, which encodes a highly divergent
HMGA with eight AT-hooks (Vignali et al., 2008). Most plants and invertebrates also
express variants of HMGAs. An example is the fly Drosophila melanogaster that
expresses the D1 protein, orthologue of HMGA, presenting ten repeated AT-hook
motifs (Aulner et al., 2002).
In fact, studies have reported on the existence of more than 100 proteins from
different species containing the AT-hook DNA-binding domain, including Aspergillus
nidulans, Arabidopsis thaliana, Gallid herpesvirus 1, Saccharomyces cerevisiae (Aulner
et al., 2002; Aravind & Landsman, 1998), as well as many species of Leishmania (Kelly
et al., 2011).
1.5.1.2 HMGB
The mammalian high mobility group B (HMGB) comprises four types of proteins
encoded by distinct genes: HMGB1 with 215 amino acids, HMGB2 with 209, HMGB3
contains 200 amino acids, and the recently discovered HMGB4 is composed of 186
residues. The canonical HMGB1-3 proteins share more than 80% identity. HMGB4
presents a lower molecular mass and lacks the C-terminal tail (Štros, 2010).
Nevertheless, all members of the HMGB family contain two DNA-binding domains
called HMG-boxes A and B (Figure 1-13). The two boxes are structurally similar, and
their motions are completely independent (Bianchi & Agresti, 2005).
HMGB proteins exhibit not only high mobility in polyacrylamide gels like the rest of the
HMGs, but they also show it in the nucleus, being the most dynamic nuclear proteins
in cells (Scaffidi, et al., 2002).
All members of the HMGB family share a great similarity in the primary structure as
shown in the amino acid sequence alignment of the HMGB proteins in Figure 1-13. The
distinction is basically the acidic C-terminal tail length and in the case of the HMGB4,
the lack of it. In contrast to the HMGAs, the two tandem highly homologous HMGB
group motifs, HMG-boxes A and B, have a well-defined secondary and tertiary
structure, while the acidic tail seems to be unstructured (Bianchi & Agresti, 2005).

INTRODUCTION
31
Each HMG-box domain contains approximately 75 amino acids and is composed of
three α-helices folded up into a typical wedge shape (Weir et al., 1993). This
characteristic L-shape architecture from the tripartite structure of the HMG-box forms
a concave surface that can delve into the minor groove of DNA with little or null
apparent sequence specificity.
Figure 1-13. Amino acid al ignment of human HMGB proteins. Residues contained in
HMG-boxes are highlighted in brownish and C-terminal acid tai l in purple. [*] Residues identical in al l sequences in the al ignment; [ : ] conserved substitutions;
and [ . ] semi-conserved substitutions. Al ignment created by UniProt [http://www.uniprot .org/al ign/] .
The HMG-box motif has been identified in more than 150 different proteins in a large
variety of organisms including human, bovine, rat, mouse, chicken, Drosophila,
Arabidopsis, Xenopus, Saccharomyces cerevisiae, Trypanosoma brucei (see section
1.7.2.1), among others (Baxevanis & Landsman, 1995). According to the evolutionary
and functional conservation, abundance, and DNA specificity, the HMG-box-containing
proteins are grouped into two families. The first one, the most abundant, has little or
no DNA sequence specificity and can present either a single motif such the Drosophila
proteins HMGD/Z and the S. cerevisiae proteins Nhp6A/B; two in tandem like the
human HMGB proteins and the mitochondrial transcription factor A (TFAM; Ngo, et al.,
2011); or more than two DNA binding domains like the Xenopus laevls transcription
factor xUBF with 5 tandemly repeated HMG-boxes (Bachvarov & Moss, 1991). The
second family of HMG-box-containing proteins is able to recognize and bind specific
DNA sequences and includes a few sequence-specific transcription factors such as the
sex-determining factor SRY and SOX proteins (Ohe, et al., 2002).

Chapter 1
32
The structures of the mammalian HMG-boxes A and B have previously been
determined individually by NMR structural studies (Figure 1-14) (Hardman, et al. 1995;
Weir et al., 1993). The conserved fold structure of the three α-helices in the HMG-box
forms an L-shape with an angle of approximately 80° between the long and the short
arms. Helix III and the extended N-terminal part create the long arm, while the short
arm is composed of helices I and II (Štros, 2010).
Figure 1-14. Domain structures of HMGB1 protein. Schematic representation of the HMGB proteins and the α-helices within the HMG-boxes A (orange; PDB ID: 1AAB) and B (blue; PDB ID: 1HME) as determined by NMR microscopy (Hardman, et al .
1995; Weir et al . , 1993) .
The tertiary structure of the HMGB1-3 proteins shows the conserved Cys23 located at
the centre of helix I and Cys45 at helix II, opposing each other and at a distance
capable to form a disulphide bond under appropriate oxidative conditions. HMGB4
lacks the Cys23 (Barreiro-Alonso et al., 2016).
NMR structures of the HMG-boxes of HMGD (Drosophila HMGB1-like protein), Nhp6A
(yeast HMGB1-like), the transcriptional activators SOX-2, SOX-4 and SOX-17, and the
human UBF HMG-boxes are also published in the PBD (Protein Data Bank). SOX-17
(Gao et al., 2013), the human mitochondrial transcription factor A box B (PDB ID: 3FGH;
Gangelhoff et al., 2009) and UBF HMG-box 5 (PDB IDL: 2HDZ; Rong et al., 2007) has
also been determined by X-ray crystallography.

INTRODUCTION
33
The homologous structures of the HMG-boxes A and B in mammalians differ slightly.
Box A presents a shorter and straighter helix I, has a longer length of the loop between
helices I and II, and more positive charge in the helices I and II as compared to box B
(see Figure 1-13 & Figure 1-14). This distribution of charged surface residues of box A
gives it significantly greater affinity for unusual or distorted DNA configurations such
as four-way junctions (Teo et al., 1995).
Significant age-dependent changes of HMGBs expression have been identified in many
organisms. In mice for example, HMGB1-3 proteins are expressed in early embryos, but
HMGB2 and HMGB3 are down regulated during embryogenesis (except for the HMGB2,
which remains highly expressed in lymphoid organs and testes). On the other hand,
HMGB1 is expressed during embryogenesis and continues in adult cells (Hock et al.,
2007).
The evolutionarily highly conserved HMGB proteins participate in divergent biological
tasks by means of two different roles: intracellular and extracellular. In the nuclear role,
they may act as architectural factors through the following mechanisms:
§ Acting as a DNA chaperon protein, binding the chromatin, altering the DNA
configuration while:
- Enhancing accessibility to transcriptional protein assemblies (Tang et al.,
2010; Bianchi & Agresti, 2005) on specific DNA targets (Figure 1-15a).
- Stabilizing a partner protein on its target and in some cases, augmenting
the affinity of other DNA binding proteins (Figure 1-15b; Hock et al., 2007),
e.g. the interactions with the TBP (TATA-binding protein)/TATA-box complex
affect the recruitment of other transcription factors (Štros, 2010).
§ Relaxing the structure of the nucleosome by inducing a shift between core
histones and remodeling the chromatin (Figure 1-15c)
§ Interacting with specific nuclear elements by protein-protein interactions,
and promoting the formation of complex nucleoprotein structures (Figure
1-15d)

Chapter 1
34
Figure 1-15. HMGBs intranuclear activity . (a) HMGB bends DNA and enhances the binding of specif ic transcription factors . (b) HMGB-TF1 complex binds and bends
DNA and HMGB-TF1-DNA may promote the binding with other TFs . (c) HMGB induces chromatin unfolding by displacing histone H1. (d) HMGB promotes formation of complex nucleoprotein structures . Nucleosome structures are
i l lustrated in grey cyl inders . TF1/TF2 are examples of transcription factors (green and purple) , NP1-3 are nuclear proteins (mint , aqua and pink) . H1 in red simulate a
histone.
In this way, the HMGB proteins are involved in numerous activities, including
transcription, recombination, replication, telomere maintenance and a series of
mechanisms of DNA repair (Barreiro-Alonso et al., 2016; Hock et al., 2007). Allosteric
transitions of DNA such as DNA bending, kinking and unwinding can be promoted by
binding of the HMG-boxes, causing greater distortions than AT-hooks (Bianchi &
Agresti, 2005). All HMGBs are able to bend the DNA from 60° to 110° by binding to
the minor groove in a number of different DNA structures. Besides supercoiled, single-
stranded DNA and B- and Z- forms, it binds preferentially DNA minicircles and other
non-canonical structures like four-way junctions, loops, hemicatenated DNA and
triplex (Tang et al., 2010). HMG-box B presents superior ability than box A to bend
linear DNA (Štros, 2010; Sánchez-Giraldo et al., 2015).

INTRODUCTION
35
Although HMGB boxes A and B can bind DNA individually, the binding affinity
improves when both domains remain attached. The major characteristic of the HMG-
box/DNA interaction is the DNA dramatic distortion and bending. The basis of this DNA
bending, demonstrated in published HMG-box/DNA structures (Sánchez-Giraldo et al.,
2015; Ngo et al., 2014; Stott et al., 2006), is the intercalation of bulky hydrophobic
amino acid residues of the HMG-box between consecutive base pairs within the minor
groove of the DNA, complemented with a partial unwinding of the minor groove and
bending towards the major groove. The box B first intercalated residue Phe102 is
located in the helix I and the second intercalated amino acid Ile121 in the helix II;
both flanked by conserved basic residues that bind to the phosphodiester bond of DNA
and stabilize the complex. Box A only contains one intercalating residue, Phe37, in the
helix II (Štros, 2010).
The structure of HMGB1 protein with both HMG-box domains in complex with DNA
has not been solved so far. Yet, the crystal structure of the HMG box A binding a
previously distorted DNA (distortion caused by the drug cisplatin) has been determined,
producing a bend of 60° on the DNA (Ohndorf et al., 1999).
Moreover, structures of the human mitochondrial transcription factor TFAM in complex
with different DNA sequences have been solved (Ngo et al., 2014; Ngo et al., 2011;
Rubio-Cosials et al., 2011). Although TFAM differs in amino acid sequence from
HMGB1 protein, it also has two tandem HMG-box domains (A and B). Crystal
structures show two sharp ~90° kinks, each caused by one HMG-box, generating an
overall U-turn of ~180° (Figure 1-16a).
Recently, the crystal structure of the HMG-box A bound to a linear AT-rich DNA has
been solved by a member of the MACROM research group (Sánchez-Giraldo et al.,
2015). The 2 Å resolution structure comprises in the asymmetric unit two
oligonucleotides d[ATATCGATAT]2: one unbound straight DNA duplex and one bent
DNA duplex bound by two boxes A acting together. These two domains enclose,
unwind and bend the DNA by approximately 85° (Figure 1-16b).

Chapter 1
36
Figure 1-16. Crystal structures of HMG-box bound to DNA. (a) The domain structure of mature TFAM in complex with a mitochondrial DNA fragment. HMG-box motifs , shown in blue and green, are forming a complex with the 28 base pair DNA (grey) , and bending the DNA into a U-turn (Ngo et al . , 2011; PDB ID: 3TMM). (b) The two near-symmetric box A domains (purple and cyan) of HMGB1 protein col laborate to
bend the AT-r ich DNA decamer (orange) (Sánchez-Giraldo et al . , 2015; PDB ID: 1CKT) . DNA sequences are given below each structure.
HMGB proteins are extensively modified after translation. Post-translational
modifications such as phosphorylation of HMGB1 are required for proper folding and
stability, as well as to influence the transcription factor activity and acquire DNA-
binding affinity. Besides, acetylation within the HMG-boxes is crucial for DNA binding
and histone interaction. Several studies have shown that phosphorylation, acetylation
and methylation modifications of the HMGB1 are involved in nucleo-cytoplasmic
translocation and subcellular localization. Besides, the acetylation of certain lysine
residues prevents a re-entry to the nucleus and participates in extracellular secretion
(Erlandsson Harris & Andersson, 2004; Štros, 2010). The regulation of the HMGB1
translocation, release, and activity in diseases are also triggered by redox modifications
(Kang et al., 2013).
After these post-translational modifications, some members of the HMGB family can
be transported from the nucleus to the cell surface membranes, cytosol and
mitochondria, and be released into the extracellular space. HMGB1 and HMGB2 shuttle
frequently form the nucleus to the cytoplasm by passive diffusion across the nuclear

INTRODUCTION
37
pores due to their relative small size, or by active transport mechanisms including
direct binding to β–related nuclear transport receptors (Štros, 2010).
The levels of expression in nuclei and cytoplasm correlate with the organism’s tissue
and with the differentiation stage of cells (Erlandsson Harris & Andersson, 2004). High
levels of HMGB proteins are found in undifferentiated cells as well as in the cytoplasm
of most tumor cells.
HMGB1, the most studied member of the HMGB family, develops numerous biological
functions inside as well as outside the cell. It also plays pathological effects in
inflammatory diseases including sepsis and arthritis, in several cancers (Lotze & Tracey,
2005), and in human epilepsy (Maroso et al., 2010).
In the extracellular role, HMGB1 (and possibly HMGB2) acts as a signaling molecule
during inflammation, cell differentiation, cell migration, tissue degeneration,
metastasis and apoptosis (Banerjee et al., 2011). HMGB1 is released to the cytoplasm
from necrotic, inflammatory or apoptotic cells. It is then secreted to the extracellular
medium by macrophages, natural killer cells and dendritic cells alone, interacting with
diverse proteins including the receptor for advanced glycation end-products (RAGE),
TLR-2/4, CD24 and others DAMP (Damage-associated molecular patterns) receptors, or
forming heterocomplexes with other immune coactivators (Kang et al., 2013; Barreiro-
Alonso et al., 2016; Tang et al., 2010).
Alterations in HMGB1 location, abundance, and levels are associated with the principal
cancer hallmarks and linked to poor prognosis in several tumors. The released HMGB1
indicates tumor cell stress or death and a warning of danger over the cells in the
microenvironment. In cancer cells, this alert contributes to tumor cell survival by
inhibition of apoptosis and the development of metastasis (Tang et al., 2010). Also,
HMGB1 can act as pro-apoptotic protein by activating the apoptotic response to
genotoxic stress caused by anticancer drugs (Štros, 2010). However, the role of HMGB1
in many types of cancer such as colon, prostate, breast, gastric, and other tumors is
clearly related to both nuclear and extracellular performing of the protein (Hock et al.,
2007; Tang et al., 2010; Barreiro-Alonso et al., 2016; Štros, 2010).

Chapter 1
38
1 .6 DNA-Drug Interactions
The distinctive structural features characteristic of DNA such as the regular helical
grooves and the arrays of hydrogen bond donors and acceptors specific to each
individual base pair (Figure 1-3), set it as an interesting target for drug design where
small molecule ligands can recognize specific sequences and/or structures, and
produce a predetermined biochemical response (Wemmer & Dervan, 1997).
Small molecules that bind to DNA generally alter the normal transcription and
replication dynamics of the cell. Thus, the design of drugs targeting DNA has become
an attractive strategy to obtain novel potent molecules for modulating gene expression
(Fitzgerald & Anderson, 1999; Waring et al., 2005). For this reason, in the last few
decades, remarkable effort has been devoted to studying DNA-drugs interactions and
describing mechanisms by how small molecules promote these changes in the cell.
Hence, DNA is the molecular presumed target for diseases treatment of many clinical
anticancer, antibacterial, antiviral and antiparasitic agents due to the inhibition of a
series of downstream biological processes including not only transcription and
replication but also cell cycle arrest and DNA repair mechanisms, leading eventually to
cell death (Sheng et al., 2013).
However, modern drug discovery is complex and requires integrated understanding of
the biological, biochemical and structural properties of the target, the ligand, the
binding site and the complex. In this way, advances in structural biology (nucleic acid
crystallography and NMR) are required to provide detailed 3D information of the drug
target and the interactions between the target and the small molecule ligand, offering
models to rationally design DNA-binging molecules. Subsequently, optimized
compounds with better properties can be developed (Gurova, 2009; Bailly, 2003).
1 .6.1 Types of DNA-Binding Drugs
By understanding the different chemical and structural modes of interaction between
small molecules and DNA, it is possible to predict the potential biological

INTRODUCTION
39
consequences of such interactions in the cell, and consequently in the organism to be
treated. DNA-binding agents can be classified into three groups according to the
general type of binding: intercalators, groove binders (minor or major) and covalent
binders (Gurova, 2009). DNA intercalators may present covalent or non-covalent mode
of DNA binding.
Small molecules forming covalent bonds with DNA can produce direct damage on the
double strand by forming various types of DNA crosslinks capable of altering DNA
conformation and stopping interactions with related proteins, thereby blocking
biological processes such as replication or transcription (Wang et al., 2016; Hofr et al.,
2001). This category includes many chemotherapeutic anticancer agents like various
platinum-containing compounds (Sheng at al. 2013), such as cisplatin or cis-
diamminedichloroplatinum (II), the most widely used and effective anticancer drug.
However, because cisplatin acts on both cancer and normal cells, it is associated to
substantial side effects (Dasari & Tchounwou, 2014). Cisplatin produces a direct and
rigid kink into the major groove of DNA, which promotes recognition by HMG domain
proteins (Hofr et al., 2001). In addition to Pt-containing compounds, other small
molecules have been discovered to covalently bind DNA duplex, including nitrogen
mustard drugs, mitomycin C and psoralen, which are used as anticancer drugs due to
their high cytotoxic activity, mainly caused by the non-specific DNA cross-linking
(Sheng et al., 2013).
Non-covalent DNA-drug interactions are generally stabilized by a combination of
hydrogen bonds and other electrostatic interactions such as van der Waals forces.
These bonds may change the conformation of DNA and/or cause indirect DNA damage
by altering the normal activity of the DNA-binding enzymes. In any case, non-covalent
binding is a reversible process beneficial for applications that require a controlled
binding such as in gene regulation (Almaqwashi et al., 2016). There are two main
modes of non-covalent DNA interactions:
§ DNA–intercalator: a planar aromatic moiety is non-covalently inserted between
adjacent DNA base pairs. Intercalation preferentially occurs at GC-rich

Chapter 1
40
sequences (Paul & Bhattacharya, 2012) and is usually stabilized by the
formation of strong stacking bonds between the aromatic chromophores of the
ligand and the nucleobase (Berman & Young, 1981). Typical examples are
ethidium bromide; the antimalarial drug quinacrine; and the natural antitumour
and antiviral compound variolin B (Canals et al., 2017).
§ DNA- groove binder: small molecules interacting with both the major or minor
groove of double-stranded DNA by H-bonds between their functional groups
and the adjacent base pairs. Due to the grooves’ dimensional difference (see
section 1.2.2), targeting them requires enormous dissimilar sized and shaped
molecules. Major groove binders are necessarily much larger molecules. Thereby,
it is the binding site of most of the DNA-interacting proteins. Added to this,
there are also various carbohydrate compounds including neocarzinostatin,
nogalamycin, and neomycin that interact with the major groove due to their
size and distribution of hydrophobic and hydrophilic moieties (Sheng et al.,
2013). Natural compounds such as pluramycins, aflatoxins, azinomycins and
leinamycin also bind the DNA major groove, although they target DNA primarily
by intercalation between DNA base pairs (Hamilton & Arya, 2012). Specific
DNA-drug interactions through the major groove can alter recognition and
binding of proteins with DNA. On the other hand, an extensive variety of small
molecules can bind within the minor groove of DNA, preferentially at AT-rich
regions (Wemmer & Dervan, 1997). Netropsin, Hoescht 33258, diminacyn,
pentamidine and DAPI are typical examples of minor groove binding drugs
(MGBD).
1.6.1.1 MinorGrooveBindingDrugs(MGBD)
Specific recognition of DNA sequences by small organic molecules is important not
only for the targeting of specific genes in a genome, but also for chemotherapeutic
purposes as antibacterial, antiprotozoal, antiviral and antitumor agents (Bailly, 2003;
Sheng et al., 2013). A large variety of such compounds have been developed,
emphasizing the study of compounds that bind the minor groove of the DNA.

INTRODUCTION
41
The molecular recognition elements of the minor groove binders are the electrostatic
interactions with the negative potential in the groove, specific hydrogen bonds of
functional groups in the ligand (donor) with the atoms of the nucleobases (acceptor),
and van der Waals contacts and other hydrophobic interactions within the minor
groove (Rentzeperis et al., 1995). MGBD display a degree of sequence specificity,
preferentially to high AT-content sequences due to the higher electrostatic potential in
AT-rich grooves than CG-rich grooves, and the formation of greater van der Waals
interactions by small molecules with the narrower, deeper and easy to fit minor groove
at AT sites (Tidwell & Boykin, 2003).
Figure 1-17. Diverse structures of minor groove binding drugs.
Although neutral, mono- or multi-charged ligands have been found, the
electronegativity of the DNA minor groove makes it more appropriate target for
cationic molecules. In addition, MGBD share several structural features to fit and
follow the narrow groove, including aromatic rings and relative flexibility to let it form
an overall curvature that matches with the DNA twist (Wemmer & Dervan, 1997).
Therefore, minor groove binders are commonly polyamides and heterocyclic dications
like pentamidine, Hoechst 33258 and DAPI (Figure 1-17).
Chapter 1
42
A series of structural studies of small molecules in complex with various
oligonucleotide duplexes containing stretches of AT base pairs via minor groove have
been reported. Examples of these studies determined by X-ray crystallography include
Hoechst 33258 in complex with DNA d[CGCGAATTCGCG]2 (Pjura et al., 1987; PDB ID:
8BNA); the complex between netropsin and the DNA dodecamer d[CGCGATATCGCG]2
(Coll et al., 1989; PDB ID: 1VTJ); the complex with d[GTATATAC]2 and distamycin A
(Mitra et al., 1999; PDB ID: 378D); among others.
The special interest of the MACROM research group for a better understanding of
DNA-drug interactions through the minor groove of AT-rich oligonucleotides has also
rendered two crystal structures at atomic resolution of DNA-MGBD complexes. First, a
new mode of interaction of the drug pentamidine with the DNA duplex
d[ATATATATAT]2 was demonstrated (Figure 1-18a) containing a mixed structure
Watson-Crick and Hoogsteen base pairs and interacting with neighboring molecules in
the crystal to stabilize the coiled-coil structure of the stacked duplexes (Moreno et al.,
2010). Lately, the crystal structure of the complex of the DNA duplex d[AAAATTTT]2
with the dicationic drug 4,4’-bis(imidazolinylamino)diphenylamine (CD27) has been
presented (Figure 1-18b; Acosta-Reyes et al., 2014). The CD27 molecules cover
completely the minor groove of the oligonucleotide and act as a cross-linking agent by
the interaction with neighboring molecules.
The amenability of the minor groove to bind with drugs is not only related to the
narrowness and more attractive dimensions of the groove for small molecules, but also
minor-groove binding generally involves greater binding affinity and higher sequence
specificity than intercalator or major-groove binding (Paul & Bhattacharya, 2012).
Hence, MGBD are extensively studied and are considered great promises for treating
diseases at the DNA level.
There are only a few minor groove binders approved for treatment due to the initial
significant toxicities they presented. Nevertheless, there has been renewed interest in
MGBD over the past years through the development of new improved compounds (Cai
et al., 2009). The major contributions of minor groove binders have been in the

INTRODUCTION
43
discovery and development of anticancer agents. Nevertheless, they have demonstrated
a wide range of applications such as antiviral, antiparasitic, antifungal and
antibacterial. This research work has focused on MGBD as antiprotozoal agents.
Figure 1-18. Crystal structures of MGBD with al l-AT DNA. (a) Asymmetric unit of the crystal containing pentamidine-d[ATATATATAT]2 complex. The drug interacts
through the minor groove at the centre of the sequence. (Moreno et al . , 2010; PDB ID: 3EY0) . (b) The different crystal lographic units of the CD27-d[AAAATTTT]2
complex . The black lozenge indicates one of the dyad axes (Acosta-Reyes et al . , 2014; PDB ID: 4OCD).
1 .6.2 Structure-Based DNA-Targeting Strategies for
Drug Discovery
Nucleic acids have usually been less attractive as drug targets in structure-based drug
design as compared with proteins. This is mainly due to the limited structural
information existing on nucleic acids complexed with potential drugs (Sheng et al.,
2013). However, over the past years, a number of structures of diverse complexities
have been determined and more than 300 structures with small molecules binding
nucleic acids have been deposited in the Protein Data Bank (PDB; www.rcsb.org) since
2004.
DNA is the primary molecular target of some clinical drugs, including anticancer and
antiprotozoal agents (Cai et al., 2009). For rational development of novel small

Chapter 1
44
molecules targeting DNA, scientists have developed different strategies including
virtual screening, molecular modeling, and structure-based drug design (Sheng et al.,
2013). These techniques depend mainly on the availability of the DNA-drug complex
3D structure, especially the high-resolution crystal structure. By extracting the key
features from this structural information it is possible to define the optimum geometry
and distance for binding site recognition, or to identify the right position of the
functional groups in the ligand for better interaction. Moreover, structure-based
approaches are also applied to integrate properties into compounds to create
alternative molecules less likely to show resistance mechanisms (Hol, 2015).
Due to the high toxicity and side effects that unspecific DNA-targeted therapies have
faced during the past decade, new approaches are being investigated for individualized
therapies that target specific genes and/or displace key proteins interacting with DNA
in determined regions of the genome causing pathogenic effects. These approaches
have progressed immensely thanks to the advances in nucleic acid chemistry,
molecular biology and structural biology.
In the complex process of drug discovery, the challenge is to identify the right DNA
ligand for a given pharmacological action. That is, a balance of affinity, selectivity,
specificity, effectiveness and minimum side effects. Selective targeting of a specific
sequence is a major challenge when designing nucleic acid ligands. Models to enhance
specificity of DNA binding agents have been developed and thereby, the design of
compounds that can minimize the off-target effects by the recognition of particular
regions, specific genes or certain configurations of DNA has allowed new therapeutics
and gene-specific probes (Paul et al., 2015).
Currently available structural information has enriched enormously the understanding
and knowledge of the molecular binding mechanisms, specific DNA-ligand interactions,
particular configurational changes, and topological deformations of DNA caused by
binding with small molecules (Smith & Buchmueller, 2011). Nevertheless, more
research and information on DNA-drug interactions is needed to help rationalized drug
design.

INTRODUCTION
45
1 .6.3 DNA-Binders Targeting Parasit ic Diseases
Infectious diseases caused by protozoan pathogens represent a global health, social
and economic problem which rank among the top leading causes of mortality, resulting
in more than one million deaths world-wide every year and threaten the health of
millions more (Andrews, et al., 2014; WHO, 2015). This enormous burden has been
aggravated by the lack of preventive chemotherapy and suitable treatments for many
of the diseases these parasites cause, added to the already existing challenge of
controlling the growing threat of drug resistance. In addition, the low economic status
of the majority of people living in the endemic countries aggravates the situation,
making the pharmaceutical market for the development of new drugs financially
unattractive to the private-research sector (Ndjonka, 2013).
Discovering and developing safe and affordable treatments to respond the neglected
tropical diseases is an urgent need. Notable progress in the development of new
antiparasitic drugs has been made in the last two decades using rational drug design
including new targets or the use of natural sources (Ndjonka, 2013; Scott et al., 2016).
Furthermore, many efforts have been devoted on creating chemotherapeutic
treatments targeting parasitic DNA as a safe, selective, and effective antiparasitic
strategy.
The DNA of protozoan organisms differs tremendously between species. However,
common trends such as a high AT content are observed in species such as P. falciparum,
(80% overall at content) (Carlton et al., 2002) or Trypanosoma brucei [about 73% AT
content in its mitochondrial DNA (mtDNA)]. Due to these AT rich genomes, parasites’
DNA appears as a suitable target for minor groove binders, particularly for aromatic
diamidines (Barrett et al., 2013).
Minor groove binding drugs (MGBD) have been extensively used as antiprotozoal
agents to fight diseases like American trypanosomiasis (Chagas disease) caused by
Trypanosoma cruzi; human African trypanosomiasis (HAT or sleeping sickness) caused
by two subspecies of Trypanosoma brucei; malaria, caused by Plasmodium falciparum;

Chapter 1
46
leishmaniasis caused by several species of Leishmania; and trichomoniasis caused by
Trichomonas vaginalis (Montalvo-Quirós et al., 2015; Soeiro et al., 2013; Scott et al.,
2016; Wilson et al., 2008; Acosta-Reyes et al., 2014).
Although widely studied, the precise mechanisms by which the minor groove binders
act in protozoa remains unclear and seems to differ between different species (Scott et
al., 2016). Still, high intracellular concentrations of dicationic drugs such as
pentamidine, have been found in treated trypanosome and plasmodia cells. It was
demonstrated that these compounds bind preferentially to AT-rich regions through the
minor groove of DNA (see section 1.6.1.1). Then, the specific parasitic DNA-drug
binding has been suggested as a potential mode of action of MGBD. This interaction
would trigger a particular trypanocidal or trypanostatic activity (Barrett et al., 2013).
Well-studied antiprotozoal compounds like pentamidine, diminazene, furamidine,
berenil and others are MDBG have been used for years against Plasmodium spp.,
Leishmania spp., Trypanosoma spp., Toxoplasma gondii, Trichomonas vaginalis,
Acanthamoeba spp., Balamuthia mandrillaris, Babesia microti, Cryptosporidium parvum
and Crithidia fasciculata (Soeiro et al., 2013). Nevertheless, new antiprotozoal drugs
are urgently required due to the appearance of drug resistant parasite strains. The high
toxicity and significant side effects of current drugs, added to the complexity of
treatment regimens (e.g. lack of oral bioavailability), the high cost, or the lack of
supply are some of the main drawbacks that available antiparasitic treatments face.
The search for efficient novel antiparasitic agents has led to the design and synthesis
of small molecules that strongly bind to the minor groove of DNA, such as the
diamidines (Soeiro et al., 2013; Scott et al., 2016). Among them, bis(2-
aminoimidazoline) compounds are considered promising due to the DNA sequence
specificity to AT-rich sites and their in vitro and in vivo antimalarial and
antitrypanosomal activity (Rodríguez et al., 2008; Nieto Garrido et al., 2011; Ríos
Martínez et al., 2014).

INTRODUCTION
47
1 .7 Human African Trypanosomiasis
Also known as sleeping sickness, human African trypanosomiasis (HAT) is a neglected
tropical disease caused by infection with protozoan parasites belonging to the species
Trypanosoma brucei. There are two forms of the disease in humans: the subspecies
Trypanosoma brucei gambiense is found in West and Central Africa and causes the
chronic form of HAT (98% of reported cases; WHO, 2017), whereas the less common
form is an acute, rapidly progressive and mortal disease caused by Trypanosma brucei
rhodesiense and is spread through East and South Africa (Figure 1-19). Both forms of
HAT are transmitted to human by the tsetse fly vector (Franco et al., 2014).
Approximately 55 million people distributed over a surface of 340,000 km2 in 33 sub-
Saharan African countries are estimated to be at different levels of risk of contracting
sleeping sickness (WHO, 2016). Most of the affected populations live in remote rural
areas with limited access to health services, which complicates the diagnosis and
treatment of cases in Africa’s poorest countries.
Figure 1-19. Distr ibution of human African trypanosomiasis worldwide in 2015. Number of reported cases caused by (a) Trypanosoma brucei gambiense and (b)
Trypanosoma brucei rhodesiense . Data source: World Health Organization.
Chapter 1
48
The epidemiology of the disease is mediated by a painful bite of an infected blood-
feeding tsetse fly (genus Glossina) to humans, where metacyclic trypomastigotes
present in the salivary fluid of the fly produce a primary lesion in the skin of the
human host, called “trypanosomal chancre” that appears from 5 to 15 days after the
bite (Nagle et al., 2014). Then, the clinical progression of sleeping sickness depends on
the type of trypanosome infection. The incubation period for Rhodesian sleeping
sickness is two to three weeks, and if left untreated, death generally occurs within a
year. Gambian sleeping sickness (gambiense HAT) has an incubation period of several
days to some weeks (Markell et al., 2006). During the incubation period, the parasites
proliferate and spread to the blood where they start to disseminate throughout the
body.
In general, HAT clinically evolves in two stages. Initially, in the first or early
hemolymphatic stage, the parasites dwell in the lymphatic system and bloodstream. At
this point, patients experience nonspecific symptoms of intermittent fevers, malaise,
arthralgias, and headaches (Franco et al., 2014). Besides the common symptoms,
lymphadenopathy, the swelling of lymph nodes (especially in the posterior cervical
nodes along the back of the neck) is exclusive and main sign of gambiense HAT and is
termed Winterbottom’s sign (Nagle et al., 2014; Markell et al., 2006).
The second stage of the disease begins when parasites penetrate the Central Nervous
System (CNS), crossing the blood-brain barrier (BBB) from capillary vasculature in the
brain. In rhodesiense HAT, this occurs a few weeks after infection, while in gambiense
HAT, it can take several months or even years before evolving into a late period of the
disease. In the late (meningoencephalitic) stage, symptoms include psychiatric, motor,
and sensory disturbances, severe headaches, personality changes, apathy, and, for
approximately three-quarters of patients, profound disorder of the sleep patterns
which includes nocturnal insomnia and daytime somnolence, symptoms from which
the disease name arises: sleeping sickness. Without treatment, patients eventually
progress to a deepening coma and death (Lamb, 2012; Barrett et al., 2003).

INTRODUCTION
49
1 .7.1 Trypanosoma brucei
Trypanosoma brucei is a species of parasitic kinetoplastid belonging to the genus
Trypanosoma and the class Kinetoplastida. There are three morphologically
indistinguishable subspecies of Trypanosoma brucei: T. b. gambiense, T. b. rhodesiense,
and T. b. brucei. In humans, T. brucei causes human African trypanosomiasis (sleeping
sickness) and in cattle, horses, lions, antelopes, buffaloes, and others, it causes animal
trypanosomiasis (nagana).
Cell Structure
T. brucei is a eukaryotic unicellular organism. Besides the typical eukaryotic organelles,
i.e. nucleus, mitochondrion, endoplasmic reticulum, Golgi apparatus, lysosomes, and
cell membrane, it has an unusual organelle called the kinetoplast composed of a mass
of catenated DNA (kDNA) (Figure 1-20). Kinetoplast is localed within a specialized
region of the mitochondrion, a single elongated organelle that extends from the
posterior to the anterior end of the cell (Matthews, 2005).
The trypanosome cell is asymmetric in shape, approximately 10 to 20 µm long, with
clearly dissimilar anterior and posterior ends (Figure 1-20). It has a long slender shape
with a single flagellum surrounded by its own membrane, which origins from the basal
body near the posterior end of the cell. The flagellum exits the cytoplasm from a small
invagination of the plasma membrane called flagellar pocket. This specialized
compartment also participates in many cellular processes (Ralston & Hill, 2008; Field &
Carrington, 2009). The flagellum is attached to the cell body along most of its length,
holding together a thin layer known as flagellum attachment zone (a network of
cytoskeletal and membranous connections) and drawing a left-handed helical path
from posterior to anterior (Ralston & Hill, 2008). The movement of the cell body is
strongly linked to flagellar wave propagation, giving the appearance of an “undulating
membrane” (Hill, 2003).
The cell membrane, called pellicle, consists of phospholipids, proteins, cholesterol, and
glycolipids. In the bloodstream, a dense coat of variable surface glycoproteins (VSG)

Chapter 1
50
covers the trypanosome surface to protect it from the mammalian immune response
(Franco et al., 2014).
F igure 1-20. Trypanosome cel l architecture. A s implif ied schematic representation of the location of the major organelles of the trypanosome cel l . Adapted from
Matthews, 2005.
The characteristic cell body shape is defined by a stable and highly cross-linked
subpellicular microtubule cytoskeleton, beneath the cell membrane. The single-copy
organelles (flagellar pocket, flagellum, kinetoplast, mitochondrion and nucleus) are
positioned specifically within the cytoskeletal corset and are concentrated between the
center and the posterior end of the cell (Figure 1-20; Matthews, 2005).
The kinetoplast and basal body are physically connected via a high-order
transmembrane structure termed tripartite attachment complex (TAC) that must cross
both the cell and the mitochondrial membranes (Figure 1-24). TAC includes a series of
filaments providing guide ropes through which mitochondrial genome segregation is
linked to replication and division of the basal body and flagellum (Ogbadoyi et al.,
2003)
Life Cycle
The organization of cell structure is fundamental to the trypanosome throughout its
life cycle. Trypanosomes pass through five distinct forms: metacyclic trypanosomes,

INTRODUCTION
51
long slender bloodstream form, short stumpy bloodstream form, procyclic
trypomastigotes and epimastigotes (Figure 1-21). The trypomastigote is the only form
to be observed in the mammalian host, whereas the epimastigote form occurs during
the development phase in the tsetse fly. The metacyclic form is the only stage that is
infective to vertebrates.
Trypanosomes undergo dramatic morphological and biochemical adaptions over their
life cycle. Life-cycle stages alternates between bloodstream-form and insect-form to
adapt and survive in the mammalian host and the insect vector, respectively (Ralston &
Hill, 2008). They proliferate in the midgut of the fly as a procyclic trypomastigote form.
After migration to the salivary glands, they progress into proliferative epimastigote
forms and then to the non-proliferative metacyclic form that are ready for
transmission to the next mammalian host (Akiyoshi & Gull, 2013).
Figure 1-21. A general ized l i fe cycle of Trypanosoma brucei . CNS: central nervous system. Adapted from Langousis & Hil l , 2014.
Infection of the mammalian host starts when the bite of an infected tsetse fly
introduces the metacyclic trypomastigote into skin tissue. The trypanosomes first
multiply locally at the site of the bite before invading the lymphatic system, the blood
stream, and later, other tissues and organs including the central nervous system (CNS;

Chapter 1
52
Kennedy, 2004). Two different trypomastigote forms can be observed in the
mammalian host: a long, slender proliferative (actively-dividing) form and a short,
stumpy non-dividing form. Both trypomastigote forms can infect tsetse flies, but only
the latter is able to develop into the proliferative procyclic trypomastigote form,
completing the life cycle (Chappuis, 2005).
Cell Cycle
Like other eukaryotic organisms, the cell cycle of trypanosomes consists of distinct G1,
S, G2 and M phases (Hammarton, 2007). The presence of single-copy organelles and
the detailed morphology of the trypanosomes cells require a highly ordered process of
organelle duplication and segregation at cell division (Woodward & Gull, 1990).
F igure 1-22. Cel l cycle regulation in Trypanosoma brucei . Duplication of the major organelles and structures during the cel l cycle is i l lustrated, indicating the stages G1, S phase, G2 and M (mitosis) . Kinetoplast (K) is shown in red ovals and nucleus
(N) in blue sphere.
During the first gap phase G1 in procyclic form T. brucei, the cell prepares for entry
into a new round of replication and cell division. The earliest detectable cytological
events during this stage are the basal body and flagellum duplication: the probasal
body (lying adjacent to the flagellar basal body) matures, daughter flagellum
outgrowth starts, and new probasal bodies for each mature basal body are formed

INTRODUCTION
53
(Figure 1-22; Gluenz et al., 2011). Duplication of the Golgi apparatus commences just
after basal body duplication (Hammarton, 2007).
S phase separates two gap phases, G1 and G2, which are followed by mitosis (M phase).
DNA is replicated during S phase. However, as mentioned before, trypanosomes have
two DNA-containing organelles: a nuclear genome and an unusual mitochondrial
genome that constitutes the kinetoplast (both of which must be replicated and
segregated coordinated) (Gluenz et al., 2011). Kinetoplast S phase is much shorter than
nuclear S phase and begins just prior to nuclear S phase (Woodward & Gull, 1990).
The segregation of the two genomes takes place in a specific chronological order. Early
in G2 phase, the replicated kinetoplast segregates, followed by nuclear mitosis and
finally cytokinesis (Figure 1-22), resulting in the formation of two daughter cells that
contain one kinetoplast and one nucleus. It has been suggested that entry to
cytokinesis may be more dependent on kinetoplast division and segregation than on
mitosis (Hammarton et al., 2003). However, it remains unknown how these temporal
orders are established and regulated. Strictly controlled regulation of DNA replication,
and kinetoplast and chromosome segregation is essential for maintenance of genome
stability.
1 .7.2 The Kinetoplast
The mitochondrial DNA of Trypanosoma brucei is organized in a unique and complex
structure called kinetoplast. The kinetoplast constitutes about the 5% of the
trypanosome’s DNA and consists of an interlocked network of tens maxicircles (23 kb
each) and several thousand minicircles (1 kb each). These circles are intercatenated
into a single huge planar disk-shaped network that resides within a specialized region
of the mitochondrial matrix near the flagellar basal body (Roy Chowdhury, 2010)
(Figure 1-23).
Maxicircles encode ribosomal RNAs and a few proteins involved in energy transduction,
such as subunits of NADH dehydrogenase, cytochrome oxidase complexes I, II and III,
cytochrome b and A6 subunit of the F1F0-ATPase (Shapiro & Englund, 1995). Most of

Chapter 1
54
the maxicircle precursor mRNAs (pre-mRNAs) would need to be modified post-
transcriptionally by a process called RNA editing in order to produce complete open
reading frames. Minicircles encode small guide RNAs (gRNAs), templates for editing of
maxicircle transcripts, which decode the encrypted information, specifying the site and
number of uridine residues added or deleted during the RNA editing (Klingbeil &
Englund, 2004; Szempruch et al, 2005). While maxicircles are homogeneous in
sequence, minicircles are highly heterogeneous and different minicircles are required
for editing different maxicircle transcripts (Beck et al., 2013). Therefore, both
minicircles and maxicircles are essential for mitochondrial physiology.
Figure 1-23. Kinetoplast DNA network structure. (a) E lectron micrograph of the periphery of an isolated kDNA network. Loops represent interlocked minicircles
(arrowhead indicates a clear example) . Scale bar 500 nm. (b) Schematic representation of the minicircles ’ organization. 1 . Segment of an isolated network showing interlocked minicircles in a planar array. 2 . Section through a condensed
network disk-shaped in vivo showing stretched-out minicircles . The double-headed arrow indicates the thickness of the disk , which is about half the perimeter of a
minicircle . Adapted from Lukes et al . , 2002.
The replication of the kinetoplast occurs simultaneously to the duplication of the
adjacent flagellum and just prior to the nuclear DNA replication. It is catalyzed by an
enzymatic machinery located at defined sites flanking the kDNA disk (antipodal sites)
(Figure 1-24) and consisting of at least six DNA polymerases, six helicases, two

INTRODUCTION
55
primasas, two ligases (Bruhn et al. 2011, Beck et al., 2013) and two topoisomerases: a
topoisomerase II (Wang & Englund, 2001) and a topoisomerase 1A (Scocca & Shapiro,
2008).
Covalent closed minicircles are released from the network by a topoisomerase II before
replication, so that they could be copied as free circular molecules (Szempruch et al,
2005). The free detached minicircles replicate first as theta-structures. Then, the
progeny minicircles, which contain nicks or gaps, are reattached to the network
periphery (Figure 1-24). Maxicircles also replicate as theta-structures, but they remain
linked to the network. However, exact mechanisms for maxicircle replication have yet
to be determined in the same detail as minicircles’. When the network has doubled the
size, the minicircles mismatches are repaired, and networks are segregated into two
daughter kinetoplasts.
Figure 1-24. The kDNA repl ication model of Trypanosoma brucei showing the location of repl ication proteins and minicircle repl ication intermediates . Pol , DNA
polymerase; PAK, prol ine, alanine and lysine-r ich; Topo, topoisomerase; SSE1, structure-specif ic endonuclease 1; UMSBP, universal minicircle sequence-binding
protein. Adapted from Englund et al . , 2005.
Minicircles make up over 90% of the mass of the network (Shapiro & Englund, 1995). T.
brucei contains approximately 300 different minicircle sequences in different number
of copies, as many maxicircle transcripts are extensively edited (Feagin, 2000). Besides
this extensive sequence heterogeneity, apart from the coding region, minicircles have a

Chapter 1
56
conserved region containing the origin of replication, which is virtually identical in all
minicircles of the network (Ray, 1989). They also have a single region of bent helix,
composed of short A-tracts (4 to 6 residues each) spaced in phase about every 10 base
pairs (Shapiro & Englund, 1995). The flexibility of A-tracts (see section 1.3) results in a
substantial curvature of the DNA double helix. Moreover, T. brucei minicircles include
up to 73% of AT-content.
ATP production (through oxidative phosphorylation) is the most well-known function
of mitochondria. Nevertheless, it has key roles in many other metabolic and cellular
processes. The vast majority of mitochondrial proteins are encoded on nuclear genes
and need to be imported from the cytosol and sorted to the mitochondrial outer
membrane (OM), inner membrane (IM), intermembrane space (IMS) or matrix (Jensen
et al, 2008). Mitochondrial enzymes, but also metabolites and other small molecules
import, depend upon a membrane potential (ΔΨ) across the IM. To generate ΔΨ, T.
brucei procyclic form uses the proton-pumping electron transport chain and
bloodstream form uses the ATP synthase to hydrolyze ATP and thus pumping protons
from the matrix to the IMS (Figure 1-25).
The partial loss (dyskinetoplastidy, Dk) or complete loss (akinetoplastidy, Ak) of
kinetoplast means that mitochondria cannot fully function due to a deficiency in
maxicircles (Jensen et al., 2008). They can propagate only as bloodstream form. The
tsetse fly is therefore eliminated from the life cycle and transmission between
individual hosts becomes via mechanical or sexual means, allowing the parasite to
spread outside the African tsetse belt (Lai et al., 2008). It was found that kDNA-
deficient T. brucei and several strains of T. equiperdum (dyskinetoplastid) and T. evansi
(akinetoplastid) need a mutation in the nuclear gene encoding the γ-subunit of the F1
portion of the F1F0-ATPase to survive the loss of their kinetoplast (Eze et al., 2016; Lai
et al, 2008). The loss of proton-pumping membrane component (Fo) of the ATP
synthase in the Dk and/or Ak trypanosomes leads to a release of the soluble,
catalytically active domain of the synthase (F1) into the matrix. ATP hydrolysis by F1
produces ADP, and the exchange of the ADP-3 for cytosolic ATP-4 via IM ADP-ATP

INTRODUCTION
57
carrier, re-establishes the mitochondrial membrane potential (ΔΨ) (Figure 1-25;
Jensen et al, 2008).
Pentamidine, diminazene and other trypanocidal diamidine-type compounds have been
shown to collapse the mitochondrial membrane potential, but the mechanism through
which these drugs exert their activity is still not entirely known (Lanteri et al., 2008).
However, and just as MGBD (see section 1.6.1.1), they are expected to interact with
parasitic DNA, both nuclear and kinetoplastid; nevertheless the rapid accumulation of
these drugs within the mitochondrion of treated trypanosomes suggests the kDNA as
the potential cellular target (Scott et al., 2016).
Figure 1-25. Mitochondrial inner-membrane potential in T. brucei . The ATP synthase is composed of Fo, which is embedded in the IM and translocates protons, and F1,
which can either synthesize or hydrolyze ATP. The ATP–ADP carr ier (AAC) mediates the exchange of ATP and ADP across the IM. (a) In the procycl ic form, the electron
transport machinery generates ΔΨ to drive ATP synthesis , in addit ion to protein import and metabolite transport (not shown). (b) In the bloodstream form, the ATP synthase runs backwards and uses ATP hydrolysis to pump protons across the IM to
generate ΔΨ. (c) In Dk or Ak trypanosomes, the Fo portion of the ATP synthase is missing (e .g . owing to a lack of the kDNA encoded subunit , A6) , but the F1 portion hydrolyzes ATP to ADP in the matrix . The exchange of ADP−3 with ATP−4 from the
cytosol establ ishes ΔΨ. Adapted from Jensen et al , 2008.
The unusual structural features of kinetoplast, its particular location, its unique
functions, its DNA composition and its sophisticated mode of replication, division and
segregation, make this system an attractive target for antitrypanosomal drugs (Sela et
al., 2008).

Chapter 1
58
1.7.2.1 HMG-boxproteinsinTrypanosomabrucei
The proper synthesis and function of kinetoplast are largely based on its structure
integrity. This highly condensed network demands proteins or protein complexes in
order to stabilize the disk architecture. Nevertheless, no information about such
proteins was discovered in the kinetoplastid protozoan Trypanosoma brucei until 2014,
when Wang and co-workers found the first trypanosomatid kinetoplast-associated
protein (KAP) called TbKAP6 (Wang et al., 2014).
Various KAP proteins had been previously identified in Crithidia fasciculate as small,
basic and nucleus-encoded histone H1-like proteins, which were able to condense the
isolated kDNA networks in vitro and colocalize with the kinetoplast disk in vivo (Xu et
al., 1996). Moreover, they may also play a role in regulating kDNA gene expression
(Avliyakulov et al., 2004). Trypanosoma cruzi also has TcKAP proteins characterized.
They are similar to KAP proteins of C. fasciculata, implicated in kDNA packaging and
architectural rearrangement (Cavalcanti et al., 2009).
Figure 1-26. The HMG box-containing proteins TbKAP6 and HMGB1. Schematic comparison of two tandem HMG-boxes in TbKAP6 with those of human HMGB1.
HMG-box A: green box; HMG-box B: blue box; C-terminal acidic tai ls : hatched l ines . Structure comparison (below each diagram) of the HMG boxes A and B of TbKAP6
constructed by SWISS-MODEL workspace [http://swissmodel .expasy.org/] (Wang, et al . , 2014); and HMGB1 box A (green; PDB ID: 1AAB) and box B (blue; PDB ID: 1HME)
as determined by NMR microscopy (Hardman, et al . 1995; Weir et al . , 1993).
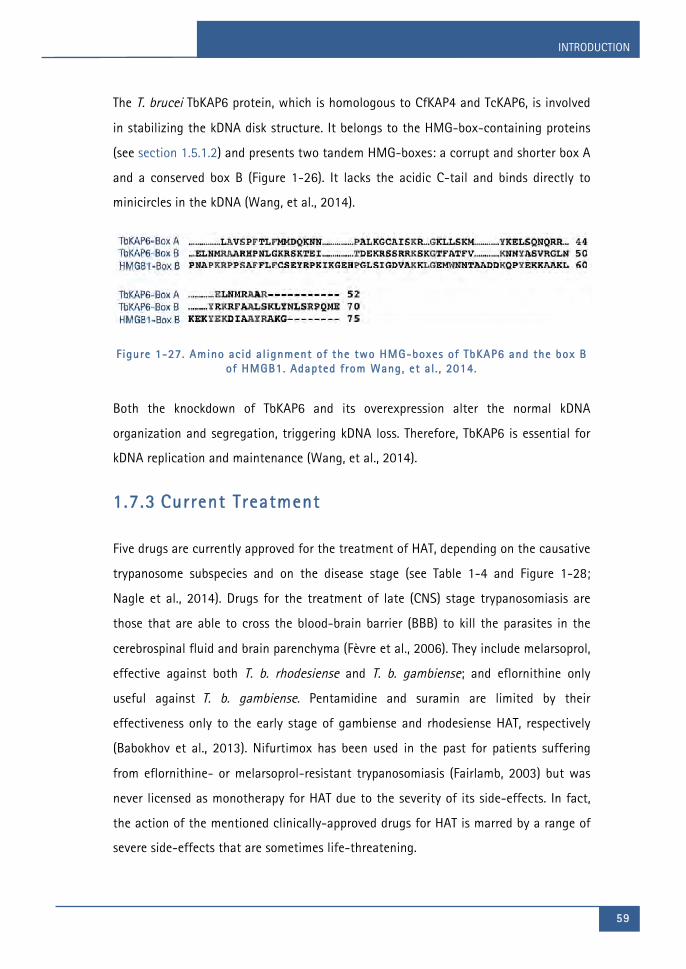
INTRODUCTION
59
The T. brucei TbKAP6 protein, which is homologous to CfKAP4 and TcKAP6, is involved
in stabilizing the kDNA disk structure. It belongs to the HMG-box-containing proteins
(see section 1.5.1.2) and presents two tandem HMG-boxes: a corrupt and shorter box A
and a conserved box B (Figure 1-26). It lacks the acidic C-tail and binds directly to
minicircles in the kDNA (Wang, et al., 2014).
F igure 1-27. Amino acid al ignment of the two HMG-boxes of TbKAP6 and the box B of HMGB1. Adapted from Wang, et al . , 2014.
Both the knockdown of TbKAP6 and its overexpression alter the normal kDNA
organization and segregation, triggering kDNA loss. Therefore, TbKAP6 is essential for
kDNA replication and maintenance (Wang, et al., 2014).
1 .7.3 Current Treatment
Five drugs are currently approved for the treatment of HAT, depending on the causative
trypanosome subspecies and on the disease stage (see Table 1-4 and Figure 1-28;
Nagle et al., 2014). Drugs for the treatment of late (CNS) stage trypanosomiasis are
those that are able to cross the blood-brain barrier (BBB) to kill the parasites in the
cerebrospinal fluid and brain parenchyma (Fèvre et al., 2006). They include melarsoprol,
effective against both T. b. rhodesiense and T. b. gambiense; and eflornithine only
useful against T. b. gambiense. Pentamidine and suramin are limited by their
effectiveness only to the early stage of gambiense and rhodesiense HAT, respectively
(Babokhov et al., 2013). Nifurtimox has been used in the past for patients suffering
from eflornithine- or melarsoprol-resistant trypanosomiasis (Fairlamb, 2003) but was
never licensed as monotherapy for HAT due to the severity of its side-effects. In fact,
the action of the mentioned clinically-approved drugs for HAT is marred by a range of
severe side-effects that are sometimes life-threatening.

Chapter 1
60
An important advance in HAT chemotherapy occurred in 2009 with the introduction of
nifurtimox-eflornithine combination treatment (NECT). NECT was compared in
efficiency to eflornithine monotherapy in the treatment of second-stage T. gambiense
infection (Priotto et al., 2009). In addition, it was found to be safer since it proved to
be half as toxic as the standard eflornithine monotherapy, being able to cure HAT in a
shorter period of administration than the monotherapy, and showing lower propensity
for resistance by trypanosomes (Priotto et al., 2009). Despite this positive progress, the
necessity of intravenous treatment, together with the high costs of distribution, place
NECT far from being optimal chemotherapy for treating HAT.
Table 1-4. Approval drugs for treating HAT.
Disease Stage Drug Year introduced
Route of admin.
Disadvantages
Gambiense HAT
1 (Early) Pentamidine 1941 IM or IV No oral formulation
Eflornithine 1981 IV
Expensive Every 6 h dosing
Melarsoprol 1949 IV
Arsenical (toxic encephalopathy)
2 (Late) NECT a 2009 IV + PO
Expensive, IV for eflornithine part
Rhodesiense HAT
1 (Early) Suramin 1922 IV No oral formulation
2 (Late) Melarsoprol 1949 IV
Arsenical (toxic encephalopathy)
aNECT: nufurtimox-eflornithine combination therapy. IV: intravenous; IM: intramuscular; PO: oral administration. From Nagle et al., 2014.
Due to the limits of currently used HAT therapies, greater emphasis should be placed
on the research and development of the ideal HAT drug. This should be effective for
both early and late disease, orally administered over relatively short periods, economic
and the most important characteristic, it should be safe for all patients (Nagle et al.,
2014).
Recent discoveries had suggested fexinidazole and oxaborole SCXY-7158 as drug
candidates for HAT. Both cure the acute and the chronic mouse models of HAT
infections, have oral bioavailability in mice (41% and 55% respectively), and
progressed to the phase II/III studies in 2012 (Nagle et al., 2014). Furthermore, a wide
variety of minor groove binding drugs, in particular amidines and imidazolines, have

INTRODUCTION
61
been synthesized, and have been strong and extensively evaluated against
trypanosomiasis (Scott et al., 2016).
F igure 1-28. Chemical structures of the establ ished drugs used in chemotherapy of HAT. Pentamidine and suramin are effective at early stage, while melarsoprol ,
nifurt imox and eflornithine are used as at late stage of HAT.
1 .7.4 Dicationic MGBD as Antitrypanosomal Agents
Diamidine-like derivatives are potent trypanocides. These dicationic aromatic
compounds are DNA minor groove binders that have been used clinically against
trypanosomes since the 1930s, starting with the diamidines pentamidine and
diminazene (Scott et al., 2016). For years, scientists have synthesized and extensively
screened in vitro and in vivo series of diamidines patterned after pentamidine, in
order to improve their selectivity and properties such as bioavailability, efficiency,
therapeutic index, and ability to cross the blood-brain barrier (BBB) (Paine et al., 2010;
Mathis et al., 2006). The latter is of outmost importance to cure the late-stage of
sleeping sickness when the parasites have invaded the central nervous system (CNS).
It has been previously described that these dicationic compounds are selectively
cytotoxic to T. brucei cells over mammalian cells due to differences in the active
Chapter 1
62
transport mechanism that aids in the accumulation of drug into parasites at levels
∼1000-fold higher than in mammalian cells (Nagle et al., 2014).
The effectiveness of diamidine-like derivatives including bisguanidines and bis(2-
aminoimidazolines) in recognizing the minor groove of AT-rich sequences of DNA has
guided to design of novel potential antiparasitic agents (Tidwell & Boykin, 2003;
Wilson et al., 2008; Soeiro et al., 2013; Dardonville & Nué Martínez, 2017). The
compounds usually show a preference for binding to AT sequences of at least four
consecutive AT base pairs in the binding site (Wilson et al., 2008). This selectivity is
particularly relevant for the Kinetoplastid protozoa, like Trypananosma brucei, whose
mitochondrial genome contains a high proportion of AT-containing DNA sequences
(Ríos Martínez et al., 2014, Ríos Martínez et al., 2015a; Ríos Martínez et al., 2015b).
The mechanism of antiparasitic action of dicationic compounds is surprisingly unclear
notwithstanding many years of study by a number of laboratories. Both the
mitochondrial and nuclear DNA are well established as targets of the diamidines. The
strongest evidence indicates that DNA functional destruction is related to their
antiparasitic activity (Soeiro et al., 2013; Scott et al., 2016).
The necessity of new, more effective antiparasitic drugs with the lowest possible side
effects has inspired Dr. Christophe Dardonville’s group to design and develop dicationic
compounds like the bis(2-aminoimidazoline) derivatives over the last decade
(Dardonville & Brun, 2004; Dardonville et al., 2006; Ríos Martínez et al., 2014; Ríos
Martínez et al., 2015a; Ríos Martínez et al., 2015b).
Bis(2-aminoimidazoline) derivatives display excellent antiprotozoal activity against T.
brucei and P. falciparum and are generally safer than their bisguanidine counterparts
(Rodríguez et al., 2008). These bis(2-aminoimidazoline) derivatives are excellent minor
groove binders of AT rich DNA (Dardonville et al., 2006; Ríos Martínez et al., 2015a).
This has prompted the study of the sequence affinity and selectivity with motifs like
AATT, TTAA and ATAT (Nagle et al., 2010; Nagle et al., 2012; Glass et al., 2009; Ríos
Martínez et al., 2015a).

INTRODUCTION
63
A good example is the bis(2-aminoimidazoline) derivative 4,4'-bis(imidazolinylamino)
diphenylamine (CD27) (see Figure 1-18b) that is a potent inhibitor of Trypanosma
brucei rhodesiense growth in vitro and in vivo (Dardonville & Brun, 2004; Dardonville
et al., 2006). This compound shows curative activity in a mouse model of early stage
HAT but results inactive against the late stage of the disease (Dardonville et al., 2006).
The dicationic compound FR60 [4-((4,5-dihydro-1H-imidazol-2-yl)amino)-N-(4-((4,5-
dihydro-1H-imidazol-2-yl)amino)phenyl)benzamide dihydrochloride] is a very
promising compound that has demonstrated submicromolar to nanomolar trypanocidal
activity in vitro against Trypanosoma brucei brucei s427-WT and T. b. rhodesiense
(Rodríguez et al., 2008; Ríos Martínez et al., 2015b). It exhibits no major cross-
resistance with the pentamidine-resistant cell line of Trypanosoma brucei brucei B48,
and relatively low cytotoxicity (CC50>200 µM) for human embryonic kidney cells (HEK).
As a result, FR60 shows a high selectivity for the parasite (SI>240), where
SI=[CC50/EC50(s427)] (Ríos Martínez et al., 2015b). In addition, FR60 is 100% curative
in vivo in the STIB900 mouse model of acute rhodesiense trypanosomiasis (i.e. early
stage HAT) (Rodríguez et al., 2008; Ríos Martínez et al., 2015a). However, this
compound proved to be inactive in the mouse model of late (CNS) stage disease (Ríos
Martínez et al., 2015a). This could be due to the high polarity shown by this dibasic
compound that holds two cationic charges at physiological pH, which possibly
decreases its BBB penetration (Ríos Martínez et al., 2015b).
A successful attempt to reduce the pKa of this compound was carried out through the
incorporation of a fluorine, chlorine, or nitrogen atom in the structure of the lead drug
FR60. In this approach, the electronegative halogen atoms decrease the electron
density of the adjacent 2-iminoimidazolidine groups, reducing their basicity and hence
their charge at physiological pH. Such substitution also increased favorably the
lipophilicity of the molecule, both effects being potentially favorable to increase the
BBB permeability of the compound (Ríos Martínez et al., 2015b).
Ríos Martínez et al. measured in vitro the drug sensitivity of the FR60 derivative
compounds on T. b. brucei. They reported a slow-acting effect of most compounds on

Chapter 1
64
the trypanosomes compared with the fast killing cytotoxic drug phenylarsine oxide
(PAO) used as reference in the assay (Ríos Martínez et al., 2015b). Nevertheless, the
introduction of one halogen atom on the diphenyl scaffold led to an increase in
antitrypanosomal activity for four compounds: JNI18, CRMV49, CRMV50 and CDMV65
(half maximal effective concentration [EC50] < [EC50]FR60). JNI18 showed to be the
drug that most modified the dynamics of action of the compounds, increasing the
speed of trypanocidal action (see Table 1-5 and Table 2-9).
None of the FR60 derivatives exhibit major cross-resistance with the pentamidine-
resistant cell line of T. b. brucei B48. Moreover, compounds 1-10 present relatively low
cytotoxicity (CC50>200 µM) for human embryonic kidney cells (HEK).
Table 1-5. In vitro activity of FR60 and derivatives against T. brucei s427 (wild type) and B48 (resistant) strains .
Ref Compound T. b . brucei 427WTa
EC50 (µM) ± SEMb
T. b . brucei AT1-B48 c EC50(µM) ± SEM
RFd HEK e CC50
f (µM) SIg
1 FR60 0.83 ± 0.08 0.87 ± 0.20 1.1 >200 >240
2 CRMV60 1.58 ± 0.31 2.16 ± 0.11 1.4 >200 >120
3 JNI33 4.22 ± 0.14 4.35 ± 1.16 1.0 >200 >45
4 CRMV65 0.58 ± 0.14 0.79 ± 0.21 1.4 >200 >340
5 JNI18 0.220 ± 0.002 0.36 ± 0.02 1.7 >200 >900
6 CRMV49 0.47 ± 0.05 0.65 ± 0.04 1.4 >200 >420
7 JNI17 1.32 ± 0.03 2.44 ± 0.15 1.8 >200 >150
8 CRMV50 0.53 ± 0.20 0.69 ± 0.07 1.3 >200 >370
9 CRMV45 0.97 ± 0.01 0.83 ± 0.08 0.9 >200 >200
10 JNI32 1.04 ± 0.02 3.23 ± 0.94 3.1 >200 >190
Pentamidine 0.00011 ± 0.0004 0.55 ± 0.003 3349
Diminazene 0.012 ± 0.002 0.78 ± 0.04 42
PAOh 0.32 ± 0.03 aBloodstream form trypomastigotes of T. b. brucei s427 wild type. bStandard error of the mean.cT. b. brucei strain resistant to diminazene, pentamidine, and melaminophenyl arsenicals.dResistance factor compared to WT. eHuman embryonic kidney cells. fHalf maximal cytotoxic concentration gSelectivity index (SI) = CC50/EC50(s427).hPhenylarsine oxide. Data taken from Ríos Martínez et al., 2015b.
As FR60, compound CD27 is curative for early stage HAT. However, it also results
inactive against late (CNS) stage sleeping sickness (Dardonville & Brun, 2004;

INTRODUCTION
65
Dardonville et al., 2006). To improve the BBB permeability of the CD27, Nieto Garrido
et al. synthesized the 1-hydroxy analogue CDIV32 [4,4'-bis(1-hydroxyimidazolinyl
amino)diphenylamine] (Table 2-9) (Nieto Garrido et al. 2011). CDIV32 was screened in
vitro against Trypanosoma brucei rhodesiense and three other related parasites:
Trypanosoma cruzi, Leishmania donovani and Plasmodium falciparum. CDIV32
demonstrated submicromolar trypanocidal activity in vitro against T. b. rhodesiense
and nanomolar trypanocidal activity against P. falciparum (Table 1-6).
Table 1-6. In vitro antiprotozoal activity of CDIV32.
Cel l EC50 (µM)
T. b. rhodesiensea (SI)b 0.37 (236)
T. cruzi c (SI) >204
L. donovani d (SI) 58
P. falciparume (SI) 0.055 (1673)
Cytotox L6-cellsf 92 aT. brucei rhodesiense STIB900 strain. Control: melarsoprol, EC50=12.6 nM. bSelectivity index=[EC50(L6-cells)/EC50(parasite)]. cAmastigotes of T. cruzi Tulahuen C4 strain. Control: benznidazole, EC50=1.64 µM. dL. donovani strain MHOM/ET/67/L82 axenically grown amastigotes. Control: miltefosine, EC50=0.275 µM. eP. falciparum K1 erythrocytic stages. Control: chloroquine, EC50=0.169 µM. fRat skeletal myoblast L-6 cells. Data taken from Nieto Garrido et al. 2011.
Nieto Garrido et al. 2011 also proved that CDIV32 is active in vivo in the STIB900
mouse model after intraperitoneal (IP) administration and it showed significant higher
permeability than compound CD27 (nearly 3-fold). These results show that N-
substitution of the imidazolylamino group with OH enhances the in vitro BBB
permeability of the CD27.
Nevertheless, the drug target and mechanism of action of these bis(2-
aminoimidazolinium) compounds into the parasites’ cells is still not clear.
Therefore, a functional and structural analysis of this bis(2-aminoimidazoline) series of
FR60 derivatives, and a CD27-derivative compound, CDIV32, is presented here, in order
to understand how these compounds affect trypanosomes.

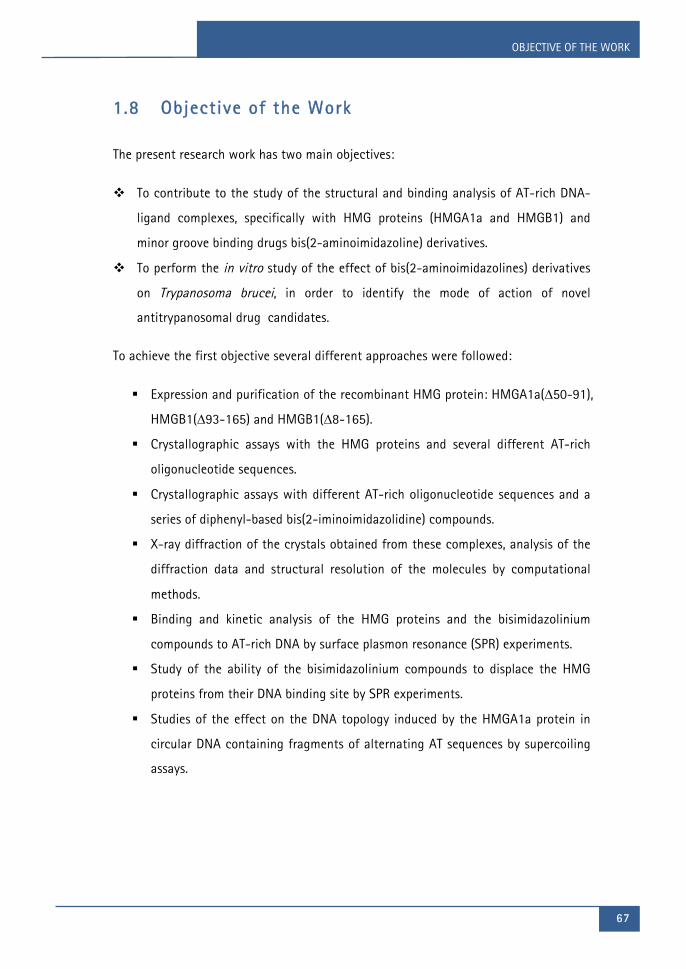
OBJECTIVE OF THE WORK
67
1 .8 Objective of the Work
The present research work has two main objectives:
v To contribute to the study of the structural and binding analysis of AT-rich DNA-
ligand complexes, specifically with HMG proteins (HMGA1a and HMGB1) and
minor groove binding drugs bis(2-aminoimidazoline) derivatives.
v To perform the in vitro study of the effect of bis(2-aminoimidazolines) derivatives
on Trypanosoma brucei, in order to identify the mode of action of novel
antitrypanosomal drug candidates.
To achieve the first objective several different approaches were followed:
§ Expression and purification of the recombinant HMG protein: HMGA1a(∆50-91),
HMGB1(∆93-165) and HMGB1(∆8-165).
§ Crystallographic assays with the HMG proteins and several different AT-rich
oligonucleotide sequences.
§ Crystallographic assays with different AT-rich oligonucleotide sequences and a
series of diphenyl-based bis(2-iminoimidazolidine) compounds.
§ X-ray diffraction of the crystals obtained from these complexes, analysis of the
diffraction data and structural resolution of the molecules by computational
methods.
§ Binding and kinetic analysis of the HMG proteins and the bisimidazolinium
compounds to AT-rich DNA by surface plasmon resonance (SPR) experiments.
§ Study of the ability of the bisimidazolinium compounds to displace the HMG
proteins from their DNA binding site by SPR experiments.
§ Studies of the effect on the DNA topology induced by the HMGA1a protein in
circular DNA containing fragments of alternating AT sequences by supercoiling
assays.

OBJECTIVE OF THE WORK
68
Likewise, to accomplish the second objective different approaches were also followed:
§ In vitro study of drug sensitivity in different cell lines of bloodstream form
Trypanosoma brucei.
§ Determination of the effect of the bis(2-iminoimidazolidine) compounds on T.
brucei growth rate.
§ Study of the cell cycle progression of T. brucei exposed to the bis(2-
iminoimidazolidine) compounds by flow cytometry.
§ Determination of the DNA content of drug-exposed T. brucei by fluorescence
microscopy.
§ Study of the mitochondrial membrane potential of treated T. brucei by flow
cytometry.
§ Study of treated T. brucei ultrastructure by transmission electron microscopy
(TEM).

CHAPTER 2
MATERIALS AND METHODS


MATERIALS AND METHODS
71 71
2 .1 Production and Purif ication of Recombinant
HMG Proteins in E. coli
For X-ray crystallography and surface plasmon resonance (SPR) assays protein samples
with the maximum level of purity achievable are required. During the research work,
the proteins HMGA1a(∆50-91), HMGB1(∆93-165) and HMGB1(∆8-165) have been
expressed and purified. Table 2-2 lists the sequence, molecular mass and other
characteristics of these proteins.
Table 2-1. Relevant specif ication of HMG proteins studied.
Protein name
MW [Da] Extinction coeff ic ient (ε)
Amino acids
Amino acid sequence
HMGA1a (∆50-91)
4,781.6 7.99 a mL·mg-1·cm-1
(at 220 nm) a 42
EVPTPKRPRG RPKGSKNKGA AKTRKTTTTP GRKPRGRPKK LE
HMGB1 Box B (∆93-165)
8,430 10,930 cm-1·M-1 (at 280 nm)
73 +2b GSNAPKRPPS AFFLFCSEYR PKIKGEHPGL SIGDVAKKLG EMWNNTAADD KQPYEKKAAK LKEKYEKDIA AYRAK
HMGB1 Box AB (∆8-165)
18,848 20,700 cm-1·M-1
1 (at 280 nm)
158 +2b
GSKPRGKMSS YAFFVQTCRE EHKKKHPDAS VNFSEFSKKC SERWKTMSAK EKGKFEDMAK ADKARYEREM KTYIPPKGET KKKFKDPNAP KRPPSAFFLF CSEYRPKIKG EHPGLSIGDV AKKLGEMWNN TAADDKQPYE KKAAKLKEKY EKDIAAYRAK
HMGB1 extinction coefficients have been calculated using Peptide Calculator, Northwestern University. aData from Reeves & Nissen, 1999.bThe two additional N-terminal residues highlighted are derived from the cloning process.
Obtaining HMG proteins directly from human cells has many limitations. Thus, the
proteins of interest have expressed in the bacterium Escherichia coli, using different
strains and expression vectors (plasmids) in each case. The plasmid pET-3a containing
the human HMGA1a(∆50-91) was kindly provided by Dr. R. Reeves (Washington State
University, USA) and the two plasmids pGEX-2T containing the genes encoding each of
the HMGB1 mutant proteins were provided by Dr. M. E. A. Churchill (Department of
Pharmacology at the University of Colorado).
A multi-stage purification strategy adapted to each protein has been followed. Table
2-2 includes the strain and type of plasmid used for protein expression, and

Chapter 2
72
summarizes the techniques followed during each purification step (capture phase,
intermediate purification and polishing).
The capture phase reduces the amount of unwanted proteins and concentrates the
target protein. Intermediate purification removes most contaminant closely related to
the target protein. Polishing removes specific contaminant and unwanted forms of the
target protein that may have formed during isolation and purification.
Table 2-2. HMG proteins production main stages.
Protein Expression Purif ication Steps
E. coli strain Plasmid Capture Intermediate Polishing
HMGA1a (∆50-91)
Rosetta (DE3) pLysS
pET-3a Acid extraction
Cation-exchange chromatography Size-exclusion chromatography
HMGB1 Box B
Rosetta (DE3) pLysS
pGEX-2T Sonication Affinity chromatography (Purification GST)
Cation-exchange chromatography
Size-exclusion chromatography
HMGB1 Box AB
Rosetta (DE3) pLysS
pGEX-2T Sonication Affinity chromatography (Purification GST)
Cation-exchange chromatography
Size-exclusion chromatography
2 .1.1 Expression of HMGA1a(∆50-91)
The research work has studied the HMGA1a protein fragment from the amino acid 50
to the 91, containing two of the three DNA binding domains: the II and the III AT-hook
(Figure 2-1). This fraction does not include the acidic C-terminal tail to facilitate its
crystallization.
Figure 2-1. Scheme of HMGA1a(∆50-91) compared to the ful l- length protein HMGA1a. The AT-hook DNA-binding domains are shown in green.

MATERIALS AND METHODS
73 73
E. coli Rosetta (DE3) pLysS strain (Novagen) has been transformed with the plasmid
pET-3a containing the human HMGA1a(∆50-91) gene (Figure 2-2). This plasmid also
contains a gene that confers resistance to the antibiotic ampicillin (ampR), in order for
bacteria carrying the plasmids can be selected.
Through the T7 promoter system present in the pET vectors, the expression of the
recombinant protein is much more specific and can be induced by isopropyl β-d-1-
thiogalactopyranoside (IPTG) (see Appendix A). Induction will be done at the
exponential growth phase of the cells to optimize the expression of the desired protein.
Figure 2-2. Scheme of the plasmid used to expressed HMGA1a(∆50-91). F igure created by Savvy SVG plasmid map generating program
[http://www.bioinformatics .org/savvy/] .
The protocols followed for the transformation, transformed cell selection, induction
and expression of HMGA1a(∆50-91) are described next. In order to prevent
contamination, all steps of the process were carried out under sterile conditions.
Appendix B describes the protocol for preparing the culture media and buffers used for
this process.
Transformation
0.5 µL of the pET-3a plasmid DNA solution (approximately 100 ng/µL) were added to
~100 µL of competent cells of Escherichia coli Rosetta (DE3) pLysS strain. A negative
control with only competent cells was also prepared. Cells were placed on ice for 15
min. They were heat shocked in a 37°C water bath for 5 min and then transferred

Chapter 2
74
to ice immediately for 2 min. This heat shock facilitates the entry of plasmid DNA into
the competent cells. The cells were then added to 1 mL of LB medium and incubated
for 1 hour at 37°C in a water bath, followed by centrifugation at 4,000 rpm for 3 min
(microfuge). About 1 mL of supernatant was removed. The pellet was resuspended and
plated directly onto LB agar plates containing the appropriate antibiotics: ampicillin
(50 µg/mL) and chloramphenicol (25 µg/mL). Plates were incubated overnight at 37°C.
On the next day, some colonies must be observed on the transformed cells plate,
whereas no colonies should appear in the control plate as the untransformed cells are
not resistant to the ampicillin.
Growing transformed E. coli in liquid media
One single colony was picked from the transformed cells plate using a sterilized loop
and inoculated into 3 mL LB medium containing 50 µg/mL ampicillin. Culture was
grown for about 6 hours at 37°C with shaking at 250 rpm until medium turned turbid.
Then, the culture was poured into 50 mL LB with 50 µg/mL ampicillin and incubated
overnight at 37°C with shaking at 250 rpm.
HMGA1a(50-91) protein induction
The required volume of the overnight culture to reach a OD600 = 0.1-0.2 was diluted
with 1 L of LB containing 50 µg/mL ampicillin. The culture was incubated at 37°C with
shaking at 250 rpm until the OD600 of 0.6 to 0.7 was achieved. 1 mL of 1 M IPTG was
added to the culture, followed by incubation at 37°C with shaking at 250 rpm for 3
hours. Culture was centrifuged at 4,000 rpm for 10 min at 4°C (SLA 3000 rotor) and
the supernatant was removed. The pellet (bacteria) was stored at -80°C until needed.
Un-induced and induced samples (induction time: 0, 1.5 h and 3 h) were analyzed by
measuring the absorbance and by SDS-PAGE to check protein expression levels. An
aliquot of 125 µL was taken every time point and centrifuged at 4,000 rpm for 5 min
(microfuge). The pellet was resuspended in 30 µL of 1× SDS sample buffer. 1 mL of
culture was taken every time point to measure its absorbance. Samples were stored at
-20°C until the electrophoresis was performed (see section 2.2.1).

MATERIALS AND METHODS
75 75
Pellet preparation
As the recombinant HMGA1a(∆50-91) protein is expressed intracellularly in E. coli, cell
disruption is necessary. Preparation of the bacterial lysate is a critical step. Optimal
conditions maximize the fraction of the recombinant protein extracted. The protocol
followed is detailed next (adapted from Reeves & Nissen, 1999).
For bacterial pellet obtained from 1 L of starting culture, 100 mL of 5% HClO4/0.5%
Triton X-100 (cold) were used to resuspend the pellet by pipetting continuously to
obtain a good dispersion of cells. Samples were incubated on ice for at least 15 min
with occasional shaking. Cells were centrifuged at 10,000 rpm for 10 min at 4°C (GSA
rotor, Sorvall) and the supernatant were collected. Recombinant HMGA1a(∆50-91)
protein was precipitated from the supernatant by adding trichloroacetic acid (TCA) to a
25% final concentration (add 33.3 mL). Samples were placed on ice for 1 h or more
with occasional agitation. At this point, samples could be stored at 4°C overnight.
Samples were centrifuged at 10,000 rpm for 20 min at 4°C (GSA rotor, Sorvall) and the
supernatant was discarded very carefully. The protein pellet often appears to be "oily"
and fluid, thus care should be taken not to lose it while decanting the supernatant.
Pellet was resuspended in 60 mL H2O. 20 mL of TCA were added to get a final
concentration of 25%. Samples were placed on ice with occasional shaking, followed
by centrifugation at 10,000 rpm for 10 min at 4°C (GSA rotor, Sorvall). Supernatant
was discarded carefully and the pellet was washed with 60 mL of acetone with 10 mM
cold HCl (-20ºC). Samples were centrifuged at 10,000 rpm for 10 min at 4°C (GSA rotor,
Sorvall), the supernatant was discarded carefully right after centrifugation and the
pellet was washed with 60 mL of cold acetone (-20°C). This step was repeated twice.
The pellet was dried under vacuum and stored at -20ºC.
The pellet obtained is enriched in HMGA1a(∆5-91) but the protein needs to be purified.

Chapter 2
76
2 .1.2 Purif ication of HMGA1a(∆50-91)
In order to achieve the required level of purity of the HMGA1a(∆50-91), the
chromatographic techniques described below have been performed.
Cation-exchange chromatography
Chromatography is one of the most widely used methods of protein purification.
Proteins can be purified based on characteristics such as size and shape, charge,
hydrophobic groups present on the surface, and binding capacity with the stationary
phase.
Ion-exchange chromatography is based on electrostatic interactions between charged
protein groups, and a solid support material called matrix. Matrix has an ion load
opposite to that of the protein to be separated, and the affinity of the protein to the
column is achieved with ionic bonds.
Proteins are separated from the column either by changing pH, concentration of ion
salts or ionic strength of the buffer solution. Positively charged ion exchange matrices
are called anion-exchange matrices, and adsorb negatively charged proteins, while
matrices bound with negatively charged groups are known as cation-exchange
matrices, and adsorb positively charged proteins. The latter have been used as the first
purification step for the HMGA1a(∆50-91) protein due to the net positive charge this
protein has.
Cation-exchange chromatography consists of three phases:
§ Equilibration. At this stage the matrix is adjusted to the initial saline and pH
conditions required for the experiment by contacting the stationary phase
with the counterion.
§ Application of protein sample. The sample, in the same buffer used to
equilibrate, is applied to the stationary phase. It is necessary to centrifuge
the sample before loading it in the column to eliminate possible insoluble
residues. Proteins carrying a charge opposite to the stationary phase displace
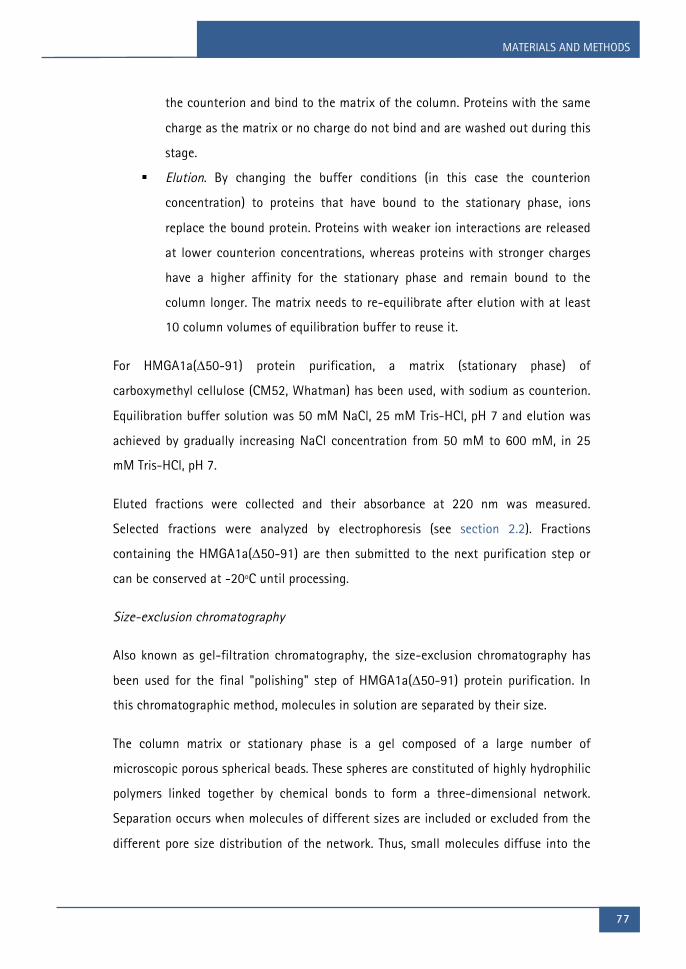
MATERIALS AND METHODS
77 77
the counterion and bind to the matrix of the column. Proteins with the same
charge as the matrix or no charge do not bind and are washed out during this
stage.
§ Elution. By changing the buffer conditions (in this case the counterion
concentration) to proteins that have bound to the stationary phase, ions
replace the bound protein. Proteins with weaker ion interactions are released
at lower counterion concentrations, whereas proteins with stronger charges
have a higher affinity for the stationary phase and remain bound to the
column longer. The matrix needs to re-equilibrate after elution with at least
10 column volumes of equilibration buffer to reuse it.
For HMGA1a(∆50-91) protein purification, a matrix (stationary phase) of
carboxymethyl cellulose (CM52, Whatman) has been used, with sodium as counterion.
Equilibration buffer solution was 50 mM NaCl, 25 mM Tris-HCl, pH 7 and elution was
achieved by gradually increasing NaCl concentration from 50 mM to 600 mM, in 25
mM Tris-HCl, pH 7.
Eluted fractions were collected and their absorbance at 220 nm was measured.
Selected fractions were analyzed by electrophoresis (see section 2.2). Fractions
containing the HMGA1a(∆50-91) are then submitted to the next purification step or
can be conserved at -20ºC until processing.
Size-exclusion chromatography
Also known as gel-filtration chromatography, the size-exclusion chromatography has
been used for the final "polishing" step of HMGA1a(∆50-91) protein purification. In
this chromatographic method, molecules in solution are separated by their size.
The column matrix or stationary phase is a gel composed of a large number of
microscopic porous spherical beads. These spheres are constituted of highly hydrophilic
polymers linked together by chemical bonds to form a three-dimensional network.
Separation occurs when molecules of different sizes are included or excluded from the
different pore size distribution of the network. Thus, small molecules diffuse into the

Chapter 2
78
pores and their flow through the column is retarded according to their size, while large
molecules cannot enter the pores and are eluted in the column’s void volume.
Therefore, molecules are separated based on their size as they pass through the column
and are eluted in order of decreasing molecular weight. The entire separation process
takes place as one total column volume (equivalent to the volume of the packed bed)
of buffer passes through the gel filtration medium.
In this case, unlike the ion-exchange columns, proteins do not bind to the matrix and
therefore the buffer composition does not directly affect the resolution. The factors
that indeed affect the resolution and thus good separation between the target protein
and the impurities are mainly the sample volume, the particle and pore size, column
dimensions, column packing, flow rate and sample viscosity.
To address fast and efficient HMGA1a(∆50-91) protein polishing the ÄKTA Purifier 10
system (GE Healthcare) has been used. The separating column was the Superdex™
Peptide 10/300 GL (GE Healthcare), with an optimum molecular weight range (Mr)
from 100 to 7,000. Column matrix is composed of spherical composite of cross-linked
agarose and dextran within a column volume of 24 mL. Protein samples were
concentrated prior to loading onto the column by ultrafiltration using a Vivaspin® (GE
Healthcare).
The buffer used for both column equilibration and elution was 25 mM Tris-HCl, pH 7.5
containing 100 mM NaCl. The flow rate was 0.5 mL/min, equilibration of the column
was done with at least 2 column volumes and elution with 1.5 column volumes.
The ÄKTA purifier 10 automatically collects fractions during elution and measures their
absorbance at 220, 260 and 280 nm. Fractions absorbing at 220 were collected, and
HMGA1a(∆50-91) purity verification was achieved by electrophoretic analysis (section
2.2). The absorbance at 260 and 280 nm is monitored to evidence possible
contamination of DNA or proteins containing aromatic residues, respectively.
For crystallography assays, pure samples were concentrated to at least 10 mg/mL by
ultrafiltration using a Vivaspin® (GE Healthcare).

MATERIALS AND METHODS
79 79
2 .1.3 Expression of HMGB1 proteins
In this work two deletion mutants of the HMGB1 protein have been studied, one from
the amino acid 8 to the 165, containing both HMG boxes, and the second from amino
acid 93 to 165, containing only the second DNA binding domain, the HMG box B
(Figure 2-3). Both lack the acidic C-terminal tail to facilitate crystallization.
As with HMGA1a(50-91), HMGB1 proteins production was performed in bacterial
cultures. Plasmids pGEX2T containing GST-tagged rat HMGB1 proteins Boxes A+B and
Box B were expressed in E. coli Rosetta (DE3) pLysS strain (Novagen). HMGB1 proteins
were obtained by the Glutathione S-transferase (GST) Gene Fusion System, which is a
versatile system for the expression, purification, and detection of GST-tagged proteins
produced in Escherichia coli.
This technique involves expressing the protein of interest fused to the known protein
glutathione S-transferase (GST) to facilitate its purification by affinity chromatography.
The pGEX2T vectors are designed for inducible, high-level intracellular expression of
genes or gene fragments as fusions with Schistosoma japonicum GST. Expression in E.
coli yields tagged proteins with the GST moiety at the amino terminus and the protein
of interest at the carboxyl terminus. Once purified, cleavage of the protein from GST is
done to obtain pure sample of the target protein.
Figure 2-3 shows the scheme of the plasmid used to express the two fragments of the
protein HMGB1. This expression vector also contains the genes Ptac promoter (Ptac),
lacI repressor (lac Iq) and ampicillin resistance (ampR). Recombinant HMGB1 protein
expression can be induced by adding IPTG (Appendix A).
The protocols followed for the transformation, induction and expression of the
HMGB1s are described next. In order to prevent possible contamination, all stages of
the work were carried out under sterile conditions. Appendix B describes the protocol
for preparing the culture media and buffers used in this section.

Chapter 2
80
Figure 2-3. Scheme of the plasmid pGEX-2T encoding the GST-fusion protein HMGB1 ( left) . F igure created by Savvy SVG plasmid map generating program
[http://www.bioinformatics .org/savvy/] . Schematic representation of the HMGB1 proteins studied (r ight): Box AB and Box B.
Transformation
0.5 µL of the pGEX-2T plasmid DNA solution (typically 1-20 ng/mL) were added to
~100 µL of competent cells of Escherichia coli Rosetta (DE3) pLysS strain. A negative
control with only competent cells was also prepared. Cells were placed on ice for 10-
20 min. They were heat shocked in a 37°C water bath for 5 min then transferred
to ice immediately for 2 min. The cells were then added to 1 mL of room temperature
LB medium and incubated for 1 hour at 37°C in a water bath, followed by
centrifugation at 4,000 rpm for 2 min at 4°C (microfuge). About 1 mL of supernatant
was removed and the pellet was resuspended and plated directly onto LB agar plates
containing the appropriate antibiotics: ampicillin (50 µg/mL) and chloramphenicol (34
µg/mL). Plates were incubated overnight at 37°C.
Growing transformed E. coli in liquid media
One single colony was picked from the transformed cells plate using a sterilized loop
and inoculated into 3 mL LB containing 50 µg/mL ampicillin and 34 µg/mL
chloramphenicol. Culture was grown for about 6 hours at 37°C with shaking at 250
rpm until medium turned turbid. The culture was then diluted with 150 mL LB
containing 50 µg/mL ampicillin and 34 µg/mL chloramphenicol and incubated
overnight at 37°C with shaking at 250 rpm.

MATERIALS AND METHODS
81 81
HMGB1 proteins induction
The required volume of culture to reach a OD600 = 0.1 (usually about 60 mL) was
inoculated into 1 L of LB with 50 µg/mL ampicillin and 34 µg/mL chloramphenicol.
Culture was incubated at 37°C with vigorous shaking at 250 rpm until OD600 of 0.8 was
achieved. HMGB1 protein induction was then performed by adding 0.5 mM IPTG. The
culture was incubated at 37°C with shaking at 250 rpm for 3 hours, followed by
centrifugation at 5,000 rpm for 10 min at 4°C (SLA 3000 rotor). The supernatant was
removed and the pellet (bacteria) was flash-frozen in liquid nitrogen and store at -
80°C until needed.
As in the HMGA1a(∆50-91) protein expression, aliquots were taken during induction at
time 0, 1.5 and 3 h to measure the absorbance and to make electrophoretic controls of
the process on SDS-PAGE gels (section 2.2.1).
50 µL aliquot was taken every time point and centrifuged at 4,000 rpm for 5 min
(microfuge). The pellet was resuspended in 15 µL of 1× SDS sample buffer. Additionally,
1 mL of culture was taken every time point to measure its absorbance. Samples were
stored at -20°C until the electrophoresis was performed.
Pellet preparation
HMGB1 protein fractions are expressed intracellularly in recombinant E. coli. Thus, cell
disruption is necessary to extract the recombinant protein. Cell lysis is produced by
sonication.
In a falcon siliconized tube, the bacterial pellet obtained from 1 L of starting culture
was resuspended in 25 mL of affinity column equilibration buffer (0.5 M NaCl, 10 mM
EDTA, 1 mM DTT, 10% glycerol, 20 mM Tris-HCl, pH 7.9) with protease inhibitors (1/2
cOmplete Protease Inhibitor Cocktail tablet, Roche) and a spatula tip of DNase by
pipetting continuously to obtain a good dispersion of cells. Cell lysis was performed by
sonication on Bandelin SONOPULS Ultrasonic Homogenizer HD 2200 twice for 2 min
with 50% of output. It is very important to keep the samples cool (on ice) during
sonication to avoid heating. Samples were then centrifuged at 15,000 rpm for 30 min

Chapter 2
82
at 4°C (GSA rotor, Sorvall) and the supernatant was decanted into a clean 50 mL
centrifuge tube. Supernatant was ready for loading onto the affinity column.
2 .1.4 Purif ication of the HMGB1 proteins
At this point, the recombinant protein mixed with bacterial proteins and other
impurities is available. In order to achieve the required level of purity, a multi-step
chromatographic strategy for optimizing purification of the HMGB proteins is carried
out. The purification process begins with an affinity chromatography (also called
affinity purification), which makes use of the specific binding interactions between the
tails of the GST fusion protein. Subsequently, a cation-exchange chromatography and
size-exclusion chromatography are performed.
Affinity chromatography
Purification of proteins can be easier and simpler if the protein of interest is tagged
with a known sequence commonly referred to as a tag. Here, GST affinity tag to aid in
the purification of the HMGB1 recombinant proteins was used.
The clarified lysate is incubated with Glutathione Sepharose™ 4B matrix (GE
Healthcare). Hence, the GST moiety binds with high affinity to the glutathione coupled
to the Sepharose beads. This binding is reversible and the protein can be eluted by the
addition of reduced glutathione to the elution buffer. A specific protease site
engineered between the GST moiety and the protein of interest allows removal of the
GST moiety from the target recombinant protein. In our case, the pGEX-2T plasmid
contains a protease cleavage site for thrombin, which cuts specifically the amino acid
sequence LVPR/ /GS, between the GST moiety and the HMGB1 protein fragment, which
is collected during the elution step. Finally, the glutathione Sepharose beads are
regenerated by exposing to guanidine chloride, which denaturates the GST tag that
remains bound to the column.
The matrix used is packed in a glass Bio-Rad column but unlike the chromatography
system previously described (section 2.1.2), this is a semi-batch chromatography,

MATERIALS AND METHODS
83 83
where the sample is incubated for a certain time with the column matrix and eluted by
gravity flow. The protocol detailed for a clarified lysate obtained from 1 L of starting
culture is presented next.
The Glutathione Sepharose™ 4B matrix (about 2.5 mL resin per 1 L of culture) was
thoroughly equilibrated by passing 3 times 10 bed volumes of equilibration buffer: 0.5
M NaCl, 10 mM EDTA, 1 mM DTT, 10% glycerol, 20 mM Tris-HCl, pH 7.9. Then, the
clarified lysate (supernatant from sonication) was loaded on the matrix and incubated
by rotating gently for 2 h at 4°C. The flow through (FT) was eluted. 5 column volumes
(one at a time) were washed with wash buffer: 1 M NaCl, 10 mM EDTA, 1 mM DTT, 20
mM Tris-HCl, pH 7.9. The eluent (W) was collected. 3 column volumes of thrombin
buffer: 100 mM NaCl, 2,5 mM CaCl2, 1 mM DTT, 20 mM Tris-HCl, pH 7.9 was passed
through the column, eluted and collected (ThW). 200 U of thrombin (Fisher Bioreagents)
in 1 mL of thrombin buffer was added to the column to remove the GST tag and
incubated by rotating overnight at 4°C. To inactivate the enzyme, enough 0.5 mM
EDTA was added to get to a final concentration of 10 mM. The flow through (FTc) was
eluted and collected. The elution of the HMGB1 protein was performed using 3
volumes of elution buffer: 100 mM NaCl, 10 mM EDTA, 1 mM DTT, 10 mM Tris-HCl, pH
7.9. Each elution was collected separately (E1, E2, E3). Column matrix regeneration was
achieved by passing 3 volumes of water, 3 volumes of 6 M guanidine chloride and rinse
with 3 volumes of water. Column can be stored in ethanol to prevent any microbial
growth once 3 volumes of ethanol have passed through it.
All samples eluted by SDS-PAGE were analyzed to verify the resolution of the
purification process (section 2.2). The fractions eluted after the GST tag removal (FTc
E1, E2, E3) are pooled in one sample ready to load into the cation exchange column as
described below.
Cation-exchange chromatography
The protein was further purified using a 5 mL HiTrap SP FF cation-exchange column
(GE Healthcare) to separate the enzyme thrombin and other minor impurities from the
HMGB1 protein. SP Sepharose Fast Flow is composed of cross-linked, 6% agarose

Chapter 2
84
particles, with sulphopropyl (SP) strong cation exchange groups. Cation-exchange
chromatography technique has been described in section 2.1.2. The chromatography
was performed in an ÄKTA purifier 10 system. Equilibration buffer solution was 100
mM NaCl, 1 mM EDTA, 1 mM DTT, 10 mM Tris-HCl, pH 7.9 and the protein was eluted
with a linear gradient to a final concentration of 1 M NaCl in the same buffer. The
flow rate used is 2 mL/min, equilibration of the column is done with 10 column
volumes.
Absorbance of each collected fraction was measured at 220, 260 and 280 nm.
Fractions absorbing at 280 nm were separated (unlike the HMGA, HMGB protein does
present aromatic residues), and their protein purity was verified by SDS-PAGE (section
2.2). The most pure fractions were pooled and concentrated for final purification via
size-exclusion chromatography.
Size-exclusion chromatography
Size-exclusion chromatography technique is described in section 2.1.2. For HMGB1
protein polishing, a HiLoad Superdex™ 75 (GE Healthcare) column was used, with an
optimum molecular weight range (Mr) from 3,000 to 70,000 Da.
The buffer used for both column equilibration and elution was 150 mM NaCl, 1 mM
DTT, 50 mM HEPES, pH 7.4. The flow rate used was 0.5 mL/min, equilibration of the
column was done with at least 2 column volumes and the elution with 1 column
volumes. Pure fractions, based on analysis by SDS–PAGE (section 2.2), were pooled and
dialyzed to decrease the salt concentration in buffer containing in 50 mM NaCl, 1 mM
DTT in 25 mM HEPES, pH 7.4 at 4ºC. Finally, pure samples were concentrated to at
least 10 mg/mL for crystallography assays using a Vivaspin® (GE Healthcare) ultra-
concentration device. Samples were submitted to flash-freezing in liquid nitrogen and
stored at -80ºC.

MATERIALS AND METHODS
85 85
2 .2 Electrophoretic Techniques
Gel electrophoresis is a technique widely used to separate biological macromolecules
(basically proteins or nucleic acids) according to their length, conformation and charge.
Using an electric field, molecules can be made to move through a gel. This electric field
consists of a negatively charged cathode and a positively charged anode at each end of
the gel, which drive the molecules through the gel according the their charge. The gel
is placed in an electrophoresis buffer-filled chamber, which is connected to a power
source. Samples being sorted are dispensed individually into wells in the gel. Applying
the electric field, molecules move through the gel at different rates and then, they
migrate different distances, which form distinct bands on the gel, one band per
component.
The gel (matrix) is a polymer whose composition and porosity is chosen based on the
specific weight and composition of the macromolecule to be analyzed. It is usually
composed of different concentrations of acrylamide and a cross-linker or agarose,
producing different sized mesh networks of polyacrylamide or agarose. Polyacrylamide
gel matrix is formed through a free radical driven chemical reaction. On the other hand,
agarose is composed of long unbranched chains of uncharged carbohydrate without
cross-links, resulting in a gel with large pores allowing separation of superior
macromolecules and macromolecular complexes.
2 .2.1 SDS Polyacrylamide Gel Electrophoresis (SDS-
PAGE)
Sodium dodecyl sulfate polyacrylamide gel electrophoresis (SDS-PAGE) is a method for
separating molecules based on the difference of their molecular weight. The SDS-PAGE
protocol followed in the present work is based on the discontinuous buffer system
devised by Laemmli (Laemmli, 1970), which is the most popular electrophoresis system.
During sample preparation for SDS-PAGE, proteins are boiled in SDS-PAGE sample
buffer containing 5% (v/v) of the reducing agent β-mercaptoethanol (Sigma-Aldrich)

Chapter 2
86
and the detergent 2% (w/v) SDS (Sigma-Aldrich) (Table 2-3). This formulation
simultaneously breaks disulfide bonds and disrupts the tertiary structure of proteins.
SDS binds to linear proteins (polypeptide subunits) in a range of 1.4 g of SDS per g of
polypeptide. SDS also coats the protein with a uniform negative charge, which masks
the intrinsic charges on the R-groups of the amino acids. One of the most significant
properties of this anionic detergent is that when it binds to polypeptides, all assume
the same hydrodynamic shape, which means that their electrophoretic mobilities are
nearly identical. Then, proteins separate by sieving on basis of size (molecular weight)
through migrating towards the anode. The glycerol (Sigma-Aldrich) present in the
sample buffer provides density for applying the sample on the gel, and bromophenol
blue (Thermo Fisher Scientific) is used as a color marker to monitor the progression of
the gel electrophoresis.
The gel is divided into two portions, a smaller upper "stacking" gel of lower percentage
of acrylamide and pH 6.8, and a resolving gel with highest percentage of acrylamide,
higher pH (8.8) with a different ionic content (Table 2-3). This allows the proteins in a
loaded sample to be concentrated into one tight layer during the first few minutes of
electrophoresis before entering the resolving portion of a gel.
Electrophoresis gels are formulated in buffers that enable electric field to flow through
the matrix. The prepared solution is poured into the thin space (usually 0.75 mm or 1.5
mm) between two glass plates that form a "cassette". This process is referred to as
“casting a gel”. First, resolving portion is dispensed, then, prior to polymerization, a
small layer of isopropanol is added on top of the gel to straighten the level of the gel.
After the resolving gel is polymerized, isopropanol is removed and stacking gel solution
is poured. Immediately after, a gel comb (a well-former template) is inserted. Once the
gel polymerizes, the cassette is mounted (typically vertically) into the electrophoresis
chamber so that the top and bottom edges are placed in contact with the running
buffer, and the comb is removed.
The running buffer contains ions that conduct the current through the gel. SDS is also
present in the gel and in the running buffer to make sure that once the proteins are

MATERIALS AND METHODS
87 87
linearized and their charges are masked, they stay that way throughout the run. The
compositions of the SDS-PAGE gel and buffers are listed in Table 2-3.
Table 2-3. SDS-PAGE gel and buffers composit ion.
SDS-PAGE GEL (10 cm × 15 cm × 1 .5 mm thick)
Reagent Resolving (10 mL) (15% acrylamide, 0,4% bisacrylamide, 0.375 M Tris, 0.1% SDS)
Stacking (3 mL) (6% acrylamide, 0.16% bisacrylamide, 0.125 M Tris, 0.1% SDS)
30% acrylamide, 0.8% bisacrylamide
5 mL 0.6 mL
1.5 M Tris-HCl, pH 8.8
2.5 mL -
10% SDS 100 µL 30 µL 0.5 M Tris-HCl, pH 6.8
- 0.75 µL
H20 2.3 mL 1.59 mL
TEMED a 4.5 µL 3 µL
10% APS b 75 µL 30 µL
SDS-PAGE RUNNING BUFFER
Reagent 5× (1 L) [1×] Tris Base 30 g 0,01 M
Glycine 144 g 0,075 M
SDS 5 g 0,02 %
SDS-PAGE SAMPLE BUFFER
Reagent 4× (10 mL) [1×] 2 M Tris, pH 6.8 1.25 mL 62 mM
Glycerol 4 mL 10 %
SDS 0.8 g 2%
β-mercaptoethanol 2 mL 5 %
Bromophenol blue Spatula tip - aN,N,N',N-Tetramethylethylenediamine (Sigma-Aldrich). bAmmonium persulfate (Bio-Rad).
SDS-PAGE gel preparation
Glass plates, combs, and spacers required were cleaned and dried. The gel cassette was
assembled and the resolving gel was prepared following Table 2-3 and poured into the
cassette. To avoid polymerization, TEMED was added when solution was well mixed.
Immediately, a small layer of isopropanol was added to the top of the gel prior to
polymerization. While the resolving gel was polymerizing, the preparation of the

Chapter 2
88
stacking gel (Table 2-3) was started (TEMED was not added yet). Isopropanol layer was
removed and the top layer of the gel was rinsed with ddH2O and dried off as much of
the water as possible by carefully using filter paper. TEMED was added to the stacking
gel solution, mixed and quickly transferred the gel solution into the cassette until full,
and then the appropriate comb was inserted.
Sample preparation
4x SDS-PAGE sample buffer was prepared following the Table 2-3. The required volume
of 4x sample buffer (or 2x) was added to each protein sample and mixed. Samples were
boiled for 3-6 min. Samples were spun and loaded onto the gel using a Hamilton.
Syringe must be thoroughly rinsed with ddH2O between applications to avoid cross
contamination of different samples.
Protein samples (containing sample buffer) can be stored at -20°C and reboiled for 5
min when used the following time.
Electrophoresis
The gel cassette in the electrophoresis chamber containing 1× SDS-PAGE running
buffer (Table 2-3) was placed on the bottom chamber. Air bubbles attached to the
bottom ends of the glass plates were removed. The comb was removed carefully and
the upper chamber was filled with running buffer until completely covering the wells.
Protein samples were loaded in consecutive wells. The electrophoresis tank was
connected to the power supply and the gel was run at constant voltage (100-130 V)
for 45-60 min until the tracking dye (bromophenol blue) was about 1 cm from the
bottom of the plates.
Protein detection with Coomassie® blue
To visualize the proteins sorted in the gel, they need to be stained. For that purpose,
Coomassie® blue G-250 dye dissolved in isopropanol and acetic acid was used (see
Table 2-4). This solution not only dyes but also fixes the proteins in the gel matrix.
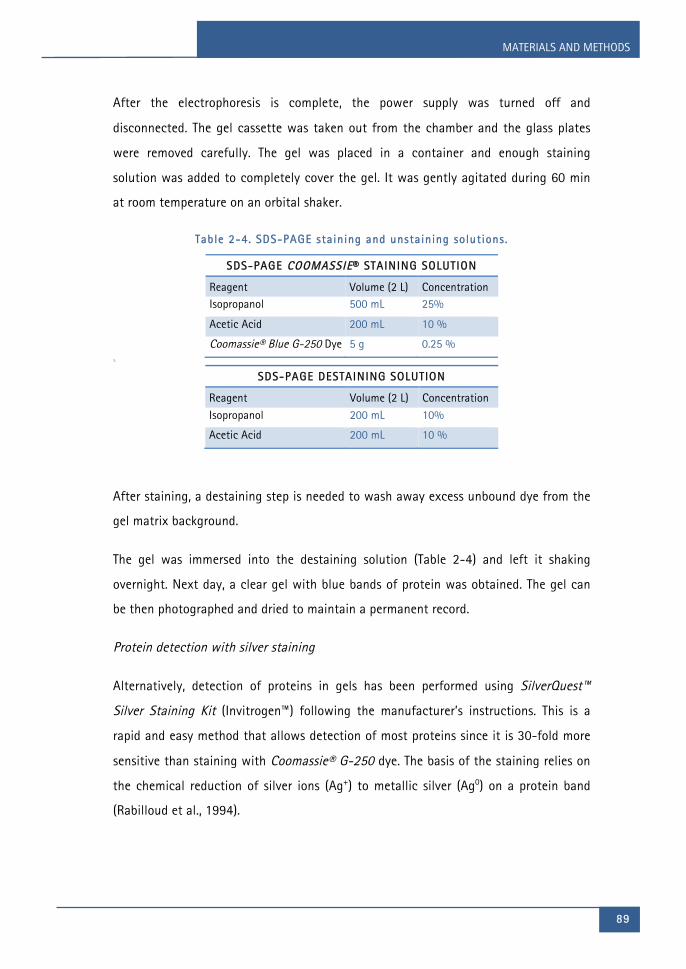
MATERIALS AND METHODS
89 89
After the electrophoresis is complete, the power supply was turned off and
disconnected. The gel cassette was taken out from the chamber and the glass plates
were removed carefully. The gel was placed in a container and enough staining
solution was added to completely cover the gel. It was gently agitated during 60 min
at room temperature on an orbital shaker.
Table 2-4. SDS-PAGE staining and unstaining solutions.
SDS-PAGE COOMASSIE® STAINING SOLUTION
Reagent Volume (2 L) Concentration Isopropanol 500 mL 25%
Acetic Acid 200 mL 10 %
Coomassie® Blue G-250 Dye 5 g 0.25 % 1.
SDS-PAGE DESTAINING SOLUTION
Reagent Volume (2 L) Concentration
Isopropanol 200 mL 10%
Acetic Acid 200 mL 10 %
After staining, a destaining step is needed to wash away excess unbound dye from the
gel matrix background.
The gel was immersed into the destaining solution (Table 2-4) and left it shaking
overnight. Next day, a clear gel with blue bands of protein was obtained. The gel can
be then photographed and dried to maintain a permanent record.
Protein detection with silver staining
Alternatively, detection of proteins in gels has been performed using SilverQuest™
Silver Staining Kit (Invitrogen™) following the manufacturer’s instructions. This is a
rapid and easy method that allows detection of most proteins since it is 30-fold more
sensitive than staining with Coomassie® G-250 dye. The basis of the staining relies on
the chemical reduction of silver ions (Ag+) to metallic silver (Ag0) on a protein band
(Rabilloud et al., 1994).

Chapter 2
90
For optimal results, it is recommended to use ultrapure water, to always use gloves to
avoid fingerprint contamination and rinse them with deionized water previous to
handling gels, to avoid applying pressure on gels, to use freshly made solutions and to
use clean glass containers designated for silver staining purposes only.
2 .2.2 Acetic Acid-Urea Polyacrylamide Gel
Electrophoresis (AU-PAGE)
Panyim and Chalkley developed in 1969 a continuous acetic acid-urea polyacrylamide
gel system that separates very similar basic proteins based on differences in size and
effective charge (Panyim & Chalkley, 1969). The original method has been modified by
replacing ammonium persulfate (APS) and tetramethylethylenediamine (TEMED) with
thiourea and H2O2 (Hurley, 1977).
At the highly acidic pH of AU- PAGE system (around pH 3.5) and deprived of SDS
detergent, the positively charged proteins of similar size are still subject to the sieving
effect of the gel matrix, but their charges would vary according to their amino acid
content. Subsequently, they can be also resolved from each other according to their
charges, and not only by their size. The presence of urea, which is an efficient agent for
breaking non-covalent protein interactions, improves the protein solubility and
facilitates electrophoretic migration.
The compositions of the AU-PAGE gel and sample buffer are listed in Table 2-5. AU-
PAGE running buffer is 5% acetic acid.
AU-PAGE gel casting and electrophoresis assembly are performed as already described
in section 2.2.1 but gels are composed of only one phase (resolving gel) in this case.
Gels are run under a constant current of 20 mA.

MATERIALS AND METHODS
91 91
Table 2-5. AU-PAGE gel and sample buffer composit ion.
AU-PAGE GEL (10 cm × 15 cm × 1 .5 mm thick)
Reagent Resolving (12 mL) (15% acrylamide, 0.1% bisacrylamida, 2.5 M Urea, 5.37% acetic acid)
30% acrylamide, 1% bisacrylamide 6 mL
20% acrylamide, 1% bisacrylamide -
Acetic acid 1.5 mL
10 M Urea 3.32 mL
Thiourea 10.5 mg
H2O2 67.5 µL
H20 Up to 12 mL
SDS-PAGE SAMPLE BUFFER
Reagent 2x (10 mL) [1×] Urea 4.8 g 4 M
Acetic Acid 0.5 mL 2.5 %
β-mercaptoethanol 14 µL 10 mM
Methyl green Spatula tip -
Sample preparation
In some instances, in order to remove the high concentration of salt in the protein
samples that could affect the resolution of the electrophoresis, the trichloroacetic acid
(TCA)/acetone precipitation method was used. The samples were treated according to
the protocol described next.
Trichloroacetic acid (TCA) was added to the samples up to a final concentration of 25%.
Samples were placed on ice for 15 min and then centrifuged at 13,000 rpm for 5 min
at 4°C (microfuge). The supernatant was carefully discarded and the sediment was
washed with 1 mL of acetone and mixed (vortex). Samples were centrifuged at 13,000
rpm for 5 min at 4°C (microfuge), the supernatant was carefully discarded and samples
were dried. Samples were resuspended in H2O milliQ®. 2x AU-PAGE sample buffer
(Table 2-5) was added to each protein sample and mixed. Each sample was loaded
using a Hamilton syringe. Syringe must be thoroughly rinsed with ddH2O between
applications to avoid cross contamination of different samples.

Chapter 2
92
Table 2-6. AU-PAGE staining and destaining solutions.
AU-PAGE COOMASSIE® STAINING SOLUTION
Reagent Volume (2 L) Concentration Methanol 1 L 50%
Acetic Acid 200 mL 10 %
Coomassie® Blue R-250 Dye 5 g 0.25 % 1.
AU-PAGE DESTAINING SOLUTION
Reagent Volume (2 L) Concentration
Methanol 1 L 50%
Acetic Acid 200 mL 10 %
Gel staining and destaining protocol is described in section 2.2.1.
2 .2.3 Electrophoretic Mobil ity Shift Assay (EMSA)
The gel electrophoresis mobility shift assay (EMSA) is used to detect protein complexes
with nucleic acids. The principle of EMSA is that DNA with a bound protein migrates
through a polyacrylamide gel more slowly than the corresponding free unbound DNA.
This technique is simple to perform. Solutions of protein and nucleic acid are combined
and incubated for a period of time. The resulting mixture is subjected to
electrophoresis under native conditions through polyacrylamide gel. If the protein is
capable of binding to a given DNA sequence, the complex is formed. The speed at
which the molecules (and combinations thereof) move through the gel is determined
by their size and charge. Consequently, after electrophoresis, DNA-protein complexes
migrate less than the corresponding free nucleic acid.
Under appropriate conditions, EMSA can provide quantitative data for the
determination of binding stoichiometries, affinities and kinetics. The complex
stoichiometry varies according to the DNA sequence and the protein nature. Then, a
range of DNA:protein ratios are tested in order to find conditions that best stabilize
the DNA- protein complex. A negative control lane (DNA probe without protein

MATERIALS AND METHODS
93 93
present), which is observed as a single band corresponding to the unbound DNA
oligonucleotide, is also loaded in the gel.
Sample preparation
EMSA sample buffer does not include tracking dye to prevent any interference in the
formation of complexes.
A set of samples containing different DNA-protein ratios were prepared and mixed
softly in 0.3x TBE containing 3% glycerol. The mixtures were incubated at least 30 min
at 4°C to allow the complex formation.
Table 2-7. EMSA Gel composit ion.
EMSA GEL (10 cm × 15 cm × 1 .5 mm thick)
Reagent Resolving (12 mL) (8% acrylamide, 0.2% bisacrylamida)
30% acrylamide, 0.8% bisacrylamide 3.2 mL 5× TBE 54 g Tris Base, 27.5 boric acid, 20 mL 0.5 M EDTA, pH 8
0.8 mL
H20 7.83 mL
10 M Urea 3.32 mL
10% APS 60 µL
TEMED 12 µL
Electrophoresis
EMSA gel recipe is listed in Table 2-7. The electrophoresis assembly and gel casting are
described in section 2.2.1. EMSA running buffer is 1× TBE pH 8 (see buffer composition
in Appendix B).
EMSA gels are native gels (as opposed to SDS- and AU-PAGE); any factor that can
disturb the integrity of labile DNA-protein complexes is not allowed. Thus, a
prerunning step is needed to remove all traces of ammonium persulfate, to
distribute/equilibrate any special stabilizing factors or ions from the running buffer,
and to ensure a constant gel temperature. Also, as proteins and oligonucleotides are

Chapter 2
94
temperature-sensitive, EMSA has to be performed at 4°C in a cold room and
electrophoresis assembly is placed on ice.
The gel was pre-run at a constant voltage (75 V) for at least 60 min on ice in a cold
room. After the prerunning step, samples were loaded gently and quickly using a
Hamilton syringe and the voltage was re-applied. Electrophoresis was performed at
125 V constant voltage for 45-60 minutes, depending on the size of the DNA and
complexes.
DNA detection
SYBR® Gold nucleic acid gel stain (Invitrogen™) is a sensitive fluorescent stain that
allows the detection of DNA in electrophoretic gels using standard ultraviolet
transilluminators. SYBR® Gold stain is not only less mutagenic than ethidium bromide
(the DNA-intercalator compound commonly used to detect DNA), but also has a
detection sensitivity comparable to that of ethidium bromide. Therefore, SYBR® Gold
nucleic acid gel stain for DNA detection in EMSA gels was used.
Gel was immerse in a staining solution containing 50 mL 0.3x TBE containing 5 µL
SYBR® Gold. The container was covered with aluminum foil or placed in the dark to
protect the staining solution from light. Then, it was gently agitated for 20 min at
room temperature on an orbital shaker. Stained gels were visualized and imaged in a
UV transilluminator using a Gel Doc XR System (Bio-Rad).
2 .2.4 Agarose Gel Electrophoresis
Agarose gel electrophoresis is the most effective electrophoresis method for separating
DNA fragments of varying sizes (for visualization and/or purification). The matrix is
comprised of agarose, one of the two main components of agar. Molecular sieving is
determined by the size of pores generated by the bundles of agarose in the gel matrix,
then the higher the concentration of agarose, the smaller the pore size.
Electrophoresis uses an electrical field to move the negatively charged DNA through an
agarose gel matrix toward a positive electrode. Longer DNA fragments migrate through

MATERIALS AND METHODS
95 95
the gel more slowly than shorter ones. An estimation of the DNA oligonucleotides
lengths can be determined if a DNA ladder marker (a collection of DNA fragments of
known lengths) is also loaded on the gel.
1% Agarose gel preparation
1g agarose was mixed with 100 mL 1× TAE (see buffer composition in Appendix B) in a
microwavable flask and microwaved for 1-3 min until the agarose was completely
dissolved. The solution was cooled down to about 50°C (e.g. until you can comfortably
keep your hand on the flask) and 5 µL SYBR™ Safe DNA Gel Stain (Invitrogen™) were
added for visualization of DNA (1 µL per 20 mL of buffer).
Both ends of the gel tray were sealed with tape and the dissolved agarose was poured
slowly into a gel tray (cast) with the corresponding comb in place. Bubbles formation
that will disrupt the gel should be avoided. When necessary, bubbles were pushed
away from the gel with a pipette tip.
Electrophoresis
There are many types of electrophoresis units, but the horizontal electrophoresis unit is
the most commonly used unit for separating DNA molecules on agarose gels. The
horizontal electrophoresis apparatus is basically a rectangular-shaped box with
electrodes at each end where the gel is completely submerged in buffer during
electrophoresis.
Once the gel solidifies in the casting tray, the tape and comb were removed and the
gel was placed in the electrophoresis chamber. Enough running buffer (1× TAE) was
added to completely cover the gel. Samples were loaded in consecutive wells using a
micropipete. The safety cover was attached, leads were connected to power source and
the gel was run at constant voltage (90-100 V) for 45-60 min until the tracking dye is
about 2-3 cm from the bottom of the plates.

Chapter 2
96
2 .2.5 DNA Supercoil ing Assays
DNA topological changes such as bending, compaction and negative supercoiling can
be induced by chromatin proteins and are related to crucial biological processes
(Gilbert & Allan, 2014).
The supercoiling ability of the HMGA1a(∆50-91) protein was evaluated by measuring
the degree of circular DNA supercoiling, which indicates whether the DNA-bending
activity of this protein is important enough to cause a topological stress.
First, the HMGA protein is incubated with previously relaxed circular DNA. Alterations
in the DNA conformation due to the presence of the protein, may force a change in the
DNA torsion or twisting, forming supercoils. Topoisomerase I is added, which dissipate
the topological stress by unwinding the helix. Finally, the HMG protein is removed as
well as the topoisomerase I, thus the twisting caused by the protein is removed but the
changes caused by the topoisomerase remain. Thereby, DNA is rewound and there will
be compensatory negative supercoils if the protein, in first instance, caused the
topological change.
The resulting samples are analyzed by electrophoresis in an agarose to visualize the
change in the degree of supercoiling of a circular DNA induced by the incubation of
different concentrations of HMG protein (see Figure 2-4).
Figure 2-4. Scheme of a supercoi l ing assay.

MATERIALS AND METHODS
97 97
Supercoiling Assay Protocol
The reaction buffer, water, supercoiled circular DNA (see Table 2-8) and 0.5 µL
topoisomerase I were mixed and incubated 1 h at 37°C in a water bath in order to
relax the plasmid. Once incubation was performed, the corresponding concentration of
protein was added to each sample as well as 0.5 µL topoisomerase I. The mixture was
incubated 1 h at 37°C in a water bath. 1 µL 10% SDS and 0.5 µL 10 mg/mL proteinase
K were added to the sample. The mixture was incubated 30 min at 37°C in a water
bath. 4.3 µL 6x TPE (see Appendix B) was added to the samples (4 µL to the SC control).
The electrophoresis was performed in a 1% agarose gel using 1× TPE as running buffer
for around 2 h at constant voltage of 90 V. DNA staining was carried out with 1× TPE
containing SYBR® Gold (Invitrogen™) for 30 min with shaking. Then, the gel was
visualized with a UV transilluminator and photographed.
Table 2-8. Reaction samples for a supercoi l ing assay.
DNA/Protein Ratio [M] SC a 1:0 1:300 1:1000 1:3000
0.8 µg/µL DNA [µL] 3.75 3.75 3.75 3.75 3.75
50 µM protein [µL] - - 0.6 2 6
10x Reaction buffer [µL] 2 2 2 2 2
H2O 14.25 13.25 12.65 11.25 7.25
Final Volume [µL] 20 19 19 19 19
Different 10x Reaction buffers were used containing 50 mM MgCl2 and 350 mM Tris-HCl pH 7.5 varying the ionic strength with different concentrations of NaCl (0.8-1.9 M). a SC, a control sample of supercoiled circular DNA without adding topoisomerase I, SDS nor proteinase K.
2 .3 N-phenylbenzamide Bis(2-aminoimidazoline)
Derivatives
The antiparasitic minor groove binding drugs (MGBD) evaluated within this research
work are a series of eleven diphenyl-based bis(2-aminoimidazolinium) compounds
(Table 2-9): the lead compound FR60 (Ref 1), nine chloro, fluoro, and pyridinyl
derivatives (Refs 2-10), and one CD27 N-hydroxy derivative called CDIV32 (Ref 11). The
chemical structures of these dicationic compounds are listed in Table 2-9.

Chapter 2
98
Table 2-9. Chemical structure of the bis(2-aminoimidazoline) compounds studied in this work.
REF Compound Structure Salt MW
1 FR60
2 HCl 436.3
2 CRMV60
2 HCl 454.3
3 JNI33
2 TFA 625.9
4 CRMV65
2 HCl 454.3
5 JNI18
2 TFA 625.9
6 CRMV49
2 HCl 454.3
7 JNI17
2 HCl 470.8
8 CRMV50
2 TFA 609.5
9 CRMV45
2 TFA 625.9
10 JNI32
2 TFA 560.1
11 CDIV32
2 HCl 440.3
The compounds were prepared as dihydrochloride salts (2 HCl) or ditrifluoroacetates (2 TFA = CF3CO2H).

MATERIALS AND METHODS
99 99
These promising antiprotozoal agents were synthetized by Dr. Dardonville’s group at
the Institute of Medicinal Chemistry, CSIC, Madrid. The synthesis of the lead FR60 (1)
was performed following a procedure described previously in Rodríguez et al., 2008.
The FR60 derivatives (compounds 2-10) were synthesized as described in Ríos Martínez
et al., 2015b. Compound CDIV32 (11) was synthesized as described Nieto Garrido et al.
2011.
The samples are dissolved in dimethylsulfoxide (DMSO) (Sigma-Aldrich) by stirring
vigorously with a vortex at atmospheric pressure and room temperature until
completely homogeneous. 10 mM stock solutions in DMSO are stored at -20°C.
Dilutions from the stock solution are performed by dilution with the corresponding
buffer or media according to the experiment to be performed, to obtain a final amount
of DMSO in the dissolved solution >5%.
2.4 DNA Oligonucleotides
Due to the high flexibility and polymorphism of AT-rich DNA, short oligonucleotides
with maximum 23 bp were used (Table 2-10). Longer oligonucleotides induce disorder
and complicate the aim of obtaining high quality ordered crystals. The length of the
oligonucleotide, together with the sequence and oligonucleotide stacking interactions
can influence periodicity and packing in the crystal by changing the length of the
helical repeat unit. Due to this fact a considerable portion of structures in the PDB are
decamers and dodecamers.
DNA samples for crystallography must comply high purity standards. Any impurity (as
contaminant particles or degradation) could influence the crystallization process and
disrupt the internal periodicity in the crystal. The oligonucleotides used for
crystallographic essays must be in the range of 95 to 98% purity.
All the oligonucleotides used were synthesized at the Genomic Platform of the Pasteur
Institute as the ammonium salt on an automatic synthesizer by the phosphoramidite
method and purified by gel filtration and reverse-phase HPLC.

Chapter 2
100
DNA powder samples were disolved in 25 mM sodium cacodylate pH 6.5, as it prevents
the degradation of the sample due to its antimicrobial effect. Concentration of the
oligonucleotide sample is verified by spectrophotometric quantification using the
Lambert-Beer law (Equation 2-1).
! = ! ! !
Equation 2-1. Lambert-Beer Law.
where A is absorbance at a given wavelength, C is the concentration in [M], l is the
path length, which is usually 1 cm for typical cuvettes and ε is the extinction
coefficient in [cm-1M-1] calculated based on the nearest-neighbor model (Cantor et al,
1970). In our case there are no contributions from DNA modifications and ε can be
obtained with Equation 2-2. The data for ε are given at neutral pH, 25°C and 260 nm
in Table 2-10.
!! = 2 !!"#$%&'()"!'@!!!!
!− !!"#$%&'()%@!
!!!
!
Equation 2-2. Extinction coeff icient equation by Cantor et al . (1970).
Table 2-10. Extinction coeff ic ient (ε) at 260 nm, neutral pH and 25°C.
DNA ε [L ·mmol -1cm -1] DNA ε [L ·mmol -1cm -1]
pdA 15,4 dCpdG 9,0
pdC 7,4 dCpdT 7,6
pdG 11,5 dGpdA 12,6
pdT 8,7 dGpdC 8,8
dApdA 13,7 dGpdG 10,8
dApdC 10,6 dGpdT 10,0
dApdG 12,5 dTpdA 11,7
dApdT 11,4 dTpdC 8,1
dCpdA 10,6 dTpdG 9,5
Values from Cantor et al. (1970).
Absorbance is read in the range approximately of 210 nm to 310 nm in a
spectrophotometer to verify maximum absorbance wavelength, which typically is
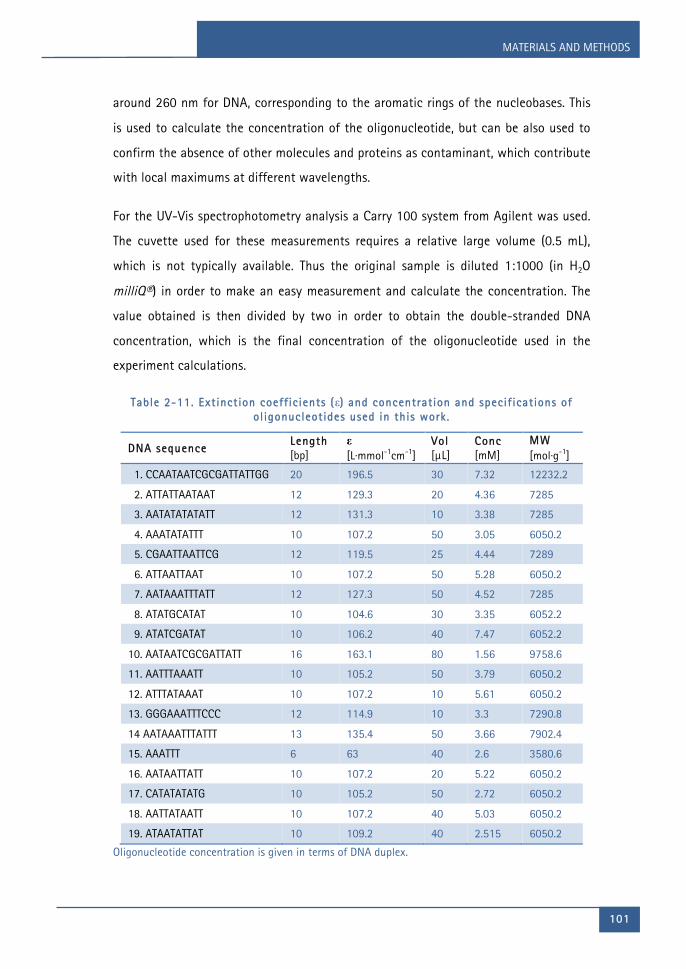
MATERIALS AND METHODS
101 101
around 260 nm for DNA, corresponding to the aromatic rings of the nucleobases. This
is used to calculate the concentration of the oligonucleotide, but can be also used to
confirm the absence of other molecules and proteins as contaminant, which contribute
with local maximums at different wavelengths.
For the UV-Vis spectrophotometry analysis a Carry 100 system from Agilent was used.
The cuvette used for these measurements requires a relative large volume (0.5 mL),
which is not typically available. Thus the original sample is diluted 1:1000 (in H2O
milliQ®) in order to make an easy measurement and calculate the concentration. The
value obtained is then divided by two in order to obtain the double-stranded DNA
concentration, which is the final concentration of the oligonucleotide used in the
experiment calculations.
Table 2-11. Extinction coeff ic ients (ε) and concentration and specif ications of ol igonucleotides used in this work.
DNA sequence Length [bp]
ε [L·mmol-1cm-1]
Vol [µL]
Conc [mM]
MW [mol·g-1]
1. CCAATAATCGCGATTATTGG 20 196.5 30 7.32 12232.2
2. ATTATTAATAAT 12 129.3 20 4.36 7285
3. AATATATATATT 12 131.3 10 3.38 7285
4. AAATATATTT 10 107.2 50 3.05 6050.2
5. CGAATTAATTCG 12 119.5 25 4.44 7289
6. ATTAATTAAT 10 107.2 50 5.28 6050.2
7. AATAAATTTATT 12 127.3 50 4.52 7285
8. ATATGCATAT 10 104.6 30 3.35 6052.2
9. ATATCGATAT 10 106.2 40 7.47 6052.2
10. AATAATCGCGATTATT 16 163.1 80 1.56 9758.6
11. AATTTAAATT 10 105.2 50 3.79 6050.2
12. ATTTATAAAT 10 107.2 10 5.61 6050.2
13. GGGAAATTTCCC 12 114.9 10 3.3 7290.8
14 AATAAATTTATTT 13 135.4 50 3.66 7902.4
15. AAATTT 6 63 40 2.6 3580.6
16. AATAATTATT 10 107.2 20 5.22 6050.2
17. CATATATATG 10 105.2 50 2.72 6050.2
18. AATTATAATT 10 107.2 40 5.03 6050.2
19. ATAATATTAT 10 109.2 40 2.515 6050.2
Oligonucleotide concentration is given in terms of DNA duplex.

Chapter 2
102
The values of extinction coefficients and concentrations calculated for the
oligonucleotides stocks prepared during this work are listed in Table 2-11.
2 .5 Crystall ization of Macromolecules
Crystallization of macromolecular complexes represents a crucial step for the analysis
by X-ray crystallography, as it requires well-ordered single crystals of adequate size.
Obtaining crystals does not necessarily imply that they are well ordered and have the
appropriate atomic periodical arrangement for structure resolution by X-ray
crystallography. This can result in poor diffraction patterns with low resolution. In
particular, for AT-rich DNA, getting the right crystallization conditions to obtain
diffraction-quality crystals is not an easy task.
Figure 2-5. General scheme for DNA- l igand crystal l ization

MATERIALS AND METHODS
103 103
The successful crystallization of macromolecules relies on several factors such as the
physicochemical properties of the oligonucleotide, the purity of the samples,
concentration, pH, temperature, ionic force, precipitants and additives, control of mass
transfer (diffusion, convection) and pressure, and presence of electric and magnetic
fields, among others.
The determination of the 3D structure by X-ray crystallography includes basically the
following steps: (1) obtaining the target macromolecule (design and synthesis or
expression, and purification), (2) search of initial crystallization conditions, (3)
optimization of crystal quality, (4) diffraction data collection, (5) data analysis and
processing, (6) structure determination, (7) refinement of the 3D model and (8)
validation. Figure 2-5 represents a general scheme of the process for DNA-ligand
crystallography.
2 .5.1 Crystall ization Fundaments and Parameters
The crystallization of macromolecules is a multi-parametric process involving three
main steps:
1. Nucleation: the most difficult problem to address since it occurs when a
specific number of macromolecules associate to form a critical mass that
breaks the energetic barrier of a first-order phase transition and precipitates
to the solid state as a nucleus. This step takes place when the solution is
supersaturated, in a meta-equilibrium called labile zone to avoid amorphous
precipitation (Figure 2-6).
2. Crystal growth: once a nucleus has formed, it serves as a scaffold center for
incorporation of the macromolecules in a crystal network, usually from a
monomeric state. This step takes place in a supersaturated state in meta-
equilibrium, near the phase boundary called metastable zone (Figure 2-6). A
solution reaches this state after nucleation, a consequence of the
concentration decrease, as solute escapes to the solid state by forming

Chapter 2
104
nucleus. The metastable phase favors diffusion conditions for ordered
incorporation of molecules as layer addition over crystallographic faces.
3. Halt in growth (or cessation of growth): after consumption of excess
macromolecules during crystal growth, concentration decreases, reaching
equilibrium when thermodynamic energetics are not enough for solute to
pass to solid state, resulting in the stop of crystal growth.
F igure 2-6. Schematic representation of a 2D phase diagram for the crystal l ization of macromolecules showing the compound solubil ity as function of precipitant. Labi le and metastable zones, where nucleation and crystal growth respectively
occur , are indicated.
The whole crystallization process can be suitably visualized in a two-dimensional phase
diagram (Figure 2-6), representing the stable states as a function of two crystallization
variables: macromolecule concentration and precipitant concentration. When the
concentration of a protein solution is brought above its solubility limit, the solution
becomes supersaturated. Depending on the level of supersaturation this zone of the
diagram can be divided into three regions: very high supersaturation (precipitation),
where molecules form amorphous aggregates; intermediate supersaturation (labile),
where nucleation occur; and lower supersaturation (metastable), where only crystal
growth is accomplished.
Supersaturation is the variable that drives the crystallization and determines their
occurrence and extent as well as the kinetics that govern them. The best crystallization
strategy is to induce nucleation at the lowest level of supersaturation, just within the

MATERIALS AND METHODS
105 105
labile region. Regardless the variable condition manipulated to reach to this point, this
should be done slowly in order to obtain well-ordered crystals. If this process takes the
system excessively fast to supersaturation, protein aggregates having short-range
order or disordered amorphous precipitate not suitable for X-ray diffraction may
appear. On the other hand, if the system never reaches supersaturation, it will not
crystallize.
The evolution of the three crystallization steps during the process usually generates
diffusion from concentration gradients of precipitant, water and other components
present in the crystallization solution. This process slowly brings the solution to the
supersaturated state for nucleation, while crystal growth compensates for solute lost,
extending the residence time in the metastable phase for better crystal growth.
Changing the temperature, pressure or both can also change the thermodynamic state.
The temperature control and variation is performed carefully according to the
evolution of the crystallization process.
For the here presented work, the crystallization system is constantly modified as the
process evolves by changing the concentrations in the equilibrium solution, in
particular for the precipitant. The relationship between macromolecule solubility and
precipitant concentration is a function of the type of precipitant, but usually,
macromolecules solubility decreases proportionally as the precipitant concentration
increases (Benvenuti & Mangani, 2007).
The crystallization of biomacromolecules is an exceptionally complex process. Some
variables that influence crystallization of macromolecules are the concentration of
components in the solution (e.g macromolecule concentrations and ratio, precipitants,
additives), pH, temperature, ionic strength, pressure, electric fields, magnetic fields,
properties that affect mass transfer (e.g. density, viscosity, volume, geometry, diffusion,
convection), sample integrity and purity (i.e. heterogeneity of sequence and length, and
presence of other molecules), contaminant, biochemical and biophysical properties of
the macromolecule (eg. hydrophobicity, electrostatic interactions, conformational
changes, flexibility, intermolecular interactions, ligands interaction). Additionally, there

Chapter 2
106
are experimental contributions and external factors that perturb the system (e.g.
vibrations) and influence crystallization. Therefore, this multi-variable process is largely
empirical in nature, and demands patience, perseverance and intuition.
The large number of variables involved in crystallization makes this process particularly
hard to control and specific for the crystallization of each macromolecule. Then, the
number of possible screening conditions turns almost infinite when defining rationally
the set of parameters to crystallize a given macromolecule. For this reason, commercial
kits based on previous successful conditions described in literature have been
developed. One of such kits is the Hampton Natrix HR2-116 (Scott et al., 1995), which
can be used for the initial test. In any case, crystallization is commonly an iterative
process where crystallization conditions are modified based on results of tested
conditions.
The main parameters that are controlled during crystallization are:
§ Oligonucleotide concentration; we have worked with oligonucleotide
concentrations between 0.1 mM and 0.4 mM. A high concentration of
oligonucleotide will reach supersaturation easily with little precipitant,
whereas low oligonucleotide concentration will require more precipitant.
§ HMG protein concentration; high protein concentration is normally used for
crystallization in a range of 3 to 10 µg/µL. To carry it out samples were
concentrated by ultrafiltration.
§ Sample purity and homogeneity; very high macromolecule purity is required
for crystallization. Impurities or heterogeneities can prevent crystallization or
introduce irregularities limiting the quality of the obtained crystal. In the
case of proteins, purity and homogeneity is determined by electrophoretic
methods (see section 2.2). For DNA oligonucleotides, samples from the
Pasteur Institute guarantee purity level of 98-99%. DNA stocks are conserved
in sodium cacodylate to prevent bacteria or fungi contamination.
§ pH; the role of pH in macromolecule crystallization is very important. A
change of pH can modify solubility of the macromolecule, and more

MATERIALS AND METHODS
107 107
dramatically when the pH is close to its pKa. More importantly, pH affects the
conformation and stability of the macromolecule, and plays a key role in the
binding specificity, molecular hydration and in the interactions with small
molecules and ions by modifying the intramolecular interactions in the
crystal. Defining the right pH depends on which are the most beneficial
configuration of conformation and intermolecular interactions for the
crystallization of the desired complex, which vary from macromolecule to
macromolecule. In particular for DNA, a starting point would be a range of
pH from 6 to 7.5, which ensures base pairing, and has demonstrated good
crystallographic results also for proteins.
§ Ionic strength; the ionic concentration not only helps to stabilize the helical
structure of DNA and the tertiary structure of proteins, but also stabilizes
intermolecular interactions generated by packing in the crystal. Different ions
have different affinities for specific groups of nucleobases and amino acid R-
groups. Thus, defining the right ions for crystallization depends on the
physicochemical properties of the oligonucleotide and/or protein, and the
intermolecular and intramolecular interactions generated during
crystallization, which are not easy to predict. Besides, the ionic strength
modifies the solubility of the macromolecules.
§ Drugs; DNA binding drugs are crystallized in complex with DNA in order to
determine the specific interactions and structural features that confer a
specific function. The presence of certain ligands can influence crystallization;
they can stabilize specific configurations beneficial for the crystal packing,
but can also prevent crystallization by the formation of unspecific
interactions or steric hindrance. Drug samples must be perfectly dissolved
and present high purity (see section 2.3).
§ Temperature; it affects the solubility of the macromolecule, but more
importantly, it also affects its stability and secondary structure. In the case of
DNA, the temperature must be below the melting temperature to avoid
denaturation. Some AT-rich oligonucleotides have melting temperatures
around room temperature (25°C), so that it is convenient to use lower

Chapter 2
108
temperatures for crystallization, usually between 4°C and 21°C when
crystallizing DNA-drug complexes. For HGM proteins, we always work at low
temperature (4°C) to ensure their stability.
§ Precipitants; they change the solubility of the macromolecules to reach
supersaturation and produce nuclei that later could grow as crystals. For DNA
and protein crystallization, the most common precipitants are 2-methyl-2,4-
pentanediol (MPD or Hexylene glycol) and polyethylene glycol (PEG), which
work also as cryo-protectants. Additionally co-precipitants, such as isopropyl
alcohol, can be used to force the system to reach supersaturation and later
keep it in the metastable zone. Spermine is commonly used as a co-
precipitant for DNA. It is a symmetric lineal polyamine that has its amino
groups positively charged at pH 6-7.5 and contributes to neutralize the
negative charges of the phosphate backbone and stabilize the helical
structure.
During this research work, crystallization conditions were based on previous successful
assays and are described next.
The droplets were prepared to a final volume of 3-5 µL. The pH screening values were
6.0, 6.5, 7.0, and 7.5, using buffers such as sodium cacodylate, potassium cacodylate,
HEPES and Tris-HCl. For DNA-drug complexes, the typical starting point was pH 6.5
using sodium cacodylate above 25 mM.
The oligonucleotide is dissolved in the buffer containing determined ions needed for
annealing process, ensuring correct base pairing and conformational homogeneity. The
divalent ions used for crystallization were magnesium (Mg2+), manganese (Mn2+) and
calcium (Ca2+) and ammonium (NH4+). The anions used were chloride (Cl2-) and acetate
(CH3-COO-). Ion concentrations between 5 to 20 mM were used, since higher
concentrations may lead to precipitation or denaturation.
Temperatures used for DNA-drug crystallization were: 4°C, 8°C, 11°C and 16°C.
Temperature was modified depending on the first screening result, usually starting at
11°C. When droplets showed numerous crystalline nuclei, increasing the temperature

MATERIALS AND METHODS
109 109
was beneficial to obtain fewer nuclei that lead to the growth of the adequate size
crystals. Temperature changes were always made, in steps, transferring to the next
lower temperature and left until equilibrium before transferring to the next
temperature if required. DNA-protein crystallization was performed at 4°C.
Precipitants used were MPD and PEG 3350. A common practice is to set the initial
precipitant concentration relatively low (typically at 20%) and wait until the system
reaches equilibrium. Then, increments of 2 or 3% are performed until equilibrium is
reached again, repeating this process until nucleation. When crystals are growing,
precipitant concentration can be incremented in steps of 0.5-1% to promote crystal
growth.
For crystallization of DNA, spermine as co-precipitant is occasionally added, in a molar
ratio between 2:1 (DNA/spermine) to stabilize the helical structure while contributing
to reach supersaturation. Other compounds used as co-precipitants are isopropyl
alcohol in 3-10% concentration.
Commercial crystallization conditions were used mainly for the crystallization of the
DNA-protein complex. The tested conditions were: Hampton Natrix HR2-116 (Scott et
al., 1995): 7, 10, 15, 16, 22, 25, 31, 34, 42, 43, 46, and 48.
For the crystallization of the DNA-drug complex, the drug and the DNA were usually
preincubated in buffer to promote interaction for 1-2 hours, while DNA-protein
complex was preincubated from 1 hour to overnight periods.
In order to verify the DNA-protein complex formation, electrophoretic mobility shift
assay (EMSA) was performed (see section 2.2.3), not only to detect the DNA-binding
protein activity but also to evaluate the binding stoichiometries, which provide
information of conditions that best stabilize the DNA-protein complex. For the
crystallization of DNA-HMG protein complexes, DNA/Protein molar ratio of 1:1, 1:2,
1:3, 1:4 and rarely 1:8 were used.

Chapter 2
110
2 .5.2 Crystall ization Method: Vapor Diffusion
Technique
To obtain high quality single crystals is the basis of X-ray structure determination and
also its limiting step. For this reason, multiple different macromolecular crystallization
methods have been described, which use different approaches to control mass transfer
and concentration of all components of the system to reach supersaturation for
crystallization. The selection of the method employed depends on the particular
requirements and the available amount of macromolecule(s) for each case. The most
used macromolecular crystallization methods are vapor diffusion, microbatch,
evaporation, microdialysis and free-interface diffusion. For the purpose of this research
work, crystallization assays were performed using the technique of vapor diffusion,
which is the most widely used method for macromolecular crystallization.
In this technique, a droplet of the solution of macromolecule, precipitants and
additives in a non-supersaturated state is equilibrated by vapor diffusion against a
reservoir with precipitant and additives at high concentration, the whole in a hermetic
system. This process gradually changes concentration of all components, taking the
system gently to a supersaturated state to obtain well-ordered crystals.
The two typical vapor diffusion set-ups are hanging-drop, where a droplet is placed on
an inverted cover slip, and sitting-drop, where the droplet is placed on a pedestal
(Figure 2-7). Modern crystallization robots use micro-fluidics technologies with the
sitting-drop technique to generate large screens of crystallization conditions using low
volume samples. Frequently, when favorable conditions are found with robots, they
have to be replicated by hand in a larger volume to obtain suitable crystal for X-ray
diffraction. Both set-ups, hanging-drop and sitting-drop, were performed in two
different arrangements, either using a MRC Maxi 48-Well Crystallization Plate (Swissci)
or individual capsules were used for crystallization of DNA-drug and DNA-protein,
(Figure 2-7).

MATERIALS AND METHODS
111 111
Figure 2-7. Schematic representation of the vapor diffusion crystal l ization set-ups used: hanging-drop and sitt ing-drop. This technique has two l iquid phases: (1) the droplet , containing a crystal l ization solution with the macromolecule and (2) the
reservoir , which contains the precipitant solution. A third gaseous phase is used to carry out vapor diffusion.
For the DNA-HMG protein complex study, screens of crystallization conditions were
carried out using 48-well plates with 3 µL droplets, containing different defined
concentrations of oligonucleotide and protein, buffer, ions, precipitant and other
additives. The reservoir is filled with 200 µL of the precipitant solution at high
concentration, and then a silylated coverslip is placed on top and sealed to promote
vapor diffusion and reach the equilibrium that will drive the system to the
supersaturated state required for crystallization. In this set-up, the conditions in the
reservoir are not changed during the experiment.
Generally, DNA-protein and DNA-drug complexes crystallization studies were screened
using individual capsules. This method has the advantage that parameters (such as
temperature) can be modified individually for each condition. Another advantage of
this set-up is that once the equilibrium is achieved, if the system has not reached
supersaturation or produced crystals, the conditions in the reservoir can be changed to
generate new equilibrium conditions. As evaporation affects directly the kinetics of
supersaturation (Wilson et al., 1991), the idea of this process is the control of
evaporation to slowly reach supersaturation in the labile zone, to produce only few

Chapter 2
112
nuclei and extend the time in the metastable zone to promote crystal growth. Typically,
a waiting time of 3 to 5 days prior to increasing the precipitant concentration was
adopted. For MPD, it is normal to start at 20% precipitant and carefully increase
concentration stepwise. In particular cases, once crystals appear, precipitant
concentration can be increased to promote crystal growth.
The iterative process of obtaining diffraction-quality crystals can be divided into two
main phases: coarse screening to identify initial crystallization conditions, followed by
optimization of these conditions. There are several parameters and considerations to
take into account during the optimization process of macromolecular crystallization.
During this work, the employed optimization strategies were grid screen and seeding
technique. The first one was carried out starting on a positive condition in which
obtained crystals were not presenting enough quality for X-ray diffraction. The
screening is prepared using closely related experimental conditions to the ones
performed before varying only two factors. If the results are negative, the procedure
continues with a second choice of factors and so on until success is achieved. The
other method employed includes two categories of the seeding technique:
macroseeding and microseeding. Macroseeding consists in the transfer of one crystal
(usually 5-10 µm in size) from a solution in which nucleation and initial growth have
occurred to a less supersaturated solution to slowly continue the growth. In
microseeding method, very small nuclei are transferred to solutions with metastable
supersaturation.
2 .5.3 Crystal Selection and Cryo-Crystal lography
The crystals obtained are continuously evaluated and scored to monitor their evolution.
The best crystals are selected initially based on a visual inspection that evaluates the
size, the shape, and perceivable defects. A second inspection is carried out under
polarized light to evaluate the birefringence of the crystal, which is an indicator of the
internal order of the crystal. It can be used additionally to identify a twinned crystal
(macle) by the presence of two polarizing domains.

MATERIALS AND METHODS
113 113
Cryo-crystallography is a common and indispensable technique for macromolecular
crystallography (Pflugrath, 2004) that is routinely used for single-crystal X-ray
diffraction (section 2.6.3). It allows preserving the best crystals cryo-cooled at 100 K
until diffraction to reduce radiation damage and disorder from thermal motion (Debye-
Waller effect). Selected crystals are fished from the droplet using a cryo-loop that
catches the crystal in a thin layer of liquid by surface tension (see Figure 2-8). A cryo-
protectant, such as glycerol, MPD, ethylenglycol or PEG, may also be added by soaking
the crystal in a solution that contains the cryo-protectant. During this research work,
the crystallization conditions already contained either MPD or PEG, which work as
cryo-protectants, and the crystals were directly transferred from the cryo-loop to a
Dewar with liquid nitrogen for flash freezing immediately after fishing. Fished crystals
are stored and transported at liquid nitrogen temperature until X-ray diffraction.
Figure 2-8. Diagram of a cryo-crystal lography system ( left) and a cryo- loop with a crystal mounted (r ight)
2 .6 X-Ray Crystal lography
The elucidation of the three-dimensional structure of biological macromolecules has
contributed enormously to the current understanding of many basic mechanisms
involved in life processes. X-ray diffraction from high quality crystals remains the most
reliable approach to obtain accurate structural details at atomic resolution. It provides
powerful insight into the molecular mechanisms in which macromolecules interact
with each other to form complex supramolecular assemblies capable of performing
specialized biological functions (Krauss et al, 2013). Moreover, knowledge of binding

Chapter 2
114
sites at atomic detail allows a rational drug design, which is essential for searching of
novel drugs. For this reason, X-ray crystallography has been the main technique used
for DNA-ligand structure determination.
2 .6.1 Crystall ine Structure
X-ray diffraction by crystals is a reflection of the periodicity of crystal architecture.
Crystals represent the most highly ordered state of matter, where molecules are
organized in a three-dimensional network with a periodical motif based on a
geometrical simple unit. The main elements that define this crystal network are the
unit cell, the asymmetric unit and the space group.
The unit cell depicts the simplest portion of the crystalline structure that can be
repeated by translation to reproduce the full crystal. In other words, it is defined as the
smallest parallelepiped containing all the symmetry operations of the space group. It
describes the distribution of atoms in the lattice from a simple motif and it comprises
three vectors that are independent from the coordinate system. These vectors are
described by six lattice parameters (Figure 2-9), the lengths of the cell or vectors
modulus (a, b, c) and the angles between them (α, β, γ). Atomic positions are defined
on this reference frame with the set of atomic position (xi, yi, zi).
Figure 2-9. The unit cel l is the simplest repeating unit in a crystal . It is determined by three vectors , which are described by s ix parameters: the lengths of the cel l (a , b ,
c) and the angles between them (α, β, γ) .

MATERIALS AND METHODS
115 115
The minimum group of atoms that after applying a set of symmetry operations
reproduce the content of the unit cell is called the asymmetric unit (Figure 2-10). The
asymmetric unit does not necessarily correspond to one molecule in the crystal; it can
be defined as fractions of the molecule or multiple molecules, including other atoms
like ions and water. In spite of the fact that the asymmetric unit is a subset contained
within the cell, this does not imply that the entirety of the asymmetric unit must lie
within the boundaries of the unit cell. However, its distribution may be constrained by
the Bravais lattice.
Figure 2-10. Schematic representation of the asymmetric unit as a group of atoms. After applying a set of symmetry operations the unit cel l is obtained; when this cel l
is regularly repeated, the crystal is generated.
Bravais lattices, also referred to as space lattices, are a mathematical concept of an
infinite distribution of discrete points with invariable structure under a certain group
of translations. When the discrete lattice points correspond to atoms, molecules or
ensembles of both, the Bravais lattice defines the crystalline arrangement. For a three
dimensional space, there are seven crystalline systems with fourteen Bravais lattices
(Table 2-12) geometrically defined by the parameters of the unit cell (a,b,c, α, β, γ).
Distribution of the lattice points in the unit cell defines the lattice type as Primitive (P)
with nodes in the corners; Body-Centered (I) with nodes in the corners and the cell
center; Face-Centered (F) with nodes in the corners and the center of faces; Base-
Centered (A, B, or C) with nodes in the corners and one in the center of the
corresponding face; Rhombohedral (R) with nodes in the corners with a = b = c and α
= β = γ = 90°.

Chapter 2
116
Table 2-12. Bravais latt ices .
Latt ice System Latt ice Type Distances Axial Angles
Cubic P, I, F a = b = c α = β = γ = 90°
Tetragonal P, I a = b ≠ c α = β = γ = 90°
Orthorhombic P, I, F, C a ≠ b ≠ c α = β = γ = 90°
Hexagonal P a = b ≠ c α = β = 90°, γ = 120°
Rhombohedral R or P a = b = c α = β = γ ≠ 90°
Monoclinic P, C a ≠ b ≠ c α = β = 90°, γ ≠ 90°
Triclinic P a ≠ b ≠ c α ≠ β ≠ γ ≠ 90°
Moreover, the symmetry operations (reflection, rotation, inversion and improper
rotation) comprise 32 possible point groups or crystal classes. In addition to the point
group, configuration of the atoms in space, which comprises additional symmetry
operations (pure translation, screw axes and glide planes), originate 230 different
space groups, from which only 65 are possible for chiral organic molecules.
Crystallographic vectors and planes in a Bravais lattice are described by the Miller
index notation: h; k; l. The set (hkl) defines a point in reciprocal space; in real space
they denote a plane that intercepts the three points a/h, b/k, c/l. Then, the Miller
indices are proportional to the inverses of the intercepts of the plane with the unit cell.
Any point in the reciprocal lattice can be expressed as a vector (q), which is the sum of
integer multiples of the reciprocal axes (defined as a*, b*, c*).
The Miller indices are very useful to work between the real and reciprocal space, and to
identify the crystal planes that contribute to diffraction.
2 .6.2 Fundamentals of X-Ray Crystal lography
The purpose of macromolecular X-ray crystallography is to determine the three-
dimensional structure of a macromolecule through the reconstruction of the electronic
density of its atoms, which generate the diffraction pattern when the incident
radiation interacts with the crystal. The electron density distribution of the
macromolecular crystal is the Fourier transform of the waves diffracted by the crystal.
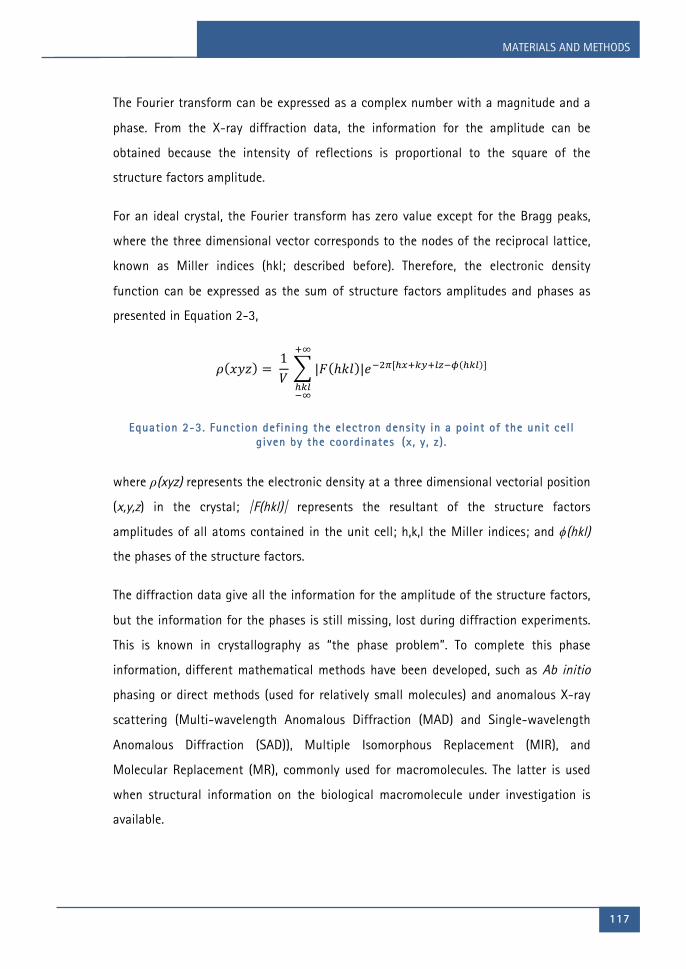
MATERIALS AND METHODS
117 117
The Fourier transform can be expressed as a complex number with a magnitude and a
phase. From the X-ray diffraction data, the information for the amplitude can be
obtained because the intensity of reflections is proportional to the square of the
structure factors amplitude.
For an ideal crystal, the Fourier transform has zero value except for the Bragg peaks,
where the three dimensional vector corresponds to the nodes of the reciprocal lattice,
known as Miller indices (hkl; described before). Therefore, the electronic density
function can be expressed as the sum of structure factors amplitudes and phases as
presented in Equation 2-3,
! !"# = 1! |! ℎ!" |!!!![!!!!"!!"!! !!" ]!!
!!"!!
Equation 2-3. Function defining the electron density in a point of the unit cel l given by the coordinates (x , y , z) .
where ρ(xyz) represents the electronic density at a three dimensional vectorial position
(x,y,z) in the crystal; |F(hkl)| represents the resultant of the structure factors
amplitudes of all atoms contained in the unit cell; h,k,l the Miller indices; and ϕ(hkl)
the phases of the structure factors.
The diffraction data give all the information for the amplitude of the structure factors,
but the information for the phases is still missing, lost during diffraction experiments.
This is known in crystallography as “the phase problem”. To complete this phase
information, different mathematical methods have been developed, such as Ab initio
phasing or direct methods (used for relatively small molecules) and anomalous X-ray
scattering (Multi-wavelength Anomalous Diffraction (MAD) and Single-wavelength
Anomalous Diffraction (SAD)), Multiple Isomorphous Replacement (MIR), and
Molecular Replacement (MR), commonly used for macromolecules. The latter is used
when structural information on the biological macromolecule under investigation is
available.

Chapter 2
118
2.6.2.1 Bragg’sLaw
The Bragg's Law (Bragg and Bragg, 1913) defines the condition for diffraction in terms
of the scattering at a given wavelength.
When X-rays hit an atom, the electromagnetic wave interacts exciting the external
electrons, which emit back the incident electromagnetic radiation in all directions with
the same frequency. In practice, an elastic scattering process dominates the re-emitted
radiation, but it can be slightly affected by various effects (Rayleigh scattering).
In a crystal, the molecules and their atoms are periodically distributed in the crystalline
network. This can be conceptualized as a set of discrete scatterers distributed in
parallel planes separated by a constant distance d (Figure 2-11). If the scattered
radiation from different planes interferes constructively, it would produce a Bragg peak
or X-ray diffraction. The Bragg condition establishes that an interference is
constructive when the phase shift among the emitted radiation by different atoms is a
multiple of 2π. This leads to Bragg's law, described in Equation 2-4:
2! sin θ = !λ
Equation 2-4. Bragg’s Law.
where the path difference for two interfering waves is given by 2dsinθ, and the waves
remain in phase only when this path difference produces a phase shift proportional to
2π; θ is the angle between the incident rays and the diffraction planes, 2θ is the
scattering angle, n is an integer, λ is the wavelength of the x-ray radiation and d
corresponds to the interplanar distance. Consequently, a diffraction pattern is
produced by the cumulative effect of constructive and destructive interference from
reflections in consecutive crystallographic planes.

MATERIALS AND METHODS
119 119
Figure 2-11. Bragg's law determines the angles for coherent scattering. Angle 2θ is the scattering angle, λ is the wavelength and d is the interplanar distance. The
lower beam travels an extra path 2dsinθ for which constructive interference occurs if the path is a multiple of the wavelength (nλ)
Two common problems that enormously complicate the structure resolution are the
presence of pseudo-translation and twinning. In particular, oligonucleotides with
hexagonal packing have a high tendency to suffer pseudo symmetry and merohedral
twinning (Abrescia & Subirana, 2002).
Pseudo-translation corresponds to two molecules or motifs with similar orientation
that are related by non crystallographic symmetry (NCS). This can be usually identified
in the Patterson map as an off origin peak with high intensity. The position of this peak
can be used to identify its relative displacement and define the pseudo-translation
vector to reproduce the molecule or motif from a known orientation.
In some cases, a special approach can be used to solve the structure by reindexing the
data in a smaller cell (pseudo-cell) based on the translational vector. Here the density
of the two related molecules is added and only one position needs to be identified. This
position may give a clue of molecular packing, which later can be translated into the
original cell. Some modern molecular replacement software like Molrep (Vagin &
Teplyakov, 2010) and Phaser (McCoy et al., 2007) automatically detect any pseudo-
translation peak and use it during MR.
Twinning, on the other hand, occurs when a multiple domain reorientation follows a
transformation related to the crystal lattice but not of the symmetry of the point
group (Koch, 2004).

Chapter 2
120
The presence of twinning adds more symmetry to the crystal, which can lead to define
the crystal in an apparent space group of higher symmetry than the real one. The twin
lattice is formed by the overlap of lattices, which correspond to the different regions of
the crystal. These regions are related by geometrical operations called twin operations,
which include reflection that generates a twin plane, rotation that generates a twin
axis and inversion that generates a twin center. The twin law is the set of twin
operations used to map two regions of a twin.
Polarized light can be used to detect twinned crystals, which never reach, complete
extinction by rotation (crystallization setup can interfere with this detection). In
addition, a visual inspection is useful for the identification of potential twinned
crystals that share a common growth center. Nevertheless, most of the twinned
crystals are not detected until analysis of the diffraction data. Programs such as
SFCHECK (Vaguine et al., 1999), Scala-Pointless (Evans, 2006) and Xtriange (Zwart et
al., 2005) use these methods to detect twinning. Molecular replacement can be
affected by the presence of twinning that adds noise to the rotation and translation.
For the refinement of the model, programs such as SHELX (Herbst-Irmer and Sheldrick,
1998), REFMAC5 (Murshudov et al., 2011) and phenix.refine (Afonine et al., 2005)
already include procedures for twinning treatment.
2.6.2.2 EwaldSphere
A crystal can be defined as a lattice of nodes (reflections) of equal symmetry. The
requirement for constructive interference in a diffraction experiment means that in
momentum (or reciprocal space) the values of momentum transfer where constructive
interference occurs also form a lattice (the reciprocal lattice). The Ewald’s sphere is a
geometrical construction in that reciprocal space (Figure 2-12) that allow to determine
which planes of the crystalline network will result in a diffracted signal for an incident
radiation at a given wavelength λ.
For an incident wave vector Si, if considering no energy is gained or lost in the
diffraction (elastic process), the diffracted wave vector So has the same length as Si.

MATERIALS AND METHODS
121 121
The scattering vector ΔS is defined as ΔS = So - Si, a condition satisfied for diffraction
when reciprocal lattice nodes lie on the sphere of radius 1/λ. This sphere is called the
Ewald’s sphere.
Figure 2-12. Ewald's Sphere of radius 1/λ. In reciprocal space, the latt ice nodes that l ie on the sphere satisfy that the diffraction vector ΔS is the difference between
the incident wave vector Si and the diffracted vector S0. This establ ishes the relationship between the wavelength of the incident radiation (wave vector) with
the reciprocal latt ice of the crystal and the diffraction angle 2θ
The reciprocal lattice nodes are the values of momentum transfer where the Bragg
diffraction condition is satisfied (see section 2.6.2.1). For diffraction to occur, the
scattering vector must be equal to a reciprocal lattice vector.
2 .6.3 Single-Crystal X-Ray Diffraction
For single-crystal X-ray diffraction, a beam of X-rays is focused on a single-crystal of
the macromolecule to produce a diffraction pattern. There are various diffraction
methods to obtain a diffraction pattern such as the Laue method, the Weisenberg
method, the precession method and the oscillation method. The latter is the method
employed during this work.
The oscillation method is the most widely used, especially for macromolecules. In this
method, a single wavelength is used and the crystal is rotated an angle (ϕ) that defines
multiple regions of reciprocal space that intersect the Ewald's sphere to produce
diffraction. Modern detector efficiency allows operating with small angles (ϕ) for each
frame to collect the diffraction from the large unit cells of macromolecules.

Chapter 2
122
For this work, the angle of rotation (ϕ) and resolution (2sinθ max/λ) or detector distance
are defined after performing a preliminary diffraction test. For crystals with low
resolution and few diffractions spots, the angle ϕ is between 8 and 12°. For high
resolution cases ϕ is between 0.5 and 1°. When the orientation of the crystal is not
optimal (e.g. the axial helical axis is perpendicular to the X-rays during all the
collection), the angle (ϕ) can be modified to reorient the crystal.
When a monochromatic X-ray beam is passed through a single crystal, the radiation
interacts with the electrons in the atoms, resulting in scattering of the radiation to
produce a unique image pattern. Multiple images are recorded with an area X-ray
detector as the crystal is rotated in the X-ray beam. The diffraction patterns obtained
have a symmetry center described by the Friedel's law. Friedel's pairs have the same
amplitude due to the symmetry of the Fourier transform (Equation 2-5), where a
complex number and its conjugate correspond to the same real part.
|! ℎ!" |! = |! ℎ!! |!
Equation 2-5. Fr iedel ’s Law.
From this, collecting an angle of 180° will provide the complete data for 360°.
Furthermore, the symmetry of the space group may reduce the angle of collection
required for a complete dataset.
X-rays can be produced by conventional generators, synchrotrons and by plasma
sources. Conventional X-ray sources are sealed anode or rotating anode, which are
commonly used in home source equipment.
A synchrotron radiation source is a very intense, tunable source of radiation that
generates a bright X-ray beam from the velocity change of electrons accelerated nearly
to the speed of light in an electron storage ring.
The single-crystal X-ray diffraction studies were performed using synchrotron radiation
(ESFR - BM16 and ALBA - Xaloc bl13). Relevant specifications of these synchrotron
lines can be found in Appendix C.

MATERIALS AND METHODS
123 123
In a synchrotron, the X-ray beam passes through a monochromator to filter all non-
desired wavelengths. Then, mirrors redirect and concentrate the beam in a focusing
step and finally the beam passes through a collimator. All these processes aim to
obtain a narrow coherent X-ray beam that can be focused in the single-crystal to
generate the best diffraction patterns with high resolution and less possible noise.
The diffracted light is collected using electronic detectors such as point detectors or
area detectors. Area detector was used for this work, which has the advantage of
recording simultaneously multiple diffraction spots, which are essential for
macromolecular crystallography.
The crystal is mounted in a goniometer using a cryo-loop, which should remain all the
time under a stream of liquid nitrogen (at 100 K) to preserve the crystal and to reduce
radiation damage.
The parameters controlled during X-ray diffraction are:
§ The wavelength and size of the beam
§ The centering of the crystal within the X-ray beam on rotation
§ The angle of rotation defines the number of diffraction spots per frame. If the
direct cell is big, then a small angle should be used to avoid spots overlapping
(usually between 0.5 and 1°)
§ The collection angle, which is usually 180°. For more redundancy, 360° can be
used
§ The exposition time, which should be used the longest exposition before
saturating the detector. The time varies considerably with crystal size
§ The distance to the detector, which defines the maximum resolution for the
collected diffractions (small distances for high resolution and large distances
for low resolution)
The recorded set of two-dimensional diffraction patterns corresponding to a different
crystal orientation are collected during single crystal X-ray diffraction and taken to the
next step of the process: data diffraction analysis.

Chapter 2
124
2 .7 Structure Determination
The steps of the structure resolution process are: the determination of the unit cell
parameters and the space group, assignation of the Miller indices to all diffractions in
each frame, integration of diffractions, merge of diffractions and scaling of intensities,
conversion of intensities to amplitudes, initial phase assignation, model building,
model refinement and finally validation. To perform all these steps, computer packages
that include specific software to perform each task are available. A comprehensive list
of software for crystallography can be found in www.iucr.org/resources/other-
directories/software. The software’s packages employed in this work are CCP4 (Winn et
al., 2011) and Phenix (Adams et al., 2010).
2 .7.1 Data Processing
Once X-ray diffraction has been performed on the selected crystals and the data has
been collected, a mathematical analysis has to be done with the diffraction patterns.
The main purpose of analysis and interpretation of diffraction data is to solve the
density function ρ(xyz) in order to solve the structure of the macromolecule(s) studied.
The dimensions of the unit cell, the space group symmetry and the amplitude term
|F(hkl)| for all diffraction directions are information that can be extracted from the
diffraction patterns. The phase ϕ(hkl) of the diffractions cannot be directly determined.
Data analysis is done in two stages: (1) data reduction, which involves indexing,
parameter refinement and integration; and (2) merge and scaling.
Data processing begins with “indexing” the reflections, i.e. to identify the dimensions
of the unit cell and which image peak corresponds to which position in reciprocal
space. To perform indexing and integration the programs iMOSFLM (Battye et al., 2011)
and XDS (Kabsch, 2010) were used.
Each diffraction pattern corresponds to a segment of the reciprocal space and each
spot corresponds to a different type of variation in the electron density. Then, it is

MATERIALS AND METHODS
125 125
necessary to define which variation corresponds to which spot. When indexing, a
reconstruction of peaks in the reciprocal space allows estimating the crystal lattice,
dimensions of the unit cell (a, b, c, α, β, γ) and the orientation of the crystal from a
subset of the data collection. The parameters obtained are refined together with the
rotation matrix, center of the beam, masked regions (e.g. beam stop, ice rings),
mosaicity (i.e. spread of crystal plane orientations), beam divergence, y-scale, twist, tilt
and distance to detector. With the optimized parameters the diffraction spots are
integrated, summarized as full or partial reflections and stored in a single file
containing the unit cell dimensions, space group and for each reflection the Miller
indices, position, intensity and its associated error.
To verify the space group, the integrated reflections must follow the diffraction
conditions of the selected space group, for which the program Pointless (Evans, 2006)
was used. This software confirms conditions for the Laue group, point group and space
group systematically, giving a probability for all possible space groups, with the
additional possibility to reindex the dataset in a new best space group.
To converge multiple observations of reflections and produce a file that contains
averaged (equivalent) intensities for each reflection, the data obtained is then merged
and scaled into a set of unique reflections with the proper intensity value. The
programs used in this part of the process are Scala or Aimless (Evans, 2006).
An indicator used to assess the quality of the dataset is Rmerge defined by Equation 2-6:
!!"#$" =|!!!",!−< !!!" > |!!!"
!!!",!!!!"
Equation 2-6. Rmerge equation.
However, due to its dependence on redundancy, Rmerge may be substituted for an
alternative improved version independent of redundancy parameter: Rmeas (Equation
2-7).

Chapter 2
126
!!"#$ =!
! − 1 |!!!",!−< !!!" > |!!!!!!"
!!!",!!!!"
Equation 2-7. Rmeas equation.
Common criteria for resolution cut-off are the average ratio of signal to noise the
highest resolution shell <I> / σ (<I>) ≈ 2, completeness in all shells > 90% and Rmerge <
0.25 in the highest resolution shell. However, recent approaches recommend to not to
cut resolution, but use all available data and only define the effective resolution (Evans
& Murshudov, 2013; Diederichs & Karplus, 2013).
Finally, using the program TRUNCATE (French and Wilson, 1978) from the CCP4
package (Winn et al., 2011) intensities are converted to amplitudes and placed on an
approximate absolute scale using a scale factor obtained from a Wilson plot, as
presented in Equation 2-8.
!!!" = ! ∙ ! ∙ ! ∙ ! ||! ℎ!" |!
Equation 2-8. Relation between the structure factors and the intensity .
where K is a scale factor (K = C-½); A the absorption factor; L the Lorentz factor; and p
is the polarization factor.
2 .7.2 Phasing: Molecular Replacement Method
To address the phase problem in the case of macromolecular structure determination,
initial phase estimates can be obtained with different methods: multiple isomorphous
replacement (MIR), anomalous X-ray scattering (MAD or SAD phasing) and molecular
replacement (MR).
The MIR method is based on the Patterson method (Patterson, 1934). It uses the
presence of heavy atoms in the crystal by soaking or co-crystallization. These atoms
should not interfere with crystallization or change unit cell dimensions, as the crystal
should be isomorphic with the native form. The heavy atoms act as large scatters that

MATERIALS AND METHODS
127 127
can be identified with the Patterson function. The difference in the scattering
amplitudes from the heavy and the native structures are used to calculate initial
phases.
Anomalous X-ray scattering (MAD or SAD phasing) is based also on the changes in the
intensity produced by the introduction of heavy atoms, but in this case using radiation
at different energies (i.e. different wavelengths). When the frequency of the X-ray
radiation is close to the natural vibration frequency of the electrons in a given atom,
the atom behaves as an anomalous scatterer and the atomic scattering factor is
modified. By analyzing the differences between diffraction data, it is possible to
calculate initial phases.
By taking advantage of the homology between macromolecules, the MR method was
used in this research work. This technique uses a related known structure as a search
model to find the orientation and position of the molecules within the unit cell. The
initial phases are assigned using the phases from the replaced homologous structure.
For proteins, sequence identity with more than 40% is used to select possible
candidate models for MR. For DNA, it is more common to use an ideal model of the
double helix with information inferred from the diffraction data, such as the rise,
rotation and possible packing. The molecular symmetry of the double helix structure
and the similarity between base pairs containing different nucleobases makes it
difficult to rely only on the sequence, and even more if MR is done with a truncated
resolution.
When the MR is performed, the unknown molecule orientation is obtained first with
the rotation function, and then, a translation defined by the interatomic cross vectors
between molecules is applied to place the molecule in the right position within the
unit cell. The main purpose of the MR method is to find these two operators: the
rotation and the translation functions.
The programs used for MR are Molrep (Vagin and Teplyakov, 2010) and Phaser (McCoy
et al., 2007). Each program has its own correlation factor to identify solutions, but

Chapter 2
128
Phaser uses a different approach by computing the likelihood of the solution. These
programs also provide the R and the C parameters, which provide the suitability of
positioning solutions regarding the data, as shown in Equation 2-9 and Equation 2-10.
! = !!!"!"# − ! |!!!"!"#!|!!"
!!!"!"#!!"
Equation 2-9. R parameter calculation.
! = !!!"!"# ! − |!!!"!"#|! ∙ !!!"!"#! ! − |!!!"!"#!|!!!"
!!!"!"# ! − |!!!"!"#|!!!" ∙ !!!"!"#! ! − |!!!"!"#!|!!!"! !
Equation 2-10. C parameter calculation.
where F obs and F calc are the observed and calculated structure factor amplitudes; R is
the reliability index or R factor, which represents the error between the model and
diffraction data; and C is the correlation coefficient between the adequacy of the
model and the observed data.
Besides, for MR of oligonucleotides, not only an existing known structure can be used,
but it is also common to generate a theoretical structure with programs like Turbo-
Frodo (Roussel et al., 1998) or 3DNA (Lu & Olson, 2003). The particular anisotropy of
nucleic acids, together with the typical crystal arrangement of pseudo-continuous
helices and the similarity between base pairs, may turn the process of MR especially
difficult.
For MR of DNA-protein complexes, a strategy that has previously shown its relevance
within the hosting research group was used: perform the MR first with a B-DNA model
theoretically generated, and once this molecule is positioned, the MR of an existing
known structure can be used to find the protein.
In general, if the model replaced is similar, model building can be performed using the
program Coot (Emsley et al., 2010) to fix the model. Computer software like Pymol
(Schrödinger, LLC, 2015) and CCP4mg from the CCP4 package (McNicholas et al. 2011)

MATERIALS AND METHODS
129 129
are molecular visualization programs used to view and manipulate the molecular
model obtained.
2 .7.3 Structure Refinement
The aim of structure refinement is to maximize the consistency between the electronic
density (X-ray diffraction data) and the atomic model. Several specialized optimization
methods have been developed to refine macromolecules, such as the least squares
method, conjugate gradient minimization, maximum-likelihood refinement and
dynamics-based simulated annealing.
The program used for structure refinement is REFMAC5 (Murshudov et al., 2011),
which uses maximum-likelihood restrained refinement. The target function (Equation
2-11) for optimization (ftotal) is defined using Bayesian methods (Equation 2-12), in
terms of a prior knowledge that depends on the geometry of the model (fgeom) and a
likelihood function (fxray) that define the link between the model parameters and the
experimental data. The idea that unifies these two parameter realms is a common
means for assessing the correctness of the model.
!!"!#$ = !!"#$ + ! !!"#$
Equation 2-11. Maximum- l ikel ihood restrained refinement function.
!!"#$%;!"# = !!"#$% + !!"#;!"#$%!!"#
Equation 2-12. Bayesian function.
Geometrical parameters include chemical information of the molecule and its residues,
internal consistency and structural knowledge such as known interatomic distances
and secondary structure. The restrains commonly used for refinement include bond
distances, bond angles, torsion angles, chiral centres, planar groups, van der Waals
repulsions, van der Waals interactions, torsion, H-bond, chain bond B values, long-
range B values and NCS. The latter is very useful if the model is close to correct. NCS
restrains are useful when molecules in the asymmetric unit have highly similar

Chapter 2
130
conformation, but are not related by the crystal symmetry. An alternative to
secondary-structure restraints are the Ramachandran restraints, performed in
phenix.refine to restrain the protein backbone, two different target functions are
implemented based on the (ϕ,�) distributions.
If necessary, REFMAC5 can perform twin refinement. Rigid body refinement is usually
done during MR, but it can also be used for further optimization of the orientation and
the position of the macromolecule in the cell. TLS refinement is used for modeling
anisotropic displacements, a set of rigid body domains are defined in the molecule and
its rigid-body motion is described by translation (T), libration (L) and screw (S) tensors.
TLS should not be used until the latest stages of refinement, since in early stages it
could induce bias and set the system in a local minimum. Real space refinement is
performed using the program Coot (Emsley et al., 2010), where residues can be
optimized or refined to follow an electron density map or difference map.
The correlation between the X-ray data and the model quality equation (Equation 2-9)
is measured, among other factors, by the improvement of two refinement statistics:
Rwork and Rfree. Rfree, is used to assess possible overmodeling (overfitting) of the data. It
is calculated according to the Equation 2-9, but on a subset of data that usually
corresponds to 5% of the total diffractions. This set of diffractions is not used for
refinement. Rwork uses the set of refined diffractions.
During each cycle of refinement the R-factors are reduced and atom positions (x,y,z),
phases ϕ(hkl) and B factors are optimized. Optimum values of R depend on the
resolution, but usually should be below 0.30, and the difference between Rwork and
Rfree should not exceed 0.05. B-factor should be on the order of 100 Å2 for resolutions
around 3 Å and 40 Å2 for resolutions around 2 Å. If after extensive refinement Rwork
and Rfree cannot reach that value, potential reasons could be errors in MR, wrong space
group, twinning or pseudo-translation.

MATERIALS AND METHODS
131 131
2 .7.4 Structure Validation
The final step in macromolecular structure resolution is the validation. In other words,
it is the process of evaluating reliability for the three-dimensional atomic model.
To validate the structure is to locate incongruities, such as bond lengths, bond angles,
dihedral angles, chirality, planarity, short atom contacts, electron density correlation,
B-factors, and conformations.
Common programs used for this purpose are SFCHECK (Vaguine et al., 1999) and
MolProbity (Chen et al., 2010). Using the graphical viewer Coot (Emsley et al., 2010) is
possible to assess and fix geometry parameters, real space correlation, conformations
(i.e. Ramachandran plot) and other parameters. The program 3DNA (Lu and Olson, 2008)
is used additionally for oligonucleotides, to analyze and validate base pairing, sugar
puckering, type of DNA, bending, local base pair parameters, local base pair helical
parameters and local base pair step parameters; all described in Figure 1-4. In this
thesis, the atomic model figures were prepared either with Pymol (Schrödinger, LLC,
2015), Coot (Emsley et al., 2010) or CCP4mg (McNicholas et al. 2011).
Once the molecular structure is analyzed and validated, the final model is deposited in
a crystallographic database providing the atomic coordinates, the related experimental
data and the structure resolution details. The most popular database for
macromolecules is the Protein Data Bank (PDB). Once the PDB validation is complete,
an identification code of the macromolecule or complex is assigned and the atomic
coordinates of this new structure become freely accessible to the scientific community.
2 .8 SPR-Biosensor Assays
Surface plasmon resonance (SPR) binding analysis methodology is an optical technique
used for detecting molecular interactions. It allows the real-time detection and
monitoring of biomolecular binding events of two different molecules in which one is
mobile and one is fixed on a thin film.

Chapter 2
132
Biacore® technology have been employed in this work to perform the SPR binding
analysis. Biacore® is a widely used technique due to its high sensitivity, great precision,
fast assay development and because of the wide range of interactions that this system
supports for analysis. This technology provides high-quality qualitative and
quantitative data in a range of fields such as immunogenicity studies, vaccine
development, biological research, biotherapeutics and small-molecule drug discovery
and development.
In our case, SPR binding analysis is performed to aid in understanding the molecular
interaction between the bis(2-aminoimidazoline) compounds or HMG proteins with
AT-rich oligonucleotides, and to analyze and compare the selectivity, affinity and
kinetics of these DNA-binding molecules.
SPR is a phenomenon that occurs in thin conducting films at an interface between
media of different refractive index. In the case of this work, the media are the glass of
the sensor chip and the sample solution, and the conducting film is a thin layer of gold
on the sensor chip surface. In an SPR experiment, the ligand (interacting molecule) is
bound to the biosensor surface while the analyte is delivered to the surface in a
continuous flow through a microfluidic system (Figure 2-13). When polarized light is
applied to the surface of the sensor chip and is reflected, the intensity of the reflected
light is reduced at a certain incident angle, the SPR angle. The interacting molecules at
the surface of the sensor chip increase the refractive index, which alters the SPR angle
(see Figure 2-13). The detector reveals position changes of the intensity dips in the
wedge of the reflected light corresponding to the SPR angle. Consequently, the binding
of biomolecules to the sensor surface will cause a shift in the SPR angle, which is
directly proportional to the increased mass. The response (signals) generated is
measured in resonance units (RU).
All SPR experiments were performed at the Institute of Medicinal Chemistry, CSIC,
Madrid, using a Biacore® X-100 apparatus (Biacore GE). The sensor chip employed was
Sensor Chip SA from Biacore® due to its suitability to work with nucleic acid ligands.
Sensor Chip SA consists in a dextran matrix to which streptavidin has been covalently

MATERIALS AND METHODS
133 133
attached. Streptavidin is a protein with a high affinity for biotin. Therefore, the surface
of the chip is able to capture biotinylated ligands (Figure 2-15). This binding is
equivalent in stability to covalent immobilization of the ligand.
Figure 2-13. The principle of surface plasmon resonance (SPR) .
The duplex immobilization can be formed through hybridization of an unlabeled DNA
strand that is complementary to a biotin labeled previously immobilized strand.
However, it is possible that some of the non-immobilized complementary strands may
be lost through dissociation. For that reason, DNA hairpins have been employed, where
the two single-strands of the duplex are connected through a loop of nucleotides (see
Figure 2-14).
Figure 2-14. Scheme of a streptavidin-biotin immobil ization of a DNA hairpin used
during SPR experiments .
Once the ligand is immobilized, a set of solutions containing different concentrations
of analyte are injected one by one over the sensor surface using the automated sample
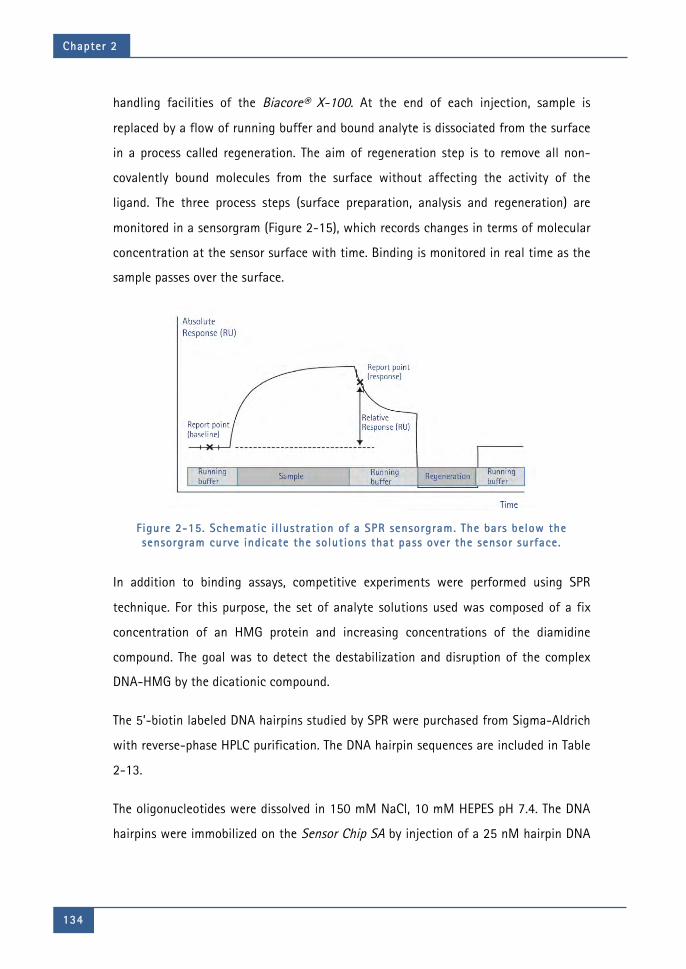
Chapter 2
134
handling facilities of the Biacore® X-100. At the end of each injection, sample is
replaced by a flow of running buffer and bound analyte is dissociated from the surface
in a process called regeneration. The aim of regeneration step is to remove all non-
covalently bound molecules from the surface without affecting the activity of the
ligand. The three process steps (surface preparation, analysis and regeneration) are
monitored in a sensorgram (Figure 2-15), which records changes in terms of molecular
concentration at the sensor surface with time. Binding is monitored in real time as the
sample passes over the surface.
Figure 2-15. Schematic i l lustration of a SPR sensorgram. The bars below the sensorgram curve indicate the solutions that pass over the sensor surface.
In addition to binding assays, competitive experiments were performed using SPR
technique. For this purpose, the set of analyte solutions used was composed of a fix
concentration of an HMG protein and increasing concentrations of the diamidine
compound. The goal was to detect the destabilization and disruption of the complex
DNA-HMG by the dicationic compound.
The 5’-biotin labeled DNA hairpins studied by SPR were purchased from Sigma-Aldrich
with reverse-phase HPLC purification. The DNA hairpin sequences are included in Table
2-13.
The oligonucleotides were dissolved in 150 mM NaCl, 10 mM HEPES pH 7.4. The DNA
hairpins were immobilized on the Sensor Chip SA by injection of a 25 nM hairpin DNA

MATERIALS AND METHODS
135 135
solution with a flow rate of 1 µL/min until 400 RU were reached. Flow cell 1 was used
as reference while flow cell 2 was immobilized with the hairpins in different chips.
Table 2-13. DNA hairpin sequences studied by SPR.
Short name Sequence
[AATAAT_ATTATT] 5’-biotin-GGGAATAATCGCGATTATTCCCCAATAATCGCGATTATT-3’
[AATT] 5’-biotin-CGAATTCGTCTCCGAATTCG-3’
[(AT)4] 5’-biotin-CATATATATCCCCATATATATG-3’
[(CG)4] 5’-biotin-CGCGCGCGTTTTCGCGCGCG-3’
The latter sequence was selected as a control.
SPR binding and competitive experiments were performed at 25°C. Running buffer
used (designated as HEPES 1) contained 10 mM HEPES, 3 mM EDTA, 200 mM NaCl,
and surfactant P-20 at 0.05% (v/v) pH 7.4. Proteins and diamidines compounds
samples were also diluted in HEPES 1 buffer.
Direct binding of the HMGA1a[∆50-91] and HMGB1 Box AB proteins was measured by
injection of increasing the protein concentration over the immobilized DNA surfaces at
a flow rate of 50 µL/min for a period of 60 s followed by a dissociation period of 120 s.
Regeneration of the surface was made with 200 mM NaCl/10 mM NaOH using a flow
rate of 10 µL/min during 30 s. The binding affinity was determined by fitting the
results to a two-site binding model according to the Equation 2-13:
! = !!!! + 2!!!!!!!1 + !!!! + !!!!!!!
Equation 2-13. Two-site binding model .
where r is the moles of bound compound per mole of DNA hairpin duplex, Cf is the free
concentration at the equilibrium, and K1 and K2 the microscopic binding constants.
Direct binding analysis of the bis(2-aminoimidazolinium) compounds was measured by
injection of increasing drug concentrations over the immobilized DNA surfaces at a
flow rate of 18 µL/min for a period of 300 s followed by a dissociation period of 300 s.
Regeneration of the surface was made with 200 mM NaCl/10 mM NaOH using a flow

Chapter 2
136
rate of 10 µL/min during 60 s. The binding affinity was determined by fitting the
results to a two-site binding model according to the Equation 2-13.
The competition experiments were prepared with samples containing a fixed
concentration of HMGA1a and HMGB1 proteins (2 µM) and a series of concentrations
of the bis(2-aminoimidazolinium) compounds ranging from 0.05 to 200 µM (for
HMGA1a) or 400 µM (for HMGB1) in HEPES 1 buffer. The samples were injected to the
immobilized DNA surfaces at a flow rate of 50 µL/min for a period of 60 s followed by
a dissociation period of 150 s. The regeneration conditions were similar to the binding
experiments described above. The binding responses (RU) at steady state were averaged
and normalized by setting the RU with the proteins HMGA1a and HMGB1 alone as
100% binding to DNA and the RU with saturation by the inhibitor as 0%. IC50 values
were determined by fitting the inhibition data with a model according to a
competition system with 1:1 binding stoichiometry for HMGA1a and HMGB1 and two-
site binding for competitor (Equation 2-14)
% proteins binding to DNA = 100 / 1 + !(1 + !!!!)!"!"(1 + !!!!"!")
Equation 2-14. Two-site binding for competitor .
where Kc2 is a macroscopic binding constant for inhibitor binding to DNA, IC50 is the
concentration of the inhibitor that causes 50% inhibition of HMGA1a and HMGB1
binding to DNA, and C is the concentration of inhibitor (Miao et al., 2008).
2 .9 Effect of Bisimidazolinium Diphenyl Compounds
on Trypanosoma brucei
The antitrypanosomal activity and mechanism of action of the bis(2-
aminoimidazolinium) compounds listed in Table 2-9 were evaluated in vitro against the
parasite Tryanosoma brucei during two 4-month research stays with Dr. Harry de
Koning at the Institute of Infection, Immunity & Inflammation, University of Glasgow,
United Kingdom.

MATERIALS AND METHODS
137 137
2 .9.1 Strains and Cultures
Three parasite cultures of Trypanosoma brucei brucei bloodstream forms (BF) were
analyzed: (1) the strain Lister 427/MiTat1.2 (wild-type, Tb427WT); (2) TbAT1-B48,
which is derived from the Tb427WT strain by the deletion of both alleles coding for the
TbAT1/P2 transporter (this s427-WT derivative strain is also called TbAT1-KO) (Matovu
et al., 2003) and also by selection through exposure to increasing concentrations of
pentamidine until the cells also lost the high-affinity to pentamidine transporter,
HAPT1 (Bridges et al., 2007), leading to high resistance to diminazene, pentamidine
and melaminophenyl arsenicals; and (3) ISMR1, which is a clonal, Tb427WT-derived
dyskinetoplastid cell line, adapted to in vitro growth in 1 µM of isometamidium (ISM)
by stepwise increases in the medium concentration of the drug (Eze et al., 2016).
All T. b. brucei strains were cultured under standard conditions (37°C under a
humidified 5% CO2 atmosphere) in HMI-9 medium (Gibco) (Hirumi & Hirumi, 1989)
supplemented with 2 mM β-mercaptoethanol (Sigma-Aldrich) and 10% fetal bovine
serum (FBS; Gibco) at pH 7.4 (see Appendix B). Passage was done three times per week
in vented flasks.
Additionally, three Trypanosoma congolense BF cell lines were studied in this project.
The wild type strain IL300 and two diminazene-resistant cell lines (growing at a
concentration of 800 nM of diminazine) called 6C3 and 4C2. T. congolense strains
were cultured in TcBSF-3 medium (see Appendix B) in log-phase culture at 34°C, 5%
CO2 by changing the medium every 3 days.
All medium was sterilized inside a flow cabinet by filtration through 0,22 µm Millipore
Express PLUS membranes (PES) filters.

Chapter 2
138
2 .9.2 Drug Sensitivity Assays
2.9.2.1 AlamarBlueAssayinBFT.brucei
Fifty percent effective concentrations (EC50) were determined using the fluorescence
viability indicator dye Alamar Blue (resazurin sodium salt, Sigma-Aldrich) as described
(Gould et al., 2008), with small modifications. Resazurin is metabolized by live cells to
resorufin and the fluorescent signal generated is thus proportionate to the number of
live cells (Gould et al., 2008) (Figure 2-16).
Figure 2-16. Conversion of resazurin to resorufin by viable cel ls results in a f luorescent product. The f luorescence produced is proportional to the number of
viable cel ls .
Drug stock solutions (see section 2.2.5) were diluted to 400 µM with HMI-9 medium
with 10% FBS. 200 µL of these test compound dilutions were added to the first well of
rows A, C, E and G of a white-bottomed 96-well microplate (Greiner - Bio-One) (Figure
2-17). A volume of 100 µL of HMI-9 medium with 10% FBS was loaded into all
remaining wells. Up to four drugs could be tested in one plate. Doubling dilutions of
test compounds were prepared, leaving the last well drug-free as a control, before the
addition of an equal volume of cell suspension to each well, to get a final cell density
of 1 × 10⁴ cells/mL. The plates were incubated at 37°C/5% CO2 for 72 h after which 20
µL of resazurin solution (125 µg/mL in phosphate-buffered saline, pH 7.4) were added
followed by another incubation for 24 h.

MATERIALS AND METHODS
139 139
Figure 2-17. 96-well microplate diagram. Arrow explains the way the drugs are doubly di luted down two rows across the plate. DF; drug free, negative control .
Pentamidine and isometamidium were used as positive controls throughout the study.
Viable cells reduce the dark blue dye to a pink colour. The change in fluorescence was
determined using a FLUOstar Optima plate reader (BMG Labtech), at excitation and
emission wavelengths of 530 and 590 nm, respectively. Data were analyzed and
plotted to a sigmoid curve with variable slope using Prism 5.0 (GraphPad). Each
experiment was performed at least on three independent occasions.
2.9.2.2 AlamarBlueAssayinBST.congolense
Alamar blue end point assays were also used to estimate the drug sensitivity in
Trypanosoma congolense cell lines as described in the previous section. Stock solutions
of drugs were diluted to 200 µM with TcBSF-3 medium. Cell density was adjusted to
reach a final density of 2.5 × 10⁵ cells/mL. Diminazene was used as positive control
throughout this study. The plates were incubated at 34 °C + 5% CO2 for 48 h after
which 20 µL of sterile resazurin solution (125 µg/mL in phosphate-buffered saline, pH
7.4) was added to every well, followed by a further incubation of 24 h in the same
conditions. Each experiment was performed at least on three independent occasions.
2 .9.3 Drug Sensitivity Assay using Cell Count
The effects of the bis(2-aminoimidazolinium) compounds on growth of BF
Trypanosoma brucei brucei strain Lister 427 were investigated by incubating cultures

Chapter 2
140
under standard conditions (HMI-9/10% FBS; 37°C, 5% CO2) in the presence or absence
of 0.5, 1, 2.5 and 5 times their EC50 values for up to 48 h. Cells were seeded at a
density of 2 × 10⁴ cells/mL using a haemocytometer. Cells were counted in triplicate at
the following times (h) after initiation of the experiment: 0, 4, 8, 24, 36 and 48.
2 .9.4 Assessment of Cell Cycle Progression in T. brucei
2.9.4.1 FluorescenceMicroscopy
Nuclei and kinetoplasts were visualized by using the fluorescent dye 4’,6-diamidino-2-
phenylindole (DAPI) on BF trypanosomes after fixation. 50 µL of cells at 2 × 10⁶
cells/mL were spread onto a glass microscope slide, left to dry in a fume hood and
fixed in 4% paraformaldehyde in fresh PBS for 10 min at room temperature. The slides
were washed with 1× PBS. The PBS was gently removed by inclining the slide on a soft
tissue and a drop of Vectashield® mounting medium with DAPI (Vector Laboratories)
was placed on the slide before covering with a cover slip. The slide was then viewed
under UV light on a Zeiss Axioskop 2 fluorescent microscope (Carl Zeiss Microscopy).
500 cells were recorded for each sample, and scored for DNA configuration following
these groups: 1N1K, 1N2K, 2N2K(Early) and 2N2K(Late) (N, nucleus; K, kinetoplast;
Early, early stage of division; Late, late stage of division;) (see Figure 1-22). The effect
of test compounds on DNA configuration was determined at 0, 8 and 24 h. Untreated
cultures served as control.
2.9.4.2 FlowCytometry
DNA content of BF trypanosomes was measured by flow cytometry using the
fluorescent dye propidium iodide (PI), as described (Ibrahim et al., 2011; Hammarton et
al., 2003) with minor modifications. Cell density was adjusted to 2 × 10⁶ cells/mL. Five
milliliters of sample were transferred at each time point into microfuge tubes and
centrifuged at 1620 g for 10 min at 4 °C, washed once in 1× PBS with 5 mM of EDTA
and re-suspended and fixed in 1 mL of 70% methanol and 30% PBS with 5 mM EDTA
(first re-suspend in 300 µL of PBS with 5mM EDTA and then add, drop-wise while

MATERIALS AND METHODS
141 141
vortexing gently, the 700 µL of methanol). The tube containing the cells was covered in
foil paper and leave at 4 °C overnight. After storage, the samples were washed once
with 1 mL of 1× PBS with 5 mM EDTA and subsequently re-suspended in 1 mL 1× PBS
with 5 mM EDTA containing 10 µg/mL RNase A and 10 µg/mL propidium iodide and
incubated at 37 °C for 45 min while protected from light.
Samples were analyzed using a BD FACSCalibur™ system (BD Biosciences). Data were
acquired from the FSC, SSC, FL2- W and FL2-A detectors using BD CellQuest™ software
(BD Biosciences), and further analyzed and graphically represented using the ©FlowJo®
10.2 software.
2 .9.5 Mitochondrial Membrane Potential Assay
The mitochondrial membrane potential of treated and untreated cells was assessed by
using tetramethylrhodamine ethyl ester (TMRE) following a protocol previously
described (Ibrahim et al., 2011). TMRE is a cell permeant, positively-charged, red-
orange dye that accumulates in active mitochondria due to their relative negative
charge. Depolarized or inactive mitochondria have decreased membrane potential and
fail to sequester TMRE.
Cell density was adjusted to 2 × 10⁶ cells/mL and the drugs were added to make a
concentration corresponding to their EC50 and 5 times their EC50 values; a negative
control (drug free sample) was also prepared. One milliliter of sample was transferred
at each time point into a microfuge tube and centrifuged at 1,500 g for 10 min at 4°C.
The pellet was washed once with 1× PBS and re-suspended in 1 mL PBS containing 25
nM of TMRE. Then, cells were incubated at 37°C for 30 min and subsequently placed
on ice for at least 30 min.
Samples were analyzed using a BD FACSCalibur™ system (BD Biosciences). Data were
acquired from the FL2-height detector using BD CellQuest™ software (BD Biosciences),
and further analyzed and graphically represented using the ©FlowJo software, version
10.2. Valinomycin (100 nM) and troglitazone (10 µM) were employed as depolarization
and hyperpolarization controls, respectively (Denninger et al., 2007). Mitochondrial

Chapter 2
142
membrane potential was determined at 0, 3, 6 and 12 h. The detector was calibrated so
that the peak of control cells (Tb427WT not exposed to any test compound) was set at
100 arbitrary units, i.e. with 50% of cells at >100 A.U. and 50% at <100 A.U. The data
are presented as percent of the cell population with a fluorescence >100 A.U.
2 .9.6 Cellular Localization of Compounds in BF T.
brucei
The localization and distribution of the fluorescent compounds in the BF trypanosomes
was studied by fluorescence microscopy. After measuring the fluorescence of all the
compounds studied in this project, only the compound JNI18 was found fluorescent in
DMSO. The fluorescence emission spectral peak of JNI18 in solution was determined in
the region of 450 nm (Table 2-14), which is exactly the emission wavelength of DAPI.
Table 2-14. Fluorescence parameters of the compound JNI18 in DMSO.
Emission (nm) 450
Molar extinction coefficient 23708
Quantum yield 0.42
Fluorescence intensity 9957
Parameters obtained at the Instituto de Química Médica IMQ-CSIC, in Madrid.
Therefore, in order to visualize both nuclei and kinetoplast DNA of the parasites,
instead of DAPI, the green-fluorescent counterstain SYTOX® Green nuclei acid stain
was used, which emits fluorescence at 523 nm. Thus, the fluorescence due to our
compound JNI18 and to the stained DNA can be differentiated. The red-fluorescent
(λem= 599 nm) dye MitoTracker® Red CMXRos, which stains mitochondria in live cells,
was also used.
Trypanosome cultures were grown in HMI-9/FCS media, cell density was adjusted to 2
× 106 cells/mL and the compound JNI18 was added to make a concentration of 5 µM;
a negative control (drug free sample) was also prepared. 1 mL of sample was taken
every time point and transferred into an empty tube, and 1 µL of 100 µM solution of
MitoTracker® Red CMXRos (Thermo Fisher Scientific) in DMSO was added to make a

MATERIALS AND METHODS
143 143
final concentration of 100 nM. Samples were incubated at 37°C and 5% CO2 for 5 min.
Subsequently, samples were washed with filter-sterilized 1× PBS and spun at 1,500 ×
g. Pellets were re-suspended in 50 µL of PBS and spread into a glass microscope slide.
The cells were dried in a fume hood and fixed in 4% formaldehyde/PBS fresh for 10
min at room temperature. Cells were permeabilized with cooled methanol for 5 to 10
min at -20°C, washed once or twice with 1× PBS and then washed twice with Hanks'
Balanced Salt Solution (HBSS) (see Appendix B). Enough solution 1:30,000 (167 nM) of
green-fluorescent counterstain SYTOX® Green nuclei acid stain (Thermo Fisher
Scientific) in HBSS to cover all the cells was added to the slides and incubated for 15
to 30 min protected from light.
Finally, cells were washed twice with HBSS and the slides were covered with a cover
slip. The location of the test compound was determined at 0, 3, 6 and 24 h. The slide
was then viewed under DeltaVision Core microscope (Image Solutions - Applied
Precision, United Kingdom) under several fluorochromes (blue for JNI18, green for the
SYTOX® and red for the Mitotracker®), as well as under UV light. Image acquisition was
controlled using Zen software (Zeiss) and SoftWorx was used for further image
processing.
2 .9.7 Transmission Electron Microscopy Analysis
Transmission electron microscopy was used to assess the action of the compounds on T.
brucei ultrastructure. Cells were harvested and the density was adjusted to 2 × 10⁶
cells/mL. The samples incubated 3 and 24 h with 5 µM of the compound, as well as
untreated cells for control were centrifuged at 610 × g for 10 min at room
temperature and the pellet was washed once with 1× PBS and re-suspended in 1 mL of
the fixative solution containing 2.5% of glutaraldehyde and 4% paraformaldehyde in
0.1 M phosphate buffer (pH 7.4) and left at 4°C overnight. Then, samples were
centrifuged at 4,000 rpm for 8 min and pellet was washed three times with 0.1 M
phosphate buffer (pH 7.4). Cells were post-fixed in a solution of 1% osmium tetroxide
for one hour on ice, and washed with the phosphate buffer to remove excess of
osmium tetroxide. Then, cells were kept in the 0.5% uranyl acetate solution for 30 min,

Chapter 2
144
washed three times with distilled water and dehydrated by using a series of increasing
concentrations of acetone (30, 50, 70, 90 and 100%). Next, cell infiltration was
performed using an epoxy resin. Thin sections (50-60 nm) were observed in a Tecnai
T20 (FEI) at 200 kV.
2 .9.8 PCR Amplif ication of Kinetoplast DNA Markers
Polymerase chain reaction (PCR) of kinetoplastid and nuclear markers was used to
verify the presence of kinetoplast in Tb427WT treated 0, 3, 6, 9, 12, 24 and 32 h with
the bisimidazolinium diphenyl compounds.
Trypanosome cultures were grown under standard conditions (HMI-9/10% FBS; 37°C,
5% CO2), cell density was adjusted to 2 × 10⁶ cells/mL and the compound JNI18 was
added to make a concentration of 5 µM; 1 mL of cells were transferred into a tube and
processed each time point. Full genomic DNA (nuclear and kinetoplast) from T. b.
brucei was obtained using the NucleoSpin® tissue kit (Machery-Nagel, Düren, Germany)
according to the manufacturer’s instructions, quantified using a NanoDrop ND1000
spectrophotometer, and stored at -20 °C. PCR master mix 1× in a total volume of 19
µL (11.8 µL nuclease free water, 4 µL Green GoTaq reaction buffer, 1 µL of 10 mM
dNTPs, 1 µL forward primer and 1 µL reverse primer along with 0.2 µL GoTaq DNA
polymerase) was prepared for each primer pair and DNA sample. One milliliter of
extracted DNA was added in the relevant tubes. Primer sequences specific for
maxicircle and minicircle kinetoplast (kDNA) are listed in Table 2-15.
Cycle conditions for maxicircle sequences were 95 °C for 5 min and 30 cycles of 95 °C
for 1 min, 54 °C for 1 min, and 72 °C for 30 s followed by a final elongation step at 72
°C for 8 min. On the other hand, cycle conditions for minicircle sequences were 94 °C
for 5 min and 35 cycles of 94 °C for 40 s, 59.4 °C for 1 min, and 72 °C for 90 s
followed by a final elongation step at 72 °C for 10 min. All samples were run on 1%
(w/v) agarose gels and visualized using SYBR™ Safe DNA Gel Stain (Invitrogen™) as
described in section 2.2.4.

MATERIALS AND METHODS
145 145
Table 2-15. Ol igonucleotide primer sequences used in this study.
Pr imer for gene Nucleotide sequence Product s ize
A6 Fwd: 5’-AAAAATAAGTATTTTGATATTATTAAAG-3’
Rev: 5’-TATTATTAACTTATTTGATC-3’ 381 bp
ND4 Fwd: 5’-TGTGTGACTACCAGAGAT-3’
Rev: 5’-ATCCTATACCCGTGTGTA-3’ 256 bp
ND5 Fwd: 5’-TGGGTTTATATCAGGTTCATTTATG-3’
Rev: 5’-CCCTAATAATCTCATCCGCAGTACG-3’ 395 bp
ND7 Fwd: 5’-ATGACTACATGATAAGTA-3’
Rev: 5’-CGGAAGACATTGTTCTACAC-3’ 161 bp
Actin Fwd: 5’-CCGAGTCACACAACGT-3’
Rev: 5’-CCACCTGCATAACATTG-3’ 456 bp
Minicircle Type A Fwd: 5’-GGGTTTTTTAGGTCCGAG-3’
Rev: 5’-CCGAAAATAGCACGTG-3’ 1001 bp
Minicircle Type A-like Fwd: 5’-GGGTTTTTAGGTCCGAG-3’
Rev: 5’-CCGAAAATAGCACGTG-3’ 1000 bp
TbAT-1 Fwd: 5’-CGTCACATCTTTCTTCTCG-3’
Rev: 5’-CTTGGGAAGCCCCTCATTGACAGCC-3’ 889 bp
A6, ND4, ND5, ND7: fragments of 4 genes known to be encoded only by the kinetoplast maxicircles from Tb427WT. Actin: Tb427WT nuclearly encoded gene. Minicircles Type A, Type A-like: representative minicircle genes. TbAT-1: Tb427WT nuclearly encoded single copy gene.


RESULTS AND DISCUSSION


CHAPTER 3
HMG PROTEINS


RESULTS AND DISCUSSION: HMG PROTEINS
151 151
3 .1 Obtaining HMG proteins
The proteins of interest were expressed in E. coli and purified following the protocol
described in section 2.1.
3 .1.1 Expression and Purif ication of HMGA1a(∆50-91)
HMGA1a(∆50-91) protein was expressed several times to obtain enough amount to
perform crystallographic and binding assays. Each expression batch was obtained from
1 L of starting culture as described section 2.1.1.
The recombinant pET-3a plasmid containing the human HMGA1a(∆50-91) gene (Figure
2-2) was transformed into E. coli Rosetta (DE3) pLysS strain. A transformed colony
was used to obtain a saturated liquid culture from which 1 L of culture was inoculated
into LB medium containing ampicillin at 37°C. Protein expression was induced when
the culture featured an OD600 of about 0.6-0.7 by adding 1 mM IPTG (see 2.1.1). The
culture was incubated for 3 h to allow the bacteria to synthesize the recombinant
protein and then the cells were recovered by centrifugation. The bacterial pellet was
processed using 5% HClO4/0.5% Triton X-100 as described section 2.1.1. The
recombinant protein was extracted and precipitated from the supernatant using 25%
TCA to obtain a pellet enriched in HMGA1a(∆50-91). Figure 3-1 shows the AU-PAGE
gel of the induction process (0 h, 1.5 h and 3 h) and the enriched extract after the
pellet preparation.
F igure 3-1. AU–PAGE showing induction of the HMGA1a(∆50-91) protein expression.

Chapter 3
152
The pellet enriched in HMGA1a(∆50-91) was admitted to a multi-stage purification
process described in section 2.1.2.
The purification process started with a cation-exchange chromatography based on the
conditions described by Reeves & Nissen (1999) with small modifications. A
carboxymethyl cellulose (CM52, Whatman) column of 20 cm in length, 1.5 cm internal
diameter and 25 mL column volume was used. Equilibration buffer was 50 mM NaCl,
25 mM Tris-HCl, pH 7 and protein elution was achieved by increasing the
concentrations of NaCl from 50 mM (buffer A) to 600 mM (buffer B). Flow rate was 1
mL/min and 4 mL samples were collected.
Figure 3-2a shows a chromatogram obtained from the cation-exchange
chromatography. Peaks of absorbance at 220 nm were collected and analyzed by
AU-PAGE (Figure 3-2b). As expected, HMGA1a(∆50-91) protein was identified in the
fractions forming the major peak of the chromatogram. Secondary peaks, from which
samples 5 and 57 were analyzed, were not containing our target protein.
F igure 3-2. (a) Cation-exchange chromatogram and (b) AU-PAGE analysis of HMGA1a(∆50-91) protein. Sample P corresponds to the pel let obtained in a
previous-to- load centrifugation of S , which is the protein sample loaded into the column. B, buffer containing 600 mM NaCl , 25 mM Tris-HCl, ph7.

RESULTS AND DISCUSSION: HMG PROTEINS
153 153
Fractions 65 to 70, which corresponded to the most pure samples, were concentrated
to proceed with the second purification step. Sample concentration was carried out
using the ultra-concentration device Vivaspin® 20 mL MWCO 3000 following the
manufacturer's instructions until the sample volume was around 1 mL.
Figure 3-3. AU-PAGE of HMGA1a(∆50-91) concentrated samples after cation-
exchange chromatography.
The electrophoretic analysis of the concentrated samples of HMGA1a(∆50-91) protein
(Figure 3-3) shows that most of the unwanted proteins were eliminated during the
cation-exchange chromatography. Nevertheless, it also confirmed the necessity to
continue with the purification of HMGA1a(∆50-91) since it contained (in different
proportion) a few impurities (Figure 3-3).
For that purpose, the HMGA1a(∆50-91) samples were submitted to a last “polishing”
purification step by size-exclusion chromatography following the protocol described in
section 2.1.2. An ÄKTA Purifier 10 system (GE Healthcare) and a 24 mL column volume
Superdex™ Peptide 10/300 GL (GE Healthcare) with Mr 100 - 7,000 were used.
Samples A, B and C (see Figure 3-3) were loaded to the column in two/three
independent injections per sample. The equilibration and elution buffer used was 100
mM NaCl, 25 mM Tris-HCl, pH 7.5, flow rate was 0.5 mL/min and elution was achieved
with 1.5 column volumes. As an example, Figure 3-4 shows the chromatogram of the
size-exclusion column for one run of sample A. Peaks of absorbance at 220 nm
were collected and analyzed by AU-PAGE (Figure 3-2).
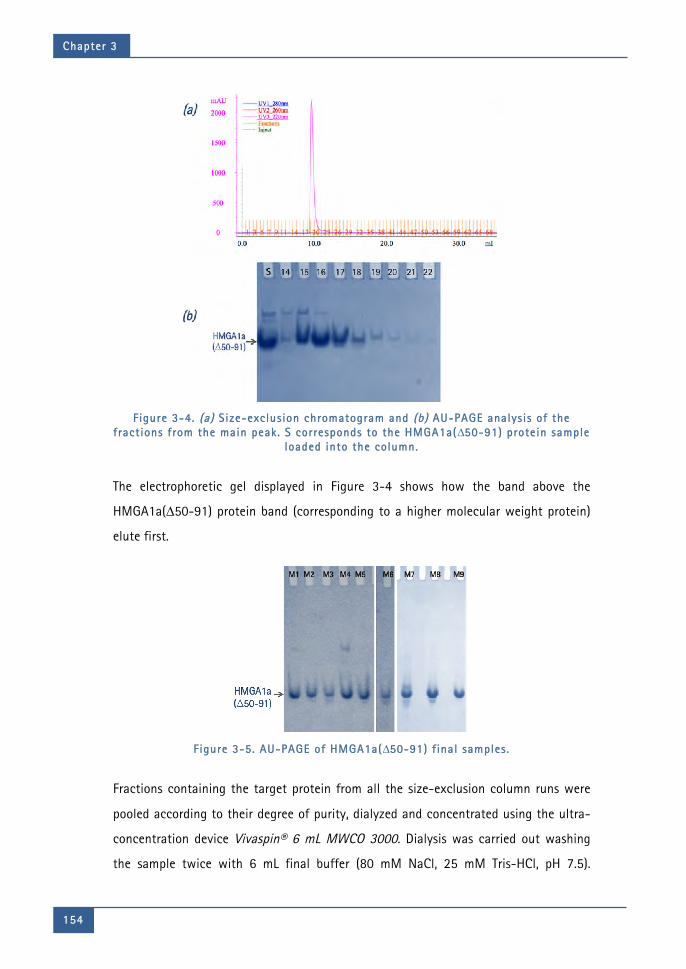
Chapter 3
154
Figure 3-4. (a) Size-exclusion chromatogram and (b) AU-PAGE analysis of the
fractions from the main peak. S corresponds to the HMGA1a(∆50-91) protein sample loaded into the column.
The electrophoretic gel displayed in Figure 3-4 shows how the band above the
HMGA1a(∆50-91) protein band (corresponding to a higher molecular weight protein)
elute first.
Figure 3-5. AU-PAGE of HMGA1a(∆50-91) f inal samples .
Fractions containing the target protein from all the size-exclusion column runs were
pooled according to their degree of purity, dialyzed and concentrated using the ultra-
concentration device Vivaspin® 6 mL MWCO 3000. Dialysis was carried out washing
the sample twice with 6 mL final buffer (80 mM NaCl, 25 mM Tris-HCl, pH 7.5).
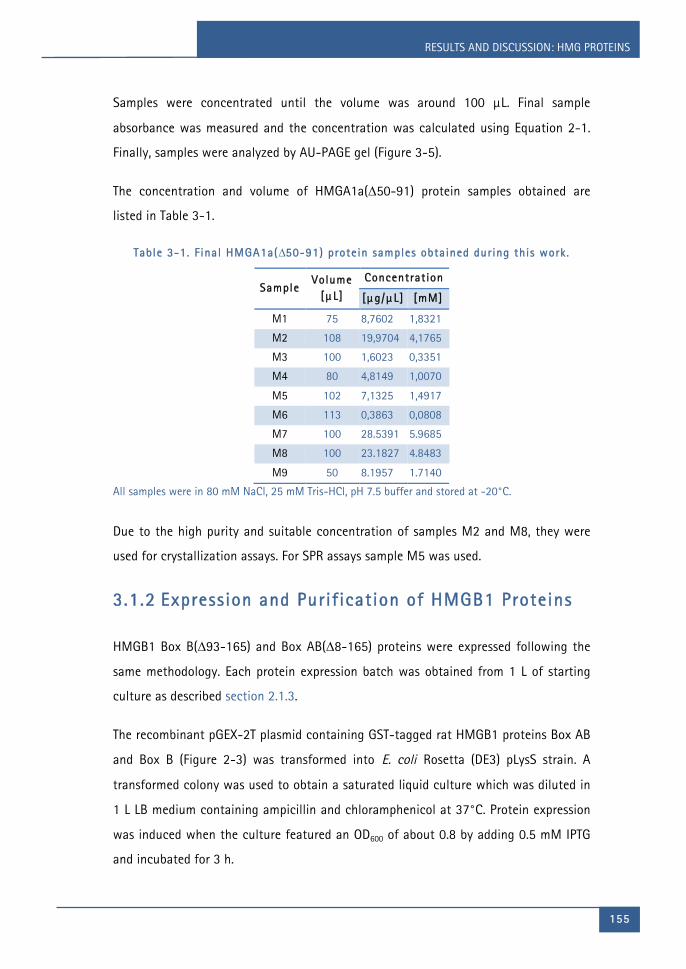
RESULTS AND DISCUSSION: HMG PROTEINS
155 155
Samples were concentrated until the volume was around 100 µL. Final sample
absorbance was measured and the concentration was calculated using Equation 2-1.
Finally, samples were analyzed by AU-PAGE gel (Figure 3-5).
The concentration and volume of HMGA1a(∆50-91) protein samples obtained are
listed in Table 3-1.
Table 3-1. Final HMGA1a(∆50-91) protein samples obtained during this work.
Sample Volume
[µL]
Concentration
[µg/µL] [mM]
M1 75 8,7602 1,8321
M2 108 19,9704 4,1765
M3 100 1,6023 0,3351
M4 80 4,8149 1,0070
M5 102 7,1325 1,4917
M6 113 0,3863 0,0808
M7 100 28.5391 5.9685
M8 100 23.1827 4.8483
M9 50 8.1957 1.7140
All samples were in 80 mM NaCl, 25 mM Tris-HCl, pH 7.5 buffer and stored at -20°C.
Due to the high purity and suitable concentration of samples M2 and M8, they were
used for crystallization assays. For SPR assays sample M5 was used.
3 .1.2 Expression and Purif ication of HMGB1 Proteins
HMGB1 Box B(∆93-165) and Box AB(∆8-165) proteins were expressed following the
same methodology. Each protein expression batch was obtained from 1 L of starting
culture as described section 2.1.3.
The recombinant pGEX-2T plasmid containing GST-tagged rat HMGB1 proteins Box AB
and Box B (Figure 2-3) was transformed into E. coli Rosetta (DE3) pLysS strain. A
transformed colony was used to obtain a saturated liquid culture which was diluted in
1 L LB medium containing ampicillin and chloramphenicol at 37°C. Protein expression
was induced when the culture featured an OD600 of about 0.8 by adding 0.5 mM IPTG
and incubated for 3 h.

Chapter 3
156
Figure 3-6 displays the SDS-PAGE gel of samples collected during induction of GST-
HMGB1 Box B and GST-HMGB1 Box AB fusion proteins expression. An increase in the
amount of the corresponding GST-HMGB1 fusion protein can be observed as the
induction progressed.
Figure 3-6. SDS–PAGE of the induction of GST-fusion HMGB1 proteins expression.
MW, molecular weight marker MW-SDS-6 Dalton Mark™ VI (Sigma).
Cell disruption was performed as described in section 2.1.3, by sonication on a
Bandelin SONOPULS Ultrasonic Homogenizer HD 2200. The clarified lysate
(supernatant from sonication) was purified by a multi-stage purification process
described in section 2.1.4. First, the sample was loaded and incubated for at least 2 h
with gentle rotation in a column packed with 6.5 mL Glutathione Sepharose™ 4B
matrix (GE Healthcare), where the GST moiety bound to the glutathione coupled to the
Sepharose beads. After incubation, the flow through (FT) was collected and the column
was rinsed with wash buffer (W). Thrombin buffer was added to the column and eluted
(ThW), followed by incubation with 200 U thrombin diluted in 1 mL thrombin buffer at
4°C overnight. Here, the GST tag was removed from the fusion protein. Next, thrombin
was inactivated with EDTA and eluted (FTc) and finally the HMGB1 protein fragments
were eluted with elution buffer and collected as E1, E2 and E3. Figure 3-7 shows all
the fractions collected during the affinity chromatography as well as a small sample of
resin (beads) that was used as control.

RESULTS AND DISCUSSION: HMG PROTEINS
157 157
Bacterial proteins were discarded in the first fractions washed from the glutathione
Sepharose column (FT, W) as shown in Figure 3-7. The fractions FTc E1, E2 and E3,
eluted after the GST tag removal, contained the target protein (Figure 3-7). Those
fractions were pooled together into a single sample and loaded into a cation-exchange
column.
Figure 3-7. SDS-PAGE gels of the fractions eluted from the aff inity column
corresponding to (a) the GST-HMGB1 Box B fusion protein and (b) the GST-HMGB1 Box AB fusion protein. MW, molecular weight marker; FT , f low through; W, column wash; THW, thrombin buffer wash; FTc, f low through after tag cleavage; El , E2 and E3, eluted fractions; Beads, sample from microparticles of the column matrix taken
at the end of the elution as a control .
As described in section 2.1.4, the ÄKTA Purifier 10 system and a 5 mL HiTrap SP FF
column were used. The sample of about 24 mL was filtered through a 0.22 µm filter
membrane and loaded into the column in three consecutive injections with a 10 mL
loop. The chromatography was performed with a constant flow of 2 mL/min at 4°C and
5 mL fractions were collected.
The column was equilibrated with 10 bed volumes buffer A (100 mM NaCl, 1 mM EDTA,
1 mM DTT, 10 mM Tris-HCl, pH 7.9) and a 45 min gradient (18 bed volumes) from
buffer A to buffer B (1 M NaCl, 1 mM EDTA, 1 mM DTT, 10 mM Tris-HCl, pH 7 9) was
applied.
Figure 3-8 shows the HiTrap SP FF column chromatograms corresponding to the
purification of the protein HMGB1 Box B and Box AB, and the SDS-PAGE gels for the
fractions conforming the main absorption peak at 280 nm. For the HMGB1 Box B
protein, the fractions 2, 3, 5, 6, 9 and 10 corresponding to the three-sample injection,

Chapter 3
158
were also analyzed. HMGB1 Box B fractions 22 to 27 and HMGB1 Box AB protein
fractions 28 to 34, containing the target protein were pooled and concentrated to
proceed with the last purification step: size-exclusion chromatography.
Figure 3-8. Cation-exchange chromatogram (left) and SDS-PAGE analysis of the fractions from the main peak (r ight) . MW, molecular weight marker; S , HMGB1
protein sample loaded into the column.
The concentration of protein sample was carried out using the ultra-concentration
device Vivaspin® 20 mL MWCO 3,000 (for the HMGB1 Box B) and MWCO 5,000 (for
the HMGB1 Box AB) following the manufacturer’s instructions until the sample volume
was around 0.5 mL.
Size-exclusion chromatography was performed as described section 2.1.4 using a
HiLoad Superdex™ 75 (GE Healthcare) column, Mr 3,000 - 70,000 Da. The samples
were filtered through a 0.22 µm filter membrane and loaded into the column in two
independent injections with a 500 µL loop. The equilibration and elution were
performed with 150 mM NaCl, 1 mM DTT, 50 mM HEPES, pH 7.4 with a constant flow
of 0.5 mL/min at 4°C and 0.5 mL fractions were collected.

RESULTS AND DISCUSSION: HMG PROTEINS
159 159
Figure 3-9 shows the chromatograms obtained during the polishing step of the
HMGB1 proteins.
Pure fractions were pooled together according to their degree of purity and
concentrated/dialyzed in buffer containing in 50 mM NaCl, 1 mM DTT in 25 mM HEPES,
pH 7.4 to a final volume of 100 µL using a Vivaspin® 6 mL MWCO 3,000 (for the
HMGB1 Box B) and 4 mL MWCO 5,000 (for the HMGB1 Box AB). Final samples were
analyzed by SDS-PAGE gel (Figure 3-10).
Figure 3-9. Size-exclusion chromatogram of (a) HMGB1 Box B protein sample and (b)
HMGB1 Box AB protein sample.
Finally, samples were flash-frozen in liquid nitrogen and stored at -80ºC. The
concentration and volume of HMGB1 protein samples prepared during this research
work are listed in Table 3-2.

Chapter 3
160
Figure 3-10. SDS-PAGE of HMGB1 protein (Box B and Box AB) concentrated samples
after s ize-exclusion chromatography. MW, molecular weight marker MW-SDS-6 Dalton Mark™ VI (Sigma).
Table 3-2. Final HMGB1 protein samples obtained during this work.
Sample Name
HMGB1 Protein
Volume [µL]
Concentration
[µg/µL] [mM]
M1 B 400 33.9528 4.02
M2 B 1,700 1.23 0.1467
M1 AB 300 48.5259 2.6253
M2 AB 300 15.1387 0.8190
M3 AB 200 6.7985 0.3678
M4 AB 200 16.9630 0.9177
M5 AB 275 9.1438 0.4947
All samples were in 50 mM NaCl, 1 mM DTT, 25 mM HEPES, pH 7.4 buffer and stored at -20°C.
Due to the high purity and suitable concentration, samples HMGB1 box B M1 and box
AB M1 were used them for crystallization assays. For SPR assays, HMGB1 box AB
sample M1 was used.
3 .2 Interaction of HMGA1a(∆50-91) Protein with
AT-r ich DNA
In order to evaluate its activity, the most pure samples of HMGA1a(∆50-91) protein
obtained (M2, M5 and M8; see Figure 3-5 and Table 3-1) were used for supercoiling
assays, crystallography assays and SPR experiments.

RESULTS AND DISCUSSION: HMG PROTEINS
161 161
3 .2.1 Supercoil ing Induced by HMGA1a Proteins
Supercoiling is a non-covalent and elusive topological modification modulated by
DNA- and chromatin-binding proteins (Gilbert & Allan, 2014). The functionality of the
HMGA1a(∆50-91) protein was verified as regarding to its ability to induce supercoiling
by measuring the degree of circular DNA supercoiling in presence of topoisomerase I.
The protocol performed in this assay is described in section 2.2.5.
The plasmid used during these experiments has been constructed by Dr. Joaquim Roca
from the Molecular Biology Institute of Barcelona (IBMB), CSIC, Barcelona. This 4.6 kb
pSTAT-CEN2-S2 plasmid contains two inserts [AT]11 in opposing sites.
The induction of supercoiling in the circular plasmid by HMGA1a(∆50-91) has been
measured using three different salt concentrations in the reaction buffer: 50 mM NaCl
(low ionic strength), 100 mM (medium ionic strength) and 150 mM (high ionic
strength) (Figure 3-11). Opposite to previous published studies with other HMG
proteins (Štros et al., 1994; Teo et al., 1995), the most favorable ionic strength for the
HMGA1a supercoiling assays proved to be at very high salt concentration (150 mM
NaCl; (1) in Figure 3-11).
Figure 3-11. Supercoi l ing activity of the HMGA1a(∆50-91) in the presence of
different salt concentrations: (1) 150 mM NaCl (high ionic strength) , (2) 100 mM NaCl (medium ionic strength) and (3) 50 mM NaCl ( low ionic strength) . DNA/protein
molar ratio is specif ied for each sample. SC, supercoi led DNA; OC, nicked form (open circular DNA).

Chapter 3
162
In addition, the supercoiling effect of the HMGA1a protein from amino acid 1 to 90, i.e.
the fraction containing the three AT-hook domains, was analyzed in order to compare
it with that caused by the (∆50-91) fraction (see Figure 2-1). The pure HMGA1a(∆1-90)
sample tested in this experiment was provided by a member of MACROM research
group.
Figure 3-12. Supercoi l ing activit ies at high ionic strength of two fragments of the HMGA1a(∆50-91) and the complete protein lacking the acidic tai l HMGA1a(∆1-90).
DNA/protein molar ratio is specif ied for each sample. SC, supercoi led DNA; OC, nicked form (open circular DNA).
At high ionic strength, a clear supercoiling effect is seen for both protein fragments
HMGA1a(∆50-91) and HMGA1a(∆1-90) as shown in Figure 3-12. The degree of
unwinding observed on nicked circular DNA depends on the DNA/protein molar ratio,
but is very similar for both proteins. Therefore, the truncated HMGA1a protein (∆50-91)
containing only two AT-hook domains seems to be as functional and active as the
HMGA1a(∆1-90), which contains the three AT-hook motifs.
The untwist provoked by the protein in the circular DNA previously relaxed is
compensated with a positive supercoiling at other region of the plasmid. This positive
supercoiling is dissipated by the topoisomerase I. But when both, the protein and the
topoisomerase are excluded, topoisomeres are obtained with negative supercoiling.
Then, the negative supercoiling introduced by two fractions of HMGA1a protein is
correlated with its unwinding activity.

RESULTS AND DISCUSSION: HMG PROTEINS
163 163
3 .2.2 HMGA1a(∆50-91) Crystal lography Assays
The crystallography assays of the HMGA1a-DNA complexes were evaluated with a set
of AT-rich oligonucleotides by the vapor diffusion crystallization technique using the
two typical set-ups: hanging-drop and sitting-drop. The oligonucleotides used are
shown in Table 3-3.
Table 3-3.Oligonucleotide sequences used for crystal lographic assays with HMGA1a(∆50-91)
DNA sequence Length [bp] MW [mol ·g -1]
1. CCAATAATCGCGATTATTGG 20 12232.2
2. ATTATTAATAAT 12 7285
3. AATATATATATT 12 7285
4. AAATATATTT 10 6050.2
5. CGAATTAATTCG 12 7289
6. ATTAATTAAT 10 6050.2
Molecular weight is given in terms of DNA duplex.
The complexes formation was evaluated first by EMSA electrophoresis in order to
determine the ability of the protein to form complexes with DNA following the
protocol described in section 2.2.3. DNA-protein samples containing 3% glycerol in
0.3x TBE were incubated for 1 h at 4°C to allow the complex formation. The EMSA gel
was run around for 1 h after a 30 min pre-run, and stained with SYBR® Gold
(Invitrogen™) for 20 min. Figure 3-13 shows the EMSA gels performed with
HMGA1a(∆50-91) protein. For these assays, 1 µM oligonucleotide was incubated with
increasing concentrations of protein (from 0.25 to 7 µM). Although a different amount
of protein may be needed in each case, the formation of complex with all the tested
oligonucleotides was confirmed.
Crystallography assays were performed varying a series of parameters as DNA/protein
ratio, buffer, salt, pH and MPD concentration. Hampton Natrix HR2-116 (Scott et al.,
1995) 7, 15, 16, 25, 31, 42, 43, 46 and 48 (see Appendix D).

Chapter 3
164
Figure 3-13. EMSA assays of HMGA1a(∆50-91) in complex with AT-r ich
ol igonucleotides: (1) d[CCAATAATCGCGATTATTGG]2, (2) d[ATTATTAATAAT]2, (3) d[AATATATATATT]2 and (4) d[AAATATATTT]2.
3 .2.3 DNA-HMGA1a(∆50-91) Protein Binding Analysis
by SPR
AT-rich sites of DNA are typically recognized by the HMGA proteins through their AT-
hook binding domains. EMSA assays were a useful procedure for analyzing the binding
of the protein HMGA1a(∆50-91) with DNA. However, in order to investigate
quantitatively the affinity of this protein with AT-rich DNA, measurements of SPR
using Biacore® technology were performed. Therefore, HMGA1a(∆50-91) protein
binding affinity and kinetics were analyzed following the protocol described in section
2.8. The DNA hairpin 5’-biotin-GGGAATAATCGCGATTATTCCCCAATAATCGCGATTATT-3’
[AATAAT_ATTATT] (see Table 2-13 and Figure 2-14) was immobilized in the SA sensor
chip. Multiple sensorgrams for direct protein binding were collected, keeping the
hairpin concentration constant at ~400 RU and varying the HMGA1a(∆50-91) protein
concentration from 10 nM to 10 µM. The best sensorgrams were obtained in HEPES,

RESULTS AND DISCUSSION: HMG PROTEINS
165 165
instead of MES or Phosphate buffer. Figure 3-14a shows the SPR sensorgrams of the
HMGA1a(∆50-91) binding to DNA hairpin [AATAAT_ATTATT], obtained with running
buffer HEPES 1 containing 10 mM HEPES, 3 mM EDTA, 200 mM NaCl, and surfactant
P-20 at 0.05% (v/v) pH 7.4) at a flow rate of 50 µL/min for a period of 60 s followed
by a dissociation period of 120 s. Results were fitted to a two-site binding model
according to the Equation 2-13 in order to determine the binding affinity (Figure
3-14b).
Figure 3-14. (a) SPR sensorgrams of HMGA1a (10 nM to 10 µM) binding to dsDNA biotin-GGGAATAATCGCGATTATTCCCCAATAATCGCGATTATT in HEPES 1 at 25°C. (b)
Binding curve for interaction of HMGA1a(∆50-91) with target DNA and f itt ing curve for a two-site aff inity model . Graphs were created with Prism 5.0 (GraphPad
Software) .
During the experiments, HMGA1a(∆50-91) protein showed a high affinity binding site
to the AT sequences of the [AATAAT_ATTATT] oligonucleotide and a weaker secondary
binding site that most likely accounts for nonspecific binding to the hairpin loop (K2/K1
= 32). The KD values are K1= 0.35 × 10⁻⁶ M and K2= 11.3 × 10⁻⁶ M.
3 .3 Interaction of HMGB1 Protein with AT-r ich DNA
The analysis of the interactions of HMGB1 box B and box AB proteins with a series of
AT-rich DNA sequences was studied by X-ray crystallography assisted with EMSA
assays, and by SPR experiments. For this purpose, the most pure samples of the
HMGB1 proteins (see section 3.1.2) were used, which were sample M1 of HMGB1a Box
B and sample M1 HMGB1 box AB (see Figure 3-10 and Table 3-2).

Chapter 3
166
3 .3.1 DNA-HMGB1 Crystal lography Assays
The main goal during this phase was to obtain high quality ordered crystals of DNA-
HMGB1 protein complexes for structure resolution by X-ray crystallography. For this,
multiple crystallization conditions were screened (see Appendix E). The
oligonucleotides used with HMGB1 box B and HMGB1 box AB proteins are listed in
Table 3-4. See Table 2-11 for more details.
Table 3-4. Ol igonucleotide sequences used for crystal lographic assays with HMGB1 proteins .
DNA sequence Length [bp]
MW [mol ·g -1]
HMGB1 Box B
HMGB1 Box AB
1. CCAATAATCGCGATTATTGG 20 12232.2 ✓ ✓
6. ATTAATTAAT 10 6050.2 ✓
7. AATAAATTTATT 12 7285 ✓
8. ATATGCATAT 10 6052.2 ✓
9. ATATCGATAT 10 6052.2 ✓ ✓
10. AATAATCGCGATTATT 16 9758.6 ✓ ✓
11. AATTTAAATT 10 6050.2 ✓
12. ATTTATAAAT 10 6050.2 ✓
13. GGGAAATTTCCC 12 7290.8 ✓
14. AATAAATTTATTT 13 7902.4 ✓
Molecular weight is given in terms of DNA duplex. ✓ Oligonucleotide studied with the HMGB1 fragment indicated.
The formation of complexes with different oligonucleotide sequence was first
evaluated by EMSA electrophoresis (see section 2.2.3). For these assays, a set of
samples containing increasing concentrations of protein from 1 to 6 µM were
incubated for 1 h at 4°C with 1 µM oligonucleotide (Figure 3-15).
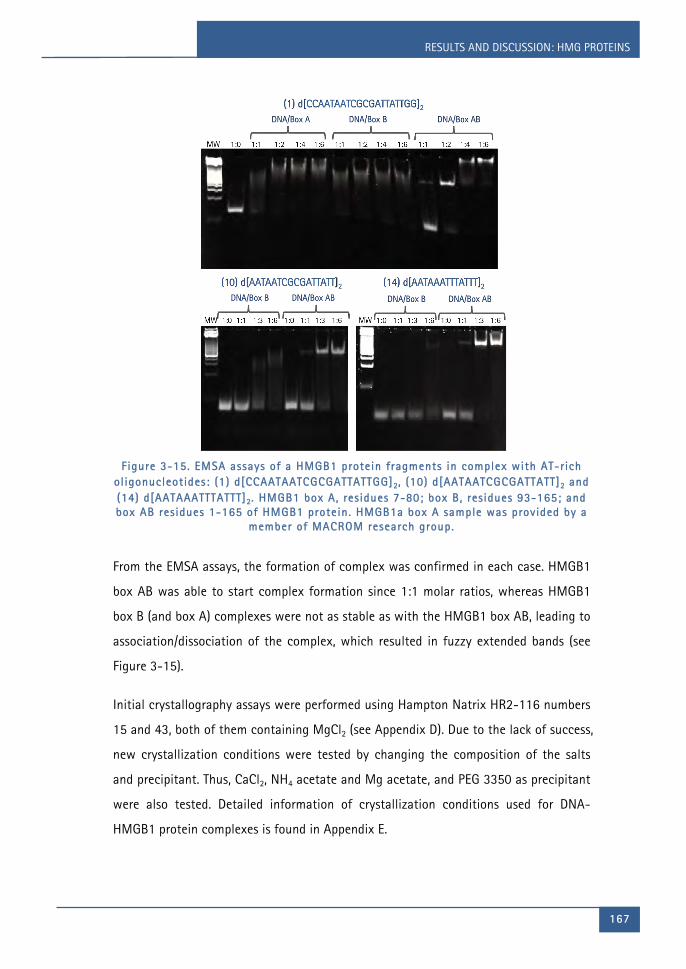
RESULTS AND DISCUSSION: HMG PROTEINS
167 167
Figure 3-15. EMSA assays of a HMGB1 protein fragments in complex with AT-r ich ol igonucleotides: (1) d[CCAATAATCGCGATTATTGG]2, (10) d[AATAATCGCGATTATT]2 and (14) d[AATAAATTTATTT]2. HMGB1 box A, residues 7-80; box B, residues 93-165; and box AB residues 1-165 of HMGB1 protein . HMGB1a box A sample was provided by a
member of MACROM research group.
From the EMSA assays, the formation of complex was confirmed in each case. HMGB1
box AB was able to start complex formation since 1:1 molar ratios, whereas HMGB1
box B (and box A) complexes were not as stable as with the HMGB1 box AB, leading to
association/dissociation of the complex, which resulted in fuzzy extended bands (see
Figure 3-15).
Initial crystallography assays were performed using Hampton Natrix HR2-116 numbers
15 and 43, both of them containing MgCl2 (see Appendix D). Due to the lack of success,
new crystallization conditions were tested by changing the composition of the salts
and precipitant. Thus, CaCl2, NH4 acetate and Mg acetate, and PEG 3350 as precipitant
were also tested. Detailed information of crystallization conditions used for DNA-
HMGB1 protein complexes is found in Appendix E.

Chapter 3
168
3.3.1.1 HMGB1BoxB–d[AATAAATTTATT]2
Crystallization assays with oligonucleotide (7) d[AATAAATTTATT]2 in complex with
HMGB1 box B were performed by the vapor diffusion technique using the sitting-drop
set-up into 48-well crystallization plates. Crystals appeared after a few days in wells
containing buffer T6 (10 mM MgCl2, 1 mM DTT, 5% MPD, 25 mM Tris-HCl, pH 7.5) and
C6 (10 mM MgCl2, 1 mM DTT, 5% MPD, 25 mM sodium cacodylate buffer pH 6).
Therefore, it was decided that a new screening has to be done varying the MgCl2
concentration. Crystals were obtained in droplets containing buffers C9 (12.5 mM
MgCl2, 1 mM DTT, 5% MPD, 25 mM sodium cacodylate buffer pH 6), T9 (12.5 mM
MgCl2, 1 mM DTT, 5% MPD, 25 mM Tris-HCl, pH 7.5) and C10 (7.5 mM MgCl2, 1 mM
DTT, 5% MPD, 25 mM sodium cacodylate buffer pH 6).
Using those buffers, crystallization assays were performed into individual capsules as
an attempt to obtain better-sized crystals in a 4 µL droplet equilibrated against 800 µL
reservoir containing initially 30% MPD. Precipitant concentration was gradually
increased until 45% MPD. Eleven crystals were fished from droplets containing buffers
T6 and T9 and diffracted as described in section 2.6.3. Figure 3-16 and Figure 3-17
show the images and diffraction patterns of the best crystallization conditions found
in droplets 4C4 and IG5, respectively.
The diffraction patterns of crystal 4C4-2 (Figure 3-16) indicate a very large and
complex unit cell, as shown by the rows of closely spaced spots. It is expected an
arrangement of the oligonucleotides in two directions due to the cross lines formed in
the patterns. Unfortunately the spots are diffused and the patterns could not be
properly indexed.

RESULTS AND DISCUSSION: HMG PROTEINS
169 169
Figure 3-16. Crystal 4C4-2 image and diffraction pattern of ol igonucleotide (7) d[AATAAATTTATT]2 with HMGB1 box B. Crystal l ization condit ions are detai led below
the image.
The diffraction patterns of the crystal IG5-6 (Figure 3-17) show fiber-like diffraction
mixed with define spots at low resolution. In this case, the duplexes show a parallel
orientation, as demonstrated by the parallel layer-line streaks (perpendicular to the
duplexes axis). The low resolution indicates that the parallel duplexes are randomly
displaced in the vertical direction.
Figure 3-17. Image of the crystal IG5-6 of ol igonucleotide (7) d[AATAAATTTATT]2 with HMGB1 box B ( left) . Its diffraction pattern corresponds to a mixture of f iber-l ike diffraction and defined spots at low resolution. Crystal l ization condit ions are
detai led below the image.

Chapter 3
170
3.3.1.2 HMGB1BoxB–d[CCAATAATCGCGATTATTGG]2
The oligonucleotide (1) d[CCAATAATCGCGATTATTGG]2 was widely studied during this
work. Different crystallization conditions were tested for oligonucleotide 1-HMGB1
box B (see Appendix E). Crystallization screening was performed in individual capsules
using magnesium as divalent ion and MPD as precipitant.
The best crystallization conditions found were 0.4 mM DNA duplex, 0.8 mM HMGB1
box B, buffer C9 (25 mM sodium cacodylate buffer pH 6, 25 mM MgCl2 and 5% MPD),
and equilibrated against a 43% MPD reservoir. Figure 3-18 shows an image of the
crystal NC5-1 and its diffraction patterns.
Figure 3-18. Image of crystal NC5-1 and diffraction pattern of ol igonucleotide (1) d[CCAATAATCGCGATTATTGG]2 with HMGB1 box B. Crystal l ization condit ions and an
image of the crystal in the loop taken at the moment of the diffraction are also shown. Arrows indicate the crystal diffracted. The patterns on the left show two
orientations of diffraction that are at ∼90° to each other .

RESULTS AND DISCUSSION: HMG PROTEINS
171 171
The diffraction patterns of the crystal NC5-1 show well-defined spots of two
orientations of stacked columns of DNA helices that are at ∼90° to each other (see
Figure 3-18 right panel).
The diffraction patterns of the crystal NC5-1 was indexed using the program iMOSFLM
(Battye et al., 2011) as orthorhombic with cell parameters a = 29.94 Å, b = 89.65 Å, c
= 109.1 Å, α = β = γ = 90° in space group P22121. The cutoff resolution limit was set
to 2.68 Å. The data were scaled using the program Scala (Evans, 2006). Rmerge and Rmeas
values were 0.049 and 0.054. The search DNA model for molecular replacement (MR)
was constructed using the program Turbo-Frodo (Roussel et al., 1998), taking the full
length of the oligonucleotide on a first attempt. Due to the difficulties that finding the
20 bp oligonucleotide presented, fragments of 6 and 10 bp, as DNA models, were
created. Despite all the DNA models used for MR, it was not possible to find the
molecule. Therefore, MR with numerous PDB structures was used to find the HMGB1
box B protein including HMGD protein (PDB ID: 3NM9), TFAM protein (PDB ID: 4NNU
and PDB ID: 3TQ6), transcription factor SOX-9 (PDB ID: 4EUW), among others.
MR in this crystal structure faced a particular difficulty. When DNA models were
replaced, they adopted an L-shape similar to the HMGB1 box B structure and the
electron density map partially followed those replacements. Nevertheless, a good
correlation within the electron density map and the oligonucleotide could not be
obtained. On the other hand, the MR with HMG protein structure models positioned
the HMG-box in the same place where the oligonucleotide was set when DNA models
were used for MR. This probably happened due to the oligonucleotide configuration in
the crystal. The HMGB1 box B protein, by its ability to recognize the DNA minor groove
and provoke a dramatic distortion on it, may have bent 90° the linear DNA
oligonucleotides. That whould explain the two orientations of diffraction obtained in
this crystal.

Chapter 3
172
3.3.1.3 ElectrophoreticVerificationofthePresenceofHMGB
ProteinintheDiffractedCrystals
In order to test the protein content in the obtained crystals, they were analyzed by
SDS-PAGE once X-ray diffraction had been performed (see section 2.2.1).
After diffraction, crystals were re-stored in liquid nitrogen to avoid degradation until
their analysis by electrophoresis. Once the SDS-PAGE was ready to be performed, each
crystal was dissolved in 4.5 µL H2O milliQ® (cold). 1.5 µL of 4x SDS sample buffer was
added to the sample. Samples were boiled for 6 min and loaded into the SDS gel. Gel
was run for 1 h at constant voltage of 100 V and stained with SilverQuest™ Silver
Staining Kit (Invitrogen™) for 20 min. Figure 3-19 show the SDS-PAGE of crystals NC5-
1, 4C4-1, 4C4-2, 1G5-6 and 1G5-17.
Figure 3-19. SDS-PAGE of crystals of HMGB1 box B with DNA. Sample of HMGB1
box B were used as control (50 and 100 ng) .
Intense bands corresponding to the crystals NC5-1, 4C4-1 and 4C4-2 clearly show the
presence of the HMGB1 box B. On the other hand, crystals 1G5-6 and -17 show also
the presence of the HMGB1 box B but with a poorer protein content.
3 .3.2 DNA-HMGB1 Protein Binding Analysis
In contrast to the HMGA proteins, HMGB1 binds more non-specifically to DNA.
Measurements of SPR using a Biacore® X-100 apparatus were also performed for the

RESULTS AND DISCUSSION: HMG PROTEINS
173 173
protein HMGB box AB to analyze the protein binding affinity and kinetics to an AT-rich
DNA following the protocol described in section 2.8.
To study the binding interactions between HMGB1 and the DNA hairpin
[AATAAT_ATTATT] (see Table 2-13), a dilution series of HMGB1 box AB samples was
prepared (from 10 nM to 10 µM) by dilution into HEPES 1 buffer. Multiple sensorgrams
were collected, keeping the DNA concentration constant at ~400 RU, and injecting the
series of protein samples over the immobilized DNA at a flow rate of 50 µL/min for a
period of 60 s followed by a dissociation period of 120 s (Figure 3-20a). HEPES 1 was
used as the running buffer. A solution containing 200 mM NaCl/10 mM NaOH was
used to regenerate the free DNA surface after each injection using a flow rate of 10
µL/min during 30 s. The binding affinity was determined by fitting the results to a two-
site binding model according to Equation 2-13 (Figure 3-20b).
Figure 3-20. (a) SPR sensorgrams of HMGB1 box AB (10 nM to 10 µM) binding to
dsDNA biotin-GGGAATAATCGCGATTATTCCCCAATAATCGCGATTATT hairpin in HEPES 1 at 25°C and (b) Binding curve for interaction of HMGB1 box AB with target DNA
and f itt ing curve for a two-site aff inity model . Graphs were created with Prism 5.0 (GraphPad Software) .
Similar to HMGA1a(∆50-91), HMGB1 box AB protein showed two KD values: a high
affinity binding site to the AT sequences of the [AATAAT_ATTATT] oligonucleotide (K1=
0.33 × 10⁻⁶ M), and a weaker secondary binding site (K2= 5.91 × 10⁻⁶ M; K2/K1 = 18)
that most likely accounts for nonspecific binding to the hairpin loop. The higher
affinity of HMGB1, compared to the HMGA1a(∆50-91) (K2= 11.3 × 10⁻⁶ M), to this
nonspecific secondary binding site is compatible with HMGB proteins binding more

Chapter 3
174
non-specifically to DNA compared to the higher preference of HMGA proteins to bind
AT-rich DNA.
3 .4 GENERAL DISCUSSION
Several goals were achieved in this chapter regarding the obtainment of the HMG
proteins of interest and their characterization and analysis.
First, the human HMGA1a(∆50-91) protein containing two AT-hook DNA binding
domains has been expressed with the recombinant DNA technology in the bacterium E.
coli (Rosetta (DE3) pLysS strain) using a pET vector. Pure protein samples were
obtained by cation-exchange chromatograpy followed by size-exclusion
chromatography. On the other hand, two fractions of the HMGB1 protein [the box B,
HMGB1(∆93-165) and the two tandem boxes AB, HMGB1(∆1-165)] were also
successfully expressed as GST-fusion proteins in the same E. coli strain transformed
with a plasmid pGEX-2T. HMGB1 proteins were purified by a multi-stage purification
strategy, which involved affinity chromatography, cation-exchange chromatography
and size-exclusion chromatography.
Using the high-purity samples, an analysis of DNA supercoiling induced by the
HMGA1a(∆50-91) protein was performed. The verification of the functionality of the
recombinant protein was achieved by demonstrating the capacity of this HMGA1a
fragment to induce supercoiling in a DNA plasmid containing two alternating AT
inserts. In addition, the activity of the protein was compared with a fragment
containing the three AT-hook domains, HMGA1a(∆1-90), finding a similar behavior for
both proteins. Then, it can be assumed that two-AT-hook DNA motifs could act
comparably to the three-AT-hook fragment in terms of inducing changes in the DNA
configuration.
HMGA1a(∆50-91) and HMGB1 box AB showed high affinity binding to the AT region of
the 39 bases (GGGAATAATCGCGATTATTCCCCAATAATCGCGATTATT) hairpin used for the
SPR assays. They also presented a weaker secondary binding site due to nonspecific
binding to the hairpin loop, weaker for the HMGA1a than for the HMGB1. This could

RESULTS AND DISCUSSION: HMG PROTEINS
175 175
be probably due to the HMGA higher specificity for AT sites compared to the HMGB
proteins.
In the DNA-protein interaction analysis by EMSA, HMGA1a(∆50-91) showed good
binding at 1:1 and 1:2 DNA/protein ratios with the oligonucleotides d[AAATATATTT]2,
d[CCAATAATCGCGATTATTGG]2, d[ATTATTAATAAT]2 and d[AATATATATATT]2. On the other
hand, DNA-HMGB1 box AB complex formation was achieved with
d[CCAATAATCGCGATTATTGG]2, d[AATAATCGCGATTATT]2 and d[AATAAATTTATTT]2. DNA
complexes with HMGB1 box B displayed fuzzy extended bands due probably to the
formation of an instable complex. A similar behavior has been described for the
HMGB1 box A (Sánchez-Giraldo et al., 2015). Nevertheless, DNA-HMGB1 box AB
complexes were observed as a neat band at 1:1 molar ratios.
Although the structure of a single AT-hook in complex with DNA has been previously
solved for the first time in our reaserch group, all the attempts to crystalize the two-
AT-hook domains protein HMGA1a(∆50-91) have not succeed. HMGA1a is an
intrinsically disordered protein and even though the crystallographic assays were
performed in complex with DNA, no crystals with any of the oligonucleotides analyzed
were obtained. However, the crystallization of the HMGB1 with several DNA sequences
has been achieved.
Crystals of macromolecular complexes containing HMGB1 box B-d[AATAAATTTATT]2
and HMGB1 box B-d[CCAATAATCGCGATTATTGG]2 were diffracted at ALBA Syncrothron.
Crystals containing the oligonucleotide d[AATAAATTTATT]2 showed fiber-like diffraction
patterns at low resolution. On the other hand, a complex with the HMGB1 box B and
d[CCAATAATCGCGATTATTGG]2 presented a well-ordered diffraction pattern at 2.68 Å
resolution. Data collection were indexed in orthorhombic P22121 space group with cell
parameters a = 29.94 Å, b = 89.65 Å, c = 109.1 Å, α = β = γ = 90°. Well-defined spots
of two orientations of diffraction ~90° to each other were shown in the diffraction
patterns. Consequently, it is expected that the oligonucleotides have packed in a
crossed column configuration, or, that DNA interaction with HMGB1 box B protein had

Chapter 3
176
provoked a ~90° kink on the DNA, as previously reported (Ngo et al., 2014; Ngo et al.,
2011; Rubio-Cosials et al., 2011; Sánchez-Giraldo et al., 2015).

CHAPTER 4
BIS(2-AMINOIMIDAZOLINE) COMPOUNDS


RESULTS AND DISCUSSION: BIS(2-AMINOIMIDAZOLINE) COMPOUNDS
179 179
4 .1 Interaction of Minor Groove Binding Drugs with
AT-Rich DNA
The high affinity and selectively recognition of the HMG proteins to AT-rich binding
sites offers an excellent opportunity for rational design of AT minor grove binding
drugs (MGBD) to contest important human diseases. For that reason, in this work the
binding and interactions of eleven bis(2-aminoimidazoline) compounds (listed in Table
2-9) with AT-rich DNA have been analyzed.
4 .2 DNA-MGBD Binding Analysis by SPR
Surface Plasmon Resonance (SPR) experiments were carried out to study the direct
binding affinity of the bis(2-aminoimidazoline) compounds to dsDNA hairpins
containing GGAATAATCGCGATTATTCC [AATAAT_ATTATT], CGAATTCG [AATT], CATATATAT
[(AT)4], and CGCGCGCG [(CG)4] sequences (Table 2-13).
As an initial analysis, a binding screening of the eleven compounds to the DNA hairpin
[AATAAT_ATTATT] (see Table 2-13) were evaluated. The compound CD27 (Figure 1-18)
was also added in this assay. Samples with a fix concentration of 24 µM of each
compound in HEPES 1 were prepared and injected over the immobilized DNA surfaces
(~400 RU) followed by running buffer injection, which was also HEPES 1. The flow rate
used for these experiments was 18 µL/min for an association period of 300 s followed
by a dissociation period of 300 s. Subsequently, a solution containing 200 mM NaCl/10
mM NaOH was used to regenerate the free DNA surface after each injection using a
flow rate of 10 µL/min during 60 s.
Figure 4-1 shows that the FR60 and derivatives (Ref 1-10 in Table 2-9) as well as the
drug CD27 exhibited, in general, an affinity for the DNA hairpin [AATAAT_ATTATT]
similar to that showed by the lead drug FR60. The compound JNI18 was the FR60
derivative that showed the higher affinity for the DNA hairpin, presenting a slightly
better affinity than FR60. On the other hand, compound CRMV49 was not able to bind

Chapter 3
180
to the DNA, probably because of the fluorine atom position, which permits the
formation of an H-bond with the central [–NH] group of the drug and thus the DNA-
drug binding could be obstructed. Interestingly, a unique pattern of interaction was
observed between DNA-CDIV32. Compound CDIV32 (see Table 2-9) presented higher
affinity compared to the rest of compounds, and a particularly slow rate of dissociation.
Figure 4-1. Binding screening by SPR of bis(2-aminoimidazoline) compounds to biotin-GGGAATAATCGCGATTATTCCCCAATAATCGCGATTATT hairpin in HEPES 1 at 25°C.
Based on those results, next experiments were performed with the there compounds
that showed the most interesting binding features: FR60, JNI18 and CDIV32.
Direct binding affinity assays of the compounds FR60, JNI18 and CDIV32 were
performed as described section 2.8. Drug samples were prepared at a series of
concentrations (from 0.25 nM to 57.6 µM) by dilution into HEPES 1 buffer. These
experiments were performed using the same conditions as in the previous binding
screening. Figure 4-2 shows the sensorgrams for FR60 binding to hairpin
[AATAAT_ATTATT] and the binding curve adjusted to a two-site binding model.

RESULTS AND DISCUSSION: BIS(2-AMINOIMIDAZOLINE) COMPOUNDS
181 181
Figure 4-2. (a) SPR sensorgrams for binding of drug FR60 to dsDNA biotin-GGGAATAATCGCGATTATTCCCCAATAATCGCGATTATT in HEPES 1 at 25°C, using
increasing concentrations of the l igand in the range of 0.25-57.6 µM. (b) Binding curve for interaction of FR60 with target DNA and f itt ing curve for a two-site
aff inity model .
SPR binding affinity for the drugs FR60 and CDIV32 binding to the DNA hairpin [AATT],
[(AT)4] and [(CG)4] are given by Ríos Martínez et al. (2015a). Figure 4-3 and Figure 4-4
show the binding affinity of drug CDIV32 to DNA hairpin [AATAAT_ATTATT] and drug
JNI18 to the four DNA hairpin sequences studied, respectively. Binding curves for
interactions of the drugs with DNA [(CG)4] were adjusted to one-site binding (K2 = 0).
The summary of the binding constants of all compounds is listed in Table 4-1.
Figure 4-3. (a) SPR sensorgrams for binding of drug CDIV32 to dsDNA biotin-GGGAATAATCGCGATTATTCCCCAATAATCGCGATTATT in HEPES 1 at 25°C, using
increasing concentrations of the l igand in the range of 0.25-57.6 µM. (b) Binding curve for interaction of CDIV32 with target DNA and f itt ing curve for a two-site
aff inity model .

Chapter 3
182
Figure 4-4. SPR sensorgrams and binding curves for interaction of drug JNI18 with
hairpins (a) biotin-GGGAATAATCGCGATTATTCCCCAATAATCGCGATTATT; (b) biotin- CGAATTCGTCTCCGAATTCG; (c) biotin-CATATATATCCCCATATATATG; and (d) biotin-
CGCGCGCGTTTTCGCGCGCG in HEPES 1 at 25°C, using increasing concentrations of the l igand in the range of 0.25-57.6 µM. For the AT-r ich sequences, the curve was adjusted to a two-site aff inity model and for the CG-r ich sequence to a one-site
binding model .
Compounds FR60 and JNI18 bound selectively to AT-containing DNA versus CG-
containing DNA (from >10-fold to >60-fold). Binding curves of both compounds were

RESULTS AND DISCUSSION: BIS(2-AMINOIMIDAZOLINE) COMPOUNDS
183 183
adjusted to a two-sites affinity model where primary binding constants were in the
submicromolar range with slight selectivity toward [AATT] versus [(AT)4] (1.8- to 2.5-
fold) or [AATAAT_ATTATT] oligonucleotides (1.6- to 3-fold). With the DNA hairpin
[AATAAT_ATTATT], compounds FR60 and JNI18 displayed submicromolar primary
binding constants (high affinity binding site) and a 133- and 48-times weaker
secondary binding constant, respectively.
Moreover, compound CDIV32 bound more selectively to AT-containing DNA versus CG-
containing DNA than the other two compounds (~120-fold). Primary binding constants
were in the submicromolar range and for [(AT)4] in the micromolar range. CDIV32
showed slight selectivity toward [AATT] versus [(AT)4] or [AATAAT_ATTATT] similar to
the compounds FR60 and JNI18 (3.1-fold and 1.6-fold, repectively). Compound CDIV32
displayed a high affinity binding site to the AT sequences and 22-, 185 and -46 times
weaker secondary binding with [AATAAT_ATTATT], [AATT] and [(AT)4], respectively.
In these experiments, secondary binding generally accounts for non-specific binding
interaction with the DNA hairpin loop as previously reported (Ríos Martínez et al.,
2015c).
Table 4-1. DNA binding constants determined by SPR for dsDNA containing AATAAT_ATTATT, AATT, (AT)4, and (CG)4 sequences.
Compound KD (×10 -6 M) a
dsDNA
GGAATAATCGCGATTATTCC dsDNA
CGAATTCG dsDNA
CATATATAT dsDNA
CGCGCGCG
FR60 K1 = 0.56 K2 = 74.7
K1 = 0.166b
K2 = 207 K1 = 0.307b K2 = 20.91
> 10b
JNI18 K1 = 0.43 K2 = 20.8
K1 = 0.262 K2 = 230
K1 = 0.65 K2 = 39
K = 6.85c
CDIV32 K1 = 0.92
K2 = 20.2
K1 = 0.568b
K2 = 105
K1 = 1.79b
K2 = 83.4
K = 66.7b,c
‡dsDNA hairpins used in the study: 5’-biotin-GGGAATAATCGCGATTATTCCCCAATAATCGCGATTATT [AATAAT_ATTATT], 5’-biotin-CGAATTCGTCTCCGAATTCG-3’ [AATT], 5’-biotin-CATATATATCCCCATATATATG-3’ [(AT)4], and 5’-biotin-CGCGCGCGTTTTCGCGCGCG-3’ [(CG)4].
aBinding constants for fitting to a two-site binding model. K1 corresponds to the primary binding constant for fitting to a two-site binding model. The secondary binding constant (K2) corresponds to nonspecific binding to the hairpin loop (Nguyen & Wilson, 2009). bReference (Ríos Martínez et al., 2015a). cBinding constant for fitting to a one-site binding model.

Chapter 3
184
4 .3 DNA Binding Competition Assay: HMG Proteins
vs Bis(2-aminoimidazoline) Derivatives
Competition assays were performed to test the capacity of compound JNI18 to inhibit
the formation of HMGA1a–DNA and HMGB1–DNA complexes (Figure 4-5). Solutions of
fixed concentration of HMGA1a(Δ50–91) or HMGB1 box AB proteins (2 µM) in the
presence of increasing concentrations of drug JNI18 were injected over the DNA
immobilized surface. The sensorgrams showed a clear decrease in RU signal when
increasing the concentration of JNI18 indicating a dose-dependent inhibition of
HMGA1a and HMGB1 binding to DNA (Figure 4-5).
Figure 4-5. (a) SPR competit ion sensorgrams showing the inhibit ion of a f ixed concentration (2 µM) of HMGA1a1a(∆50-91) (Top left panel) and HMGB1 box AB
(top r ight panel) binding to dsDNA containing [AATAAT_ATTATT] ol igonucleotide in the presence of increasing concentration of JNI18. Drug concentration range from
0.05 to 200 µM (for HMGA1a[∆50-91]) and 0.05 to 400 µM (for HMGB1). (b) Inhibit ion curves and IC50 values for inhibit ion of binding of HMGA1a(∆50-91)
( lower left panel) and HMGB1 box AB ( lower r ight panel) to dsDNA by compound JNI18.

RESULTS AND DISCUSSION: BIS(2-AMINOIMIDAZOLINE) COMPOUNDS
185 185
IC50 values, determined by fitting the inhibition data with a model according to a
competition system with 1:1 binding stoichiometry for HMGA1a(∆50-91) and HMGB1
box AB and two-site binding for competitor (Miao et al., 2008) were in the low
micromolar range (6.0 and 3.4 µM for HMGA1a and HMGB1, respectively). Thus, it can
be concluded that drug JNI18 competes with HMGA1a and HMGB1 binding to DNA
and it is able to displace the proteins from its binding sites.
4 .4 DNA-Bis(2-aminoimidazoline) Crystal lography
Assays
Crystallography assays were performed with AT-rich DNA and the bis(2-
aminoimidazoline) compounds studied following the protocol described in section 2.5
in order to obtain X-ray quality crystals and solve the 3D structure of the complex. For
this purpose, multiple crystallization conditions were screened.
For the crystallization of drugs FR60, JNI18 and CDIV32, 6-12 base pair all-AT or AT-
rich oligonucleotides used are listed in Table 4-2.
Table 4-2. Ol igonucleotide sequences used for crystal lographic assays with bis(2-aminoimidazoline) compounds.
DNA sequence Length [bp] MW [mol ·g -1]
2. ATTATTAATAAT 12 7285
4. AAATATATTT 10 6050.2
6. ATTAATTAAT 10 6050.2
11. AATTTAAATT 10 6050.2
12. ATTTATAAAT 10 6050.2
15. AAATTT 6 3580.6
16. AATAATTATT 10 6050.2
17. CATATATATG 10 6050.2
18. AATTATAATT 10 6050.2
19. ATAATATTAT 10 6050.2
Molecular weight is given in terms of DNA duplex.
DNA-drug crystallography assays were performed in individual capsules by vapor
diffusion hanging-drop technique. A set of crystallization buffers were prepared using

Chapter 3
186
the salts MgCl2, Mg(CH3COO)2, MnCl2 and NH4CH3COO in sodium cacodylate pH 6
adding spermine to get a final concentration 2:1 DNA/spermine molar ratio. In all cases,
MPD was used as precipitant (18-20% MPD initial concentration). Droplets of 3 to 4
µL size were set up. The Hampton Natrix HR2-116 number 7 and 42 were also
employed, both of them containing MgCl2 (see Appendix D). Detailed information on
the crystallization conditions used for DNA-drugs complexes is found in Appendix E.
4 .4.1 Structure of CDIV32 – d[AAATTT]2
Extensive crystallization assays were performed with complexes of DNA-CDIV32, using
several oligonucleotide sequences. However, special attention was given to the 6 bp
DNA (15) d[AAATTT]2 during this research work due to its capacity to form crystals with
the compounds studied. Crystallization screening was performed in individual capsules
using different crystallization conditions as described in Appendix E. Several crystals
appeared after 16 weeks in different droplets containing 1:2 and 1:4 DNA/drug molar
ratios using the buffers D1 and D3 (see Appendix D) (Figure 4-6).
Figure 4-6. Crystals of d[AAATTT]2 with drug CDIV32 with different morphologies .
Numerous crystals were fished and diffracted. The best crystallization condition was
obtained in the presence of Mn2+ (25 mM sodium cacodylate buffer pH 6, 0.2 mM

RESULTS AND DISCUSSION: BIS(2-AMINOIMIDAZOLINE) COMPOUNDS
187 187
oligonucleotide, 0.8 mM drug CDIV32, 0.1 mM spermine) (buffer D1, Appendix D)
against 55% MPD reservoir (Figure 4-7).
Diffraction of the best crystal (DB.5-4-1) (see Figure 4-7) was indexed and integrated
using the program iMOSFLM as orthorhombic crystalline system with a space group
C2221. The parameters of the unit cell are a = 62.79, b = 451.08 and c = 80.93; α = β
= γ = 90°. The resolution range was 69.27-3.10 Å.
Figure 4-7. Image of crystal DB.5-4-1 and diffraction pattern of ol igonucleotide (15) d[AAATTT]2 with drug CDIV32. Crystal l ization condit ions and an image of the crystal in the loop taken at the moment of the diffraction are also shown. Arrows indicate
the crystal diffracted.
The diffraction patterns of this crystal show well-defined spots of two orientations of
diffraction that are at ∼90° to each other. The best approximation of a solution was
obtained by the construction of a theoretical straight column with 16 oligonucleotides;
the model of B-form AAATTT dsDNA was generated with Turbo-Frodo (Roussel et al.,
1998) with base-pair staking of 3.25 Å, a uniform twist of 36° and Watson–Crick base-
pair pairing. The column of the stacked oligonucleotides forming a pseudo-continuous
helix was created with Pymol (Schrödinger, LLC, 2015), considering that the virtual
step T-A, in the end-to-end interaction of stacked oligonucleotides, had a negative
rotational setting angle ωT (i.e. helical twist) of about -25° for WC conformation. The
distance between oligonucleotides was adjusted to 3.446 Å by measuring the total
distance between symmetric columns. The program Molrep (Vagin and Teplyakov, 2010)

Chapter 3
188
was used for molecular replacement of the partial solution. The refinement of this
partial solution (3.10 Å, Rwork/Rfree 0.3817/0.4584, using REFMAC5 (Murshudov et al.,
2011) shows the DNA molecules are organized in a crossed column configuration of
sixteen stacked oligonucleotides at about 90° (Figure 4-8).
The presence of the CDIV32 drug has modulated this structure of oligonucleotides. In
spite of the low resolution, solving this structure could be of interest to determine if
the drug may act as a cross-linking agent, forming links between neighbour DNA
columns and consequently, causing the crossed column organization found, as reported
for alternative DNA-drug complexes (Moreno et al., 2010; Acosta-Reyes et al., 2014).
Figure 4-8. View of the packing of the model , where the crossed columns
organization and the asymmetric unit are vis ible .
The analysis of the Patterson function by Phenix.Xtriange (Zwart et al., 2005) reveals a
significant off-origin peak (0.5, 0.217, 0) corresponding to 40.46% of the origin peak,
indicating pseudo translational symmetry. This detectable translational NCS hinders
the full resolution of the structure.

RESULTS AND DISCUSSION: BIS(2-AMINOIMIDAZOLINE) COMPOUNDS
189 189
Figure 4-9. View of the electron density map at 1σ and difference map at 3σ of the stacked ol igonucleotides d[AAATTT]2 in crossed columns at 3 .10 Å resolution. The
virtual step A-T between ol igonucleotides has an hel ical twist of about -25°.
4 .4.2 Structure of FR60 – d[AAATTT]2
The lead compound FR60 was widely studied by crystallography assays with (15)
d[AAATTT]2 oligonucleotide. The crystallization of this oligonucleotide was tested in the
presence of various divalent ions (Appendix E). The best crystallization conditions were
obtained with the divalent ion Mg2+ (D2 buffer: 25 mM sodium cacodylate buffer pH 6,
0.2 mM oligonucleotide, 0.4 mM drug CDIV32, 0.1 mM spermine) (see Appendix D)
against gradually increased concentration of MPD up to 50% in the reservoir. A single
perfectly defined crystal (F6-1, see Figure 4-10 left panel) in a droplet with those
conditions appeared after 14 months.
Figure 4-10. Image of crystal F6-1 and diffraction pattern of ol igonucleotide (15)
d[AAATTT]2 with drug FR60. Crystal l ization condit ions are also shown.

Chapter 3
190
Figure 4-11. View of the different crystal lographic units of the complex. The black lozenge indicates the dyad axes. Four independent s ingle ol igonucleotides chains are shown; two of them (blue-green) form the central duplex and the other two
single strands (orange and red) form two different DNA duplexes with their symmetrical chain. Three crystal lographical ly independent drug molecules are indicated in different colours . Drug F (pink) , Drugs E (green) and G (blue) . (b) Hydrogen bonds formed by the drugs with the minor-groove atoms of the DNA
duplexes show similar interactions. The orientation of the aromatic r ings in the central drug (F , pink) differs from to the other two drugs. Drug E and G have two possible inverted posit ions in the groove; for clar ity only one of them is shown.
Image prepared with PyMOL (http://www.pymol.org) .
The single-crystal was diffracted and data was collected with a maximum resolution of
1.2 Å. Diffraction data were integrated using iMOSFLM (Battye et al., 2011) and scaled
with Aimless Pointless (Evans, 2006) from the CCP4 suite (Winn et al., 2011). The space
group turned out to be the monoclinic space group I121 with unit cell parameters (a, b,
c, α, β, γ) 22.33 40.25 72.42 90.0 93.67 90.0. A theoretical B-DNA model was
constructed using Turbo-Frodo (Roussel et al., 1998), with a base-pair stacking of
3.286 Å, a uniform twist of 36° and Watson–Crick base-pair pairing. This was a
starting search model for molecular replacement with MOLREP (Vagin & Teplyakov,
2010). Due to the lack of success after an extensive search in different monoclinic
space groups, another theoretical model was generated, formed by half of the
oligonucleotide and placed it in the correct position by molecular replacement using
Phaser (McCoy et al., 2007). The missing base pairs of the oligonucleotide were added

RESULTS AND DISCUSSION: BIS(2-AMINOIMIDAZOLINE) COMPOUNDS
191 191
with Coot (Emsley et al., 2010) following the well-defined electron density map. The
replacement was next refined with REFMAC5 (Murshudov et al., 2011) and real-space
refinement was performed with Coot.
One duplex and two single strands of DNA in the asymmetric unit were placed. The
coordinates and stereochemical restraint dictionary of the drug FR60 molecule were
generated with Phenix (Adams et al., 2010), and one drug per duplex was placed in the
minor groove of the DNA structure using Coot following the well-defined electron
density map.
Figure 4-12. (a) View of the electron density map at 1σ of the stacked
ol igonucleotides d[AAATTT]2 at 1 ,25 Å resolution. (b) OMIT 2Fo–Fc e lectron-density map (1 σ level) of the three drugs in the complex. Drug F is at the top, fol lowed by E and G below. The bottom two frames show a superposit ion of the three drugs in
two perpendicular views. Image prepared with the program CCP4mg (McNicholas et al . 2011).
The asymmetric unit in the final model contained three FR60 molecules (two of them
show half-occupancy), plus one DNA duplex and two DNA single strands. Three
complete duplexes and three drug molecules are shown in Figure 4-11 (electronic map
is displayed in Figure 4-12a). Several cycles of maximum-likelihood isotropic restrained
refinement were performed with REFMAC5 to 1.247 Å resolution. Finally, a last round
of refinement with anisotropic restrictions was completed to obtain the final values of

Chapter 3
192
Rwork/Rfree 0.1205/0.1668 in a resolution range of 36.137-1.247 Å, with a completeness
of 92.54%. Four magnesium ions were detected. A summary of crystal data and
refinement statistics is given in Table 4-3.
Table 4-3. Data col lection and refinement statist ics of the crystal F6-1.
Data col lection
Beamline BL13-XALOC, ALBA
Wavelength 0.998
Resolution range (Å) 36.14 - 1.25 (1.279 - 1.247)
Space group I 1 2 1
Unit cell parameters (Å, °) a =22.33, b = 40.25, c =72.42, α= 90.00 β = 93.67 γ = 90.00
Total reflections 245821 (22828)
Unique reflections 16801 (1594)
Multiplicity 14.7 (14.2)
Completeness (%) 92.54 (90.67)
Mean I/sigma(I) 14.1 (5.5)
Wilson B-factor 9.90
R-merge † 0.069 (0.227)
Refinement statist ics
Reflections used in refinement 15741 (1122)
Reflections used for R-free 850 (89)
R-work ‡ 0.1205 (0.141)
R-free § 0.1668 (0.200)
Number of non-hydrogen atoms 730
DNA 480
FR60 (PDB name: 6XV) 81
Water 165
Mg2+ 4
RMS(bonds) 0.022
RMS(angles) 2.52
Average B-factor, all atoms (Å2) 13.0
DNA 10.43
FR60 (PDB name: 6XV) 10.33
Water 22.38
PDB-ID 5LIT
Statistics for the highest-resolution shell are shown in parentheses. † Rmerge was calculated with Equation 2-6. ‡ Rwork
and Rfree were calculated as R following the Equation 2-9. § Rfree is the R factor evaluated for the reflections (5%) used for cross-validation during refinement.

RESULTS AND DISCUSSION: BIS(2-AMINOIMIDAZOLINE) COMPOUNDS
193 193
Solution coordinates have been deposited in the Protein Data Bank as PDB ID: 5LIT
(drug FR60 corresponds to 6XV in PDB). The DNA structural parameters were calculated
using the 3DNA software (Lu & Olson, 2003).
The asymmetric unit contains one molecule of drug F, one half-occupancy drug E and
one half-occupancy drug G. All of them interact in the middle of the DNA duplex, the
central AATT sequence, as found in several other cases (Sheng et al., 2013). The 1σ 2Fo-
Fc omit map of each drugs (F, E and G from top to bottom) are shown in Figure 4-12b,
as well as two perpendicular superposition views of the three drugs.
Drug E and G are practically identical (r.m.s. differences of 0.172 Å). Both drugs form
three hydrogen bonds with two consecutive thymines from one DNA strand (T4 and T5)
and another thymine (T5) from its symmetric strand, as shown in Figure 4-13. Values
are given in Table 4-4. The nitrogen atoms that are not hydrogen bonded to
oligonucleotides are associated with water molecules, as shown in Figure 4-13.
Figure 4-13. Schematic representation of interactions between F and G or E drugs
and d[AAATTT]2. In the crystal , drugs G and E may be found in two alternative posit ions, up and down, which are structural ly identical . Symmetric chains are
indicated with apostrophe.
The central drug molecule F has maximum r.m.s. differences of 1.250 and 1.269 Å with
drug E and G, respectively. Drug F forms also three hydrogen bonds with DNA (adenine
3 (A3) and thymine 5 (T5), both from chain A, and thymine 4 (T4) from chain B).

Chapter 3
194
Table 4-4. Hydrogen bonds formed by drug FR60 in the minor groove of d[AAATTT]2 and interactions with neighbouring phosphates.
Atoms involved Drug E Drug F Drug G
O2(T4)-N3(FR60) 3.32 3.07 3.30
O2(T5)-N22(FR60) -- 2.9 --
N3(A3)-N13(FR60) -- 3.05 --
O2(T5)-N25(FR60) 2.94 -- 2.87
O2(T5’)-N13(FR60) 3.09 -- 3.05
N10(FR60)-OP1(A3 oligo B’) -- 2.82 --
N20(FR60)-OP2(A2 oligo A’) -- 2.79 --
N25(FR60)-OP1(A2 oligo A’) -- 2.79 --
Values are given in Å.
Moreover, the drug F molecules are well positioned and centered in their corresponding
duplex, allowing that its central nitrogen atom (N3) interacts with the oxygen from
thymine 4 [O2(T4)] either in the 3’-5’ direction (drug F with chain B) or in the 5’-3’
direction (drugs G and E) (Figure 4-13). A remarkable feature of this drug is its
interactions with two phosphates from neighboring DNA molecules, as shown in Figure
4-14 and Table 4-4.
Figure 4-14. Packing of a layer of A-B duplexes. An enlarged view of the interactions of drug F with the neighbouring phosphates of symmetrical DNA chains is shown at the left . Images prepared with the program CCP4mg (McNicholas et al .
2011) .

RESULTS AND DISCUSSION: BIS(2-AMINOIMIDAZOLINE) COMPOUNDS
195 195
The duplexes are stacked and organized as infinite continuous parallel columns, which
are packed in a pseudo-tetragonal way (Figure 4-15) and stabilized in part by the
interaction of the central molecule, drug F (pink) with the DNA phosphates of
neighbouring molecules (Figure 4-14). Drug G (blue) and E (green) do not participate in
the interactions with neighbour DNA duplexes.
Figure 4-15. Views of the pseudo-tetragonal crystal packing of d[AAATTT]2 and the drug FR60. Image prepared with PyMOL (http://www.pymol.org) .
The three different DNA duplexes in the structure have similar and standard
conformational parameters. The main difference is found in the twist angles in the
pseudo base step T-A between the ends of neighbor duplexes in oligonucleotide
columns, see Figure 4-16. As found in previous studies (Campos et al., 2006), the
helical twist angle had a negative value (-21°) in the end-to-end interaction of
stacked oligonucleotides at the virtual step T-A between oligos A-B and D-D’.
Nevertheless, a peculiar feature of the present structure is the positive twist angle (29°)
between oligos A-B and C-C’, allowing these two oligonucleotides form a pseudo-
continuous B-DNA helix Figure 4-16. These differences are probably due to packing
constraints induced by interactions between neighboring duplexes (Figure 4-14).

Chapter 3
196
Figure 4-16. End-to-end interaction hel ical twist (ωT) angles of a s ingle stacked ol igonucleotide column. The virtual step T-A between ol igos A-B and D-D’ form a ωT
of -21°, while between ol igos A-B and C-C’ ωT. value is 29°. Image prepared with PyMOL (http://www.pymol.org) .
4 .5 GENERAL DISCUSSION
The binding analysis and structural studies of the interaction of the bis(2-
aminoimidazoline) compounds to AT-rich DNA were examined in this chapter.
Direct DNA binding of all compounds to a 39 bases AT-rich DNA hairpin was confirmed
by SPR. The bis(2-aminoimidazoline) derivatives CDIV32, JNI18 and FR60 were the
strongest DNA binders. However, different binding behaviors and affinities were
observed. Compound CDIV32 showed a distinctive association and dissociation
patterns.
The interaction of FR60, JNI18 and CDIV32 directly with four DNA hairpin sequences
was measured by SPR. Strong affinity was found for the three AT-rich hairpin duplexes
containing: [AATAAT_ATTATT], [AATT] and [(AT)4]. In contrast, none of the compounds
bind significantly to the dsDNA containing [(CG)4] sequences as expected for this class
of minor groove binders. This confirmed that FR60, JNI18 and CDIV32 are strong DNA
minor groove binders and specifically target AT- over GC-rich sequences.

RESULTS AND DISCUSSION: BIS(2-AMINOIMIDAZOLINE) COMPOUNDS
197 197
In addition, SPR experiments were performed in order to investigate whether the bis(2-
aminoimidazolinium) compounds could potentially compete with HMG-box proteins
for binding to DNA. It was found that compound JNI18 was able to displace HMGB1
box AB and the HMGA1a(∆50-91) proteins from their DNA binding sites.
By X-ray crystallography, structural analyses of the DNA-drug complex at the
molecular level were accomplished. The best crystals were found with the all-AT
oligonucleotide d[AAATTT]2. A crystal containing this DNA sequence with the drug
CDIV32 was studied thoroughly. The partial structure solution of the drug CDIV32 with
d[AAATTT]2 at 3.10 Å resolution indicated that DNA columns were constituted by
sixteen stacked oligonucleotides forming a pseudo-continuous helix with average
helical twist of the T-A virtual step between stacked oligonucleotides (ωT) of about -
25°. The DNA molecules were conserved a related organization of crossed column. The
drug CDIV32 could have coordinated this structure of oligonucleotides by the
formation of cross-links between crossed columns. However, the analysis of the
Patterson function revealed pseudo translational symmetry, which complicated the
resolution of the structure.
On the other hand, the crystal structure of drug FR60 in complex with the DNA
d[AAATTT]2 at atomic resolution of 1.25 Å was solved (PDB: 5LIT; FR60 PDB name:
6XV). The space group turned out to be the monoclinic I121. The asymmetric unit was
containing three FR60 drugs, one per DNA duplex, interacting with DNA in several
alternative positions (molecule F, G and E). The drugs were covered the minor groove of
the DNA duplexes, filling the central part of the minor groove [AATT]. More remarkable,
the drug was forming cross-link with neighboring DNA molecules stacked as infinite
parallel columns in pseudo-tetragonal organization. Cross-linking interactions
contribute to stabilize the crystal lattice. End to end oligonucleotides stacking were
found forming a combination of negative helical twist (-21°) and WC configuration
(positive ωT of about 29).
It has been confirmed through genomic analysis that the number of occurances of the
motif [AATT] in a kinetoplast minicircle of T. brucei Tb427WT is 14 times (Appendix G).


CHAPTER 5
EFFECT OF THE BIS(2-AMINOIMIDAZOLINES) ON
TRYPANOSOMA BRUCEI


RESULTS AND DISCUSSION: EFFECT OF THE BIS(2-AMINOIMIDAZOLINES) ON TRYPANOSOMA BRUCEI
201 201
5 .1 In vitro Activity of Bis(2-aminoimidazoline)
Compounds Against Trypanosomes
Alamar blue assays were carried out according to the protocol described in section
2.9.2, to obtain the half maximal effective concentration (EC50) values for the drugs
FR60, JNI18 and CDIV32 against T. brucei Tb427WT, pentamidine-resistant strain
TbAT1-B48 and isometamidium-resistant strain ISMR1. Compounds activity against T.
congolense wild type IL3000 and diminazine-resistant cell lines 4C2 and 6C3 were also
evaluated.
5 .1.1 Drug sensitivity in Trypanosoma brucei
As the starting hypothesis was that kDNA might be a target for the bis(2-
aminoimidazoline) compounds, they were tested in parallel against the standard T.
brucei wild type strain Tb427WT and against ISMR1 cell line (Table 5-1). ISMR1 is an
isometamidium-adapted strain (Eze et al., 2016), which is dyskinetoplastic, meaning
that the cell line has adapted to the loss of its kinetoplast. The compound CDIV32 was
also tested against the pentamidine-resistant cell line TbAT1-B48 (Table 5-2).
Table 5-1. Activity of bis(2-aminoimidazoline) compounds against T. brucei 427WT and the isometamidium-resistant strain ISMR1.
Compound EC50 [µM] ± SEM Resistance Factor
ISMR1 vs . Tb247WT
427WT a ISMR1 b
FR60 0.83 ± 0.08 c 105.26 ± 3.22 127 ***
JNI18 0.220 ± 0.06 c 28.97 ± 0.75 132 ***
CDIV32 29.98 ± 2.17 118.87 ± 4.22 4 ***
Compound EC50 [nM] ± SEM Resistance Factor
ISMR1 vs . Tb247WT
Isometamidium 0.015 ± 0.0007 1464 ± 94.56 92522 ***
EC50 values are given as mean of at least 3 independent determinations and SEM. The resistance factor (RF) is the ratio of the EC50 values of the adapted strain and the wild-type control. Statistical significance was determined using a two-tailed unpaired t-test. a Bloodstream form (BF) trypomastigotes of T. b. brucei Tb427WT. b BF trypomastigotes of T. b. brucei ISMR1.
c Reference (Eze et al., 2016). Asterisks represent P-values for statistically significant resistance, as calculated using a two-tailed unpaired Student’s t-test: ***, P-value <0.0001.

Chapter 5
202
In vitro drug sensitivity assay established that ISMR1 was highly resistant to
isometamidium (ISM) when the EC50 values of the resistant clone were compared to
those of the parent Tb427WT strain (Table 5-1) . Significant cross-resistance was
displayed by ISMR1 to the compounds FR60 and JNI18, with 127- and 132-fold
increases in EC50 values, respectively, indicating that the independence from kDNA had
made the cells resistant to the test compounds.
Table 5-2. Activity of drug CDIV23 against T. brucei TbAT1-B48.
Compound EC50 (µM) a ± SEM
CDIV32 20.82 ± 2.25
Pentamidine 0.35 ± 0.003
EC50 values are given as mean of at least 3 independent determinations and SEM. a TbAT1-B48, T. b. brucei strain that is resistant to diminazene, pentamidine, and melaminophenyl arsenicals.
Minor loss of sensitivity was shown for the compound CDIV32 for ISMR1 (4-fold),
which also presented less activity than drugs FR60 and JNI18 (36 and 136 times) to
the T. brucei 427WT. No significant cross-resistance with FR60, JNI18 nor CDIV32 was
observed to TbAT1-B48 cell line (see Table 1-5 and Table 5-2), presenting resistance
factors (AT1-B48 vs 427WT) of 1.05, 1.6 and 0.7, respectively.
5 .1.2 Drug sensitivity in Trypanosoma congolense
The bis(2-aminoimidazoline) compounds FR60, JNI18 and CDIV32 were tested against
three strains of Trypanosoma congolense (Table 5-3).
Table 5-3. Activity of bis(2-aminoimidazoline) compounds against T. congolense.
Compound EC50 (µM) ± SEM
IL3000 a 4C2 b 6C3 c
FR60 3.95 ± 0.59 2.72 ± 0.01 3.73 ± 0.53
JNI18 7.37 ± 1.37 7.27 ± 0.25 5.94 ± 0.17
CDIV32 2.07 ± 0.26 1.94 ± 0.04 2.16 ± 0.49
Compound EC50 (nM) ± SEM
Diminazine 258.5 ± 15.8 2473 ± 150 2609 ± 120
EC50 values are given as mean of at least 3 independent determinations and SEM. a Trypomastigotes of T. congolense wild type IL3000 and, b 4C2 and c 6C3 diminazine-resistant cell lines.

RESULTS AND DISCUSSION: EFFECT OF THE BIS(2-AMINOIMIDAZOLINES) ON TRYPANOSOMA BRUCEI
203 203
Compounds FR60 and JNI18 presented better activity against T. brucei 427WT than
against T. congolense IL3000WT (4.75 and 33.5 times, respectively). However, drug
CDIV32 displayed around 14 times better activity against T. congolense IL3000. No
cross-resistance was observed by the diminazine-resistant cell lines to any of the
compounds.
Next experiments were performed by testing the compounds only in Trypanosoma
brucei Tb427WT.
5 .2 In vitro Eff icacy and Effect of Bis(2-
aminoimidazoline) Compounds on Trypanosome
Growth
In order to determinate how fast these compounds act on cell proliferation and cell
survival, T. b. brucei s427WT was exposed to each compound at four different
concentrations according to their EC50: 0.5×, 1×, 2.5× and 5× EC50 values (see Table
5-1).
Figure 5-1. Effect of the bis(2-aminoimidazoline) compounds on the growth curve of bloodstream form T. brucei 427WT. Microscopic cel l counts were performed in
duplicate using a haemocytometer . The results shown are the average of the duplicate determinations. Phenylarsine oxide (PAO) 1 µM and untreated cel ls (Drug
Free Control) are taken as controls .

Chapter 5
204
Figure 5-1 shows the growth curve for all the compounds at each EC50 concentration.
Analyzing the effect of the compounds on the growth and survival of the
trypanosomes it can be implied that this set of diamidine-like derivatives tested are, in
general, effective in reducing the normal growth rate of the parasite. At concentrations
equal to the EC50 value, CDIV32, FR60, JNI18, CRMV49 and JNI17 inhibit the growth by
more than 50% compared to the untreated cells after 24 h of incubation with the
compounds.
Figure 5-2. Growth curves of untreated control (Drug Free) T. brucei 427WT and of
paral lel cultures treated with compounds FR60, JNI18 and CDIV32 at 0.5 , 1 , 2 .5 and 5× their EC50 values. Microscopic cel l counts were performed in tr ipl icate, using a
haemocytometer . Error bars show the standard error of the mean for three independent determinations.

RESULTS AND DISCUSSION: EFFECT OF THE BIS(2-AMINOIMIDAZOLINES) ON TRYPANOSOMA BRUCEI
205 205
Figure 5-2 depicts the growth curve for the four concentrations tested of the three
compounds (FR60, JNI18 and CDIV32). The initial cell concentration was 2 × 10⁴
cell/mL as described in section 2.9.3, and growth curves were produced by assessing
trypanosome counts at 4, 8, 24, 36 and 48 h after incubation with appropriate
concentrations of drugs.
Treated with 2.5 times the EC50 values, the growth rate was decreased for cells treated
with every compound compared to the control. Nevertheless, cells are still increasing
the population after the 48 h of incubation. Therefore, the compounds are affecting
the growth rate of the trypanosomes but not killing them even at those concentrations.
Drug concentrations of 0.5× and 1× EC50 (Figure 5-2a & b) do not appear to have a
significant effect on the growth curve of T. b. brucei 427WT after 24 h of incubation.
However, cell population was reduced to half when parasites are incubated with 0.5×
and 1× EC50 for 32 h. After 48 h incubated with 0.5× CDIV32 EC50, and 1× EC50
concentrations of FR60 and JNI18, two-thirds of the population of parasites was
decreased. Moreover, for concentrations above EC50 (2.5× & 5×), FR60 and JNI18
blocked almost completely the cell proliferation after the first 24 h of incubation, and
allowed only a gradual, slow increase in the cell population at 32 and 48 h of
incubation, while the compound CDIV32 blocked completely the cell proliferation after
24 h. The observations show that the compounds have a growth-limiting, trypanostatic
effect rather than an immediate trypanocidal effect.
5 .3 Cell Cycle Analysis of Bis(2-aminoimidazoline)-
Exposed Trypanosoma brucei
In the T. brucei cell cycle, replication and division of kDNA necessarily precedes nuclear
division (Gluenz et al., 2011), and bis(2-aminoimidazoline) compounds that directly
impact on kDNA are thus expected to interfere with cell division. Indeed, compounds
FR60, JNI18 and CDIV32 dose-dependently reduced T. brucei growth rates and, at
concentrations above EC50, appeared to induce growth arrest after 24 h (Figure 5-2).

Chapter 5
206
To analyze whether compounds have an effect on the cell cycle, the DNA content was
measured by flow cytometry, with emphasis on the ratio between cells with G1 phase
of cell cycle and those cells synthesizing DNA (S phase of cell cycle), as well as on the
appearance of cells in G2 phase. Moreover, in order to observe cell cycle progression in
detail, i.e. to visualise DNA configuration from nuclei and kinetoplast, fluorescence
microscopy was carried out.
Trypanosomes were exposed to the compounds during 24 h and flow cytometry assay
was performed as described in section 2.9.4.2. Cell density was adjusted to 2 × 10⁶
cells/mL, exposed with 1× and 5× EC50 concentrations of each compound and
incubated for the duration of the experiment. Samples were taken at 0, 12 and 24 hour
and a Becton Dickinson FACSCalibur was used to analyze them. Table 5-4 shows the
histograms of treated and untreated cells for 0, 12 and 24 h of one of three
independent assays performed. CellQuest™ and ©FlowJo software have been used to
analyze the flow cytometry data by modelling the histogram peaks and defining the
percentages of the population at each cell cycle phase. Thus, G1 is the non-dividing
stage of the cell, i.e. cells that have one kinetoplast and one nucleus; S phase is where
DNA replication occurs; and in G2 cells have two kinetoplasts and two nuclei.
Table 5-4. Histograms of f low cytometric analysis of propidium iodide f luorescence associated with Tb427WT trypanosomes treated with the bis(2-aminoimidazoline)
compounds.
Compound 0 h 12 h 24 h
Untreated (Control)
FR60 (EC50)

RESULTS AND DISCUSSION: EFFECT OF THE BIS(2-AMINOIMIDAZOLINES) ON TRYPANOSOMA BRUCEI
207 207
Compound 0 h 12 h 24 h
FR60 (5 × EC50)
JNI18 (EC50)
JNI18 (5 × EC50)
CDIV32 (EC50)
CDIV32 (5 × EC50)
Cells in G1 phase (blue peak) contain a single set of chromosomes; S-phase (green), DNA synthesis and G2 phase (orange), cells with 2 sets of chromosomes. Results from one of three independent experiments that produced similar results are shown. Percentage of the population at each cell cycle phase is shown above its histogram peak. Untreated cells were included in each assay as control.
The results show a clear effect of the tested compounds on the S phase of the cell
cycle after 12 h and even more remarkable alteration after 24 h of incubation (Table

Chapter 5
208
5-4 and Figure 5-3). The proportion of cells in G2 phases initially showed a slight
increase (at 12 h of treatment), and a small reduction later (after 24 h), while an
increase of cells in G1 phase was observed. The percentage of treated cells in S phase
decreased dose-dependently throughout the experiment, whereas there was no
significant change in the S phase for the control which maintained a normal growth
rate (Table 5-4).
Figure 5-3. Percentage of T. brucei 427WT in each stage of the cel l cycle after 24 h incubated with the compounds FR60, JNI18 and CDIV32. Parasites were treated with 1× and 5×EC50 values of each compound. Error bars show the standard error of the mean for three independent determinations. G1: al l cel ls have one kinetoplast and
one nucleus; G2: al l cel ls have two kinetoplast and two nucleus; S phase: DNA synthesis . Untreated cel ls (Drug Free) as control was included in each assay.
The most outstanding result to emerge from the data is the strong relationship
between the S phase and the growth curve (see Figure 5-2). A significant S phase
reduction coincides with an inhibition of the growth after 24 h treatment with the
drugs. Apparently, the observed decrease of DNA synthesis led to a reduction of growth
and finally to a complete arrest of cell proliferation.
To evaluate whether nuclear and/or kinetoplast division was affected and to observe
cell cycle progression in detail, the cellular DNA configuration was assessed by
fluorescence microscopy using the dye DAPI for compound FR60 and CDIV32 and
SYTOX® Green nuclei acid stain for compound JNI18 (as this compound fluoresces at a
similar wavelength as DAPI). Following the protocol described in section 2.9.4.2, cells
exposed to the compounds for 8 h and 24 h were scored into the following standard

RESULTS AND DISCUSSION: EFFECT OF THE BIS(2-AMINOIMIDAZOLINES) ON TRYPANOSOMA BRUCEI
209 209
groups (Figure 5-4): 1N1K (one nucleus and one kinetoplast), 1N2K (one nucleus and
two kinetoplasts), 2N2K-E (two nuclei and two kinetoplasts, but no clear furrow
towards cell division), 2N2K-L (two nuclei and two kinetoplasts when cells were almost
completely divided into two daughter cells. Another group was added to the
classification: 1N/2N (1 or 2 nuclei and no kinetoplast) due to the high incidence of
cells with such a DNA configuration after 8h (Figure 5-5a) or 24 h of treatment (Figure
5-5b).
Figure 5-4. Classif ication of the DNA content analysis . Images taken by the Zeiss
Axioskop 2 f luorescent microscope of Tb427WT cel ls stained with DAPI . The outl ine of al l cel ls is shown by DIC imaging. Images were processed using the program Fi j i
( ImageJ) . N, nucleus; K , k inetoplast; E , early stage of divis ion; L , late stage of divis ion.
In cells treated with either compound there was a dose-dependent reduction in cells
with 1 nucleus and 2 kinetoplasts, indicative of a failure to initiate a new cell division
cycle. Similarly, the number of cells in the early stages of cell division, with 2
kinetoplasts and nuclei, was approximately halved after 24 h of exposure to the
compounds. At the same time, cells without any kinetoplast (1N/2N) started to appear
in the treated populations (about 10% of cells after 24 h of exposure), having

Chapter 5
210
apparently concluded mitosis despite the non-division of the kinetoplasts. In addition,
completely aberrant cells (‘others’) also appeared in the treated cultures, which
typically contained DNA fragmentation, multiple nuclei and/or kinetoplasts, or none at
all. The combined evidence shows that the three compounds tested affect the normal
progression of the T. brucei cell cycle, most likely by preventing kinetoplast division.
Figure 5-5. DNA content of cel ls treated (a) 8 and (b) 24 h with compounds FR60, JNI18 and CDIV32 at 1× and 5× EC50 as determined by f luorescence microscopy. For
each sample, about 500 cel ls were counted and scored in terms of nuclei and kinetoplasts . N, nucleus; K , k inetoplast; 1N/2N, cel ls with one or two nuclei but no
observable kinetoplastid . E , early stage of divis ion; L , late stage of divis ion.

RESULTS AND DISCUSSION: EFFECT OF THE BIS(2-AMINOIMIDAZOLINES) ON TRYPANOSOMA BRUCEI
211 211
5 .4 Cellular Localization of the Compound JNI18
To study the cellular distribution of the bis(2-aminoimidazolinium) compounds, cells
were incubated with the fluorescent compound JNI18 (emission: 450 nm), using the
green-fluorescent SYTOX® Green nucleic acid stain (excitation/emission: 504/523 nm)
to visualize the nuclei and kinetoplasts. The T. brucei mitochondrion was further
visualized with the red-fluorescent dye MitoTracker Red CMXRos (excitation/emission:
579/599 nm), which produces a highly specific stain of T. brucei mitochondria (Vassella
et al., 1997; Huang et al., 2013).
After 3 h of exposure, compound JNI18 can just be detected inside of the cell but no
particular distribution is discernible (Figure 5-6). After 6 h, compound JNI18 shows a
homogeneous distribution throughout the cytoplasm, and is becoming concentrated in
the mitochondria. At that moment, the kinetoplast is no longer visible in many of the
cells, although the SYTOX® Green still strongly highlights the nuclei. After 24 h of
treatment, drug JNI18 seems to be even more concentrated in the mitochondrion with
intense spots of the fluorescence coinciding with the most intense MitoTracker
staining; kinetoplast staining with SYTOX® Green was absent from almost all cells.
In untreated cells grown in parallel, no changes in fluorescence were observed at the
blue wavelength that visualized JNI18, and normal kinetoplast staining with SYTOX®
Green was visualized (see Appendix F).

Chapter 5
212
Figure 5-6. Fluorescence local ization of the JNI18 in Trypanosoma brucei 427WT cel ls . Images were taken at 0, 3 , 6 and 24 h of incubation with 5 µM compound
JNI18. Al l f luorescent images are shown with compound 2 (λ=450, blue channel) , SYTOX Green (λ=523, green channel) , MitoTracker (λ=599, red channel) , and merge,
where arbitrary colours were used to visual ise the various dyes: blue for JNI18, purple for SYTOX , yel low for Mitotracker . The outl ine of al l cel ls is shown by
differential interference contrast (DIC) imaging. Images were acquired using a DeltaVision imaging system and deconvolved using the ratio conservative method,
on SoftWoRx software.

RESULTS AND DISCUSSION: EFFECT OF THE BIS(2-AMINOIMIDAZOLINES) ON TRYPANOSOMA BRUCEI
213 213
5 .5 Effect of the Bis(2-aminoimidazoline)
Derivatives on the Mitochondrial Membrane
Potential of T. brucei
In order to investigate whether the compounds affect the mitochondrial function of
the Trypanosome brucei, flow cytometry was carried out. Bloodstream forms of T.
brucei were cultured for up to 12 h in the presence and absence of compounds FR60,
JNI18 and CDIV32. Samples were taken at 0, 3, 6 and 12 h of incubation. The
quantitative changes in the mitochondrial membrane potential were measured by
using tetramethylrhodamine ethyl ester (TMRE) following the protocol described in
section 2.9.5. A shift to higher fluorescence indicates an increase of Ψm
(hyperpolarisation), whereas a shift to lower fluorescence indicates a decrease of Ψm
(depolarization) (Denninger et al., 2007). Valinomycin was used as control for
depolarization and troglitazone as control for hyperpolarization. Samples were
analyzed via flow cytometry by using a FL2-height detector and data were processed
with CellQuest and FlowJo software.
The summary of the results of three independent determinations of TMRE fluorescence
of treated and untreated cells with FR60, JNI18 and CDIV32 for 3, 6 and 12 h is shown
as a line graph in Figure 5-7. Histograms from the three determinations performed are
shown Appendix F. Values are given as the percentage of cells with fluorescence above
100 arbitrary units (AU), which was set to approximately 50% for the controls. A shift
to higher fluorescence signifies increased Ψm; lower fluorescence signifies
depolarization of the mitochondrial membrane; for the untreated cell culture, Ψm
remained stable for the duration of the experiment, at approximately 50%.
As expected, Ψm for untreated cells was remained unaffected throughout the 12 h
experiment. In contrast, valinomycin rapidly induced a deep depolarization of the
mitochondrial membrane while troglitazone induced a clear hyperpolarisation.
Compounds FR60 and JNI18 acted in a dose dependent form, progressively reducing
Ψm, with only minor effects at 3 h but significantly progressing by 6 h, and a clear,

Chapter 5
214
dose-dependent depolarization of the Ψm evident at 12 h (Figure 5-7). Slightly more
significant Ψm depolarization was caused by the compound CDIV32 at 3 h, and more
significant by 6 h as compared to the other two compounds, causing a depolarization
of about 30% an 60% when parasites are treated with 1× and 5× EC50 concentrations,
respectively. At 12 h, CDIV32 induced a deep Ψm depolarization of T. brucei (Figure
5-8).
Figure 5-7. Effect of compounds FR60, JNI18 and CDIV32 on mitochondrial membrane potential (Ψm) of T. b . brucei 427WT. The results shown are the mean of
three independent determinations; error bars depict standard errors . Untreated cel ls (drug free) , val inomycin (depolarization) and trogl itazone (hyperpolarization) are
employed as controls .
The data are consistent with mitochondrial targeting of the compounds as cations, but
their effect on the membrane potential is slower than has been reported for some
other compounds such as bisphosphonium salts, which appeared to impact directly on
the FoF1-ATPase (Alkhaldi et al., 2016).
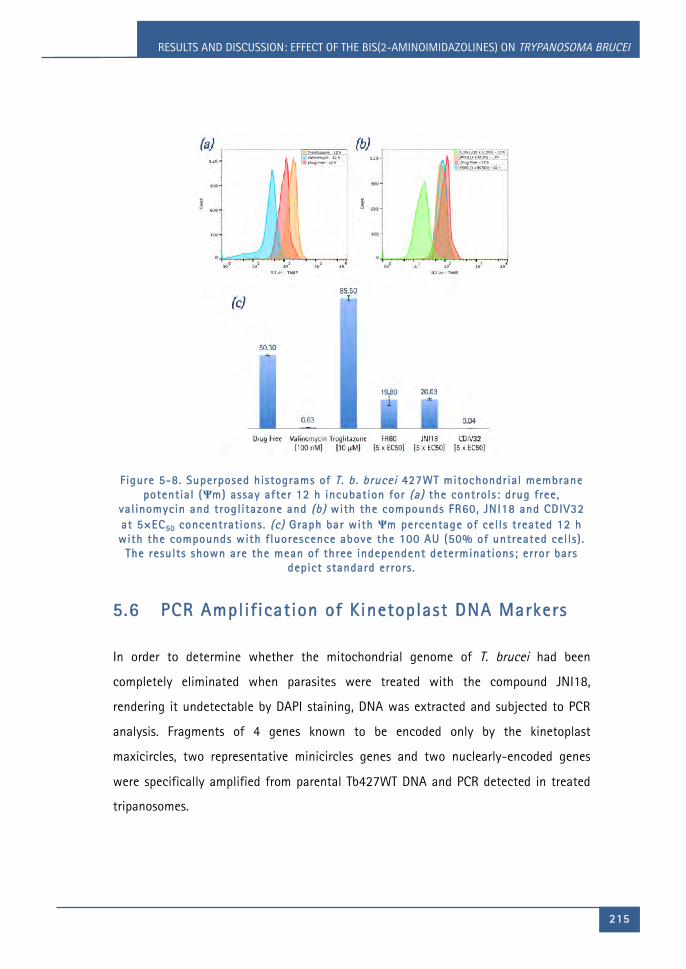
RESULTS AND DISCUSSION: EFFECT OF THE BIS(2-AMINOIMIDAZOLINES) ON TRYPANOSOMA BRUCEI
215 215
Figure 5-8. Superposed histograms of T. b . brucei 427WT mitochondrial membrane potential (Ψm) assay after 12 h incubation for (a) the controls: drug free,
val inomycin and trogl itazone and (b) with the compounds FR60, JNI18 and CDIV32 at 5×EC50 concentrations. (c) Graph bar with Ψm percentage of cel ls treated 12 h with the compounds with f luorescence above the 100 AU (50% of untreated cel ls) .
The results shown are the mean of three independent determinations; error bars depict standard errors .
5 .6 PCR Amplif ication of Kinetoplast DNA Markers
In order to determine whether the mitochondrial genome of T. brucei had been
completely eliminated when parasites were treated with the compound JNI18,
rendering it undetectable by DAPI staining, DNA was extracted and subjected to PCR
analysis. Fragments of 4 genes known to be encoded only by the kinetoplast
maxicircles, two representative minicircles genes and two nuclearly-encoded genes
were specifically amplified from parental Tb427WT DNA and PCR detected in treated
tripanosomes.

Chapter 5
216
Entire genome from trypanosomes exposed with 5 µM JNI18 for 0, 3, 6, 9, 12, 24 and
32 h were purified and forward and reverse PCR primers described in Table 2-15 were
used following the protocol described in section 2.9.8. PCR products were run on 1%
agarose gel to observe the PCR products (Figure 5-9).
Figure 5-9. PCR amplif ication of the maxicircles genes ND5, ND7 and ND4;
minicircles genes Type A and Type A –l ike; nuclearly encoded actin & TbAT-1 gene as a posit ive control for a nuclearly-encoded single copy gene from Trypanosoma brucei 427WT. T ime of exposure with the compound JNI18 is indicated above of
each band. (- ) Negative control (no DNA in the PCR sample) . (+) Posit ive control of Tb427-WT DNA.
Figure 5-9 shows that both kinetoplast and nuclear DNA standard markers were
amplified by PCR even after 32 h exposure with compound JNI18. Nevertheless, no
information was provided about the abundance or organisation of these genes in the
cell, which was therefore further investigated using Transmission Electron Microscopy
(TEM).

RESULTS AND DISCUSSION: EFFECT OF THE BIS(2-AMINOIMIDAZOLINES) ON TRYPANOSOMA BRUCEI
217 217
5 .7 Effect of Compounds FR60 and JNI18 on the
Kinetoplast Network
Transmission Electron Microscopy (TEM) was used to study the trypanosomes’
ultrastructure after exposure to 5 µM compounds FR60 and JNI18, in order to analyze
the effects of these compounds on the cellular structure of the parasite. Based on the
information obtained with the cellular localization of the compounds in the cell by
fluorescence microscopy (see section 5.4), TEM samples were taken after 3 h and 24 h
incubation, as ‘early’ and ‘late’ time points to determine the structural effects of the
compounds.
Figure 5-10 shows the TEM images for untreated cells (drug free control) after 3 and
24 h of experiment. Kinetoplast appears normal in all the cases.
Figure 5-10. TEM images showing normal ultrastructure of untreated cel ls of
Tb427WT after (a) 3 h of experiment and (b) 24 h. F , f lagel lum, FP, f lagel lum pocket , k , k inetoplast . Images were observed in a Tecnai T20 (FEI) at 200 kV.
Analyzing the images obtained with TEM of cells treated 3 h (Figure 5-11) and 24 h
(Figure 5-12), it can be confirmed that compounds FR60 and JNI18 have the same
mechanism of action in the cell. Both compounds cause ultrastructural abnormalities
in the kinetoplast, which were clearly far more severe at 24 h than at 3 h of incubation,
when many cells appeared still undamaged, i.e., the drug has not yet impacted on the
kinetoplast (top row images, Figure 5-11). However, different cells in the same

Chapter 5
218
population show dark dots or empty space inside the kinetoplast (bottom row; arrows
indicate the abnormalities), which confirm an initial level of damage in the kDNA of
some cells during the first 3 h exposure with the compounds.
Figure 5-11. TEM images showing cel ls of Tb427WT treated with (a) FR60 and (b)
JNI18 for 3 h. F , f lagel lum, k , k inetoplast . Images were observed in a Tecnai T20 (FEI) at 200 kV. Irregular structures in the kinetoplast are shown with arrows and
arrowheads, indicating kDNA damage.
Figure 5-12. TEM images showing cel ls of Tb427WT treated with (a) FR60 and (b) JNI18 for 24 h. F , f lagel lum, k , k inetoplast . Images were observed in a Tecnai T20 (FEI) at 200 kV. Irregular structures in the kinetoplast are shown with arrows and
arrowheads, indicating kDNA severe damage.

RESULTS AND DISCUSSION: EFFECT OF THE BIS(2-AMINOIMIDAZOLINES) ON TRYPANOSOMA BRUCEI
219 219
After 24 h of treatment with compounds FR60 and JNI18, all cells displayed clear
damage to kinetoplasts, which has completely lost the characteristic disk-like structure
of uniform electron-density, a structure of intercalating minicircles and maxicircles
that is essential for both the functioning and replication of the kinetoplast (Povelones,
2014). This is completely consistent with the lack of kDNA staining observed with
SYTOX Green (see Figure 5-6). Since no other structures were found to be affected at
24 h but only the mitochondrial DNA is largely absent and completely disorganised, it
can be concluded that they directly affect the kinetoplast.
5 .8 In vivo Activity in a Mouse Model of First Stage
HAT
In vivo efficacy studies were conducted at the Swiss Tropical and Public Health
Institute (Basel) according to the rules and regulations for the protection of animal
rights of the Swiss ‘Bundesant für Veterinärwesen’. They were approved by the
veterinary office of Canton Basel-stadt, Switzerland.
The in vivo activity of FR60, assessed before this research work, showed that this
compound is 100% curative in the STIB900 mouse model of acute T. b. rhodesiense
infection by intraperitoneal (4×5 mg/kg/day) and oral (4×50 mg/kg/day) dosage (Ríos
Martínez el at., 2015c; Rodríguez et al., 2008).
During this work, the in vivo activity of JNI18 against T. b. rhodesiense was assessed in
the same mouse model. For that reason, JNI18 was administered to a group of four
female NMRI mice by intraperitoneal route using a 4-day treatment regimen of 20
mg/kg/day using a previously reported protocol described in Ríos Martínez et al., 2014.
Parasitemia was monitored over a 60-day observation period. Mice were considered
cured when no relapse was detected in the tail blood over the observation period.
The intraperitoneal administration of JNI18 at 4×4 mg/kg/day increased the mean day
of relapse of parasitemia (17.5 days) in mice although no cures were obtained.
However, a 5-fold higher dosage (4×20 mg/kg/day i.p.) provided a 100% cure rate in
this mouse model of stage 1 HAT.

Chapter 5
220
5 .9 GENERAL DISCUSSION
Trypanocidal dications such as diamidines and bisimidazolinium compounds have long
been speculated to act on mitochondrial targets (Lanteri et al., 2008; Roy Chowdhury
et al., 2010) and some clearly bind to DNA (see section 1.6.1.1). However, although
their abilities to act as minor groove binding drugs (MGBD) are well established, it is
much less clear whether this is necessarily the principal trypanocidal mode of action,
and whether binding to kDNA and/or nuclear DNA contributes most to cell death. In
this chapter is presented the most comprehensive analysis to date that one class of
aromatic dications, the bis(2-aminoimidazolines), directly act on the kinetoplast.
Significant resistance (>100-fold) by the dyskinetoplastic cell line ISMR1, relative to
the wild type cell line, indicated the kinetoplast as a probable target of compounds
FR60 and JNI18. Moreover, a study of the T. brucei cell cycle by flow cytometry showed
that incubation with the FR60, JNI18 and CDIV32 compounds caused a progressive cell
cycle arrest in G1 phase, reflected in the major decrease in S-phase cells after 24 h.
The failure to initiate DNA synthesis was almost certainly the result of damage to the
kinetoplast, as kDNA division necessarily precedes nuclear division (McKean, 2003), and
both fluorescence microscopy and TEM showed major damage to the kinetoplast but
not to the nucleus. Starting at just 8 h, as fluorescent compound JNI18 had
accumulated in the mitochondrion, significant numbers of cells were found without an
observable kinetoplast or with one kinetoplast and two, or even three nuclei, which
clearly evidence a defect in kinetoplast replication. By 24 hours this was leading to the
gross destruction and/or disorganisation of the kinetoplast as observed by TEM and
concomitant growth arrest. Importantly, the electron microscopy did not reveal any
damage to the nuclei or other cellular structures.
Despite the absence of ultrastructural damage to the mitochondrion, Ψm began to
decrease from 6 h of incubation. In bloodstream trypanosomes, which lack the
common oxidative phosphorylation complexes, Ψm is generated by the FoF1 ATPase
pumping protons from the mitochondrial matrix, using ATP (Dean, et al., 2013;
Schnaufer et al., 2005; Bhat et al., 1990) clearly this process would progressively be

RESULTS AND DISCUSSION: EFFECT OF THE BIS(2-AMINOIMIDAZOLINES) ON TRYPANOSOMA BRUCEI
221 221
impeded as the lack of functional kDNA precludes the production of the A6 subunit of
Fo, leading to the slow membrane depolarization observed. Accumulation of cationic
compounds in the mitochondria, driven by the negative electrostatic potential
(negative inside), is a well-described phenomenon for cationic and dicationic
compounds (Ibrahim et al., 2011; Alkhaldi et al., 2016; Fueyo Gonzalez et al., 2017) but
the relatively slow effect of compounds FR60 and JNI18 on the Ψm compared with
CDIV32, and with that of compounds that act directly on the F1F0-ATPase complex
(Alkhaldi et al., 2016) is consistent with the hypothesis that the antiparasitic effect
derives from preventing the accurate replication of kDNA and consequently the
assembly of F0.
Altogether, these results show that the N-phenylbenzamide bis(2-aminoimidazolinium)
compounds FR60 and JNI18 act specifically on the kinetoplast DNA of the T. brucei by
altering its structure and replication.
Finally, the in vivo screening for trypanocidal activity against Trypanosoma brucei
rhodesiense of compounds FR60 and JNI18 showed, for both compounds, 100%
curative action in a mouse model of first stage Human African Trypanosomiasis (HAT).


CONCLUSIONS

CONCLUSIONS
225 225
CONCLUSIONS
Part I . DNA–ligand interactions
1. HMGA1a (∆50-91) as well as HMGB1 box B and HMGB1 box AB fragments were
expressed in E. coli strain Rosetta (DE3) pLysS and purified.
2. A clear supercoiling effect on circular DNA was induced by HMGA1a (∆50-91),
demonstrating its functionality and unwinding activity.
3. Surface plasmon resonance (SPR) successfully demonstrated a strong binding
affinity of the HMGA1a and HMGB proteins towards an immobilized AT-rich DNA
oligonucleotide containing [AATAAT_ATTATT]. The KD was found similar and in the
low micromolar range for both proteins (KD =0.35 × 10⁻⁶ M and KD =0.33 × 10⁻⁶ M,
respectively).
4. After more than 100 crystallization assays with 6 different AT-rich
oligonucleotides and the protein HMGA1a (∆50-91), the appropriate
crystallization condition was not found.
5. Numerous crystallization trials with the HMGB box B and 10 different AT-rich
oligonucleotides were performed, from which 20 crystals suitable for X-ray
crystallography were diffracted.
6. A crystal of HMGB1 box B in complex with the 20 bp oligonucleotide
d[CCAATAATCGCGATTATTGG]2 diffracted to 2.68 Å resolution, presented well-
defined spots revealing two diffraction orientations. The space group was P22121
with a = 29.94 Å, b = 89.65 Å, c = 109.1 Å, α = β = γ = 90°.
7. The capacity of bis(2-aminoimidazoline) compounds to selectively bind AT-rich
sequences over CG-containing DNA was confirmed by SPR. All KD were found in
the submicromolar range.

CONCLUSIONS
226
8. Compound JNI18 was able to displace the HMG proteins from their DNA binding
sites, showing IC50 values for inhibition of binding of 6.0 µM and 3.4 µM for
HMGA1a and HMGB1, respectively.
9. Several crystallization trials with the bis(2-aminoimidazolines) FR60, JNI18 and
CDIV32 and 10 different AT-rich oligonucleotides permitted the diffraction of
about 50 crystals suitable for X-ray crystallography.
10. The compound CDIV32 in complex with the all-AT oligonucleotide d[AAATTT]2 was
crystallized in a pseudo-continuous helix, packed in a crossed column
configuration. Sixteen stacked oligonucleotides with average helical twist of
about -25° conformed the asymmetrical unit. The cell parameters were a = 62.79
Å, b = 451.08 Å and c = 80.93 Å; α = β = γ = 90° in C2221 space group. The drug
modulates the crossed helical arrangement. Pseudo translational symmetry
detected in the crystal impeded complete resolution of the structure.
11. Crystal structure of the FR60-d[AAATTT]2 complex at atomic resolution of 1.25 Å
revealed important features: FR60 interacts in the middle of the DNA duplex, the
central [AATT] sequence; it fills the minor groove of the all-AT oligonucleotide
and displaces water from the hydration spine. The drug also protrudes from DNA,
forming hydrogen bond interactions with phosphates from neighboring DNA
molecules acting as a cross-linking agent. This originates the packing in a
pseudo-tetragonal configuration.
Part I I . Functional analysis of the effect of bis(2-aminoimidazol ine)
compounds on Trypanosoma brucei
1. In vitro drug sensitivity assays established that T. brucei isometamidium-adapted
dyskinetoplastic cell line ISMRI was highly resistant to compounds FR60 and
JNI18 when EC50 values were compared to those of the Trypanosoma brucei
Tb427 wild type strain, pointing to kDNA as a target for these compounds.

CONCLUSIONS
227 227
2. A series of FR60 derivatives and CDIV32 dose-dependently reduced the T. brucei
growth rates and, at concentrations above EC50 appeared to induce growth arrest
after 24 h.
3. Bis(2-aminoimidazolines) FR60, JNI18 and CDIV32 caused a progressive cell cycle
arrest in G1 phase, as reflected by a major decrease in S-phase cells after 24 h.
4. Failure to initiate a new cell division cycle in treated T. brucei was confirmed by
the reduction of cell population replicating the kinetoplast (kDNA).
5. FR60 and JNI18 drugs caused a slow decline in mitochondrial membrane
potential (Ψm) of T. brucei, showing its partial depolarization after a 12 h
exposure. Compound CDIV32 reduced the Ψm more strongly at 6 h exposure, and
completely after 12 h of treatment.
6. Fluorescent compound JNI18 (a chloro derivative of the lead FR60) tended to
accumulate in the mitochondrion of T. brucei. Cells showed a homogeneous
distribution throughout the cytoplasm after 6 h of treatment with the drug, but a
visible accumulation in the mitochondrion after 24 h exposure.
7. TEM images of trypanosomes treated with FR60 and JNI18 showed dark dots or
empty space inside the kinetoplast, confirming initial kDNA damage. After 24 h,
kinetoplast was largely absent and completely disorganized. No damage to the
nuclei or other cellular structures was displayed.
8. Compounds JNI18 and FR60 share the same mechanism of action and cellular
target against Trypanosoma brucei, acting specifically on the integrity of the
kinetoplast by altering the structure and replication of kDNA. Direct effect on
kinetoplast DNA causing the destruction of the network was confirmed.
9. As both compounds showed 100% curative activity in a mouse model of T. brucei
rhodesiense infection, they have a potential as effective chemotherapeutic agents
for the treatment of sleeping sickness.


PUBLICATION
229 229
PUBLICATION RELATED TO THIS
THESIS Millan, C. R., Acosta-Reyes, F. J., Lagartera, L., Ebiloma, G. U., Lemgruber, L.,
Nué Martínez, J. J., Saperas, N., Dardonville, C., de Koning, H. P., & Campos, J. L.
(2017). Functional and structural analysis of AT-specific minor groove binders that
disrupt DNA–protein interactions and cause disintegration of the Trypanosoma brucei
kinetoplast. Nucleic Acids Research. https://doi.org/10.1093/nar/gkx521
ABSTRACT
Trypanosoma brucei, the causative agent of sleeping sickness (Human African
Trypanosomiasis, HAT), contains a kinetoplast with the mitochondrial DNA (kDNA),
comprising of >70% AT base pairs. This has prompted studies of drugs interacting with
AT-rich DNA, such as the N-phenylbenzamide bis(2-aminoimidazoline) derivatives 1
[4-((4,5-dihydro-1Himidazol-2-yl)amino)-N-(4-((4,5-dihydro-1H-imidazol-2-yl)amino)
phenyl)benzamide dihydrochloride] and 2 [N-(3-chloro-4-((4,5-dihydro-1H-imidazol-
2-yl)amino)phenyl)-4-((4,5-dihydro-1H-imidazol-2-yl)amino)benzamide] as potential
drugs for HAT. Both compounds show in vitro effects against T. brucei and in vivo
curative activity in a mouse model of HAT. The main objective was to identify their
cellular target inside the parasite. We were able to demonstrate that the compounds
have a clear effect on the S-phase of T. brucei cell cycle by inflicting specific damage
on the kinetoplast. Surface plasmon resonance (SPR)–biosensor experiments show that
the drug can displace HMG box-containing proteins essential for kDNA function from
their kDNA binding sites. The crystal structure of the complex of the oligonucleotide
d[AAATTT]2 with compound 1 solved at 1.25 °A (PDB-ID: 5LIT) shows that the drug
covers the minor groove of DNA, displaces bound water and interacts with
neighbouring DNA molecules as a cross-linking agent. We conclude that 1 and 2 are
powerful trypanocides that act directly on the kinetoplast, a structure unique to the
order Kinetoplastida.


APPENDIXES


APPENDIXES
233 233
APPENDIXES
Appendix A
IPTG INDUCTION OF PROTEIN EXPRESSION
Isopropyl β-D-1-thiogalactopyranoside (IPTG) is a molecular mimic of allolactose, a
lactose metabolite that triggers transcription of the lac operon, and it is therefore used
to induce recombinant protein expression where the gene is under the control of the
lac operator.
Usually, the gene of interest is inserted into a commercial vector pET that contains: (1)
a gene coding for antibiotic resistance (e.g. ampR); (2) the lacI gene (lac Iq) from the lac
operon that codes for the lac repressor (LacI); and (3) the gene of interest inserted just
after the T7 promoter DNA sequence, the lac operator DNA sequence, and the ribosome
binding site (at the start of the future mRNA transcript).
The lac repressor protein (LacI) evolved to sense the presence of lactose. In the absence
of lactose, the lac repressor binds to the operator sequence on DNA and bends the DNA
by 40° (as seen in the crystal structure PDB ID: 1EFA). This blocks access of T7 RNA
polymerase to the promoter site and thus prevents leaky transcription of the gene
before induction.
When lactose binds to LacI it induces a conformational change in the protein structure
that renders it incapable of binding to the operator DNA sequence. IPTG, like
allolactose, also binds to the lac repressor and induces a similar conformational change
(PDB ID: 2P9H) that greatly reduces its affinity for DNA. Unlike lactose, IPTG is not part
of any metabolic pathways and so will not be broken down or used by the cell. This
ensures that the concentration of IPTG added remains constant, making it a more
useful inducer of the lac operon than lactose itself.

APPENDIXES
234
Figure A1. Mechanism of action of the IPTG induction. Image taken from https://www.goldbio.com/blog/493/a-deep-dive- into- iptg- induction.

APPENDIXES
235 235
Appendix B
CULTURE MEDIA
§ HMI-9 medium (10% FCS)
A pack of HMI-9 powder (Gibco®) was emptied into a 5-litre capacity beaker, followed
by 4.5 L of ddH2O and 15 g of NaHCO3. After stirring on a magnetic stirrer for about 1
h at room temperature, 500 mL of FBS (Fetal Bovine Serum; Gibco®) and 71.5 µl of β-
mercaptoethanol were added. The solution was left stirring overnight at 4°C. The pH
was adjusted to 7.4 the next day. Finally, the media was filtered into 10 sterile 500 ml
reagent bottles and stored at 4°C.
§ TcBCF-3 medium
Table B-1. Trypanosoma congolense culture media TcBCF-3 composit ion.
Basal medium (mM) Supplements (mM)
Serum (% v/v)
Base powder Hep Gluc Pyr Ade Hypo Thy Bac Gln 2 Me RBC FGS SP MEM 25 5.5 1 0.04 0.1 0.02 0.02 2 0.2 0.5 20 5 MEM, Eagle's Minimum Essential Medium powder medium (M0643, Sigma-Aldrich), supplemented with 2.2 g of sodium bicarbonate (Sigma-Aldrich). Basal medium components were resuspended in 1 L Versol water (Revol, Villeurbanne) and after adjustment of the pH to 7.3 with 5 N NaOH, the medium was filter sterilized (Millipore 0.22 um), stored at 4°C and used within 10 days. Before use, basal medium was supplemented with the components listed (Sigma-Aldrich) and serum. Hep, HEPES Acid; Gluc, D-Glucose; Pyr, Sodium Pyruvate; Ade, Adenosine; Hypo, Hypoxanthine; Thy, Thymidine; Bac, Bathocuproin; Gln, Glutamine; 2 Me, 2-mercaptoethanol. RBC, Red Blood Cell lysate was obtained after centrifugation (1 min 2000 rpm) of 100 µl of mouse blood, and resuspending of the pellet in 50 µl sterile distilled water. FGS, Fresh Goat Serum; SP, Serum Plus (SAFC Biosciences, United Kingdom).

APPENDIXES
236
BUFFER SOLUTIONS
Table B-2. Hanks' Balanced Salt Solution (HBSS) formulation.
Components Molecular Weight
Concentration
[mg/L] [mM]
Inorganic Salts
Calcium Chloride (CaCl2) (anhyd.) 111.0 140.0 1.2612612
Magnesium Chloride (MgCl2-6H2O) 203.0 100.0 0.49261084
Magnesium Sulfate (MgSO4-7H2O) 246.0 100.0 0.40650406
Potassium Chloride (KCl) 75.0 400.0 5.3333335
Potassium Phosphate monobasic (KH2PO4) 136.0 60.0 0.44117647
Sodium Bicarbonate (NaHCO3) 84.0 350.0 4.1666665
Sodium Chloride (NaCl) 58.0 8000.0 137.93103
Sodium Phosphate dibasic (Na2HPO4) anhydrous
142.0 48.0 0.33802816
Other Components
D-Glucose (Dextrose) 180.0 1000.0 5.5555553
HBSS, calcium, magnesium, no phenol red. Hanks & Wallace, 1949.
Table B-3. Electrophoresis buffers .
Buffer Working Solution Stock Solution [per 1 L]
TAE 1× 40 mM Tris-acetate 1 mM EDTA
50x 242 g Tris base 57.1 mL of glacial acetic acid 100 mL of 0.5 M EDTA (pH 8.0)
TPE 1× 90 mM Tris-phosphate 2 mM EDTA
10x 108 g Tris base 15.5 mL of phosphoric acid (85%, 1.679 g/mL) 40 mL of 0.5 M EDTA (pH 8.0)
TBE 1× 90 mM Tris-phosphate 2 mM EDTA
5× 54 g Tris base 27.5 g of boric acid 20 mL of 0.5 M EDTA (pH 8.0)
Passing the concentrated buffer stocks through a 0.45-µm filter can prevent or delay formation of precipitates.

APPENDIXES
237 237
Appendix C
RELEVANT SPECIFICATIONS OF THE USED SYNCHROTRON LINE
Beamline Xaloc bl13
§ Source type bending magnet
§ Energy Range: 5-22 keV
§ Wavelength Range: 2.4-0.58 Å
§ 12-foil attenuators ESRF type
§ Fast shutter: FPS400 CEDRAT
§ Slits: JJ-Xray ESRF type
§ Automatic Sample Changer: CATS - IRELEC
§ Detector: PILATUS 6M - Dectris
§ Cryostream: 700 series - Oxford Cryosystems
§ Monochromator: Si(111) channel-cut, cryocooled
§ KB Mirrors, Elliptically bent mirror (Si, Rh, Ir) (2)

APPENDIXES
238
Appendix D
CRYSTALLIZATION CONDITIONS
Table D-1. Crystal l ization Kit Natrix HR2-116 Hampton.
No. Composit ion
1 0.01 M Mg Chloride, 0.05 M MES pH 5.6, 2.0 M Lithium Sulfate
2 0.01 M Mg Acetate, 0.05 M MES pH 5.6, 2.5 M Ammonium Sulfate
3 0.1 M Mg Acetate, 0.05 M MES pH 5.6, 20% MPD
4 0.2 M K Chloride, 0.01 M Mg Sulfate, 0.05 M MES pH 5.6, 10% PEG 400
5 0.2 M K Chloride, 0.01 M Mg Chloride, 0.05 M MES pH 5.6, 5% PEG 8000
6 0.1 M Ammonium Sulfate, 0.01 M Mg Chloride, 0.05 M MES pH 5.6, 20% PEG 8000
7 0.02 M Mg Chloride, 0.05 M MES pH 6.0, 15% iso-Propanol
8 0.005 M Mg Sulfate, 0.1 M Ammonium Acetate, 0.05 M MES pH 6.0, 0.6 M NaCl
9 0.1 M K Chloride, 0.01 M Mg Chloride, 0.05 M MES pH 6.0, 10% PEG 400
10 0.005 M Mg Sulfate, 0.05 M MES pH 6.0, 5% PEG 4000
11 0.01 M Mg Chloride, 0.05 M Na Cacodylate pH 6.0, 1.0 M Lithium Sulfate
12 0.01 M Mg Sulfate, 0.05 M Na Cacodylate pH 6.0, 1.8 M Lithium Sulfate
13 0.015 M Mg Acetate, 0.05 M Na Cacodylate pH 6.0, 1.7 M Ammonium Sulfate
14 0.1 M K Chloride, 0.025 M Mg Chloride, 0.05 M Na Cacodylate pH 6.0, 15% iso-Propanol
15 0.04 M Mg Chloride, 0.05 M Na Cacodylate pH 6.0, 5% MPD
16 0.04 M Mg Acetate, 0.05 M Na Cacodylate pH 6.0, 30% MPD
17 0.2 M K Chloride, 0.01 M Ca Chloride, 0.05 M Na Cacodylate pH 6.0, 10% PEG 4000
18 0.01 M Mg Acetate, 0.05 M Na Cacodylate pH 6.5, 1.3 M Lithium Sulfate
19 0.01 M Mg Sulfate, 0.05 M Na Cacodylate pH 6.5, 2.0 M Ammonium Sulfate
20 0.1 M Ammonium Acetate, 0.015 M Mg Acetate, 0.05 M Na Cacodylate pH 6.5, 10% iso-Propanol
21 0.2 M K Chloride, 0.005 M Mg Chloride, 0.05 M Na Cacodylate pH 6.5, 10% 1,6 Hexanediol
22 0.08 M Mg Acetate, 0.05 M Na Cacodylate pH 6.5, 15% PEG 400
23 0.2 M K Chloride, 0.01 M Mg Chloride, 0.05 M Na Cacodylate pH 6.5, 10% PEG 4000
24 0.2 M Ammonium Acetate, 0.01 M Ca Chloride, 0.05 M Na Cacodylate pH 6.5, 10% PEG 4000
25 0.08 M Mg Acetate, 0.05 M Na Cacodylate pH 6.5, 30% PEG 4000
26 0.2 M K Chloride, 0.1 M Mg Acetate, 0.05 M Na Cacodylate pH 6.5, 10% PEG 8000
27 0.2 M Ammonium Acetate, 0.01 M Mg Acetate, 0.05 M Na Cacodylate pH 6.5, 30% PEG 8000
28 0.05 M Mg Sulfate, 0.05 M HEPES - Na pH 7.0, 1.6 M Lithium Sulfate
29 0.01 M Mg Chloride, 0.05 M HEPES - Na pH 7.0, 4.0 M Lithium Chloride
30 0.01 M Mg Chloride, 0.05 M HEPES - Na pH 7.0, 1.6 M Ammonium Sulfate
31 0.005 M Mg Chloride, 0.05 M HEPES - Na pH 7.0, 25% PEG Monomethyl Ether 550

APPENDIXES
239 239
32 0.2 M KCl, 0.01 M Mg Chloride, 0.05 M HEPES - Na pH 7.0, 20% 1,6 Hexanediol
33 0.2 M Ammonium Chloride, 0.01 M Mg Chloride, 0.05 M HEPES - Na pH 7.0, 30% 1,6 Hexanediol
34 0.1 M K Chloride, 0.005 M Mg Sulfate, 0.05 M HEPES - Na pH 7.0, 15% MPD
35 0.1 M K Chloride, 0.01 M Mg Chloride, 0.05 M HEPES - Na pH 7.0, 5% PEG 400
36 0.1 M K Chloride, 0.01 M Ca Chloride, 0.05 M HEPES - Na pH 7.0, 10% PEG 400
37 0.2 M K Chloride, 0.025 M Mg Sulfate, 0.05 M HEPES - Na pH 7.0, 20% PEG 200
38 0.2 M Ammonium Acetate, 0.15 M Mg Acetate, 0.05 M HEPES - Na pH 7.0, 5% PEG 4000
39 0.1 M Ammonium Acetate, 0.02 M Mg Chloride, 0.05 M HEPES - Na pH 7.0, 5% PEG 8000
40 0.01 M Mg Chloride, 0.05 M Tris HCl pH 7.5, 1.6 M Ammonium Sulfate
41 0.1 M KCl, 0.015 M Mg Chloride, 0.05 M Tris HCl pH 7.5, 10% PEG Monomethyl Ether 550
42 0.01 M Mg Chloride, 0.05 M Tris HCl pH 7.5, 5% iso-Propanol
43 0.01 M Mg Chloride, 0.05 M Ammonium Acetate, 0.05 M Tris HCl pH 7.5, 10% MPD
44 0.2 M K Chloride, 0.05 M Mg Chloride, 0.05 M Tris HCl pH 7.5, 10% PEG 4000
45 0.025 M Mg Sulfate, 0.05 M Tris HCl pH 8.5, 1.8 M Ammonium Sulfate
46 0.005 M Mg Sulfate, 0.05 M Tris HCl pH 8.5, 35% 1,6 Hexanediol
47 0.1 M K Chloride, 0.01 M Mg Chloride, 0.05 M Tris HCl pH 8.5, 30% PEG 400
48 0.01 M Ca Chloride, 0.2 M Ammonium Chloride, 0.05 M Tris HCl pH 8.5, 30% PEG 4000

APPENDIXES
240
Table D-2. Crystal l ization condit ions for DNA-HMG protein complex.
Name Ion Buffer pH Precipitants Addit ive
C1 10 mM NH4(OAc) 25 mM NaCac 6 3% PEG 3350 1 mM DTT
C2 10 mM NH4(OAc) 25 mM NaCac 6 5% MPD 1 mM DTT
C3 10 mM Mg(OAc)2 25 mM NaCac 6 3% PEG 3350 1 mM DTT
C4 10 mM Mg(OAc)2 25 mM NaCac 6 5% MPD 1 mM DTT
C5 10 mM MgCl2 25 mM NaCac 6 3% PEG 3350 1 mM DTT
C6 10 mM MgCl2 25 mM NaCac 6 5% MPD 1 mM DTT
C7 10 mM CaCl2 25 mM NaCac 6 3% PEG 3350 1 mM DTT
C8 10 mM CaCl2 25 mM NaCac 6 5% MPD 1 mM DTT
C9 12.5 mM MgCl2 25 mM NaCac 6 5% MPD 1 mM DTT
C10 7.5 mM MgCl2 25 mM NaCac 6 5% MPD 1 mM DTT
T1 10 mM NH4(OAc) 25 mM Tris-HCl 7.5 3% PEG 3350 1 mM DTT
T2 10 mM NH4(OAc) 25 mM Tris-HCl 7.5 5% MPD 1 mM DTT
T3 10 mM Mg(OAc)2 25 mM Tris-HCl 7.5 3% PEG 3350 1 mM DTT
T4 10 mM Mg(OAc)2 25 mM Tris-HCl 7.5 5% MPD 1 mM DTT
T5 10 mM MgCl2 25 mM Tris-HCl 7.5 3% PEG 3350 1 mM DTT
T6 10 mM MgCl2 25 mM Tris-HCl 7.5 5% MPD 1 mM DTT
T7 10 mM CaCl2 25 mM Tris-HCl 7.5 3% PEG 3350 1 mM DTT
T8 10 mM CaCl2 25 mM Tris-HCl 7.5 5% MPD 1 mM DTT
T9 12.5 mM MgCl2 25 mM Tris-HCl 7.5 5% MPD 1 mM DTT
T10 7.5 mM MgCl2 25 mM Tris-HCl 7.5 5% MPD 1 mM DTT
T11 7 mM MgCl2 25 mM Tris-HCl 7.5 5% MPD 1 mM DTT 40 mM NaCl
T12 7 mM MgCl2 25 mM Tris-HCl 7.5 5% MPD 1 mM DTT 40 mM NaCl
CA1 10 mM Mg(OAc)2 25 mM NaCac 6 - -
CA2 10 mM MgCl2 25 mM NaCac 6 - -
CA3 25 mM Mg(OAc)2 25 mM NaCac 6 - -
CA4 25 mM MgCl2 25 mM NaCac 6 - -
TA1 10 mM Mg(OAc)2 25 mM Tris-HCl 7.5 - -
TA2 10 mM MgCl2 25 mM Tris-HCl 7.5 - -
TA3 25 mM Mg(OAc)2 25 mM Tris-HCl 7.5 - -
TA4 25 mM MgCl2 25 mM Tris-HCl 7.5 - -
OAc; acetate.

APPENDIXES
241 241
Table D-3. Crystal l ization condit ions for the DNA and N-phenylbenzamide bis(2-aminoimidazolinium) compounds complexes.
Name Ion Buffer pH Precipitants Addit ives
D1 8 mM MnCl2 25 mM NaCac 6 5% MPD 0.1 mM Spermine
D2 10 mM Mg(OAc)2 25 mM NaCac 6 5% MPD 0.1 mM Spermine
D3 8 mM MgCl2 25 mM NaCac 6 5% MPD 0.1 mM Spermine
D4 10 mM NH4(OAc) 25 mM NaCac 6 5% MPD 0.1 mM Spermine
D2.2 8 mM Mg(OAc)2 25 mM NaCac 6 5% MPD 0.1 mM Spermine
D4.2 8 mM NH4(OAc) 25 mM NaCac 6 5% MPD 0.1 mM Spermine
OAc; acetate.

APPENDIXES
242
Appendix E
CRYSTALLIZATION CONDITIONS
Table E-1. Crystal l ization assays with DNA-HMGA1a protein complexes.
Complex with HMGA1a(∆50-91)
DNA Sequence
DNA [mM]
Ratio [DNA/Prot]
Buffer Reservoir final concentration [% MPD]
Observations
CCAATAATCGCGATTATTGG 0.1 0.1 0.2 0.25
1:2 1:4 1:6 1:8
Natrix HR2-116: 7, 15, 16, 25, 31, 42, 43, 46. T6, T9, T11, T12 CA1, CA2, CA3, CA4, TA1, TA2, TA3, TA4.
0.25 mM NiCl2
Up to 69% -Phase separation -Liquid crystals -Amorphous precipitate -Crystalline points
ATTATTAATAAT 0.1 0.2 0.3
1:2 1:4 1:8
Natrix HR2-116: 15, 16, 25, 43, 48.
Up to 70% Phase separation Liquid crystals
AATATATATATT 0.3 0.2
1:3 1:6 1:9
Natrix HR2-116: 7, 15, 16, 43.
Up to 55% -Phase separation -Amorphous precipitate
AAATATATTT 0.3 0.2 0.15
1:4 1:6 1:8
Natrix HR2-116: 7, 15, 16, 43.
Up to 55% -Phase separation -Crystalline precipitate
CGAATTAATTCG 0.2
1:4
Natrix HR2-116: 43 T6, T9, T11, T12 CA1, CA2, CA3, CA4, TA1, TA2, TA3, TA4.
0.25 mM NiCl2
Up to 50% -Amorphous precipitate -Crystalline points
ATTAATTAAT 0.2 1:4
T6, T9, T11, T12 Up to 50% -Amorphous precipitate

APPENDIXES
243 243
Table E-2. Crystal l ization assays with DNA-HMGB1 proteins complexes.
Complex with HMGB1 box B and box AB
DNA Sequence
DNA [mM]
Ratio [DNA/Prot]
Buffer Reservoir final conc. [%]
Observations
CCAATAATCGCGATTATTGG
0.2 0.4
1:2 1:4
Natrix HR2-116: 15, 43. T1-T10 (T6, T9) C1-C10 (C9)
MPD: Up to 69% PEG 3350: 20%, 30%, 40%
-Rectangular crystals -Amorphous crystals -Crystalline sheets
ATTAATTAAT
0.25 0.4
1:2
Natrix HR2-116: 15, 43. T6, T9, T10 C6, C9, C10
Up to 70% -Phase separation -Liquid crystals -Small rods and needles
AATAAATTTATT
0.2 0.4
1:2 C1-C8 T1-T10 (T6, T9, T10)
MPD: 30%, 40%, 50%. PEG 3350: 20%, 30%, 40%
-Precipitate -Small needles - Amorphous crystals - Small rectangular crystals -Crystals with different morphologies
ATATGCATAT
0 .2 0.4
1:2 C1-C8 T1-T8
MPD: 30%, 40%, 50%. PEG 3350: 20%, 30%, 40%
-Phase separation -Liquid crystals -Amorphous precipitate
ATATCGATAT
0 .2 0.4 0.6
1:2 C1-C8 T1-T8
MPD: 30%, 40%, 50%. PEG 3350: 20%, 30%, 40%
-Phase separation -Amorphous precipitate
AATAATCGCGATTATT
0.2 0.25
1:3 1:4
Natrix HR2-116: 15, 43. C1-C8 T1-T10
MPD: Up to 70%
-Phase separation -Liquid crystals
AATTTAAATT
0.2
1:2 1:4
Natrix HR2-116: 15. T6, T9, T10 C6, C9, C10
MPD: Up to 50%
-Phase separation -Crystalline points -Small rectangular crystals
ATTTATAAAT
0.2
1:2
Natrix HR2-116: 15. T6, T9 C6, C9
MPD: Up to 50%
-Phase separation -Crystalline points
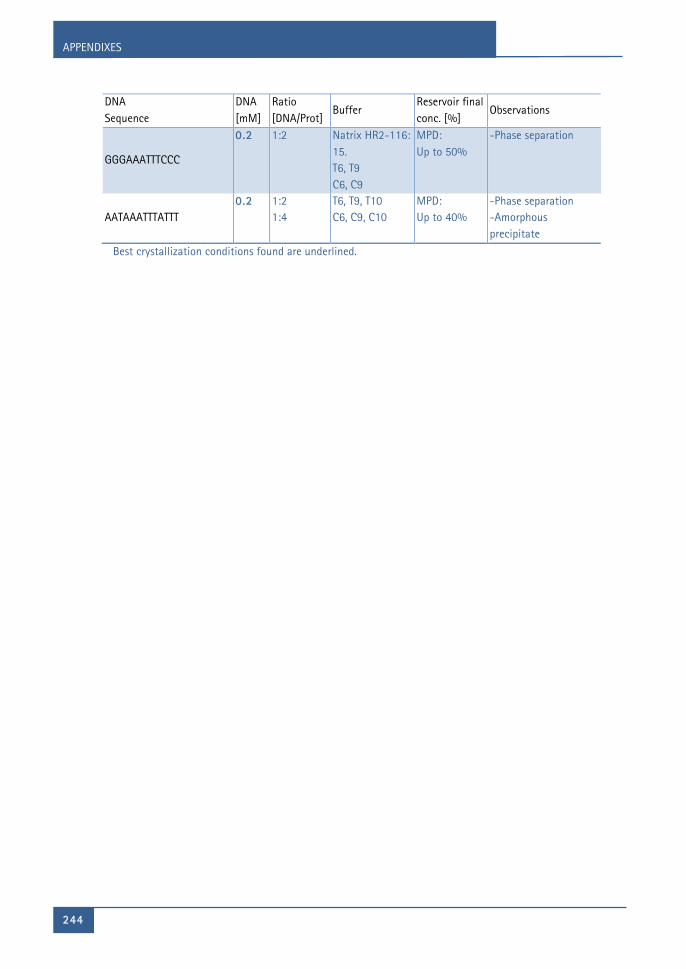
APPENDIXES
244
DNA Sequence
DNA [mM]
Ratio [DNA/Prot]
Buffer Reservoir final conc. [%]
Observations
GGGAAATTTCCC
0.2
1:2 Natrix HR2-116: 15. T6, T9 C6, C9
MPD: Up to 50%
-Phase separation
AATAAATTTATTT 0.2
1:2 1:4
T6, T9, T10 C6, C9, C10
MPD: Up to 40%
-Phase separation -Amorphous precipitate
Best crystallization conditions found are underlined.

APPENDIXES
245 245
Table E-3. Crystal l ization assays with DNA-bis(2-aminoimidazolines) complexes.
Complex with FR60, JNI18 and CDIV32 compounds
DNA Sequence
DNA [mM]
Ratio [DNA/Drug]
Buffer Reservoir final concentration [% MPD]
Observations
ATTATTAATAAT
0.2
1:2 1:4
Natrix HR2-116: 7, 42. D1, D2, D3, D4, D2.2, D4.2. C2, C4, C6
Up to 60% -Phase separation -Small needles -Crystalline precipitate -Small crystals -Amorphous precipitate
AAATATATTT
0.2 1:2 D1, D2, D3, D4 Up to 40% -Amorphous precipitate -Crystalline precipitate -Small rectangular crystals - Amorphous crystals
ATTAATTAAT 0.2 1:2 D1, D2, D3, D4 Up to 50% -Amorphous
precipitate -Crystalline precipitate
AATTTAAATT
0.2 1:2 1:4
D1, D2, D3, D4 Up to 30% -Small rectangular and amorphous crystals -Small needles -Crystalline precipitate
ATTTATAAAT 0.2 1:2
1:4 D1, D2, D3, D4 Up to 30% -Amorphous crystals
-Small needles
AAATTT
0 .2 1:2 1:4
D1, D2, D3, D4 Up to 60% -Rectangular, trapezoidal and hexagonal crystals -Small rhombic crystals -One single crystal
AATAATTATT
0.2 1:2 1:4
D1, D2, D3, D4 Up to 30% -Small needles -Crystalline precipitate -Crystalline points
CATATATATG 0.2 1:2 D1, D2, D3, D4 Up to 53% -Amorphous
precipitate -Rectangular crystals
AATTATAATT 0.2 1:2 D1, D2, D3, D4 Up to 50% -Amorphous
precipitate -Crystalline precipitate
ATAATATTAT 0.2 1:2 D1, D2, D3, D4 Up to 30% -Small needles
-Liquid crystals -Crystalline precipitate
Best crystallization conditions found are underlined.

APPENDIXES
246
Appendix F
Figure F1. F luorescence images of untreated cel l samples of Trypanosoma brucei 427WT cel ls taken at 0, 3 , 6 and 24 h of experiment. Al l f luorescent images are
shown with Blue channel (λ=450), SYTOX Green (λ=523, green channel) , MitoTracker (λ=599, red channel) , and merge, where arbitrary colours were used to visual ise the
various dyes: blue for Blue channel , purple for SYTOX , yel low for Mitotracker . No changes in f luorescence were observed at blue wavelength as untreated cel ls (no f luorescent compound JNI18 added) were visual ized. Normal cel ls were observed
containing 1N1K (one nuclei and one kinetoplast) . The outl ine of al l cel ls was shown by differential interference contrast (DIC) imaging. Images were acquired using a DeltaVision imaging system and deconvolved using the ratio conservative
method, on SoftWoRx software.

APPENDIXES
247 247
Table F 1. Mitochondrial membrane potential assay.
Untreated cel ls (drug free)
Time Repeat 1 Repeat 2 Repeat 3
0 h
3 h
6 h
12 h
Values are given as the percentage of cells with fluorescence above 1 × 10² arbitrary units (AU), equivalent to approximately 50% for the untreated cells. Samples are taken at 0, 3, 6 and 12 h by a BD FACSCalibur™ using a FL2-height detector. Data were processed with CellQuest™ and ©FlowJo software.

APPENDIXES
248
Treated cel ls with 1× EC50 FR60 (0 .83 µM)
Time Repeat 1 Repeat 2 Repeat 3
3 h
6 h
12 h
Values are given as the percentage of cells with fluorescence above 1 × 10² arbitrary units (AU), equivalent to approximately 50% for the untreated cells. Samples are taken at 3, 6 and 12 h by a BD FACSCalibur™ using a FL2-height detector. Data were processed with CellQuest™ and ©FlowJo software.
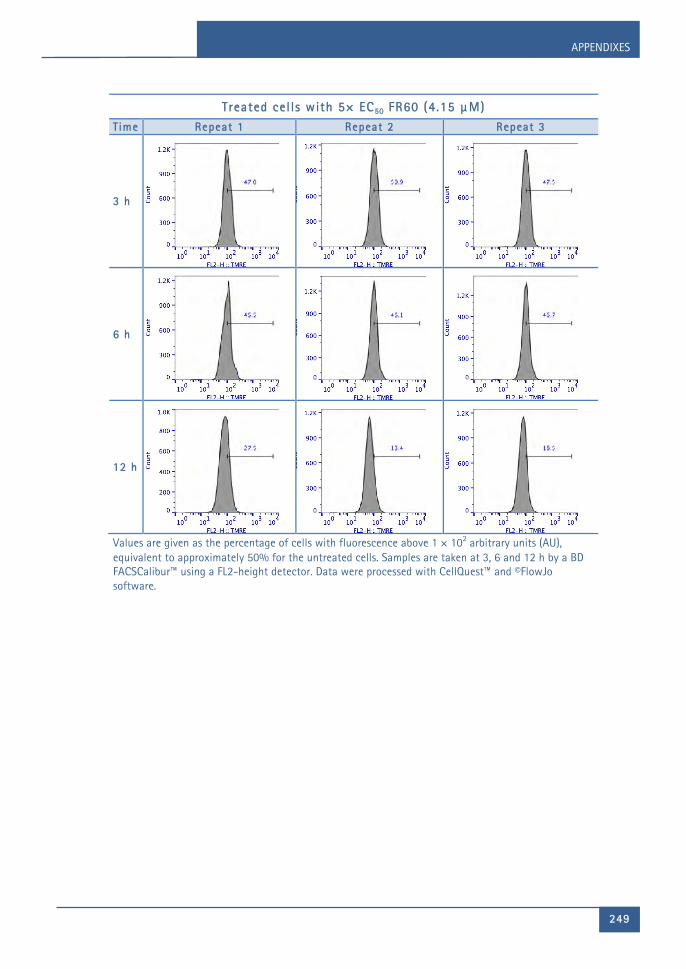
APPENDIXES
249 249
Treated cel ls with 5× EC50 FR60 (4 .15 µM)
Time Repeat 1 Repeat 2 Repeat 3
3 h
6 h
12 h
Values are given as the percentage of cells with fluorescence above 1 × 10² arbitrary units (AU), equivalent to approximately 50% for the untreated cells. Samples are taken at 3, 6 and 12 h by a BD FACSCalibur™ using a FL2-height detector. Data were processed with CellQuest™ and ©FlowJo software.

APPENDIXES
250
Treated cel ls with 1× EC50 JNI18 (0 .22 µM)
Time Repeat 1 Repeat 2 Repeat 3
3 h
6 h
12 h
Values are given as the percentage of cells with fluorescence above 1 × 10² arbitrary units (AU), equivalent to approximately 50% for the untreated cells. Samples are taken at 3, 6 and 12 h by a BD FACSCalibur™ using a FL2-height detector. Data were processed with CellQuest™ and ©FlowJo software.

APPENDIXES
251 251
Treated cel ls with 5× EC50 JNI18 (1 .1 µM)
Time Repeat 1 Repeat 2 Repeat 3
3 h
6 h
12 h
Values are given as the percentage of cells with fluorescence above 1 × 10² arbitrary units (AU), equivalent to approximately 50% for the untreated cells. Samples are taken at 3, 6 and 12 h by a BD FACSCalibur™ using a FL2-height detector. Data were processed with CellQuest™ and ©FlowJo software.

APPENDIXES
252
Treated cel ls with 1× EC50 CDIV32 (29.98 µM)
Time Repeat 1 Repeat 2 Repeat 3
3 h
6 h
12 h
Values are given as the percentage of cells with fluorescence above 1 × 10² arbitrary units (AU), equivalent to approximately 50% for the untreated cells. Samples are taken at 3, 6 and 12 h by a BD FACSCalibur™ using a FL2-height detector. Data were processed with CellQuest™ and ©FlowJo software.

APPENDIXES
253 253
Treated cel ls with 5× EC50 CDIV32 (149.9 µM)
Time Repeat 1 Repeat 2 Repeat 3
3 h
6 h
12 h
Values are given as the percentage of cells with fluorescence above 1 × 10² arbitrary units (AU), equivalent to approximately 50% for the untreated cells. Samples are taken at 3, 6 and 12 h by a BD FACSCalibur™ using a FL2-height detector. Data were processed with CellQuest™ and ©FlowJo software.

APPENDIXES
254
Val inomycin (100 nM)
Time Repeat 1 Repeat 2 Repeat 3
3 h
6 h
12 h
Values are given as the percentage of cells with fluorescence above 1 × 10² arbitrary units (AU), equivalent to approximately 50% for the untreated cells. Samples are taken at 3, 6 and 12 h by a BD FACSCalibur™ using a FL2-height detector. Data were processed with CellQuest™ and ©FlowJo software.

APPENDIXES
255 255
Trogl itazone (10 µM)
Time Repeat 1 Repeat 2 Repeat 3
3 h
6 h
12 h
Values are given as the percentage of cells with fluorescence above 1 × 10² arbitrary units (AU), equivalent to approximately 50% for the untreated cells. Samples are taken at 3, 6 and 12 h by a BD FACSCalibur™ using a FL2-height detector. Data were processed with CellQuest™ and ©FlowJo software.

APPENDIXES
256
Appendix G
Trypanosoma brucei brucei strain Lister 427 (Tb427WT) minicircle, complete sequence;
kinetoplast (Dean, et al., 2013)
LOCUS: KF293288 1001 bp DNA circular
GGGGTTGGTGTAATACACACAGGGTTTTCCCGTAGAAATTATATTAATTTGGATCATTTGGTGTTTTCTATTGATAAAAGAATAAGATAATAGATAGATTAATTGATATTATATAGATATTATATATAAGACGCATATAAGTGAGTCTATATACAGATAATGATGATAATTTATATATATGTTAACTTTAATATTTATTTATTATTTTCTTTTCTATATTAGGAGAAATGTGATAATAGATAAGTAATGAGAGTAATTTAGATATTTAATTGTATATAATTACACACACAGATACGTGATATATAGAGTGTTAAGATAATATGATGTATATATATGTAAATTAAAAACTATTTATTATTTTATGTTAAGTAGATGGAGAAATAATAGTTAAATAAGAGGTAGTACTTTGAGGAGGTATAAGGTAATATTAACATTGAGAATCTTAGATAACTGATAAAATACTGTTATTTCTGCATCTAAAAGAGGGTTTTAAGCTGTCTAAAAGGGTAAAATGAGGTAATAGATAAGGTATAGATAATATAATATTTAATATAATATATATAATAACAATAGCAGGTAAAGGTAAGAAAGTGAAGATATCATATAAGATTGTATATTTAATGTTAAACTATATTTATTATTTTATTTATAATTAGTAGATAAGATTAGTAGAAGTGAAGTAGTAATTGTAAAACTGATAGTAAGATGGGAATAAGGTGTGAGATATAAATAGAAAGGTTAAGTTAATTGTAGTTATAATTGGAAGTGCAGAAAGTGTTGTAGATGGAGTATTAGGTTGATTAGAGAGAGAGTAGTATAAAGTGTAAAAAGTTTGTGTTGGATGGTAGAGATAGAAGGGAGAAGTTAGAAATTCAGAGAAAATTGGGGAAAAATCAGGGAAAATCGGGCTGAAAAACCGAAAATCTTATGGGCGTGCAGATTTCACCATACACAAATCACGTGCTATTTTCGGGGGTTTTTAGGTCCGAGGTACTTCGAAA. The AT content represents the 73.6% of the minicircle genome of Tb427WT (A = 394 and T = 342); and CG-content the 26.5% (G = 206 and C = 59). The sequence AAA appears 28 times and the sequence TTT 26 times; both are shown in red, bold font. The sequence AATT exists 14 times and is highlighted in yellow. Tracts with more than 10 A/T are found 15 times (red and underlined).

REFERENCES

REFERENCES
259
259 259
REFERENCES
Abrescia, N. G. A. & Subirana, J. A. (2002). When pseudosymmetry and merohedral
twinning come across: the case of the d(ApTpApTpApT) oligonucleotide in a hexagonal
lattice. Acta crystallographica. Section D, Biological crystallography, 58(Pt 12), 2205-
2208.
Abrescia, N. G. A., Gonzalez, C., Gouyette, C., & Subirana, J. A. (2004). X-ray and NMR
studies of the DNA oligomer d(ATATAT): Hoogsteen base pairing in duplex DNA.
Biochemistry, 43(14), 4092–4100. https://doi.org/10.1021/bi0355140
Abrescia, N. G. A., Thompson, A., Huynh-Dinh, T., & Subirana, J. A. (2002). Crystal structure
of an antiparallel DNA fragment with Hoogsteen base pairing. Proceedings of the
National Academy of Sciences of the United States of America, 99(5), 2806–2811.
http://doi.org/10.1073/pnas.052675499
Acosta-Reyes, F. J., Alechaga, E., Subirana, J. A., & Campos, J. L. (2015). Structure of the
DNA duplex d(ATTAAT)2 with Hoogsteen hydrogen bonds. PloS One, 10(3), e0120241.
https://doi.org/10.1371/journal.pone.0120241
Acosta-Reyes, F. J., Dardonville, C., de Koning, H. P., Natto, M., Subirana, J. A., & Campos, J.
L. (2014). In and out of the minor groove: interaction of an AT-rich DNA with the drug
CD27. Acta Crystallographica Section D Biological Crystallography, 70(6), 1614–1621.
https://doi.org/10.1107/S139900471400697X
Adams, P. D., Afonine, P. V., Bunkóczi, G., Chen, V. B., Davis, I. W., Echols, N., … Zwart, P. H.
(2010). PHENIX : a comprehensive Python-based system for macromolecular structure
solution. Acta Crystallographica Section D Biological Crystallography, 66(2), 213–221.
https://doi.org/10.1107/S0907444909052925
Afonine, P., Grosse-Kunstleve, R. & Adams, P. (2005). The Phenix refinement framework.
CCP4 newsletter, 42(8), 1-7.

REFERENCES
260
Akiyoshi, B., & Gull, K. (2013). Evolutionary cell biology of chromosome segregation:
insights from trypanosomes. Open Biology, 3(5), 130023.
http://doi.org/10.1098/rsob.130023
Alkhaldi, A. A. M., Martinek, J., Panicucci, B., Dardonville, C., Zíková, A., & de Koning, H. P.
(2016). Trypanocidal action of bisphosphonium salts through a mitochondrial target in
bloodstream form Trypanosoma brucei. International Journal for Parasitology: Drugs
and Drug Resistance, 6(1), 23–34. https://doi.org/10.1016/j.ijpddr.2015.12.002
Almaqwashi, A. A., Paramanathan, T., Rouzina, I., & Williams, M. C. (2016). Mechanisms of
small molecule–DNA interactions probed by single-molecule force spectroscopy.
Nucleic Acids Research, 44(9), 3971–3988. http://doi.org/10.1093/nar/gkw237
Anand, A., & Chada, K. (2000). In vivo modulation of Hmgic reduces obesity. Nature
Genetics, 24(4), 377–380. https://doi.org/10.1038/74207
Andrews, K. T., Fisher, G., & Skinner-Adams, T. S. (2014). Drug repurposing and human
parasitic protozoan diseases. International Journal for Parasitology: Drugs and Drug
Resistance, 4(2), 95–111. https://doi.org/10.1016/j.ijpddr.2014.02.002
Aravind, L., & Landsman, D. (1998). AT-hook motifs identified in a wide variety of DNA-
binding proteins. Nucleic Acids Research, 26(19), 4413–4421.
Aravind, L., Iyer, L. M., Wellems, T. E., & Miller, L. H. (2003). Plasmodium biology: genomic
gleanings. Cell, 115(7), 771–785.
Aulner, N., Monod, C., Mandicourt, G., Jullien, D., Cuvier, O., Sall, A., Janssen, S., Laemmli,
U.K., & Kas, E. (2002). The AT-Hook Protein D1 Is Essential for Drosophila melanogaster
Development and Is Implicated in Position-Effect Variegation. Molecular and Cellular
Biology, 22(4), 1218–1232. https://doi.org/10.1128/MCB.22.4.1218-1232.2002
Avliyakulov, N. K., Lukeš, J., & Ray, D. S. (2004). Mitochondrial Histone-Like DNA-Binding
Proteins Are Essential for Normal Cell Growth and Mitochondrial Function in Crithidia
fasciculata. Eukaryotic Cell, 3(2), 518–526. https://doi.org/10.1128/EC.3.2.518-
526.2004

REFERENCES
261
261 261
Babine, R. E., & Bender, S. L. (1997). Molecular Recognition of Protein−Ligand Complexes:
Applications to Drug Design. Chemical Reviews, 97 (5), 1359-1472.
https://doi.org/10.1021/cr960370z
Babokhov, P., Sanyaolu, A. O., Oyibo, W. A., Fagbenro-Beyioku, A. F., & Iriemenam, N. C.
(2013). A current analysis of chemotherapy strategies for the treatment of human
African trypanosomiasis. Pathogens and Global Health, 107(5), 242–252.
http://doi.org/10.1179/2047773213Y.0000000105
Bachvarov, D & Moss, T. (1991). The RNA polymerase I transcription factor xUBF contains
5 tandemly repeated HMG homology boxes. Nucleic Acids ResearchI, 19 (9), 2331-
2335. https://doi.org/10.1093/nar/19.9.2331
Bailly, C. (2003). Sequence-specific minor groove binding by bis-benzimidazoles: water
molecules in ligand recognition. Nucleic Acids Research, 31(5), 1514–1524.
https://doi.org/10.1093/nar/gkg237
Baldassarre, G., Belletti, B., Battista, S., Nicoloso, M.S., Pentimalli, F., Fedele, M., Croce,
C.M., & Fusco, A. (2005). HMGA1 protein expression sensitizes cells to cisplatin-
induced cell death. Oncogene, 24(45), 6809–6819.
https://doi.org/10.1038/sj.onc.1208831
Banerjee, S., de Freitas, A., Friggeri, A., Zmijewski, J. W., Liu, G., & Abraham, E. (2011).
Intracellular HMGB1 negatively regulates efferocytosis. Journal of Immunology
(Baltimore, Md. : 1950), 187(9), 4686–4694. http://doi.org/10.4049/jimmunol.1101500
Baron, R., Setny, P., & Andrew McCammon, J. (2010). Water in Cavity−Ligand Recognition.
Journal of the American Chemical Society, 132(34), 12091–12097.
https://doi.org/10.1021/ja1050082
Barrett, M. P., Burchmore, R. J. S., Stich, A., Lazzari, J. O., Frasch, A. C., Cazzulo, J. J., &
Krishna, S. (2003). The trypanosomiases. Lancet (London, England), 362(9394), 1469–
1480. https://doi.org/10.1016/S0140-6736(03)14694-6

REFERENCES
262
Barrett, M. P., Gemmell, C. G., & Suckling, C. J. (2013). Minor groove binders as anti-
infective agents. Pharmacology & Therapeutics, 139(1), 12–23.
https://doi.org/10.1016/j.pharmthera.2013.03.002
Battye, T. G. G., Kontogiannis, L., Johnson, O., Powell, H. R., & Leslie, A. G. W. (2011).
iMOSFLM : a new graphical interface for diffraction-image processing with MOSFLM.
Acta Crystallographica Section D Biological Crystallography, 67(4), 271–281.
https://doi.org/10.1107/S0907444910048675
Baxevanis, A. D., & Landsman, D. (1995). The HMG-1 box protein family: classification and
functional relationships. Nucleic Acids Research, 23(9), 1604–1613.
Beck, K., Acestor, N., Schulfer, A., Anupama, A., Carnes, J., Panigrahi, A. K., & Stuart, K.
(2013). Trypanosoma brucei Tb927.2.6100 Is an Essential Protein Associated with
Kinetoplast DNA. Eukaryotic Cell, 12(7), 970–978. http://doi.org/10.1128/EC.00352-
12
Behe, M., & Felsenfeld, G. (1981). Effects of methylation on a synthetic polynucleotide: the
B–Z transition in poly (dG-m5dC). poly (dG-m5dC). Proceedings of the National
Academy of Sciences, 78(3), 1619–1623.
Benini, F., Onorati, M., Altamura, S., Manfioletti, G., & Vignali, R. (2006). Identification and
developmental expression of Xenopus hmga2beta. Biochemical and Biophysical
Research Communications, 351(2), 392–397.
https://doi.org/10.1016/j.bbrc.2006.10.074
Benvenuti, M., & Mangani, S. (2007). Crystallization of soluble proteins in vapor diffusion
for x-ray crystallography. Nature Protocols, 2(7), 1633–1651.
https://doi.org/10.1038/nprot.2007.198
Berman, H. M. & Young, P. R. (1981). The interaction of intercalation drugs with nucleic
acids. Cancer, 10(60):87-114.
Bhat, G. J., Koslowsky, D. J., Feagin, J. E., Smiley, B. L., & Stuart, K. (1990). An extensively
edited mitochondrial transcript in kinetoplastids encodes a protein homologous to

REFERENCES
263
263 263
ATPase subunit 6. Cell, 61(5), 885-894. https://doi.org/10.1016/0092-8674(90)90199-
O
Bianchi, M. E., & Agresti, A. (2005). HMG proteins: dynamic players in gene regulation and
differentiation. Current Opinion in Genetics & Development, 15(5), 496–506.
https://doi.org/10.1016/j.gde.2005.08.007
Bragg, W. H . & Bragg, W. L. (1913). The Reflexion of X-rays by Crystals . Proceedings of
the Royal Society A: Mathematical, Physical and Engineering Sciences, 88(605), 428–
438. http://doi:10.1098/rspa.1913.0040
Bridges, D. J., Gould, M. K., Nerima, B., Maser, P., Burchmore, R. J. S., & de Koning, H. P.
(2007). Loss of the high-affinity pentamidine transporter is responsible for high
levels of cross-resistance between arsenical and diamidine drugs in African
trypanosomes. Molecular Pharmacology, 71(4), 1098–1108.
https://doi.org/10.1124/mol.106.031351
Bruhn, D. F., Sammartino, M. P., & Klingbeil, M. M. (2011). Three Mitochondrial DNA
Polymerases Are Essential for Kinetoplast DNA Replication and Survival of Bloodstream
Form Trypanosoma brucei. Eukaryotic Cell, 10(6), 734–743.
http://doi.org/10.1128/EC.05008-11
Bustin, M. (1999). Regulation of DNA-dependent activities by the functional motifs of the
high-mobility-group chromosomal proteins. Molecular and Cellular Biology, 19(8),
5237–5246.
Cai, X., Gray Jr., P. J., & Von Hoff, D. D. (2009). DNA minor groove binders: Back in the
groove. Cancer Treatment Reviews, 35(5), 437–450.
https://doi.org/10.1016/j.ctrv.2009.02.004
Campos, L., Valls, N., Urpí, L., Gouyette, C., Sanmartín, T., Richter, M., Alechaga, E.,
Santaolalla, A., Baldini, R., Creixell, M., Ciurans, R., Skokan, P., Pous, J., & Subirana, J. A.
(2006). Overview of the Structure of All-AT Oligonucleotides: Organization in Helices
REFERENCES
264
and Packing Interactions. Biophysical Journal, 91(3), 892–903.
https://doi.org/10.1529/biophysj.106.084210
Canals, A., Arribas-Bosacoma, R., Albericio, F., Álvarez, M., Aymamí, J., & Coll, M. (2017).
Intercalative DNA binding of the marine anticancer drug variolin B. Scientific
Reports, 7, 39680. http://doi.org/10.1038/srep39680
Cantor, C. R., Warshaw, M. M., & Shapiro, H. (1970). Oligonucleotide interactions. III.
Circular dichroism studies of the conformation of deoxyoligonucleotides. Biopolymers,
9(9), 1059–1077. https://doi.org/10.1002/bip.1970.360090909
Carlton, J. M., Angiuoli, S. V., Suh, B. B., Kooij, T. W., Pertea, M., Silva, J. C., Ermolaeva, M.D.,
Allen, J.E., Selengut, J.D., Koo, H.L., et al. (2002). Genome sequence and comparative
analysis of the model rodent malaria parasite Plasmodium yoelii yoelii. Nature,
419(6906), 512–519. https://doi.org/10.1038/nature01099
Carr, K.M., & Kaguni, J.M. (2001). Stoichiometry of DnaA and DnaB protein in initiation at
the Escherichia coli chromosomal origin. The Journal of Biological Chemistry, 276(48),
44919-25. https://doi.org/10.1074/jbc.M107463200
Cavalcanti, D. P., Shimada, M. K., Probst, C. M., Souto-Padrón, T. C. B. S., de Souza, W.,
Goldenberg, S., … Motta, M. C. M. (2009). Expression and subcellular localization of
kinetoplast-associated proteins in the different developmental stages of Trypanosoma
cruzi. BMC Microbiology, 9, 120. http://doi.org/10.1186/1471-2180-9-120
Chappuis, F., Loutan, L., Simarro, P., Lejon, V., & Büscher, P. (2005). Options for Field
Diagnosis of Human African Trypanosomiasis. Clinical Microbiology Reviews, 18(1),
133–146. http://doi.org/10.1128/CMR.18.1.133-146.2005
Chen, K. K., & Donelson, J. E. (1980). Sequences of two kinetoplast DNA minicircles of
Tryptanosoma brucei. Proceedings of the National Academy of Sciences of the United
States of America, 77(5), 2445–2449.
Chen, V. B., Arendall, W. B. 3rd, Headd, J. J., Keedy, D. A., Immormino, R. M., Kapral, G. J.,
Murray, L. W., Richardson, J. S., Richardson, D. C. (2010). MolProbity: all-atom structure

REFERENCES
265
265 265
validation for macromolecular crystallography. Acta Crystallographica. Section D,
Biological Crystallography, 66(Pt 1), 12–21.
https://doi.org/10.1107/S0907444909042073
Chiefari, E., Tanyolac, S., Paonessa, F., Pullinger, C. R., Capula, C., Iiritano, S., … Brunetti, A.
(2011). Functional variants of the HMGA1 gene and type 2 diabetes mellitus. JAMA,
305(9), 903–912. https://doi.org/10.1001/jama.2011.207
Cleynen, I., & van de Ven, W. J. M. (2008). The HMGA proteins: A myriad of functions
(Review). International Journal of Oncology, 32, 289-305.
Coll, M., Aymami, J., van der Marel, G. A., van Boom, J. H., Rich, A., & Wang, A. H. (1989).
Molecular structure of the netropsin-d(CGCGATATCGCG) complex: DNA conformation
in an alternating AT segment. Biochemistry, 28(1), 310–320.
Crick, F. H. C. (1966). Codon–anticodon pairing: The wobble hypothesis. Journal of
Molecular Biology, 19, 548–555.
Crick, F. H., Barnett, L., Brenner, S., & Watts-Tobin, R. J. (1961). General nature of the
genetic code for proteins. Nature, 192 (4809): 1227–32.
Bibcode:1961Natur.192.1227C. doi:10.1038/1921227a0. PMID 13882203.
Dardonville, C., & Brun, R. (2004). Bisguanidine, bis(2-aminoimidazoline), and polyamine
derivatives as potent and selective chemotherapeutic agents against Trypanosoma
brucei rhodesiense. Synthesis and in vitro evaluation. Journal of Medicinal Chemistry,
47(9), 2296–2307. https://doi.org/10.1021/jm031024u
Dardonville, C., & Nué Martínez, J. J. (2017). Bis(2-aminoimidazolines) and Bisguanidines:
Synthetic Approaches, Antiparasitic Activity and DNA Binding Properties. Current
Medicinal Chemistry, 24. https://doi.org/10.2174/0929867324666170623091522
Dardonville, C., Barrett, M. P., Brun, R., Kaiser, M., Tanious, F., & Wilson, W. D. (2006). DNA
Binding Affinity of Bisguanidine and Bis(2-aminoimidazoline) Derivatives with in Vivo
Antitrypanosomal Activity. Journal of Medicinal Chemistry, 49(12), 3748–3752.
https://doi.org/10.1021/jm060295c

REFERENCES
266
Dasari, S., & Tchounwou, P. B. (2014). Cisplatin in cancer therapy: molecular mechanisms
of action. European Journal of Pharmacology, 0, 364–378.
http://doi.org/10.1016/j.ejphar.2014.07.025
De Belle, I., Cai, S., & Kohwi-Shigematsu, T. (1998). The Genomic Sequences Bound to
Special AT-rich Sequence-binding Protein 1 (SATB1) In Vivo in Jurkat T Cells Are Tightly
Associated with the Nuclear Matrix at the Bases of the Chromatin Loops . The Journal
of Cell Biology, 141(2), 335–348.
De Rosa, M., de Sanctis, D., Rosario, A. L., Archer, M., Rich, A., Athanasiadis, A., & Carrondo,
M. A. (2010). Crystal structure of a junction between two Z-DNA helices. Proceedings
of the National Academy of Sciences, 107(20), 9088–9092.
Dean, S., Gould, M. K., Dewar, C. E., & Schnaufer, A. C. (2013). Single point mutations in
ATP synthase compensate for mitochondrial genome loss in trypanosomes. Proceedings
of the National Academy of Sciences of the United States of America, 110(36), 14741–
14746. https://doi.org/10.1073/pnas.1305404110
Denninger, V., Figarella, K., Schönfeld, C., Brems, S., Busold, C., Lang, F., … Duszenko, M.
(2007). Troglitazone induces differentiation in Trypanosoma brucei. Experimental Cell
Research, 313(9), 1805–1819. https://doi.org/10.1016/j.yexcr.2007.03.003
Dickerson R. E. (1989): Definitions and nomenclature of nucleic acid structure parameters.
Journal of Biomolecular Structure and Dynamics, 6, 627—634.
Diederichs, K., & Karplus, P. A. (2013). Better models by discarding data? Acta
Crystallographica Section D: Biological Crystallography, 69(Pt 7), 1215–1222.
http://doi.org/10.1107/S0907444913001121
Driessen, R. P. C., Sitters, G., Laurens, N., Moolenaar, G. F., Wuite, G. J. L., Goosen, N., &
Dame, R. T. (2014). Effect of Temperature on the Intrinsic Flexibility of DNA and Its
Interaction with Architectural Proteins. Biochemistry, 53(41), 6430–6438.
https://doi.org/10.1021/bi500344j

REFERENCES
267
267 267
Du, W., & Maniatis, T. (1994). The high mobility group protein HMG I(Y) can stimulate or
inhibit DNA binding of distinct transcription factor ATF-2 isoforms. Proceedings of the
National Academy of Sciences of the United States of America, 91(24), 11318–11322.
Dunker, A. K., Oldfield, C. J., Meng, J., Romero, P., Yang, J. Y., Chen, J. W., Vacic, V.,
Obradovic, Z., & Uversky, V. N. (2008). The unfoldomics decade: an update on
intrinsically disordered proteins. BMC Genomics, 9(Suppl 2), S1.
http://doi.org/10.1186/1471-2164-9-S2-S1
Emsley, P., Lohkamp, B., Scott, W. G., & Cowtan, K. (2010). Features and development of
Coot. Acta Crystallographica. Section D, Biological Crystallography, 66(Pt 4), 486–501.
https://doi.org/10.1107/S0907444910007493
Englund, P. T., Agbo, E. E. C., Lindsay, M. E., Liu, B., Liu, Y., Motyka, S. A., … Zhao, Z. (2005).
RNAi libraries and kinetoplast DNA. Biochemical Society Transactions, 33(6), 1409.
https://doi.org/10.1042/BST0331409
Erlandsson Harris, H., & Andersson, U. (2004). Mini-review: the nuclear protein HMGB1 as
a proinflammatory mediator. European Journal of Immunology, 34(6), 1503–1512.
Evans, P. (2006). Scaling and assessment of data quality. Acta Crystallographica Section D
Biological Crystallography, 62(1), 72–82. https://doi.org/10.1107/S0907444905036693
Evans, P. R., & Murshudov, G. N. (2013). How good are my data and what is the
resolution? Acta Crystallographica Section D: Biological Crystallography, 69(Pt 7),
1204–1214. http://doi.org/10.1107/S0907444913000061
Eze, A. A., Gould, M. K., Munday, J. C., Tagoe, D. N. A., Stelmanis, V., Schnaufer, A., & De
Koning, H. P. (2016). Reduced Mitochondrial Membrane Potential Is a Late Adaptation
of Trypanosoma brucei brucei to Isometamidium Preceded by Mutations in the γ
Subunit of the F1Fo-ATPase. PLOS Neglected Tropical Diseases, 10(8), e0004791.
https://doi.org/10.1371/journal.pntd.0004791
Fairlamb, A. H. (2003). Chemotherapy of human African trypanosomiasis: current and
future prospects. Trends in Parasitology, 19(11), 488–494.

REFERENCES
268
Feagin, J. E. (2000). Mitochondrial genome diversity in parasites. International Journal for
Parasitology, 30(4), 371–390.
Feig, M., & Pettitt, B. M. (1998), A molecular simulation picture of DNA hydration around
A- and B-DNA. Biopolymers, 48: 199–209. https://doi.org/10.1002/(SICI)1097-
0282(1998)48:4<199::AID-BIP2>3.0.CO;2-5
Feig, M., & Pettitt, B.M. (1998). A molecular simulation picture of DNA hydration around
A- and B-DNA. Biopolymers, 48, 199–209. https://doi.org/10.1002/sici1097-0282
Fèvre, E. M., Picozzi, K., Jannin, J., Welburn, S. C., & Maudlin, I. (2006). Human African
Trypanosomiasis: Epidemiology and Control. In David H. Molyneux (Ed.), Advances in
Parasitology (Vol. Volume 61, pp. 167–221). Academic Press.
https://doi.org/10.1016/S0065-308X(05)61005-6
Field, M. C., & Carrington, M. (2009). The trypanosome flagellar pocket. Nature Reviews
Microbiology, 7(11), 775–786. https://doi.org/10.1038/nrmicro2221
Fitzgerald, D. J., & Anderson, J. N. (1999). Selective Nucleosome Disruption by Drugs That
Bind in the Minor Groove of DNA. Journal of Biological Chemistry, 274(38), 27128–
27138. https://doi.org/10.1074/jbc.274.38.27128
Flickinger, R. (2015). AT-rich repetitive DNA sequences, transcription frequency and germ
layer determination. Mechanisms of Development, 138, Part 3, 227–232.
https://doi.org/10.1016/j.mod.2015.10.004
Fonfría-Subirós, E., Acosta-Reyes, F., Saperas, N., Pous, J., Subirana, J. A., & Campos, J. L.
(2012). Crystal Structure of a Complex of DNA with One AT-Hook of HMGA1. PLoS
ONE, 7(5), e37120. https://doi.org/10.1371/journal.pone.0037120
Franco, J. R., Simarro, P. P., Diarra, A., & Jannin, J. G. (2014). Epidemiology of human
African trypanosomiasis. Clinical Epidemiology, 6, 257–275.
http://doi.org/10.2147/CLEP.S39728

REFERENCES
269
269 269
Franklin, R. E., & Gosling, R. G. (1953). Molecular configuration in sodium thymonucleate.
Nature, 171(4356), 740-1.
French, S. & Wilson, K. (1978). On the treatment of negative intensity observations. Acta
Crystallographica Section A: Crystal Physics, Diffraction, Theoretical and General
Crystallography, 34(4), 517-525. https://doi.org/10.1107/S0567739478001114
Fujikane, R., Komori, K., Sekiguchi, M., & Hidaka, M. (2016). Function of high-mobility
group A proteins in the DNA damage signaling for the induction of apoptosis. Scientific
Reports, 6, 31714. http://doi.org/10.1038/srep31714
Fusco, A., & Fedele, M. (2007). Roles of HMGA proteins in cancer. Nature Reviews Cancer,
7(12), 899–910. https://doi.org/10.1038/nrc2271
Gangelhoff, T. A., Mungalachetty, P. S., Nix, J. C., & Churchill, M. E. A. (2009). Structural
analysis and DNA binding of the HMG domains of the human mitochondrial
transcription factor A. Nucleic Acids Research, 37(10), 3153–3164.
http://doi.org/10.1093/nar/gkp157
Gao, N., Jiang, W., Gao, H., Cheng, Z., Qian, H., Si, S., & Xie, Y. (2013). Structural basis of
human transcription factor Sry-related box 17 binding to DNA. Protein and Peptide
Letters, 20(4), 481–488.
Garcia, H. G., Grayson, P., Han, L., Inamdar, M., Kondev, J., Nelson, P. C., … Wiggins, P. A.
(2007). Biological consequences of tightly bent DNA: The other life of a
macromolecular celebrity. Biopolymers, 85(2), 115–130.
https://doi.org/10.1002/bip.20627
Gardner, M. J., Hall, N., Fung, E., White, O., Berriman, M., Hyman, R. W., … Barrell, B.
(2002). Genome sequence of the human malaria parasite Plasmodium falciparum.
Nature, 419(6906), 498–511. https://doi.org/10.1038/nature01097
Geggier, S., & Vologodskii, A. (2010). Sequence dependence of DNA bending rigidity.
Proceedings of the National Academy of Sciences, 107(35), 15421–15426.

REFERENCES
270
Geierstanger, B. H., Volkman, B. F., Kremer, W., & Wemmer, D. E. (1994). Short peptide
fragments derived from HMG-I/Y proteins bind specifically to the minor groove of DNA.
Biochemistry, 33(17), 5347–5355.
Gilbert, N., & Allan, J. (2014). Supercoiling in DNA and chromatin. Current Opinion in
Genetics & Development, 25(100), 15–21. http://doi.org/10.1016/j.gde.2013.10.013
Glass, L. S., Nguyen, B., Goodwin, K. D., Dardonville, C., Wilson, W. D., Long, E. C., &
Georgiadis, M. M. (2009). Crystal Structure of a Trypanocidal 4,4′-
Bis(imidazolinylamino)diphenylamine Bound to DNA ,. Biochemistry, 48(25), 5943–
5952. https://doi.org/10.1021/bi900204w
Gluenz, E., Povelones, M. L., Englund, P. T., & Gull, K. (2011). The Kinetoplast Duplication
Cycle in Trypanosoma brucei Is Orchestrated by Cytoskeleton-Mediated Cell
Morphogenesis. Molecular and Cellular Biology, 31(5), 1012–1021.
https://doi.org/10.1128/MCB.01176-10
Goodwin, G.H., Sanders, C. & Johns, E.W. (1973). A new group of chromatin-associated
proteins with a high content of acidic and basic amino acids. European Journal of
Biochemistry, 38, 14-19.
Gurova, K. (2009). New hopes from old drugs: revisiting DNA-binding small molecules as
anticancer agents. Future Oncology (London, England), 5(10), 1685.
http://doi.org/10.2217/fon.09.127
Halford, S. E., & Marko, J. F. (2004). How do site-specific DNA-binding proteins find their
targets? Nucleic Acids Research, 32(10), 3040–3052.
http://doi.org/10.1093/nar/gkh624
Hamilton, P. L., & Arya, D. P. (2012). Natural product DNA major groove binders. Natural
Product Reports, 29(2), 134–143. https://doi.org/10.1039/c1np00054c
Hammarton, T. C. (2007). Cell cycle regulation in Trypanosoma brucei. Molecular and
Biochemical Parasitology, 153(1-4), 1–8.
http://doi.org/10.1016/j.molbiopara.2007.01.017

REFERENCES
271
271 271
Hammarton, T. C., Clark, J., Douglas, F., Boshart, M., & Mottram, J. C. (2003). Stage-specific
Differences in Cell Cycle Control in Trypanosoma brucei Revealed by RNA Interference
of a Mitotic Cyclin. Journal of Biological Chemistry, 278(25), 22877–22886.
https://doi.org/10.1074/jbc.M300813200
Hanks, J. H. & Wallace, R. E. (1949). Relation of Oxygen and Temperature in the
Preservation of Tissues by Refrigeration. Proceedings of the Society for Experimental
Biology and Medicine, 71,196.
Hardman, C. H., Broadhurst, R. W., Raine, A. R., Grasser, K. D., Thomas, J. O. & Laue, E. D.
(1995). Biochemistry, 34, 16596–16607.
Hart, C. M., & Laemmli, U. K. (1998). Facilitation of chromatin dynamics by SARs. Current
Opinion in Genetics & Development, 8(5), 519–525. https://doi.org/10.1016/S0959-
437X(98)80005-1
Herbst-Irmer, R. & Sheldrick, G. M. (1998). Refinement of twinned structures with
SHELXL97. Acta Crystallographica Section B: Structural Science, 54(4), 443-449.
https://doi.org/10.1107/S0108768197018454
Hill, K. L. (2003). Biology and Mechanism of Trypanosome Cell Motility. Eukaryotic Cell,
2(2), 200–208. http://doi.org/10.1128/EC.2.2.200-208.2003
Hirumi, H. & Hirumi, K. (1989). Continuous cultivation of Trypanosoma brucei blood
stream forms in a medium containing a low concentration of serum protein without
feeder cell layers. The Journal of Parasitology, 75(6), 985-989.
Hizver, J., Rozenberg, H., Frolow, F., Rabinovich, D., & Shakked, Z. (2001). DNA bending by
an adenine–thymine tract and its role in gene regulation. Proceedings of the National
Academy of Sciences, 98(15), 8490–8495.
Hock, R., Furusawa, T., Ueda, T., & Bustin, M. (2007). HMG chromosomal proteins in
development and disease. Trends in Cell Biology, 17(2), 72–79.
https://doi.org/10.1016/j.tcb.2006.12.001

REFERENCES
272
Hofr, C., Farrell, N., & Brabec, V. (2001). Thermodynamic properties of duplex DNA
containing a site-specific d(GpG) intrastrand crosslink formed by an antitumor
dinuclear platinum complex. Nucleic Acids Research, 29(10), 2034–2040.
Hol, W. G. J. (2015). Three-dimensional structures in the design of therapeutics targeting
parasitic protozoa: reflections on the past, present and future. Acta Crystallographica.
Section F, Structural Biology Communications, 71(Pt 5), 485–499.
https://doi.org/10.1107/S2053230X15004987
Hoogsteen, K. (1963). The crystal and molecular structure of a hydrogen-bonded complex
between 1-methylthymine and 9-methyladenine. Acta Crystallographica, 16, 907-916.
https://doi.org/10.1107/S0365110X63002437
Huang, G., Vercesi, A. E., & Docampo, R. (2013). Essential regulation of cell bioenergetics
in Trypanosoma brucei by the mitochondrial calcium uniporter. Nature
Communications, 4, 2865. http://doi.org/10.1038/ncomms3865
Hud, N. V. and Plavec, J. (2003), A unified model for the origin of DNA sequence-directed
curvature. Biopolymers, 69: 144–158. https://doi.org/10.1002/bip.10364
Hurley, C.K. (1977). Electrophoresis of histones: A modified Panyim and Chalkley system
for slab gels. Analytical Biochemistry, 80, 624-626.
Huth, J. R., Bewley, C. A., Nissen, M. S., Evans, J. N. S., Reeves, R., Gronenborn, A. M., &
Clore, G. M. (1997). The solution structure of an HMG-I(Y)-DNA complex defines a new
architectural minor groove binding motif. Nature Structural & Molecular Biology, 4(8),
657–665. https://doi.org/10.1038/nsb0897-657
Ibrahim, H. M. S., Al-Salabi, M. I., El Sabbagh, N., Quashie, N. B., Alkhaldi, A. A. M., Escale,
R., Smith, T. K., Vial, H. J., de Koning, H. P. (2011). Symmetrical choline-derived
dications display strong anti-kinetoplastid activity. Journal of Antimicrobial
Chemotherapy, 66(1), 111–125. https://doi.org/10.1093/jac/dkq401
Javaherian, K., Liu, J.F. & Wang, J.C. (1978). Nonhistone proteins HMG1 and HMG2 change
the DNA helical structure. Science. 199, 1345-1346.

REFERENCES
273
273 273
Jensen, R. E., Simpson, L., & Englund, P. T. (2008). What happens when Trypanosoma brucei
leaves Africa. Trends in Parasitology, 24(10), 428–431.
https://doi.org/10.1016/j.pt.2008.06.007
Kabsch, W. (2010). XDS. Acta Crystallographica Section D: Biological
Crystallography, 66(Pt 2), 125–132. http://doi.org/10.1107/S0907444909047337
Kang, R., Zhang, Q., Zeh, H. J. 3rd, Lotze, M. T., & Tang, D. (2013). HMGB1 in cancer: good,
bad, or both? Clinical Cancer Research : An Official Journal of the American
Association for Cancer Research, 19(15), 4046–4057. https://doi.org/10.1158/1078-
0432.CCR-13-0495
Kelly, B. L., Singh, G., & Aiyar, A. (2011). Molecular and cellular characterization of an AT-
hook protein from Leishmania. PloS One, 6(6), e21412.
Kennedy, P. G. E. (2004). Human African trypanosomiasis of the CNS: current issues and
challenges. Journal of Clinical Investigation, 113(4), 496–504.
http://doi.org/10.1172/JCI200421052
Klingbeil, M. M., & Englund, P. T. (2004). Closing the gaps in kinetoplast DNA network
replication. Proceedings of the National Academy of Sciences of the United States of
America, 101(13), 4333–4334. https://doi.org/10.1073/pnas.0401400101
Koch, E. Twinning. In International Tables for Crystallography Volume C: Mathematical,
physical and chemical tables, pages 10-14. Springer, 2004.
Kowalski, D., & Eddy, M. J. (1989). The DNA unwinding element: a novel, cis-acting
component that facilitates opening of the Escherichia coli replication origin. The EMBO
Journal, 8(13), 4335-4344.
Krauss, I. R., Merlino, A., Vergara, A., & Sica, F. (2013). An Overview of Biological
Macromolecule Crystallization. International Journal of Molecular Sciences, 14(6),
11643–11691. http://doi.org/10.3390/ijms140611643

REFERENCES
274
Laemmli, U. K. (1970). Cleavage of structural proteins during the assembly of the head of
bacteriophage T4. Nature, 227(5259), 680–685.
Lai, D.-H., Hashimi, H., Lun, Z.-R., Ayala, F. J., & Lukes, J. (2008). Adaptations of
Trypanosoma brucei to gradual loss of kinetoplast DNA: Trypanosoma equiperdum and
Trypanosoma evansi are petite mutants of T. brucei. Proceedings of the National
Academy of Sciences of the United States of America, 105(6), 1999–2004.
https://doi.org/10.1073/pnas.0711799105
Lamb, T. (2012). Immunity to Parasitic Infection. John Wiley & Sons. Retrieved from
https://books.google.es/books?id=METSVw5k3LwC
Langousis, G. & Hill, K. L. (2014). Motility and more: the flagellum of Trypanosoma
brucei. Nature Reviews MicrobiologyI, 12, 505–518.
http://doi.org/10.1038/nrmicro3274
Lanteri, C. A., Tidwell, R. R., & Meshnick, S. R. (2008). The Mitochondrion Is a Site of
Trypanocidal Action of the Aromatic Diamidine DB75 in Bloodstream Forms
of Trypanosoma brucei. Antimicrobial Agents and Chemotherapy, 52(3), 875–882.
http://doi.org/10.1128/AAC.00642-07
Li, L., Yoder, K., Hansen, M. S. T., Olvera, J., Miller, M. D., & Bushman, F. D. (2000).
Retroviral cDNA Integration: Stimulation by HMG I Family Proteins. Journal of Virology,
74(23), 10965–10974.
Lim, J.-H., West, K. L., Rubinstein, Y., Bergel, M., Postnikov, Y. V., & Bustin, M. (2005).
Chromosomal protein HMGN1 enhances the acetylation of lysine 14 in histone H3. The
EMBO Journal, 24(17), 3038–3048. http://doi.org/10.1038/sj.emboj.7600768
Lindemose, S., Nielsen, P. E., Hansen, M., & Mollegaard, N. E. (2011). A DNA minor groove
electronegative potential genome map based on photo-chemical probing. Nucleic Acids
Research, 39(14), 6269–6276. https://doi.org/10.1093/nar/gkr204
REFERENCES
275
275 275
Lotze, M. T., & Tracey, K. J. (2005). High-mobility group box 1 protein (HMGB1): nuclear
weapon in the immune arsenal. Nature Reviews Immunology, 5(4), 331–342.
https://doi.org/10.1038/nri1594
Lu, X.-J., & Olson, W. K. (2003). 3DNA: a software package for the analysis, rebuilding and
visualization of three-dimensional nucleic acid structures. Nucleic Acids Research,
31(17), 5108–5121. https://doi.org/10.1093/nar/gkg680
Luijsterburg, M. S., White, M. F., van Driel, R., & Dame, R. T. (2008). The Major Architects of
Chromatin: Architectural Proteins in Bacteria, Archaea and Eukaryotes. Critical Reviews
in Biochemistry and Molecular Biology, 43(6), 393–418.
https://doi.org/10.1080/10409230802528488
Lukes, J., Lys Guilbride, D., Votypka, J., Zikova, A., Benne, R., & Englund, P. T. (2002).
Kinetoplast DNA Network: Evolution of an Improbable Structure. Eukaryotic Cell, 1(4),
495–502. https://doi.org/10.1128/EC.1.4.495-502.2002
Macrì, S., Simula, L., Pellarin, I., Pegoraro, S., Onorati, M., Sgarra, R., Manfioletti, G., &
Vignali, R. (2016). Hmga2 is required for neural crest cell specification in Xenopus
laevis. Developmental Biology, 411(1), 25–37.
https://doi.org/10.1016/j.ydbio.2016.01.014
Markell, EK, John, DT & Krotoski, WA. (2006). Markell and Voge's Medical Parasitology. 9th
edition. Saunders Company: USA.
Maroso, M., Balosso, S., Ravizza, T., Liu, J., Aronica, E., Iyer, A. M., … Vezzani, A. (2010).
Toll-like receptor 4 and high-mobility group box-1 are involved in ictogenesis and can
be targeted to reduce seizures. Nature Medicine, 16(4), 413–419.
https://doi.org/10.1038/nm.2127
Martinez de Ilarduya, I., De Luchi, D., Subirana, J. A., Campos, J. L., & Uson, I. (2010). A
geometric approach to the crystallographic solution of nonconventional DNA
structures: helical superstructures of d(CGATAT). Angewandte Chemie (International Ed.
in English), 49(43), 7920–7922. https://doi.org/10.1002/anie.201003647

REFERENCES
276
Mathis, A. M., Holman, J. L., Sturk, L. M., Ismail, M. A., Boykin, D. W., Tidwell, R. R., & Hall,
J. E. (2006). Accumulation and Intracellular Distribution of Antitrypanosomal Diamidine
Compounds DB75 and DB820 in African Trypanosomes. Antimicrobial Agents and
Chemotherapy, 50(6), 2185–2191. https://doi.org/10.1128/AAC.00192-06
Matovu, E., Stewart, M. L., Geiser, F., Brun, R., Maser, P., Wallace, L. J. M., Burchmore, R. J.,
Enyaru, J. C. K., Barrett, M. P., Kaminsky, R., Seebeck, T., & de Koning, H. P. (2003).
Mechanisms of Arsenical and Diamidine Uptake and Resistance in Trypanosoma brucei.
Eukaryotic Cell, 2(5), 1003–1008. https://doi.org/10.1128/EC.2.5.1003-1008.2003
Matthews, K. R. (2005). The developmental cell biology of Trypanosoma brucei. Journal of
Cell Science, 118(Pt 2), 283–290. http://doi.org/10.1242/jcs.01649
Mattick, J. S. (2009). The Genetic Signatures of Noncoding RNAs. PLoS Genetics, 5(4),
e1000459. https://doi.org/10.1371/journal.pgen.1000459
McCoy, A. J., Grosse-Kunstleve, R. W., Adams, P. D., Winn, M. D., Storoni, L. C., & Read, R. J.
(2007). Phaser crystallographic software. Journal of Applied Crystallography, 40(4),
658–674. https://doi.org/10.1107/S0021889807021206
McKean, P. (2003), Coordination of cell cycle and cytokinesis in Trypanosoma brucei.
Current Opinion in Microbiology, 6, 600-607.
McNicholas, S., Potterton, E., Wilson, K. S., & Noble, M. E. M. (2011). Presenting your
structures: the CCP4mg molecular-graphics software. Acta Crystallographica Section
D: Biological Crystallography, 67(Pt 4), 386–394.
http://doi.org/10.1107/S0907444911007281
Miao, Y., Cui, T., Leng, F., & Wilson, W. D. (2008). Inhibition of high-mobility-group A2
protein binding to DNA by netropsin: A biosensor-surface plasmon resonance assay.
Analytical Biochemistry, 374(1), 7–15. https://doi.org/10.1016/j.ab.2007.10.023
Mitra, S. N., Wahl, M. C., & Sundaralingam, M. (1999). Structure of the side-by-side
binding of distamycin to d(GTATATAC)2. Acta Crystallographica. Section D, Biological
Crystallography, 55(Pt 3), 602–609.

REFERENCES
277
277 277
Montalvo-Quirós, S., Taladriz-Sender, A., Kaiser, M., & Dardonville, C. (2015). Antiprotozoal
activity and DNA binding of dicationic acridones. Journal of Medicinal Chemistry,
58(4), 1940–1949. https://doi.org/10.1021/jm5018303
Morávek, Z., Neidle, S., & Schneider, B. (2002). Protein and drug interactions in the minor
groove of DNA. Nucleic Acids Research, 30(5), 1182–1191.
Moreno, T., Pous, J., Subirana, J. A., & Campos, J. L. (2010). Coiled-coil conformation of a
pentamidine–DNA complex. Acta Crystallographica Section D Biological
Crystallography, 66(3), 251–257. https://doi.org/10.1107/S0907444909055693
Murshudov, G. N., Skubák, P., Lebedev, A. A., Pannu, N. S., Steiner, R. A., Nicholls, R. A.,
Winn, M. D., Long, F. & Vagin, A. A. (2011). REFMAC 5 for the refinement of
macromolecular crystal structures. Acta Crystallographica Section D Biological
Crystallography, 67(4), 355–367. https://doi.org/10.1107/S0907444911001314
Nagle, A. S., Khare, S., Kumar, A. B., Supek, F., Buchynskyy, A., Mathison, C. J. N., … Molteni,
V. (2014). Recent Developments in Drug Discovery for Leishmaniasis and Human
African Trypanosomiasis. Chemical Reviews, 114(22), 11305–11347.
http://doi.org/10.1021/cr500365f
Nagle, P. S., Quinn, S. J., Kelly, J. M., O’Donovan, D. H., Khan, A. R., Rodríguez, F., … Rozas, I.
(2010). Understanding the DNA binding of novel non-symmetrical guanidinium/2-
aminoimidazolinium derivatives. Organic & Biomolecular Chemistry, 8(24), 5558.
https://doi.org/10.1039/c0ob00428f
Nagle, P. S., Rodríguez, F., Nguyen, B., Wilson, W. D., & Rozas, I. (2012). High DNA Affinity
of a Series of Peptide Linked Diaromatic Guanidinium-like Derivatives. Journal of
Medicinal Chemistry, 55(9), 4397–4406. https://doi.org/10.1021/jm300296f
Narlikar, L., & Ovcharenko, I. (2009). Identifying regulatory elements in eukaryotic
genomes. Briefings in Functional Genomics and Proteomics, 8(4), 215–230.
https://doi.org/10.1093/bfgp/elp014
REFERENCES
278
Ndjonka, D., Rapado, L. N., Silber, A. M., Liebau, E., & Wrenger, C. (2013). Natural Products
as a Source for Treating Neglected Parasitic Diseases. International Journal of
Molecular Sciences, 14(2), 3395–3439. http://doi.org/10.3390/ijms14023395
Ngo, H. B., Kaiser, J. T., & Chan, D. C. (2011). Tfam, a mitochondrial transcription and
packaging factor, imposes a U-turn on mitochondrial DNA. Nature Structural &
Molecular Biology, 18(11), 1290–1296. http://doi.org/10.1038/nsmb.2159
Ngo, H. B., Lovely, G. A., Phillips, R., & Chan, D. C. (2014). Distinct structural features of
TFAM drive mitochondrial DNA packaging versus transcriptional activation. Nature
Communications, 5, 3077. http://doi.org/10.1038/ncomms4077
Nguyen, B., & Wilson, W. D. (2009). The Effects of Hairpin Loops on Ligand−DNA
Interactions. The Journal of Physical Chemistry B, 113(43), 14329–14335.
https://doi.org/10.1021/jp904830m
Nieto, L., Mascaraque, A., Miller, F., Glacial, F., Ríos Martínez, C., Kaiser, M., Brun, R., &
Dardonville, C. (2011). Synthesis and Antiprotozoal Activity of N -Alkoxy Analogues of
the Trypanocidal Lead Compound 4,4′-Bis(imidazolinylamino)diphenylamine with
Improved Human Blood−Brain Barrier Permeability. Journal of Medicinal Chemistry,
54(2), 485–494. https://doi.org/10.1021/jm101335q
Ogbadoyi, E. O., Robinson, D. R., & Gull, K. (2003). A High-Order Trans-Membrane
Structural Linkage Is Responsible for Mitochondrial Genome Positioning and
Segregation by Flagellar Basal Bodies in Trypanosomes. Molecular Biology of the Cell,
14(5), 1769–1779. https://doi.org/10.1091/mbc.E02-08-0525
Oguey, C., Foloppe, N., & Hartmann, B. (2010). Understanding the Sequence-Dependence
of DNA Groove Dimensions: Implications for DNA Interactions. PLoS ONE, 5(12),
e15931. https://doi.org/10.1371/journal.pone.0015931
Oh, D.-B., Kim, Y.-G., & Rich, A. (2002). Z-DNA-binding proteins can act as potent
effectors of gene expression in vivo. Proceedings of the National Academy of Sciences,
99(26), 16666–16671.

REFERENCES
279
279 279
Ohe, K., Lalli, E., & Sassone-Corsi, P. (2002). A direct role of SRY and SOX proteins in pre-
mRNA splicing. Proceedings of the National Academy of Sciences of the United States
of America, 99(3), 1146–1151. http://doi.org/10.1073/pnas.022645899
Ohndorf, U.-M., Rould, M. A., He, Q., Pabo, C. O., & Lippard, S. J. (1999). Basis for
recognition of cisplatin-modified DNA by high-mobility-group proteins. Nature,
399(6737), 708–712. https://doi.org/10.1038/21460
Ozturk, N., Singh, I., Mehta, A., Braun, T., & Barreto, G. (2014). HMGA proteins as
modulators of chromatin structure during transcriptional activation. Frontiers in Cell
and Developmental Biology, 2, 5. http://doi.org/10.3389/fcell.2014.00005
Paine, M. F., Wang, M. Z., Generaux, C. N., Boykin, D. W., Wilson, W. D., De Koning, H. P., …
Tidwell, R. R. (2010). Diamidines for human African trypanosomiasis. Current Opinion in
Investigational Drugs (London, England : 2000), 11(8), 876–883.
Pandit, K. V., Corcoran, D., Yousef, H., Yarlagadda, M., Tzouvelekis, A., Gibson, K. F., …
Kaminski, N. (2010). Inhibition and Role of let-7d in Idiopathic Pulmonary Fibrosis.
American Journal of Respiratory and Critical Care Medicine, 182(2), 220–229.
http://doi.org/10.1164/rccm.200911-1698OC
Panyim, S., & Chalkley, R. (1969). High resolution acrylamide gel electrophoresis of
histones. Archives of Biochemistry and Biophysics, 130(1), 337–346.
Patterson, A. L. (1934). A fourier series method for the determination of the components of
interatomic distances in crystals. Physical Review, 46(5), 372.
https://doi.org/10.1103/PhysRev.46.372
Paul, A., & Bhattacharya, S. (2012). Chemistry and biology of DNA-binding small
molecules. Current Science, 102(2), 212-231.
Paul, A., Nanjunda, R., Kumar, A., Laughlin, S., Nhili, R., Depauw, S., … Wilson, W. D. (2015).
Mixed up minor groove binders: Convincing A·T specific compounds to recognize a G·C
base pair. Bioorganic & Medicinal Chemistry Letters, 25(21), 4927–4932.
https://doi.org/10.1016/j.bmcl.2015.05.005

REFERENCES
280
Petersen, K., Leah, R., Knudsen, S., & Cameron-Mills, V. (2002). Matrix attachment regions
(MARs) enhance transformation frequencies and reduce variance of transgene
expression in barley. Plant Molecular Biology, 49(1), 45–58.
Pflugrath, J. (2004). Macromolecular cryocrystallography?methods for cooling and
mounting protein crystals at cryogenic temperatures. Methods, 34(3), 415–423.
https://doi.org/10.1016/j.ymeth.2004.03.032
Pjura, P. E., Grzeskowiak, K., & Dickerson, R. E. (1987). Binding of Hoechst 33258 to the
minor groove of B-DNA. Journal of Molecular Biology, 197(2), 257–271.
Potaman, V.N., & Sinden, R.R. (2000-2013). DNA: Alternative Conformations and Biology.
In: Madame Curie Bioscience Database [Internet]. Landes Bioscience. Available from:
https://www.ncbi.nlm.nih.gov/books/NBK6545/
Povelones, M. L. (2014). Beyond replication: division and segregation of mitochondrial
DNA in kinetoplastids. Molecular and Biochemical Parasitology, 196(1), 53–60.
https://doi.org/10.1016/j.molbiopara.2014.03.008
Priotto, G., Kasparian, S., Mutombo, W., Ngouama, D., Ghorashian, S., Arnold, U., Ghabri, S.,
Baudin, E., Buard, V., Kazadi-Kyanza, S., et al. (2009). Nifurtimox-eflornithine
combination therapy for second-stage African Trypanosoma brucei gambiense
trypanosomiasis: a multicentre, randomised, phase III, non-inferiority trial. The Lancet,
374(9683), 56–64. https://doi.org/10.1016/S0140-6736(09)61117-X
Rabilloud, T., Vuillard, L., Gilly, C., & Lawrence, J. J. (1994). Silver-staining of proteins in
polyacrylamide gels: a general overview. Cellular and Molecular Biology (Noisy-Le-
Grand, France), 40(1), 57–75.
Radic, M. Z., Lundgren, K., & Hamkalo, B. A. (1987). Curvature of mouse satellite DNA and
condensation of heterochromatin. Cell, 50(7), 1101–1108.
Rajewska, M., Wegrzyn, K., & Konieczny, I. (2012). AT-rich region and repeated sequences
– the essential elements of replication origins of bacterial replicons. FEMS

REFERENCES
281
281 281
Microbiology Reviews, 36(2), 408–434. https://doi.org/10.1111/j.1574-
6976.2011.00300.x
Ralston, K. S., & Hill, K. L. (2008). The flagellum of Trypanosoma brucei: new tricks from an
old dog. International Journal for Parasitology, 38(8-9), 869–884.
http://doi.org/10.1016/j.ijpara.2008.03.003
Ray, D. S. (1989). Conserved sequence blocks in kinetoplast minicircles from diverse
species of trypanosomes. Molecular and Cellular Biology, 9(3), 1365–1367.
Reeves, R. (2001). Molecular biology of HMGA proteins: hubs of nuclear function. Gene,
277(1), 63–81.
Reeves, R. (2010). HMG Nuclear Proteins: Linking Chromatin Structure to Cellular
Phenotype. Biochimica et Biophysica Acta, 1799(1-2), 3.
http://doi.org/10.1016/j.bbagrm.2009.09.001
Rentzeperis, D., Marky, L. A., Dwyer, T. J., Geierstanger, B. H., Pelton, J. G., & Wemmer, D. E.
(1995). Interaction of minor groove ligands to an AAATT/AATTT site: correlation of
thermodynamic characterization and solution structure. Biochemistry, 34(9), 2937–
2945.
Ríos Martínez, C. H., Lagartera, L., Kaiser, M., & Dardonville, C. (2014). Antiprotozoal
activity and DNA binding of N-substituted N-phenylbenzamide and 1,3-diphenylurea
bisguanidines. European Journal of Medicinal Chemistry, 81, 481–491.
https://doi.org/10.1016/j.ejmech.2014.04.083
Ríos Martínez, C. H., Lagartera, L., Trujillo, C., & Dardonville, C. (2015a). Bisimidazoline
arylamides binding to the DNA minor groove: N1-hydroxylation enhances binding
affinity and selectivity to AATT sites. Med. Chem. Commun., 6(11), 2036–2042.
https://doi.org/10.1039/C5MD00292C
Ríos Martínez, C. H., Miller, F., Ganeshamoorthy, K., Glacial, F., Kaiser, M., de Koning, H. P.,
Eze, A. A., Lagartera, L., Herraiz, Dardonville, C. (2015c). A New Nonpolar N -Hydroxy
Imidazoline Lead Compound with Improved Activity in a Murine Model of Late-Stage

REFERENCES
282
Trypanosoma brucei brucei Infection Is Not Cross-Resistant with Diamidines.
Antimicrobial Agents and Chemotherapy, 59(2), 890–904.
https://doi.org/10.1128/AAC.03958-14
Ríos Martínez, C. H., Nué Martínez, J. J., Ebiloma, G. U., de Koning, H. P., Alkorta, I., &
Dardonville, C. (2015b). Lowering the pKa of a bisimidazoline lead with halogen atoms
results in improved activity and selectivity against Trypanosoma brucei in vitro.
European Journal of Medicinal Chemistry, 101, 806–817.
https://doi.org/10.1016/j.ejmech.2015.07.013
Rodríguez, F., Rozas, I., Kaiser, M., Brun, R., Nguyen, B., Wilson, W. D., … Dardonville, C.
(2008). New Bis(2-aminoimidazoline) and Bisguanidine DNA Minor Groove Binders
with Potent in Vivo Antitrypanosomal and Antiplasmodial Activity. Journal of
Medicinal Chemistry, 51(4), 909–923. https://doi.org/10.1021/jm7013088
Roeder, R. G. (1996). The role of general initiation factors in transcription by RNA
polymerase II. Trends in Biochemical Sciences, 21, 327-335.
Rong, H., Li, Y., Shi, X., Zhang, X., Gao, Y., Dai, H., Teng, M.K., Niu, L.W., Liu, Q., Hao, Q.
(2007). Structure of human upstream binding factor HMG box 5 and site for binding of
the cell-cycle regulatory factor TAF1. Acta Crystallographica Section D Biological
Crystallography, 63, 730-737. https://doi.org/10.1107/S0907444907017027
Roque, A., Orrego, M., Ponte, I., & Suau, P. (2004). The preferential binding of histone H1 to
DNA scaffold-associated regions is determined by its C-terminal domain. Nucleic Acids
Research, 32(20), 6111–6119. http://doi.org/10.1093/nar/gkh945
Roussel, A., Inisan, A., Knoops-Mouthuy, E. & Cambillau, E. Turbo-Frodo Version OpenGL.1
University of Marseille. Silicon Graphics, Mountain View, CA , 1998.
Roy Chowdhury A, Bakshi R, Wang J, Yildirir G, Liu B, Pappas-Brown V, et al. (2010) The
Killing of African Trypanosomes by Ethidium Bromide. PLOS Pathogens 6(12),
e1001226. https://doi.org/10.1371/journal.ppat.1001226

REFERENCES
283
283 283
Rubio-Cosials, A., Sidow, J.F., Jimenez-Menendez, N., Fernandez-Millan, P., Montoya, J.,
Jacobs, H.T., Coll, M., Bernado, P., Sola, M. (2011). Human mitochondrial transcription
factor A induces a U-turn structure in the light strand promoter. Nature Structural &
Molecular Biology. 18: 1281-1289. http://doi.org/10.1038/nsmb.2160
Sánchez-Giraldo, R., Acosta-Reyes, F. J., Malarkey, C. S., Saperas, N., Churchill, M. E. A., &
Campos, J. L. (2015). Two high-mobility group box domains act together to underwind
and kink DNA. Acta Crystallographica Section D Biological Crystallography, 71(7),
1423–1432. https://doi.org/10.1107/S1399004715007452
Sarai, A., Mazur, J., Nussinov, R., & Jernigan, R.L. (1989). Sequence dependence of DNA
conformational flexibility. Biochemistry, 28(19), 7842–7849. 418.
https://doi.org/10.1021/bi00445a046
Scaffidi, P., Misteli, T., & Bianchi, M. E. (2002). Release of chromatin protein HMGB1 by
necrotic cells triggers inflammation. Nature, 418(6894), 191–195.
https://doi.org/10.1038/nature00858
Schnaufer, A., Clark-Walker, G. D., Steinberg, A. G., & Stuart, K. (2005). The F1-ATP
synthase complex in bloodstream stage trypanosomes has an unusual and essential
function. The EMBO Journal, 24(23), 4029–4040.
http://doi.org/10.1038/sj.emboj.7600862
Schneider, B., Neidle, S., Berman, H.M. (1997). Conformations of the sugar-phosphate
backbone in helical DNA crystal structures. Biopolymers, 42, 113–124.
https://doi.org/10.1002/(SICI)1097-0282(199707)42:1<113::AID-BIP10>3.0.CO;2-O
Schrödinger, LLC. (2015). The PyMOL molecular graphics system, version 1.8.
Scocca, J. R., & Shapiro, T. A. (2008). A mitochondrial topoisomerase IA essential for late
theta structure resolution in African trypanosomes. Molecular Microbiology, 67(4),
820–829. https://doi.org/10.1111/j.1365-2958.2007.06087.x
Scott, F. J., Khalaf, A. I., Giordani, F., Wong, P. E., Duffy, S., Barrett, M., … Suckling, C. J.
(2016). An evaluation of Minor Groove Binders as anti-Trypanosoma brucei brucei

REFERENCES
284
therapeutics. European Journal of Medicinal Chemistry, 116, 116–125.
http://doi.org/10.1016/j.ejmech.2016.03.064
Scott, W. G., Finch, J. T., Grenfell, R., Fogg, J., Smith, T., Gait, M. J., & Klug, A. (1995). Rapid
crystallization of chemically synthesized hammerhead RNAs using a double screening
procedure. Journal of Molecular Biology, 250(3), 327–332.
https://doi.org/10.1006/jmbi.1995.0380
Sela, D., Milman, N., Kapeller, I., Zick, A., Bezalel, R., Yaffe, N., & Shlomai, J. (2008). Unique
Characteristics of the Kinetoplast DNA Replication Machinery Provide Potential Drug
Targets in Trypanosomatids. In H. K. Majumder (Ed.), Drug Targets in Kinetoplastid
Parasites (pp. 9–21). New York, NY: Springer New York. https://doi.org/10.1007/978-0-
387-77570-8_2
Shah, S. N., & Resar, L. M. S. (2012). High mobility group A1 and cancer: Potential
biomarker and therapeutic target (review). Histology and Histopathology, 27, 567-579.
Shapiro, T. A., & Englund, P. T. (1995). The structure and replication of kinetoplast DNA.
Annual Review of Microbiology, 49, 117–143.
https://doi.org/10.1146/annurev.mi.49.100195.001001
Sheng, J., Gan, J., & Huang, Z. (2013). Structure-Based DNA-Targeting Strategies with
Small Molecule Ligands for Drug Discovery: TARGETING DNAs VIA STRUCTURAL
INVESTIGATIONS. Medicinal Research Reviews, 33(5), 1119–1173.
https://doi.org/10.1002/med.21278
Sicard, F., Destainville, N., & Manghi, M. (2016). DNA denaturation bubbles: Free-energy
landscape and nucleation/closure rates. The Journal of Chemical Physics, 142, 034903.
http://dx.doi.org/10.1063/1.4905668
Slama-Schwok, A., Zakrzewska, K., Leger, G., Leroux, Y., Takahashi, M., Käs, E., & Debey, P.
(2000). Structural changes induced by binding of the high-mobility group I protein to a
mouse satellite DNA sequence. Biophysical Journal, 78(5), 2543–2559.

REFERENCES
285
285 285
Smith, A. E., & Buchmueller, K. L. (2011). Molecular basis for the inhibition of HMGA1
proteins by distamycin A. Biochemistry, 50(38), 8107–8116.
https://doi.org/10.1021/bi200822c
Soeiro, M. N. C., Werbovetz, K., Boykin, D. W., Wilson, W. D., Wang, M. Z., & Hemphill, A.
(2013). Novel amidines and analogues as promising agents against intracellular
parasites: a systematic review. Parasitology, 140(8), 10.1017/S0031182013000292.
http://doi.org/10.1017/S0031182013000292
Stott, K., Tang, G. S. F., Lee, K.-B., & Thomas, J. O. (2006). Structure of a Complex of
Tandem HMG Boxes and DNA. Journal of Molecular Biology, 360(1), 90–104.
https://doi.org/10.1016/j.jmb.2006.04.059
Strekowski, L., & Wilson, B. (2007). Noncovalent interactions with DNA: an overview.
Mutation Research, 623(1–2), 3–13. https://doi.org/10.1016/j.mrfmmm.2007.03.008
Štros, M. (2010). HMGB proteins: Interactions with DNA and chromatin. Biochimica et
Biophysica Acta (BBA) - Gene Regulatory Mechanisms, 1799(1-2), 101–113.
https://doi.org/10.1016/j.bbagrm.2009.09.008
Štros, M., Štokrová, J., & Thomas, J. O. (1994). DNA looping by the HMG-box domains of
HMG1 and modulation of DNA binding by the acidic C-terminal domain. Nucleic Acids
Research, 22(6), 1044–1051.
Szempruch, A. J., Choudhury, R., Wang, Z., & Hajduk, S. L. (2015). In vivo analysis of
trypanosome mitochondrial RNA function by artificial site-specific RNA endonuclease-
mediated knockdown. RNA, 21(10), 1781–1789.
http://doi.org/10.1261/rna.052084.115
Tang, D., Kang, R., Zeh III, H. J., & Lotze, M. T. (2010). High-mobility group box 1 and
cancer. Biochimica et Biophysica Acta (BBA) - Gene Regulatory Mechanisms, 1799(1-
2), 131–140. https://doi.org/10.1016/j.bbagrm.2009.11.014

REFERENCES
286
Teo, S. H., Grasser, K. D., & Thomas, J. O. (1995). Differences in the DNA-binding properties
of the HMG-box domains of HMG1 and the sex-determining factor SRY. Eur. J.
Biochem. 230, 943-950. https://doi.org/10.1111/j.1432-1033.1995.0943g.x
Tidwell. R.R, Boykin, D.W. (2003). DNA and RNA Binders: From Small Molecules to
Drugs. Demeunynck, M., Bailly, C., Wilson, W.D., editors. Vol. 2, 414–460. Weinheim:
WILEY-VCH.
Tolstorukov, M. Y., Ivanov, V. I., Malenkov, G. G., Jernigan, R. L., & Zhurkin, V. B. (2001).
Sequence-dependent B↔ A transition in DNA evaluated with dimeric and trimeric
scales. Biophysical Journal, 81(6), 3409–3421.
Tolstorukov, M. Y., Virnik, K. M., Adhya, S., & Zhurkin, V. B. (2005). A-tract clusters may
facilitate DNA packaging in bacterial nucleoid. Nucleic Acids Research, 33(12), 3907–
3918. https://doi.org/10.1093/nar/gki699
Travers, A. A. (2004). The structural basis of DNA flexibility. Philosophical Transactions
Series A Mathematical Physical and Engineering Sciences, 362:1423–1438.
http://dx.doi.org/10.1098/rsta.2004.1390
Vagin, A., & Teplyakov, A. (2010). Molecular replacement with MOLREP. Acta
Crystallographica. Section D, Biological Crystallography, 66(Pt 1), 22–25.
https://doi.org/10.1107/S0907444909042589
Vaguine, A. A., Richelle, J., & Wodak, S. J. (1999). SFCHECK: a unified set of procedures for
evaluating the quality of macromolecular structure-factor data and their agreement
with the atomic model. Acta Crystallographica. Section D, Biological Crystallography,
55(Pt 1), 191–205. https://doi.org/10.1107/S0907444998006684
Varani, G., & McClain, W. H. (2000). The G·U wobble base pair: A fundamental building
block of RNA structure crucial to RNA function in diverse biological systems. EMBO
Reports, 1(1), 18–23. http://doi.org/10.1093/embo-reports/kvd001

REFERENCES
287
287 287
Vassella, E., Straesser, K., & Boshart, M. (1997). A mitochondrion-specific dye for
multicolour fluorescent imaging of Trypanosoma brucei. Molecular and Biochemical
Parasitology, 90(1), 381–385.
Vignali, R., Macrì, S., Onorati, M., Basaldella, E., Sgarra, R., Manfioletti, G. (2008). HMGA
proteins in Xenopus laevis. Developmental Biology, 319, 587–598.
Wang, A. H.-J., Quigley, G. J., Kolpak, F. J., Crawford, J. L., van Boom, J. H., van der Marel,
G., & Rich, A. (1979). Molecular structure of a left-handed double helical DNA
fragment at atomic resolution. Nature, 282(5740), 680–686.
https://doi.org/10.1038/282680a0
Wang, J., Pappas-Brown, V., Englund, P. T., & Jensen, R. E. (2014). TbKAP6, a Mitochondrial
HMG Box-Containing Protein in Trypanosoma brucei, Is the First Trypanosomatid
Kinetoplast-Associated Protein Essential for Kinetoplast DNA Replication and
Maintenance. Eukaryotic Cell, 13(7), 919–932. https://doi.org/10.1128/EC.00260-13
Wang, M., Yu, Y., Liang, C., Lu, A., & Zhang, G. (2016). Recent Advances in Developing
Small Molecules Targeting Nucleic Acid. International Journal of Molecular Sciences,
17(6), 779. https://doi.org/10.3390/ijms17060779
Wang, Z., & Englund, P. T. (2001). RNA interference of a trypanosome topoisomerase II
causes progressive loss of mitochondrial DNA. The EMBO Journal, 20(17), 4674–4683.
https://doi.org/10.1093/emboj/20.17.4674
Waring, M. J., Chaires, J. B. and Armitage, B. A. (2005). DNA binders and related subjects.
Springer Science & Business Media, volume 253.
Watson, J. D., & Crick, F. H. C. (1953). A Structure for Deoxyribose Nucleic Acid. Nature,
171, 737-738.
Watson, J. D., Baker, T. A,. Bell, S. P., Gann, A., Levine, M., and Losick, R. (2008). Molecular
biology of the gene. 6th edition. San Francisco Cold Spring Harbor, Pearson/Benjamin
Cummings; Cold Spring Harbor Laboratory Press, New York.

REFERENCES
288
Weir, H. M., Kraulis, P. J., Hill, C. S., Raine, A. R., Laue, E. D., & Thomas, J. O. (1993).
Structure of the HMG box motif in the B-domain of HMG1. The EMBO Journal, 12(4),
1311–1319.
Wemmer, D. E., & Dervan, P. B. (1997). Targeting the minor groove of DNA. Current
Opinion in Structural Biology, 7(3), 355–361.
Whelan, D. R., Hiscox, T. J., Rood, J. I., Bambery, K. R., McNaughton, D., & Wood, B. R.
(2014). Detection of an en masse and reversible B- to A-DNA conformational transition
in prokaryotes in response to desiccation. Journal of The Royal Society Interface,
11(97), 20140454–20140454. https://doi.org/10.1098/rsif.2014.0454
WHO Media centre (2017). "Fact sheet N°259: Trypanosomiasis, Human African (sleeping
sickness)". World Health Organization. Retrieved 17 April 2017.
Wilson, L., Bray, T. & Suddath, F. (1991). Crystallization of proteins by dynamic control of
evaporation. Journal of Crystal Growth , 110(1), 142-147.
https://doi.org/10.1016/0022-0248(91)90877-8
Wilson, W. D., Tanious, F. A., Mathis, A., Tevis, D., Hall, J. E., & Boykin, D. W. (2008).
Antiparasitic compounds that target DNA. Biochimie, 90(7), 999–1014.
https://doi.org/10.1016/j.biochi.2008.02.017
Winn, M. D., Ballard, C. C., Cowtan, K. D., Dodson, E. J., Emsley, P., Evans, P. R., … Wilson, K.
S. (2011). Overview of the CCP 4 suite and current developments. Acta
Crystallographica Section D Biological Crystallography, 67(4), 235–242.
https://doi.org/10.1107/S0907444910045749
Woodward, R., & Gull, K. (1990). Timing of nuclear and kinetoplast DNA replication and
early morphological events in the cell cycle of Trypanosoma brucei. Journal of Cell
Science, 95(1), 49–57.
World Health Organization and Department of control of neglected tropical diseases.
(2016). Report of the second WHO stakeholders meeting on gambiense human African
trypanosomiasis elimination, Geneva, 21–23 March 2016. WHO/HTM/NTD/IDM/2016.4

REFERENCES
289
289 289
World Health Organization and Department of control of neglected tropical diseases.
(2017). Integrating neglected tropical diseases into global health and development:
fourth WHO report on neglected tropical diseases. vi, 267. WHO/HTM/NTD/2017.01
World Health Organization. (2015). World health statistics 2015. Geneva: World Health
Organization.
Xu, C. W., Hines, J. C., Engel, M. L., Russell, D. G., & Ray, D. S. (1996). Nucleus-encoded
histone H1-like proteins are associated with kinetoplast DNA in the trypanosomatid
Crithidia fasciculata. Molecular and Cellular Biology, 16(2), 564–576.
Yakovchuk, P., Protozanova, E., & Frank-Kamenetskii, M.D. (2006). Base-stacking and base-
pairing contributions into thermal stability of the DNA double helix. Nucleic Acids
Research, 34(2), 564–574. https://doi.org/10.1093/nar/gkj454
Zhang, Q., & Wang, Y. (2010). HMG Modifications and Nuclear Function. Biochimica et
Biophysica Acta, 1799(1-2), 28. http://doi.org/10.1016/j.bbagrm.2009.11.009
Zwart, P., Grosse-Kunstleve, R. & Adams, P. (2005). Xtriage and fest: automatic assessment
of x-ray data and substructure structure factor estimation. CCP4 Newsl, 43, 27-35.