Review Heparan sulfate proteoglycan ... - Harvard University
Upload
gareth-thomasCategory
view
214download
0
Structural and Functional Changes in HeparanSulfate Proteoglycan Expression Associated with theMyofibroblastic Phenotype
Gareth Thomas, Aled Clayton, Janet Thomas,Malcolm Davies, and Robert SteadmanFrom the Institute of Nephrology, University of Wales College of
Medicine, Heath Park, Cardiff, Wales
The principal cells implicated as the source of theextracellular matrix in areas of progressive fibrosisare fibroblasts with the phenotypic appearance ofmyofibroblasts. This report describes differences inheparan sulfate proteoglycan expression betweenmyofibroblasts and normal fibroblasts, associatedwith impaired responses to fibroblast growth factor-2(FGF-2). Although both cell types responded to plate-let-derived growth factor, myofibroblasts, unlike fi-broblasts, did not proliferate to FGF-2. A responsewas acquired, however, when myofibroblasts wereincubated with FGF-2 in the presence of heparan sul-fate (HS) and heparin. Selective digestion with pro-nase, NaOH/NaBH4, heparinase I, or low pH nitrousacid showed that each HS-glycosaminoglycan regioncomprised a pronase-resistant peptide separating twoHS chains. The HS-glycosaminoglycan chains frommyofibroblasts were larger (Kav, 0.32; molecularweight, 50 kd) than those from fibroblasts (Kav, 0.4;molecular weight, 33 kd), although their disaccharidecomposition was identical. The chains from myofi-broblasts, however, contained three, compared totwo, heparinase 1-resistant sequences separated bylarger contiguous areas of low sulfation. Further-more, although there was no difference in FGF-2-binding affinity between the two cell types, thechains secreted by myofibroblasts had twice the bind-ing capacity of those from fibroblasts. Thus, it islikely that the difference in response to FGF-2 is be-cause of a difference in FGF-2 sequestration and re-ceptor interaction with FGF-2-HS complexes. A com-parative investigation into HS fine structure is beingundertaken to examine these findings in more detail.(Am J Pathol 2003, 162:977–989)
The decline in organ function associated with progres-sive fibrosis is directly linked to the accumulation of ex-tracellular matrix. In most organs this matrix is synthe-sized by cells that are phenotypically myofibroblasts.1–7
Work from our own laboratory8,9 and others10–14 hasfocused on the potential importance of these cells in thedevelopment of renal fibrosis, in which they are consid-ered the best marker of progressive disease.2,15–17 Myo-fibroblasts express the smooth muscle isoform of �-actin(�-SMA) and incorporate this into reorganized actinstress fibers. They also up-regulate their expression ofthe intercellular adhesion molecules ICAM-1 andVCAM-1 and synthesize increased amounts of extracel-lular matrix, particularly interstitial collagens.8,9
Matrix synthesis, deposition, and turnover are under thecontrol of growth factors such as platelet-derived growthfactor (PDGF) and fibroblast growth factor (FGF)-2. In manycells the biological effect of these cytokines is mediated bytheir initial interaction with matrix- and cell-associated pro-teoglycans.18–26 Proteoglycans have a protein core, whichis covalently substituted with glycosaminoglycan (GAG)side chains. The binding of growth factors to these GAGchains, particularly heparan sulfate (HS) chains on the cellsurface, is a prerequisite for the increased local concentra-tion of many growth factors and their subsequent transfer tohigh-affinity signaling receptors.18,27–32 There are severaldifferent families of heparan sulfate proteoglycans (HSPGs)expressed on the surface of cells. These include the GPI-linked glypicans, the transmembrane syndecans, and thehyaluronan receptor CD44.33–37
We have recently described the identification and ex-pression of cell surface HSPGs on renal fibroblasts anddemonstrated that they were essential for the control ofthe proliferative response of these cells to FGF-2.38 TheHS chains were shown to be the mediators of this re-sponse because it was blocked by removing them fromthe cell surface (with heparinase) or preventing their sul-fation (with sodium chlorate). This was specific for FGF-2,because neither proliferation in response to PDGF-BB norto fetal calf serum (FCS) was affected by these treat-ments. The current study extends these findings by ex-amining differences in FGF-2 response and HS structurebetween these fibroblasts and renal myofibroblasts. Theresults suggest that, as a result of myofibroblastic differ-
Supported by the National Kidney Research Fund and Welsh Scheme forDevelopment of Health and Social Research.
Accepted for publication December 11, 2002.
Address reprint requests to Robert Steadman, Ph.D., Institute of Ne-phrology, University of Wales College of Medicine, Heath Park, Cardiff,Wales, UK CF144XN. E-mail: [email protected].
American Journal of Pathology, Vol. 162, No. 3, March 2003
Copyright © American Society for Investigative Pathology
977
entiation, there is a change in the proteoglycan profile ofthe cell that is associated with a change in the respon-siveness of the cells to FGF-2.
Materials and Methods
Materials
All general reagents were from Sigma-Aldrich (Poole,UK), unless stated otherwise. All tissue culture reagentswere obtained from Gibco/BRL Life Technologies Ltd.(Paisley, UK). Radioisotopes were purchased from Am-ersham Biosciences (Little Chalfont, Bucks, UK).
Cell Culture
The renal fibroblast line NRK49F (ECACC no. 86101301)was obtained from the European Collection of Animal CellCultures (Salisbury Wiltshire) and cultured as describedin Dulbecco’s modified Eagle’s medium (DMEM)/Ham’sF-12 containing 5% FCS.38 Myofibroblasts were initiallyderived by selection based on an increased proliferativerate and elongated morphology. Subsequently their phe-notype was confirmed using �-SMA expression. Prelimi-nary experiments demonstrated that in this medium themyofibroblasts had a doubling time of 33 � 6 hourscompared to 46 � 5 hours for the fibroblasts (n � 3).There was also a difference in the time taken for the cellsto become quiescent after removal of FCS. The cells wereseeded at 2 � 103 cells/ml and cultured for 24 hours inmedium containing 5% FCS until 50% confluent. Themedium was then removed and the cells washed in se-rum-free medium and placed in medium containing 0.2%lactalbumin hydrolysate (LH). Cell numbers were mea-sured by 3-(4,5-dimethylthiazol-2-yl)-2.5-diphenyl tetra-zolium bromide (MTT) assay (see below) at selectedtimes thereafter. Both cell populations decreased theirproliferative rate with the fibroblasts reaching a quiescentstate by 30 hours. The rate of decrease was less marked,however, for the myofibroblasts, which did not entergrowth arrest until 48 hours (data not shown). In all sub-sequent experiments, therefore, unless otherwise stated,cells were seeded at a density of 2 to 4 � 104 cells/cm2
grown to 75% confluence and made quiescent for 48hours in DMEM/Ham’s F-12 containing 0.2% LH.
Cell numbers were assessed by MTT assay or bydirect counting using a Neubauer hemocytometer. Forthe MTT assay, the culture medium was removed and100 �l of MTT (1.25 mg/ml in DMEM-Ham’s F-12) wasadded to the cell layer and incubated at 37°C for 4 hours.The formazan precipitate was solubilized in 20% sodiumdodecyl sulfate and 50% dimethyl formamide overnight.The absorbance was read at 600 nm. In validation exper-iments there was a correlation coefficient of 0.95 betweencell number and absorbance.
Proliferative Response of Myofibroblasts andFibroblasts to Growth Factors
In all experiments to evaluate fibroblast proliferation, cellswere growth-arrested for 48 hours before treatment or
stimulation. The cells were then incubated either in se-rum-free medium, supplemented with 0.2% LH (negativecontrol) or in serum-free medium containing FGF-2 orPDGF-BB (R & D Systems Europe Ltd., Abingdon, Ox-ford, UK). Cell numbers were then estimated by MTTassay at selected times after growth factor addition.
Immunocytochemistry
Fibroblasts were seeded in eight-well chamber slides at adensity of 5 � 103 cells/well and cultured in DMEM/Ham’sF-12 containing 5% FCS for 48 hours before washing withphosphate-buffered saline (PBS) and fixation with acetone:methanol (1:1) at �20°C for 2 minutes. The slides wereair-dried and incubated with 1% dried milk and 1% bovineserum albumin in PBS for 1 hour at room temperature. Thecells were then incubated with specific antibody; anti-vi-mentin (clone V9), anti-desmin (clone D33), or anti-�-SMA(clone IA4) (DAKO Ltd., High Wycombe, Bucks, UK) orappropriately diluted mouse serum for 1 hour at room tem-perature according the manufacturer’s recommended pro-tocols. The slides were washed four times with 1% driedmilk and 1% bovine serum albumin in PBS and primaryantibody localized using anti-mouse IgG-fluorescein iso-thiocyanate conjugate (Sigma, Poole, Dorset, UK). Excessantibody was removed by extensive washing with PBS andthe slides mounted with Vectashield fluorescent mountant(Vector Laboratories, Peterborough, UK).
Fluorecence-Activated Cell Sorting (FACS)Analysis of FGF Receptor Expression
Cells were grown to subconfluence in DMEM/Ham’s F-12containing 5% FCS. They were then washed three timeswith PBS and made quiescent by growth arrest in 0.2%LH in DMEM/Ham’s F-12 for 48 hours. The cells wereharvested by removing the culture medium, washing thecells with PBS three times, and replacing the final washwith ice-cold 0.05% ethylenediaminetetraacetic acid. Theflasks were left on ice for 5 minutes and then cells de-tached by brief vigorous shaking. Detached cells werepelleted by centrifugation at 500 � g for 5 minutes andresuspended in 1 ml of FACS buffer (PBS containing 1mmol/L of ethylenediaminetetraacetic acid, 1% bovineserum albumin, and 1.5 mmol/L of sodium azide). Morethan 95% of the cells were recovered by this method.One hundred �l of cell suspension (1 � 105 cells) wasthen incubated for 30 minutes at 4°C with 1 �g/ml of eachof the anti-FGF receptor (FGFR) antibodies (sc-121 forFGFR-1, sc-6930 for FGFR-2, sc-123 for FGFR-3, andsc-7590 for FGFR-4) purchased from Santa Cruz Biotech-nology, Inc., Santa Cruz, CA. The cells were then pelletedby centrifugation for 5 minutes at 500 � g and washedthree times in FACS buffer. Fluorescein isothiocyanate-conjugated anti-mouse IgG was then added to a finalconcentration of 10 �g/L and incubated with the cells for30 minutes at 4°C. After three washes the cells wereresuspended in 250 �l of FACS buffer and receptorexpression was analyzed using a Becton DickinsonFACScaliber. Data were acquired from 5 � 103 gated
978 Thomas et alAJP March 2003, Vol. 162, No. 3

events for each sample. Fluorescence intensity readingsand the number of cells in each cell population wereexpressed as mean � 1 SD corrected for the mouseserum-negative control in four separate experiments.
Enzymatic Removal of HS GAG Chains
Fibroblasts were grown to subconfluence and incubatedwith a cocktail of 0.3 mU each of heparinase I, II, and IIIas previously described.38 The removal of HS chains wasconfirmed by immunohistochemistry using anti-HS anti-body (10E4). The chains were then used, after heat-denaturation of the enzymes, to treat myofibroblasts at aconcentration equivalent to the same number of fibro-blasts extracted.
Metabolic Labeling of Proteoglycans with[ 35S]-Sulfate
Cells were metabolically labeled with [35S]-sulfate as de-scribed previously39–41 except that the medium wasbased on DMEM/Ham’s F-12.38 Briefly, the cells werewashed three times with PBS and made quiescent bygrowth arrest in 0.2% LH in DMEM/Ham’s F-12 for 48hours. They were then washed with PBS and labeled with50 �Ci/ml of carrier-free [35S]-sulfate in sulfate-freeDMEM supplemented with 0.2% LH for 24 hours. Afterlabeling, the culture medium was collected and cell sur-face proteoglycans were released by limited incubationwith 20 �g/ml of trypsin in PBS on ice for 5 minutes. Theremaining cell layer material was extracted with 4 mol/L ofguanidine-HCl, 4% CHAPS in 50 mmol/L of sodium ace-tate buffer, pH 5.8, containing proteinase inhibitors.
Isolation and Analysis of [ 35S]-HSPG
The labeled extracts were dialyzed with 8 mol/L of ureaand 20 mmol/L of Bis-Tris-HCl buffer, pH 6.0, containing0.1% Triton X-100, and then passed over a 2-ml columnof DEAE-Sephacel equilibrated in the same buffer. Mate-rial of low net charge was removed by washing the col-umn with 5 bed volumes of urea buffer containing 0.3mol/L of NaCl. The 35S-labeled proteoglycans wereeluted from the DEAE with 4 bed volumes of 4 mol/Lof guanidine-HCl buffered with 50 mmol/L of sodiumacetate, pH 6.0, containing 0.5% Triton X-100, 1 mmol/LNa2SO4, and 0.05% Na2N3 (guanidine buffer).
Aliquots of 35S-labeled proteoglycans were precipi-tated with 3 volumes of 1.3% potassium acetate in 95%ethanol in the presence of 50 �g/ml each of heparin andchondroitin sulfate GAGs overnight at 4°C. The pelletswere recovered by centrifugation and dried under nitro-gen. To determine the level of HS GAGs, aliquots of[35S]-proteoglycans were incubated with 125 mU ofchondroitin ABC lyase in 50 mmol/L of Tris-HCl, pH 8.0,containing 50 mmol/L of NaCl at 37°C overnight and theproducts were analyzed using PD-10 columns equili-brated with guanidine buffer. Further aliquots were pre-cipitated and incubated with chondroitin ABC in the pres-
ence of proteinase inhibitors,39 the remaining [35S]-HSPGswere precipitated with ethanol and analyzed on a Sepha-rose CL–4B column (0.006 � 1.5 m) equilibrated in guani-dine buffer. The V0 and Vt were routinely determined using3H-labeled hyaluronan (Mr �2 � 106) and 3H-labeled glu-cosamine, respectively, and were consistent to 2% of therun volume.
Isolation of [ 3H]-Glucosamine-Labeled HS GAGChains
Cells were metabolically labeled with D-[6-3H]-glu-cosamine, 20 �Ci/ml in 0.2% LH in DMEM/Ham’s F-12 for24 hours. The medium was collected and the cell surfaceproteoglycans released with 20 �g/ml of trypsin in PBSon ice for 5 minutes. GAG chains remaining in the celllayer were released by incubation with 100 �g/ml pro-nase in 50 mmol/L of Tris-HCl, pH 8.0, containing 0.1%CHAPS and 0.05% NaN3 at 37°C overnight. The culturemedium and cell surface proteoglycans were dialyzedagainst 50 mmol/L of Tris-HCl, pH 8.0, 0.1% CHAPS and0.05% NaN3 and the GAG chains released by incubationwith pronase (100 �g/ml) at 37°C overnight. To removechondroitin or dermatan sulfate (CS or DS) GAG chains,pronase-digested chains were dialyzed against 50mmol/L of Tris-HCl, pH 8.0, containing 50 mmol/L of NaCland then incubated with 125 mU of chondroitin ABClyase at 37°C overnight. The digests were chromato-graphed on a DEAE column equilibrated with 50 mmol/Lof Tris-HCl buffer, pH 7.0. The column was washed with0.25 mol/L of NaCl and the HS GAGs eluted with 1.5mol/L of NaCl in the same buffer. The HS GAG chainswere buffer-exchanged on PD-10 columns equilibrated in0.2 mol/L of NH4HCO3 and lyophilized. DEAE ion ex-change chromatography followed by PD-10 chromatog-raphy, in addition to isolating the HS GAGs released fromintact proteoglycans also served to remove any small,
Figure 1. Renal fibroblasts (A, C, and E) and myofibroblasts (B, D, and F)were grown to subconfluence and examined after fixation by immunochem-istry for vimentin (A and B), �-SMA (C and D), or desmin (E and F). Originalmagnifications: �250 (A–C, E, F); �400 (D).
Expression of GAGs by Myofibroblasts 979AJP March 2003, Vol. 162, No. 3
low net charge CS and HS GAGs degradation fragmentslocated in the cell layer.
Gel filtration chromatography of labeled GAG chains wasperformed on a Sepharose CL-6B column (0.006 � 1.5 m)equilibrated in 4 mol/L of guanidine-HCl buffered with 50mmol/L of sodium acetate, pH 6.0, containing 0.5% TritonX-100, 1 mmol/L Na2SO4, and 0.05% NaN3. The column V0
and Vt were routinely determined as above and calibratedaccording to the method of Wasteson.42
Mild Alkaline Hydrolysis of GAG Chains
Radiolabeled GAG preparations (100 �l) were incubatedwith 0.5 ml of 1 mol/L NaBH4 in 0.1 mol/L of NaOH at 40°Cfor 24 hours. The reaction was neutralized with glacial
acetic acid and the free GAG chains precipitated byincubation with 3 volumes of 1.3% potassium acetate in95% ethanol in the presence of 50 �g/ml of chondroitinsulfate and 50 �g/ml of heparin at 4°C overnight and thenanalyzed on a Sepharose CL-6B column.
Limited Hydrolysis of HS GAGs withHeparinase 1
Aliquots of 3H-labeled HS GAGs were incubated with 20mU/ml heparinase I in 50 mmol/L of sodium acetatebuffer, pH 7.0, containing 0.5 mmol/L of calcium acetate
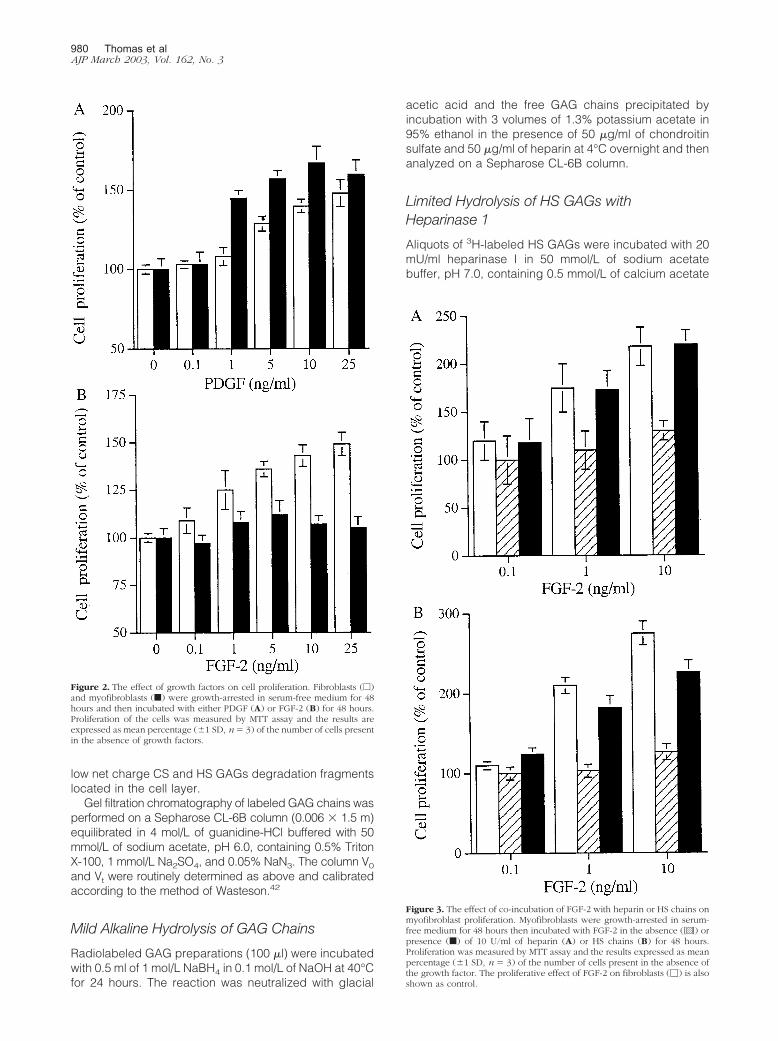
Figure 2. The effect of growth factors on cell proliferation. Fibroblasts (e)and myofibroblasts (f) were growth-arrested in serum-free medium for 48hours and then incubated with either PDGF (A) or FGF-2 (B) for 48 hours.Proliferation of the cells was measured by MTT assay and the results areexpressed as mean percentage (�1 SD, n� 3) of the number of cells presentin the absence of growth factors.
Figure 3. The effect of co-incubation of FGF-2 with heparin or HS chains onmyofibroblast proliferation. Myofibroblasts were growth-arrested in serum-free medium for 48 hours then incubated with FGF-2 in the absence ([ ]) orpresence (f) of 10 U/ml of heparin (A) or HS chains (B) for 48 hours.Proliferation was measured by MTT assay and the results expressed as meanpercentage (�1 SD, n � 3) of the number of cells present in the absence ofthe growth factor. The proliferative effect of FGF-2 on fibroblasts (�) is alsoshown as control.
980 Thomas et alAJP March 2003, Vol. 162, No. 3

at 37°C for 20 hours. The digests were then analyzed onthe Sepharose CL-6B column as before.
Nitrous Acid Hydrolysis
HS chains were depolymerized in ice-cold nitrous acid ac-cording to the methods of Shively and Conrad.43,44 Theproducts were lyophilized, suspended in 200 �l of 0.2 mol/LNH4HCO3, and chromatographed using a BioGel P-10 col-umn (0.006 � 1.5 m) equilibrated with the same buffer.
Disaccharide Analysis Using Strong AnionExchange Chromatography
The HS GAGs were lyophilized twice and incubated with20 mU/ml each of heparinase I, II, and III in 50 mmol/L ofsodium acetate buffer, pH 7.0, containing 0.5 mmol/L ofcalcium acetate at 37°C for 20 hours. The HS digest waspassed over a BioGel P-2 column equilibrated with 0.2mol/L of NH4HCO3. The disaccharide peak was lyophi-lized and then dissolved in acidified water (pH 3.5 withHCl). This was passed over a S5-SAX column (Anachem,Luton, UK) attached to a high pressure liquid chromatog-raphy system and the HS disaccharides eluted with alinear 0 to 0.75 mol/L NaCl gradient in acidified water.45
The radioactivity was determined with an online �-counterand radioactive peaks identified using standard HS disac-charides (Seikagaku, Tokyo, Japan) monitored at A232 nm.
Analysis of the Binding of HS GAGs to FGF-2
The FGF-2 binding assay was based on a modification ofthe procedure of Maccarana and colleagues.46 Briefly100 ng of FGF-2 (R&D Systems, Abington, UK) wasmixed overnight with 3H-labeled HS GAG chains in a totalvolume of 100 �l of 20 mmol/L Tris-HCl, pH 7.4, at 4°C.The mixture was passed through a 0.22-�m pore nitro-cellulose membrane (Sartorious, Gottingen, Germany)under pressure. Reactive sites on the nitrocellulose wereblocked by washing with 1 ml of 1% bovine serum albu-min in 20 mmol/L of Tris-HCl, pH 7.4, containing 0.13mol/L of NaCl. Nonbound material was removed by wash-ing the membranes with 5 � 1-ml aliquots of 20 mmol/LTris-HCl, pH 7.4 containing 0.13 mol/L NaCl. The boundmaterial was then eluted with a stepwise gradient of 0.2 to2 mol/L NaCl in 20 mmol/L Tris-HCl, pH 7.4. The relativebinding was determined as a percentage of the totaleluted radioactivity.
Results
Cell Growth and Morphology
Two distinct populations of fibroblasts with different phe-notypes were isolated and cultured from the original pop-ulation of NRK49F cells. Both cell types stained positivelyfor vimentin (Figure 1, A and B). One population, how-ever, stained poorly for �-SMA (Figure 1C), whereas theother was positive for �-SMA (Figure 1D). Both cell typeswere negative for desmin (Figure 1, E and F). The cellsthat stained positively for �-SMA were therefore consid-ered phenotypically myofibroblastic.
Proliferative Responses to PDGF-BB and FGF-2
Both cell types proliferated in response to PDGF-BB in adose-dependent manner (Figure 2A). In contrast, al-though the fibroblasts proliferated in response to FGF-2,there was no effect of FGF-2 on the myofibroblasts (Fig-ure 2B). We have previously demonstrated that HS GAGsare essential for the interaction of FGF-2 with its receptorson the renal fibroblast. To investigate whether the lack ofmyofibroblast response was because of a defect in thecapacity of FGF-2 to interact with cell surface HS or adefect in receptor signaling, myofibroblasts were incu-bated with FGF-2 in the presence of heparin or HS GAGchains as described previously.38 This has been re-ported to bypass the need for the presence of cell sur-face HS.33,47–49 Both heparin and the HS chains restoredthe proliferative response of the cells to FGF-2 (Figure 3).This suggests that the lack of response was because of adifference in the interaction of cell surface HS GAGs withFGF-2 or its receptor rather than to a defect in the FGFRper se.
FGFR Expression by Fibroblasts andMyofibroblasts
FACS analysis was used to assess whether there weredifferences in the cell-surface expression of the four ma-jor FGFRs between the two cell types. After analysis infour separate experiments there were no significant dif-ferences identified. Both fibroblasts and myofibroblastsexpressed FGFR-1 and FGFR-4 but had only low levels ofFGFR-2 and FGFR-3 expression (Table 1).
Table 1. FACS Analysis of FGFR Expression on Fibroblasts and Myofibroblasts
FGFR subtype
Mean fluorescence intensity,* �101 Cells gated,† %
Fibroblasts Myofibroblasts Fibroblasts Myofibroblasts
FGFR-1 0.98 � 0.27 1.01 � 0.33 69 � 17 78 � 22FGFR-2 0.17 � 0.06 0.22 � 0.05 25 � 21 28 � 11FGFR-3 0.29 � 0.15 0.37 � 0.09 22 � 9 17 � 2FGFR-4 0.88 � 0.31 0.99 � 0.02 66 � 23 59 � 19
The mean fluorescence intensity (*) and the percentage of cells staining positively (†) of cells immunolabeled with each of the FGFR subtypes wascorrected for the negative control in four independent experiments and expressed as the mean � 1 SD.
Expression of GAGs by Myofibroblasts 981AJP March 2003, Vol. 162, No. 3

Incorporation of [ 35S]-Sulfate into GAGs
To investigate potential differences in HS expression be-tween the two cell types we initially examined the profilesof proteoglycan synthesis between fibroblasts and myo-fibroblasts. Cells were growth-arrested and then meta-bolically labeled with [35S]-sulfate. The incorporation of35S into proteoglycans in the culture medium (CM), on thecell surface or in the matrix was determined after sepa-ration on PD-10 columns. Overall the myofibroblasticcells incorporated 1.6-fold more [35S]-sulfate into proteo-glycans (1096 � 201 cpm/104 cells) than the fibroblasts(694 � 260 cpm/104 cells, n � 3). Of the labeled materialincorporated by myofibroblasts, 58% was in the CM, 18%was trypsin-extractable from the cell surface, and 24%remained in the cell layer. In contrast, the fibroblastssecreted 50% into the CM, 28% was cell surface-associ-ated, and 22% was extracted with guanidine from the celllayer.
Next the 35S-labeled proteoglycans from each extractwere isolated by DEAE ion exchange chromatography,precipitated with ethanol, incubated with chondroitinABC lyase with proteinase inhibitors, and then chromato-graphed on a Sepharose CL-4B column. Representativepatterns of the HSPGs after chondroitin ABC lyase diges-tion are shown in Figure 4. The HSPGs of the myofibro-blast cells eluted earlier on the Sepharose column indi-cating that they were slightly larger than those derivedfrom the fibroblasts. In addition the results showed thatmore HSPG was in the medium of the myofibroblast cellsbut in contrast there was less associated with the cellsurface (Figure 4, compare A with B). Analysis of thecell-layer extract HSPGs also indicated an increasedamount of labeled material associated with the myofibro-blast phenotype (Figure 4C). In separate labeling exper-iments 35S-labeled proteoglycans from each extract wereagain isolated by DEAE ion exchange chromatography,the protein cores were digested with pronase and CS/DSGAG chains with chondroitin ABC lyase. The proportion
Table 2. Analysis of the Glycosaminoglycan Chains
HS-GAG35S radioactivity cpm/104 cells, (%)
Fibroblasts Myofibroblasts
Culture medium 65 � 20 (23) 165 � 46 (42)Cell surface 106 � 34 (39) 69 � 12 (18)Cell layer extract 102 � 37 (37) 160 � 24 (40)Total 273 � 90 (100) 394 � 56 (100)
The 35S-labeled proteoglycans were incubated with pronase and thereleased GAG chains precipitated with alcohol and incubated withchondroitin ABC lyase (see Materials and Methods). The HS-GAGswere then determined using Sephadex PD-10 columns. Results aregiven as 35S-radioactivity cpm/104 cells � 1 SD, n � 3. The amount ofGAG as a % of the total in each compartment is also included.
Figure 4. Sepharose CL-4B chromatography of 35S HSPGs. Aliquots of 35S-labeled proteoglycans (normalized to cell number) were incubated withchondroitin ABC lyase overnight. The remaining HSPGs were recovered byalcohol precipitation and chromatographed on a Sepharose CL-4B column.Fibroblasts (E) and myofibroblasts (F): conditioned medium (A), cell sur-face (B), and cell layer extract (C).
982 Thomas et alAJP March 2003, Vol. 162, No. 3
that was HS was determined after separation on PD-10columns. The increased synthesis of proteoglycans bymyofibroblasts was reflected in increased amounts of HSGAG chains isolated (Table 2). Furthermore there was ahigher proportion of the HS GAGs in the medium and inthe cell layer extract of myofibroblasts when compared tofibroblasts. In contrast, the proportion of HS GAGs asso-ciated with the cell surface was higher in the fibroblasts.Together this data suggested that during the metaboliclabeling period there was a greater proportion of shed-ding of HSPGs from the myofibroblast surface.
Analysis of the Cell Surface HS GAG Chains
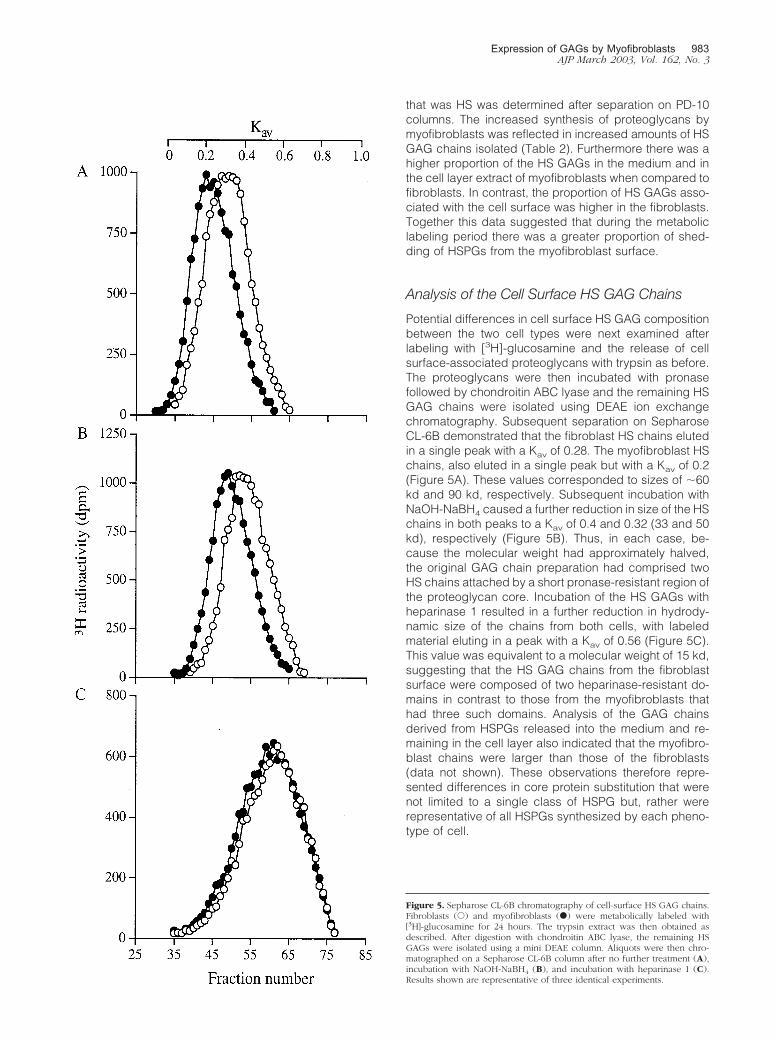
Potential differences in cell surface HS GAG compositionbetween the two cell types were next examined afterlabeling with [3H]-glucosamine and the release of cellsurface-associated proteoglycans with trypsin as before.The proteoglycans were then incubated with pronasefollowed by chondroitin ABC lyase and the remaining HSGAG chains were isolated using DEAE ion exchangechromatography. Subsequent separation on SepharoseCL-6B demonstrated that the fibroblast HS chains elutedin a single peak with a Kav of 0.28. The myofibroblast HSchains, also eluted in a single peak but with a Kav of 0.2(Figure 5A). These values corresponded to sizes of �60kd and 90 kd, respectively. Subsequent incubation withNaOH-NaBH4 caused a further reduction in size of the HSchains in both peaks to a Kav of 0.4 and 0.32 (33 and 50kd), respectively (Figure 5B). Thus, in each case, be-cause the molecular weight had approximately halved,the original GAG chain preparation had comprised twoHS chains attached by a short pronase-resistant region ofthe proteoglycan core. Incubation of the HS GAGs withheparinase 1 resulted in a further reduction in hydrody-namic size of the chains from both cells, with labeledmaterial eluting in a peak with a Kav of 0.56 (Figure 5C).This value was equivalent to a molecular weight of 15 kd,suggesting that the HS GAG chains from the fibroblastsurface were composed of two heparinase-resistant do-mains in contrast to those from the myofibroblasts thathad three such domains. Analysis of the GAG chainsderived from HSPGs released into the medium and re-maining in the cell layer also indicated that the myofibro-blast chains were larger than those of the fibroblasts(data not shown). These observations therefore repre-sented differences in core protein substitution that werenot limited to a single class of HSPG but, rather wererepresentative of all HSPGs synthesized by each pheno-type of cell.
Figure 5. Sepharose CL-6B chromatography of cell-surface HS GAG chains.Fibroblasts (E) and myofibroblasts (F) were metabolically labeled with[3H]-glucosamine for 24 hours. The trypsin extract was then obtained asdescribed. After digestion with chondroitin ABC lyase, the remaining HSGAGs were isolated using a mini DEAE column. Aliquots were then chro-matographed on a Sepharose CL-6B column after no further treatment (A),incubation with NaOH-NaBH4 (B), and incubation with heparinase 1 (C).Results shown are representative of three identical experiments.
Expression of GAGs by Myofibroblasts 983AJP March 2003, Vol. 162, No. 3

Internal Structure of the HS GAGs
To investigate potential differences in the disaccharidecontent of the HS chains they were analyzed, after ex-haustive digestion, with a mixture of heparinase 1, 2, and3, by strong anion exchange chromatography and theresulting peaks were identified by reference to well-char-acterized disaccharide standards. Comparison of the la-beled disaccharides (Table 3) showed that nonsulfated(�di-0S) were the most common disaccharide from bothsources of HS GAG chains. The results of three indepen-dent experiments consistently showed no significant dif-ferences between the composition of the HS GAG chainsobtained from myofibroblasts when compared to thosefrom fibroblasts. Furthermore the disaccharide composi-tion was similar whether derived from the medium, cellsurface, or cell layer.
Nitrous acid digestion of the GAG chains, followed byseparation of the resultant oligosaccharides on a BioGelP-10 column revealed subtle differences in elution profilebetween the cell types. These differences were mostmarked in the chains isolated from the cell medium (Fig-ure 6A), were less so in the chains from the cell surface(Figure 6B), and were least in the cell extract (Figure 6C).Nitrous acid cleaves HS chains at N-sulfated glu-cosamine residues. Low sulfated or nonsulfated regionsare therefore resistant to digestion. The profiles revealeda greater proportion of large oligosaccharide sequenceswith low sulfation in the GAG chains derived from fibro-blasts compared to those from myofibroblasts (markedwith an arrow). They also showed that the percentage oflow sulfated oligosaccharides in the 5 to 7 disaccharidesize range was greater in the myofibroblast GAG prepa-ration, implying more regions of N-sulfation in thesechains.
The HS GAGs were next incubated with heparinase 3and the products analyzed on a BioGel P-10 column.Approximately 65% of the HS chains were digested todisaccharides (Figure 7), confirming the strong ion ex-change analysis results of high levels of unsulfated dis-accharides. The remaining sulfated oligosaccharideswere resolved into a broad peak corresponding to oligo-saccharides of between three and six disaccharide units.The elution profile of the material from culture medium,cell surface, and cell layer extracts derived from myofi-broblasts was identical to those from fibroblasts.
Analysis of HS GAG Binding Affinity for FGF-2
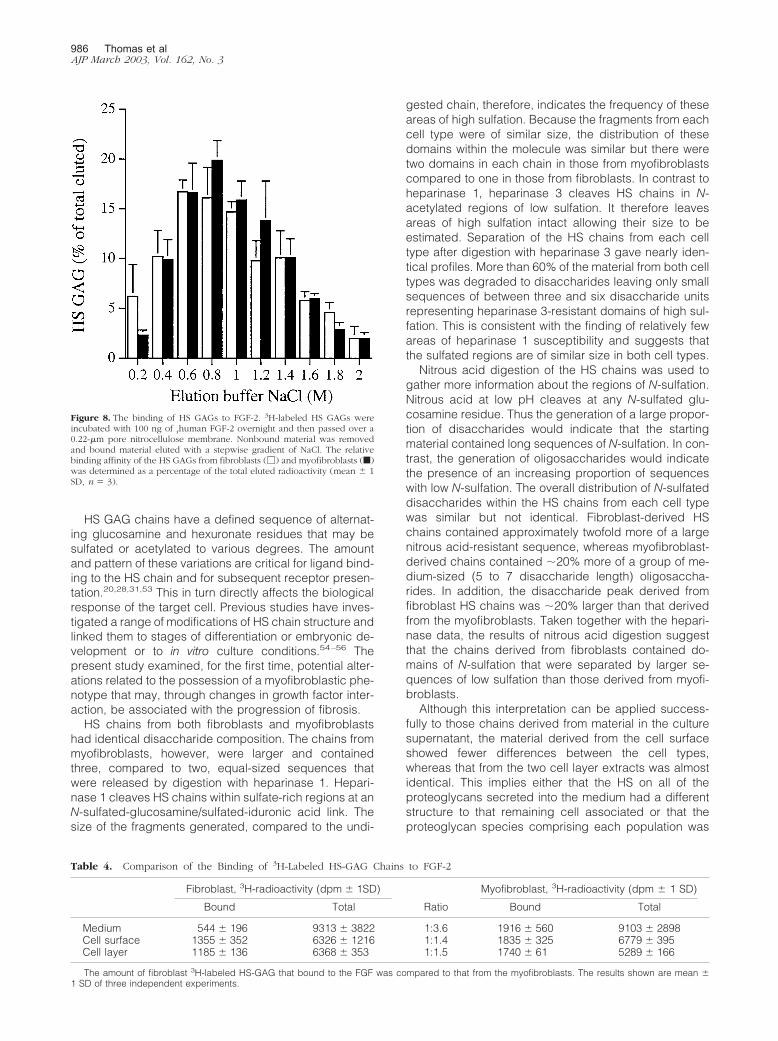
The possibility that the small structural differences iden-tified between the myofibroblast and fibroblast HS chainsreflected differences in their binding and subsequently intheir response to FGF-2 was investigated using an in vitrobinding assay. The majority of the HS chains from bothcell types that bound to the immobilized rFGF-2, elutedwith a NaCl concentration between 0.6 and 1.2 mol/L(Figure 8). Thus the HS GAGs from both cell types had asimilar, albeit relatively weak, affinity for FGF-2, implyingthat the lack of a proliferative response of the myofibro-blasts to FGF-2 was not because of their inability to bindthe growth factor. A consistent finding, however, was thatthe HS chains released to the fibroblast culture mediumbound a smaller absolute amount of FGF-2 than thechains in any other fibroblast or myofibroblast fraction(Table 4). HS chains isolated from the cell surface andfrom cell extracts of myofibroblasts bound 1.5-fold moreFGF-2, consistent with a chain size 50% larger than theHS chains of the fibroblasts. Taking into account thedifferences in chain length between the fibroblast- andmyofibroblast-derived material, HS chains isolated fromthe cell surface and from cell extracts of myofibroblastsshould have had identical binding capacities to those offibroblasts. The chains isolated from the culture mediumof the fibroblasts however, had only 50% of the absolutebinding capacity for FGF-2 as those from the myofibro-blast medium (Table 4) suggesting differences in domainassembly despite similar patterns of sulfation.
DiscussionThe present study demonstrated that renal myofibro-blasts in culture did not proliferate in response to FGF-2,although they retained a proliferative response to PDGF.This lack of response, however, was overcome in thepresence of heparin and HS chains, confirming that thecells possessed the necessary receptors and that incommon with other systems,50–52 heparin can substitutefor endogenous HSPG. Further examination revealed thatthere were several differences in structure between HSchains isolated from the myofibroblasts compared tothose from renal fibroblasts.
Table 3. Analysis of [3H]-Heparan Sulfate Disaccharides by Strong Anion Exchange Chromatography
Disaccharides
3H-Radioactivity in peak (% of total)
Culture medium Cell surface extract Cell layer extract
Fibroblasts Myofibroblasts Fibroblasts Myofibroblasts Fibroblasts Myofibroblasts
�Di-0S 56.6 � 1.5 63.6 � 1.5 62.7 � 1.5 61.3 � 1.5 59.3 � 1.1 63.0 � 5.2�Di-NS 18.0 � 1.7 14.3 � 1.5 17.3 � 1.5 18.3 � 1.2 17.0 � 1.0 17.0 � 2.0�Di-6S 7.0 � 1.0 7.3 � 2.1 6.7 � 1.1 4.3 � 0.6 6.7 � 0.6 4.7 � 1.2�Di-di(6,N)S 4.0 � 1.0 2.7 � 0.6 3.0 � 0.5 2.7 � 0.6 3.7 � 0.6 2.7 � 1.5�Di-di(U,N)S 9.0 � 1.0 7.0 � 0.0 7.3 � 1.5 7.3 � 0.6 8.0 � 1.0 7.0 � 1.0�Di-tri(U,6,N)S 5.3 � 1.5 5.0 � 0.0 3.0 � 1.7 4.3 � 0.6 3.7 � 0.6 5.7 � 0.6
HS GAGs were incubated with a mixture of heparinases to fully degrade the HS to their constituent disaccharides. These were then analyzed usingstrong anion exchange chromatography. The results shown are mean � 1 SD of three independent experiments.
984 Thomas et alAJP March 2003, Vol. 162, No. 3

Figure 6. BioGel P-10 chromatography of nitrous acid-treated HS GAGs.Aliquots of the 3H-labeled HS GAG chains from fibroblasts (E) and myofi-broblasts (F) were alcohol precipitated and incubated with ice-cold nitrousacid. The products were then separated on a BioGel P-10 column equili-brated with 0.2 mol/L of NH4HCO3 (see Materials and Methods). A: Culturemedium; B: cell surface; and C: cell layer extract. The number of disaccha-rides making up each oligosaccharide peak is shown. Results are represen-tative of three identical experiments.
Figure 7. BioGel P-10 chromatography of heparinase 3-digested HS GAGs.Aliquots of the 3H-labeled HS GAGs obtained from fibroblasts (E) andmyofibroblasts (F) were alcohol precipitated and incubated with heparinase3. The products were then separated on a BioGel P-10 column equilibratedwith 0.2 mol/L of NH4HCO3. A: Culture medium; B: cell surface; and C: celllayer extract. Results shown are representative of three identical experiments.
Expression of GAGs by Myofibroblasts 985AJP March 2003, Vol. 162, No. 3
HS GAG chains have a defined sequence of alternat-ing glucosamine and hexuronate residues that may besulfated or acetylated to various degrees. The amountand pattern of these variations are critical for ligand bind-ing to the HS chain and for subsequent receptor presen-tation.20,28,31,53 This in turn directly affects the biologicalresponse of the target cell. Previous studies have inves-tigated a range of modifications of HS chain structure andlinked them to stages of differentiation or embryonic de-velopment or to in vitro culture conditions.54–56 Thepresent study examined, for the first time, potential alter-ations related to the possession of a myofibroblastic phe-notype that may, through changes in growth factor inter-action, be associated with the progression of fibrosis.
HS chains from both fibroblasts and myofibroblastshad identical disaccharide composition. The chains frommyofibroblasts, however, were larger and containedthree, compared to two, equal-sized sequences thatwere released by digestion with heparinase 1. Hepari-nase 1 cleaves HS chains within sulfate-rich regions at anN-sulfated-glucosamine/sulfated-iduronic acid link. Thesize of the fragments generated, compared to the undi-
gested chain, therefore, indicates the frequency of theseareas of high sulfation. Because the fragments from eachcell type were of similar size, the distribution of thesedomains within the molecule was similar but there weretwo domains in each chain in those from myofibroblastscompared to one in those from fibroblasts. In contrast toheparinase 1, heparinase 3 cleaves HS chains in N-acetylated regions of low sulfation. It therefore leavesareas of high sulfation intact allowing their size to beestimated. Separation of the HS chains from each celltype after digestion with heparinase 3 gave nearly iden-tical profiles. More than 60% of the material from both celltypes was degraded to disaccharides leaving only smallsequences of between three and six disaccharide unitsrepresenting heparinase 3-resistant domains of high sul-fation. This is consistent with the finding of relatively fewareas of heparinase 1 susceptibility and suggests thatthe sulfated regions are of similar size in both cell types.
Nitrous acid digestion of the HS chains was used togather more information about the regions of N-sulfation.Nitrous acid at low pH cleaves at any N-sulfated glu-cosamine residue. Thus the generation of a large propor-tion of disaccharides would indicate that the startingmaterial contained long sequences of N-sulfation. In con-trast, the generation of oligosaccharides would indicatethe presence of an increasing proportion of sequenceswith low N-sulfation. The overall distribution of N-sulfateddisaccharides within the HS chains from each cell typewas similar but not identical. Fibroblast-derived HSchains contained approximately twofold more of a largenitrous acid-resistant sequence, whereas myofibroblast-derived chains contained �20% more of a group of me-dium-sized (5 to 7 disaccharide length) oligosaccha-rides. In addition, the disaccharide peak derived fromfibroblast HS chains was �20% larger than that derivedfrom the myofibroblasts. Taken together with the hepari-nase data, the results of nitrous acid digestion suggestthat the chains derived from fibroblasts contained do-mains of N-sulfation that were separated by larger se-quences of low sulfation than those derived from myofi-broblasts.
Although this interpretation can be applied success-fully to those chains derived from material in the culturesupernatant, the material derived from the cell surfaceshowed fewer differences between the cell types,whereas that from the two cell layer extracts was almostidentical. This implies either that the HS on all of theproteoglycans secreted into the medium had a differentstructure to that remaining cell associated or that theproteoglycan species comprising each population was
Figure 8. The binding of HS GAGs to FGF-2. 3H-labeled HS GAGs wereincubated with 100 ng of rhuman FGF-2 overnight and then passed over a0.22-�m pore nitrocellulose membrane. Nonbound material was removedand bound material eluted with a stepwise gradient of NaCl. The relativebinding affinity of the HS GAGs from fibroblasts (�) and myofibroblasts (f)was determined as a percentage of the total eluted radioactivity (mean � 1SD, n � 3).
Table 4. Comparison of the Binding of 3H-Labeled HS-GAG Chains to FGF-2
Fibroblast, 3H-radioactivity (dpm � 1SD) Myofibroblast, 3H-radioactivity (dpm � 1 SD)
Bound Total Ratio Bound Total
Medium 544 � 196 9313 � 3822 1:3.6 1916 � 560 9103 � 2898Cell surface 1355 � 352 6326 � 1216 1:1.4 1835 � 325 6779 � 395Cell layer 1185 � 136 6368 � 353 1:1.5 1740 � 61 5289 � 166
The amount of fibroblast 3H-labeled HS-GAG that bound to the FGF was compared to that from the myofibroblasts. The results shown are mean �1 SD of three independent experiments.
986 Thomas et alAJP March 2003, Vol. 162, No. 3

different in the two locations. This latter explanation mayimply a switch in core protein expression profile. Figure 4,however, showing the intact HSPG profile of the cells,demonstrates that the elution patterns of HSPG in themedium, from the cell surface or cell and matrix associ-ated are very similar between the cell types. This sug-gests that the HSPG composition in each compartment issimilar. Again it is clear that in the medium and associ-ated with cell layer there is more HSPG expressed bymyofibroblasts while on the cell surface there is morefrom fibroblasts, as also shown in Table 2. Although thissupports the idea of differential shedding of similar HSPGpopulations, the possibility that there was a selectiverelease of molecules possessing the altered HS structurecannot be ruled out. The detailed core protein expressionof the syndecans, glypicans, and perlecan will, therefore,be investigated in more detail.
Most modifications to HS structure occur in or adjacentto domains of N-sulfation, resulting in highly sulfated se-quences separated by nonsulfated or low-sulfated do-mains. The specific sequences that interact with FGF-2have been well documented and those with highest af-finity consist of alternating sulfated glucosamine with 2-O-sulfated glucuronic and iduronic acids. These sequencescontain a heparinase 1 cleavage site and thus our resultssuggest that, although the HS GAG chains from the me-dium of myofibroblasts had a similar affinity for FGF-2,they had twice the FGF-2 binding capacity of the fibro-blast HS GAG chains. Whether this is linked to the lack ofresponse of the myofibroblasts to FGF-2 is currently un-der investigation.
Another HS-dependent event involved in FGF-2 signal-ing is presentation to the receptor. FGF-2 and other mem-bers of the FGF family bind to cell surface receptors(FGFR) encoded by four separate alternatively splicedgenes.57,58 The isoforms of the FGFR that are expressedvary in their ligand-binding properties and in the structureof their kinase domains.18,58,59 They all contain a posi-tively charged region in their extracellular domain, how-ever, that binds to HS.60 Nevertheless, in view of thecomplexity of isoform expression, there may be morethan one receptor activation mechanism.61 In addition,the type of cell surface HSPG involved in FGF-2 bindingalso affects activation. For example, syndecans 1, 2, and4, and glypican, when co-expressed with FGFR-1 in K562cells, potentiate FGF-2 activity.30 The soluble ectodo-mains of these HSPG, purified from lung fibroblasts, how-ever, are inhibitory.27 It has also been suggested thatvariations in syndecan expression alone do not explaindifferences in FGF-FGFR complex formation but differ-ences in HS GAG structure are more important.62 Thusthe location of the HS sequences that bind to the FGFR,together with steric constraints may strongly influence theFGF-2 to FGFR interaction. For these reasons, we ana-lyzed the expression of FGFR on the fibroblasts andmyofibroblasts and found no significant differences. Inboth cell types FGFR-1 and FGFR-4 were the major re-ceptors expressed, with the expression of FGFR-2 andFGFR-3 being very low. We have not yet examined thepotential expression of alternatively spliced variants totake this further. These results, taken together, however,
with the observations that both HS chains derived fromfibroblasts and heparin can restore FGF-2 reactivity tomyofibroblasts suggest that it is an HS-dependent bind-ing interaction, rather than receptor activation that is thedifference between the cell types. Whether this is a HS/FGF-2 or a HS/FGFR interaction or a combination of bothis currently under investigation. Furthermore, for at leastone cell surface HSPG (glypican) both inhibitory andactivating properties of its HS chains have been de-scribed. In keratinocytes, glypican strongly inhibited themitogenic response to keratinocyte growth factor but en-hanced the response to FGF-1.37,63 It will also be impor-tant, therefore, to examine which cell surface HSPGs areexpressed on each cell type and what proportion of eachhas been released to the medium.
The results of the present study demonstrate a differ-ence between fibroblasts and myofibroblasts that mayreflect the different functions of the two cell types. Thus,although a response of resident tissue fibroblasts toFGF-2 may initiate a fibrotic change, myofibroblasts inareas of fibrosis, although unresponsive to FGF-2, mayelaborate a different response repertoire. We are, there-fore, currently examining whether there is also a differ-ence between the cells in terms of other selected HSinteractions, such as that with fibronectin.64–66 Thepresent study together with our future investigations mayreveal important mechanisms underlying the progressionof fibrosis. This, in turn, will increase our understanding ofthe control of cell function in fibrotic disease.
References
1. Badid C, Mounier N, Costa AM, Desmouliere A: Role of myofibroblastsduring normal tissue repair and excessive scarring: interest of theirassessment in nephropathies. Histol Histopathol 2000, 15:269–280
2. Badid C, Vincent M, Fouque D, Laville M, Desmouliere A:Myofibroblast: a prognostic marker and target cell in progressiverenal disease. Ren Fail 2001, 23:543–549
3. Desmouliere A: Factors influencing myofibroblast differentiation dur-ing wound healing and fibrosis. Cell Biol Int 1995, 19:471–476
4. Desmouliere A, Gabbiani G: Myofibroblast differentiation during fibro-sis. Exp Nephrol 1995, 3:134–139
5. Desmouliere A, Tuchweber B, Gabbiani G: Role of the myofibroblastdifferentiation during liver fibrosis. J Hepatol 1995, 22:61–64
6. Phan SH, Zhang K, Zhang HY, Gharaee-Kermani M: The myofibro-blast as an inflammatory cell in pulmonary fibrosis. Curr Top Pathol1999, 93:173–182
7. Vaquero E, Molero X, Tian X, Salas A, Malagelada JR: Myofibroblastproliferation, fibrosis, and defective pancreatic repair induced bycyclosporin in rats. Gut 1999, 45:269–277
8. Clayton A, Steadman R, Williams JD: Cells isolated from the humancortical interstitium resemble myofibroblasts and bind neutrophils inan ICAM-1-dependent manner. J Am Soc Nephrol 1997, 8:604–615
9. Clayton A, Steadman R: ICAM-1 interactions in the renal interstitium:a novel activator of fibroblasts during nephritis. Histol Histopathol1999, 14:861–870
10. Muller GA, Rodemann HP: Characterization of human renal fibroblasts inhealth and disease: I. Immunophenotyping of cultured tubular epithelialcells and fibroblasts derived from kidneys with histologically proveninterstitial fibrosis. Am J Kidney Dis 1991, 17:680–683
11. Rodemann HP, Muller GA: Characterization of human renal fibro-blasts in health and disease: II. In vitro growth, differentiation, andcollagen synthesis of fibroblasts from kidneys with interstitial fibrosis.Am J Kidney Dis 1991, 17:684–686
12. Fine LG, Ong AC, Norman JT: Mechanisms of tubulo-interstitial injuryin progressive renal diseases. Eur J Clin Invest 1993, 23:259–265
Expression of GAGs by Myofibroblasts 987AJP March 2003, Vol. 162, No. 3

13. Eddy AA: Experimental insights into the tubulointerstitial disease ac-companying primary glomerular lesions. J Am Soc Nephrol 1994,5:1273–1287
14. Lewis MP, Fine LG, Norman JT: Pexicrine effects of basement mem-brane components on paracrine signaling by renal tubular cells.Kidney Int 1996, 49:48–58
15. Goumenos DS, Brown CB, Shortland J, el Nahas AM: Myofibroblasts,predictors of progression of mesangial IgA nephropathy? NephrolDial Transplant 1994, 9:1418–1425
16. Zhang G, Moorhead PJ, el Nahas AM: Myofibroblasts and the pro-gression of experimental glomerulonephritis. Exp Nephrol 1995,3:308–318
17. Norman JT, Fine LG: Progressive renal disease: fibroblasts, extracel-lular matrix, and integrins. Exp Nephrol 1999, 7:167–177
18. Coutts JC, Gallagher JT: Receptors for fibroblast growth factors.Immunol Cell Biol 1995, 73:584–589
19. Gallagher JT: Heparan sulphate and protein recognition. Bindingspecificities and activation mechanisms. Adv Exp Med Biol 1995,376:125–134
20. Gallagher JT: Structure-activity relationship of heparin sulphate. Bio-chem Soc Trans 1997, 25:1206–1209
21. Hildebrand A, Romaris M, Rasmussen LM, Heinegard D, TwardzikDR, Border WA, Ruoslahti E: Interaction of the small interstitial pro-teoglycans biglycan, decorin and fibromodulin with transforminggrowth factor beta. Biochem J 1994, 302:527–534
22. Humes HD, Nakamura T, Cieslinski DA, Miller D, Emmons RV, BorderWA: Role of proteoglycans and cytoskeleton in the effects of TGF-beta 1 on renal proximal tubule cells. Kidney Int 1993, 43:575–584
23. Lyon M, Gallagher JT: Hepatocyte growth factor/scatter factor: aheparan sulphate-binding pleiotropic growth factor. Biochem SocTrans 1994, 22:365–370
24. Lyon M, Rushton G, Gallagher JT: The interaction of the transforminggrowth factor-betas with heparin/heparan sulfate is isoform-specific.J Biol Chem 1997, 272:18000–18006
25. Lyon M, Deakin JA, Rahmoune H, Fernig DG, Nakamura T, GallagherJT: Hepatocyte growth factor/scatter factor binds with high affinity todermatan sulfate. J Biol Chem 1998, 273:271–278
26. Lyon M, Gallagher JT: Bio-specific sequences and domains in hepa-ran sulphate and the regulation of cell growth and adhesion. MatrixBiol 1998, 17:485–493
27. Aviezer D, Levy E, Safrant M, Svahn C, Buddecke E, Schmidt A,David G, Vlodavsky I, Yayon A: Differential structural requirements ofheparin and heparan sulfate proteoglycans that promote binding ofbasic fibroblast growth factor to its receptor. J Biol Chem 1994,269:114–121
28. Fernig DG, Gallagher JT: Fibroblast growth factors and theirreceptors: an information network controlling tissue growth, morpho-genesis and repair. Prog Growth Factor Res 1994, 5:353–377
29. Gallagher JT: Heparan sulphates as membrane receptors for thefibroblast growth factors. Eur J Clin Chem Clin Biochem 1994, 32:239–247
30. Steinfeld R, Van Den Berghe H, David G: Stimulation of fibroblastgrowth factor receptor-1 occupancy and signaling by cell surface-associated syndecans and glypican. J Cell Biol 1996, 133:405–416
31. Jayson GC, Vives C, Paraskeva C, Schofield K, Coutts J, FleetwoodA, Gallagher JT: Coordinated modulation of the fibroblast growthfactor dual receptor mechanism during transformation from humancolon adenoma to carcinoma. Int J Cancer 1999, 82:298–304
32. Guimond SE, Turnbull JE: Fibroblast growth factor receptor signallingis dictated by specific heparan sulphate saccharides. Curr Biol 1999,9:1343–1346
33. Rapraeger A, Krufla A, Olwin BB: Requirement of heparin sulfate forbFGF-mediated fibroblast growth and myoblast differentiation. Sci-ence 1991, 252:1705–1708
34. Bernfield M, Kokenyesi R, Kato M, Spring MT, Gallo J, Lose E: Biologyof the syndecans: a family of transmembrane heparan sulphate pro-teoglycans. Annu Rev Cell Biol 1992, 8:365–393
35. Abboud HE: Growth factors in glomerulonephritis. Kidney Int 1993,43:252–257
36. Kim CW, Goldberger OA, Gallo RL, Bernfield M: Members of thesyndecan family of heparan sulfate proteoglycans are expressed indistinct cell-, tissue-, and development-specific patterns. Mol BiolCell 1994, 5:797–805
37. Bonneh-Barkay D, Shlissel M, Berman B, Shaoul E, Admon A, Vlo-
davsky I, Carey DJ, Asundi VK, Reich-Slotky R, Ron D: Identificationof glypican as a dual modulator of the biological activity of fibroblastgrowth factors. J Biol Chem 1997, 272:12415–12421
38. Clayton A, Thomas J, Thomas GJ, Davies M, Steadman R: Cellsurface heparan sulfate proteoglycans control the response of renalinterstitial fibroblasts to fibroblast growth factor-2. Kidney Int 2001,59:2084–2094
39. Thomas GJ, Jenner L, Mason RM, Davies M: Human glomerularepithelial cell proteoglycans. Arch Biochem Biophys 1990, 278:11–20
40. Thomas GJ, Bayliss MT, Harper K, Mason RM, Davies M: Glomerularmesangial cells in vitro synthesize an aggregating proteoglycan im-munologically related to versican. Biochem J 1994, 302:49–56
41. Thomas GJ, Shewring L, McCarthy KJ, Couchman JR, Mason RM,Davies M: Rat mesangial cells in vitro synthesize a spectrum ofproteoglycan species including those of the basement membraneand interstitium. Kidney Int 1995, 48:1278–1289
42. Wasteson A: A method for the determination of the molecular weightand molecular-weight distribution of chondroitin sulphate. J Chro-matogr 1971, 59:87–97
43. Shively JE, Conrad HE: Formation of anhydrosugars in the chemicaldepolymerization of heparin. Biochemistry 1976, 15:3932–3942
44. Shively JE, Conrad HE: Nearest neighbor analysis of heparin: identi-fication and quantitation of the products formed by selective depoly-merization procedures. Biochemistry 1976, 15:3943–3950
45. Lyon M, Deakin JA, Gallagher JT: Liver heparan sulfate structure. Anovel molecular design. J Biol Chem 1994, 269:11208–11215
46. Maccarana M, Casu B, Lindahl U: Minimal sequence in heparin/heparan sulfate required for binding of basic fibroblast growth factor[published erratum appears in J Biol Chem 1994 Feb 4;269(5):3903].J Biol Chem 1993, 268:23898–23905
47. Guimond S, Maccarana M, Olwin BB, Lindahl U, Rapraeger AC:Activating and inhibitory heparin sequences for FGF-2 (basic FGF).Distinct requirements for FGF-1, FGF-2, and FGF-4. J Biol Chem1993, 268:23906–23914
48. Walker A, Turnbull JE, Gallagher JT: Specific heparan sulfate sac-charides mediate the activity of basic fibroblast growth factor. J BiolChem 1994, 269:931–935
49. Ishihara M: Function and structure of heparan sulfate—modificationof FGF activities. Tanpakushitsu Kakusan Koso 1995, 40:1122–1133
50. Herr AB, Ornitz DM, Sasisekharan R, Venkataraman G, Waksman G:Heparin-induced self-association of fibroblast growth factor-2. Evi-dence for two oligomerization processes. J Biol Chem 1997, 272:16382–16389
51. Moy FJ, Safran M, Seddon AP, Kitchen D, Bohlen P, Aviezer D, YayonA, Powers R: Properly oriented heparin-decasaccharide-induceddimers are the biologically active form of basic fibroblast growthfactor. Biochemistry 1997, 36:4782–4791
52. DiGabriele AD, Lax I, Chen DI, Svahn CM, Jaye M, Schlessinger J,Hendrickson WA: Structure of a heparin-linked biologically activedimer of fibroblast growth factor. Nature 1998, 393:812–817
53. Gallagher JT: Heparan sulfate: growth control with a restricted se-quence menu. J Clin Invest 2001, 108:357–361
54. Brickman YG, Ford MD, Small DH, Bartlett PF, Nurcombe V: Heparansulfates mediate the binding of basic fibroblast growth factor to aspecific receptor on neural precursor cells. J Biol Chem 1995, 270:24941–24948
55. Brickman YG, Ford MD, Gallagher JT, Nurcombe V, Bartlett PF,Turnbull JE: Structural modification of fibroblast growth factor-bindingheparan sulfate at a determinative stage of neural development.J Biol Chem 1998, 273:4350–4359
56. Brickman YG, Nurcombe V, Ford MD, Gallagher JT, Bartlett PF,Turnbull JE: Structural comparison of fibroblast growth factor-specificheparan sulfates derived from a growing or differentiating neuroepi-thelial cell line. Glycobiology 1998, 8:463–471
57. Green PJ, Walsh FS, Doherty P: Promiscuity of fibroblast growthfactor receptors. Bioessays 1996, 18:639–646
58. Klint P, Claesson-Welsh L: Signal transduction by fibroblast growthfactor receptors. Front Biosci 1999, 4:D165–D177
59. Szebenyi G, Fallon JF: Fibroblast growth factors as multifunctionalsignaling factors. Int Rev Cytol 1999, 185:45–106
60. Kan M, Wang F, To B, Gabriel JL, McKeehan WL: Divalent cationsand heparin/heparan sulfate cooperate to control assembly and ac-tivity of the fibroblast growth factor receptor complex. J Biol Chem1996, 271:26143–26148
988 Thomas et alAJP March 2003, Vol. 162, No. 3

61. Krufka A, Guimond S, Rapraeger AC: Two hierarchies of FGF-2signaling in heparin: mitogenic stimulation and high-affinity binding/receptor transphosphorylation. Biochemistry 1996, 35:11131–11141
62. Mundhenke C, Meyer K, Drew S, Friedl A: Heparan sulfate proteo-glycans as regulators of fibroblast growth factor-2 receptor binding inbreast carcinomas. Am J Pathol 2002, 160:185–194
63. Berman B, Ostrovsky O, Shlissel M, Lang T, Regan D, Vlodavsky I,Ishai-Michaeli R, Ron D: Similarities and differences between theeffects of heparin and glypican-1 on the bioactivity of acidic fibroblast
growth factor and the keratinocyte growth factor. J Biol Chem 1999,274:36132–36138
64. Couchman JR, Woods A: Syndecans, signaling, and cell adhesion.J Cell Biochem 1996, 61:578–584
65. Woods A, Longley RL, Tumova S, Couchman JR: Syndecan-4 binding tothe high affinity heparin-binding domain of fibronectin drives focal ad-hesion formation in fibroblasts. Arch Biochem Biophys 2000, 374:66–72
66. Couchman JR, Chen L, Woods A: Syndecans and cell adhesion. IntRev Cytol 2001, 207:113–150
Expression of GAGs by Myofibroblasts 989AJP March 2003, Vol. 162, No. 3