Stroop Performance in Normal Control Subjects: An fMRI Study S.A. Gruber, J. Rogowska, P. Holcomb,...
31
Stroop Performance in Normal Control Subjects: An fMRI Study S.A. Gruber, J. Rogowska, P. Holcomb, S. Soraci, and D. Yurgelun- Todd
-
date post
18-Dec-2015 -
Category
Documents
-
view
213 -
download
0
Transcript of Stroop Performance in Normal Control Subjects: An fMRI Study S.A. Gruber, J. Rogowska, P. Holcomb,...
Stroop Performance in Normal Control Subjects: An fMRI Study
S.A. Gruber, J. Rogowska, P. Holcomb,
S. Soraci, and D. Yurgelun-Todd

Roadmap for today….
• Purpose
• Hypotheses
• Method
• Results
• Conclusion
• Limitations

Purpose
• To better characterize the changes in cortical signal intensity that occur in the ACC during performance on the Stroop-Color Word task
• Specific regions of ACC: VOA and AAA (Vogt et al., 1992)

The ACC
• Tiny nerve bundle tucked between the cerebral hemispheres
• associated with attentional control
• possibly detects occurrence of processing conflicts
• a region involved in evaluatory processes at the level of response (e.g., detecting potential for error)


The Stroop Colour-Word Task
• Requires the inhibition of an overlearned response (word reading) in favour of a less automatic behaviour (colour naming)
• Model for the examination of conflict resolution and regulation of impulse control (Matochik et al., 1996)Red Green Blue Green Red Blue Blue Green Red Green
Differences from previous studies
• Using fMRI instead of PET
• Looking at specific regions of ACC, rather than considering ACC as one large region
• Ss examined individually using ROI localization technique
• Vocalization of responses instead of button press
Hypotheses
• Significant changes in signal intensity from baseline states will occur in the ACC during the interference subtest
• increased signal intensity in the AAA and VOA subdivisions of ACC will be correlated with task performance
Method: Participants
• 12 healthy adults (10)
• 4 males, 6 females
• Age: 23.5 (+\-) 3.93
• 9R, 1L

Conventional Image Acquisition
• 1.5T MRI
• Sagittal localizer images
• 2 MR protocols:
– double-echo spin echo (SE)
– 3-D Fourier-transform (3-DFT)
• SE
– 108, 3-mm coronal slices of whole brain
• 3-DFT SPGR
– 124, 1.5-mm coronal slices of whole brain

Regions of Interest
• Left and right ACC (Brodmann’s area 24 and 25)• ACC divided bilaterally into:
– vocalization area (VOA)-area immediately anterior to the genu of the corpus callosum
– attention to action area (AAA)- posterior to VOA; area superior to the anterior corpus callosum (Vogt et al., 1992)
• ROIs were selected a priori and outlined in each S’s MR image
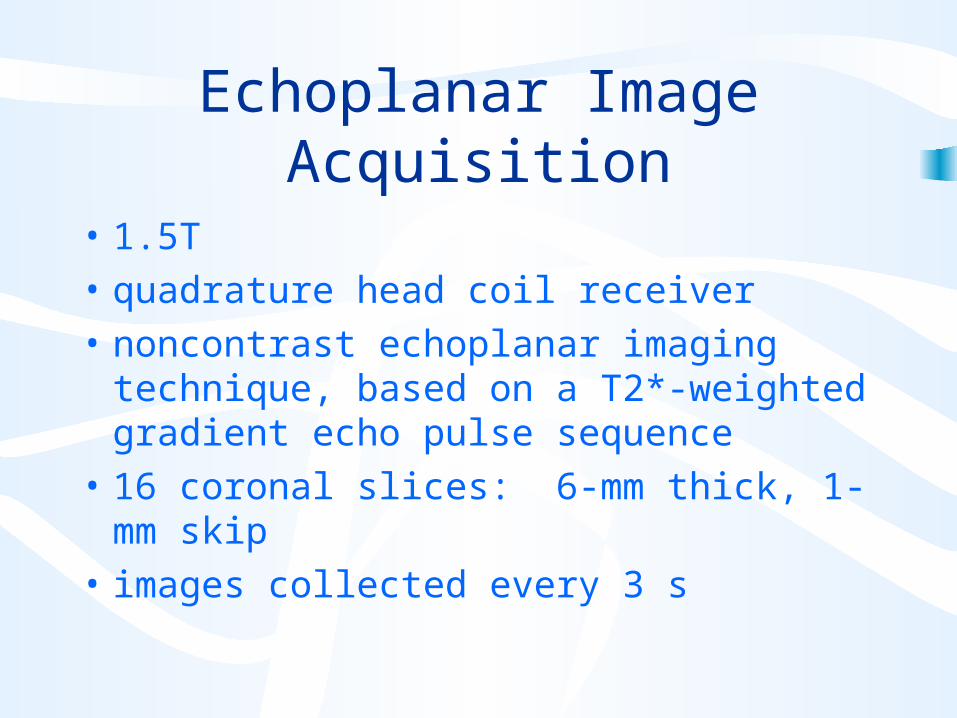
Echoplanar Image Acquisition
• 1.5T
• quadrature head coil receiver
• noncontrast echoplanar imaging technique, based on a T2*-weighted gradient echo pulse sequence
• 16 coronal slices: 6-mm thick, 1-mm skip
• images collected every 3 s

Block Design
The Scanning Run
-compare [task+rest] with [rest] to see the effect of task-one session with three runs-each run had 5 epochs: 3 rest sessions alternating with 2 challenge sessions-each run consisted of two trials of only one of the subtests
30 s Rest
“off”
Task“on”
30 s
30 sRest
Task“on”
30 sRest

Run 1: Colour Naming
-report colour of randomly sequenced colour blocks printed in red, blue, and green ink-Involves: discrimination and naming of colours, attention and verbal response
30 s Rest
“off”
ColourNaming
30 s
30 sRest
Colournaming
30 sRest
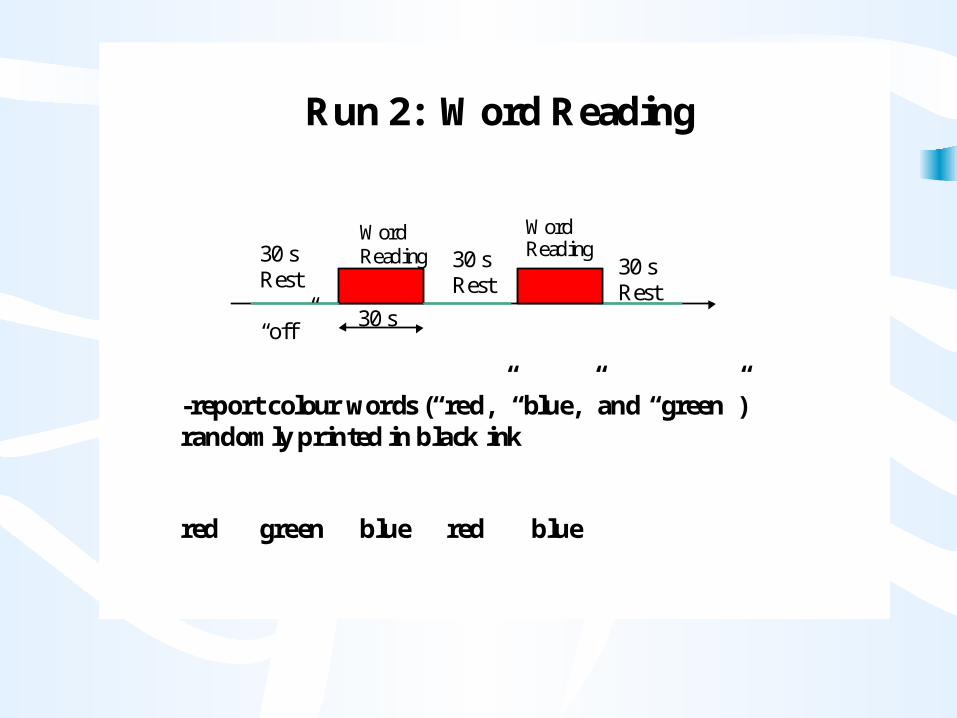
Run 2: Word Reading
-report colour words (“red,” “blue,” and “green”) randomly printed in black ink
red green blue red blue
30 s Rest
“off”
WordReading
30 s
30 sRest
WordReading
30 sRest

Run 3: Interference
-presented with words from the Word Reading task (“red,” “blue,” “green”) in incongruent ink colour. -Asked to identify the ink colour
red blue green red blue green
30 s Rest
“off”
TASK
30 s
30 sRest
TASK30 sRest

Activation Phases
ColourNaming
WordReading
Interference
Duration 30 seconds 30 seconds 30 seconds
Lines ofstimuli
10 10 6
No. oftargets
6 (2500 ms)500 msinterval
6 (2500 ms)500 msinterval
6 (4500 ms)500 msinterval

Results
• Data collected from 12 Ss but only 10 in analysis
• Data analyzed for each ROI
• Mean percent change (MPC) in signal intensity from baseline
• MPC calculated separately for AAA and VOA on the left and right for each task

Intensity change within each run
leftVOA
rightVOA
leftAAA
rightAAA
ColourNaming
ns ns ns ns
WordReading
ns ns ns ns
Interfe-rence
P < .10 t(9) =2.39*
t(9) =2.63 *
t(9) =3.02*
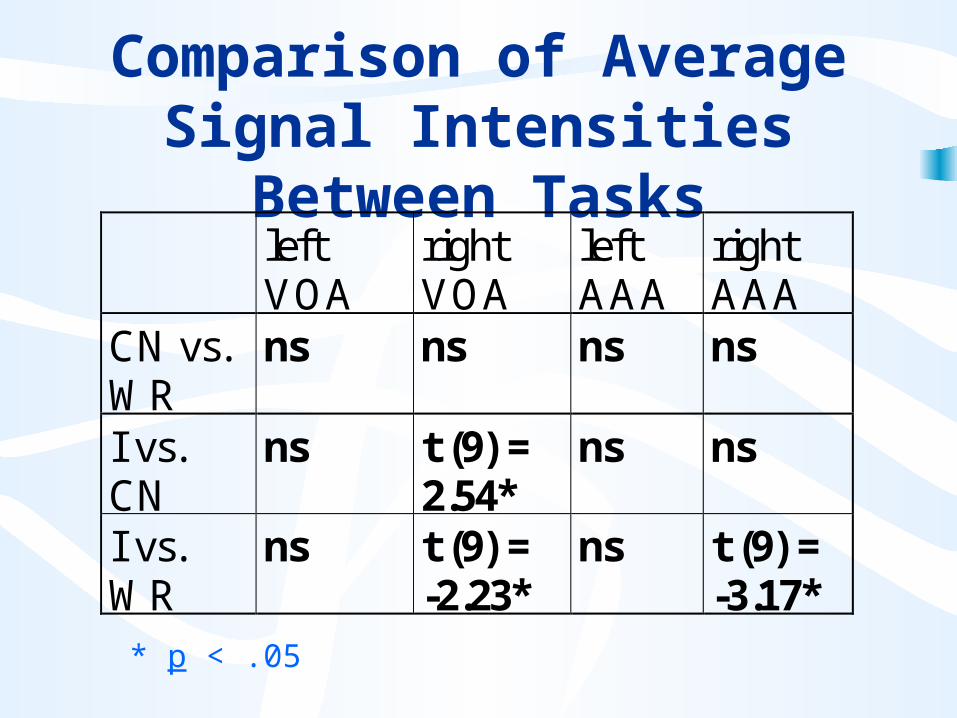
Comparison of Average Signal Intensities Between Tasks
leftVOA
rightVOA
leftAAA
rightAAA
CN vs.WR
ns ns ns ns
I vs.CN
ns t (9) =2.54*
ns ns
I vs.WR
ns t (9) =-2.23*
ns t (9) =-3.17*
* p < .05
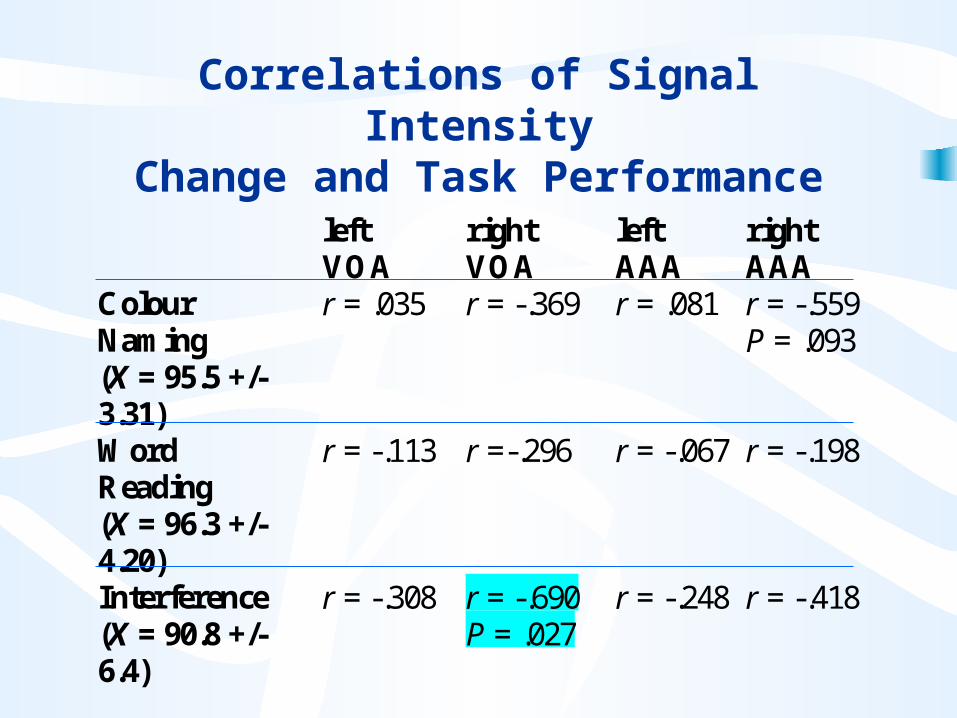
Correlations of Signal IntensityChange and Task Performance
leftVOA
rightVOA
leftAAA
rightAAA
ColourNaming(X = 95.5 +/-3.31)
r = .035 r = -.369 r = .081 r = -.559P = .093
WordReading(X = 96.3 +/-4.20)
r = -.113 r =-.296 r = -.067 r = -.198
Interference(X = 90.8 +/-6.4)
r = -.308 r = -.690P = .027
r = -.248 r = -.418

Discussion
• On the I subtest, significant changes in signal intensity occur in both regions of the ACC compared to baseline
• This signal intensity change was only significant in the rVOA after controlling for the signal change in CN
• Only the signal intensity within the rVOA correlated w/ task performance
• The cognitive demands associated with this interference task appear to be associated with the rVOA
• Task performance on I was significantly inversely related to signal intensity change within the rVOA only

Conclusions
• ACC is activated in response to competing demands produced during the I condition of the Stroop test
• ACC is responsible for the organization and integration of cognitive functions that involve attentional subsystems
• In healthy adults, the VOA is specifically associated with processing in the I subtest
• Only the right VOA demonstrated a significant difference in signal intensity change between the colour naming and interference conditions
• Suggests that inhibition of responses is associated with the VOA region

Limitations
• Small sample size (only 10 Ss)
• The design (e.g., including interference task twice in the same run)
• Vocalization and motion artifact
• What do the changes in signal intensity really represent??
Other ways of approaching this question??
• Different task
• Different design

The Block Design
• Assumption: neural structures underlying cognitive and behavioural processes combine in a simple additive manner
• Signal increases with repeated stimulation due to overlap of “on” and “off” conditions
• produces large signal change and thus, high statistical power
• Potential problems:– a new cognitive component can be purely inserted without affecting the
expression of previous ones BUT processes may combine in a nonadditive/interactive fashion
– can be confounded by sensitization, habituation, practice effects, inter-stimulus interaction, and predictability

Event-Related Design
• Detection of brain’s response to multiple presentations of brief stimuli (few msec to few sec)
• Better temporal information regarding response to individual trials and minimization of stimulus predictability
• Analysis can be restricted to post-hoc categorization of responses
• May not yield sufficient signal to noise in all paradigms
• Loss of statistical power
• ER design is preferred for estimation of Hemodynamic Response (HDR) function, block design is preferred for detection of activation (Liu et al., 2001)
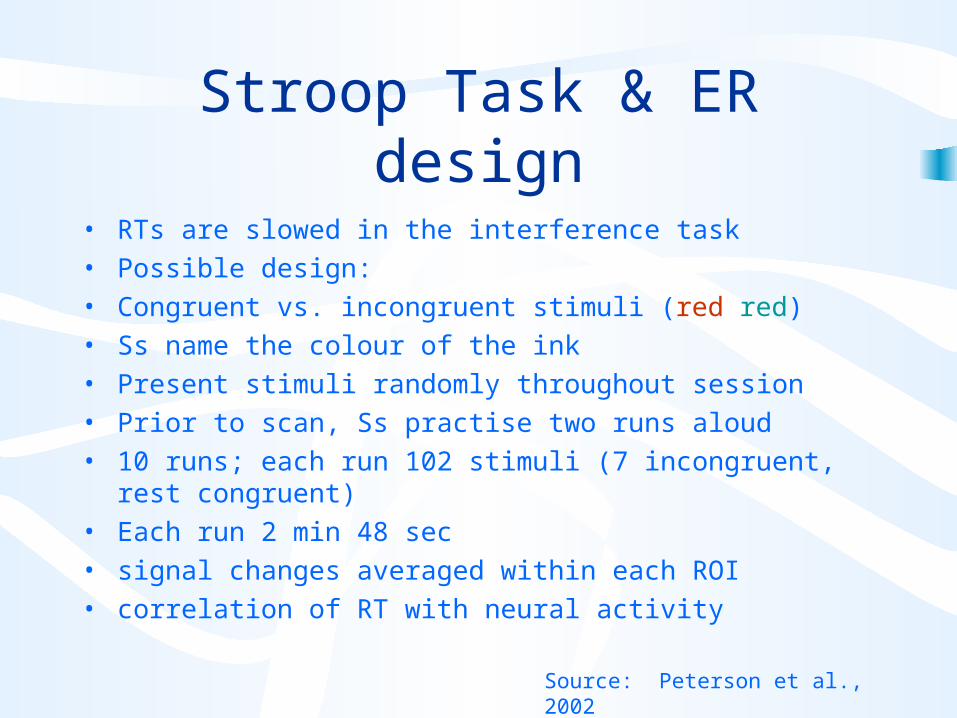
Stroop Task & ER design
• RTs are slowed in the interference task
• Possible design:
• Congruent vs. incongruent stimuli (red red)
• Ss name the colour of the ink
• Present stimuli randomly throughout session
• Prior to scan, Ss practise two runs aloud
• 10 runs; each run 102 stimuli (7 incongruent, rest congruent)
• Each run 2 min 48 sec
• signal changes averaged within each ROI
• correlation of RT with neural activity
Source: Peterson et al., 2002

Block vs. ER Design
30 s Rest
“off”
TASK
30 s
30 sRest
TASK30 sRest
R G B R R G B G R G B R
R G B B R R G R B R G G R B G
Time (ms)
RT
Advantages of Event-Related Designs
• Randomized ER design may resolve activation induced by individual cognitive events, that are lumped together during block design experiments
• Opportunity to randomly intermix events of different types because response to one event is not systematically influenced by prior events, nor confounded by differences in the S’s cognitive state
• Treating stimuli as distinct events provides a potentially more accurate model
• ER design might be necessary for studies that have to minimize habituation and expectation effects and for studies that are addressing these factors
» Source: Henson 2000
Summary
• Current study was first to examine changes in signal intensity within specific subregions of ACC with respect to modified Stroop Task performance
• Results are consistent with previous studies reporting increased activity in ACC during interference subtest
• Ideas for future studies?