Strictly private & Confidential - Quick Healdlupdate.quickheal.com/documents/investors/Quick... ·...
44
1 Quick Heal Technologies Limited Investor Presentation May 2017
Transcript of Strictly private & Confidential - Quick Healdlupdate.quickheal.com/documents/investors/Quick... ·...

1
Strictly private & Confidential
Quick Heal Technologies Limited
Investor Presentation
May 2017

2
DISCLAIMER
This presentation and the following discussion may contain “forward looking statements” by Quick Heal Technologies Limited (“Quick Heal” or the “Company”)
that are not historical in nature. These forward looking statements, which may include statements relating to future results of operations, financial condition,
business prospects, plans and objectives are based on the current beliefs, assumptions, expectations, estimates and projections of the management of Quick
Heal about the business, industry and markets in which Quick Heal operates.
These statements are not guarantees of future performance and are subject to known and unknown risks, uncertainties and other factors, some of which are
beyond Quick Heal’s control and difficult to predict, that could cause actual results, performance or achievements to differ materially from those in the forward
looking statements.
Such statements are not and should not be construed as a representation of future performance or achievements of Quick Heal. In particular, such
statements should not be regarded as a projection of future performance of Quick Heal. It should be noted that the actual performance or achievements of
Quick Heal may vary significantly from such statements.
3
DISCUSSION SUMMARY
• KEY HIGHLIGHTS
• COMPANY OVERVIEW
• COMPETITIVE ADVANTAGES
• BUSINESS MODEL
• STRATEGY & OUTLOOK
• Q4 & FY17 RESULT UPDATE
• SHAREHOLDING STRUCTURE
• ANNEXURE
– CASE STUDIES

KEY HIGHLIGHTS – MOVING IN RIGHT DIRECTION
4
• Difficult business environment in H2 FY17 post ‘Demonetisation’; however active licenses witnessed steady growth from
7.3 mn as on Mar-16 to 7.8 mn as on Mar-17
• Active Retail licenses grew by 9.3% to 6.6 mn
• Active Enterprise & Government licenses grew by 11.9% to 1.1 mn
• FY17 Net Revenues remained stable YoY at Rs 3,329.8 mn
• Strong traction in Enterprise & Government segment with healthy customer additions
• Quick Heal has become the Preferred Partner to Government in its ‘Cyber Swachhta Kendra’ project as a part of ‘Digital India’ Initiative
• The Board of Directors recommended a dividend of
Rs 175.3 mn for FY17 (excl. dividend distribution tax of
Rs 35.6 mn), Dividend Per Share of Rs 2.5 & Dividend
Payout Ratio of 37.0% # of PAT excl. exceptional item
• Overall costs under strict control
• Cash profit * generation of Rs 879.5 mn in FY17 vs. Rs 816.3 mn in
FY16
STEADY GROWTH DESPITE ECONOMIC CHALLENGES
CONSISTENT DIVIDEND PAYOUT STRICT FOCUS ON COST CONTROL & OPERATING CASH FLOWS
# Including Dividend Distribution Tax * Cash Profit = PAT excl. exceptional item + Depreciation / Amortization

KEY HIGHLIGHTS – RECENT CYBER ATTACKS
5
Debit Cards of 3.2 mn
customers hacked in May 2016
from Yes Bank ATMs managed
by Hitachi Payment Services
RECENT CYBER EVENTS IMPACT
Cyber attack on Bangladesh
Central Bank in April 2016
Hacking of Twitter accounts in
December 2016
“WannaCry” ransomware attack
hits more than 154 countries
affecting more than 200,000
users in May 2017
GOVERNMENT AND
QUICK HEAL INITIATIVES IMPACT
IRCTC: Indian Railway and Tourism Corporation Of India
NPCI: National Payment Corporation of India
90 ATMs have been
compromised and ~ 641
customers across 19 banks
have lost Rs 13 mn as per NCPI
$101 mn paid out of total
ransom demand of $1 bn and
$81 mn remains uncovered
Twitter accounts of prominent
public figures like Vijay Mallya,
Rahul Gandhi & Barkha Dutt
were hacked
The virus blocks access to data
on one’s computer.
Quick Heal has successfully
prevented this virus from
compromising user systems
Govt. Of India launched Cyber
Swachhta Kendra in partnership
with Quick Heal, It is operated
by CERT-In
Cosmos Bank website was
compromised in March 2017
with RIG Exploit Kit which drops
Cerber Ransomware
Govt. of India to set up Cyber
Security Coordination Centre
Union Budget 2017-18 allocates
Rs 100 bn for BharatNet Project
in 2017-18.
CERT-In will work with banks to
detect infection in their network
and help them mitigate damage
Quick Heal and Seqrite
products successfully detected
the Cerber Ransomware
NCCC will ensure real time
threat assessment and
situational awareness to enable
timely alerts and periodic
reports
A spike in usage of connected
devices and a boost to Digital
India Initiative of the Govt.
CERT-In: Computer Emergency Response Team
NCCC: National Cyber Security Coordination Centre

6
KEY HIGHLIGHTS – ‘CYBER SWACHHTA KENDRA’ PROJECT
QUICK HEAL COLLABORATES WITH CERT-IN FOR ‘CYBER SWACHHTA KENDRA’
• ~ 50% of PCs and laptops in India do not have a security
software installed
• Quick Heal has been closely working with CERT-In to
develop effective security solutions
• CERT-In is the nodal agency responsible for dealing with
cyber attacks in India
PROJECT
RATIONALE
• Quick Heal is providing its ‘Bot Removal tool’ to CERT-In
• This ‘Bot Removal tool’ will help in detecting and removing
any botnet & bot malware infection
• This solution will automatically detect botnets and analyse the
behaviour of a malware
• The tool is freely available on Cyber Swachhta Kendra portal
• Currently, around 3,900 users have so far downloaded this
tool for cleaning their computers and mobiles.
QUICK HEAL’S
SOLUTION
• The ‘Cyber Swachhta Kendra’ is a Botnet Cleaning and
Malware Analysis Centre (BCMAC)
• BCMAC is a part of the Government’s Digital India initiative
under the Ministry of Electronics and Information Technology
(MeitY)
CYBER SWACHHTA
KENDRA
CERT-In - Computer Emergency Response Team
What is a ‘Botnet’?
• Botnet is a group of computers controlled by cybercriminals to spread
malware and launch other malicious attacks on their targets.
• Attackers can make one’s computer a part of their botnet by infecting it
with a ‘bot code’ by sending emails containing malicious links or
attachments, fake social media posts, or exploiting existing security
vulnerabilities on one’s system.
7
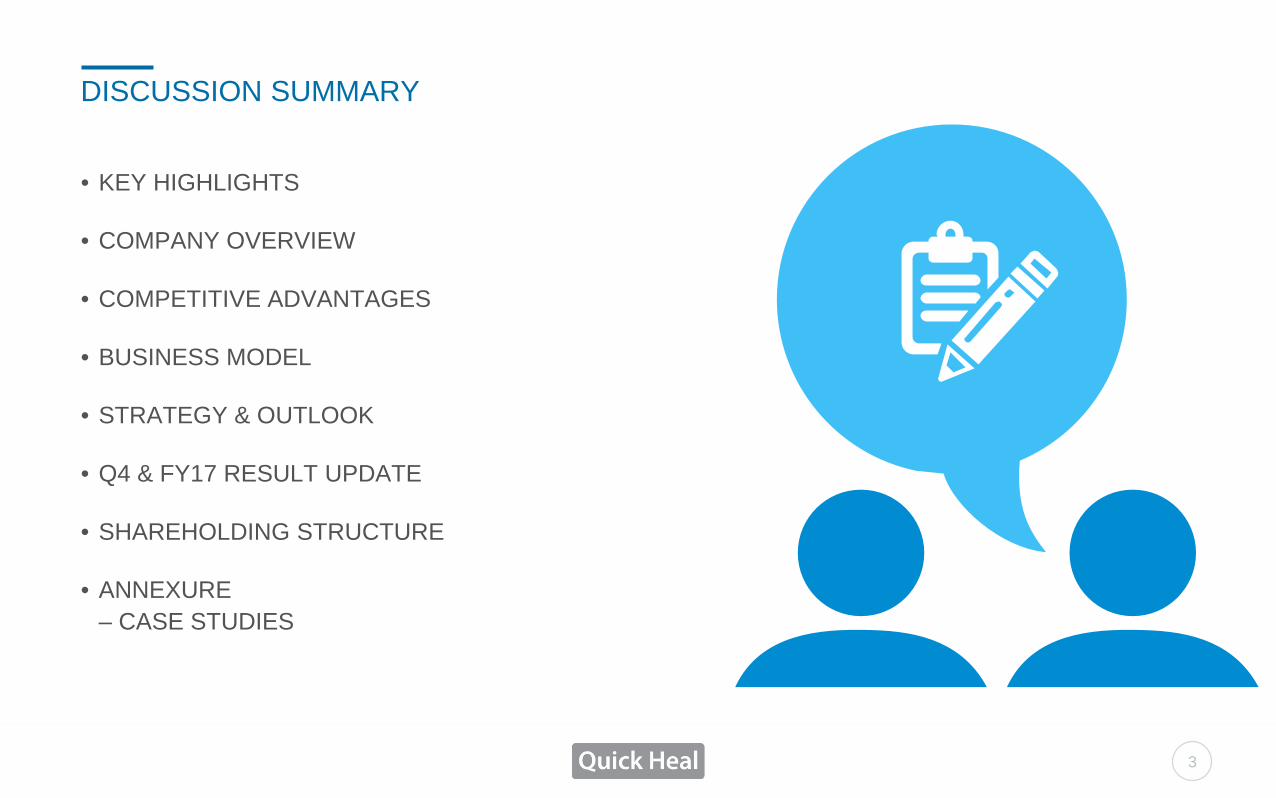
COMPANY OVERVIEW QUICK HEAL – BRIEF PROFILE
BUSINESS OVERVIEW
• Incorporated in 1995, Quick Heal is the pioneer in Indian IT Security Software and is currently one of the leading providers of Security Software Products and Solutions in India
• More than 30% market share in Retail segment
• Strong recognition / customer recall – “Quick Heal” for retail products and “Seqrite” for enterprise products
• Active licenses of over 7.8 mn as on Mar-17 across more than 80 countries
• Continued backing by Venture Capital Investor - Sequoia Capital which still holds 5.23%
KEY STRENGTHS
• Established and proven technology over a span of 22 years
• Comprehensive product offering (majority indigenously developed) across all segments (Home, SMB, Enterprise), all platforms (Windows, Mac, Android, iOS, Linux) and all devices (Desktops, Laptops, Mobiles, Tablets)
• Strong and diversified Channel network – 63 Offices and Warehouses in 35 Cities in India and 4 International Offices, 15,093 Retail Channel Partners, 491 Enterprise Channel Partners, 102 Government Partners, 1,660 Mobile Channel Partners
• Superior Customer Support
STRONG FINANCIALS
• Consolidated Revenues, EBITDA and PAT excl. exceptional item were Rs 2,999.7 mn, Rs 901.4 mn and Rs 570 mn respectively in FY17
• Robust profitability with EBITDA Margin of 30.0% and PAT Margin of 19.0% in FY17
• Healthy Cash profit* generation of Rs 879.5 mn in FY17
• Strong balance sheet with zero debt and healthy cash position in FY17
• Consistent dividend payments, the Board of Directors recommended a dividend of Rs 175.3 mn for FY17 (excl. dividend distribution tax of Rs 35.6 mn) translating into Dividend Payout Ratio of 37.0%# of PAT excl. exceptional item
* Cash Profit = PAT excl. exceptional item + Depreciation / Amortization
# Including Dividend Distribution Tax

8
COMPANY OVERVIEW QUICK HEAL JOURNEY
• Company renamed as Quick Heal
Technologies Pvt. Ltd. from CAT
Computer Services Pvt. Ltd.
• Quick Heal sets up Technical Support
Centre at Nashik
2006 - 2007
• Quick Heal starts Radio Campaign
• Quick Heal starts its first branch in Nashik
2002 - 2004
• Private Equity Investment firm Sequoia
Capital, invests in Quick Heal
• Quick Heal recognized by CRN India as
No.1 Channel Champion
2009 - 2010
• Quick Heal becomes Microsoft’s certified partner
• Quick Heal hosts AAVAR International Security
Conference in India
2008
• Incorporates Quick Heal in Kenya
• Incorporates Quick Heal in Japan
• Quick Heal acquires SurfCanister Sandbox
technology from Apurva Technologies, India
2011
• Launches Quick Heal Mobile Security
• Launches Quick Heal End Point Security
• Quick Heal acquires behavior based technologies
from Nova Shield Inc. UK
• Incorporates Quick Heal in Dubai
• ISO 9000
2012 - 2013
• Launches Quick Heal MDM (Mobile
Device Management)
• Launches Quick Heal Terminator (UTM-
Unified Threat Management)
• Launches free mobile security for Android
• Quick Heal invests in Wegilant Net
Solutions Pvt. Ltd, India
2014
• Launches Seqrite a brand encompassing security
products for Business Enterprise customers
• Quick Heal invests in ‘Smartalyse Technologies
Pvt. Ltd., India’
• Quick Heal inaugurates its first office in the US,
‘Quick Heal Technologies America’ in Boston
• Launches Quick Heal Gadget Securance for Mobile
security + insurance
• Launches Fonetastic for Mobile security
2015
• Incorporation as ‘CAT Computer
Services Pvt. Ltd.’
• Launch of ‘Quick Heal’ DOS
version
• Launch of ‘Quick Heal’ Windows
version
1995 - 1998
• Listing on BSE
and NSE
exchanges
• ISO 27001
• ISO 20000
2016
• Crosses 1 million active
licenses in Enterprise
Security segment
• Collaborates with CERT-
In (Govt. of India) on
‘Cyber Swachhta Kendra’
project.
2017

9
Awards in India International Certificates
* There marks are owned and copyrighted by their respective holders
• 2017: Quick Heal Total Security for Android (v2.01) gives 100% malware detection – Latest AV-Test results.
• 2016: Seqrite Endpoint Security (EPS) and Quick Heal Total Security recognized as a ‘Top Product’ by AV-Test Institute in their
September-October 2016 test results
• 2016: Seqrite EPS Enterprise Suite Edition awarded the AVLab BEST+++ Award in their October 2016 results
• 2016: ‘Top Trademark Driven Industry’ award by CII in its Industrial Intellectual Property Awards
• 2016: Best Antivirus, 9th NCN Most Innovative Product of the Year Award
• 2016: Best Make in India Brand, 14th VARINDIA IT Forum
• 2016: 12th Annual Info Security PG's 2016 Global Excellence Awards, USA
* Gold Winner for Product Development/Management Executive of the year
* Silver Winner in the category of Security Products and Solutions for Small Businesses and SOHO
• 2016: ICSA Labs Excellence in “Information Security Testing” Award for the 5th consecutive year
• 2015: IMC Information Technology Award for Excellence in Information Technology Products for small and
medium enterprise category, awarded by Indian Merchants Chamber
• 2015: Mumbai Hot 50 Brands in the B2C category, awarded by OneIndia
• 2014 – 2015: DQ Channels India’s Most Popular Vendor
• 2014 and 2015: CRN Channel Champions, Client Security awarded by United Business Media
• 2012, 2013 and 2014: Quality Brands, awarded by Quality Brand Times
• 2012: Maharashtra Corporate Excellence Awards, by Maxell Foundation
• 2008, 2009 and 2010: CRN Channel Champions, Antivirus Segments awarded by United Business Media
• 2010: Tech Life – The Lifestyle and Gadgets Awards, awarded by NDTV
• 2010: SME Awards for Best SME Innovation awarded by Business Today
• 2010: Deloitte Technology Fast500 Asia Pacific awarded by Deloitte
• 2010: Deloitte Technology Fast50 India awarded by Deloitte
COMPANY OVERVIEW TECHNOLOGY & MARKET LEADERSHIP
10
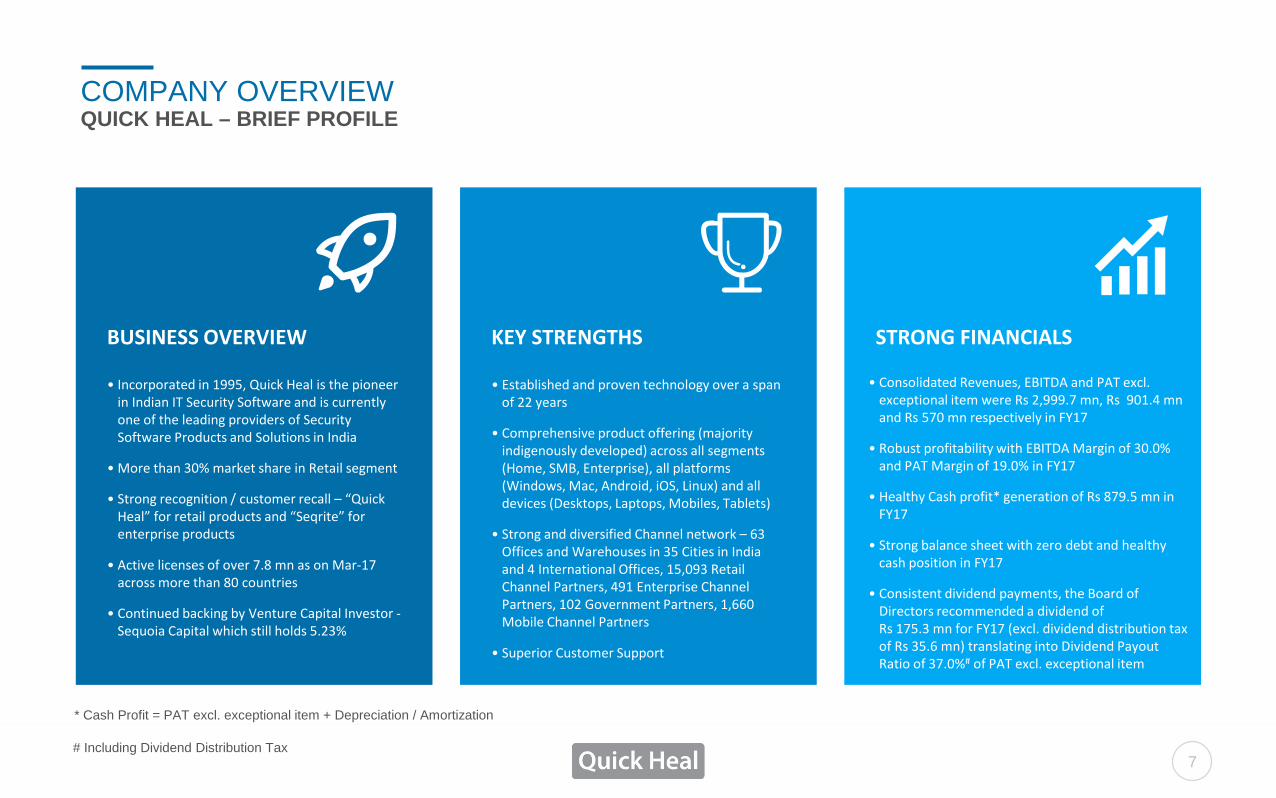
KAILASH KATKAR
Promoter of the Company since
incorporation
CEO & MD
SANJAY KATKAR
Promoter of the Company since
incorporation
CTO & MD
ABHIJIT JORVEKAR
Responsible for Sales &
Marketing
Executive Director & VP
SHAILESH LAKHANI
Serves as the MD at Sequoia
Capital India
Non-Executive Director
APURVA JOSHI
Is a certified bank forensic
accounting professional and
anti-money laundering expert
Independent Director
SUNIL SETHY
Comes from an experienced
background in accountancy,
finance, treasury, and legal
departments
Independent Director
PRADEEP BHIDE
Ex-IAS Officer and has served a series of increasingly
senior positions at the State Government and Central
Government
Independent Director
MEHUL SAVLA
Serves as the Director of
RippleWave Equity Private
Limited
Independent Director
COMPANY OVERVIEW BOARD OF DIRECTORS

11
COMPANY OVERVIEW STRONG BRAND RECOGNITION AND RECALL
7.8 m Active Licenses across more
than 80 countries
1.8x Growth Active Licenses over last
5 years
30% + Retail Market Share in India
Preferred Choice of
IT technicians for PC
Virus Cleaning
15,093 Retail, 491 Enterprise, 102 Government and 1,660 Mobile Partners

12
INDIA (HO) Quick Heal Technologies
Ltd.
JAPAN Quick Heal Japan KK.
UAE Quick Heal Technologies
(MENA) FZE
KENYA Quick Heal Technologies
Africa Ltd.
USA Quick Heal Technologies
America Inc
COMPANY OVERVIEW EXPANDING PRESENCE ACROSS INTERNATIONAL MARKETS
DUBAI Seqrite Technologies
DMCC

4,386
5,450
6,317
7,323
7,847
MAR-13 MAR-14 MAR-15 MAR-16 MAR-17
13
ACTIVE LICENSES (‘000)
COMPANY OVERVIEW LARGE AND GROWING USER BASE
6,050 6,612
994
1,112 279
123
MAR-16 MAR-17
Retail Enterprise & Government Mobile
7,323
7,847

14
COMPETITIVE ADVANTAGE COMPREHENSIVE PRODUCT PORTFOLIO
Retail / SMB
Features
Core Protection
Web Security
Email Security
Data Theft Protection
Safe Banking Features
Parental Controls
Stealth Mode
Anti-Keylogger
Improved Scan Engine
Virtual Keyboard
Privacy Protection
QH Remote Device Management
PC2Mobile Scan
PCTuner
Track My Laptop

15
COMPETITIVE ADVANTAGE COMPREHENSIVE PRODUCT PORTFOLIO
Mobile Security / Fontastic
/Gadget Securance
Features
Background Scan
Security Advisor
Privacy Advisor
Call & Message Filter
Register with TRAI
Anti-Theft Technology
Virus Protection
Mobile Tracker
Cloud Backup
Insurance cover - Theft
Physical and Liquid Damage
Fire Damage
Remote Device Management

COMPETITIVE ADVANTAGE COMPREHENSIVE PRODUCT PORTFOLIO
Advance Device Control
Features
Other AV Removal
Vulnerability Scan
Web Security
Application Control
Core Protection (AV, Firewall, IDS/IPS)
SEQRITE ENDPOINT
SECURITY
Data Loss Prevention
Remote Client management
Asset Management
File Activity Monitor
16

COMPETITIVE ADVANTAGE COMPREHENSIVE PRODUCT PORTFOLIO
DATA LOSS PREVENTION
(DLP) WINDOWS & MAC
17
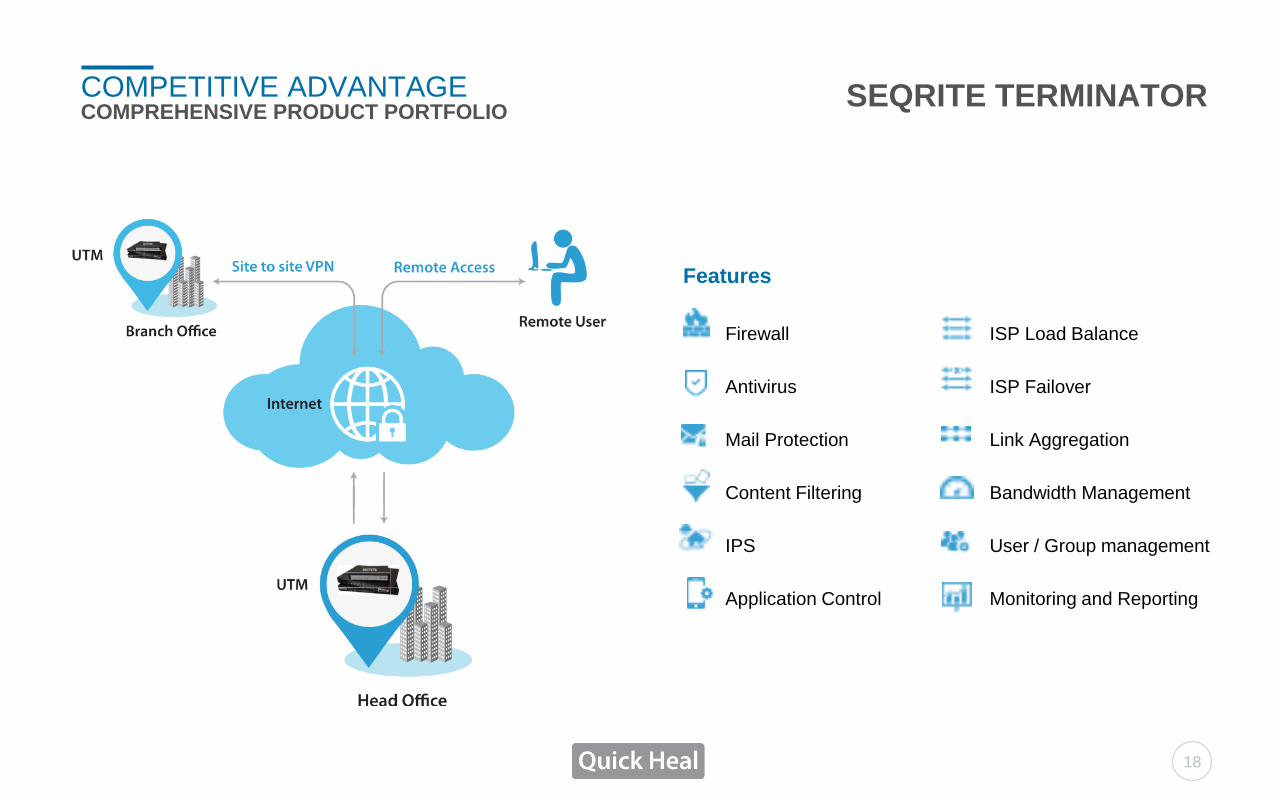
SEQRITE TERMINATOR
Firewall
Features
Antivirus
Mail Protection
Content Filtering
IPS
Application Control
ISP Load Balance
ISP Failover
Link Aggregation
Bandwidth Management
User / Group management
Monitoring and Reporting
COMPETITIVE ADVANTAGE COMPREHENSIVE PRODUCT PORTFOLIO
18
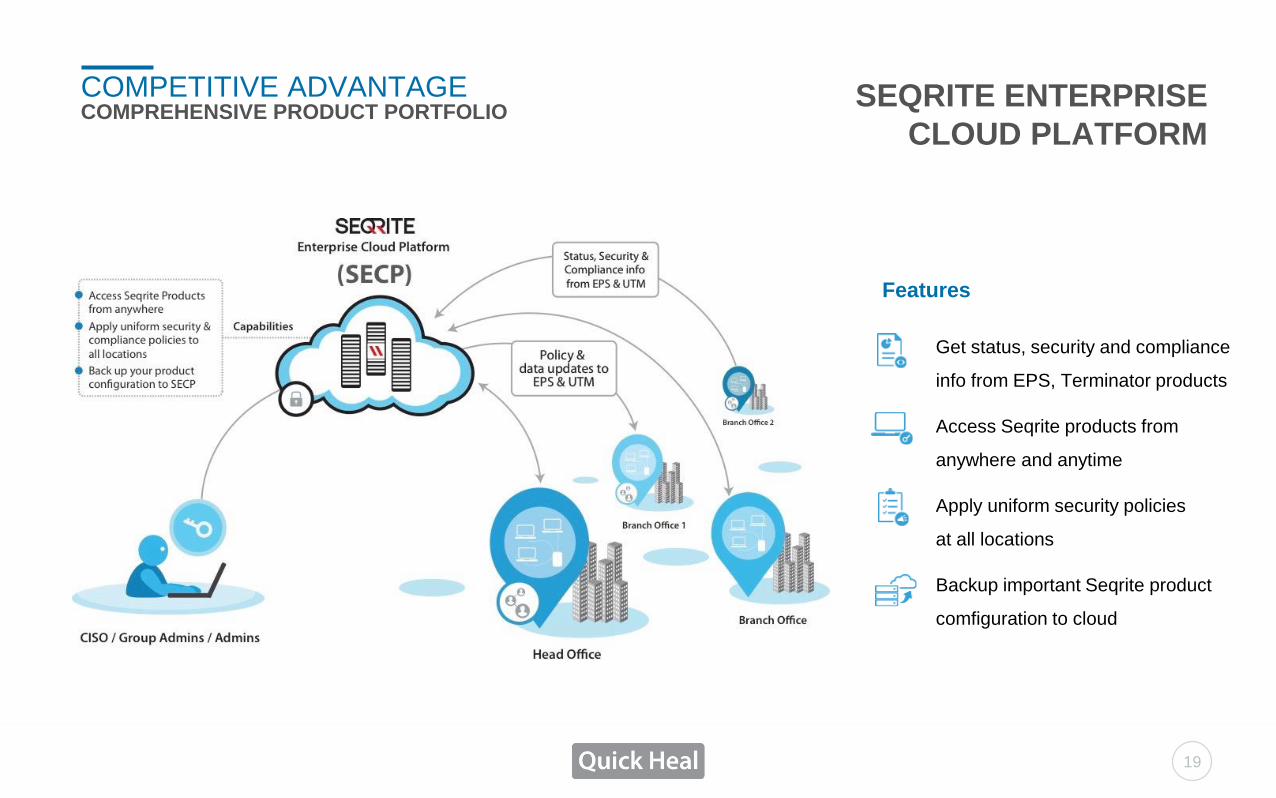
SEQRITE ENTERPRISE
CLOUD PLATFORM
Get status, security and compliance
info from EPS, Terminator products
Access Seqrite products from
anywhere and anytime
Apply uniform security policies
at all locations
Backup important Seqrite product
comfiguration to cloud
Features
COMPETITIVE ADVANTAGE COMPREHENSIVE PRODUCT PORTFOLIO
19

COMPETITIVE ADVANTAGE COMPREHENSIVE PRODUCT PORTFOLIO
Manage users, devices, groups
Features
OTA provisioning of devices
Remotely push configuration and policies
Application control
Anti-theft (ring / lock / locate / trace)
Remote wipe
SEQRITE MOBILE
DEVICE MANAGEMENT
20

Features
Manage chat groups, policies
One-to-One chat
Group Chat
Share files (image, audio, video, etc.)
Evaporated & Private messages
COMPETITIVE ADVANTAGE COMPREHENSIVE PRODUCT PORTFOLIO
SEQRITE SECURE CHAT
21

22
Significant National Outreach and Penetration
Customer Centric Approach
Domestic & International Support
Centre (Telephone, SMS, Online
chat, forum, Remote and on-site
ground support)
Sales team is closely
involved in maximising
product availability
across the channel and
providing technical /
sales assistance
Signed Agreements
Annual Sales Targets
Attractive Sales
Incentives
Quick Heal – 63 offices & warehouses across 35 cities in India
End Users End Users
Certifications
programmes for
enterprise channel
partner empowerment &
education
On-going training (4
technical support centres)
to channel partners for
providing support
services to end users
End Users
COMPETITIVE ADVANTAGE EXTENSIVE PAN-INDIA DISTRIBUTION NETWORK
Retail Network
15,093
Enterprise & Government
Network
593
Mobile Channel
1,660
Head Office & R&D Center Pune

23
COMPETITIVE ADVANTAGE SUPERIOR CUSTOMER SUPPORT
STRONG CUSTOMER SUPPORT – SINGLE LARGEST DIFFERENTIATOR
• Multi-lingual end user support in English, Hindi and several other major regional Indian languages
• Multi-modal support to users through phone, email, SMS, online chat, support forum and remote access
• Ground support and onsite support for non-home users pan India
• Availability of data sheets, product videos and manuals on website for providing information on technical specifications, installation
guide, upgrade mechanisms
• Release of various articles, technical papers, quarterly threat reports and conducting webinars in the area of security software
Strong Emphasis on
Efficient Customer Service
Remote Access Support –
Key Differentiator
Maintain High Levels of User
Satisfaction and Retention

15 - 17%
27 - 29%
17 - 19%
38 - 45%
Q1 Q2 Q3 Q4
24
QUARTERLY REVENUES - % OF ANNUAL
Note: Fiscal year ends on March 31 of each year as shown above
Source: Industry Overview and Trends – India and IT Security Market India - Inferences - Zinnov
SEASONALITY IMPACT ON REVENUES & MARGINS:
• Revenues are higher in Q2 and Q4.
• R&D, G&A expenses are spread across all
four quarters
• Hence, there is variation in EBITDA margin
on quarterly basis
BUSINESS MODEL SEASONALITY IMPACT ON REVENUES & MARGINS

25
CTO
Business
Logic Team
Development
Team Quality
Assurance Team
Incidence
Response Team
IoT(1) Team Threat Research &
Response Team
CONTINUOUS FOCUS AND INVESTMENTS IN R&D R&D DEPARTMENT STRUCTURE
ROBUST R&D FRAMEWORK TO ACTIVELY TRACK AND QUARANTINE NEW VIRUSES
• Business Logic Team - helps in building product roadmaps and devising appropriate strategies.
• Product Development Team - responsible for the design and development of various products
and solutions.
• Incidence Response Team – responsible for any emergency situation/incident at any enterprise
security infrastructure.
• Threat Research and Response Team -takes part in detection of and removal of reported
viruses and malwares
• Internet of Things Security Team - create products and solutions for home automation security
• Quality Assurance Team - provides systematic measurement, standard evaluation and
monitoring of processes.
Earmarked Rs 418.8 mn
from IPO proceeds to be
spent on R&D investments
over next 3 years
Indian GAAP Financial
Reporting with full
expensing of R&D
expenses
BUSINESS MODEL THRUST ON RESEARCH & DEVELOPMENT
191
318
433
555 494
FY13 FY14 FY15 FY16 FY17
No. of R&D Employees

26
STRONG DRIVERS FOR LONG-TERM GROWTH
• Special focus on Tier
II and Tier III towns
• Tailored offerings for
SMB and enterprise
users
• Develop and promote
software-as-a-service
model
• Plans to focus on
manufacturing, BFSI,
healthcare,
hospitality industries
• Reach out to SMBs,
identify new SMB
opportunities,
increase engagement
with channel partners
• Focus on international
expansion through
consistent brand
building and marketing
effort including media
events and exhibitions
• Exploring opportunities
in Africa, Middle East &
South East Asia
• Develop product for
upcoming platforms like
Androids, Windows,
Linux, iOS to address
opportunities in
consumer enterprise.
• Monetize opportunities
of our free solutions for
mobile devices
• Work ongoing on
several new
technologies such as
IoT and home
security automation
• Has 4 US patents to
its credit. Awaiting 3
Indian patents
Retain and Expand User
Base
International Expansion
Expand Mobile
Capabilities
Grow SMB and Enterprise Business
Strengthen R&D Investments and Broaden Product
Portfolio

In Rs. Million
Q4 & FY17 RESULTS HIGHLIGHTS
27
579.2 570.0
19.2% 19.0%
FY16 FY17
PAT PAT Margin %
Q4 FY17 YoY ANALYSIS
FY17 YoY ANALYSIS
REVENUES * EBITDA and EBITDA MARGIN PAT and PAT MARGIN #
1,123.7
921.7
Q4 FY16 Q4 FY17
558.7
365.7
49.7%
39.7%
Q4 FY16 Q4 FY17
EBIDTA EBIDTA Margin %
18 % 35 %
364.7
221.9
32.5% 24.1%
Q4 FY16 Q4 FY17
PAT PAT Margin %
39 %
CASH PROFIT @
428.0
303.8
Q4 FY16 Q4 FY17
Cash Profit
REVENUES * EBITDA and EBITDA MARGIN PAT and PAT MARGIN #
3,020.9 2,999.7
FY16 FY17
1,019.2 901.4
33.7% 30.0%
FY16 FY17
EBIDTA EBIDTA Margin %
0.7 % 1.6 %
CASH PROFIT @
816.3 879.5
FY16 FY17
Cash Profit
8 % 12 %
29 %
# FY17 PAT excludes exceptional item of Rs 37.8 mn on account of
impairment of financial assets (Loan & Interest receivable)
@ Cash Profit = PAT excl. exceptional item + Depreciation / Amortization * Based on IND-AS Accounting Standards

1,117.8
822.3
155.6
188.1
21.4
22.7
Q4 FY16 Q4 FY17
Retail
Enterprises & Government
Mobile
28
Q4 & FY17 – REVENUE ANALYSIS In Rs. Million
2,882.2 2,674.6
437.1 569.6
61.4 85.7
FY16 FY17
Retail
Enterprises & Government
Mobile
* Based on net revenues before adjusting for sales incentives
SEGMENT BREAKUP *
Q4 FY17 YoY ANALYSIS
SEGMENT BREAKUP *
FY17 YoY ANALYSIS
3,329.8 3,380.7
1,033.1
1,294.8
21 %
26 %
6 %
30 %
7 %
40 %
% Share Q4 FY16 Q4 FY17
86.3% 79.6%
12.0% 18.2%
1.7% 2.2%
% Share FY16 FY17
85.3% 80.3%
12.9% 17.1%
1.8% 2.6%

5,763 5,183
923
913
145
126
FY16 FY17
Retail
Enterprises & Government
Mobile
29
Q4 & FY17 – REVENUE ANALYSIS
2,251
1,632
452
261
41
20
Q4 FY16 Q4 FY17
Retail
Enterprises & Government
Mobile
NUMBER OF LICENSES SOLD (‘000)
Q4 FY17 YoY ANALYSIS
NUMBER OF LICENSES SOLD (‘000)
FY17 YoY ANALYSIS
% Share Q4 FY16 Q4 FY17
82.0% 85.3%
16.5% 13.6%
1.5% 1.0%
% Share FY16 FY17
84.4% 82.2%
13.5% 15.9%
2.1% 1.9%
6,222
6,831
1,913
2,744
42 %
27 %
1 %
10 %
13 % 52 %
30
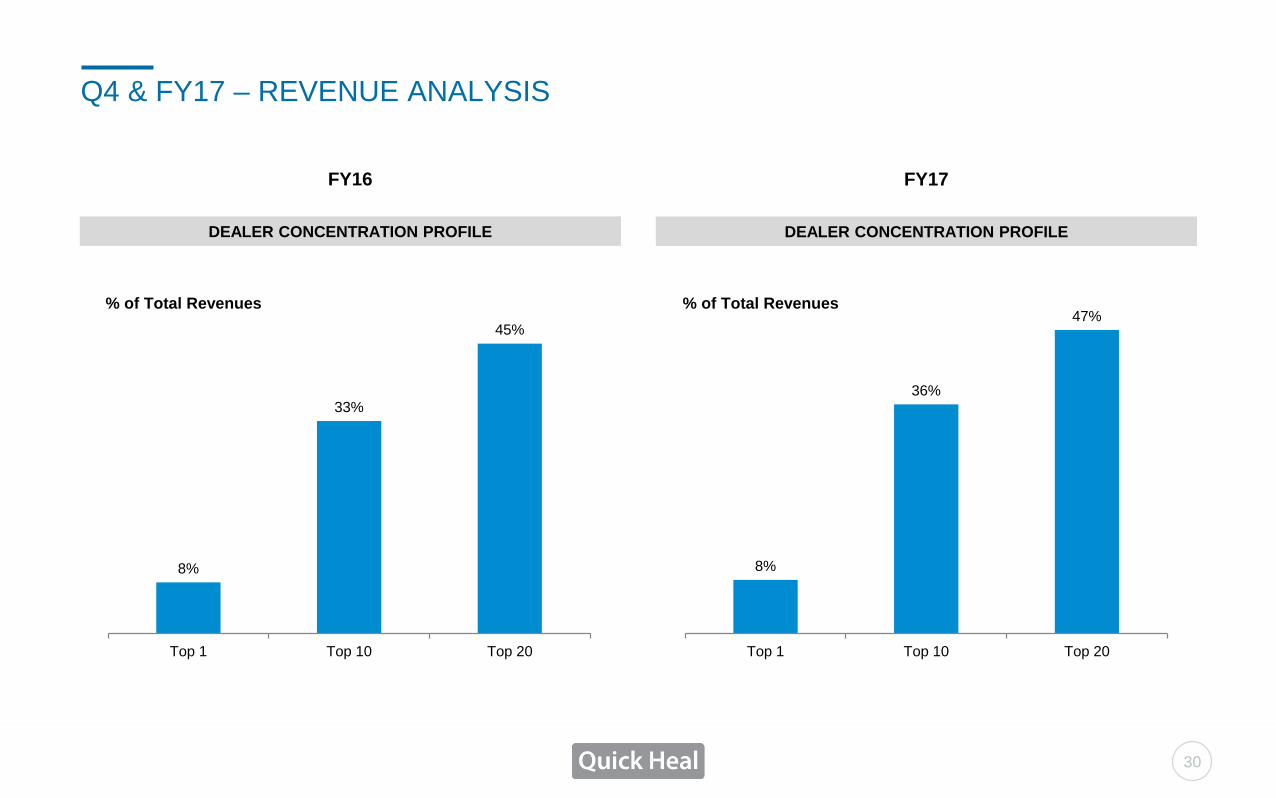
Q4 & FY17 – REVENUE ANALYSIS
DEALER CONCENTRATION PROFILE
FY16
DEALER CONCENTRATION PROFILE
FY17
8%
33%
45%
Top 1 Top 10 Top 20
% of Total Revenues
8%
36%
47%
Top 1 Top 10 Top 20
% of Total Revenues

31
Q4 & FY17 – EMPLOYEE BREAKUP
370
555
249
218
Sales & Marketing
R&D
Technical Support
Others
March 2016 – 1,392
394
521
265
208
March 2017 – 1,374
396
494
276
208
December 2016 – 1,388

32
Q4 & FY17 – COST ANALYSIS Rs Million
Head Consolidated
Q4 FY17,a Q3 FY17,a Q2 FY17,a Q1 FY17, a Q4 FY16, a
Operating Cost
Salaries 116.5 118.7 122.4 120.8 109.6
Fees for technical services 24.9 24.9 25.2 25.1 19.0
Technology subscription charges 14.2 13.6 16.2 12.8 25.7
R&D Expenses (A) 155.6 157.3 163.8 158.8 154.3
Salaries 77.7 75.9 78.3 72.4 67.7
S&M - Mobile Outsourcing Cost 22.9 23.8 21.5 18.0 15.9
Advertising Expenses 71.4 44.2 21.5 34.3 71.3
Sales Promotion 3.4 12.6 7.7 14.1 33.8
Traveling and conveyance 11.6 13.5 12.5 10.9 12.6
Technical Support Cost 19.4 19.1 23.2 18.2 18.0
Selling & Marketing Expenses (B) 206.4 189.1 164.7 167.9 219.3
Salaries 43.7 45.7 40.2 36.3 36.1
Other Expenses 90.5 73.3 74.1 100.9 71.4
G&A (C) 134.2 119.0 114.3 137.2 107.5
Total Expenditure (A+B+C) 496.1 465.4 442.8 463.9 481.1
NOTE: Certain figures have been re-grouped wherever necessary

33
Q4 & FY17 – WORKING CAPITAL ANALYSIS
86
57
7 36
Receivables Days Inventory Days Payables Days Net Working Capital Days
Note: Net Working Capital Days = (Net Working Capital / Fourth Quarter Sales * 91 days
Calculation is based on net revenues before adjusting for sales incentives
WORKING CAPITAL ANALYSIS – MARCH 2017

34
Q4 & FY17 – TACTICAL MARKETING CAMPAIGNS
QUICK HEAL ASSOCIATES WITH RISING PUNE SUPERGIANT IPL TEAM AS ‘SECURITY PARTNER’
• Quick Heal rolled out IPL (Indian Premier League) themed campaign across OOH, digital and social media channels
• Quick Heal has the rights to feature Rising Pune Supergiant (RPS) team players in its marketing campaigns during the IPL season
• IPL has global viewership and this partnership will offer Quick Heal a strong platform to showcase our capabilities and one of the best Internet Security Solutions

Q4 & FY17 CONSOLIDATED RESULTS – PROFIT & LOSS
35
Rs Million
Head Consolidated
Q4 FY17,a Q4 FY16,a Growth % Change FY17,a FY16,a Growth % Change
Revenue 921.7 1,123.7 -202.0 -18.0% 2,999.7 3,020.9 -21.2 -0.7%
Direct Cost 59.8 83.9 24.1 28.7% 230.2 278.4 48.2 17.3%
Gross profit 861.9 1,039.8 -177.9 -17.1% 2,769.6 2,742.5 27.0 1.0%
Gross Margin, % 93.0% 92.5% 91.8% 90.8%
Operating Costs
R&D Cost 155.6 154.3 -1.3 -0.8% 635.4 590.4 -45.0 -7.6%
Sales and Marketing (S&M) 206.4 219.3 12.9 5.9% 728.5 718.2 -10.3 -1.4%
General Administration (G&A) 134.2 107.5 -26.7 -24.8% 504.2 414.7 -89.5 -21.6%
Total 496.1 481.1 -15.1 -3.1% 1,868.2 1,723.3 -144.9 -8.4%
EBIDTA 365.7 558.7 -193.0 -34.5% 901.4 1,019.2 -117.8 -11.6%
Depreciation / Amortization 81.9 63.3 -18.6 -29.3% 309.5 237.1 -72.3 -30.5%
EBIT 283.9 495.4 -211.5 -42.7% 591.9 782.1 -190.2 -24.3%
Other Income 62.2 42.0 20.2 48.1% 284.5 99.0 185.5 187.3%
Profit Before Tax & Exceptional Item 346.1 537.4 -191.3 -35.6% 876.4 881.1 -4.7 -0.5%
Exceptional Item - - - - 37.8 - -37.8 -
Tax 124.2 172.7 48.5 28.1% 306.4 302.0 -4.4 -1.5%
PAT 221.9 364.7 -142.8 -39.2% 532.2 579.2 -47.0 -8.1%
PAT excl. Exceptional Item * 221.9 364.7 -142.8 -39.2% 570.0 579.2 -9.2 -1.6%
Reconciliation between I GAAP and IND-AS
Revenue (Gross) 1,122.4 1,374.1 -251.6 -18.3% 3,608.2 3,618.6 -10.4 -0.3%
Taxes 89.3 79.2 -10.1 -12.8% 278.3 237.9 -40.4 -17.0%
Net revenue 1,033.1 1,294.8 -261.8 -20.2% 3,329.8 3,380.7 -50.9 -1.5%
Less Dealer Incentive 106.2 171.2 65.0 38.0% 314.0 359.8 45.8 12.7%
Less Mobile Insurance 5.2 0.0 -5.2 - 16.1 0.0 -16.1 -
Net revenue after Dealer Incentive 921.7 1,123.7 -202.0 -18.0% 2,999.7 3,020.9 -21.2 -0.7% * FY17 PAT excludes exceptional item of Rs 37.8 mn on account of
impairment of financial assets (Loan & Interest receivable) NOTE: Certain figures have been re-grouped wherever necessary

36
Q4 & FY17 CONSOLIDATED RESULTS – RATIO ANALYSIS
Ratio Analysis
Head Consolidated
Q4 FY17,a Q4 FY16,a FY17,a FY16,a
Expenses
Direct Cost / Revenue 6.5% 7.5% 7.7% 9.2%
R&D / Revenue 16.9% 13.7% 21.2% 19.5%
S&M / Revenue 22.4% 19.5% 24.3% 23.8%
G&A / Revenue 14.6% 9.6% 16.8% 13.7%
Total Cost / Revenue 53.8% 42.8% 62.3% 57.0%
Margin
Gross Margin 93.5% 92.5% 92.3% 90.8%
EBIDTA 39.7% 49.7% 30.0% 33.7%
EBIT 30.8% 44.1% 19.7% 25.9%
PBT 37.5% 47.8% 29.2% 29.2%
PAT * 24.1% 32.5% 19.0% 19.2%
* FY17 PAT excludes exceptional item of Rs 37.8 mn on account of
impairment of financial assets (Loan & Interest receivable) NOTE: Certain figures have been re-grouped wherever necessary

37
Q4 & FY17 CONSOLIDATED RESULTS – BALANCE SHEET
Particulars (In Rs Mn) Mar-17 Mar-16
Share Holders’ Funds:
Equity Share Capital 701.0 700.3
Share application money pending allotment 0.1 -
Reserves And Surplus 5,915.5 5,593.3
Total Of Shareholder Funds 6,616.6 6,293.6
Non-Current Liabilities:
Net employee defined benefit liabilities 22.7 18.3
Current Liabilities:
Trade and Other Payables 408.9 509.8
Other Financial Liabilities 13.2 10.3
Other Current Liabilities 136.2 160.8
Net employee defined benefit liabilities 14.4 14.8
Current Tax Liabilities (Net) 123.1 165.8
Total Of Current Liabilities 695.9 861.4
Total Equity & Liabilities 7,335.2 7,173.3
Particulars (In Rs Mn) Mar-17 Mar-16
Non-Current Assets:
Property, plant and equipment 1,782.2 1,323.5
Capital work-in-progress 135.9 550.6
Other Intangible assets 65.4 93.7
Investments 66.7 40.1
Loan and Security Deposits 4.5 1.5
Bank Balances 1.8 2.0
Deferred tax assets (net) 87.3 77.8
Other non-current assets 244.8 177.4
Total Non-Current Assets 2,388.6 2,266.6
Current assets:
Inventories 79.4 66.7
Investment in Mutual Fund 1,750.8 1,113.2
Trade and other receivables 971.8 923.8
Investment in Fixed Deposit 1,898.6 2,273.3
Bank Balances & Cash and Cash Equivalents 195.0 417.2
Loans and Security Deposits 6.2 70.2
Interest accrued 8.7 14.2
Share issue expenses recoverable - 4.5
Other current assets 36.0 23.5
Total Current Assets 4,946.6 4,906.7
Total Assets 7,335.2 7,173.3
NOTE: Certain figures have been re-grouped wherever necessary

Rs Million
Head Standalone
Q4 FY17, a Q4 FY16, a Growth % Change FY17, a FY16, a Growth % Change
Revenue 918.9 1,116.6 -197.7 -17.7% 2,990.2 2,984.9 5.3 0.2%
Direct Cost 57.1 82.1 25.0 30.5% 217.2 253.2 36.0 14.2%
Gross profit 861.8 1,034.6 -172.7 -16.7% 2,773.0 2,731.7 41.3 1.5%
Gross Margin, % 93.3% 92.7% 92.2% 91.5%
Operating Costs
R&D Cost 155.6 148.6 -7.0 -4.7% 635.4 584.6 -50.8 -8.7%
Sales and Marketing (S&M) 196.2 205.7 9.5 4.6% 681.0 674.7 -6.3 -0.9%
General Administration (G&A) 127.3 108.9 -18.3 -16.8% 484.1 404.3 -79.7 -19.7%
Total 479.0 463.2 -15.8 -3.4% 1,800.5 1,663.7 -136.8 -8.2%
EBIDTA 382.7 571.4 -188.7 -33.0% 972.5 1,068.0 -95.5 -8.9%
Depreciation / Amortization 81.6 63.2 -18.4 -29.2% 308.7 236.8 -71.9 -30.4%
EBIT 301.1 508.2 -207.1 -40.7% 663.8 831.2 -167.4 -20.1%
Other Income 58.8 38.1 20.8 54.5% 277.7 94.5 183.3 194.1%
Profit Before Tax & Exceptional Item 360.0 546.3 -186.3 -34.1% 941.5 925.7 15.9 1.7%
Exceptional Item - - - - 44.1 - -44.1 -
Tax 123.7 172.7 49.1 28.4% 305.7 301.9 -3.8 -1.3%
PAT 236.3 373.6 -137.3 -36.7% 591.7 623.8 -32.1 -5.1%
PAT excl. Exceptional Item * 236.3 373.6 -137.3 -36.7% 629.5 623.8 5.7 0.9%
Q4 & FY17 STANDALONE RESULTS – PROFIT & LOSS
38 * FY17 PAT excludes exceptional item of Rs 37.8 mn on account of
impairment of financial assets (Loan & Interest receivable) NOTE: Certain figures have been re-grouped wherever necessary
39
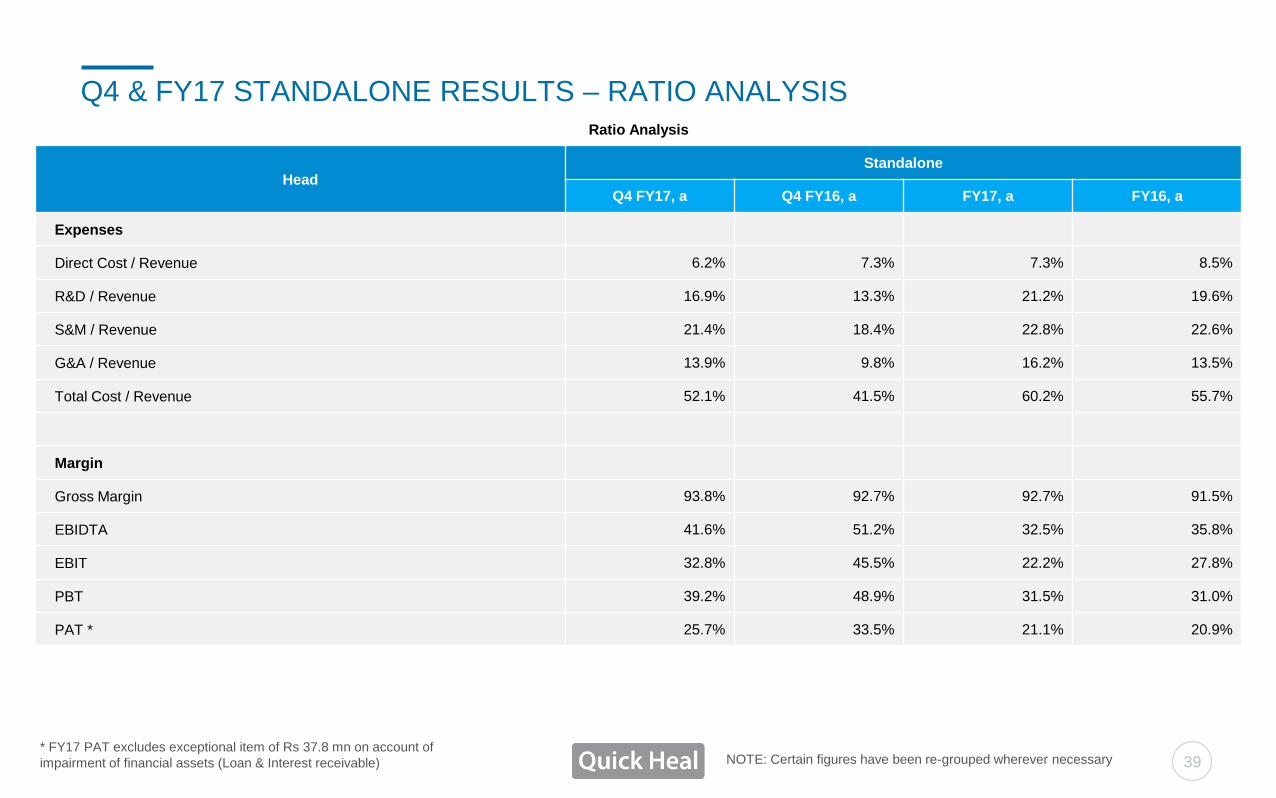
Q4 & FY17 STANDALONE RESULTS – RATIO ANALYSIS Ratio Analysis
Head Standalone
Q4 FY17, a Q4 FY16, a FY17, a FY16, a
Expenses
Direct Cost / Revenue 6.2% 7.3% 7.3% 8.5%
R&D / Revenue 16.9% 13.3% 21.2% 19.6%
S&M / Revenue 21.4% 18.4% 22.8% 22.6%
G&A / Revenue 13.9% 9.8% 16.2% 13.5%
Total Cost / Revenue 52.1% 41.5% 60.2% 55.7%
Margin
Gross Margin 93.8% 92.7% 92.7% 91.5%
EBIDTA 41.6% 51.2% 32.5% 35.8%
EBIT 32.8% 45.5% 22.2% 27.8%
PBT 39.2% 48.9% 31.5% 31.0%
PAT * 25.7% 33.5% 21.1% 20.9%
* FY17 PAT excludes exceptional item of Rs 37.8 mn on account of
impairment of financial assets (Loan & Interest receivable) NOTE: Certain figures have been re-grouped wherever necessary

40
Q4 & FY17 STANDALONE RESULTS – BALANCE SHEET
Particulars (In Rs Mn) Mar-17 Mar-16
Share Holders’ Funds:
Equity Share Capital 701.0 700.3
Share application money pending
allotment 0.1 -
Reserves And Surplus 6,089.5 5,699.7
Total Of Shareholder Funds 6,790.5 6,400.0
Non-Current Liabilities:
Net employee defined benefit liabilities 22.7 18.3
Current Liabilities:
Trade and Other Payables 406.0 506.1
Other Financial Liabilities 13.2 10.3
Other Current Liabilities 135.8 159.7
Net employee defined benefit liabilities 14.4 14.8
Current Tax Liabilities (Net) 122.5 165.8
Total Of Current Liabilities 692.0 856.6
Total Equity & Liabilities 7,505.1 7,274.9
Particulars (In Rs Mn) Mar-17 Mar-16
Non-Current Assets:
Property, plant and equipment 1,780.7 1,321.6
Capital work-in-progress 135.9 550.2
Other Intangible assets 65.1 93.7
Non-current financial assets
Investments 361.6 170.1
Loan and Security Deposits 4.5 1.5
Bank Balances 2.1 5.3
Deferred tax assets (net) 87.3 77.8
Other non-current assets 244.8 177.5
Total Non-Current Assets 2,681.9 2,397.8
Current assets:
Inventories 72.2 53.7
Financial assets
Investment in Mutual Fund 1,750.8 1,113.2
Trade and other receivables 949.9 969.1
Investment in Fixed Deposit 1,898.6 2,273.3
Bank Balances & Cash and Cash Equivalents 103.8 357.2
Loans and Security Deposits 5.4 68.9
Interest accrued 8.7 14.2
Share issue expenses recoverable - 4.5
Other current assets 33.9 23.0
Total Current Assets 4,823.2 4,877.2
Total Assets 7,505.1 7,274.9
NOTE: Certain figures have been re-grouped wherever necessary

41
SHAREHOLDING STRUCTURE
Promoter & Promoter Group,
72.79
Institutions, 9.43
Public, 17.78
Source – BSE
% Shareholding – March 2017

Nilesh Dalvi / Vatsal Mehta
Dickenson Seagull IR
IR Consultant
Email ID: [email protected]
Contact No:+91 9819289131 / 9712129581
FOR FURTHER QUERIES
42
Mr Vijay Shirode
Quick Heal Technologies Limited
Company Secretary
Email ID: [email protected]
Contact No: +91 932 578 9617
43
ANNEXURE – CASE STUDIES
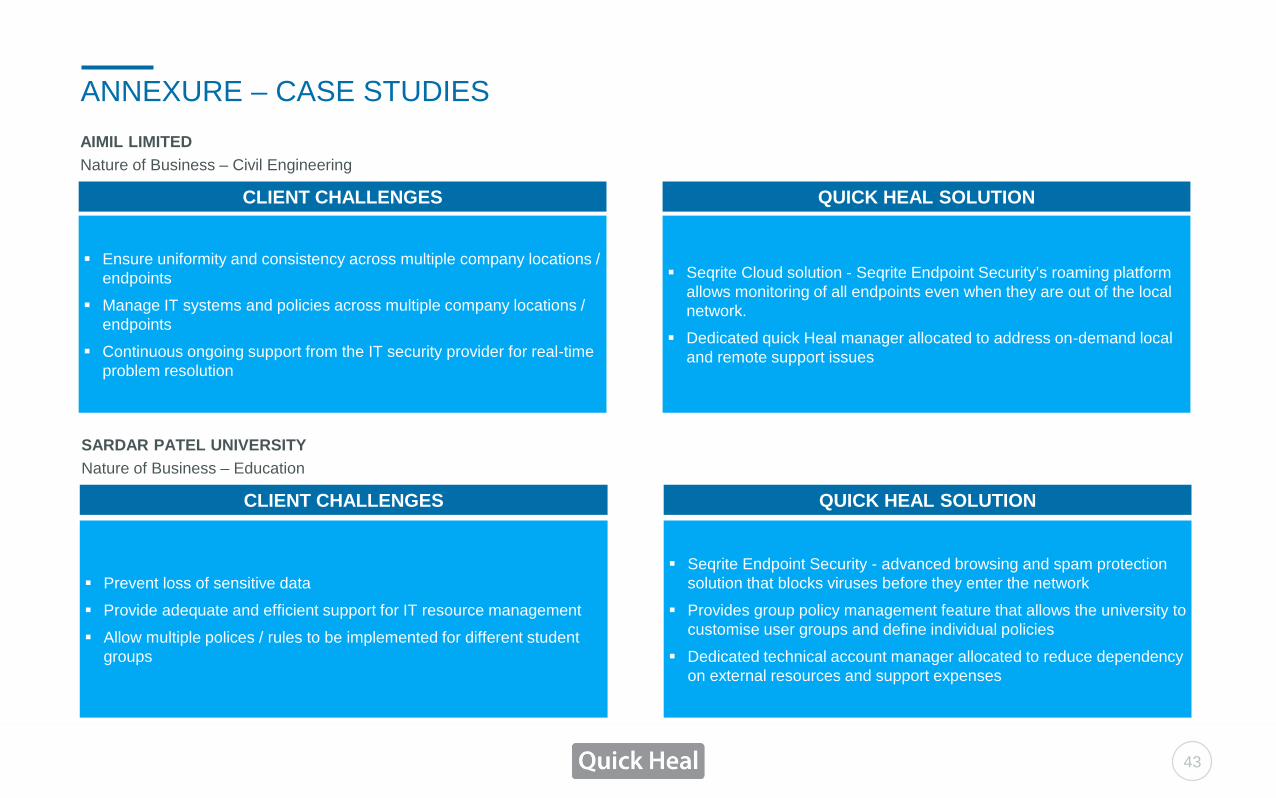
CLIENT CHALLENGES QUICK HEAL SOLUTION
Ensure uniformity and consistency across multiple company locations /
endpoints
Manage IT systems and policies across multiple company locations /
endpoints
Continuous ongoing support from the IT security provider for real-time
problem resolution
Seqrite Cloud solution - Seqrite Endpoint Security’s roaming platform
allows monitoring of all endpoints even when they are out of the local
network.
Dedicated quick Heal manager allocated to address on-demand local
and remote support issues
AIMIL LIMITED
Nature of Business – Civil Engineering
CLIENT CHALLENGES QUICK HEAL SOLUTION
Prevent loss of sensitive data
Provide adequate and efficient support for IT resource management
Allow multiple polices / rules to be implemented for different student
groups
Seqrite Endpoint Security - advanced browsing and spam protection
solution that blocks viruses before they enter the network
Provides group policy management feature that allows the university to
customise user groups and define individual policies
Dedicated technical account manager allocated to reduce dependency
on external resources and support expenses
SARDAR PATEL UNIVERSITY
Nature of Business – Education

44
ANNEXURE – CASE STUDIES
CLIENT CHALLENGES QUICK HEAL SOLUTION
Prevent loss of bandwidth due to employees accessing social media
sites
Allow the hospital to implement uniform policies across all systems
Prevent slowing down and frequent freezing of systems within the
hospital network
Seqrite Endpoint Security - allows the hospital to implement website
filtering to block individual sites or category-based sites
Provides group policy management feature that allows the hospital to
define user groups and assign policies
Allows cleaning up of junk files and deletes invalid registry entries to
optimize system speed and avoid unwanted disruptions
BOMBAY HOSPITAL, INDORE
Nature of Business – Healthcare & Hospitals
CLIENT CHALLENGES QUICK HEAL SOLUTION
Prevent loss of bandwidth due to employees accessing unwanted
websites
Allow installation of crucial software without slowing down the network
Provide adequate technical support and services for addressing issues
Seqrite Endpoint Security - allows website filtering to restrict access to
unwanted websites to preserve network bandwidth
Includes an application control feature that blocks categories of
applications from functioning within the network
Dedicated technical account manager to resolve technical issues from
time to time
PUBLIC WORKS DEPARTMENT – DEHRADUN
Nature of Business – Government Authority for State Road Network