Stresses In The End Zones Of Precast Inverted T-Beams With ...
78
Wayne State University Wayne State University eses 1-1-2018 Stresses In e End Zones Of Precast Inverted T- Beams With Tapered Webs Ravi Siddharth Raja Wayne State University, Follow this and additional works at: hps://digitalcommons.wayne.edu/oa_theses Part of the Civil Engineering Commons is Open Access esis is brought to you for free and open access by DigitalCommons@WayneState. It has been accepted for inclusion in Wayne State University eses by an authorized administrator of DigitalCommons@WayneState. Recommended Citation Raja, Ravi Siddharth, "Stresses In e End Zones Of Precast Inverted T-Beams With Tapered Webs" (2018). Wayne State University eses. 686. hps://digitalcommons.wayne.edu/oa_theses/686
Transcript of Stresses In The End Zones Of Precast Inverted T-Beams With ...

Wayne State University
Wayne State University Theses
1-1-2018
Stresses In The End Zones Of Precast Inverted T-Beams With Tapered WebsRavi Siddharth RajaWayne State University,
Follow this and additional works at: https://digitalcommons.wayne.edu/oa_theses
Part of the Civil Engineering Commons
This Open Access Thesis is brought to you for free and open access by DigitalCommons@WayneState. It has been accepted for inclusion in WayneState University Theses by an authorized administrator of DigitalCommons@WayneState.
Recommended CitationRaja, Ravi Siddharth, "Stresses In The End Zones Of Precast Inverted T-Beams With Tapered Webs" (2018). Wayne State UniversityTheses. 686.https://digitalcommons.wayne.edu/oa_theses/686

STRESSES IN THE END ZONES OF PRECAST INVERTED T-BEAMS WITH
TAPERED WEBS
by
RAVI SIDDHARTH RAJA
THESIS
Submitted to the Graduate School
of Wayne State University,
Detroit, Michigan
in partial fulfilment of the requirements
for the degree of
MASTER OF SCIENCE
2018
MAJOR: CIVIL ENGINEERING
Approved By:
Dr. Fatmir Menkulasi Date

ii
ACKNOWLEDGMENTS
First, I would like to thank Dr. Fatmir Menkulasi for giving me this opportunity to
develop my knowledge and skills in the field of civil engineering. The knowledge I gained
from his teaching, and technical material in Bridge Design classes were the backbone for this
project. Office doors to Dr. Menkulasi were always open, whenever I struck or had any
question about my research or writing. He always steered me in the right direction, whenever
he thought I needed it. His continuous encouragement and motivation has made me to drive
through all obstacles in this project and wisdom I got will always be helpful in challenges I
face in future.
I would also like to extend my gratitude to Dr. Christopher Eamon and Dr. John Gruber
for serving in my committee and being a good support at all times. As a student in his Finite
Element Analysis class his teaching and material had been helpful in understanding the finite
element techniques used in this project. Dr. Gruber had always been a great support from the
time working as a teaching assistant. His teachings in Advance Reinforced Concrete classes,
his way of relating classroom study with actual field experiences were always helpful in my
formation as a structural engineer.
Finally, I must express my profound gratitude to my father Raja and my mother
Kalaiselvi for providing me with unfailing support, encouragement and fulfilling all my dreams
from childhood till now. Also, I am thankful to my grandfather Ranganathan without his
blessings this accomplishment would not be possible. Last but not the least, my friends who
were another family far from home and you people were great support in all hard times. Thank
you.

iii
TABLE OF CONTENTS
Acknowledgements_________________________________________________________ii
List of Tables______________________________________________________________v
List of Figures_____________________________________________________________vi
Chapter 1 Introduction______________________________________________________1
1.1 A Unique Precast Shape______________________________________________1
1.2 Research Objective and Scope_________________________________________4
Chapter 2 Literature Review_________________________________________________6
2.1 Introduction_______________________________________________________6
2.2 Pretensioning Mechanism____________________________________________6
2.3 Stresses in the End Zones of Prestressed Beam____________________________8
2.4 Finite Element Modelling of Pretension_________________________________19
2.5 AASHTO Specification_____________________________________________22
Chapter 3 Description of Numerical Modelling Protocol__________________________24
3.1 Introduction______________________________________________________24
3.2 Cases Considered__________________________________________________24
3.3 Material Properties_________________________________________________26
3.4 Finite Element Mesh for Concrete Beam________________________________37
3.5 Strands Modelled as Truss Elements___________________________________39
3.6 Strands Modelled as Solid Elements___________________________________41

iv
3.7 Validation of Modelling Protocol_____________________________________45
Chapter 4 Results of Numerical Models________________________________________52
4.1 Response of Non-Linear Models______________________________________52
4.2 Comparison of Response between Linear and Non-Linear Models___________58
Chapter 5 Conclusions and Recommendations_________________________________63
References _______________________________________________________________65
Abstract _________________________________________________________________69
Autobiographical Statement_________________________________________________70

v
LIST OF TABLES
Table 1 :Vertical Reinforcement in Configuration 1-4 used with Precast Members Utilized in
Experimental Study. ................................................................................................................. 18
Table 2: Basic Sectional Properties of a 20 ft. beam: ............................................................. 28
Table 3: Basic Sectional Properties of a 41.5 ft. beam: .......................................................... 28
Table 4: Basic Sectional Properties of a 60 ft beam ............................................................... 28
Table 5: Parameters of Concrete Damage Plasticity ............................................................... 31
Table 6: Concrete Damage Plasticity-Inelastic Behavior ....................................................... 34
Table 7: Tension Behavior of Concrete .................................................................................. 36
Table 8 : Plasticity of Prestressing strand ............................................................................... 37
Table 9 : Comparison of Numerical and Theoretical Results for Precast Beams 20ft, 41.5ft
and 60ft (Strands Modeled as Truss Elements). ...................................................................... 41
Table 10 :Comparison of Numerical and Theoretical Results for Specimen 20ft, 41.5ft and
60ft (Strands Modeled as Solid Elements)............................................................................... 45
Table 11: Comparison of Numerical and Theoretical Results for Specimen 1 through 8
(Strands Modelled as Solid Elements) ..................................................................................... 47

vi
LIST OF FIGURES
Figure 1: Shows the 3-dimensional view of Bridge with Precast Inverted T-beam ................. 3
Figure 2: (a) Isometric View (b) Hoyer's Effect (c) Flow of stresses after release .................. 4
Figure 3: Gergerly-Sozen Equilibrium Model (Gergerly and Sozen, 1967) ............................ 9
Figure 4: Shows cracks that form at release of prestress (Crispino et.al, 2009) ..................... 11
Figure 5: Finite Element Models (a) Extruded Model (b) Embedded Model (Arab, 2012) ... 19
Figure 6: Model used for concrete in tension (Okumus et al., 2012) ..................................... 21
Figure 7: Cross Section of a 20 ft. precast beam (Menkulasi et.al, 2014) .............................. 24
Figure 8: Cross Section of a 41.5ft. precast beam (Menkulasi et.al, 2014) ............................ 25
Figure 9: Cross-Section of a 60 ft. precast beam (Menkulasi et.al, 2014).............................. 25
Figure 10: Shows recession on the precast flanges................................................................. 26
Figure 11: Response of concrete under uniaxial tension (Abaqus, 2016) .............................. 30
Figure 12: Response of concrete under uniaxial compression (Abaqus, 2016) ...................... 31
Figure 13: Stress-Strain curve for Concrete in Compression ................................................. 32
Figure 14: Definition for a Concrete Compression Behavior (Abaqus, 2016) ....................... 33
Figure 15: Stress-Strain Curve of Concrete in Tension based on Collins Model. .................. 35
Figure 16: Definition of Cracking Strain used for Defining Tension Stiffening (Abaqus,
2016) ........................................................................................................................................ 35
Figure 17: Stress-Strain curve for a strand ............................................................................. 37
Figure 18: Typical 3-dimensional 8-node brick element. (Abaqus,2016) .............................. 38
Figure 19: Typical 3-Dimensional 4-node Tetrahedral Element (C3D4) ............................... 39
Figure 20: Finite Element Modeling of a Pretensioned Concrete Members using the
Embedment Technique ............................................................................................................ 40
Figure 21: (a) Shows the typical 60ft beam meshed with Tetrahedral Elements (b) Shows the
concrete-strand interface (c) Shows the modelled 3-D strand. ................................................ 42
Figure 22: Mater Surface Penetration into the Slave Surface of a pure Master-Slave Contact
Pair (Abaqus,2016) .................................................................................................................. 43
Figure 23: Specimens considered for the Model Validation. ................................................. 46

vii
Figure 24: Node Path to Collect Strain Data Along Direction of Strand ............................... 48
Figure 25: Validation of Numerical Modeling Protocol using Tetrahedral elements -
Comparison of numerical and Experimental Results for Specimen 1-8, a) Specimen-1, b)
Specimen -2, c) Specimen -3, d) Specimen-4, e) Specimen-5, f) Specimen-6, g) Specimen-7,
h) Specimen-8. ......................................................................................................................... 49
Figure 26: Typical 60ft beam with C3D4 Tetrahedral element and mesh surrounding the
concrete holes........................................................................................................................... 50
Figure 27: Mesh Sensitivity .................................................................................................... 51
Figure 28: Max-Principal Strain (PE) in 20ft beam (a) Truss Element (b) Solid Element ..... 53
Figure 29: Max-Principal Strain (PE) in 41.5ft beam (a) Truss Element (b) Solid Element. . 55
Figure 30 : Max-Principal Strain (PE) in 60ft (a)Truss Element (b) Solid Element .............. 57
Figure 31: Shows Total Strain (E) in 20ft beam (a) Linear Truss Element (b)Non-Linear
Truss Element (c)Linear Solid Element (d) Non-Linear Solid Element. ................................. 60
Figure 32: Shows Total Strain (E) in 41.5ft beam (a) Linear Truss Element (b)Non-Linear
Truss Element (c)Linear Solid Element (d) Non-Linear Solid Element. ................................. 61
Figure 33: Shows Total Strain (E) in 60ft beam (a) Linear Truss Element (b)Non-Linear
Truss Element (c)Linear Solid Element (d) Non-Linear Solid Element. ................................. 62

1
Chapter 1: Introduction
1.1 A Unique Precast Shape
End regions of prestressed members are subject to high concentrated loads during the
transfer of the prestressing force. Accordingly, the state of stress in these regions is complicated
and cannot be predicted by the Euler-Bernoulli beam theory, in which plane sections are
assumed to remain plane. According to Saint Venant’s principle, the disturbance caused by the
concentrated forces at the ends of the member diminishes after a distance h from the end of the
member, where h is the overall depth of the member. In pre-tensioned concrete members, the
transfer of the prestressing force into the surrounding concrete creates tensile stresses in the
end zones. These stresses are characterized as spalling, splitting and bursting stresses. Spalling
stresses are vertical tensile stresses that occur near the end face at the centroid of the member.
Splitting stresses are circumferential tensile stresses that occur around each individual
prestressing strand along the transfer length and result from the radial compressive stresses
caused by bond. Bursting stresses are vertical tensile stresses that occur along the line of the
prestressing force, beginning a few inches into the member and extending through the transfer
length. When these tensile stresses exceed the modulus of rupture of concrete, cracks form,
which may compromise the shear and flexural strength of the member near that region as well
as its durability.
AASHTO LRFD Specifications (2017) require that reinforcing be provided in pre-
tensioned anchorage zones to resist 4% of the total prestressing force. The specifications also
require that this reinforcing be placed within a distance that is equal to h/4 from the end of the
beam, where h is the overall dimension of the precast member in the direction in which
“splitting” resistance is evaluated. These provisions, incorrectly labelled as splitting provisions,
are intended to resist spalling forces. The value of h and the direction in which the reinforcing

2
required to resist the spalling forces is oriented, depends on the shape of the member. For
example, for pre-tensioned I-girders or bulb tees, h represents the overall depth of the member
and the end zone reinforcing is placed vertically within a distance equal to h/4 from the end of
the member. For pre-tensioned solid or voided slabs, h represents the overall width of the
section and the end zone reinforcing is placed horizontally within h/4. For pre-tensioned box
or tub girders with prestressing strands located in both the bottom flange and the webs, end
zone reinforcing is placed both horizontally and vertically within h/4, where “h” is the lesser
of the overall width or height of the member. Although not specifically addressed in AASHTO
(2017), the confinement requirements of Article 5.10.10.2 should help control the bursting and
splitting stresses that develop in the transfer length region (French et al. 2011). It should be
noted that AASHTO specifications (2017) require that end zone reinforcing be provided in the
vertical plane, horizontal plane or both planes regardless of the geometry of the pre-tensioned
member, the strand pattern or the eccentricity in the plane under consideration.
The research presented herein deals with an investigation of the stresses in the end
zones of precast inverted T-beams with tapered webs. This unique precast shape is intended
for the construction of short to medium span bridges with spans ranging from 20 ft to 60 ft.
The inverted T-beam bridge system is illustrated in Figure 1 and provides an accelerated
bridge construction alternative. It consists of adjacent precast inverted T-beams, which serve
as stay-in-place forms for a cast-in-place concrete topping, thus eliminating the need for site-
installed formwork. This bridge system is intended to address reflective cracking problems
present in composite bridges built with the traditional adjacent voided slab or adjacent box
beam systems (Menkulasi 2014).

3
Figure 1:Shows the 3-dimensional view of Bridge with Precast Inverted T-beam
Because the inverted T-beam system featuring adjacent precast inverted T-beams with
tapered webs and cast-in-place topping is a new bridge system, there is a need to evaluate the
applicability of the current AASHTO (2017) provisions for pre-tensioned anchorage zones.
Because of the unique shape of the cross-section of the precast beam, the diffusion of the
prestressing force will occur in both the vertical and horizontal planes. Menkulasi (2014)
investigated stresses in the end zones of such a uniquely shaped element using linear elastic
finite element modelling. The strands were modelled using two node truss elements.
The purpose of this study is to investigate the magnitude of tensile stresses in the end
zones using nonlinear finite element models that consider concrete plasticity, and the Hoyer
effect, neither of which is captured using linear models and when the strands are modelled as
truss elements. The Hoyer effect and the anticipated distribution of stresses in the end zone is
illustrated in Figure 2. Additionally, the purpose of this study is to determine whether such
sophisticated modelling techniques are required in terms of characterizing the distribution of
stresses in the end zones and determining the areas that need to be reinforced.

4
Figure 2 (a) Isometric View (b) Hoyer's Effect (c) Flow of stresses after release
The purpose of this paper is to quantify normal tensile stresses at the end zones in both
planes and determine whether these stresses are high enough to cause cracking. A series of 3-
D finite element analyses were performed to investigate the magnitude of these tensile stresses.
Various methods of modelling the prestressing force including the modelling of the transfer
length are examined and the effect of notches at the end of the precast beams is explored.
Existing design methods are evaluated and strut and tie models, calibrated to match the results
of 3-D finite element analysis, are proposed as alternatives to existing methods to aid engineers
in sizing reinforcing in the end zones.
1.2 Research Objective and Scope
The objective of this study is to characterize the distribution of stresses in the end zones
of precast inverted T-beams with tapered webs using a variety of modelling techniques ranging
from linear elastic models to nonlinear models that capture the Hoyer effect. Additionally, the
objective of this study is to evaluate the applicability of AASHTO provisions for proportioning
reinforcing in the end zones of such a uniquely shaped member. These objectives are achieved

5
by considering three precast inverted T-beam spans that cover the range of spans that this
bridge system is appropriate for (20 ft to 60 ft). These cases include 20 ft long, 41.5 ft long and
60 ft long precast inverted T-beams. The 41.5 ft long span was selected because the first
application of this bridge system in Virginia featured 41.5 spans and some qualitative data was
collected during the fabrication of the beams. Each beam cross-section is modelled using linear
and nonlinear finite element models to characterize differences in results. Strands are modelled
using truss elements as well as solid elements to study the influence of the Hoyer effect.
Experimental data is used to validate the modelling protocol.

6
Chapter 2 Literature Review
2.1 Introduction
Research on cracks in the end zones of a pretension prestressed concrete beams has
been reported on numerous occasions in past years. Cracks at the end zones are a common
problem in the prestressed concrete regardless of the shape of the girders, whether it is an I-
shape beam, T- beam, Inverted T-beam, or rectangular beam; cracks are observed in them at
the end zones. Cracks are formed at the end zones of prestressed beams due to stresses that
develop at the transfer of prestress. This chapter explains the prestressing mechanism, deals
with a review of previous research on the end zone stresses, and the different finite element
modelling approaches of pretension beams.
2.2 Pretensioning Mechanism
Prestressed pretension concrete involves transfer of stress from the already tensioned
strand. Once the concrete attains its initial compressive strength, the strands are released.
Transfer of prestressing force from the prestressing strand to the concrete depends on the bond
between the strand and the concrete. Bonding depends on three mechanisms: 1) Hoyer’s Effect,
2) Adhesion, 3) Mechanical Interlock.
When the prestressing strands are tensioned, the strand diameter will reduce due to the
material’s Poisson’s ratio. When it is released, it recovers from the lateral contraction and the
strand dilates. Concrete surrounded by the prestressing strand resists this dilation; blocking it
from getting into its original diameter. This constraint creates a normal force over the strand
and a persuading frictional force along the axis. Consequently, the strand at the end of the
member where it is not surrounded by a concrete is free to expand to its original position,
whereas remaining part inside the member is restricted by the surrounding concrete. This
difference in diameter creates a wedging effect and the stresses are transferred from the strand

7
to the concrete. Also, this distance is called transfer length, after the release of strands the
pretension force increases from zero at the end of the member to the maximum targeted stress
at a distance.
Adhesion between the strand and the concrete is due to physical and chemical bonding
between the roughened steel surface and the cementitious concrete surface. Adhesion
contributes to the bond at a negligible magnitude and it fails once the strands slips within the
concrete. Adhesion fails when stresses at the interface between the both surfaces reach a critical
value and slippage of the strands within the concrete will be initiated along the interface. Once
the adhesion fails, the load transfer relies on Hoyer’s effect and the mechanical interlock.
Hence, adhesion can be neglected while analyzing the bond strength on the set of slippages.
Low-relaxation seven wire prestressing strand has a helical shape and when the
concrete is cast around the strand; it matches the shape of the strand. When the twisted strand
is released, it slips with the hardened concrete host due to its helical formulation. This
mechanism is resisted by the hardened concrete, creating a non-uniform stress at the interface
of concrete and the strand.
Transfer of prestress into the concrete, also creates three tensile stresses as mentioned
in the previous chapter. Bursting stresses are vertical tensile stresses that develop a few inches
from the end of the member, spread along the line of prestressing force and extends through its
transfer length. Spalling stresses are vertical tensile stresses that occur at the centroid of the
member in the end region. Splitting stresses are circumferential tensile stresses, which occur
around the circumference of the hole; caused by the radial expansion of the prestressing strands
due to the Hoyer’s Effect.

8
2.3 Stresses in the End Zones of Prestressed Beam
Marshall and Mattock (1962), found that horizontal end cracks occur because of the
high tensile stresses developed at the end face. Mostly, the maximum tensile stresses develop
at the centroidal axis. Their work shows that providing end blocks at the end of the member
does not reduce the development of the cracks. Additionally, providing adequate amounts of
vertical reinforcement can reduce the amount of development of horizontal end cracks.
Series of I-shaped beams were tested in the laboratory with and without vertical
reinforcement, results obtained were used to develop an empirical formula (see Eq. 1) for
designing the end zone reinforcement for prestressed concrete beams.
𝐴𝑡 = 0.021 [(
𝑇
𝑓𝑠) . (
ℎ
𝑙𝑡)]
(1)
Where,
T = total prestress force (kips).
𝑙𝑡= transfer length (in).
h= depth of the member (in).
𝑓𝑠= ultimate stress of stirrups (ksi).
The result suggests that vertical reinforcement must be placed closely as possible to the
end of the member. So, it will increase the service life of the member by reducing the crack
width and the length.
Gergely and Sozen (1967) analyzed the equilibrium conditions of the cracked end
zones; after the release of pretension using a linear-elastic approach. Investigation was on an
equilibrium of the free body bounded by a crack to estimate the internal forces. The forces
acting on the free body is shown in Figure 3 where, c represents the distance from a crack to

9
bottom of the beam, e represents the distance between the applied load and bottom of the beam
and P is the applied force that creates a linear stress distribution at a distance L from the end.
Figure 3: Gergerly-Sozen Equilibrium Model (Gergerly and Sozen, 1967)
Moment and shear force must be acting on the top of the beam to maintain the
equilibrium. The moment is supplied by the tension force T in the reinforcement and by the
compression force C in the concrete. The mathematically derived equation for a moment is as
follows:
𝑀 = 𝑃 [𝐶 − 𝑒 − (
𝑐
ℎ)
2
(2ℎ − 3𝑒 − 𝑐 +2𝑒𝑐
ℎ)]
(2)
This moment equation changes with the height of the free body diagram c, and gives
extreme values for c,
𝑐1 =
ℎ2
3(ℎ − 2𝑒)
(3)
𝑐2 = ℎ (4)

10
Maximum moment along the height of the member can be found from the eq. (5).
𝑀𝑚𝑎𝑥 = 𝑃 [
ℎ2
27
4ℎ − 9𝑒
(ℎ − 2𝑒)2− 𝑒]
(5)
Eq. (6) leads to zero moment on the top surface and a maximum moment may occur along the line of
pretension and that maximum moment can be obtained when e=c:
𝑀𝑚𝑎𝑥,𝑒 = 2𝑃
𝑒2
ℎ3 (ℎ − 𝑒)2
(6)
Taun et al. (2004) conducted a study to evaluate the applicability of various theories
and methods for the design of end zone reinforcement. A semi-empirical design procedure was
introduced, based on the theoretical and the experimental results. Thus, the splitting
reinforcement is calculated for a force equal to 4 percent of the total prestressing force. At least
50 percent of that reinforcement should be placed a distance h/8 from the end of the beam. The
remaining steel should be placed between h/8 to h/2 from the end. Beyond h/2, the splitting
reinforcement should not be needed and the shear reinforcement if needed, should be placed.
The proposed procedure requires the same amount of splitting reinforcement as AASHTO
LRFD Specifications.
Belhadj and Bahai (2000) studied the movement of high tensile strength, smooth
prestressing bars after release. Time history signals of the load and axial strain in the bar were
recorded and analyzed using a computer software. The finite element simulations were carried
out. The release of smooth bars cast in small volumes of grout, showed that the stress waves
travelled along the specimen. The dynamic debonding of the bars progressed along the
interface of the bar and the grout with small disturbances caused by frictional resistance. Low
bond characteristics and the Poisson’s effect were big enough to induce cracking in the
surrounding grout. Despite of cracking, the friction-slip mechanism and resistance by friction

11
were the main reasons for limited movement of the bar. Thus, a friction slip mechanism plays
an important role in restraining the bar movement.
Crispino et. al (2009) performed a research on the anchorage zone of the precast bulb-
T beams. Most of the cracks were developed within the anchorage zone region of the beams.
The range of these cracks were from acceptable to poor and they required patching up. Figure
4 shows the crack pattern in the precast bulb-T anchorage zones. Horizontal cracks that
developed at the intersection of the bottom flange and the web were common. Diagonal cracks
were developed at the upper portion of the web. Cracks shown in Figure 4 occur at the time of
prestress release.
Figure 4: Shows cracks that form at release of prestress (Crispino et.al, 2009)
Diagonal cracks were formed due to self-weight; while lifting beam for transportation.
The two main objectives of their research were, to reduce the anchorage zone cracking and to
verify the strut-tie model by Davis et. al (2005) for the anchorage zone design. To develop a
simplified approach for the anchorage zone design for the precast bulb-T girders, two
parametric studies were performed. The first one included the beams cast with normal weight
concrete and other were the beams with light weight concrete. New standards were also
developed for the Virginia Department of Transportation and to use in conjunction with the

12
design tables. The results from the parametric study were used to form the design tables for the
anchorage zone. The anchorage zone is the area h/4 from the end of the member, where h is
the depth of the member. These design tables include, stirrups area for a concrete type, strand
type, and cross section of the precast beams.
Anchorage zone has been split into two regions: one from the end of the member to h/4,
and next region is from h/4 to 3h/4. Beyond 3h/4, the stirrups must be placed as needed by the
horizontal or vertical shear.
The design tables give the required stirrup area for the two anchorage regions from the
end of beam to h/4 and from h/4 to 3h/4 respectively. They also give, the number of stirrups,
size of stirrups, and stirrups spacing for respective anchorage zones. Crispiano et.al (2009)
concluded that, a typical precast bulb-T would require more area of reinforcement within h/4
than the current requirements; regardless of whether the light weight or normal weight concrete
is used. For the area between h/4 to 3h/4, the area of reinforcement required is always less than
that required within h/4. Also, a significant tensile force is found between h/4 to 3h/4 which
suggests that the area affected by prestress force is longer than h/4 and therefore this area should
be considered in anchorage zone design.
Mirza and Tawfik (1978) confirmed the hypothesis that end cracks developed during
pretensioning operations were caused by tensile stresses induced in the concrete, by the
restraining effect of the unreleased tendons. A mathematical model was proposed to find the
strains in the unbonded tendons during the detensioning process. The accuracy of the model
was verified with the field measurements containing tendon strains. It has been experimentally
and theoretically shown that the restraining effect of the unreleased tendons can cause cracks
near the end zones. This study also indicates the desirability of detensioning scheme, where the
tendons at the ends are released first and then the interior tendons. This study also showed that

13
the tension stress due to the tendon restraint will usually be below the cracking value if each
end tendon is longer than the 5 percent of the bed length.
Callaghan and Bayrak (2008) performed an experimental investigation to find the
causes of the end region cracks and to optimize the reinforcements at the end regions to reduce
the widths of the cracks in the pretensioned-I girders. The results of the specimens tested in the
study showed that the magnitude of the spalling stresses increased as the eccentricity of the
prestressing force increased. The quantity and length of the cracks also increased with the
increased eccentricity. On the other hand, eccentricity of the prestressing force had no effect
on the bursting stress, which is related to the amount of prestressing force applied and the
transfer length. Straight bars were used in this research for the bursting and the spalling
reinforcement. The magnitude of stresses measured in the transverse reinforcement bars were
less than half of its yield strength. Therefore, it is recommended to use additional straight bars
to reduce the magnitude of stress induced in the shear reinforcement.
Kannel et al. (1997) researched on the release methodology of the strands in the
pretensioned concrete girders to reduce the end zone cracking. Different methods were
examined to reduce the cracks, including the strand cutting pattern, debonding some of the
strands in the end regions, and increasing the slope of the top surface of a bottom flange.
Reasons for the development of the cracks during the flame cutting process, include restraining
effect of the unreleased strands; as the girders shortened from the partially transferred prestress
force and the shear stresses generated from the cutting order of the strands. The results show
that consideration should be given to cutting the longest free span first (end spans) to preclude
the chance of cutting the shortest free span first. So, it can reduce the tensile stresses developed
in the girders. Increasing the slope of the flange over a distance 18 in. from the end, reduces
the chances for horizontal cracking at the bottom of the flange-web interface.

14
In 1984, Sarles and Itani investigated the effects on the stresses at the transfer zone with
and without the end blocks. Finite element analysis was done on the I-beams with rectangular
end blocks, without end blocks, end block with a transition length equal to the length of the
end block, and end block with a transition length equal to twice the length of the end block.
Analysis were done on the post-tension and the pretension beams. The transverse tensile
stresses were computed, and the comparison were made among the results. Tensile stresses
were reduced to a smaller amount in the concentrically loaded members due to the presence of
end blocks. For eccentrically loaded members, the presence of end blocks does not have a
major advantage but can help with the congestion of the reinforcement.
Greene and Graybeal (2008) performed a research on the use of lightweight high-
performance concrete (LWHPC) girders in the highway bridges. Investigation was done in
various dimensions such as, finding the performance of LWHPC produced using aggregates
found in North America, examining the transfer length, development length and shear strength
of the precast LWHPC members, and investigating the prestress losses in the LWHPC girders.
One within our scope of study is discussed here. Transfer length was tested from the girders
that were precast using three different mix designs. Theoretical calculation of the transfer
length was done using different equations that were previously found, including the AASHTO
LRFD Specifications and ACI 318-08. The strain data were collected from the experimental
analysis. The measured and predicted transfer lengths were compared with each other. The
transfer length predicted using the equations suggested by the previous researches, AASHTO
LRFD Specifications and ACI 318 Code were found to be conservative.
Hegger et al. (2007) experimented on the structural behavior of prestressed members,
made from the Self-Consolidating Concrete (SCC). Tests on the bond strength and shear
capacity were performed on the members. The results of the analyses on the bond behavior of
prestressed strand in SCC showed a similar behavior of the prestressed strands in the High

15
Strength Concrete (HSC). Additionally, the current calculations for transfer length can be used
for SCC, though they are derived for normal strength concrete and high strength concrete. The
bond strength depends on the mixture of components.
Bai and Davidson (2016) developed a composite beam theory for the pretensioned
concrete structures. This theory defines the longitudinal interaction that occurs between the
prestressing tendon and the concrete under normal service conditions. The transfer length, the
elastic shortening losses and the prestress gain due to the external loads were predicted using
the current theories. Validation and comparisons were made between the findings and the
conventional approaches. The transfer length comparisons showed that the current provisions
are consistently close to the upper bound predicted from this study. The elastic shortening
losses were found to be overestimated by the conventional gross section approach in the PCI
design Handbook, AASHTO-LRFD Specifications, ACI-318, and the degree of overestimation
depends on the eccentricity of the tendon. It was demonstrated analytically that the gross
section approach is higher for the larger reinforcement ratio (𝐴𝑠𝐸𝑠)
(𝐴𝑐𝐸𝑐)⁄ components,
whereas formulation derived in this study (Eq.7) was more reasonable.
𝑃𝑒𝑓𝑓−𝐸𝑆 =
𝛽𝐵2𝐴𝑐𝐸𝑐
𝐴𝑠𝐸𝑠 + 𝐴𝑐𝐸𝑐
(7)
Where,
𝛽𝐵2 = 1 − 𝛼𝐵
2 ; 𝛼𝐵2= 𝑒2𝜂 𝐷𝐵⁄ ; 𝐷𝐵 = 𝐸𝑐𝐼𝑐 + 𝑒2𝜂 ; 𝜂 =
𝐴𝑐𝐸𝑐𝐴𝑠𝐸𝑠
(𝐴𝑐𝐸𝑐+𝐴𝑠𝐸𝑠)
e =Distance from the concrete beam centroid to tendon centroid (in).
𝐸𝑐=Concrete elastic modulus (ksi).
𝐸𝑠 =Prestressing tendon elastic modulus (ksi)
𝐴𝑐=Cross sectional area of concrete (𝑖𝑛2).

16
𝐼𝑐=Concrete beam moment of inertia (𝑖𝑛4).
Overall, it is demonstrated that the approach presented in this paper improves accuracy
and facilitates a better understanding of the prestressed concrete mechanics while maintaining
a concise closed form solution.
Tadros et al. (2010) performed a research to establish a user’s manual for the
acceptance, repair, or rejection of the precast/prestressed concrete girders with longitudinal
web cracking. Based on the work and results, a new user’s manual was developed for the
acceptance criteria, and repair methods for the prestressed concrete girders experiencing an end
zone cracking due to transfer of a pretension force. The manual consists of four criteria,
depending on the crack width. For the first criteria, no repair is recommended for the crack
width less than 0.012 in. When the crack width is from 0.012 in. to 0.025 in. then it is
recommended that the cracks are to be filled with a cementitious packing material and then
covered with a water-resistant surface. When the crack widths are from 0.025 in. to 0.050 in.,
the epoxy injection is recommended and filled with a cementitious packing material. Last
criterion is for the cracks greater than 0.050 in., where rejection of the girder is recommended;
until it can be shown that the structural capacity and long-term durability are not compromised.
Arancibia and Okumus (2017) investigated on the cracks that develop in the flanges
and webs of adjacent double-t beams during the release of prestress. The causes for flange
cracks were investigated using a non-linear finite element analysis. The end zone concrete
stresses created due to the prestress transfer were not high enough to cause cracks in the flanges.
This result contradicts the behavior of end zone stresses in the bulb-t beams. Skew causes a
differential camber between the stems of the beam that leads to torsion and transverse bending
at the ends. This is the largest contributor to the end cracks when the beams are restrained by a
formwork. Skew causes a much higher stresses in the flange bottom-face than the stresses in

17
the flange top-face. The uneven seating and restraint formwork are the main contributors to
cracking. So, increasing the flexibility of supports during casting, transportation or flange
cutouts are recommended to control the cracking.
Dang et al. (2014) analyzed the distribution of bond stress for a prestressing strand. A
new standard test was developed to assess the bonding capacity of strand with the surrounding
concrete. Test data were used to propose a bond stress-slip model and to investigate the bond
stress distribution. The experimental and analytical results proved that the proposed bond slip
model can estimate the relationship of the bond stress and slip of prestressing strand with 2%
error. Investigation on the bond stress distribution showed that, along the embedment length
the stress is not uniform. It increases from the free end to the loaded end of the prestressing
strand. Therefore, identifying the shape of stress distribution and computing the value of bond
stresses are vital for estimating the anchor length of prestressing strand.
Galvez et al. (2009) performed a study on the splitting failure in prestressed concrete
beams after release. Different factors that influence the splitting failure in the concrete were
examined. The results showed that the splitting failure was observed on specimens with the
thinnest concrete cover. Beams with the deepest depth of strand showed the best bond between
the strand and concrete. Also, a deeper strand indentation leads to a higher splitting stress.
French et al. did an evaluation to determine the magnitude and location of the spalling
and bursting stresses in the end region of a precast inverted T-section. Finite element model of
2-dimensional rectangular slab with the linear elastic material properties was modelled. The
magnitude of spalling stresses and distribution were depended on many factors. Importantly it
depends on the eccentricity and the height of the member. When eccentricity increases, the
magnitude of spalling stresses also increases and extends further into the precast beam. With
bursting stresses, the magnitude and location were affected by the eccentricity, transfer length

18
and height of the member. As member height increases, the magnitude and length over which
bursting stress acts also increases. Various steel configurations were used in the experimental
study. These configurations are shown in Table 1.
Table 1 :Vertical Reinforcement in Configuration 1-4 used with Precast Members Utilized in
Experimental Study.
Results from the experimental study is obtained by testing a 12 in. deep precast beam
with various steel configurations. The results showed that no cracking at the end regions of the
precast members, even for the beams with no end zone reinforcement. Therefore, the beams
had sufficient strength to resists the vertical tensile stresses that develop at the release of
pretension force. Conclusion was made as the depth of the beam increase it also increases the
spalling stresses. Additionally, the steel to resists the vertical tensile stress has to be placed as
close as possible from the end of the beam.

19
2.4 Finite Element Modelling Approaches of Pretensioned Concrete Beams
Arab et al. (2011) studied a methodological approach for the finite element simulation
of the pretensioned concrete members. The finite element models were divided into two
categories: 1) concentrically pretensioned 2) eccentrically pretensioned. Two approaches were
examined for finite element modeling of the pretensioned concrete specimens such as the
embedded technique and extrusion technique. The extrusion technique uses the friction-based
contact simulations. The extrusion technique gives an equivalent response to an embedded
technique that being computationally less expensive. Figure 5 shows the finite element models
of both the embedded and extruded techniques. The validity of the finite element models was
verified by the comparative analysis of analytical data against the experimental findings.
Figure 5: Finite Element Models (a) Extruded Model (b) Embedded Model (Arab, 2012)
The results showed that both the embedded technique and extruded models are
workable to model the pretensioning mechanism. The embedment technique provides an
accurate and numerically efficient results compared to the extrusion technique. The extrusion
technique is computationally more expensive than the embedded model. It provides an
information corresponding to the regions located immediately around the prestressing strands,
including the concrete-strand interface and bond slippage. It depends on the objective of an

20
analysis, whether to choose an embedded or extruded model. Additional conclusion was made
that improper calculation of the material non-linearity will lead to inaccurate results
Okumus et al. (2012) investigated to identify the input parameters and the modelling
features that have a significant effect on the non-linear finite element analyses for the
prestressed concrete girders. The tensile strength of concrete, the bond properties between the
concrete and the strand, different forms of transferring a prestress force to the concrete and its
effects on the results were evaluated. The available experimental test data were used to verify
the modeling techniques. Once verified, the modelling techniques were used to model the
girders in which significant cracking was found. The effect of the end zone reinforcement bars
on an intention to control the crack width was examined. The linear models do not capture the
loss of stiffness in concrete once it undergoes cracking and it underestimates the concrete
strains. Even though the linear models have less computational time, it under calculates the
stresses acting in the rebar, which is transferred from the concrete to steel after the concrete
undergoes cracking. Therefore, it is important to model the non-linearity to capture cracking.
Post cracking stages of the concrete are defined using the fracture energy. Fracture energy is
found by eq. 8.
𝐺𝑓 = 73. 𝑓𝑐𝑚0.18
(8)
The correct prediction of a fracture energy for concrete tension behavior is important
as it can reduce an error in the calculation of rebar stresses. Constitutive model for the concrete
in tension is shown in Figure 6.

21
Figure 6: Model used for concrete in tension (Okumus et al., 2012)
Both linear tetrahedral (C3D4) and quadratic tetrahedral (C3D10) elements were tested
with the test data. C3D4 tetrahedral elements predicted the stresses that match the test results
closely. Therefore, these elements are recommended for the modeling a non-linear plastic
problem.
Llau et al. (2016) proposed a new approach for modelling the 1D steel inclusions within
a 3D concrete domain. Approach included in this study is called “1D-3D”, generates an
equivalent volume from a 1D mesh reinforcements. The stresses and stiffness associated with
the newly created volume and the relationship with the 3D concrete elements are defined using
a kinematic relation at the nodal displacements. The results were validated with two cases of a
civil engineering applications. Results of the first case with the curved prestressed concrete
volume shows, it avoids the stress concentration that is seen with 1D modelling approaches.
On the second validation comparing it with explicit 3D modelling, it reproduces both the local
effects and the structural behavior. Particularly, it captures the local effects that is responsible
for an initiation and propagation of damage. Thus, the new approach combines the
computational efficiency of a 1D approach and rich kinematics of a full 3D approaches in one
single modelling.

22
Menkulasi et al. (2014) investigated the stresses in the end zones of precast inverted T-
beams with tapered webs. Vertical and horizontal tensile stresses were created in the end zones
while transferring the prestress into the member. Investigation was done on these stresses using
the finite element analyses. Three different spans were considered for this study (20ft, 41.5ft
and 60ft). In the vertical plane, it was found that precast inverted T-beams with depth less than
or equal to 18 in. did not experience the stresses that were greater than the modulus of rupture
of the concrete. Therefore, application of the AASHTO provisions was found to be
conservative and the end zone reinforcement should be placed over a distance of h/4 from the
end of the beam where, h is the depth of the section. For the beams greater than 18 in. depth
were also applicable for the AASHTO provisions of the end zone reinforcement and it was
found to be conservative. In the horizontal plane, the bursting stresses did not exceed the
modulus of rupture in any cases. The application of AASHTO provisions were found
conservative. Also, as per the AASHTO LRFD Specifications confinement steel should be
provided for a distance of 1.5d from the end of the member. Additionally, the straight transverse
bars must be placed in the flanges to resist the transverses bending moments due to live loads.
Various methods for applying the prestress force to the finite element models and the effect of
notches at the ends were examined. Modelling the prestressing strands with an incrementally
varying cross-sectional area was found more realistic than the other modelling techniques.
Presence of notches at the end zones were found reducing the vulnerability of cracking at the
intersection between the precast flange and the precast web.
2.5 AASHTO LRFD Specifications
According to article 5.10.10.1 of AASHTO LRFD states splitting resistance of a
pretensioned anchorage zones provided by the reinforcement in the ends of the pretensioned
beams shall be taken as:

23
𝑃𝑟 = 𝑓𝑠𝐴𝑠
(9)
Where,
𝑓𝑠 = stress in the steel not to exceed 20 ksi.
𝐴𝑠 = total area of reinforcement located within the distance h/4 from the end of the beam (𝑖𝑛2).
h= overall dimension of precast member in the direction in which splitting resistance is being
evaluated (in).
To resists the cracks that form at the end zones of precast beams, AASHTO LRFD
Specifications suggests 4% of the total prestressing force at transfer should be used to calculate
the amount of reinforcing provided at the end zones. Adding to it, they suggest this calculated
reinforcing should be placed at a distance of h/4 from the end of the beam, where h is the total
depth of the beam. These reinforcements are used to resist the spalling stress at the end zone.
The value for “h” and direction on which it must be placed depends on the shape of the member.
For pretensioned I-girders, h represents the overall depth of the member and reinforcement has
to be placed in the vertical direction. For pretensioned voided slabs, h represents overall width
of the member and it must be placed in horizontal direction. For pretensioned box girders, h
represents the lesser of overall width or depth and reinforcement is placed in both the vertical
and the horizontal direction. Regardless of geometry of the member, strand pattern and
eccentricity, AASHTO LRFD Specifications require that the end zone reinforcing is to be
provided in the vertical, horizontal or both the planes as close to the end of the beam as
practicable. According to article 5.10.10.2 of AASHTO LRFD Specifications, confinement
steel has to be placed for a distance of 1.5d from the end of the precast member other than box
beams. The reinforcement shall not be less than the No.3 deformed bars, with a spacing not
exceeding 6.0 in. and it is shaped to enclose the strands.

24
Chapter 3: Description of Numerical Modeling Protocol
3.1 Introduction
This chapter discusses the different cases that were considered as part of this research,
and various methods used in the finite element modelling. All finite element models were
created using the commercially available software Abaqus (Abaqus, 2016). The results
obtained from the finite element models were verified with the experimental and theoretical
findings. The validated modeling protocol was then used to model the actual beams that were
considered in this study.
3.2 Cases Considered
To investigate the stresses in the end zones, precast inverted T-beams of three different
spans (20 ft., 41.5 ft., 60 ft.) were considered. The configuration of all the three beams were
found from the preliminary work performed by Menkulasi et al. (2014). First beam is 20 ft.
span with 72 in. width and 14 in. depth from top till bottom of the flange. It consists of 14
0.5 in. diameter strands that were placed at 2 in. from the soffit of a beam. Eccentricity of
the prestressing force is 1.47 in. It can be seen in Figure 7 that shows the arrangement of
the strands.
Figure 7: Cross Section of a 20 ft. precast beam (Menkulasi et.al, 2014)

25
The second beam is 41.5 ft. span beam with 72 in. width and total depth of 18 in. It has
26 strands with 0.6 in. diameter that is arranged as 24 strands at bottom and 2 strands at the
top as shown in the Figure 8. The eccentricity of the prestressing force is 2.99 in. The third
section is a span of 60 ft beam with 72 in. width and depth of 24 in. It has a total of 48
strands of 0.6 in. diameter strands with 42 at bottom and 6 at top as shown in Figure 9. The
eccentricity of prestressing force is 3.94 in.
Figure 8: Cross Section of a 41.5ft. precast beam (Menkulasi et.al, 2014)
Figure 9 : Cross-Section of a 60 ft. precast beam (Menkulasi et.al, 2014)
All the beams mentioned above consists of the strands and stirrup configuration as
proposed by Menkulasi et al. (2004) as seen in Figure 7, Figure 8, Figure 9. The extended
stirrups from the top of the web are for composite action with cast in place concrete. Transverse
26
steel is provided past the flange cut to resist the wet weight of the cast in place concrete and
the transverse bending due to live loads. Both the extended stirrups and confinement steel resist
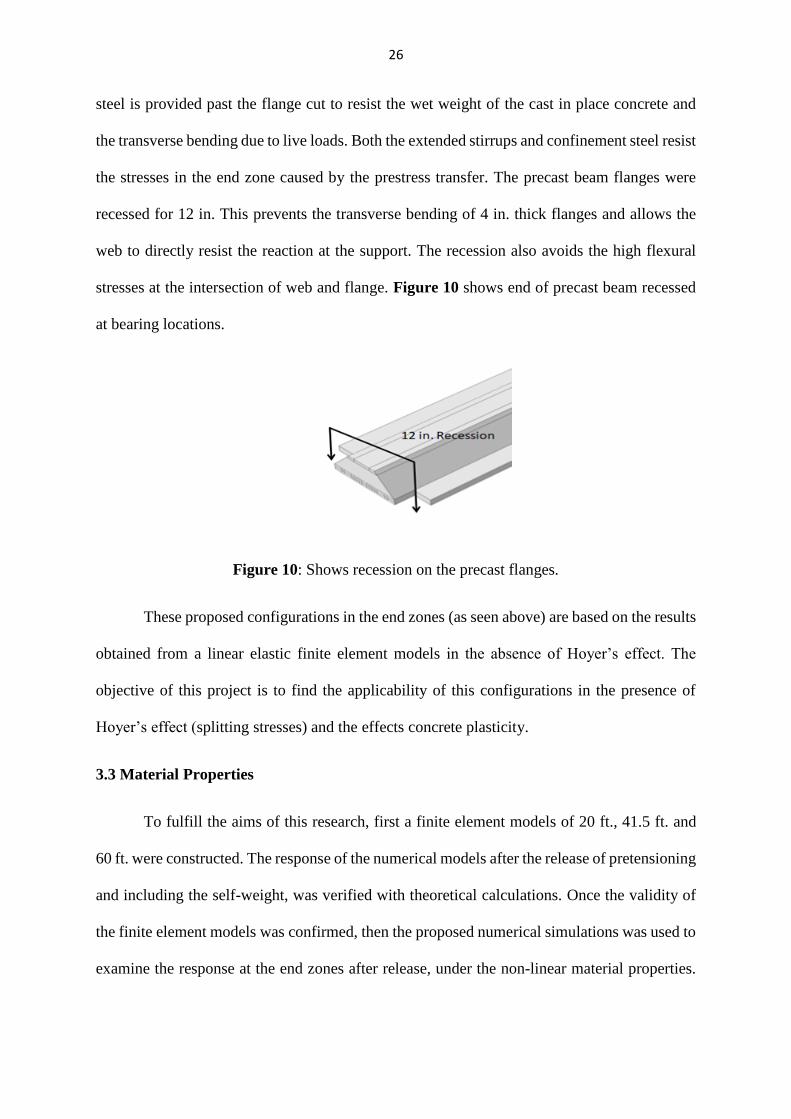
the stresses in the end zone caused by the prestress transfer. The precast beam flanges were
recessed for 12 in. This prevents the transverse bending of 4 in. thick flanges and allows the
web to directly resist the reaction at the support. The recession also avoids the high flexural
stresses at the intersection of web and flange. Figure 10 shows end of precast beam recessed
at bearing locations.
Figure 10: Shows recession on the precast flanges.
These proposed configurations in the end zones (as seen above) are based on the results
obtained from a linear elastic finite element models in the absence of Hoyer’s effect. The
objective of this project is to find the applicability of this configurations in the presence of
Hoyer’s effect (splitting stresses) and the effects concrete plasticity.
3.3 Material Properties
To fulfill the aims of this research, first a finite element models of 20 ft., 41.5 ft. and
60 ft. were constructed. The response of the numerical models after the release of pretensioning
and including the self-weight, was verified with theoretical calculations. Once the validity of
the finite element models was confirmed, then the proposed numerical simulations was used to
examine the response at the end zones after release, under the non-linear material properties.

27
This section discusses about the material properties considered and how the commercial
software conceives given data and applies it to numerical models.
The considered cases assume the concrete compressive strength at release of
pretensioning is equal to 𝑓′𝑐 =5 ksi. As per AASHTO LRFD Specifications, the calculated
modulus of elasticity of concrete at transfer is 4287 ksi. Poisson’s Ratio was 0.2 as per
AASHTO LRFD Specifications. In accordance to the preliminary work presented by
Menkulasi et al. (2014), 0.6 in. diameter low relaxation, seven wire strands were required for
pretensioning 41.5 ft. and 60 ft. beams, 0.5 in. for a 20 ft. beam. The following were the basic
properties of the prestressing strand used in this study:
𝐴𝑝 = 0.153 (𝑖𝑛2)……………….…………………….... Area of one 1/2 –in diameter
prestressing strand.
𝐴𝑝 = 0.217 (𝑖𝑛2)………………………………. Area of 0.6 in diameter prestressing
strand.
Ultimate tensile strength of the prestressing strand is equal to 𝑓𝑝𝑢 = 270,000 psi.
Modulus of elasticity of the strands 𝐸𝑝= 28,500 ksi. Poisson’s ratio of the strand was 0.3. The
jacking stress of the low relaxation strand equal to 𝑓𝑝𝑗= 75% of 𝑓𝑝𝑢 = 202.5 ksi. The basic
sectional properties of the beams 20 ft., 41.5 ft., and 60 ft. are given below in Table 2, Table
3, and Table 4 respectively.

28
Table 2: Basic Sectional Properties of a 20 ft. beam:
Cross-Sectional area (𝐴𝑐) 460 𝑖𝑛2
Weight of the member (w) 479 lbs/ft
Moment inertia about the centroid of the member (I) 2282.44 𝑖𝑛4
Distance from the extreme bottom fiber to the centroid of the
member(𝑦𝑏)
3.47 in
Distance from the extreme top fiber to the centroid of the
member(𝑦𝑡)
4.53 in
Section modulus for the extreme bottom fiber (𝑠𝑏) 657.76 𝑖𝑛3
Section modulus for the extreme top fiber (𝑠𝑡) 503.84 𝑖𝑛3
Table 3: Basic Sectional Properties of a 41.5 ft. beam:
Cross-Sectional area (𝐴𝑐) 757 𝑖𝑛2
Weight of the member (w) 788 lbs/ft
Moment inertia about the centroid of the member (I) 23338.02 𝑖𝑛4
Distance from the extreme bottom fiber to the centroid of the
member(𝑦𝑏)
6.9 in
Distance from the extreme top fiber to the centroid of the
member(𝑦𝑡)
11.01 in
Section modulus for the extreme bottom fiber (𝑠𝑏) 3338.77 𝑖𝑛3
Section modulus for the extreme top fiber (𝑠𝑡) 2119.71 𝑖𝑛3
Table 4: Basic Sectional Properties of a 60 ft beam
Cross-Sectional area (𝐴𝑐) 1044 𝑖𝑛2
Weight of the member (w) 1087.5 lbs/ft
Moment inertia about the centroid of the member (I) 46231.43 𝑖𝑛4
Distance from the extreme bottom fiber to the centroid of the
member(𝑦𝑏)
9.31 in
Distance from the extreme top fiber to the centroid of the
member(𝑦𝑡)
14.69 in
Section modulus for the extreme bottom fiber (𝑠𝑏) 4965.78 𝑖𝑛3
Section modulus for the extreme top fiber (𝑠𝑡) 3147.13 𝑖𝑛3

29
The response of concrete after cracking is captured by the Concrete Damage Plasticity
(CDP) model. This Concrete Damage Plasticity (CDP) model can be used for modeling the
concrete and other quasi-brittle materials that are subjected to cyclic, and/or dynamic loading
under low confining pressure. It uses the concept of isotropic damaged elasticity in
combination with the isotropic tensile and the compression plasticity. Under low confining
pressure, the concrete failure mechanisms are cracking in tension and crushing in compression.
On the other hand, when the confining pressure is high it prevents the brittle behavior of the
concrete and prevents crack propagation. The failure mechanisms at this case, with higher
confining pressure are collapse of microstructure of the concrete and this response resembles
the failure of the ductile materials. CDP model aims to capture the effects of irreversible
damage associated with the failure mechanisms that occur in the concrete. These effects have
certain macroscopic properties (Abaqus,2016):
1. Different yield strength in tension and compression.
2. Tensile failure is characterized with softening behavior.
3. Degradation of the elastic stiffness is different under tension and compression.
4. Mechanical properties are rate sensitive.
The plasticity-damage model used in Abaqus is based on the models proposed by Lubline et
al. (1989) and by Lee and Fenves (1998).
The finite element model for the concrete is made up of continuum elements with
plasticity material properties. The non-linear material properties assume two failure
mechanisms such as tensile cracking and compressive crushing of the concrete material. Failure
surface is controlled by the two hardening variables 𝜀𝑡𝑝𝑙 and 𝜀𝑐
𝑝𝑙 associated with the failure
mechanics under tension and compression loading. In that 𝜀𝑡𝑝𝑙 refers to the tensile plastic
strains and 𝜀𝑐𝑝𝑙 refers to the compressive plastic strains. The model will assume that the

30
uniaxial tensile and compressive response on the concrete is characterized by the damage
plasticity as shown in the Figure 11 and Figure 12 respectively. The stress-strain relationship
under the uniaxial tension follows a linear elastic relationship until it reaches the value of
failure stress 𝜎𝑡0 (see Figure 11). The failure stress corresponds to the onset of micro-cracking
in the concrete material. Beyond the failure stress the formation of micro-cracks are represented
macroscopically with softening the stress-strain response that induces the strain localization in
the concrete structure. (Abaqus, 2016)
Figure 11: Response of concrete under uniaxial tension (Abaqus, 2016)
Under uniaxial compression the response of the concrete material is linear till the initial
yield, 𝜎𝑐0. On the plasticity side, the response is typically characterized by the stress hardening
followed by strain softening beyond the ultimate stress, 𝜎𝑐𝑢(See Figure 12). This simplified
representation captures the main features of the concrete response. (Abaqus, 2016)

31
Figure 12: Response of concrete under uniaxial compression (Abaqus, 2016)
Table 5 includes the elastoplastic parameters used in the numerical simulation
(Burgueno and Sun,2014). Along with these parameters the compression and tension behavior
of the concrete need to be included in the finite element model.
Table 5: Parameters of Concrete Damage Plasticity
Parameter Value
Dilation Angle 37
Eccentricity 0.1 𝜎𝑏0
𝜎𝑐0 1.16
K 0.667
Viscosity Parameter 0.005
Note: K= ratio of second stress invariant on the tensile meridian to that on the compressive
meridian at initial yield for any given value of the pressure invariant such that the maximum
principal stress is negative
𝜎𝑏0
𝜎𝑐0 = ratio of initial equibiaxial compressive yield stress to the initial uniaxial compressive
yield stress.
Stress-strain data were developed using Hognestad model (1951) for the concrete with
initial compressive stress of 5000 psi at release. Calibration of concrete for uniaxial
compression was done by testing 3 by 6in concrete cylinders and it produced a generalized

32
equation (Eq.10) that is used widely to calculate the non-linearity for different concrete
strengths. Eq. 10 is used to obtain the full stress-strain curve for the concrete in compression
as shown in the Figure 13.
𝒇𝒄 = 𝒇′𝒄 ⌊(
𝟐𝜺𝒄
𝜺𝟎) − (
𝜺𝒄
𝜺𝟎)
𝟐
⌋
(10)
Where,
𝜀0 = Corresponding strain to peak stress. (in in⁄ )
εc = Concrete strain values. (in in⁄ )
fc = Stress corresponding to concrete strain εc (ksi)
f′c = Ultimate stress of concrete.(ksi)
Figure 13: Stress-Strain curve for Concrete in Compression
The stress-strain behavior of concrete outside the elastic range can be defined
under “compression behavior” in the software. The compressive stress data are provided as a
tabular function of inelastic strain, 𝜀𝑐𝑖𝑛 and the values should be positive for both the
compressive stress and the strain. The curve can be defined beyond the ultimate stress, the
strain-softening regime. Hardening data are given in terms of an inelastic strain, 𝜀𝑐𝑖𝑛. The

33
compressive inelastic strain is defined as the total strain minus the elastic strain corresponding
to the undamaged material, eq.(11) and illustrated in Figure 14. (Abaqus, 2016).
Table 6 shows the stress and corresponding plastic strain values calculated for the finite
element modeling.
εcin = εc − ε0c
el
(11)
Where,
𝜀0𝑐𝑒𝑙 =
𝜎𝑐𝐸0
⁄ .
Figure 14: Definition for a Concrete Compression Behavior (Abaqus, 2016)

34
Table 6: Concrete Damage Plasticity-Inelastic Behavior
Concrete Damage Plasticity
Stress
(ksi)
Crushing Strain
(in/in)
Stress
(ksi)
Crushing Strain
(in/in)
2.5 0 4.83 0.00147224
2.68 0.00007588 4.74 0.00159393
2.98 0.00010599 4.63 0.00172043
3.25 0.00014093 4.49 0.00185176
3.51 0.00018069 4.34 0.00198791
3.75 0.00022526 4.16 0.00212887
3.97 0.00027466 3.97 0.00227466
4.16 0.00032887 3.75 0.00242526
4.34 0.00038791 3.51 0.00258069
4.49 0.00045176 3.25 0.00274093
4.63 0.00052043 2.98 0.00290599
4.74 0.00059393 2.68 0.00307588
4.83 0.00067224 0.01 0.00379883
4.91 0.00075537
4.96 0.00084332
4.99 0.00093609
5.00 0.00103368
4.99 0.00113609
4.96 0.00124332
4.91 0.00135537
The behavior of the concrete in tension is calibrated by testing the reinforced concrete
beams performed by Collins et al. (1996). Their research suggested that after cracking the
principal tensile stress 𝑓𝑡 is related to the principal tensile strain 𝜀1 as follows:
𝑓𝑡 =
𝑓𝑐𝑟
1 + √500𝜀1
(12)
Where the cracking stress 𝑓𝑐𝑟 can be taken as 4√𝑓𝑐′ psi. Eq.(12) is used to model the tension
behavior of concrete after cracking shown in Figure 15.

35
Figure 15: Stress-Strain Curve of Concrete in Tension based on Collins Model.
In Abaqus, “tension stiffening” allows you to define the strain-softening behavior for
the cracked concrete. Generally it is defined by means of giving post failure stress as a function
of cracking strain, 𝜀𝑡𝑐𝑘.The cracking strain is defined as the total strain minus the elastic strain
corresponding to the undamaged material that is given in eq.(13) and illustrated in the Figure
16.(13) Data calculated for the tension stiffening are shown in Table 7.
𝜀𝑡𝑐𝑘 = 𝜀𝑡 − 𝜀0𝑡
𝑒𝑙
(13)
Where,
𝜀0𝑡𝑒𝑙 = 𝜎𝑡/𝐸0.
Figure 16: Definition of Cracking Strain used for Defining Tension Stiffening (Abaqus,
2016)

36
Table 7: Tension Behavior of Concrete
Tension Stiffening
Stress
(ksi)
Cracking Strain
(in/in)
Stress
(ksi)
Cracking Strain
(in/in)
0.51 0 0.39866 0.000297007
0.441589 1.69934E-05 0.397555 0.000307265
0.439184 2.75545E-05 0.396469 0.000317518
0.436894 3.80887E-05 0.395402 0.000327767
0.434707 4.85989E-05 0.394353 0.000338012
0.432612 5.90875E-05 0.393322 0.000348252
0.430601 6.95565E-05 0.392308 0.000358489
0.428666 8.00079E-05 0.39131 0.000368722
0.426801 9.04429E-05 0.390328 0.000378951
0.425 0.000100863 0.389361 0.000389176
0.423258 0.000111269 0.388409 0.000399398
0.421571 0.000121663 0.387471 0.000409617
0.419934 0.000132045 0.386547 0.000419833
0.418345 0.000142415 0.385636 0.000430045
0.416801 0.000152776 0.384738 0.000440255
0.415298 0.000163126 0.378785 0.000511643
0.413834 0.000173468 0.371134 0.000613428
0.412407 0.000183801 0.364286 0.000715025
0.411015 0.000194125 0.35808 0.000816473
0.409655 0.000204442 0.352401 0.000917798
0.408327 0.000214752 0.312413 0.001927126
0.407029 0.000225055 0.287389 0.002932963
0.405759 0.000235351 0.269211 0.003937203
0.404515 0.000245641 0.255 0.004940518
0.403298 0.000255925 0.243385 0.005943227
0.402104 0.000266204 0.2336 0.00694551
0.400934 0.000276477 0.225174 0.007947475
0.399786 0.000286744 0.217796 0.008949196
0.051 0.009988104
As seen before, the prestressing strand will be stressed to a maximum threshold of 0.75
𝑓𝑝𝑢 where 𝑓𝑝𝑢 is the ultimate tensile capacity of the prestressing strand. Even though, the yield
strength equal to 𝑓𝑦 = 270 ksi the prestressing strands is 90% of 𝑓𝑝𝑢 which implies that the
strand will be elastic throughout the analysis; to make model more efficient and for accurate
results non-linearity was included for prestressing strands. The material model for the
prestressing steel consisted of a tri-linear curve, which was mathematically described by the

37
piecewise functions in Eq. (14) and illustrated in the Figure 17.(Menkulasi et al.,2014). Table
8 shows the inelastic non-linear parameters used for the prestressing strand.
𝑓𝑝𝑠 = 𝐸𝑝𝑠𝜀𝑝𝑠𝑖𝑓 𝜀𝑝𝑠 ≤ 0.0084
𝑓𝑝𝑠 = 240 + 1515(𝜀𝑝𝑠 − 0.0084)𝑖𝑓 0.0084 ≤ 𝜀𝑝𝑠 ≤ 0.015
(14)
𝑓𝑝𝑠 = 250 + 444(𝜀𝑝𝑠 − 0.015) 𝑜𝑡ℎ𝑒𝑟𝑤𝑖𝑠𝑒
Figure 17 Stress-Strain curve for a strand
Table 8 : Plasticity of Prestressing strand
Yield Stress
(ksi)
Plastic Strain
(in/in)
228 0
240.99 0.0005471
242.424 0.0014939
252.22 0.0111502
256.66 0.020994
261.1 0.0308386
265.54 0.0406828
270 0.050527
3.4 Finite Element Mesh for Concrete
Two different meshing techniques were used for creating concrete models. For the
models containing strands as truss elements, the concrete was modelled using a solid

38
continuum element. These elements are standard volume elements in the Abaqus. It can be
used to build a single homogeneous material, or it can include several layers of different
materials. They are more accurate for the quadrilateral and hexahedral elements. It can be used
for the linear analysis and for a complex non-linear analysis involving contact, plasticity, and
large deformations. They are available for stress, heat transfer, acoustic, and other analyses.
These solid elements are of two types; the first-order(linear) interpolation elements and the
second-order(quadratic) interpolation elements in one, two or three dimensions. Hexahedral
“bricks” are provided in the three dimensions. Choosing an appropriate element for the analysis
is necessary. Therefore, stress and displacement elements were chosen as it performs well with
the static and quasi static analysis. The stress and displacement elements consist of various
three-dimensional elements. In that, C3D8I, 8-node linear brick, incompatible modes were
selected as shown Figure 18.(Abaqus.2016)
Figure 18: Typical 3-dimensional 8-node brick element. (Abaqus,2016)
For models containing strands as solid elements, meshing is a hard process as it contains
holes in the concrete models. To reduce the computational cost and get accurate results
appropriate elements were used in meshing techniques. Tetrahedral elements (C3D4) are
geometrically versatile and used in many automatic meshing algorithms. It is very convenient
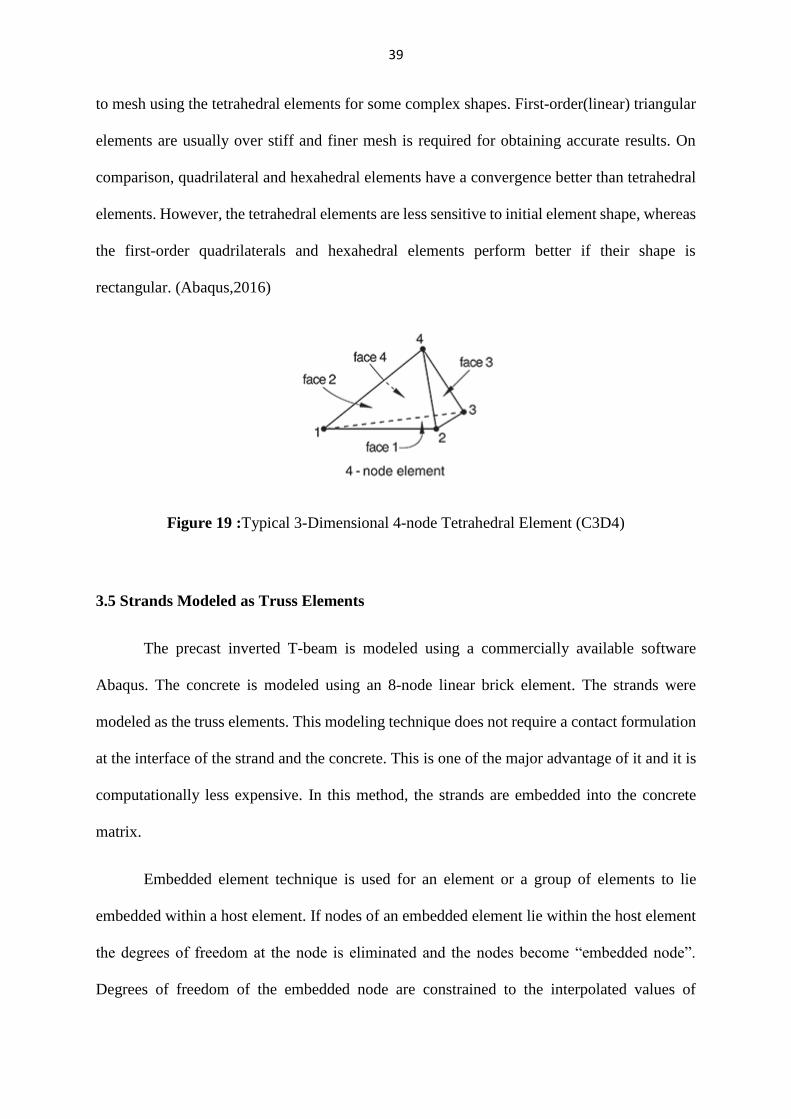
39
to mesh using the tetrahedral elements for some complex shapes. First-order(linear) triangular
elements are usually over stiff and finer mesh is required for obtaining accurate results. On
comparison, quadrilateral and hexahedral elements have a convergence better than tetrahedral
elements. However, the tetrahedral elements are less sensitive to initial element shape, whereas
the first-order quadrilaterals and hexahedral elements perform better if their shape is
rectangular. (Abaqus,2016)
Figure 19 :Typical 3-Dimensional 4-node Tetrahedral Element (C3D4)
3.5 Strands Modeled as Truss Elements
The precast inverted T-beam is modeled using a commercially available software
Abaqus. The concrete is modeled using an 8-node linear brick element. The strands were
modeled as the truss elements. This modeling technique does not require a contact formulation
at the interface of the strand and the concrete. This is one of the major advantage of it and it is
computationally less expensive. In this method, the strands are embedded into the concrete
matrix.
Embedded element technique is used for an element or a group of elements to lie
embedded within a host element. If nodes of an embedded element lie within the host element
the degrees of freedom at the node is eliminated and the nodes become “embedded node”.
Degrees of freedom of the embedded node are constrained to the interpolated values of

40
corresponding degrees of freedom of the host element. Figure 20 shows a finite element
modeling of a pretensioned concrete member using the embedment technique.
Figure 20: Finite Element Modeling of a Pretensioned Concrete Members using the
Embedment Technique
Prestressing force is applied by varying the cross-sectional area of the strand up to its
transfer length from both the ends and value of prestress is kept constant. This technique was
suggested by Menkulasi et.al, 2014. This technique proved to be more realistic as the amount
of prestressing force transferred to the surrounding concrete varies linearly within the transfer
length. Hand calculations were compared with numerical results to ensure that the prestress is
modeled correctly.
Table 9 shows the comparison of finite element results and theoretical values. The values of
stresses are collected from the midspan at top and bottom of the beam in longitudinal direction
(S33). The values obtained from finite element results were too close with theoretical values
which again proved that 2 in mesh can capture the stress and deflection in the member.

41
Table 9 : Comparison of Numerical and Theoretical Results for Precast Beams 20ft, 41.5ft
and 60ft (Strands Modeled as Truss Elements).
Specimen
ID
Measure Location FEA Theoretical Ratio
= 𝑭𝑬𝑨𝑻𝒉𝒆𝒐𝒓𝒆𝒕𝒊𝒄𝒂𝒍⁄
20ft
𝜎 (ksi) Midspan/Top 0.26 0.27 0.96
𝜎 (ksi) Midspan/Bottom 1.39 1.41 0.99
∆ (in) Midspan 0.29 0.29 1.00
41.5ft
𝜎 (ksi) Midspan/Top 0.84 0.86 0.98
𝜎 (ksi) Midspan/Bottom 1.79 1.79 1.00
∆ (in) Midspan 0.54 0.51 1.00
60ft
𝜎 (ksi) Midspan/Top 1.4 1.26 1.11
𝜎 (ksi) Midspan/Bottom 2.23 2.18 1.02
∆ (in) Midspan 0.9 0.88 1.02
Average 1.02
Standard Deviation 0.05
COV 0.05
*∆- Deflection, 𝜎- Normal Stress
3.6 Strands Modeled as Solid Elements
When strands are modeled as a truss element, it does not capture the Hoyer’s Effect.
So, it ignores the effect of splitting stresses around the circumference of the holes which is
caused by radial expansion of the strand after release. To capture the Hoyer’s effect, the strands
must be modeled as a 3D solid element as shown in Figure 21 by default it includes Poisson’s
ratio in the numerical process. The actual practical scenario is brought up by modeling it as a
solid element. The solid elements can capture all the three stresses that develop at the transfer
of prestress into the concrete.

42
Figure 21: (a) Shows the typical 60ft beam meshed with Tetrahedral Elements (b) Shows the
concrete-strand interface (c) Shows the modelled 3-D strand.
This modelling technique requires defining the composite interaction between the
concrete and the strand. The contact formulations include friction, slippage of the strand in
concrete, pressure dependency, and over-closure. To accurately simulate the interaction
between the two matrixes, a friction-based model is used. Friction based model consists of two
components: 1) Tangential Behavior 2) Normal Behavior.
In the tangential behavior, a “penalty” friction formulation is used. The model is
controlled by the co-efficient of friction 𝜇, which is obtained by continuous iterations with
simple beams. The penalty stiffness method requires the selection of an allowable elastic
slip,𝛾𝑖. The default value of an allowable elastic slip is used; it provides conservative balance
between efficiency and accuracy. The allowable elastic slip is given as, (Abaqus, 2016)
𝛾𝑖 = 𝐹𝑓𝑙𝑖

43
Where
𝐹𝑓 = slip tolerance (default value is 0.005).
𝑙𝑖 =is the characteristic contact surface length?
Moreover, an investigation was done on different beams to accurately simulate the interaction
between the concrete and the strand.
In the normal behavior, “hard” pressure-overclosure relationship is used at the interface
between the concrete and the strand. The hard contact minimizes the penetration of the slave
node into the master surface and using a finer mesh on slave surface reduces the penetration to
a greater extent. Also, it does not allow the transfer of tensile stress across the interface. The
concrete holes were chosen to be the master surface and strands were chosen to be the slave
surface in this study.
Figure 22: Mater Surface Penetration into the Slave Surface of a pure Master-Slave Contact
Pair (Abaqus,2016)
Hard contact needs defining “constraint enforcement method”. Augmented Lagrange
method is selected, as this approach can make the resolution of contact conditions and avoid
problems with over constraints; while keeping the penetrations small. The separation of two

44
surfaces once they come in contact is toggled off; to ensure it is fully bonded together, even if
the contact pressure between them is tensile. (Abaqus,2016)
The initial pretension is applied to the strand by introducing as an initial stress in
longitudinal direction, which makes strand tensioned before it becomes in contact with the
concrete. The bond between the circular strand and surrounding concrete should include the
effect of adhesion, mechanical interlock along the tangential direction. However, Hoyer’s
effect is included in the model by modeling the strand as 3D solid elements and Poisson’s ratio
is added to it. When the prestressing strand is released, it will dilate laterally; it is constrained
by the surrounding concrete, creating a pressure between the strand and the concrete.
Additionally, friction coefficient entered controls the friction per unit area and the bond
resistance between the strand and the concrete. Bond slip could occur when the shear stress
between the surfaces exceeds a value and this can be achieved by “penalty friction formulation”
in the software. In the interactions, strand is modeled as a slave surface and concrete as a master
surface. Slave surface should have finer mesh than the master surface so that the computational
time can be reduced. Like truss models C3D8I element was used in modeling both the concrete
and the strand. Only half of the precast beam cross section was modeled, and the single
symmetry condition was used along the z-axis.
The results obtained were found to be close enough with the theoretical values. When
comparing with the theoretical results the truss model showed a closed proximity than the solid
elements. Table 10 shows the comparison of the results from the numerical and theoretical
values. Major disadvantage of using a solid element is, it is computationally more expensive
and memory allocation required is more than the truss element.

45
Table 10 :Comparison of Numerical and Theoretical Results for Specimen 20ft, 41.5ft and
60ft (Strands Modeled as Solid Elements)
Specimen
ID
Measure Location FEA Theoretical Ratio=FEA/Theoretical
20ft 𝜎 (ksi) Midspan/Top 0.30 0.27 1.11
𝜎 (ksi) Midspan/Bottom 1.24 1.35 0.92
∆ (in) Midspan 0.24 0.26 0.92
41.5 ft 𝜎 (ksi) Midspan/Top 0.85 0.86 0.99
𝜎 (ksi) Midspan/Bottom 1.74 1.89 0.92
∆ (in) Midspan 0.5 0.51 0.98
60 ft 𝜎 (ksi) Midspan/Top 1.42 1.3 1.09
𝜎 (ksi) Midspan/Bottom 2.11 2.43 0.87
∆ (in) Midspan 0.74 0.87 0.86
Average 0.96
Standard Deviation 0.09
COV 0.09
∆-Deflection, 𝜎-Normal Stress
3.7 Validation of Modeling Protocol
This section deals with experimental verification for the finite element approach of
pretensioned concrete beams as seen in previous sections. The response of beams with different
strand sizes, the different spacing between the strands and beams with different cross section
were validated with experimental and theoretical results. The experimental data used in this
study was based on the previous research on transfer length, which includes straight strands
with fully bonded and uncoated. The transfer length is plotted using the strain data collected
by DEMEC discs. Discs are placed outside the concrete and parallel to centroid of the concrete
and the strand. The first measurements will be taken at 2in from the end of the member. In
agreement with most of the research papers, Demec discs readings were recorded 24 hours
after casting. Only the transfer length, after the release of pretension was considered for the
validation. The strain data collected for plotting the transfer length corresponds to concrete
surface strain due to pretensioning.
The finite element models for validation was created using the same material data used in
the experimental study or laboratory and the exact prestressing force was applied. Losses due

46
to creep and shrinkage were significantly small in the precast beams. It was not possible to
simulate creep and shrinkage because of lack of data on parameters such as temperature,
relative humidity, and creep coefficients. Also, these time-dependent effects do not influence
the transfer length very much. Therefore, it was ignored. The dimensions of the strand,
prestressing force and cross section details of the beam are shown in Figure 23.
Figure 23: Specimens considered for the Model Validation.
The objective of model validation is to capture the prestressing force and identify the
parameters to define the interaction between the strand and the concrete. As previously
discussed, model requires defining the concrete-strand interface. After continuous iterations,
interaction properties were found in the process of matching finite element results with
experimental and theoretical values.
Table 11 shows stress values of finite element analyses compared with theoretical
values. The values are close to theoretical calculations which proves that the prestress action is
captured accurately, and values used in these models can further be used in actual beams.

47
Table 11: Comparison of Numerical and Theoretical Results for Specimen 1 through 8
(Strands Modelled as Solid Elements)
Specimen ID Location 𝝈𝑭𝑬𝑨
(ksi) &
(N/mm^2)
𝝈𝑻𝒉𝒆𝒐𝒓𝒆𝒕𝒊𝒄𝒂𝒍
(ksi) &
(N/mm^2)
Ratio = 𝝈𝑭𝑬𝑨
𝝈𝑻𝒉𝒆𝒐𝒓𝒆𝒕𝒊𝒄𝒂𝒍
Specimen 1 Midspan/Top 1.7 1.83 0.93
Specimen 2 Midspan/Top 1.44 1.52 0.95
Specimen 3 Midspan/Top 4.02 4.44 0.91
Midspan/Bottom 18.39 19.02 0.97
Specimen 4 Midspan/Top 0.96 1 0.96
Specimen 5 Midspan/Top 9.14 9.16 1.00
Specimen 6 Midspan/Top 12.55 12.54 1.00
Specimen 7 Midspan/Top 2.68 2.76 0.97
Specimen 8 Midspan/Top 1.86 1.9 0.98
Average 0.96
Standard Deviation 0.03
COV 0.03
The input parameters that were found from model validation is summarized below. A
friction-based model was developed with friction coefficient of 0.4 at the interface of two
matrices. Under the interaction properties, for the tangential behavior; the “penalty friction
formulation” was used. For the normal behavior, “hard contact” and “augmented Lagrange
multiplier” were used as constraint as previously discussed. Moreover, when the prestressing
force is applied to the beam, there is small amount of loss in prestressing force due to elastic
shortening. This elastic shortening was taken into consideration while calculating the stresses
theoretically at the top and bottom of the precast beam. This calculated stress values are
compared with finite element results. Abaqus by itself considers the elastic shortening in its
numerical calculation.
As mentioned before, the experimental concrete strain profile (transfer length) was
compared with the finite element analyses results for each corresponding beam unit. The strain
graph is plotted by creating a node path along the direction of the strand from centroid of the
beam as shown in Figure 24. In the finite element models, the strain values were collected in

48
the same way as the strain values collected from actual pretensioned concrete beams in
laboratory.
Figure 24: Node Path to Collect Strain Data Along Direction of Strand
By default, software captures the transfer length due to release of prestress force as seen in
Figure 25.
The graphs shown in (Figure 25 a-f) confirms transfer length captured using the
software is close to real laboratory results. These results from numerical study, compared with
theoretical and experimental values; proves that the prestress force is properly applied to the
beam. The friction coefficient and other interaction properties used in this validation shows
good agreement with experimental results, so it can be used in modelling actual beams.
Therefore, interaction properties that were defined for this validation, for example: the friction
coefficient at interface of concrete and strand it can be used with other beams of different spans
for investigation of end zone stresses.

49
Figure 25: Validation of Numerical Modeling Protocol using Tetrahedral elements -
Comparison of numerical and Experimental Results for Specimen 1-8, a) Specimen-1, b)
Specimen -2, c) Specimen -3, d) Specimen-4, e) Specimen-5, f) Specimen-6, g) Specimen-7,
h) Specimen-8.

50
Initially, models with truss elements were modelled with 2 in mesh as Menkulasi et. al
(2014) proved top and bottom fibers of beam captures the stresses and self-weight exactly that
were identical with hand calculation. Next, modelling the strands as a 3D solid brick element
requires defining the strand-concrete interface, and the interaction between the two materials.
Therefore, to reduce the computational cost and get accurate results from finite element
analysis mesh sensitivity test is essential. For this test, longest among the three beams (60ft)
were considered shown in Figure 26. Beam was modelled with different mesh sizes that
includes 2 in., 3 in., and 4 in. The test results were plotted along the longitudinal stress (S33);
based on the size of concrete elements of the beam as shown in Figure 27. The stress curve
converges from 4 in. to 3 in. and remains same with 2 in. mesh. Therefore, 2 in. mesh is used
in modelling the beams and the results obtained showed a good agreement with theoretical
values that can be seen in upcoming sections.
Figure 26 : Typical 60ft beam with C3D4 Tetrahedral element and mesh surrounding the
concrete holes.

51
Figure 27: Mesh Sensitivity

52
Chapter 4 Results of Numerical Model
4.1 Response of Nonlinear Models
This section deals with the presentation of results in terms of characterizing the extent
of potential cracking at the end zones of precast inverted T-beams with tapered webs. Areas of
potential cracking are designated as those in which the magnitude of principal plastic strain
exceeds the cracking strain. The extent of potential cracking is then examined to determine
whether existing AASHTO provisions are adequate to properly reinforce the ends of such a
uniquely shaped element.
Figure 28 shows the extent of potential cracking in the 20 ft long specimen. The extent
of cracking in the models that feature truss and solid elements for the strands is similar. The
models with solid elements for the strands exhibit some additional cracking around the strands
due to capturing of the Hoyer effect, however, the extent of this cracking is slightly exaggerated
because of the influence of stress concentrations in the nodes of two adjacent elements. There
is a total of two elements in the horizontal direction between two adjacent strands. As a result,
any stress concentration in the node around the hole may be reflected in the node that is shared
by the two elements and give the illusion of a continuous splitting crack. A 2 in. strand spacing
is typical in the precast industry and is not anticipated to create any splitting cracks.
The extent of cracking in the 20 ft beam specimen is minimal and is believed to be
controlled by the confinement steel shown in Figure 7. The models with truss elements for the
strands do not show any extension of this cracking along the axis of the member, whereas those
that feature solid elements show that cracking may extent up to 12 in from the end of the
member, which is equal to 1.5d, where d is the overall depth of the member. This is consistent
with AASHTO’s requirement to extend confinement steel up to 1.5 from the end of the
member.

53
(a)
(b)
Figure 28: Max-Principal Strain (PE) in 20ft beam (a) Truss Element (b) Solid Element
Figure 29 shows the extent of potential cracking in the 41.5 ft beam. The extent of
cracking at the end of the element is similar between truss and solid element models, with the

54
cracking concentrated at the bottom corners of the notched ends. The models with truss
elements do not show any cracking along the length of the element. The models with solid
elements show additional cracking between the strands for reasons that were explained earlier.
Cracking due to splitting stresses appears to extend up to 17 in. along the length of the element.
Given that the depth of the element is 18 in. the 17 in. distance is within the 1.5d limit, which
defines the extent of confinement reinforcement.
It should be noted that Menkulasi (2014) reports that no cracks were reported during
the fabrication of these beams. This can be due to several factors: 1) the assumed modulus of
rupture (cracking stress) is different from the actual cracking stress, and 2) stress concentrations
in certain nodes may dominate the averaging process that the software uses to report stress in
a given node thus overestimating the extent of cracking.

55
(a)
(b)
Figure 29: Max-Principal Strain (PE) in 41.5ft beam (a) Truss Element (b) Solid Element.
Figure 36 shows the principal plastic strains in the 60 ft beam specimen for nonlinear models
featuring truss and solid elements for the strands. The areas in gray indicate strain areas that

56
are greater than the cracking strain. Overall the regions that are likely to be subject to cracking
are similar between truss and solid element models with the solid elements presenting a more
well defined and consistent description of the extent of potential cracking. However, truss also
clearly show the formation of spalling stresses at the end of the element and the formation of
bursting stresses.
The extent of spalling stresses in the nonlinear models with truss elements for the
strands is less than 4 in., which is within the 6 in. limit (h/4) defined in AASHTO. There is a
small region about 6 in. from the end that appears to experience some cracking around the
centroid of strands, which is interrupted and starts again for a distance up to 42 in. Any potential
cracking in this area is covered by confinement steel requirements which applies up to a
distance of 1.5d from the end of the member.
The extent of spalling stress in the nonlinear models with the solid element strands is 4
in. from the end of the beam. This is smaller than AASHTO’s 6 in. limit (h/4) recommended
for placing end zone reinforcement. The extent of potential cracking due to splitting and
bursting stresses extends up to 54 in. from the end of the member. As a result, the confinement
steel recommended to be placed up to 1.5d based on AASHTO’s recommendations needs to be
changed to at least 2.3d to cover the 54 in. distance, where d is the overall depth of the member.

57
(a)
(b)
Figure 30 : Max-Principal Strain (PE) in 60ft (a)Truss Element (b) Solid Element

58
4.2 Response of Linear and Non-Linear Member
This section gives a comparison of results obtained from linear elastic and nonlinear
models. The comparison is conducted in terms of the total strain (E). Areas that exceed the
cracking strain are shown in gray. The purpose of this section is to investigate the need to
conducting the more sophisticated nonlinear models with strands modeled as truss and solid
elements.
Figure 31 shows the total principal strains for the 20 ft long specimen featuring four
different modeling techniques: a) linear elastic analyses with the strands modeled as truss
elements, b) nonlinear analyses with the strands modeled as truss elements, c) linear elastic
analyses with the strands modeled as solid elements, and d) nonlinear analyses with the strands
modeled as solid elements. The extent of cracking in linear elastic models with truss elements
for the strands is isolated at very small regions and could be considered to be nonexistent. When
the effects of concrete plasticity are captured the extent of cracking grows but is still isolated
at the end of the section. This is due to the fact that as soon as the cracking stress is achieved,
the strain in that region grows quickly due to the shape of the adopted stress-strain curve in
tension. This is the reason why the magnitude of principal strain values shown in the legend is
higher. The extent of cracking is also very sensitive to the assumed cracking stress. When the
strands are modeled as solid elements the extent of cracking is more well defined and includes
the area around the strands. There is no significant difference in the extent of cracking between
linear elastic and nonlinear models, however, the magnitude of strains is higher in the nonlinear
model.
Figure 32 shows the total principal strain in the end zones of the 41.5 ft beam. When
the strands are modeled as truss elements, the formation of bursting stresses in the end zones
is similar. The extent of potential cracking in the nonlinear model is larger than that observed

59
in the linear model. There is almost no sign of cracking due to spalling stresses at the end faces.
When the strands are modeled as solid elements the extent of potential cracking slightly grows
and the potential for cracking due to spalling stresses becomes apparent. However, as noted
earlier, no cracking was observed during the fabrication of 41.5 ft long beams (Menkulasi
2014).
Figure 33 shows the total principal strains in the 60 ft beam specimen. The extent of
potential cracking is similar in all cases suggesting that linear elastic models with truss
elements for the strands are adequate for proportioning and mapping reinforcing in the
pretension anchorage zones. The extent of cracking in the 60 ft beam is much larger than that
in the 20 ft and 41.5 ft beam.

60
Figure 31 : Shows Total Strain (E) in 20ft beam (a) Linear Truss Element (b)Non-Linear
Truss Element (c)Linear Solid Element (d) Non-Linear Solid Element.
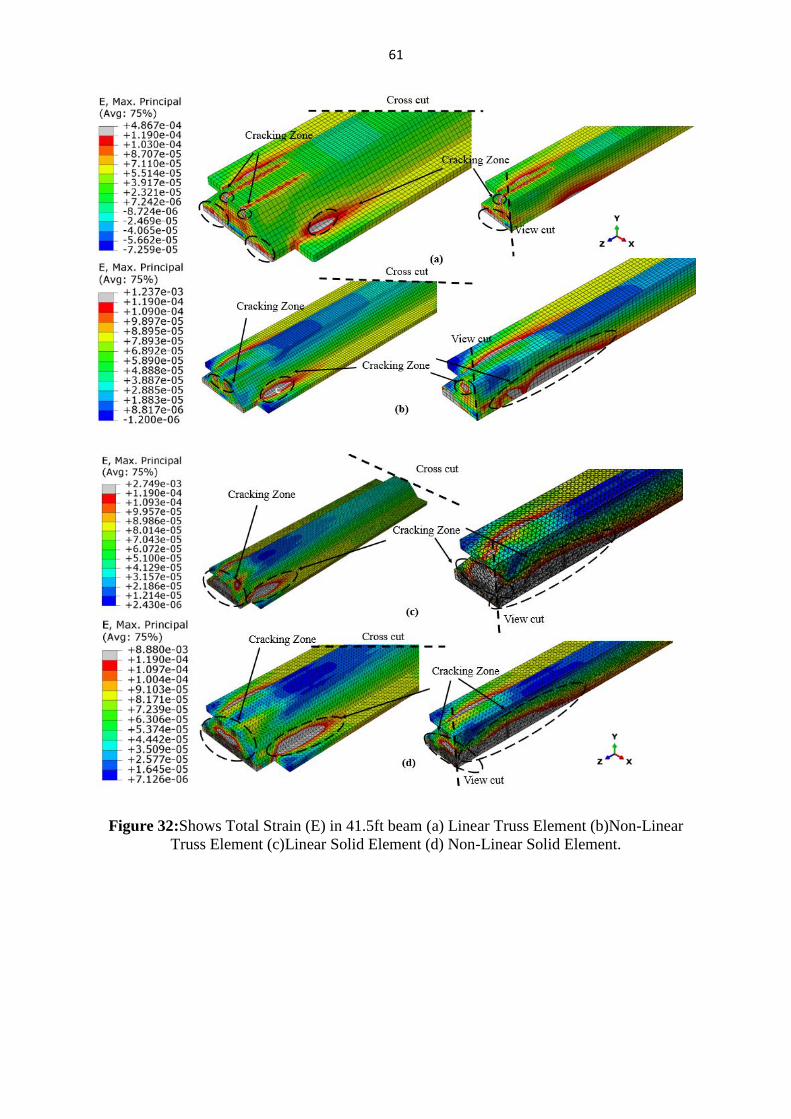
61
Figure 32:Shows Total Strain (E) in 41.5ft beam (a) Linear Truss Element (b)Non-Linear
Truss Element (c)Linear Solid Element (d) Non-Linear Solid Element.

62
Figure 33 : Shows Total Strain (E) in 60ft beam (a) Linear Truss Element (b)Non-Linear
Truss Element (c)Linear Solid Element (d) Non-Linear Solid Element.

63
Chapter 5 Conclusions and Recommendations
1) In general, the areas that areas in need of reinforcing in the end zones were similar
between linear elastic and nonlinear models as well as between models that featured
truss and solid elements for the strands.
2) The extent of potential cracking in the linear elastic models as characterized by
principal strains was slightly smaller than that observed in the nonlinear models due
to the fact that the linear models do not capture concrete plasticity and therefore
underestimate strain after cracking occurs. However, these differences were small,
suggesting that the extra modelling effort to simulate plasticity and the Hoyer effect
by modelling the strands as solid elements is not warranted. Therefore, for design
purposes, the linear elastic models with truss elements for the strands are more than
adequate for proportioning and mapping reinforcing in the end zones.
3) The models with solid elements for the strands capture the increase in stresses
around the strands better due to their ability to simulate the Hoyer effect. However,
the extent of cracking around the strands is exaggerated due to the size of the mesh
and the overlapping of the stress concentrations from one node of an element to the
node of the adjacent elements. The finite element code uses an averaging technique
for reporting stresses in a node that is shared by many elements. As a result, if there
are not more than two elements between the strands, the stress concentrations will
overlap and will give the illusion of a splitting “failure”. The apparent splitting
failures are also attributed to the assumed value for cracking strain, which typically
varies from 0.23√𝑓′𝑐 to 0.37√𝑓′𝑐.
4) Tensile stresses created due to the Hoyer effect did not extent past the area around
the strands. It is recommended that if a more accurate characterization of the
stresses around the strands is desired than at least three elements should be created

64
between the strands and extra effort is dedicated to improving the meshing
technique.
5) The time that it took to create and analyse the nonlinear models with the solid
elements for the strands was significantly higher than that required for linear elastic
models with truss elements. This was due to the fact the presence of the holes for
the strands required a finer mesh around the strands, which increased overall
element number. Additionally, the introduction of contact definitions in the normal
and tangential plane increased computational time since it took longer for the
analysis to converge to a solution.
6) The extent of potential cracking in the 60 ft long beam was more pronounced than
that observed in the 20 ft and 41.5 ft beams. This is expected due to the depth of the
beam, which allows more room for the creation of spalling and bursting stresses.
7) AASHTO’s recommendations for sizing reinforcing in the end zone appear to be
adequate with the following modifications. For beams with depths 18 in. or less no
modifications are necessary. End zone reinforcing based on the 4% rule should help
control any spalling stresses created within a distance of h/4 from the end of the
beam. The prescriptive requirements for confinement steel up to a distance of 1.5d
from the end of the member should help control bursting stresses as well as splitting
stresses created around the strands. Most of cracks as characterized by principal
tensile strains in beams 18 in. and less did not extend past a distance of 1.5d from
the end of the beam. For beams deeper than 18 in. it is recommended that the
confinement steel is extended up to a distance of 2.5d from the end of the member
to capture the extent of cracking observed in the 60 ft beam, which applied up to a
distance of 55 in. from the end of the beam (2.3d).

65
REFERENCES
AASHTO, 2014, AASHTO LRFD Bridge Design Specifications 7th Edition, Washington, DC.
ABAQUS User Manual, 2016.
Arancibia, M.D., Okumus, P., (2017) “Causes Excessive Detensioning Stresses in Northeast
Extreme Tee (NEXT) Beams”, PCI Journal, May-June 2017.
Amir. A Arab (2012), “Methodological Approach with Applications in Large Strands and End
Zone Cracking”, Southern Illinois University, Edwardsville.
Bai, F., Davidson S.J., (2016), “Composite Beam Theory for Pretensioned Concrete Structures
with Solutions to Transfer Length and Immediate Prestress Loss”, Engineering Structures,
September 2016.
Belhadj, A., Bahai, H., (2000) “Frictional -Slip: An Efficient Energy Dissipating Mechanism
for Suddenly Released Prestressing Bars”, Engineering Structures, November 2000.
Burgueno, R., Sun, Y., (2014) “Stress Transfer Characteristics of Sheathed Strand in
Prestressed Concrete Beams: Computational study”, PCI Journal, Summer, 2014.
Crispino, E.D, Cousins, T.E, Wollmann, C.L.R. (2009), “Anchorage Zone Design for
Pretensioned Precast Bulb-T girders in Virginia”, June 2009.
Christopher, Y.T., Sherif, A.Y., Nipon, J., Maher K.T., (2004) “End Zone Reinforcement for
Pretensioned Concrete Girders”, April 2004.
Collins, M.P., Mitchell, D., Adebar, P., Vecchio, F.J., (1996), “General Shear Design Method”,
ACI Structural Journal, January-February 1996.
Cousins, E.T., (1986) “Bond of Epoxy Coated Prestressing Strand”, North Carolina State
University, Raleigh, 1986.
66
Dang, C.N., Murray, C.D., Floyd, R.W., Hale, M.W., Marti-Vargas, J.R., (2014), “Analysis of
Bond Stress Distribution for Prestressing Strand by Standard Test for Strand Bond”,
Engineering Structures, May 2014.
Galvez, J.C., Benitez, J.M., Tork, B., Casati, M.J., Cendon, D.A., (2009) “Splitting Failure of
Precast Prestressed Concrete During the Release of the Prestressing Force”, Engineering
Structures, May 2009.
Gergely, P., Sozen, M.A., (1967) “Design of Anchorage Zone Reinforcement in Prestressed
Concrete Beams”, April 1967.
Greene, G.G., Graybeal, B., (2008) “FHWA Research Program on Lightweight High-
Performance Concrete-Transfer Length”, National Bridge Conference, October 2008.
Hegger, J., Bulte, S., Kommer, B., (2007) “Structural Behavior of Prestressed Beams Made
with Self-Consolidating Concrete”, PCI Journal, July-August 2007.
Hognestad, E., (1951) “A study of combined bending and axial load in reinforced concrete
members”, University of Illinois Engineering Experiment Station, Bulletin no. 399.128,1951.
Kaar, P.H., LaFarugh, W.R., Mass, M.A., (1963) “Influence of Concrete Strength on Strand
Transfer Length”, PCI Journal, October 1963.
Llau, A., Jason, L., Dufour, F., Baroth, J., (2016) “Finite Element Modelling of 1D Steel
Components in Reinforced and Prestressed Concrete Structures”, Engineering Structures,
September 2016.
Lee, J., and G. L. Fenves (1998) “Plastic-Damage Model for Cyclic Loading of Concrete
Structures,” Journal of Engineering Mechanics, vol. 124, no.8, pp. 892–900, 1998.
Lubliner, J., J. Oliver, S. Oller, E. Oñate, (1989) “A Plastic-Damage Model for
Concrete,” International Journal of Solids and Structures, vol. 25, no.3, pp. 229–326, 1989.

67
Menkulasi, F., Mercer, M., Wollmann, C. L.R, Cousins, T., (2012) “Accelerating Bridge
Construction Using the Precast Inverted T-Beam Concept”, PCI 2012 Convention and National
Bridge Conference, September 29 -October 02, 2012.
Menkulasi, F., Wollmann, C.L.R., Cousins, T., (2013) “Investigation of Time Dependent
Effects on Composite Bridges with Precast Inverted T-Beams”, PCI 2013 Convention and
National Bridge Conference, September 21-24, 2013.
Menkulasi, F., Wollmann, C.L.R., Cousins, T., (2014) “Investigation of Stresses in the End
Zones of Precast Inverted T-Beams with Tapered Webs”, PCI 2014 Convention and National
Bridge Conference, 2014.
Mirza, J.F., Tawfik, M.E., (1978) “End Cracking in Prestressed Members During
Detensioning”, PCI Journal, March-April 1978.
O’ Callaghan, M.R., Oguzhan, B., (2008) “Tensile Stresses in the End Regions of Pretensioned
I-Beams at Release”, Technical Report for Texas Department of Transportation, University of
Texas, Austin, September 2008.
Oh, H.B., Kim, S.E., (2000) “Realistic Evaluation of Transfer Length in Pretensioned,
Prestressed Concrete Members”, ACI Structural Journal, November-December 2000.
Okumus, P., Oliva, M.G., Becker, S., “Nonlinear Finite Element Modeling of Cracking at Ends
of Pretensioned Bridge Girders”, Engineering Structures, March, 2012.
Russel, W.B., Burns, H.N., (1997) “Measurement of Transfer Length on Pretensioned Concrete
Elements”, Journal of Structural Engineering, Vol. 123, No.5. May, 1997.
Sarles, D. Jr., Itani, R.Y., (1984) “Effect of End Blocks on Anchorage Zone Stresses in
Prestressed Concrete Girders”, PCI Journal, November-December 1984.

68
Tuan, C.Y., Yehia, S.A., Jongpitakssel, N., Tadros, M.K., (2004) “End Zone Reinforcement
for Pretensioned Concrete Girders”, PCI Journal,68-82, May-June,2004.
Tadros, M.k., Badie, S.S., Tuan, C.Y., (2010) “Evaluation and Repair Procedures for
Precast/Prestressed Concrete Girders with Longitudinal Cracking in the Web”, National
Cooperative Highway Research Program, Washington, D.C Transportation Research Board.

69
ABSTRACT
STRESSES IN THE END ZONES OF PRECAST INVERTED T-BEAMS WITH
TAPERED WEBS
by
RAVI SIDDHARTH RAJA
August 2018
Advisor: Dr. Fatmir Menkulasi
Major: Civil Engineering
Degree: Master of Science
Short to medium span composite bridges constructed with adjacent precast inverted T-
beams and cast-in-place topping are intended to provide more resiliency against reflective
cracking and time dependent effects compared to voided slabs and adjacent box girder systems.
This thesis investigates the stresses in the end zones of such a uniquely shaped precast element.
The transfer of prestressing force creates vertical and horizontal tensile stresses in the end zones
of the girder. A series of 3-D finite element analyses were performed to investigate the
magnitude of these tensile stresses. Hoyer effect is captured by modelling the strands as solid
elements and defining the interaction between strands and concrete in the tangential and normal
behavior using friction coefficient and hard contact, respectively. The modelling protocol
captures spalling, splitting, and bursting stresses. It was found that, stresses in the end zones
of precast inverted T-beams with tapered webs are not likely to cause any significant cracking
if the beam is reinforced based on AASHTO’s provisions for pretensioned anchorage zones.
Various modeling techniques were evaluated, and it was found that linear elastic models with
truss elements are adequate for design purposes in terms of mapping where the end zone
reinforcing needs to be located. However, if such modeling capabilities are not available
AASHTO’s provisions suffice in terms of reinforcing the critical areas in the end zones.

70
AUTOBIOGRAPHICAL STATEMENT
My name is Ravi Siddharth Raja and I was born in Southern India in 1994. I was
brought up in Salem. My father is a businessperson and my mother is a home maker.
Like most of the boys, I use to play around with the playing cards and built small
pyramids with that cards, when I was young. Later that interest developed to toys, I was
interested in getting toys and assembling it together and making it as a small building. Making
scale models were one my hobbies till now. In my junior and senior high schools, besides my
regular courses I was interested in drawing and was trained in pencil sketch. Based, on my
interest and career consideration, I chose Civil Engineering as major in Anna University,
Chennai and graduated in 2016. I earned my bachelor’s degree in Civil Engineering.
I am really interested in design, I had good records on courses relative to design, where
my GPA for major courses was 85/100 during my undergraduate studies. I am also active in
practice design learning and design software. For instance, when my school sponsored a regular
Building Design Week every two week in the campus of the university, I was deeply involved
in the activities. One of the activity was constructing a covered parking lot with waste collected
within our university. In the vacation, I like travelling, visiting some historical places and
learning the architecture behind the buildings. Travelling can broaden my horizon and
observing can enhance my sensibility of beauty and architecture, which both are advantages to
a person engaged in building design or modelling structures.
Travelling different places, made me to choose USA as my second home. I got a place
in Wayne State University, it exposes me to a new set of problems and solving in a different
way. I want to do some real-world engineering work here and it helped me to extent my
boundaries structural engineering. I believe it will help me in formulation of a structural
engineer and make the world a better place to live.