Stress-strain-strain rate relation for the compressibility ... · LEROUEL, S., KABBAI, M., TAVENAS,...
22
LEROUEL, S., KABBAI, M., TAVENAS, F. & BOUCHARD, R. (1985). G&technique 35, No. 2, 159-180 Stress-strain-strain rate relation for the of sensitive natural clays compressibility S. LEROUEIL,* M. KABBAJ,* F. TAVENAS* and R. BOUCHARDt Four types of oedometer tests (constant rate of strain tests, controlled gradient tests, multiple-stage loading tests and creep tests) were carried out on a variety of Champlain sea clays. Results obtained on five sites are used to demonstrate that the rheological behaviour of these clays is controlled by a unique stress-strain- strain rate relationship. This relationship can be simply described by two curves (upl-E, and (u,‘/ud)-E,). The significance, the practical implications and the limita- tions of the model are also discussed. Quatre types d’essais oedom&riques (a vitesse con- stante de d&formation, 21gradient contr616, g charge- ment en plusieurs &tapes et avec fluage) ont BtB effect& sur diverses argiles marines Champlain. LB rtsultats obtenus sur cinq sites sent utilis% pour dtmontrer que le comportement rheologique de ces argiles est r&i par une relation unique contrainte- dtformation/vitesse de d&formation. Cette relation peut &tre d&rite de fawn tr&s simple par deux courbes (a,-l, et (a,‘/~,‘)-s,). L’article analyse aussi la signifi- cation, les implications pratiques et les limitations du modtle. NOTATION compression index coefficient of secondary compression with respect to the void ratio void ratio afdat oedometric modulus (du,‘/da,) initial height of the specimen time pore pressure at the base of the specimen back pressure pore pressure distribution parameter vertical strain (AH/H,) a&,/at total vertical stress preconsolidation pressure vertical effective stress aa,‘/at INTRODUCTION One-dimensional consolidation has always been considered one of the most important geotech- Discussion on this Paper closes on 1 October 1985. For further details see inside back cover. * Laval University, Quebec. t Techmat, Quebec. nical problems and it is not surprising that hundreds of papers have been written on this subject. Most of the studies are theoretical, analytical or numerical and more than 25 differ- ent rheological models have been suggested for clays. Simply, four families of rheological mod- els can be defined: if e is the void ratio, u,’ the vertical effective stress, t the time, & = aelat and 6,’ = au,‘/,% these families can be represented by the following equations. R(u,‘,e)=O (1) R(u,‘, e, t) = 0 (2) R(u,‘, e, a,, d) = 0 (3) R(uv,‘, e,i)=O (4) Equation (1) is representative of models in which the effective stress-void ratio response of the soil is unique and independent of time or strain rate. This is the case for the classical Terzaghi theory of consolidation in which a linear effective stress-void ratio relation is as- sumed. The model suggested by Davis & Raymond (1965) based on a linear void ratio- logarithm of effective stress relation is also of this type. Although equation (1) is widely used in practice, it has been recognized ever since Buisman (1936) that the void ratio varies under a constant effective stress and thus that equation (1) is not sufficient to describe the rheological behaviour of clays completely. Koppejan (1948), Bjerrum (1967) and Hansen (1969) have prop- osed models represented by equation (2) in which the void ratio is a function of the effective stress and time. A major difficulty, however, is encountered with these models when an origin for time must be defined, particularly when the applied load varies with time. The models corresponding to equations (3) and (4) overcome this difficulty since the be- haviour of the material depends only on its present conditions and is not a function of previ- ous history. Taylor & Merchant (1940) were the first to suggest a model of the type represented by equation (3) in which the rate of change in void ratio is a function of the effective stress, the void ratio and the rate of change in effective stress. This suggestion has been followed by 159
Transcript of Stress-strain-strain rate relation for the compressibility ... · LEROUEL, S., KABBAI, M., TAVENAS,...
LEROUEL, S., KABBAI, M., TAVENAS, F. & BOUCHARD, R. (1985). G&technique 35, No. 2, 159-180
Stress-strain-strain rate relation for the of sensitive natural clays
compressibility
S. LEROUEIL,* M. KABBAJ,* F. TAVENAS* and R. BOUCHARDt
Four types of oedometer tests (constant rate of strain tests, controlled gradient tests, multiple-stage loading tests and creep tests) were carried out on a variety of Champlain sea clays. Results obtained on five sites are used to demonstrate that the rheological behaviour of these clays is controlled by a unique stress-strain- strain rate relationship. This relationship can be simply described by two curves (upl-E, and (u,‘/ud)-E,). The significance, the practical implications and the limita- tions of the model are also discussed.
Quatre types d’essais oedom&riques (a vitesse con- stante de d&formation, 21 gradient contr616, g charge- ment en plusieurs &tapes et avec fluage) ont BtB effect& sur diverses argiles marines Champlain. LB rtsultats obtenus sur cinq sites sent utilis% pour dtmontrer que le comportement rheologique de ces argiles est r&i par une relation unique contrainte- dtformation/vitesse de d&formation. Cette relation peut &tre d&rite de fawn tr&s simple par deux courbes (a,-l, et (a,‘/~,‘)-s,). L’article analyse aussi la signifi- cation, les implications pratiques et les limitations du modtle.
NOTATION compression index coefficient of secondary compression with respect to the void ratio void ratio afdat oedometric modulus (du,‘/da,) initial height of the specimen time pore pressure at the base of the specimen back pressure pore pressure distribution parameter vertical strain (AH/H,) a&,/at total vertical stress preconsolidation pressure vertical effective stress aa,‘/at
INTRODUCTION One-dimensional consolidation has always been considered one of the most important geotech-
Discussion on this Paper closes on 1 October 1985. For further details see inside back cover. * Laval University, Quebec. t Techmat, Quebec.
nical problems and it is not surprising that hundreds of papers have been written on this subject. Most of the studies are theoretical, analytical or numerical and more than 25 differ- ent rheological models have been suggested for clays. Simply, four families of rheological mod- els can be defined: if e is the void ratio, u,’ the vertical effective stress, t the time, & = aelat and 6,’ = au,‘/,% these families can be represented by the following equations.
R(u,‘,e)=O (1)
R(u,‘, e, t) = 0 (2)
R(u,‘, e, a,, d) = 0 (3)
R(uv,‘, e,i)=O (4)
Equation (1) is representative of models in which the effective stress-void ratio response of the soil is unique and independent of time or strain rate. This is the case for the classical Terzaghi theory of consolidation in which a linear effective stress-void ratio relation is as- sumed. The model suggested by Davis & Raymond (1965) based on a linear void ratio- logarithm of effective stress relation is also of this type. Although equation (1) is widely used in practice, it has been recognized ever since Buisman (1936) that the void ratio varies under a constant effective stress and thus that equation (1) is not sufficient to describe the rheological behaviour of clays completely. Koppejan (1948), Bjerrum (1967) and Hansen (1969) have prop- osed models represented by equation (2) in which the void ratio is a function of the effective stress and time. A major difficulty, however, is encountered with these models when an origin for time must be defined, particularly when the applied load varies with time.
The models corresponding to equations (3) and (4) overcome this difficulty since the be- haviour of the material depends only on its present conditions and is not a function of previ- ous history. Taylor & Merchant (1940) were the first to suggest a model of the type represented by equation (3) in which the rate of change in void ratio is a function of the effective stress, the void ratio and the rate of change in effective stress. This suggestion has been followed by
159
160 LEROUEIL, KABBAJ, TAVENAS AND BOUCHARD
numerous researchers (Gibson & Lo, 1961; Wu, Resendiz & Neukirchner, 1966; Poskitt & Bird- sall, 1971; Sekiguchi & Toriihara, 1976). Mod- els corresponding to equation (4) show a unique relationship between the effective stress, the void ratio and the rate of change in void ratio; they can be represented in an e-u,’ diagram by P =constant lines called isotaches by Suklje (1957, 1969a). Various equations have been suggested to define these isotaches. The first and also the simplest corresponds to Taylor’s theory B (1942)
i=au,‘+be+c
Other more complex equations have been suggested by Barden (1965), Suklje (1969b), Poorooshasb & Sivapatham (1969), Battelino (1973) and Hawley & Borin (1973).
The rheological models proposed were seldom assessed experimentally or only on the basis of a few laboratory test results. Experimental studies, however, have been performed on natural clays (Crawford, 1965; Jarrett, 1967; Berre & Iversen, 1972; Sallfors, 1975; Larsson, 1981) and on resedimented clays (Smith & Wahls, 1969; Aboshi, 1973; Burghignoli, 1979), but in each study only one type of test was used: constant rate of strain (CRS) tests by Crawford (1965), Smith & Wahls (1969) and Sallfors (1975); constant rate of loading test by Jarrett (1967) and Burghignoli (1979); total load ap- plied by steps by Berre & Iversen (1972) and Larsson (1981). It is thus difficult to obtain an overall view of the rheological behaviour of clays from these studies. As a result this abun- dant literature has modified neither the common practice based on the Terzaghi theory nor the way of thinking on clay behaviour.
About half a century after the work of Ter- zaghi (1923) and Buisman (1936) engineers are still undecided on whether there is a combina- tion of primary and secondary compressions during primary consolidation of thick layers of clay. Suklje (1957), Barden (1965) and Bjerrum (1967) have expressed the idea that there is a combination of both processes (theory B, from Ladd, Foott, Ishihara, Schlosser & Poulos, 1977), while Leonards (1977) and Ladd et al. (1977) think that secondary compression de- velops only after primary consolidation is com- pleted (Au-O), (theory A from Ladd et al., 1977). Here again, the experimental evidence is almost non-existent or not convincing: the con- solidation test results obtained by Berre & Iversen (1972) on specimens of different heights which are often used to validate theory B were also used by Leonards (1977) to justify theory A; the tests carried out by Aboshi (1973) on a
remoulded clay indicate a behaviour somewhere in between the predictions of theories A and B.
Therefore it was decided to initiate a detailed research programme on consolidation. In the first stage, different types of oedometer tests (CRS tests, controlled gradient tests (CGTS), stage loading tests and long-term creep tests) were carried out on a variety of clays, and from these experimental data obtained on small speci- mens a rheological model has been developed. The objective of this Paper is to present these results. In the second stage of the research, the behaviour of clays observed in situ is compared with the behaviour observed in the laboratory; results in terms of the preconsolidation pressure have been published (Leroueil, Samson & Bozozuk, 1983; Leroueil, Tavenas, Samson & Morin, 1983; Morin, Leroueil & Samson, 1983). A detailed analysis of the stress-strain-strain rate behaviour of well-defined clay layers under three test embankments will be the subject of another paper.
CLAYS INVESTIGATED The clays investigated were formed in the
Champlain sea which occupied the St Lawrence lowlands and the Ottawa valley from approxi- mately 12 500 to 10 000 Before Present. Gen- eral physical and mechanical properties of these marine clays have been presented by Leroueil, Tavenas & Le Bihan (1983): the organic matter content is usually less than 1% and the sensi- tivity greater than 15. According to Lebuis, Robert & Rissmann (1982), less than 50% of the clay fraction is phyllosilicates and amorph- ous materials, the remainder being primary min- erals, mainly quartz, plagioclase and potassium feldspar.
Eleven sites were investigated by Terratech Ltd, Montreal, and Laval University, Quebec, and 14 series of tests were carried out to study the preconsolidation pressure of the clays (Leroueil, Tavenas, Samson & Morin, 1983). The oedometer test data have been reanalysed in detail to extract the rheological behaviour of these clays (Kabbaj, Leroueil & Tavenas, 1984).
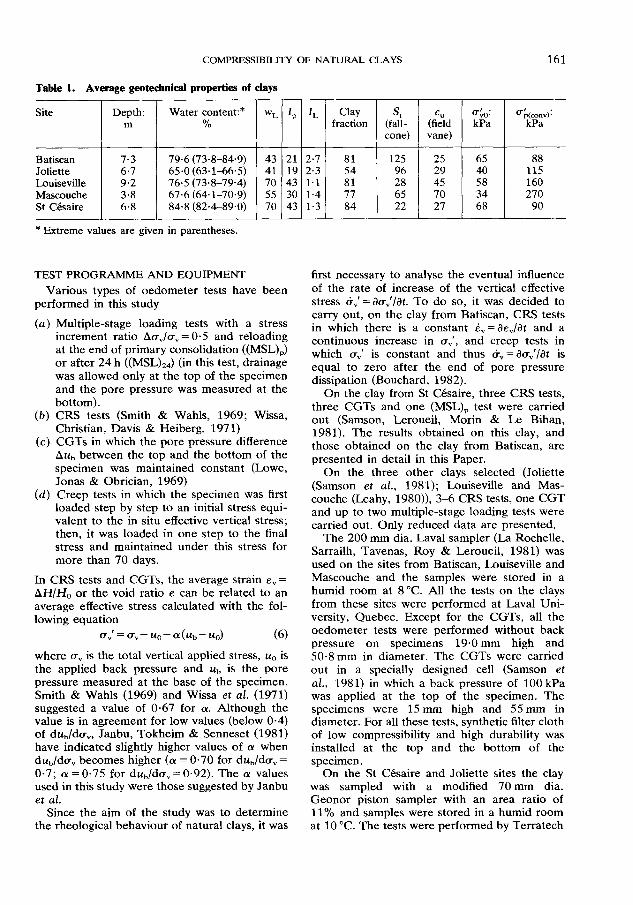
Typical results obtained for five representative sites are presented here. The main characteris- tics of the clays are shown in Table 1. The natural water content varies from 63% to 89%, the plasticity index ranges between 19 and 43, the liquidity index varies from 1.1 to 2.7 and the preconsolidation pressure measured in conven- tional oedometer tests (Au,/u,= 0.5 and a re- loading schedule of 24 h) ranges from 88 kPa to 270 kPa.
COMPRESSIBILllT OF NATURAL CLAYS 161
Table 1. Average geotechnkal properties of clays
Site
Bat&an Joliette Louiseville Mascouche St CBsaire
Depth: m
7.3 6.7 9.2 3.8 6.8
Water content:* WL 1, Il. Clay fraction (fZi- (f&l
(T&: $(cOn”) : % kPa kPa
cone) vane)
79.6 (73.8-84.9) 43 21 2.7 81 125 25 6.5 88 65.0 (63.1-66.5) 41 19 2.3 54 96 29 40 115 76.5 (73.8-79.4) 70 43 1.1 81 28 45 58 160 67.6 (64.1-70.9) 55 30 1.4 77 65 70 34 270 84.8 (824-89.0) 70431.3 84 22 27 68 90
* Extreme values are given in parentheses.
TEST PROGRAMME AND EQUIPMENT
Various types of oedometer tests have been performed in this study
(a) Multiple-stage loading tests with a stress increment ratio Aa,/a, = 0.5 and reloading at the end of primary consolidation ((MSL),) or after 24 h ((MSL),) (in this test, drainage was allowed only at the top of the specimen and the pore pressure was measured at the bottom).
(b) CRS tests (Smith & Wahls, 1969; Wissa, Christian, Davis & Heiberg, 1971)
(c) CGTs in which the pore pressure difference hub between the top and the bottom of the specimen was maintained constant (Lowe, Jonas & Obrician, 1969)
(d) Creep tests in which the specimen was first loaded step by step to an initial stress equi- valent to the in situ effective vertical stress; then, it was loaded in one step to the final stress and maintained under this stress for more than 70 days.
In CRS tests and CGTs, the average strain E,= AH/H, or the void ratio e can be related to an average effective stress calculated with the fol- lowing equation
U” ‘=a”-uuo-a(u~-U~) (6)
where u, is the total vertical applied stress, u. is the applied back pressure and ub is the pore pressure measured at the base of the specimen. Smith & Wahls (1969) and Wissa et aI. (1971) suggested a value of 0.67 for (Y. Although the value is in agreement for low values (below O-4) of dub/da,, Janbu, Tokheim & Senneset (1981) have indicated slightly higher values of (Y when dub/du, becomes higher (a = 0.70 for du,/du, = 0.7; a! = 0.75 for dub/da,= 0.92). The (Y values used in this study were those suggested by Janbu et al.
Since the aim of the study was to determine the rheological behaviour of natural clays, it was
first necessary to analyse the eventual influence of the rate of increase of the vertical effective stress &G = au,‘lat. To do so, it was decided to carry out, on the clay from Batiscan, CRS tests in which there is a constant E,= as,/& and a continuous increase in uV’, and creep tests in which a,’ is constant and thus & =auV’/at is equal to zero after the end of pore pressure dissipation (Bouchard, 1982).
On the clay from St CXsaire, three CRS tests, three CGTs and one (MSL), test were carried out (Samson, Leroueil, Morin & Le Bihan, 1981). The results obtained on this clay, and those obtained on the clay from Batiscan, are presented in detail in this Paper.
On the three other clays selected (Joliette (Samson et al., 1981); Louiseville and Mas- couche (Leahy, 1980)), 3-6 CRS tests, one CGT and up to two multiple-stage loading tests were carried out. Only reduced data are presented.
The 200 mm dia. Lava1 sampler (La Rochelle, Sarrailh, Tavenas, Roy & Leroueil, 1981) was used on the sites from Batiscan, Louiseville and Mascouche and the samples were stored in a humid room at 8 “C. All the tests on the clays from these sites were performed at Lava1 Uni- versity, Quebec. Except for the CGTs, all the oedometer tests were performed without back pressure on specimens 19.0 mm high and 50.8 mm in diameter. The CGTs were carried out in a specially designed cell (Samson et al., 1981) in which a back pressure of 100 kPa was applied at the top of the specimen. The specimens were 1.5 mm high and 55 mm in diameter. For all these tests, synthetic filter cloth of low compressibility and high durability was installed at the top and the bottom of the specimen.
On the St CBsaire and Joliette sites the clay was sampled with a modified 70 mm dia. Geonor piston sampler with an area ratio of 11% and samples were stored in a humid room at 10 “C. The tests were performed by Terratech
162 LJZROUEIL, KABBAJ, TAVENAS AND BOUCHARD
Effective stress CT,‘: kPa
Batiscan 15 - CRS tests: s-1
-“p,, = 143x10-5
--~“,=5~30x10-6 -.- &=2.13x10m6 -,..- &,=5.33x,0m7
20 -----iv5=,.0,x,0-7
~,,=,+Bx,0-8
<- 25 &-
H I
OB
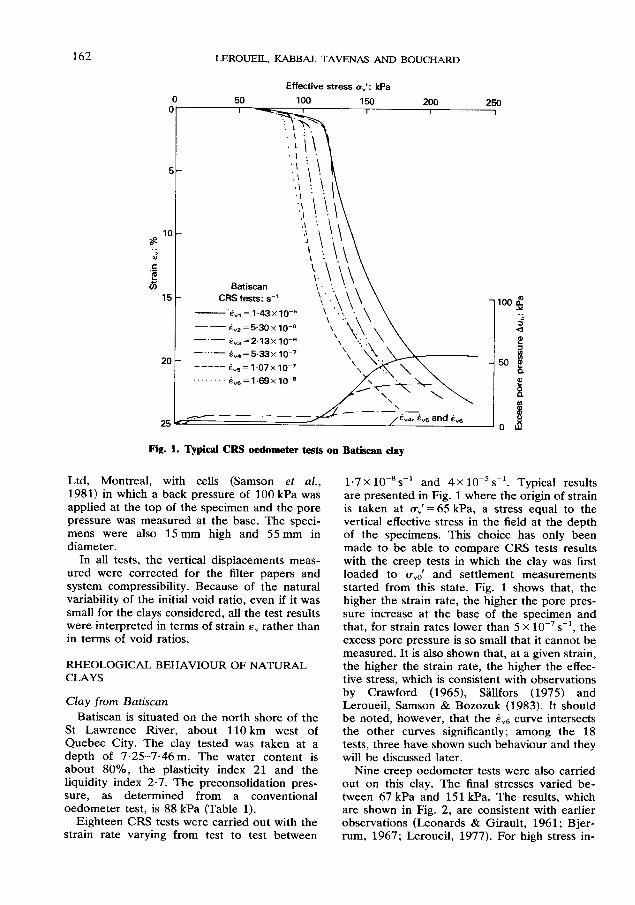
Fig. 1. Typical CRS oedometer tests on Batisean day
Ltd, Montreal, with cells (Samson et al., 1981) in which a back pressure of 100 kPa was applied at the top of the specimen and the pore pressure was measured at the base. The speci- mens were also 15 mm high and 55 mm in diameter.
In all tests, the vertical displacements meas- ured were corrected for the filter papers and system compressibility. Because of the natural variability of the initial void ratio, even if it was small for the clays considered, all the test results were interpreted in terms of strain E, rather than in terms of void ratios.
RHEOLOGICAL BEHAVIOUR OF NATURAL CLAYS
Clay from Bat&an
Batiscan is situated on the north shore of the St Lawrence River, about 110 km west of Quebec City. The clay tested was taken at a depth of 7.25-7.46m. The water content is about 80%, the plasticity index 21 and the liquidity index 2.7. The preconsolidation pres- sure, as determined from a conventional oedometer test, is 88 kPa (Table 1).
Eighteen CRS tests were carried out with the strain rate varying from test to test between
1.7 x ~O-‘S-~ and 4 x lo-’ s-l. Typical results are presented in Fig. 1 where the origin of strain is taken at u”’ = 65 kPa, a stress equal to the vertical effective stress in the field at the depth of the specimens. This choice has only been made to be able to compare CRS tests results with the creep tests in which the clay was first loaded to (T,~’ and settlement measurements started from this state. Fig. 1 shows that, the higher the strain rate, the higher the pore pres- sure increase at the base of the specimen and that, for strain rates lower than 5 x 10m7 s-‘, the excess pore pressure is so small that it cannot be measured. It is also shown that, at a given strain, the higher the strain rate, the higher the effec- tive stress, which is consistent with observations by Crawford (1965), Sallfors (1975) and Leroueil, Samson & Bozozuk (1983). It should be noted, however, that the .& curve intersects the other curves significantly; among the 18 tests, three have shown such behaviour and they will be discussed later.
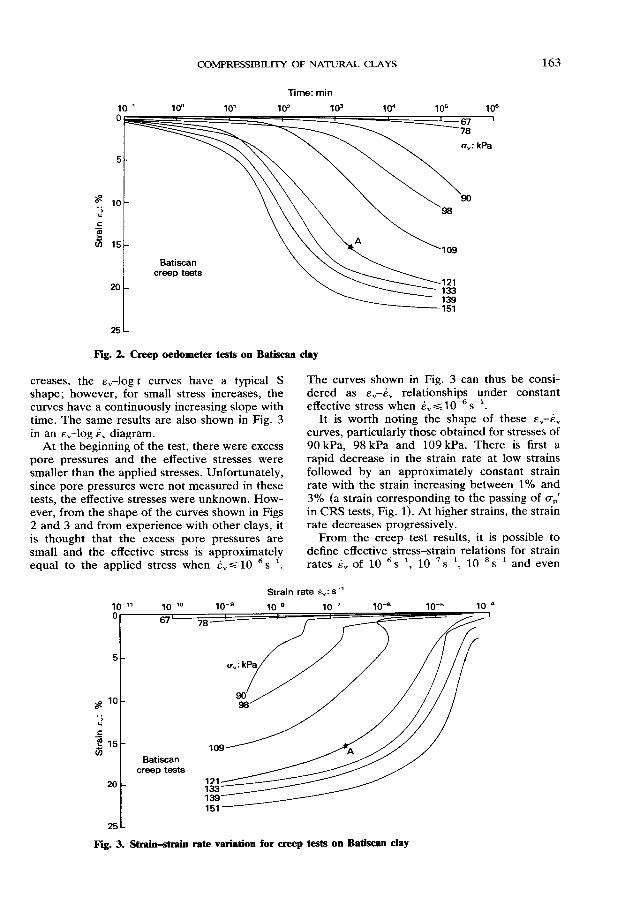
Nine creep oedometer tests were also carried out on this clay. The final stresses varied be- tween 67 kPa and 151 kPa. The results, which are shown in Fig. 2, are consistent with earlier observations (Leonards & Girault, 1961; Bjer- rum, 1967; Leroueil, 1977). For high stress in-
COh4PREtSSlB~ OF NATURAL CLAYS 163
Time: min
20
25 t
Fig. 2. Creep oedometer tests on Bat&an clay
creases, the Ev-lOg t curves have a typical S shape; however, for small stress increases, the curves have a continuously increasing slope with time. The same results are also shown in Fig. 3 in an &,--log E, diagram.
At the beginning of the test, there were excess pore pressures and the effective stresses were smaller than the applied stresses. Unfortunately, since pore pressures were not measured in these tests, the effective stresses were unknown. How- ever, from the shape of the curves shown in Figs 2 and 3 and from experience with other clays, it is thought that the excess pore pressures are small and the effective stress is approximately equal to the applied stress when 6, G 10m6 ssl.
The curves shown in Fig. 3 can thus be consi- dered as Ed-& relationships under constant effective stress when t-, < 1O-6 s-l.
It is worth noting the shape of these E,--E, curves, particularly those obtained for stresses of 90 kPa, 98 kPa and 109 kPa. There is first a rapid decrease in the strain rate at low strains followed by an approximately constant strain rate with the strain increasing between 1% and 3% (a strain corresponding to the passing of ad in CRS tests, Fig. 1). At higher strains, the strain rate decreases progressively.
From the creep test results, it is possible to define effective stress-strain relations for strain rates 6, of 10m6 s-l, ~O-‘S-~, lo-* ski and even
b”_” IO_‘0
67’
Strain rate Q,:s-’
10-8 1 o-7
5-
g lo- . . w’
.E E 15- x
Bat&an creep tests
20 -
25-
Fig. 3. Strain-strain rate variation for creep tests on BaGscan clay
164 LEROUEIL, KABBAJ, TAVENAS AND BOUCHARD
Effective stress CT,‘: kPa
.E E c
uJ 15 :
Batiscan creep tests
Strain rate 8,: s 20- 0 lom6
A 10m7 0 1om8 0 10-S
25-
Fig. 4. Constant 8, curves deduced from creep tests OII Bat&an clay
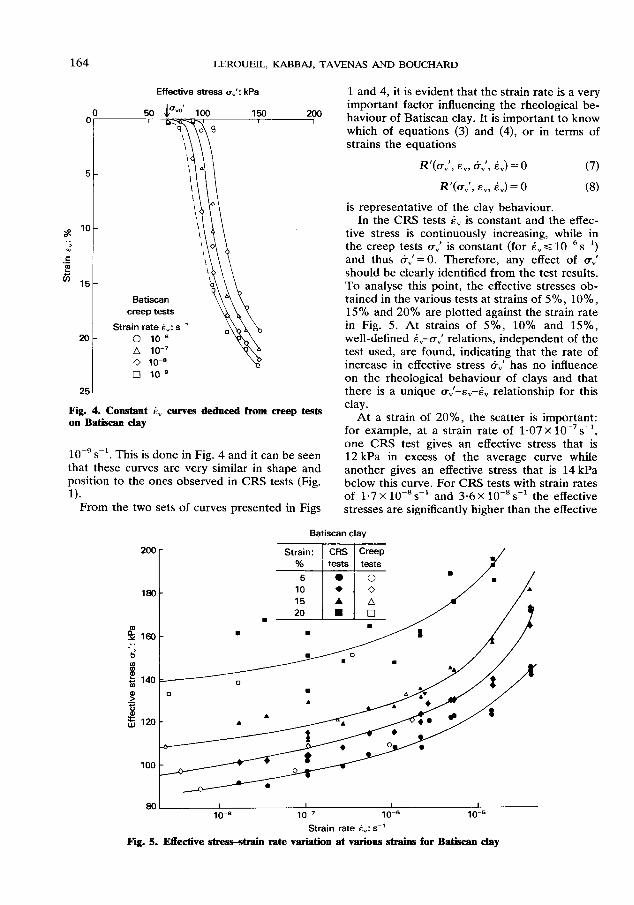
10m9 s-l. This is done in Fig. 4 and it can be seen that these curves are very similar in shape and position to the ones observed in CRS tests (Fig. 1).
From the two sets of curves presented in Figs
1 and 4, it is evident that the strain rate is a very important factor influencing the rheological be- haviour of Batiscan clay. It is important to know which of equations (3) and (4), or in terms of strains the equations
No,‘, E,, d”‘, .&) = 0
R'(a,', E,, 6”) = 0
is representative of the clay behaviour.
(7)
(f3
In the CRS tests & is constant and the effec- tive stress is continuously increasing, while in the creep tests ui is constant (for t-, G 10m6 s-l) and thus 6”’ = 0. Therefore, any effect of uV’ should be clearly identified from the test results. To analyse this point, the effective stresses ob- tained in the various tests at strains of 5%) 10%) 15% and 20% are plotted against the strain rate in Fig. 5. At strains of 5%, 10% and 15%, well-defined &-a,’ relations, independent of the test used, are found, indicating that the rate of increase in effective stress d-,’ has no influence on the rheological behaviour of clays and that there is a unique o;‘--E,+, relationship for this clay.
At a strain of 20%, the scatter is important: for example, at a strain rate of 1.07 X ~O-‘S-~, one CRS test gives an effective stress that is 12 kPa in excess of the average curve while another gives an effective stress that is 14 kPa below this curve. For CRS tests with strain rates of 1.7 X lO-‘s~’ and 3.6~ lo-‘s-’ the effective stresses are significantly higher than the effective
Batiscan clay
I I
10-7 10-B
Strain rate 6,: s-’
Fig. 5. Effective stress-strain rate variation at various strains for Bat&an clay

COhPRJ33SIBUlTY OF NATURAL CLAYS 165
stresses deduced from creep tests. It is difficult to say whether the scatter (or differences) ob- served at 20% strain is due to fundamental rheological clay behaviour or to the natural var- iability of the specimens. This latter possibility is real, as small variations in grain size distribution, water content and particle arrangement have a significant influence on the stress necessary to compress the soil at high strains. However, for strains up to 1.5% and strain rates usually en- countered in the laboratory, it can be considered that there is a unique stress-strain-strain rate relationship, independent of the rate of effective stress change.
The existence of such a (T,‘--E,--E, relationship has been confirmed by two special CRS tests in which the strain rates were changed at various strains. The test SPl (Fig. 6) started with a strain rate E,, = 2.7 x 1O-6 s-r up to a strain of 3.7%, then was switched to E,* = 1.05 X ~O-‘S-~ up to a strain of 7.2% and back again. The test SP2 began with a strain rate & = 1.05 x lo-‘s-’ up to E,= 4.5%, then was switched to FV1 up to E,= 8.8% and back again. A strain rate I& = 1.3~ 10e5 s-r was also used for the SP2 test at strains between 17.7% and 21.8%. The results in Fig. 6 clearly show that there is a unique stress-strain-strain rate relationship for this clay, at least for strains less than 16%. At strains larger than 23%, the two & curves are differ- ent, probably because of small differences in the specimens. However, the results prove that there is still a strain rate effect at strains as high as 23%. Graham, Crooks & Bell (1983) also observed such strain rate effects at large strains on a clay from Belfast.
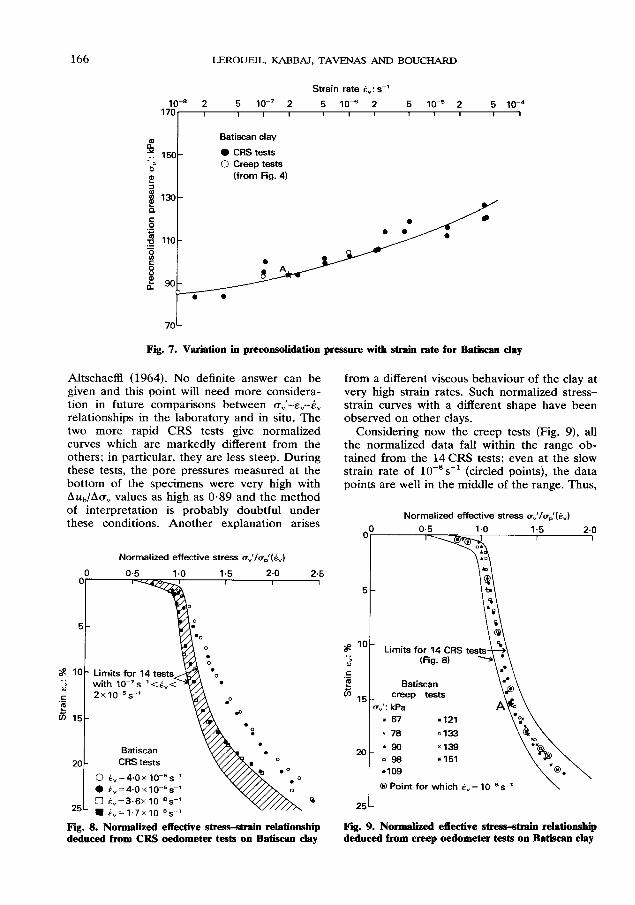
From the stress-strain curves presented in Figs 1 and 4, it can be observed that the strain on passing the preconsolidation pressure up’ is about 1% for all the tests. A a,‘+, relationship can thus be determined in the same manner as that by which a,‘-& curves were established at other strains (Fig. 5). Both series of a,‘-& points deduced from CRS (Fig. 1) and creep tests (Fig. 4) and plotted in Fig. 7 are on the same average curve.
The o,,‘-E, and up’-& curves presented in Figs 5 and 7 have roughly the same shape and it appeared that the complete u,‘--E,-& relation- ship for the clay could be normalized. This was verified in the following way: for CRS tests, the vertical effective stress u,’ was normalized with respect to the preconsolidation pressure up’(&) associated with the corresponding strain rate on the average curve (Fig. 7). The a,‘/~,‘(&) ratios were plotted against F, for the 18 tests (Fig. 8). Fourteen normalized test curves for strain rates between 1.4 x 10m5 s-r and 1.07 X lo-’ s-’ fall in
O0
Effective stress 0,‘: kPa
50 100 150 200 250 I
5-
g IO- . . :
.G !I fX 15-
20 - - SPI test -- SP2 test
i,, = 2.70 x 1Om6 s-’ d,,=1.o5x1o-‘s~’
25 - 1,,=1.34x10⁻⁵s-’
3OL
Fig. 6. Special CRS oedometer tests on Batiscan clay
a narrow range, while four are out of this range and will be discussed later. For the creep tests, the strain rate varied continuously during the test, but at a given strain there was a definite strain rate and it was possible to normalize the effective stress (equal to the applied stress when E, < 10m6 s-r) with respect to the preconsolida- tion pressure associated with the strain rate at that strain (Fig. 7). For example, if we consider the creep test in which a, = 121 kPa is applied, after 2000 min the strain is equal to 15.5% (Fig. 2, point A), the strain rate of the specimen at that moment is 2 x ~O-‘S-~ (Fig. 3, point A) and the preconsolidation pressure a,’ corresponding to this strain rate is 94 kPa (Fig. 7, point A). It is then possible to plot u,‘/u,‘(E,) (121/94= 1.29) against E,= 15.5% (Fig. 9, point A). All the creep tests were interpreted in this way and the results are plotted in Fig. 9.
As for the CRS tests (Fig. 8), with the excep- tion of the two more rapid tests carried out with a strain rate of 4.0~ 10-5s-‘, they all fall in a very narrow range up to strains of 15%. At larger strains, the range obtained with 14 tests enlarges and, moreover, the two slowest CRS tests (6, = 3-6 x lOma s-r and 1.7 X 1O-8 S-I) go
out of this range. There are two possible reasons for the behaviour in these two tests: the first is associated with the natural variability of the spec- imens; the second is associated with a thixotropic hardening of the clay skeleton at very small strain rates of the type observed by Leonards &
166 LEROUEIL, KABBAJ, TAVENAS AND BOUCHARD
Strain rate i,: s-’
10-e 2 5 lo-’ 2 5 10-S 2 5 10-s 2 5 10-a 170 I , I 1 I I I 1 1 1 I
Batiscan clay
150- 0 CRS tests 0 creep tests
(from Fig. 4)
130-
Fig. 7. Variation in preco~~~olidation pressure with strain rate for Bat&can clay
Altschaeffl (1964). No definite answer can be given and this point will need more considera- tion in future comparisons between CT,‘-E,-k,
relationships in the laboratory and in situ. The two more rapid CRS tests give normalized curves which are markedly different from the others; in particular, they are less steep. During these tests, the pore pressures measured at the bottom of the specimens were very high with Aub/AuV values as high as 0.89 and the method of interpretation is probably doubtful under these conditions. Another explanation arises
Normal&d effective stress o,‘/a,‘(i,)
O0 0.5 1.0 1.5 2.0 2.5
I I I
5-
20-
25-
. 0
Limits for 14 tests l <
2x10⁻⁵s
Batiscan CRS tests
0 i,=4~0x10-5s-’ 0 ~“=4.0X10⁻⁵S-’ 0 i,=3.6~1O-~s-’ n c,=1~7x10~8s ’
Fig. 8. Normal&d effective stress-strain relationship deduced from CRS oedometer tests on Batisam clay
from a different viscous behaviour of the clay at very high strain rates. Such normalized stress- strain curves with a different shape have been observed on other clays.
Considering now the creep tests (Fig. 9), all the normalized data fall within the range ob- tained from the 14CRS tests; even at the slow strain rate of 10-8s-’ (circled points), the data points are well in the middle of the range. Thus,
Normalized effective stress ~,‘/a,‘(~,)
O0 0.5 1.0 1.5 2.0 I I I
ae lo t
Limits for 14 CRS . . 3 (Fig. 8)
.; L
x 15 creep tests
II 67 1121
v 78 0133
20- ‘80 x139
088 *I51
*lo9
0 Point for which L, = 1O-Bsm’ \
25-
Fig. 9. Normahzed effective stress-strain relationship deduced from creep oedometer tests on Batiscan clay
COMPFtESSJB~ OF NATURAL CLAYS 167
it can be concluded that for all the creep and CRS tests, with the exception of those carried out at very high strain rates and in which the pore pressure is high (and possibly with the exception of those carried out at slow strain rates when at large strains), for Batiscan clay there is a unique stress-strain-strain rate rela- tionship which can be normalized and rep- resented by only two curves: a,‘-& and (+“‘/uD’(+&,.
Clay from St Chaire
The site of St CCsaire is located in the Champlain sea basin, about 50 km south east of Montreal. The clay specimens used for this study were taken at a depth of 6.55-7.04 m. They are characterized by an average water content of 85%, a liquid limit of 70, a conventional pre- consolidation pressure of 90 kPa and a sensitiv- ity of 22 (Table 1).
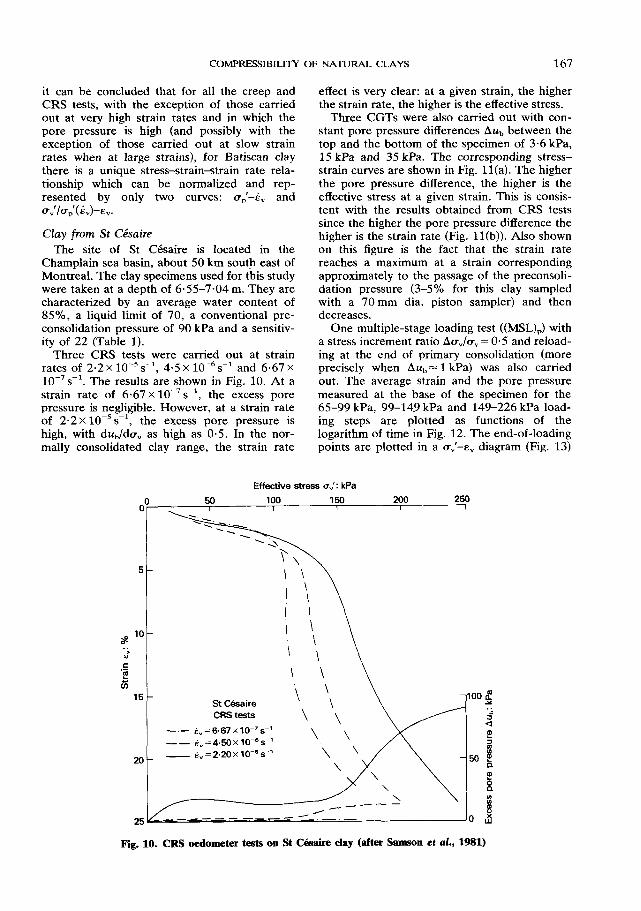
Three CRS tests were carried out at strain rates of 2.2 x 10s5 s-l, 4.5 x 10e6 s-’ and 6.67 X lo-‘s-i. The results are shown in Fig. 10. At a strain rate of 6.67 x ~O-‘S-~, the excess pore pressure is negligible. However, at a strain rate of 2.2 x 10e5 s-r, the excess pore pressure is high, with du,/doV as high as 0.5. In the nor- mally consolidated clay range, the strain rate
effect is very clear: at a given strain, the higher the strain rate, the higher is the effective stress.
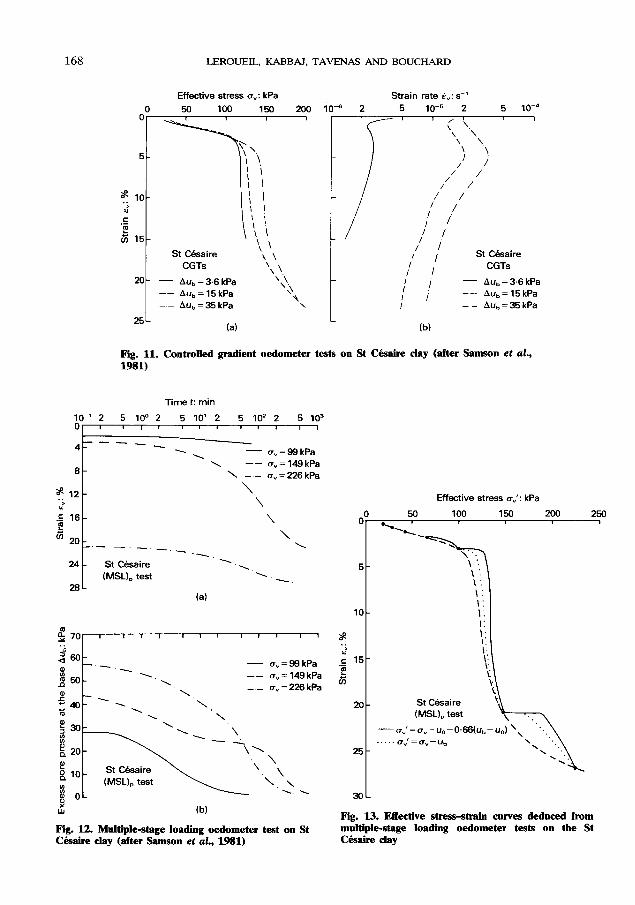
Three CGTs were also carried out with con- stant pore pressure differences Au, between the top and the bottom of the specimen of 3.6 kPa, 15 kPa and 35 kPa. The corresponding stress- strain curves are shown in Fig. 11(a). The higher the pore pressure difference, the higher is the effective stress at a given strain. This is consis- tent with the results obtained from CRS tests since the higher the pore pressure difference the higher is the strain rate (Fig. 11(b)). Also shown on this figure is the fact that the strain rate reaches a maximum at a strain corresponding approximately to the passage of the preconsoli- dation pressure (3-5% for this clay sampled with a 70 mm dia. piston sampler) and then decreases.
One multiple-stage loading test ((MSL),) with a stress increment ratio AuJcr, = 0.5 and reload- ing at the end of primary consolidation (more precisely when Au,,= 1 kPa) was also carried out. The average strain and the pore pressure measured at the base of the specimen for the 65-99kPa, 99-149kPa and 149-226kPaload- ing steps are plotted as functions of the logarithm of time in Fig. 12. The end-of-loading points are plotted in a u,I--E, diagram (Fig. 13)
Effective stress 0,‘: kPa
5-
s 10 -
. . w’
.E E x
15 - St Cbsaire CRS tests
-- ~,=4.50x10-~s-’ 6
20- - ” = 2.20 x 10-S s-1
Fig. 10. CRS oedometer tests on St CCaire clay (after Samson et al., 1981)
168 LEROUEIL, KABBAJ, TAVENAS AND BOUCHARD
s . . : .g
L
Fl
oo-
5-
10-
15-
zo-
25-
Effective stress 0,: kPa
50 100 150 200 1
v, \ ‘. 1 ! ‘;’ ’ I ’ I I
I ’ I I
: ’ \ 1 \ ,
St C&aim \ ’ \ \
CGTs \ \\
- Au, = 3.6 kPa \\
-- Au,=lSkPa ‘\\
-- Au,=35kPa Y
(a)
Strain rate 8,:s
= 2 5 10-S 2 5 10-a
\ ‘. \ \
1 I St Cbaire
l’ I CGTs
: I - Au, = 3.6 kPa
: I -- Au,= 15 kPa
-- Au,=35kPa
b)
Fig. 11. Controlled gradient oedometer teats on St Cksaire clay (after Samson et al., 1981)
Time t: min
.E 16 E e v) 20
24
.-.-. -.--._ ‘..
St Cbsaire . . . . (MSL), test
(a)
\ \
\
0,=99kPa -- o, = 146 kPa
‘. \.
-.- o, = 226 kPa
‘. \
\
Fig. 12. Multiple-stage loading oedometer test on St Cbsaire clay (after Samson el al., 19%1)
Effective stress 0,‘: kPa
50 100 150 200 250
’ ,
.*.
5-
\: \: 1:
lo- \: I:
s . . !i : \. c 15- \: ‘1 L z
20 - St G%aire (MSL), test
-u”‘=o,-u,-o66b . . . ..g”‘=(T.-_ub
25 -
30-
Fig. 13. Effective str-train curves deduced from multiple-stage loading oedometer tests on the St C&ire clay
COMPFESSlBlLlTY OF NATURAL CLAYS 169
and the classical oedometric curve (broken line) is drawn. Also shown in this figure with full lines are the stress-strain curves obtained from the data presented in Fig. 12 and a calculation of the average effective stress by using equation (6) with an cx value of 0.66. This last calculation is not rigorous just after loading, when the ex- cess pore pressure is high, but it gives a higher limit for u,‘. An extreme lower limit is given by considering the effective stress at the base of the specimen: a,’ = a,---~~ (dotted line in Fig. 13). The difference between these two curves is rela- tively small and the error in the average effec- tive stress calculated by using equation (6) is limited to a few kilopascals. The results shown in Figs 12 and 13 call for some remarks.
(a) The loading from 65 kPa to 99 kPa is typical of the behaviour of eastern Canadian over- consolidated clays. The duration of the primary consolidation is relatively short (Fig. 12(b)) and the &,-log t curve has a slope that increases continuously with time. The Aub-log t curve for loading from 99 kPa to 149 kPa is typical of a clay passing its pre- consolidation pressure with a well-defined step between 10 and 60 min, as previously established by Leroueil, Le Bihan & Tavenas (1980). The accumulated strain (about 17%) during this step is very impor- tant. Finally, the behaviour observed during the loading from 149 kPa to 226 kPa is typi- cal of a normally consolidated clay.
(b) Even if there is an eventual small error in the calculated average effective stress, the stress-strain curves shown in Fig. 13 are representative of the real behaviour. They are very different from the classical oedometric curve (broken line) showing, dur- ing the first phases of the loading, a rapid increase in the effective stress with small strains followed by a progressive increase in the effective stress with a significant accumu- lation of strain. Berre & Iversen (1972) ob- served similar behaviour in a Norwegian clay.
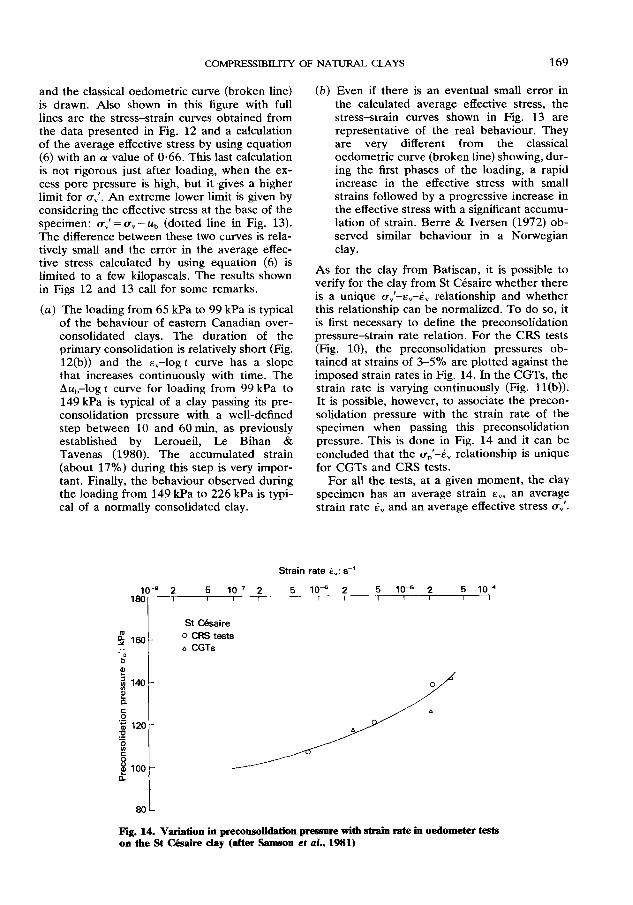
As for the clay from Batiscan, it is possible to verify for the clay from St CCsaire whether there is a unique u~‘--E,-& relationship and whether this relationship can be normalized. To do so, it is first necessary to define the preconsolidation pressure-strain rate relation. For the CRS tests (Fig. lo), the preconsolidation pressures ob- tained at strains of 3-5% are plotted against the imposed strain rates in Fig. 14. In the CGTs, the strain rate is varying continuously (Fig. 11(b)). It is possible, however, to associate the precon- solidation pressure with the strain rate of the specimen when passing this preconsolidation pressure. This is done in Fig. 14 and it can be concluded that the up’-& relationship is unique for CGTs and CRS tests.
For all the tests, at a given moment, the clay specimen has an average strain E,, an average strain rate 6, and an average effective stress a,‘.
Strain rate d,:sm’
St @sake
0 CFIS tests A CGTs
8OL Fig. 14. Variation in preconsolidation pressure with strain rate in odometer tests on the St C&mire clay (after Samson et al., 1981)
170 LEROUEIL, KAJ3BA.I. TAVENAS AND BOUCHARD
Normal&d effective stress o,‘/a.‘t&)
g 10 0’
.c St CIsaire clay
E x
15 d Au,=3,6kPa 0
CRS tests 20- o &=2.16~10~~s-
G &=4.5x16~6s-’
25-
Fig. 15. Normalfzed effective stress-strain relationship for the St Cksaire day
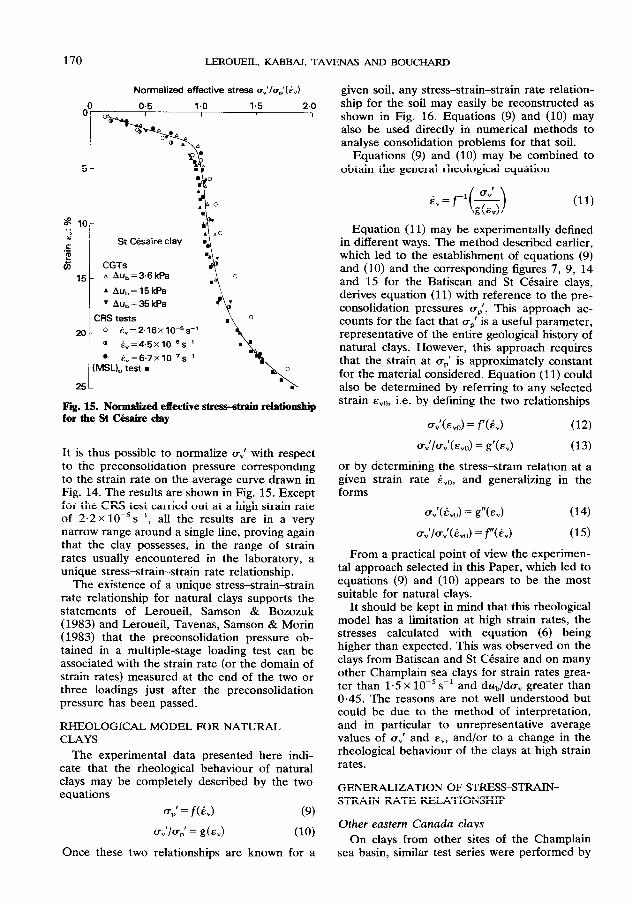
It is thus possible to normalize a,’ with respect to the preconsolidation pressure corresponding to the strain rate on the average curve drawn in Fig. 14. The results are shown in Fig. 15. Except for the CRS test carried out at a high strain rate of 2.2 x 1o-5 s-l, all the results are in a very narrow range around a single line, proving again that the clay possesses, in the range of strain rates usually encountered in the laboratory, a unique stress-strain-strain rate relationship.
The existence of a unique stress-strain-strain rate relationship for natural clays supports the statements of Leroueil, Samson & Bozozuk (1983) and Ieroueil, Tavenas, Samson & Morin (1983) that the preconsolidation pressure ob- tained in a multiple-stage loading test can be associated with the strain rate (or the domain of strain rates) measured at the end of the two or three loadings just after the preconsolidation pressure has been passed.
RHEOLOGICAL MODEL FOR NATURAL CLAYS
The experimental data presented here indi- cate that the rheological behaviour of natural clays may be completely described by the two equations
up’ = f(&) (9)
U”‘IUP = g(.%) (10)
Once these two relationships are known for a
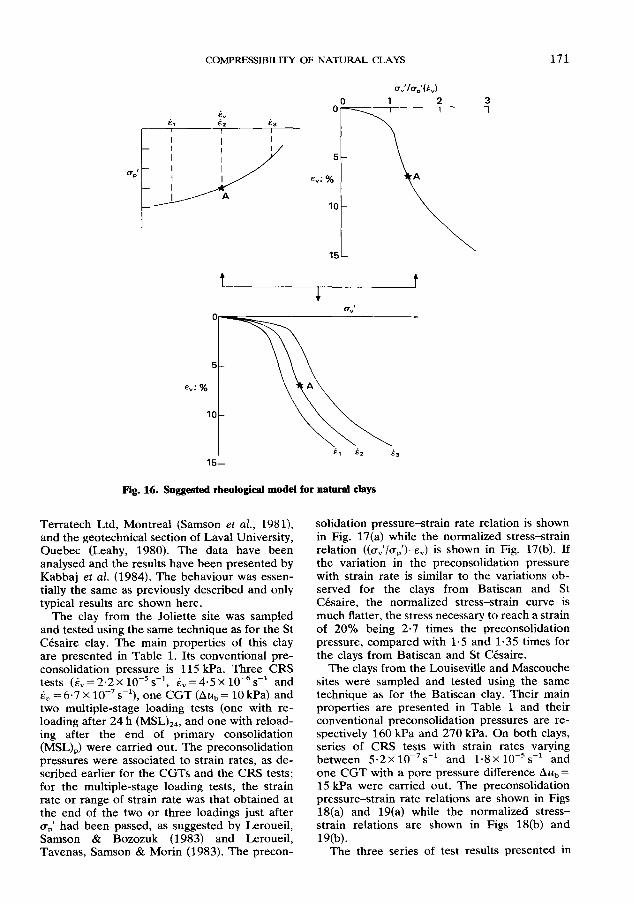
given soil, any stress-strain-strain rate relation- ship for the soil may easily be reconstructed as shown in Fig. 16. Equations (9) and (10) may also be used directly in numerical methods to analyse consolidation problems for that soil.
Equations (9) and (10) may be combined to obtain the general rheological equation
(+” &=f-’ - ( ‘) Ed4 (11)
Equation (11) may be experimentally defined in different ways. The method described earlier, which led to the establishment of equations (9) and (10) and the corresponding figures 7, 9, 14 and 15 for the Batiscan and St Cesaire clays, derives equation (11) with reference to the pre- consolidation pressures a,‘. This approach ac- counts for the fact that a,’ is a useful parameter, representative of the entire geological history of natural clays. However, this approach requires that the strain at a,’ is approximately constant for the material considered. Equation (11) could also be determined by referring to any selected strain E,“, i.e. by defining the two relationships
o,‘(&o) = f)(&) (12)
o”‘/o”‘(E”O) = g’(c,) (13)
or by determining the stress-strain relation at a given strain rate .&, and generalizing in the forms
a”‘(&) = g”(EJ (14)
u;/u,I(E”cJ = P(;-“) (15)
From a practical point of view the experimen- tal approach selected in this Paper, which led to equations (9) and (10) appears to be the most suitable for natural clays.
It should be kept in mind that this rheological model has a limitation at high strain rates, the stresses calculated with equation (6) being higher than expected. This was observed on the clays from Batiscan and St CCsaire and on many other Champlain sea clays for strain rates grea- ter than 1.5 x ~O-‘S-~ and dub/da, greater than 0.45. The reasons are not well understood but could be due to the method of interpretation, and in particular to unrepresentative average values of uV’ and e,, and/or to a change in the rheological behaviour of the clays at high strain rates.
GENERALIZATION OF STRESS-STRAIN- STRAIN RATE RELATIONSHIP
Other eastern Canada clays
On clays from other sites of the Champlain sea basin, similar test series were performed by
COh4PRESSlBILITY OF NATURAL CLAYS 171
Fig. 16. Suggested rheological model for natmd clays
Terratech Ltd, Montreal (Samson et al., 1981), and the geotechnical section of Lava1 University, Quebec (Leahy, 1980). The data have been analysed and the results have been presented by Kabbaj et al. (1984). The behaviour was essen- tially the same as previously described and only typical results are shown here.
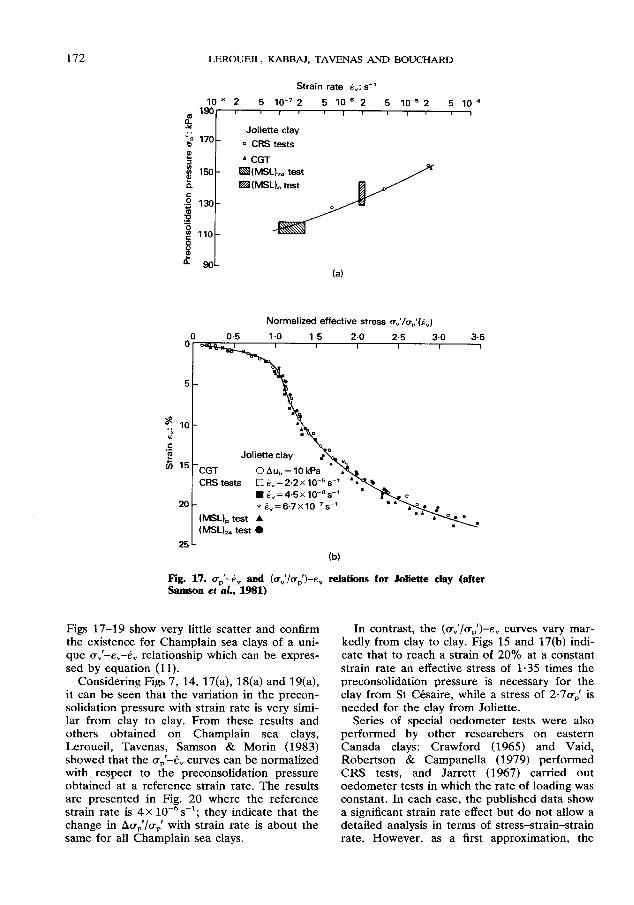
The clay from the Joliette site was sampled and tested using the same technique as for the St CCsaire clay. The main properties of this clay are presented in Table 1. Its conventional pre- consolidation pressure is 115 kPa. Three CRS tests (E, = 2.2 x 10m5 s-l, E, = 4.5 x lop6 s-l and 6, = 6.7 x 10e7 s-l), one CGT (Au, = 10 kPa) and two multiple-stage loading tests (one with re- loading after 24 h (MSL),,, and one with reload- ing after the end of primary consolidation (MSL),) were carried out. The preconsolidation pressures were associated to strain rates, as de- scribed earlier for the CGTs and the CRS tests; for the multiple-stage loading tests, the strain rate or range of strain rate was that obtained at the end of the two or three loadings just after a,’ had been passed, as suggested by Leroueil, Samson & Bozozuk (1983) and Leroueil, Tavenas, Samson & Morin (1983). The precon-
solidation pressure-strain rate relation is shown in Fig. 17(a) while the normalized stress-strain relation ((a,‘/~,‘)-e,) is shown in Fig. 17(b). If the variation in the preconsolidation pressure with strain rate is similar to the variations ob- served for the clays from Batiscan and St Cesaire, the normalized stress-strain curve is much flatter, the stress necessary to reach a strain of 20% being 2.7 times the preconsolidation pressure, compared with 1.5 and 1.35 times for the clays from Batiscan and St Cesaire.
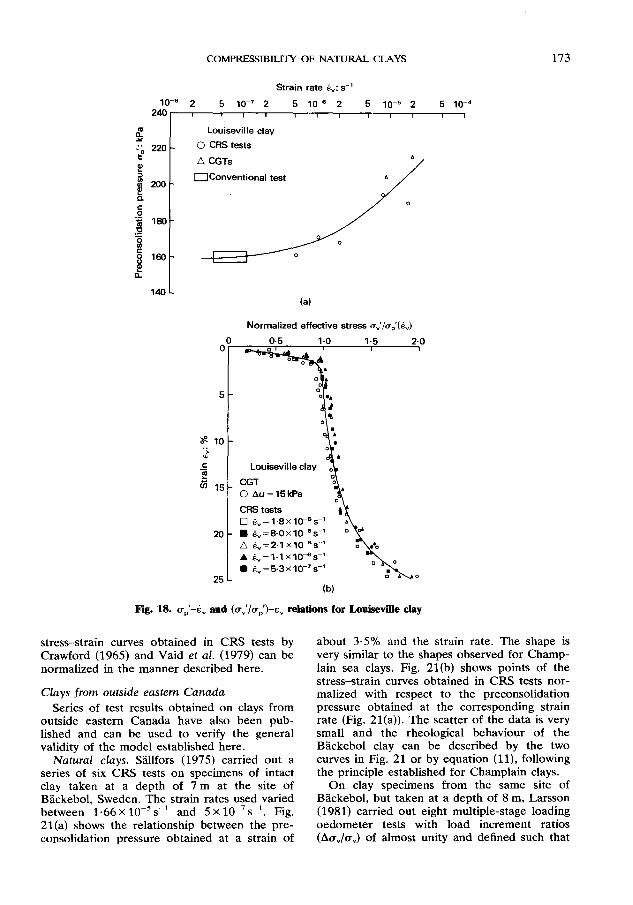
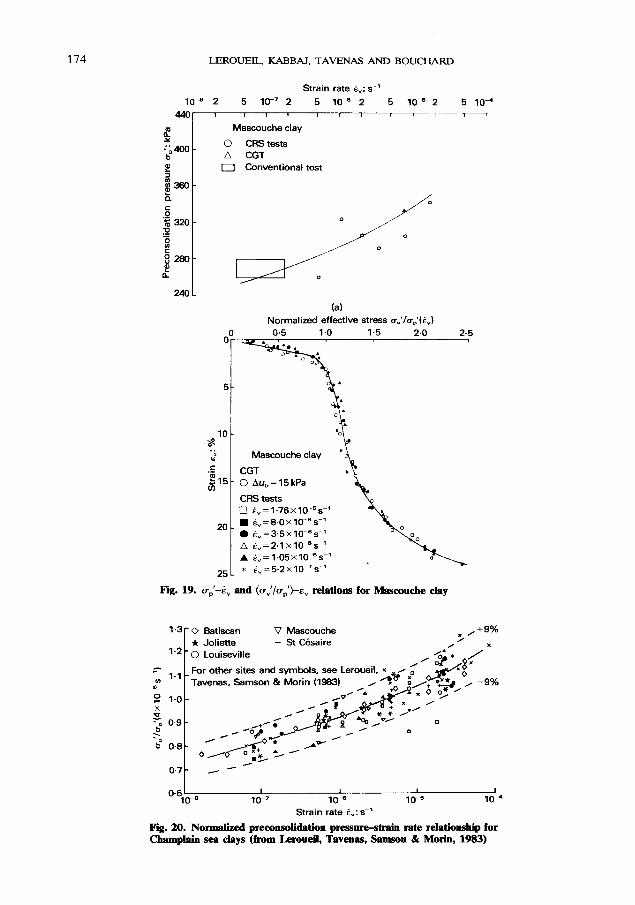
The clays from the Louiseville and Mascouche sites were sampled and tested using the same technique as for the Batiscan clay. Their main properties are presented in Table 1 and their conventional preconsolidation pressures are re- spectively 160 kPa and 270 kPa. On both clays, series of CRS tests with strain rates varying between 5.2 x lo-’ s-l and 1.8~ 10e5 s-l and one CGT with a pore pressure difference hub = 15 kPa were carried out. The preconsolidation pressure-strain rate relations are shown in Figs 18(a) and 19(a) while the normalized stress- strain relations are shown in Figs 18(b) and 19(b).
The three series of test results presented in
172 LEROUEIL, KABBAJ, TAVENAS AND BOUCHARD
Strain rate 0,: s-’
10~8 2 5 10-7 2 5 10-e 2 5 10-s 2 5 10-d rnlW ’ I I 1 1 1 I ! 1 !?? ‘i 170-
Joliette clay
0 CRS tests F z
A CGT a 150 - p!
m(MSL), test
P @MSL), test
.! 1=- ;i rr a g 110-
Normalized effective stress o,‘/o,‘(P,)
O0 o-5 1.0 1.5 2.0 2.5 3.0 3.5 I I I f
5-
?I JO- :
OAu, = 10 kPa
(MSL), test A (MSL), test 0
25-
(b)
Fig. 17. ~~'4, and (cT.,'/u~')-E, relations for Joliette cfay (after Samson et al., 1981)
Figs 17-19 show very little scatter and confirm the existence for Champlain sea clays of a uni- que u,‘--E,--E, relationship which can be expres- sed by equation (11).
Considering Figs 7, 14, 17(a), 18(a) and 19(a), it can be seen that the variation in the precon- solidation pressure with strain rate is very simi- lar from clay to clay. From these results and others obtained on Champlain sea clays, Leroueil, Tavenas, Samson & Morin (1983) showed that the uP’-E, curves can be normalized with respect to the preconsolidation pressure obtained at a reference strain rate. The results are presented in Fig. 20 where the reference strain rate is 4 x 10m6 s-‘; they indicate that the change in AoP’/uP’ with strain rate is about the same for all Champlain sea clays.
In contrast, the (od/crP’)-~V curves vary mar- kedly from clay to clay. Figs 15 and 17(b) indi- cate that to reach a strain of 20% at a constant strain rate an effective stress of 1.35 times the preconsolidation pressure is necessary for the clay from St CCsaire, while a stress of 2.7~~’ is needed for the clay from Joliette.
Series of special oedometer tests were also performed by other researchers on eastern Canada clays: Crawford (1965) and Vaid, Robertson & Campanella (1979) performed CRS tests, and Jarrett (1967) carried out oedometer tests in which the rate of loading was constant. In each case, the published data show a significant strain rate effect but do not allow a detailed analysis in terms of stress-strain-strain rate. However, as a first approximation, the
COMPRESSIBILITY OF NATURAL CLAYS 173
Strain rate 8,: 5’
10-S 2 5 10-7 2 5 10-S 2 5 10-s 2 5 10-a 2401 , I 1 I I I I I I I ,
Louiseville clay
0 CRS tests
A CGTs
!3Conventionel test
Normalized effective stress ~,‘/a,‘(&)
0 Au=lSkPa
W
Fig. 18. (~~‘4, and (uv’/crp’)-~, relations for L.ouisedle clay
stress-strain curves obtained in CRS tests by Crawford (1965) and Vaid et al. (1979) can be normalized in the manner described here.
Clays from outside eastern Canada
Series of test results obtained on clays from outside eastern Canada have also been pub- lished and can be used to verify the general validity of the model established here.
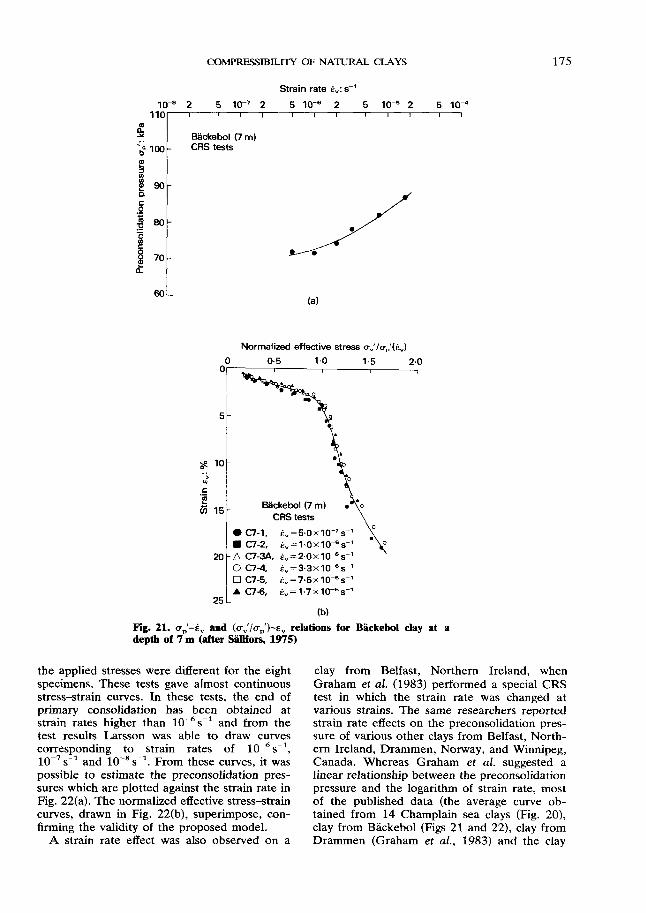
Natural clays. SZlfors (1975) carried out a series of six CRS tests on specimens of intact clay taken at a depth of 7 m at the site of BHckebol, Sweden. The strain rates used varied between 1.66 x lo-’ s-l and 5 x 10m7 s-l. Fig. 21(a) shows the relationship between the pre- consolidation pressure obtained at a strain of
about 3.5% and the strain rate. The shape is very similar to the shapes observed for Champ- lain sea clays. Fig. 21(b) shows points of the stress-strain curves obtained in CRS tests nor- malized with respect to the preconsolidation pressure obtained at the corresponding strain rate (Fig. 21(a)). The scatter of the data is very small and the rheological behaviour of the B&ckebol clay can be described by the two curves in Fig. 21 or by equation (ll), following the principle established for Champlain clays.
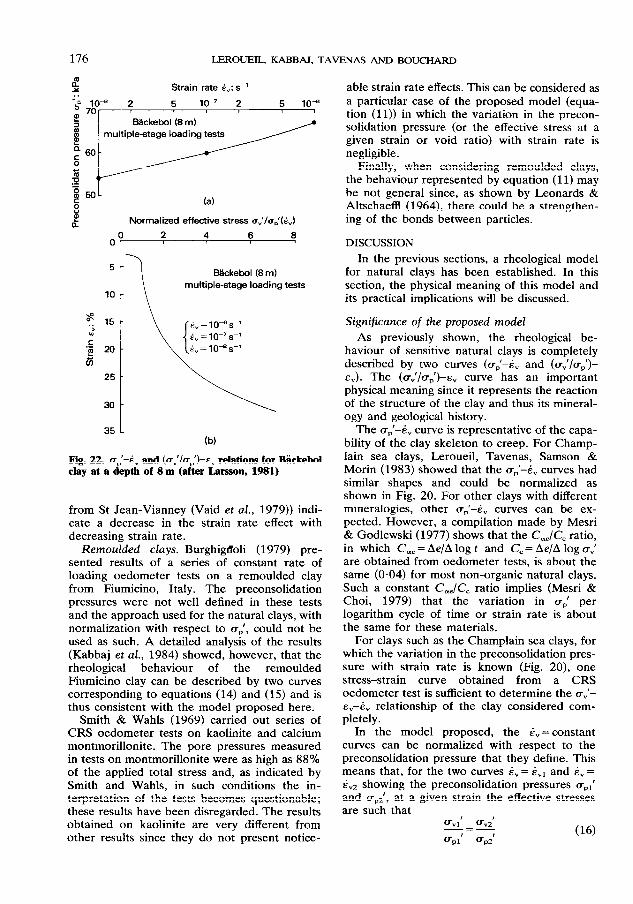
On clay specimens from the same site of B&kebol, but taken at a depth of 8 m, Larsson (1981) carried out eight multiple-stage loading oedometer tests with load increment ratios (Aa,/cJ of almost unity and defined such that
174 LEFtOUJZIL, KABBAJ, TAVENAS AND BOUCHARD
Strain rate d,: s-’
10-B 2 5 lo-’ 2 5 10-e 2 5 10-S 2 5 IO-4 440‘ 1 I , , I I I I 1 1-n
g Mascouche clay
”
b
400 0 cFEtests -
A CGT E 0 Conventional test z m36c- c P
s ‘g 320 - 0
C
5
20
25
I?-
,-
(a) Normalized effective stress a,‘/a,‘(B,)
0.5 1.0 1.5 2.0
Mascouche clay
CGT 0 Au,=lSkPa
c!?S tests 0 d, = 1.76x 10⁻⁵s-’ n 1,=6.0~10-~s-’ 0 &=3.5xlo~~s-’ A &=2~1~1O~~s~’ A Q,=1.05x10-~s-’ * i, = 5.2~ IO-‘s-’
Fig. 19. ~~‘4, and (u,‘/u~‘)-E, relations for Mascooche thy
1.3- 0 Batiscan V Mascouche ;
,+90/o t Joliette + St CBsaire
1’2 - 0 Louiseville
7 l.l For other sites and symbols, see Leroueil, *
Q” Tavenas, Samson & Morin (1983)
$ l.O-
:: 2 0.9-
> b 0.8-
0.7 - / - -
0.6 - I I I I 10-8 10-7 10-a 10-S 104
Strain rate 8,: se’
Fig. 20. Nomwlized precondidation pressurwdrain rate relationship for Champlain sea days (from Jaxooeil, Tavenas, Samson & Morin, 1983)
COh4PRESSlBlLlTY OF NATURAL CLAYS 175
Strain rate iv: s-’
10-e 2 5 10-5 2 5 10-s 2 5 10-S 2 5 104 1101 1 T I I 1 , 1 1 T I I 1
B;ickebl (7 m) CRS tests
(a)
Normalized effective stress o,‘/o,‘(&:,)
Bckebol (7 m)
20 A C7-34, 8,=2.0~10-~s-’
1 7
0 c74, ~,=3Glx10~s-' 0 c7-5, ~,=7.5xlo~=s-’ A c7-6, b, = 1.7 x lo-Es-’
25
b)
Fig. 21. up’-& and (a,‘/~,‘)-E, relations for Biickebol clay at a depth of 7 m (after SCillfors, 1975)
the applied stresses were different for the eight specimens. These tests gave almost continuous stress-strain curves. In these tests, the end of primary consolidation has been obtained at strain rates higher than 10-6s-1 and from the test results Larsson was able to draw curves corresponding to strain rates of 10-6s-1, ~O-‘S-~ and 10-8s-1. From these curves, it was possible to estimate the preconsolidation pres- sures which are plotted against the strain rate in Fig. 22(a). The normalized effective stress-strain curves, drawn in Fig. 22(b), superimpose, con- firming the validity of the proposed model.
A strain rate effect was also observed on a
clay from Belfast, Northern Ireland, when Graham et al. (1983) performed a special CRS test in which the strain rate was changed at various strains. The same researchers reported strain rate effects on the preconsolidation pres- sure of various other clays from Belfast, North- ern Ireland, Drammen, Norway, and Winnipeg, Canada. Whereas Graham et al. suggested a linear relationship between the preconsolidation pressure and the logarithm of strain rate, most of the published data (the average curve ob- tained from 14 Champlain sea clays (Fig. 20), clay from BHckebol (Figs 21 and 22), clay from Drammen (Graham et al., 1983) and the clay
176 LJZROUEIL, KABBAJ, TAVENAS AND BOUCHARD
Strain rate 8,: s-’
F P
Normalized effective stress o,‘/o,‘k,)
35 1 b)
Fig. 22. up’-iv and (u~‘/u,,‘)--E, relations for Bickebol clay at a depth of 8 m (after Larson, 1981)
from St Jean-Vianney (Vaid et al., 1979)) indi- cate a decrease in the strain rate effect with decreasing strain rate.
Remoulded clays. Burghigffoli (1979) pre- sented results of a series of constant rate of loading oedometer tests on a remoulded clay from Fiumicino, Italy. The preconsolidation pressures were not well defined in these tests and the approach used for the natural clays, with normalization with respect to up’, could not be used as such. A detailed analysis of the results (Kabbaj et al., 1984) showed, however, that the rheological behaviour of the remoulded Fiumicino clay can be described by two curves corresponding to equations (14) and (15) and is thus consistent with the model proposed here.
Smith & Wahls (1969) carried out series of CRS oedometer tests on kaolinite and calcium montmorillonite. The pore pressures measured in tests on montmorillonite were as high as 88% of the applied total stress and, as indicated by Smith and Wahls, in such conditions the in- terpretation of the tests becomes questionable; these results have been disregarded. The results obtained on kaolinite are very different from other results since they do not present notice-
able strain rate effects. This can be considered as a particular case of the proposed model (equa- tion (11)) in which the variation in the precon- solidation pressure (or the effective stress at a given strain or void ratio) with strain rate is negligible.
Finally, when considering remoulded clays, the behaviour represented by equation (11) may be not general since, as shown by Leonards & Altschaeffl (1964), there could be a strengthen- ing of the bonds between particles.
DISCUSSION In the previous sections, a rheological model
for natural clays has been established. In this section, the physical meaning of this model and its practical implications will be discussed.
Significance of the proposed model
As previously shown, the rheological be- haviour of sensitive natural clays is completely described by two curves ((+p)-E, and (~:/a,‘)- E,). The (u~‘/u~‘)--E, curve has an important physical meaning since it represents the reaction of the structure of the clay and thus its mineral- ogy and geological history.
The al)‘-& curve is representative of the capa- bility of the clay skeleton to creep. For Champ- lain sea clays, Leroueil, Tavenas, Samson & Morin (1983) showed that the a,‘-& curves had similar shapes and could be normalized as shown in Fig. 20. For other clays with different mineralogies, other trO’-&, curves can be ex- pected. However, a compilation made by Mesri & Godlewski (1977) shows that the C,,/C, ratio, in which C,, = Ae/A log t and C, = Ae/A log a,’ are obtained from oedometer tests, is about the same (O-04) for most non-organic natural clays. Such a constant C,,/C, ratio implies (Mesri & Choi, 1979) that the variation in up’ per logarithm cycle of time or strain rate is about the same for these materials.
For clays such as the Champlain sea clays, for which the variation in the preconsolidation pres- sure with strain rate is known (Fig. 20), one stress-strain curve obtained from a CRS oedometer test is sufficient to determine the ov’- F,--E, relationship of the clay considered com- pletely.
In the model proposed, the E,= constant curves can be normalized with respect to the preconsolidation pressure that they define. This means that, for the two curves E, = E,, and & = & showing the preconsolidation pressures uPl’ and up*‘, at a given strain the effective stresses are such that
%I U”2’ _=- UPI’ up*’
(16)
COMPREssIBlLlTY OF NATURAL CLAYS
- &=10-6s-’
-- &=,O-Ps-’
-.- 6, ZE lo- s-’
___ Schematic CGl
Effective stress cr”‘: kPa
Fig. 23. schematic state path followed daring a con- trolled gradient oedometer test
This equation can also be written as
log a,r’ -log a,*’ = log c+’ -log a@ (17)
which indicates that in an a,-log u,’ diagram the distance log a”,‘-log uVz’ between two E, = constant curves is a constant.
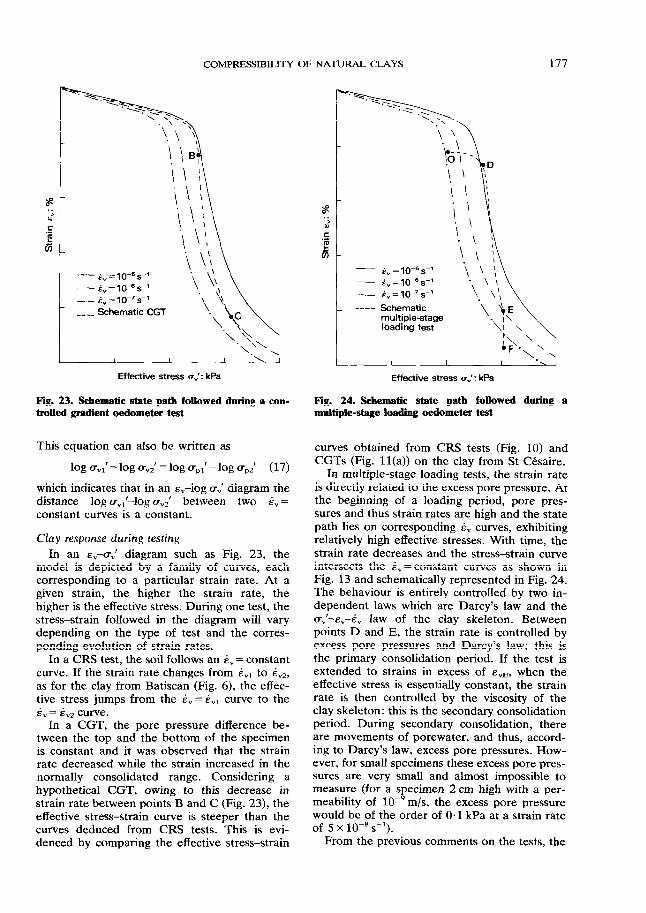
Clay response during testing
In an E”--CT.,’ diagram such as Fig. 23, the model is depicted by a family of curves, each corresponding to a particular strain rate. At a given strain, the higher the strain rate, the higher is the effective stress. During one test, the stress-strain followed in the diagram will vary depending on the type of test and the corres- ponding evolution of strain rates.
In a CRS test, the soil follows an & = constant cuNe. If the strain rate changes from E,, to .&, as for the clay from Batiscan (Fig. 6), the effec- tive stress jumps from the i,= E,r curve to the E, = E,z curve.
In a CGT, the pore pressure difference be- tween the top and the bottom of the specimen is constant and it was observed that the strain rate decreased while the strain increased in the normally consolidated range. Considering a hypothetical CGT, owing to this decrease in strain rate between points B and C (Fig. 23), the effective stress-strain curve is steeper than the curves deduced from CRS tests. This is evi- denced by comparing the effective stress-strain
s . : .5 c 63
Fig.
- 8, 10-5 s-1 = -- 6, = 10-e s-’
-.- 1, = 10-7 s-’
---- Schematic multiple-stage loading test
Effective stress a,‘: kPa
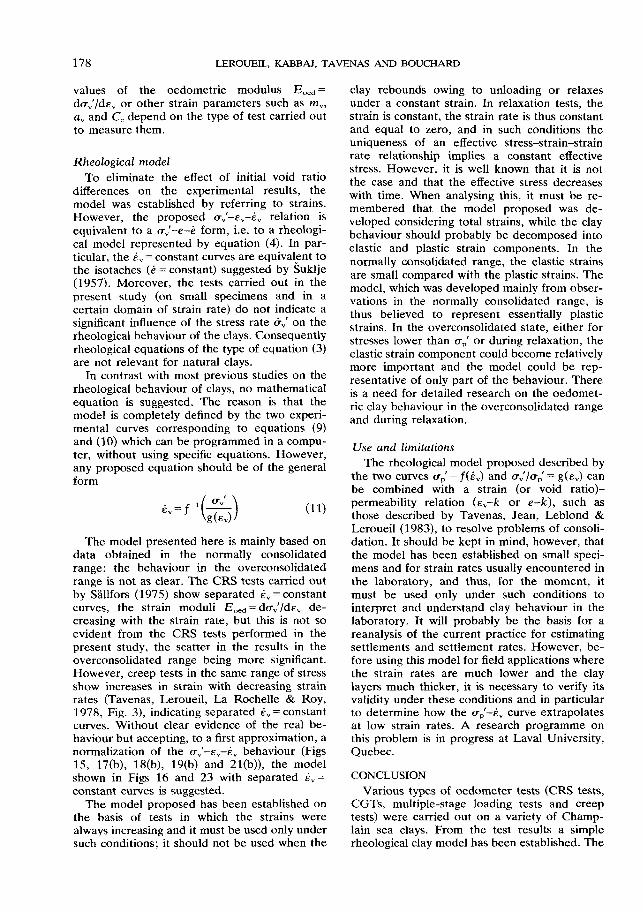
24. Schematic state path followed dming a multiple-stage loading oedometer test
curves obtained from CRS tests (Fig. 10) and CGTs (Fig. 11(a)) on the clay from St Cesaire.
In multiple-stage loading tests, the strain rate is directly related to the excess pore pressure. At the beginning of a loading period, pore pres- sures and thus strain rates are high and the state path lies on corresponding E, curves, exhibiting relatively high effective stresses. With time, the strain rate decreases and the stress-strain curve intersects the &=constant curves as shown in Fig. 13 and schematically represented in Fig. 24. The behaviour is entirely controlled by two in- dependent laws which are Darcy’s law and the u~‘--E,--E, law of the clay skeleton. Between points D and E, the strain rate is controlled by excess pore pressures and Darcy’s law: this is the primary consolidation period. If the test is extended to strains in excess of E,~, when the effective stress is essentially constant, the strain rate is then controlled by the viscosity of the clay skeleton: this is the secondary consolidation period. During secondary consolidation, there are movements of porewater, and thus, accord- ing to Darcy’s law, excess pore pressures. How- ever, for small specimens these excess pore pres- sures are very small and almost impossible to measure (for a specimen 2 cm high with a per- meability of 10-9m/s, the excess pore pressure would be of the order of 0.1 kPa at a strain rate of 5 x lo-* s-l).
From the previous comments on the tests, the
178 LEROUEIL, KABBAJ, TAVENAS AND BOUCHARD
values of the oedometric modulus E,,= do,‘/de, or other strain parameters such as m,, a, and C, depend on the type of test carried out to measure them.
Rheological model
To eliminate the effect of initial void ratio differences on the experimental results, the model was established by referring to strains. However, the proposed (+d-E,--F, relation is equivalent to a a,‘-e-i? form, i.e. to a rheologi- cal model represented by equation (4). In par- ticular, the E, = constant curves are equivalent to the isotaches (i’ = constant) suggested by Suklje (1957). Moreover, the tests carried out in the present study (on small specimens and in a certain domain of strain rate) do not indicate a significant influence of the stress rate civ’ on the rheological behaviour of the clays. Consequently rheological equations of the type of equation (3) are not relevant for natural clays.
In contrast with most previous studies on the rheological behaviour of clays, no mathematical equation is suggested. The reason is that the model is completely defined by the two experi- mental curves corresponding to equations (9) and (10) which can be programmed in a compu- ter, without using specific equations. However, any proposed equation should be of the general form
a”’ &=f-’ - ( ) g(G) (11)
The model presented here is mainly based on data obtained in the normally consolidated range; the behaviour in the overconsolidated range is not as clear. The CRS tests carried out by Sallfors (1975) show separated 6, = constant curves, the strain moduli E,,=du”‘/da, de- creasing with the strain rate, but this is not so evident from the CRS tests performed in the present study, the scatter in the results in the overconsolidated range being more significant. However, creep tests in the same range of stress show increases in strain with decreasing strain rates (Tavenas, Leroueil, La Rochelle & Roy, 1978, Fig. 3), indicating separated &, = constant curves. Without clear evidence of the real be- haviour but accepting, to a first approximation, a normalization of the uV’-E,--E, behaviour (Figs 15, 17(b), 18(b), 19(b) and 21(b)), the model shown in Figs 16 and 23 with separated E,= constant curves is suggested.
The model proposed has been established on the basis of tests in which the strains were always increasing and it must be used only under such conditions; it should not be used when the
clay rebounds owing to unloading or relaxes under a constant strain. In relaxation tests, the strain is constant, the strain rate is thus constant and equal to zero, and in such conditions the uniqueness of an effective stress-strain-strain rate relationship implies a constant effective stress. However, it is well known that it is not the case and that the effective stress decreases with time. When analysing this, it must be re- membered that the model proposed was de- veloped considering total strains, while the clay behaviour should probably be decomposed into elastic and plastic strain components. In the normally consolidated range, the elastic strains are small compared with the plastic strains. The model, which was developed mainly from obser- vations in the normally consolidated range, is thus believed to represent essentially plastic strains. In the overconsolidated state, either for stresses lower than u,,’ or during relaxation, the elastic strain component could become relatively more important and the model could be rep- resentative of only part of the behaviour. There is a need for detailed research on the oedomet- ric clay behaviour in the overconsolidated range and during relaxation.
Use and limitations The rheological model proposed described by
the two curves a,’ = f(.&) and u</upl = g(e,) can be combined with a strain (or void ratio)- permeability relation (E,-k or e-k), such as those described by Tavenas, Jean, Leblond & Leroueil (1983), to resolve problems of consoli- dation. It should be kept in mind, however, that the model has been established on small speci- mens and for strain rates usually encountered in the laboratory, and thus, for the moment, it must be used only under such conditions to interpret and understand clay behaviour in the laboratory. It will probably be the basis for a reanalysis of the current practice for estimating settlements and settlement rates. However, be- fore using this model for field applications where the strain rates are much lower and the clay layers much thicker, it is necessary to verify its validity under these conditions and in particular to determine how the a,‘--&, curve extrapolates at low strain rates. A research programme on this problem is in progress at Lava1 University, Quebec.
CONCLUSION Various types of oedometer tests (CRS tests,
CGTs, multiple-stage loading tests and creep tests) were carried out on a variety of Champ- lain sea clays. From the test results a simple rheological clay model has been established. The
COMPFESSlBILlTY OF NATURAL CLAYS 179
clay behaviour under one-dimensional compres- sion is controlled by a unique stress-strain- strain rate relationship which can be described by only two curves (a,‘-& and (cT,‘/u~‘)- E,). This model is a pariicular case of the isotache model proposed by Suklje (1957).
From published data on secondary consolida- tion and strain rate effects, this model may be representative of a: large variety of natural clays. However, the model has been established on specimens of small thickness in which the strain was continuously increasing, and, for the mo- ment, it must be used only in these conditions.
ACKNOWLEDGEMENTS The work carried out at Lava1 University was
supported by grants from the ministries of Transport and Education of Quebec and from the National Sciences and Engineering Research Council of Canada. The contribution of D. Leahy and P. Leblond who performed some of the laboratory tests is gratefully acknowledged.
Part of the research was performed by Ter- ratech as an unsolicited proposal sponsored by the Division of Building Research of the Na- tional Research Council of Canada and was financed by the Division of Building Research of the National Research Council and Supply and Services Canada under contract lSX79-00026. The Authors thank J. P. Le Bihan, P. Morin and L. Samson for performing the tests and for constructive discussions.
REFERENCES Aboshi, H. (1973). An experimental investigation on
the similitude in the consolidation of a soft clay, including the secondary creep settlement. Proc. 8th Int. Conf. Soil Mech. Fdn Engng, Moscow 4, No. 3, 88.
Barden, L. (1965). Consolidation of clay with non- linear viscosity. Gtotechnique 15, No. 4, 345-362.
Battelino, D. (1973). Oedometer testing of viscous soils. Proc. 8th Int. Conf. Soil Mech. Fdn Engng Moscow 1, No. 1, 25-30.
Berre, T. & Iversen, K. (1972). Oedometer tests with different specimen heights on a clay exhibiting large secondary compression. Ge’otechnique 22, No. 1, 53-70.
Bjerrum, L. (1967). Engineering geology of Norwegian normally consolidated marine clays as related to the settlements of buildings. Ge’otechnique 17, No. 2,83-118.
Bouchard, R. (1982). Eflet de la uitesse sur le com- portement oedomdtrique de I’argile de B&scan. MSc thesis, Laval University, Quebec.
Buisman, A. S. (1936). Results of long duration settle- ment tests. Proc. 1st Int. Conf. Soil Mech. Fdn Engng, Cambridge 1,103-107.
Burghignoli, A. (1979). An experimental study of the
structural viscosity of soft clays by means of con- tinuous consolidation tests. Proc. 7th Eur. Conf. Soil Mech. Fdn Engng, Brighton 2, 23-28.
Crawford, C. B. (1965). The resistance of soil struc- ture to consolidation. Can. Geotech. J. 2, No. 2, 90-97.
Davis, E. H. & Raymond, G. P. (1965). A non-linear theory of consolidation. Gtotechnique 15, No. 2, 161-173.
Gibson, R. E. & Lo, K. Y. (1961). A theory of consolidation for soils exhibiting secondary compres- sion. Report No. 41, Norwegian Geotechnical In- stitute.
Graham, J., Crooks, J. H. A. & Bell, A. L. (1983). Time effects on the stress-strain behaviour of natural soft clays. Gtotechnique 33, No. 3, 327- 340.
Hansen, B. (1969). A mathematical model for creep phenomena in clay. Proc. 7th Int. Conf. Soil Mech. Fdn Engng, Mexico City, Specialty session 12, pp. 12-18.
Hawley, J. G. & Borin, D. L. (1973). A unified theory for the consolidation of clays. Proc. 8th Int. Conf. Soil Mech. Fdn Engng, Moscow 1, No. 3, 107-119.
Janbu, N., Tokheim, 0. & Senneset, K. (1981). Con- solidation tests with continuous loading. Proc. 10th Int. Conf. Soil Mech. Fdn Engng, Stockholm 1, 645-654.
Jarrett, P. M. (1967). Time-dependent consolidation of a sensitive clay. Bull. Am. Sot. Test. Mater 7, No. 7, 300-304.
Kabbaj, M., Leroueil, S. & Tavenas, F. (1984). Dtueloppement d’une loi rhtologique repr&entatiue du comportement en laboratoire des argiles naturef- les. Internal Report, Department of Civil En- gineering, Lava1 University, Quebec.
Koppejan, A. W. (1948). A formula combining the Terzaghi load compression relationship and the Buisman secular time effect. Proc. 2nd Int. Conf. Soil Mech. Fdn Engne, Rotterdam 3,32-37.
Ladd, C. C., Foott, R., Ishihara, K., Schlosser, F. & Poulos. H. J. (1977). Stress-deformation and strength characte;isti& Proc. 9th Int. Conf. Soil Mech. Fdn Engng, Tokyo 2, State of the art report, pp. 421-494.
La Rochelle, P., Sarrailh, J., Tavenas, F., Roy, M. & Leroueil, S. (1981). Causes of sampling distur- bance and design of a new sampler for sensitive soils. Can. Geotech. J. 18, No. 1, 52-66.
Larsson, R. (1981). Drained behaviour of Swedish clays. Report No. 12, Swedish Geotechnical Insti- tute.
Leahy, D. (1980). Contribution h I’ttude du comporte- ment oedomktique des argiles. MSc thesis, Depart- ment of Civil Engineering, Lava1 University, Quebec.
Lebuis, J., Robert, J. M. & Rissmann, P. (1982). Regional mapping of landslide hazard. Int. Symp. Landslides, Linkbping, pp. 205-262.
Leonards, G. A. (1977). Proc. 9th Int. Conf. Soil Mech. Fdn Engng, Tokyo 3, Panel discussion, pp. 384- 386.
Leonards, G. A. & Altschaeffl, A. G. (1964). Com- pressibility of clay. J. Soil Mech. Fdns Div. Am. Sot. Civ. Engrs 90, SM5, 133-155.
180 LEROUElL, KABBAI, TAVENAS AND BOUCHARD
Leonards, G. A. & Girault, P. (1961). A study of one-dimensional consolidation test. Proc. 5th Int. Conf. Soil Mech. Fdn Engng, Paris 1, 213-218.
Leroueil, S. (1977). Quelques considerations sur le comportement des argiles sensibles. PhD thesis, De- partment of Civil Engineering, Lava1 University, Quebec.
Leroueil, S., Le Bihan, J. P. & Tavenas, F. (1980). An approach for the determination of the preconsoli- dation pressure in sensitive clays. Can. Geotech. J. 17, No. 3, 446-4.53.
Leroueil, S., Samson, L. & Bozozuk, M. (1983). Laboratory and field determination of preconsoli- dation pressure at Gloucester. Can. Geotech. J. 20, No. 3, 477-490.
Leroueil, S., Tavenas, F. & Le Bihan, J. P. (1983). Proprittes caracteristiques des argiles de Test du Canada. Can. Geotech. J. 20, No. 4, 681-705.
Leroueil, S., Tavenas, F., Samson, L. & Morin, P. (1983). Preconsolidation pressure of Champlain clays: part II-laboratory determination. ‘Can. Geotech. J. 20, No. 4. 803-816.
Lowe, J. III, Jonas, E. & Obrician, V. (1969). Con- trolled gradient consolidation test. J. Soil Mech. Fdns Div. Am. Sot. Ciu. Engrs. 95, SMl, 77-97.
Mesri, G. & Choi, Y. K. (1979). Strain rate behaviour of the Saint-Jean-Vianney clay: discussion. Can. Geotech. J. 16, No. 4, 831-834.
Mesri, G. & Godlewski, P. M. (1977). Time and stress compressibility interrelationship. J. Geotech. Engng Div. Am. Sot. Ciu. Engrs 103, GT5, 417-430.
Morin, P., Leroueil, S. & Samson, L. (1983). Precon- solidation pressure of Champlain clays: part I, in situ determination. Can. Geotech. J. 20, No. 4, 782-802.
Poorooshasb, H. B. & Sivapatham, T. (1969). Consoli- dation of sensitive clays exhibiting strong structural breakdown. Proc. 7th Int. Conf. Soil Mech. Fdn Engng, Mexico City, Specialty session 12, pp. 27- 37.
Poskitt, T. J. & Birdsall, R. 0. (1971). A theoretical and experimental investigation of mildly non-linear consolidation behaviour in saturated soil. Can. Geotech. J. 8, No. 2, 182-216.
Siillfors, G. (1975). Preconsolidation pressure of soft high plastic clays. PhD thesis, Chalmers University of Technology, Gothenburg.
Samson, L., Leroueil, S., Morin, P. & Le Bihan, J. P.
(1981). Pressions de p&consolidation des argiles sensibles. DSS Contract lSX79-00026. Division of Building Research of the National Research Coun- cil of Canada.
Sekiguchi, H. & Toriihara, M. (1976). Theory of one- dimensional consolidation of clays with cbnsidera- tion of their rheoloaical orooerties. Soils Fdns 16. No. 1, 27-44. - _ _
Smith, R. E. & Wahls, H. E. (1969). Consolidation under constant rates of strain. J. Soil Mech. Fdns Div. Am. Sot. Ciu. Engrs 95, SM2, 519-539.
Suklje, L. (1957). The analysis of the consolidation process of the isotache method. Proc. 4th Int. Conf. Soil Mech. Fdn Engng, London 1, 200-206.
Suklie, L. (1969a). Rheoloaical asoects of soil mechanics. London: Wiley-Interscience.
Suklje, L. (1969b). Consolidation of viscous soils sub- jected to continuously increasing uniform load. In New advances in soil mechanics, Vol. 1, pp. 199- 235. Praha.
Tavenas, F., Jean, P., Leblond, P. & Leroueil, S. (1983). The permeability of natural soft clays: part II, permeability characteristics. Can. Geotech. J. 20, No. 4, 645-660.
Tavenas, F., Leroueil, S., La Rochelle, P. & Roy, M. (1978). Creep behaviour of an undisturbed lightly overconsolidated clay. Can. Geotech. J. 15, No. 3, 402-423.
Taylor, D. W. (1942). Research on consolidation of clays. Series 82, Massachusetts Institute of Tech- nology.
Taylor, D. W. & Merchant, W. (1940). A theory of clay consolidation accounting for secondary com- pression. .I. Math. Phys. 19, 167-185.
Terzaghi, K. (1923). Die Berechnung der Durchlassig- keitsziffer des Tones aus dem Verlauf der hyd- rodynamischen Spannungserscheinungen. Sber. Wien. Akad. Wiss. 132, Nos. 3 & 4.
Vaid, Y. P., Robertson, P. K. & Campanella, R. G. (1979). Strain rate behaviour of Saint-Jean- Vianney clay. Can. Geotech. .I. 16, No. 1, 34-42.
Wissa, A. E. Z., Christian, J. T., Davis, E. H. & Heiberg, S. (1971). Consolidation at constant rate of strain. J. Soil Mech. Fdns Div. Am. Sot. Ciu. Engrs 97, SMIO, 1393-1413.
Wu, T. H., Resendiz, D. & Neukirchner, R. J. (1966). Analysis of consolidation by rate process theory. I. Soil Mech. Fdns Diu. Am. Sot. Ciu. Engrs 92, SM6, 229-248.