Stress measurements at great depth at Craig-Onaping … · 1500m deep and blasthole/longhole and...
10
1 INTRODUCTION Effective planning, design and operation of deep underground mines requires a good under- standing of the geological environment. In essence, knowledge of large scale structures, rock mass strength and deformability, as well as in-situ stress is required prior to the start of the min- ing operations. These data are required as input to numerical models of the planned extraction sequences in order to predict the performance of excavations and to design appropriate ground support schemes. Over the last ten years researchers at the Western Australian School of Mines (WASM) have developed techniques for measuring in-situ stress from oriented core, obtained from remote locations well in advance of mining development (Villaescusa et al,2002; 2003). This information can be used to estimate the mobilized shear stress on large scale structures that are likely to cause failure, seismicity or influence the overall rock mass behaviour at a global mine scale (Windsor et al, 2007). 2 MINE LOCATION The Craig-Onaping Mine is located in the Onaping-Levack region on the Northwest rim of the Sudbury Igneous Complex, roughly 45 minutes from downtown Sudbury (see Figure 1). It is in close proximity to the Fraser Mine and the Strathcona Mill. The Onaping mine was amalga- mated with Craig to form one mine in 1997. Activity at the Onaping shaft has since decreased to providing a few services including second egress for Craig. The Craig Mine’s shaft is currently 1500m deep and blasthole/longhole and cut & fill stoping are the major mining methods used. Longhole/blasthole stoping accounts for about 70% of the mining that occurs while Cut-and-fill is used for the remaining 30%. Where geometry and continuity permit, blasthole mining Stress measurements at great depth at Craig-Onaping Mines, Sudbury Canada E. Villaescusa, L. Machuca & C. Windsor CRC Mining, Western Australian School of Mines, Kalgoorlie, WA, Australia B. Simser & S. Carlisle Xstrata Nickel, Onaping Ontario Canada ABSTRACT: Reliable estimation of in situ stress is a major step in the analysis and design of underground excavations in rock, particularly for evaluating the stability of underground struc- tures to prevent failure or collapse. In the last ten years, the Western Australian School of Mines (WASM) has studied and developed an AE stress measurement technique using orientated core named the WASM AE method. It allows the determination of a representative and detailed knowledge of the in situ stress field during the early stages of a project (such as mine feasibility studies), even in areas where development access is not yet available. The method has been used for in situ stress measurement at more than 80 mine sites worldwide with over 200 individual stress measurements carried out to date. This paper describes the sample collection, sample test- ing and reconciliation of results for very deep measurements carried out at the Craig-Onaping mine complex in Sudbury Canada. The results constitute the deepest measurements undertaken to date at the WA School of Mines and indicate that the main principal stress is horizontal and oriented parallel to a common regional sub trend in a NE/SW direction. ROCKENG09: Proceedings of the 3rd CANUS Rock Mechanics Symposium, Toronto, May 2009 (Ed: M.Diederichs and G. Grasselli) PAPER 4033 1
Transcript of Stress measurements at great depth at Craig-Onaping … · 1500m deep and blasthole/longhole and...
1 INTRODUCTION
Effective planning, design and operation of deep underground mines requires a good under-standing of the geological environment. In essence, knowledge of large scale structures, rock mass strength and deformability, as well as in-situ stress is required prior to the start of the min-ing operations. These data are required as input to numerical models of the planned extraction sequences in order to predict the performance of excavations and to design appropriate ground support schemes. Over the last ten years researchers at the Western Australian School of Mines (WASM) have developed techniques for measuring in-situ stress from oriented core, obtained from remote locations well in advance of mining development (Villaescusa et al,2002; 2003). This information can be used to estimate the mobilized shear stress on large scale structures that are likely to cause failure, seismicity or influence the overall rock mass behaviour at a global mine scale (Windsor et al, 2007).
2 MINE LOCATION
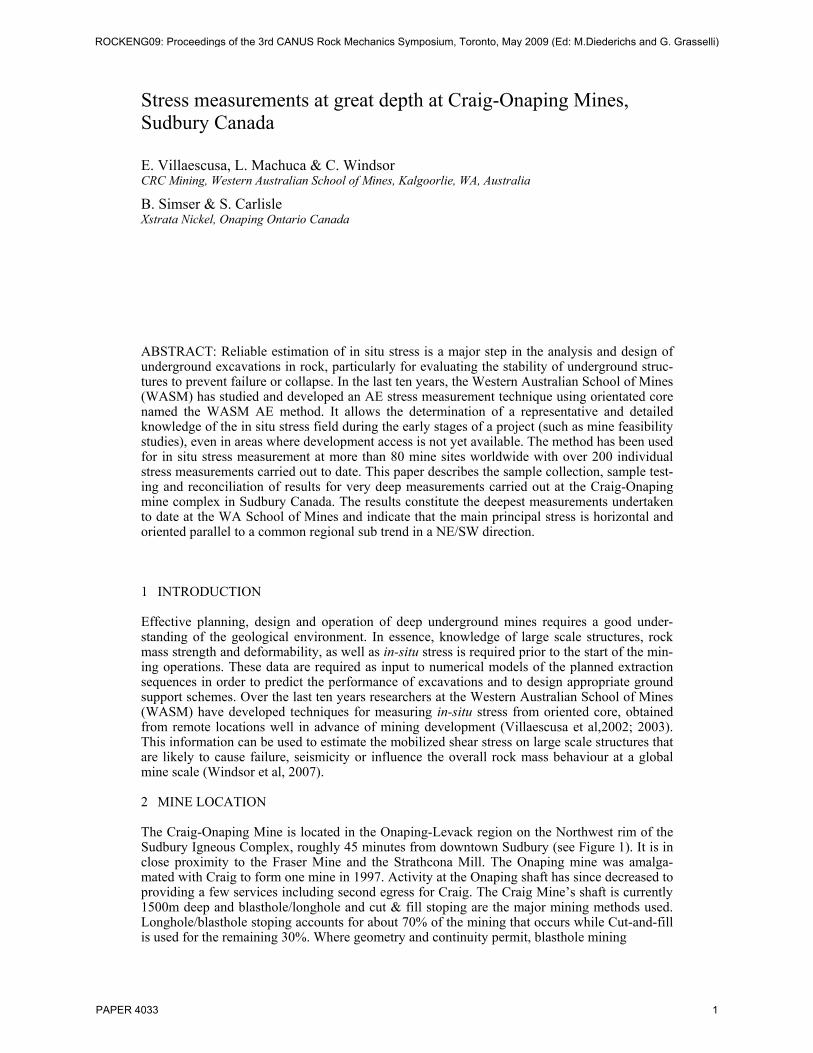
The Craig-Onaping Mine is located in the Onaping-Levack region on the Northwest rim of the Sudbury Igneous Complex, roughly 45 minutes from downtown Sudbury (see Figure 1). It is in close proximity to the Fraser Mine and the Strathcona Mill. The Onaping mine was amalga-mated with Craig to form one mine in 1997. Activity at the Onaping shaft has since decreased to providing a few services including second egress for Craig. The Craig Mine’s shaft is currently 1500m deep and blasthole/longhole and cut & fill stoping are the major mining methods used. Longhole/blasthole stoping accounts for about 70% of the mining that occurs while Cut-and-fill is used for the remaining 30%. Where geometry and continuity permit, blasthole mining
Stress measurements at great depth at Craig-Onaping Mines, Sudbury Canada
E. Villaescusa, L. Machuca & C. Windsor CRC Mining, Western Australian School of Mines, Kalgoorlie, WA, Australia
B. Simser & S. Carlisle Xstrata Nickel, Onaping Ontario Canada
ABSTRACT: Reliable estimation of in situ stress is a major step in the analysis and design of underground excavations in rock, particularly for evaluating the stability of underground struc-tures to prevent failure or collapse. In the last ten years, the Western Australian School of Mines (WASM) has studied and developed an AE stress measurement technique using orientated core named the WASM AE method. It allows the determination of a representative and detailed knowledge of the in situ stress field during the early stages of a project (such as mine feasibility studies), even in areas where development access is not yet available. The method has been used for in situ stress measurement at more than 80 mine sites worldwide with over 200 individual stress measurements carried out to date. This paper describes the sample collection, sample test-ing and reconciliation of results for very deep measurements carried out at the Craig-Onaping mine complex in Sudbury Canada. The results constitute the deepest measurements undertaken to date at the WA School of Mines and indicate that the main principal stress is horizontal and oriented parallel to a common regional sub trend in a NE/SW direction.
ROCKENG09: Proceedings of the 3rd CANUS Rock Mechanics Symposium, Toronto, May 2009 (Ed: M.Diederichs and G. Grasselli)
PAPER 4033 1
Strathcona-FraserStrathcona-Fraser
Onaping-CraigOnaping-Craig
CreightonCreightonCopper CliffCopper Cliff
Frood-StobieFrood-Stobie
FalconbridgeFalconbridge
LockerbyLockerby
Thayer LindsleyThayer Lindsley
Nickel RimNickel Rim
Figure 1. General illustration of the Sudbury basin area (MAP249 - Ontario Geological Survey).
is the method of choice; where the ore is more erratic and ‘poddy’ in nature, cut-and-fill is se-lected for mining. Cut-and-fill has, to date, been utilized for the greater percentage of the mining at Craig (~80%). If possible, the waste rock is placed in mined stopes so that it does not need to be hoisted to surface for disposal.
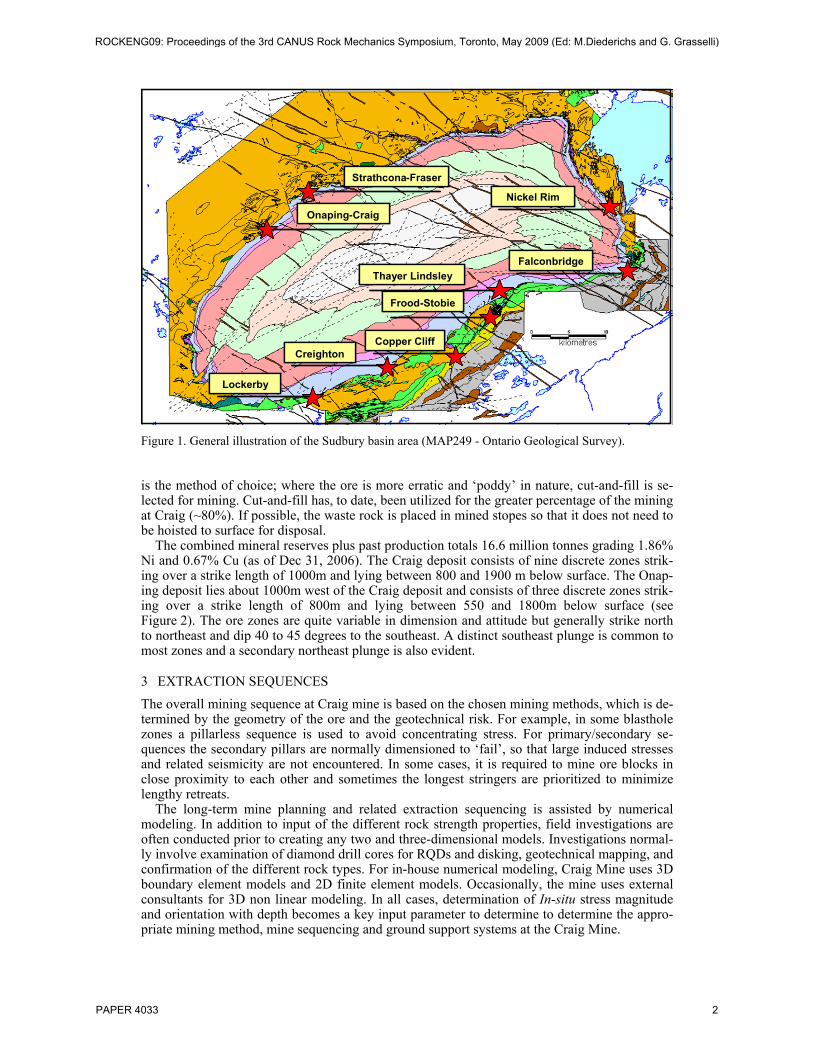
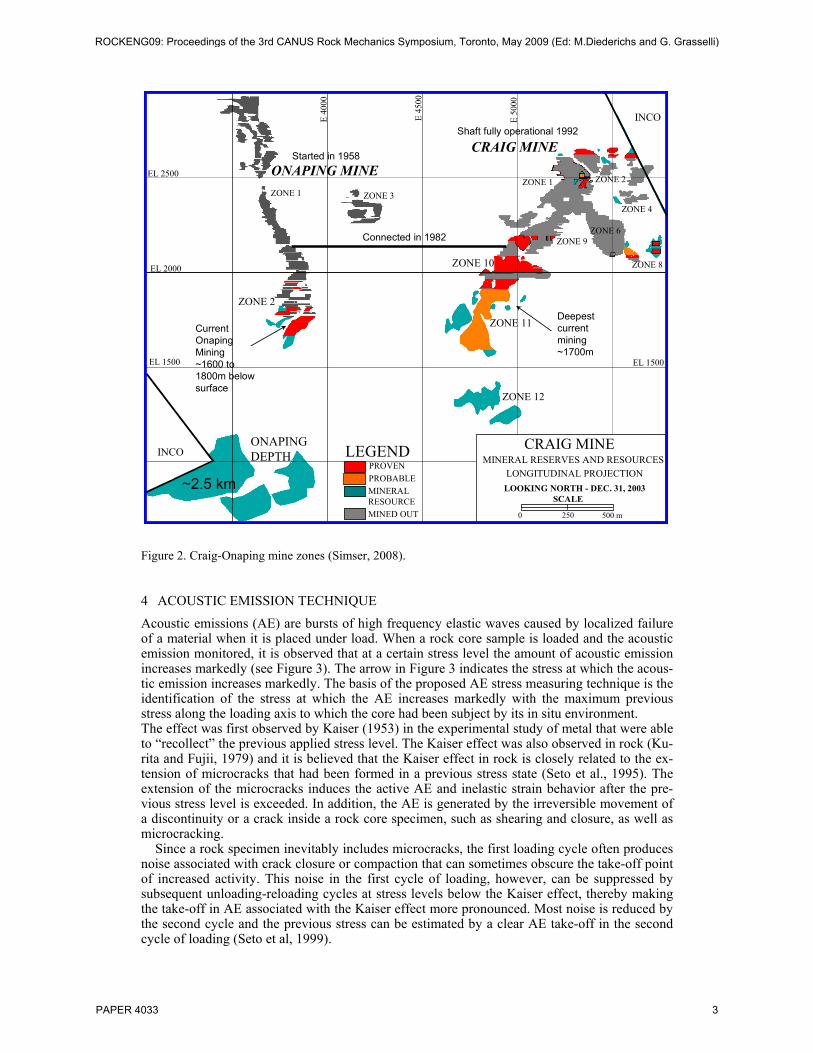
The combined mineral reserves plus past production totals 16.6 million tonnes grading 1.86% Ni and 0.67% Cu (as of Dec 31, 2006). The Craig deposit consists of nine discrete zones strik-ing over a strike length of 1000m and lying between 800 and 1900 m below surface. The Onap-ing deposit lies about 1000m west of the Craig deposit and consists of three discrete zones strik-ing over a strike length of 800m and lying between 550 and 1800m below surface (see Figure 2). The ore zones are quite variable in dimension and attitude but generally strike north to northeast and dip 40 to 45 degrees to the southeast. A distinct southeast plunge is common to most zones and a secondary northeast plunge is also evident.
3 EXTRACTION SEQUENCES
The overall mining sequence at Craig mine is based on the chosen mining methods, which is de-termined by the geometry of the ore and the geotechnical risk. For example, in some blasthole zones a pillarless sequence is used to avoid concentrating stress. For primary/secondary se-quences the secondary pillars are normally dimensioned to ‘fail’, so that large induced stresses and related seismicity are not encountered. In some cases, it is required to mine ore blocks in close proximity to each other and sometimes the longest stringers are prioritized to minimize lengthy retreats.
The long-term mine planning and related extraction sequencing is assisted by numerical modeling. In addition to input of the different rock strength properties, field investigations are often conducted prior to creating any two and three-dimensional models. Investigations normal-ly involve examination of diamond drill cores for RQDs and disking, geotechnical mapping, and confirmation of the different rock types. For in-house numerical modeling, Craig Mine uses 3D boundary element models and 2D finite element models. Occasionally, the mine uses external consultants for 3D non linear modeling. In all cases, determination of In-situ stress magnitude and orientation with depth becomes a key input parameter to determine to determine the appro-priate mining method, mine sequencing and ground support systems at the Craig Mine.
ROCKENG09: Proceedings of the 3rd CANUS Rock Mechanics Symposium, Toronto, May 2009 (Ed: M.Diederichs and G. Grasselli)
PAPER 4033 2
ONAPING MINE
CRAIG MINE
ZONE 1
ZONE 10
ZONE 11
ZONE 2
ZONE 3
ZONE 12
ONAPING DEPTH
ZONE 1
ZONE 8
ZONE 6ZONE 9
INCO
INCO
ZONE 2
ZONE 4
CRAIG MINE
LONGITUDINAL PROJECTIONLOOKING NORTH - DEC. 31, 2003
SCALE
0 250 500 m
MINERAL RESERVES AND RESOURCES
EL 1500 EL 1500
LEGENDPROVENPROBABLE
MINED OUT
MINERAL RESOURCE
E 50
00
E 40
00
E 45
00
EL 2000
EL 2500 ONAPING MINE
CRAIG MINE
ZONE 1
ZONE 10
ZONE 11
ZONE 2
ZONE 3
ZONE 12
ONAPING DEPTH
ZONE 1
ZONE 8
ZONE 6ZONE 9
INCO
INCO
ZONE 2
ZONE 4
CRAIG MINE
LONGITUDINAL PROJECTIONLOOKING NORTH - DEC. 31, 2003
SCALE
0 250 500 m
MINERAL RESERVES AND RESOURCES
EL 1500 EL 1500
LEGENDPROVENPROBABLE
MINED OUT
MINERAL RESOURCE
E 50
00
E 40
00
E 45
00
EL 2000
EL 2500
CurrentOnapingMining~1600 to1800m belowsurface
Deepestcurrentmining~1700m
Started in 1958
Connected in 1982
Shaft fully operational 1992
~2.5 km
Figure 2. Craig-Onaping mine zones (Simser, 2008).
4 ACOUSTIC EMISSION TECHNIQUE
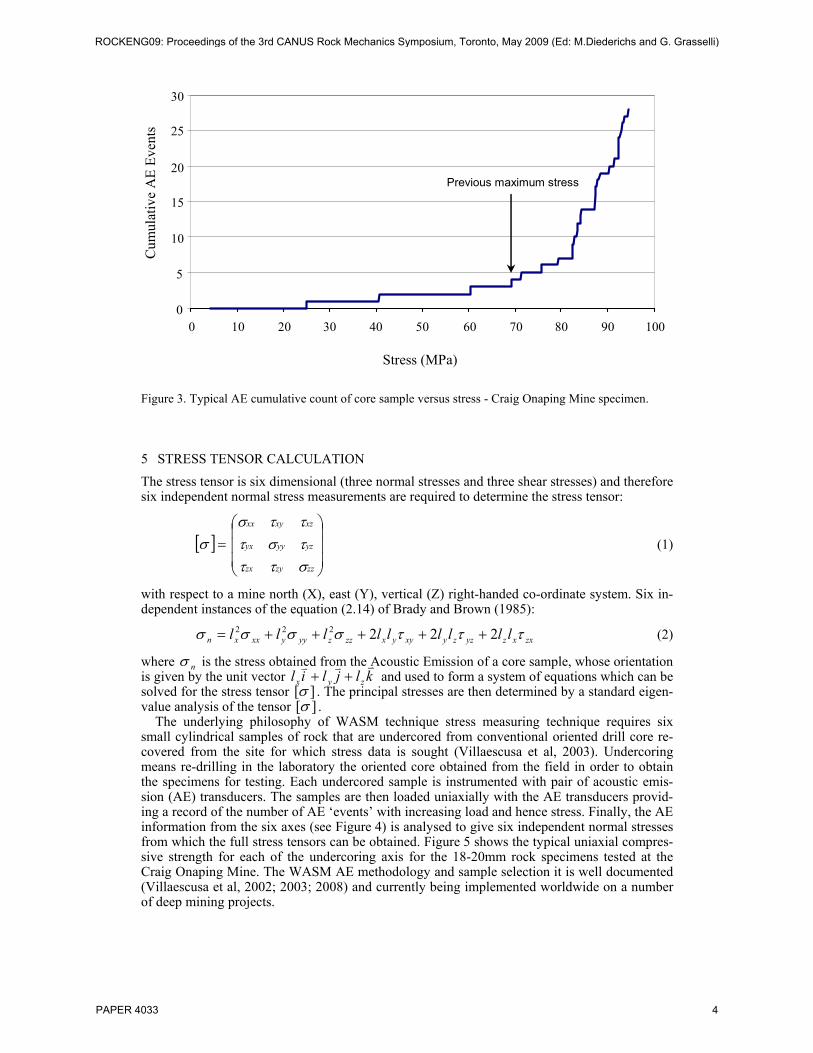
Acoustic emissions (AE) are bursts of high frequency elastic waves caused by localized failure of a material when it is placed under load. When a rock core sample is loaded and the acoustic emission monitored, it is observed that at a certain stress level the amount of acoustic emission increases markedly (see Figure 3). The arrow in Figure 3 indicates the stress at which the acous-tic emission increases markedly. The basis of the proposed AE stress measuring technique is the identification of the stress at which the AE increases markedly with the maximum previous stress along the loading axis to which the core had been subject by its in situ environment. The effect was first observed by Kaiser (1953) in the experimental study of metal that were able to “recollect” the previous applied stress level. The Kaiser effect was also observed in rock (Ku-rita and Fujii, 1979) and it is believed that the Kaiser effect in rock is closely related to the ex-tension of microcracks that had been formed in a previous stress state (Seto et al., 1995). The extension of the microcracks induces the active AE and inelastic strain behavior after the pre-vious stress level is exceeded. In addition, the AE is generated by the irreversible movement of a discontinuity or a crack inside a rock core specimen, such as shearing and closure, as well as microcracking.
Since a rock specimen inevitably includes microcracks, the first loading cycle often produces noise associated with crack closure or compaction that can sometimes obscure the take-off point of increased activity. This noise in the first cycle of loading, however, can be suppressed by subsequent unloading-reloading cycles at stress levels below the Kaiser effect, thereby making the take-off in AE associated with the Kaiser effect more pronounced. Most noise is reduced by the second cycle and the previous stress can be estimated by a clear AE take-off in the second cycle of loading (Seto et al, 1999).
ROCKENG09: Proceedings of the 3rd CANUS Rock Mechanics Symposium, Toronto, May 2009 (Ed: M.Diederichs and G. Grasselli)
PAPER 4033 3
0
5
10
15
20
25
30
0 10 20 30 40 50 60 70 80 90 100
Stress (MPa)
Cum
ulat
ive
AE
Even
ts
Previous maximum stress
Figure 3. Typical AE cumulative count of core sample versus stress - Craig Onaping Mine specimen.
5 STRESS TENSOR CALCULATION
The stress tensor is six dimensional (three normal stresses and three shear stresses) and therefore six independent normal stress measurements are required to determine the stress tensor:
[ ] =σ⎟⎟⎟
⎠
⎞
⎜⎜⎜
⎝
⎛
zzzyzx
yzyyyx
xzxyxx
στττστττσ
(1)
with respect to a mine north (X), east (Y), vertical (Z) right-handed co-ordinate system. Six in-dependent instances of the equation (2.14) of Brady and Brown (1985):
zxxzyzzyxyyxzzzyyyxxxn lllllllll τττσσσσ 222222 +++++= (2)
where nσ is the stress obtained from the Acoustic Emission of a core sample, whose orientation is given by the unit vector kljlil zyx
vvv++ and used to form a system of equations which can be
solved for the stress tensor ][σ . The principal stresses are then determined by a standard eigen-value analysis of the tensor ][σ .
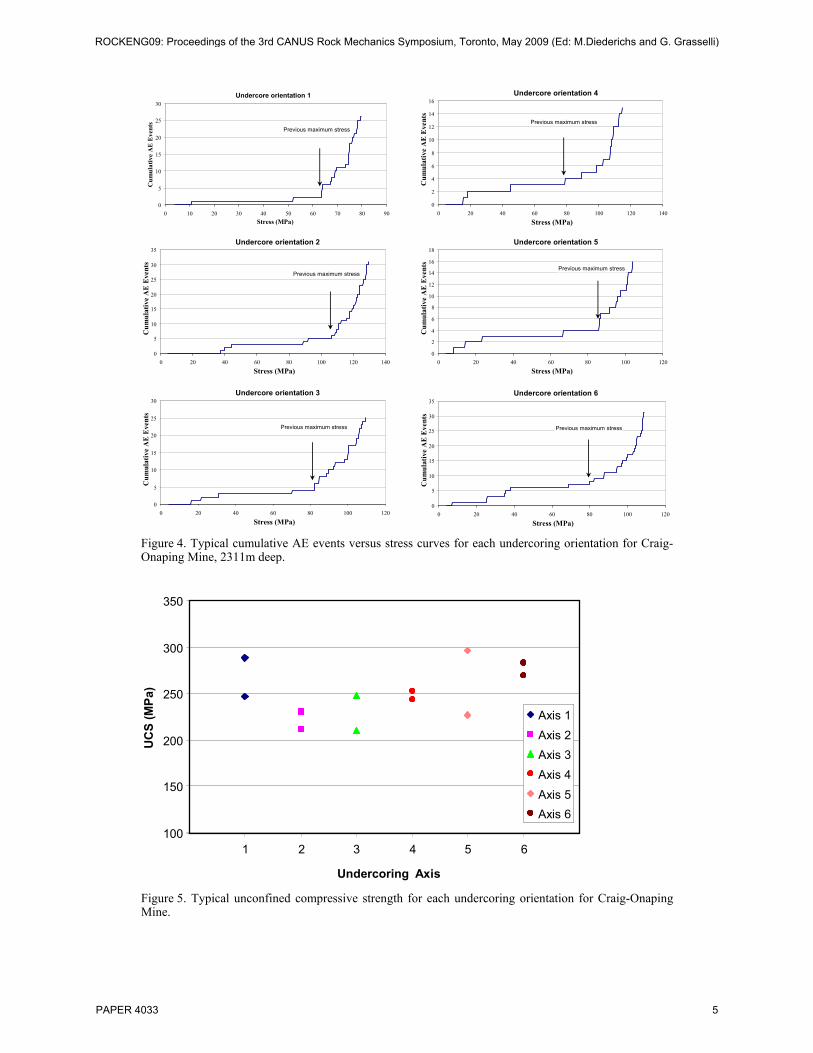
The underlying philosophy of WASM technique stress measuring technique requires six small cylindrical samples of rock that are undercored from conventional oriented drill core re-covered from the site for which stress data is sought (Villaescusa et al, 2003). Undercoring means re-drilling in the laboratory the oriented core obtained from the field in order to obtain the specimens for testing. Each undercored sample is instrumented with pair of acoustic emis-sion (AE) transducers. The samples are then loaded uniaxially with the AE transducers provid-ing a record of the number of AE ‘events’ with increasing load and hence stress. Finally, the AE information from the six axes (see Figure 4) is analysed to give six independent normal stresses from which the full stress tensors can be obtained. Figure 5 shows the typical uniaxial compres-sive strength for each of the undercoring axis for the 18-20mm rock specimens tested at the Craig Onaping Mine. The WASM AE methodology and sample selection it is well documented (Villaescusa et al, 2002; 2003; 2008) and currently being implemented worldwide on a number of deep mining projects.
ROCKENG09: Proceedings of the 3rd CANUS Rock Mechanics Symposium, Toronto, May 2009 (Ed: M.Diederichs and G. Grasselli)
PAPER 4033 4
Undercore orientation 1
0
5
10
15
20
25
30
0 10 20 30 40 50 60 70 80 90Stress (MPa)
Cum
ulat
ive
AE
Eve
nts
Previous maximum stress
Undercore orientation 2
0
5
10
15
20
25
30
35
0 20 40 60 80 100 120 140Stress (MPa)
Cum
ulat
ive
AE
Eve
nts
Previous maximum stress
Undercore orientation 3
0
5
10
15
20
25
30
0 20 40 60 80 100 120
Stress (MPa)
Cum
ulat
ive
AE
Eve
nts
Previous maximum stress
Undercore orientation 4
0
2
4
6
8
10
12
14
16
0 20 40 60 80 100 120 140
Stress (MPa)
Cum
ulat
ive
AE
Eve
nts
Previous maximum stress
Undercore orientation 5
0
2
4
6
8
10
12
14
16
18
0 20 40 60 80 100 120Stress (MPa)
Cum
ulat
ive
AE
Eve
nts
Previous maximum stress
Undercore orientation 6
0
5
10
15
20
25
30
35
0 20 40 60 80 100 120
Stress (MPa)
Cum
ulat
ive
AE
Eve
nts
Previous maximum stress
Figure 4. Typical cumulative AE events versus stress curves for each undercoring orientation for Craig-Onaping Mine, 2311m deep.
100
150
200
250
300
350
1 2 3 4 5 6
Undercoring Axis
UC
S (M
Pa)
Axis 1Axis 2Axis 3Axis 4Axis 5Axis 6
Figure 5. Typical unconfined compressive strength for each undercoring orientation for Craig-Onaping Mine.
ROCKENG09: Proceedings of the 3rd CANUS Rock Mechanics Symposium, Toronto, May 2009 (Ed: M.Diederichs and G. Grasselli)
PAPER 4033 5
6 IN-SITU STRESS ORIENTATION AND MAGNITUDES FOR CRAIG-ONAPING MINE
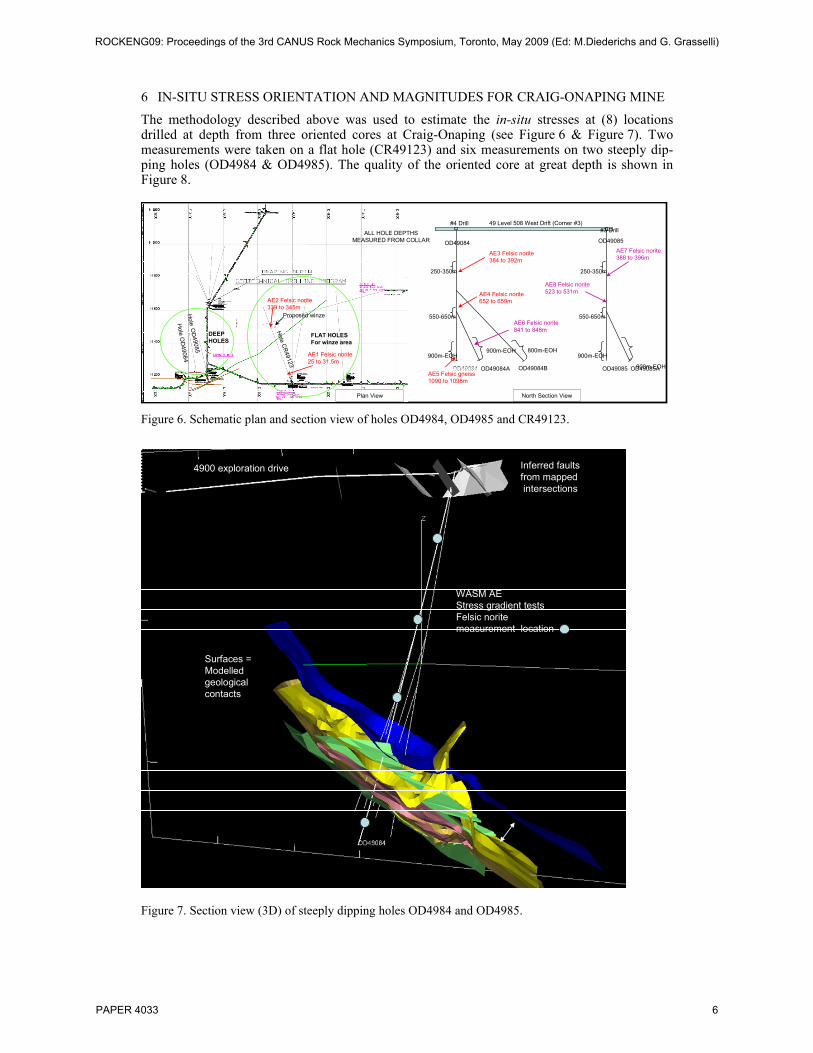
The methodology described above was used to estimate the in-situ stresses at (8) locations drilled at depth from three oriented cores at Craig-Onaping (see Figure 6 & Figure 7). Two measurements were taken on a flat hole (CR49123) and six measurements on two steeply dip-ping holes (OD4984 & OD4985). The quality of the oriented core at great depth is shown in Figure 8.
49 Level 508 West Drift (Corner #3)#3 Drill
#4 Drill
OD49084 OD49084A OD49084B
250-350m
550-650m
900m-EOH900m-EOH 800m-EOH
OD49085 OD49085A
250-350m
550-650m
900m-EOH
900m-EOH
North Section View
OD49084 OD49085
AE3 Felsic norite384 to 392m
AE4 Felsic norite652 to 659m
AE5 Felsic gneiss1090 to 1098m
AE6 Felsic norite841 to 848m
AE7 Felsic norite388 to 396m
AE8 Felsic norite523 to 531m
Hole O
D49084
Hole
OD
49085
Hole C
R49123
Proposed winze
ALL HOLE DEPTHSMEASURED FROM COLLAR
AE2 Felsic norite339 to 345m
AE1 Felsic norite25 to 31.5m
DEEP HOLES
FLAT HOLESFor winze area
Plan View Figure 6. Schematic plan and section view of holes OD4984, OD4985 and CR49123.
4900 exploration drive Inferred faultsfrom mappedintersections
Surfaces =Modelledgeologicalcontacts
WASM AEStress gradient testsFelsic noritemeasurement location
Figure 7. Section view (3D) of steeply dipping holes OD4984 and OD4985.
ROCKENG09: Proceedings of the 3rd CANUS Rock Mechanics Symposium, Toronto, May 2009 (Ed: M.Diederichs and G. Grasselli)
PAPER 4033 6
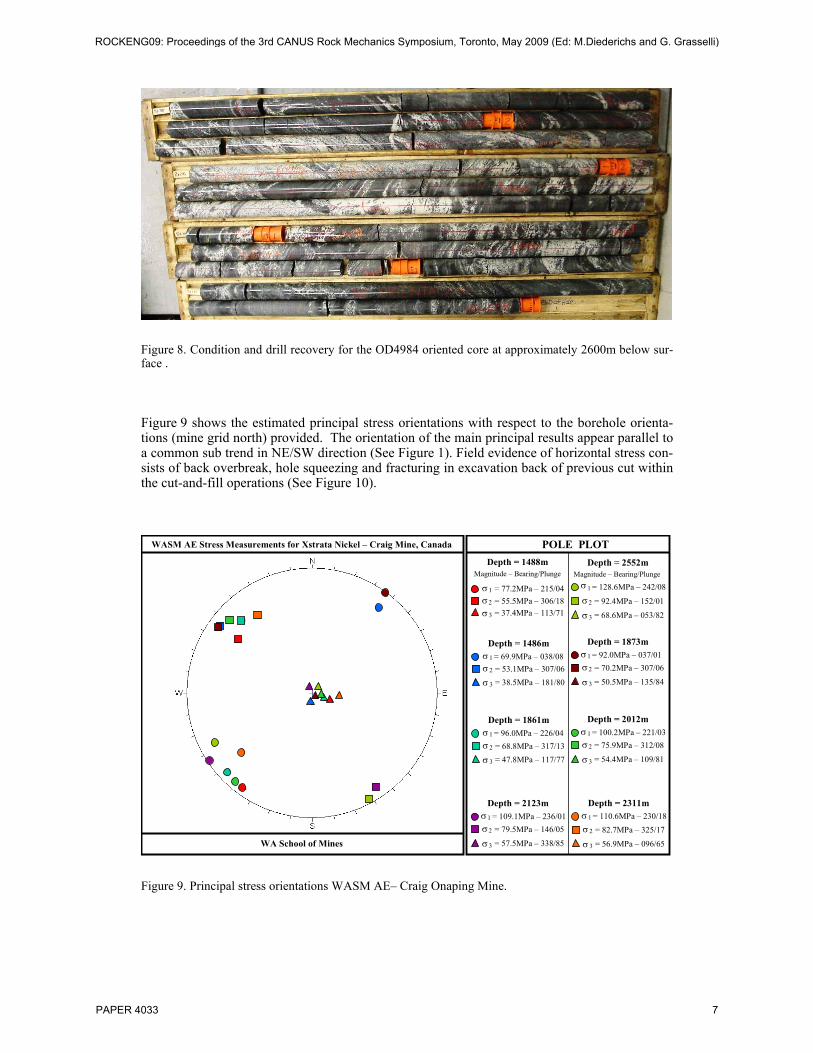
Figure 8. Condition and drill recovery for the OD4984 oriented core at approximately 2600m below sur-face .
Figure 9 shows the estimated principal stress orientations with respect to the borehole orienta-tions (mine grid north) provided. The orientation of the main principal results appear parallel to a common sub trend in NE/SW direction (See Figure 1). Field evidence of horizontal stress con-sists of back overbreak, hole squeezing and fracturing in excavation back of previous cut within the cut-and-fill operations (See Figure 10).
WASM AE Stress Measurements for Xstrata Nickel – Craig Mine, Canada
WA School of Mines
POLE PLOTDepth = 1488m
Magnitude – Bearing/Plunge
σ1 = 69.9MPa – 038/08σ2 = 53.1MPa – 307/06
σ 3 = 38.5MPa – 181/80
Depth = 1486m
σ1 = 77.2MPa – 215/04σ2 = 55.5MPa – 306/18σ3 = 37.4MPa – 113/71
σ1 = 96.0MPa – 226/04σ2 = 68.8MPa – 317/13
σ 3 = 47.8MPa – 117/77
Depth = 1861m
σ1 = 109.1MPa – 236/01σ2 = 79.5MPa – 146/05
σ3 = 57.5MPa – 338/85
Depth = 2123m
σ1 = 92.0MPa – 037/01σ2 = 70.2MPa – 307/06
σ3 = 50.5MPa – 135/84
Depth = 1873m
σ1 = 100.2MPa – 221/03σ2 = 75.9MPa – 312/08
σ3 = 54.4MPa – 109/81
Depth = 2012m
σ1 = 128.6MPa – 242/08σ2 = 92.4MPa – 152/01
σ3 = 68.6MPa – 053/82
Depth = 2552m
σ1 = 110.6MPa – 230/18σ2 = 82.7MPa – 325/17
σ3 = 56.9MPa – 096/65
Depth = 2311m
Magnitude – Bearing/Plunge
Figure 9. Principal stress orientations WASM AE– Craig Onaping Mine.
ROCKENG09: Proceedings of the 3rd CANUS Rock Mechanics Symposium, Toronto, May 2009 (Ed: M.Diederichs and G. Grasselli)
PAPER 4033 7
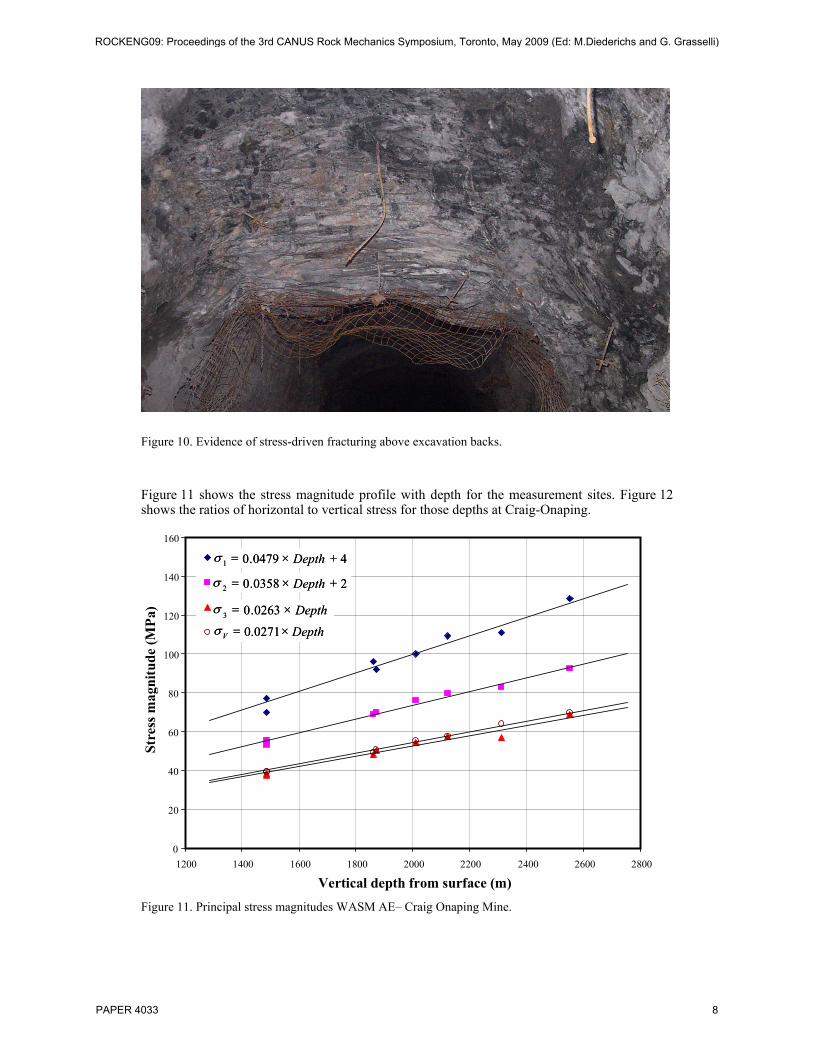
Figure 10. Evidence of stress-driven fracturing above excavation backs.
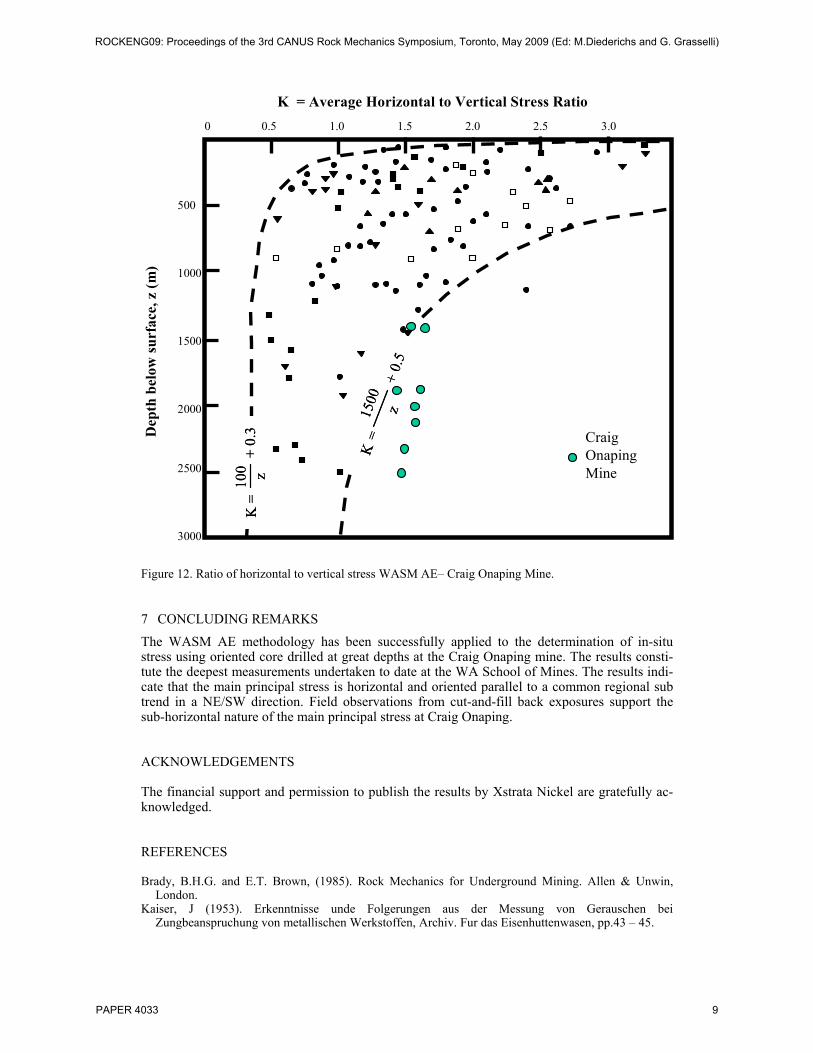
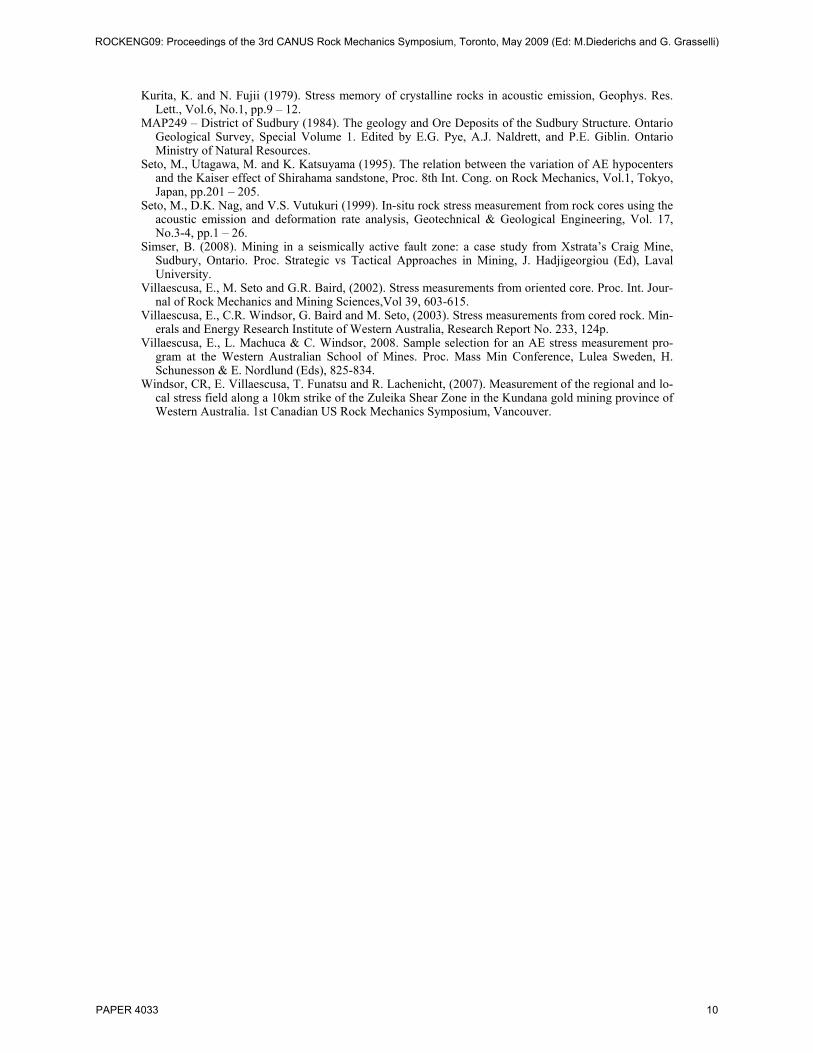
Figure 11 shows the stress magnitude profile with depth for the measurement sites. Figure 12 shows the ratios of horizontal to vertical stress for those depths at Craig-Onaping.
0
20
40
60
80
100
120
140
160
1200 1400 1600 1800 2000 2200 2400 2600 2800
Vertical depth from surface (m)
Stre
ss m
agni
tude
(MPa
)
S1
S2
S3
Sz
40479.01 +×= Depthσ 40479.01 +×= Depthσ 40479.01 +×= Depthσ
20358.02 +×= Depthσ 20358.02 +×= Depthσ 20358.02 +×= Depthσ
Depth×= 0263.03σ Depth×= 0263.03σ Depth×= 0263.03σ
DepthV ×= 0271.0σ DepthV ×= 0271.0σ DepthV ×= 0271.0σ
Figure 11. Principal stress magnitudes WASM AE– Craig Onaping Mine.
ROCKENG09: Proceedings of the 3rd CANUS Rock Mechanics Symposium, Toronto, May 2009 (Ed: M.Diederichs and G. Grasselli)
PAPER 4033 8
500
1000
1500
2000
2500
3000
Dep
th b
elow
surf
ace,
z (m
)
K = Average Horizontal to Vertical Stress Ratio0 0.5 1.0 1.5 2.0 2.5 3.0
K =
100 z
+ 0.
3K
=10
0 z+
0.3
K =
100 z
+ 0.
3
K=
1500 z
+ 0.
5
K=
1500 z
+ 0.
5
K=
1500 z
+ 0.
5
Craig OnapingMine
Figure 12. Ratio of horizontal to vertical stress WASM AE– Craig Onaping Mine.
7 CONCLUDING REMARKS
The WASM AE methodology has been successfully applied to the determination of in-situ stress using oriented core drilled at great depths at the Craig Onaping mine. The results consti-tute the deepest measurements undertaken to date at the WA School of Mines. The results indi-cate that the main principal stress is horizontal and oriented parallel to a common regional sub trend in a NE/SW direction. Field observations from cut-and-fill back exposures support the sub-horizontal nature of the main principal stress at Craig Onaping.
ACKNOWLEDGEMENTS
The financial support and permission to publish the results by Xstrata Nickel are gratefully ac-knowledged.
REFERENCES
Brady, B.H.G. and E.T. Brown, (1985). Rock Mechanics for Underground Mining. Allen & Unwin, London.
Kaiser, J (1953). Erkenntnisse unde Folgerungen aus der Messung von Gerauschen bei Zungbeanspruchung von metallischen Werkstoffen, Archiv. Fur das Eisenhuttenwasen, pp.43 – 45.
ROCKENG09: Proceedings of the 3rd CANUS Rock Mechanics Symposium, Toronto, May 2009 (Ed: M.Diederichs and G. Grasselli)
PAPER 4033 9
Kurita, K. and N. Fujii (1979). Stress memory of crystalline rocks in acoustic emission, Geophys. Res. Lett., Vol.6, No.1, pp.9 – 12.
MAP249 – District of Sudbury (1984). The geology and Ore Deposits of the Sudbury Structure. Ontario Geological Survey, Special Volume 1. Edited by E.G. Pye, A.J. Naldrett, and P.E. Giblin. Ontario Ministry of Natural Resources.
Seto, M., Utagawa, M. and K. Katsuyama (1995). The relation between the variation of AE hypocenters and the Kaiser effect of Shirahama sandstone, Proc. 8th Int. Cong. on Rock Mechanics, Vol.1, Tokyo, Japan, pp.201 – 205.
Seto, M., D.K. Nag, and V.S. Vutukuri (1999). In-situ rock stress measurement from rock cores using the acoustic emission and deformation rate analysis, Geotechnical & Geological Engineering, Vol. 17, No.3-4, pp.1 – 26.
Simser, B. (2008). Mining in a seismically active fault zone: a case study from Xstrata’s Craig Mine, Sudbury, Ontario. Proc. Strategic vs Tactical Approaches in Mining, J. Hadjigeorgiou (Ed), Laval University.
Villaescusa, E., M. Seto and G.R. Baird, (2002). Stress measurements from oriented core. Proc. Int. Jour-nal of Rock Mechanics and Mining Sciences,Vol 39, 603-615.
Villaescusa, E., C.R. Windsor, G. Baird and M. Seto, (2003). Stress measurements from cored rock. Min-erals and Energy Research Institute of Western Australia, Research Report No. 233, 124p.
Villaescusa, E., L. Machuca & C. Windsor, 2008. Sample selection for an AE stress measurement pro-gram at the Western Australian School of Mines. Proc. Mass Min Conference, Lulea Sweden, H. Schunesson & E. Nordlund (Eds), 825-834.
Windsor, CR, E. Villaescusa, T. Funatsu and R. Lachenicht, (2007). Measurement of the regional and lo-cal stress field along a 10km strike of the Zuleika Shear Zone in the Kundana gold mining province of Western Australia. 1st Canadian US Rock Mechanics Symposium, Vancouver.
ROCKENG09: Proceedings of the 3rd CANUS Rock Mechanics Symposium, Toronto, May 2009 (Ed: M.Diederichs and G. Grasselli)
PAPER 4033 10