Stress Measurement Using Pulsed Eddy Current Thermography · PDF fileStress Measurement Using...
12
Stress Measurement Using Pulsed Eddy Current Thermography Libing Bai 1,2 and Gui Yun Tian 1, 2 1 School of Automation Engineering, University of Electronic Science and Technology of China, Chengdu, 611731, China 2 School of Electrical and Electronic Engineering, Newcastle University, NE1 7RU, UK Abstract This paper reports a noncontact inspection method, using Pulsed Eddy Current (PEC) stimulated thermography, for the evaluation of the anisotropic dependency of electrical conductivity of steel exposed to tensile stress. This method combines microscope lens based thermography with PEC using a rectangular excitation coil, giving directional excitation, to infer the electromagnetic properties variation in the longitudinal and transverse directions to a static uniaxially applied tensile stress. Theoretical analysis and details of the experimental set-up are presented. The relationship between excitation coil layout and applied stress, and the measured transient thermal images are discussed. Comparison of the results with previous work on PEC techniques for stress measurement is also discussed. 1. Introduction Residual Stress (RS) measurement and characterisation are important for early warning of failure and lifetime extension (1-2) . However, RS prediction is still a big challenge (3) . At present, the most common methods of RS evaluation are X-ray diffraction and hole drilling. However, the penetration of laboratory X-rays in most engineering metals is typically of the order of tens of microns at most. Consequently, the technique must be combined with destructive layer removal to extend it to depths of around 1-2 mm (4) . Hole drilling typically has similar depth capability (5) . For magnetic materials, Magnetic Memory Method (MMM) and magnetoelastic effect are also used for RS measurement. However, the evaluation criteria of MMM indications still remain unsolved (6) and the magnetoelastic effect based measuring results is ambiguous (7-8) . Synchrotron radiation and neutron diffraction have penetration depth up to a few centimetres, however, the spatial resolution of these techniques is limited by minimum diffraction volume (9) . Therefore, there is a requirement to develop a non-destructive method for near surface stress inspection with high resolution.
Transcript of Stress Measurement Using Pulsed Eddy Current Thermography · PDF fileStress Measurement Using...

Stress Measurement Using Pulsed Eddy Current Thermography
Libing Bai1,2 and Gui Yun Tian1, 2
1School of Automation Engineering, University of Electronic Science and Technology
of China, Chengdu, 611731, China 2School of Electrical and Electronic Engineering, Newcastle University, NE1 7RU, UK
Abstract
This paper reports a noncontact inspection method, using Pulsed Eddy Current (PEC)
stimulated thermography, for the evaluation of the anisotropic dependency of electrical
conductivity of steel exposed to tensile stress. This method combines microscope lens
based thermography with PEC using a rectangular excitation coil, giving directional
excitation, to infer the electromagnetic properties variation in the longitudinal and
transverse directions to a static uniaxially applied tensile stress. Theoretical analysis and
details of the experimental set-up are presented. The relationship between excitation coil
layout and applied stress, and the measured transient thermal images are discussed.
Comparison of the results with previous work on PEC techniques for stress
measurement is also discussed.
1. Introduction
Residual Stress (RS) measurement and characterisation are important for early warning
of failure and lifetime extension (1-2)
. However, RS prediction is still a big challenge (3)
.
At present, the most common methods of RS evaluation are X-ray diffraction and hole
drilling. However, the penetration of laboratory X-rays in most engineering metals is
typically of the order of tens of microns at most. Consequently, the technique must be
combined with destructive layer removal to extend it to depths of around 1-2 mm (4)
.
Hole drilling typically has similar depth capability (5)
. For magnetic materials, Magnetic
Memory Method (MMM) and magnetoelastic effect are also used for RS measurement.
However, the evaluation criteria of MMM indications still remain unsolved (6) and the
magnetoelastic effect based measuring results is ambiguous (7-8). Synchrotron radiation
and neutron diffraction have penetration depth up to a few centimetres, however, the
spatial resolution of these techniques is limited by minimum diffraction volume (9)
.
Therefore, there is a requirement to develop a non-destructive method for near surface
stress inspection with high resolution.

Eddy Current (EC) and PEC have been applied for stress characterisation. Nagy et al.
non-destructively characterized the subsurface residual stress distribution in shot-peened
metals using apparent eddy current conductivity (10-11)
. Tian et al. evaluated the
anisotropic dependency of electrical conductivity of metallic specimens exposed to
essentially static tensile stress (12-13). However, the sensitivity and spatial resolution of
this method need to be improved, for residual stress characterisation in particular.
Lock-in thermography, a full-field, non-contact, rapid detection method, has shown
promising potential in stress and fatigue investigation. However, because of dependency
on thermoelastic effect, it can only be used for dynamic load evaluation (14-16)
. Recent
work in Thermal Stress Analysis (TSA) and PEC stimulated thermography integrates
eddy current and thermographic non-destructive evaluation (NDE) and improves
detection sensitivity and spatial resolution of electric and thermal conductivity
significantly (17-19)
. In this paper, PEC thermography is proposed for static stress
measurement and evaluation.
In order to infer RS levels from the PEC thermography measurements, it is necessary to
know the correlation between PEC thermography response and stress level. Therefore,
as the first step it is important to quantify the PEC thermography response to known
levels of stress. A straightforward way to find the associated stress coefficients is by
introducing known stresses in the materials of interest in a controlled manner, for
instance by applying hydrostatic compression or uniaxial tension (20)
. Here we apply
uniaxial tensile loading.
A microscope lens based PEC thermography with directional coils is developed for
applied stress measurement and characterisation of transient behaviours of elastic and
plastic stress. This method uses thermal pattern variation from electric and thermal
conductivity change, which is caused by stress, to characterise the stress. This work
includes: (1) establish links between stress variation and structural deformation using
experimental measurement; (2) extract features from the transient thermal response and
build the link between features and elastic and plastic stress for applied stress
measurement.
The rest of this paper is organised as: Section 2 presents the principle of PEC
thermography on stress characterisation. Section 3 presents experiment set-up and
samples used for demonstration. The results are discussed in Section 4. At the end a
conclusion is drawn.
2. Theoretical background
2.1 Piezoresistivity

The piezoresistive effect describes the changing of electrical resistance of a material due
to an applied mechanical stress leading to a deformation. The resistance R of a
rectangular conductor is given by
wb
lR
ρ= , (1)
where ρ is the specific electrical resistivity of the conducting material and l , w and
b are the length, width and thickness of the conductor, respectively. When the material
is strained, the relative change in the resistance is given by
)()(00000 b
b
w
w
l
l
R
R ∆−
∆−
∆+
∆=
∆
ρ
ρ , (2)
where subscript 0 denotes the respective initial value before deformation. The
sensitivity of a piezoresistive element to strain is characterized by the gauge factor
)()21(00 ρ
ρ
ε
∆++=
∆= v
R
RG , (3)
where ε is the strain and v is the material specific Poisson’s ratio. The first term
represents the change in resistance due to geometry, whereas the second term represents
the change due to electrical conductivity (21)
. The geometrical term dominates for strain
gauges. Since the eddy currents flow in closed loops and with an appropriate choice of
the probe size and excitation frequency, they lie well within the volume of the test-piece,
effect of the first term of Eq. (3) can be neglected when performing piezoresistivity
measurements with EC. Hence we are interested in monitoring the last term of Eq. (3).
Indeed, the residual stresses can be inferred by measuring the electrical conductivity
distribution. High frequency eddy current conductivity spectroscopy has previously
been applied for residual stress profiling measurement (11). The stress-induced change of
resistance can be expressed as
klijkl
ij τπρ
ρ=
∆
0
, (4)
where ijρ is the second-rank resistivity tensor, klτ is the second-rank stress tensor,
ijklπ is the fourth-rank piezoresistivity tensor. Since klτ is symmetric, it can be
transformed to its principal axes xx , yy and zz , and hence can be represented by the
principal stresses xxτ , yyτ and zzτ . Tensor ijρ is also symmetric. Moreover, in an
unstressed polycrystalline metal ijρ which is spherical and the respective principal

axis can be chosen to coincide with those of the stress to be applied. Thus, the resistivity
tensor can be represented by the principal resistivities xxρ ,yy
ρ and zzρ . For a
polycrystalline, hence isotropic, metallic test-piece under an arbitrary multi-axial state
of stress with respect to the principal stress directions the resistivity change can be
expressed, in Voigt notation (see Nye (22)), in terms of a symmetrical tensor, mnπ :
nmn
m τπρ
ρ=
∆
0
, ).6,1,( −nm (5)
With regard to the principal stress axes (with zero shear stresses) Eq. (5) takes the
following form:
=
∆
∆
∆
3
2
1
111212
121112
121211
0
3
0
2
0
1
τ
τ
τ
πππ
πππ
πππ
ρ
ρρ
ρρ
ρ
, (6)
where mnπ has two distinct components, 11π which expresses the change in resistivity
parallel to an applied stress and 12π the change transverse to it (23)
. For Uniaxial tension
along the z direction 0≠zτ , 0== yx ττ , and Eq. (4) becomes
( )zzzzyx τπτπτπ
ρ
ρ
ρ
ρ
ρ
ρ111212
000
,,,, =
∆∆∆. (7)
2.2 Directional excitation
As discussed in Section 2.1, a uniaxial tensile load affects the longitudinal and
transverse components of the electrical conductivity tensor in different ways (24)
. Thus,
an initially electrically isotropic polycrystalline metal will develop an anisotropic
response under uniaxial tension. The resulting eddy current density depends on the
rotational induced electric field E according to the Ohm’s law:
EJ σ= , (8)
where 1−= ρσ is the electrical conductivity of the sample. At each point of the
material under test E has a specific direction, as shown in Fig.1. Let zσ be electrical
conductivity parallel to the tensile axis and xσ and yσ the conductivity along the two
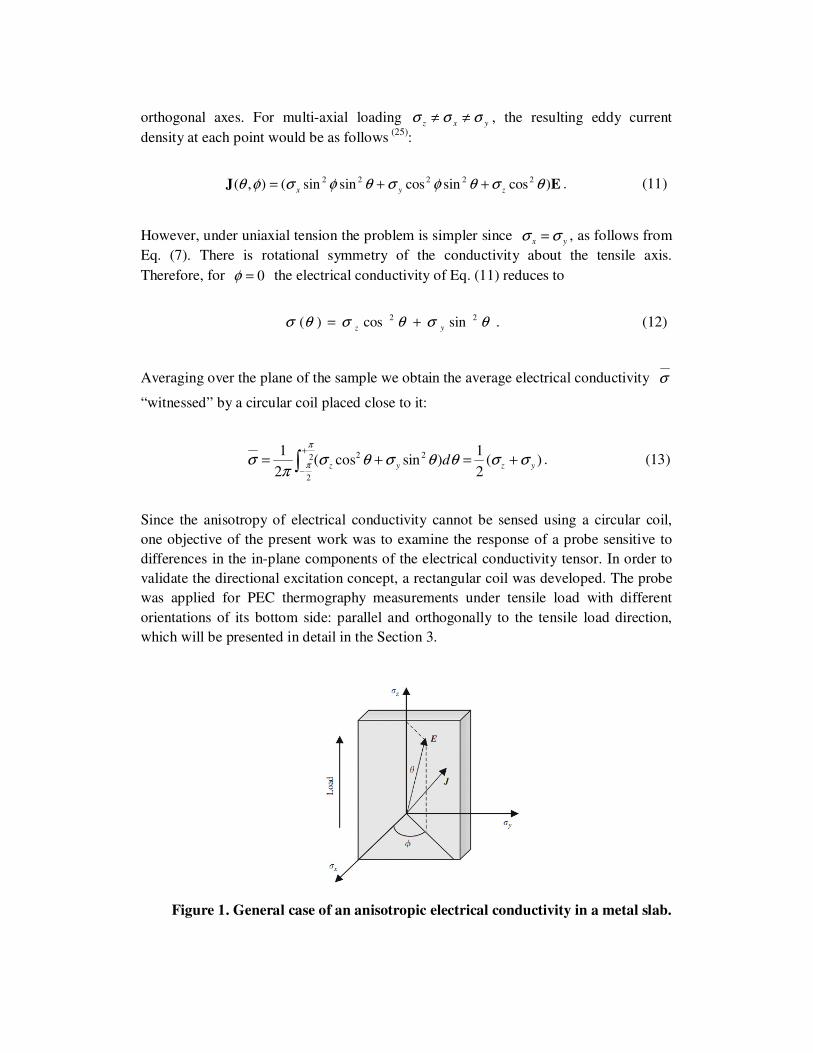
orthogonal axes. For multi-axial loading yxz σσσ ≠≠ , the resulting eddy current
density at each point would be as follows (25)
:
EJ )cossincossinsin(),( 22222 θσθφσθφσφθzyx
++= . (11)
However, under uniaxial tension the problem is simpler since yx σσ = , as follows from
Eq. (7). There is rotational symmetry of the conductivity about the tensile axis.
Therefore, for 0=φ the electrical conductivity of Eq. (11) reduces to
θσθσθσ 22 sincos)(yz
+= . (12)
Averaging over the plane of the sample we obtain the average electrical conductivity σ
“witnessed” by a circular coil placed close to it:
∫+
−+=+= 2
2
22 )(2
1)sincos(
2
1π
π σσθθσθσπ
σ yzyz d . (13)
Since the anisotropy of electrical conductivity cannot be sensed using a circular coil,
one objective of the present work was to examine the response of a probe sensitive to
differences in the in-plane components of the electrical conductivity tensor. In order to
validate the directional excitation concept, a rectangular coil was developed. The probe
was applied for PEC thermography measurements under tensile load with different
orientations of its bottom side: parallel and orthogonally to the tensile load direction,
which will be presented in detail in the Section 3.
Figure 1. General case of an anisotropic electrical conductivity in a metal slab.

2.3 Joule heating
When a conductive material is introduced into a time-alternating magnetic field, the
material is heated by Joule heating, which is caused by resistive heating from eddy
currents. The generated resistive heat Q is proportional to the square of the eddy
current density J or electric field intensity E . The relationship between Q , J and
E is governed by
221
EJ σσ
==Q. (14)
The heat conduction equation of a specimen caused by a Joule heating source Q is
governed by
QTkt
TCp =∇∇−
∂
∂)('ρ , (15)
where 'ρ , p
C and k are density, heat capacity and thermal conductivity,
respectively (19).
As discussed in Section 2.1, a conductive material under uniaxial tensile load has
different longitudinal and transverse variations of the electrical conductivity tensor
components. Based on Eq. (14) and (15), it is clear that these variations differences will
lead to different thermal behaviour under directional excitation.
3. Experiment set-up and samples
The experimental set-up is shown in Fig. 2. An Instron model 3369 universal material
testing machine with maximum load capacity of 50 kN is used to apply tensile stress to
the specimens. This machine has two grips: the one at the bottom is fixed and the one at
the top can move up and down to create tensile stress in the specimens. In this work, the
load increases with a step of 200 N until the specimen is ruptured. For each load, PEC
thermography response is recorded for post analysis.
An Easyheat 224 from Cheltenham Induction Heating is used for coil excitation. The
Easyheat has a maximum excitation power of 2.4 kW, a maximum current of 400 Arms
and an excitation frequency range of 150-400 kHz (380 Arms and 256 kHz are used in
the experiments). The system has a quoted rise time (from the start of the heating period
to full power) of 5ms, which was verified experimentally. Water cooling of coil is
implemented to counteract direct heating of the coil.

The IR camera, SC7500 is a Stirling cooled camera with a 320 × 256 array of 1.5-5µm
InSb detectors. This camera has a sensitivity of < 20 mK and a maximum full frame
rate of 383 Hz, with the option to increase frame rate with windowing of the image. In
this work, half frame with frame rate of 1253 Hz is used for investigation including
feature optimization. A microscope lens L0905 with spatial resolution of 30 µm, work
distance 30 cm is used to observe specimen deformation.
A rectangular coil is constructed to apply directional excitation. This coil is made of
6.35 mm high conductivity hollow copper tube. This coil is selected to introduce
parallel eddy current in longitude and transverse directions of applied stress, as
presented in Section 4.
Two steel samples (0.11mm×33.62mm×335mm), cut from same steel sheet are prepared.
A 100 ms heating duration is selected for inspection, which is long enough to elicit an
observable heat pattern. During experiment, the camera and test machine are fixed. For
each specimen, the coil is also fixed parallel or perpendicular to applied stress, as shown
in Fig. 3.
(a) Coil parallel to the applied stress (b) Coil perpendicular to the applied stress
Figure 3. Directional excitation
Figure 2. Experiment set-up

4. Results and discussion
4.1 Excitation parallel to the applied stress
A 0.9 mm length line (line 1 in Fig. 4) is used to investigate the transient response against
applied stress. This line consists of 30 pixels and is parallel to the excitation coil. A light spot
(of high emissivity) at the top of the line is taken as an origin. It is clear that the spot moves
toward the upper left corner. Since the bottom grip of the test machine is fixed, the longitude
displacement of the spot corresponds to the sample extension, and the transverse displacement
corresponds to the transverse deformation. These displacements in parallel and perpendicular to
the applied stress direction are shown in Fig. 5. When the applied stress is less than 432.6 MPa,
longitude displacement and stress shows a linear relationship, which means the material is in the
elastic regime. When the applied stress is larger than 432.6 MPa, the longitude displacement has
a increasing rate, so the material is in the plastic regime (26). However, deformation behaviour in
the perpendicular direction is complex. An high rate of deformation is shown in the early elastic
regime (less than 216.3 MPa), followed by a constant zone (216.3 MPa to 432.6 MPa), and then
another high rate of deformation.
Figure 5. Displacement of the spot
(a) Stress: 54.08MPa (b) Stress: 811.2MPa
Figure 4. Line for analysis: average transient response of line 1 is used to evaluate
applied stress. The line is parallel to the excitation coil and applied stress.
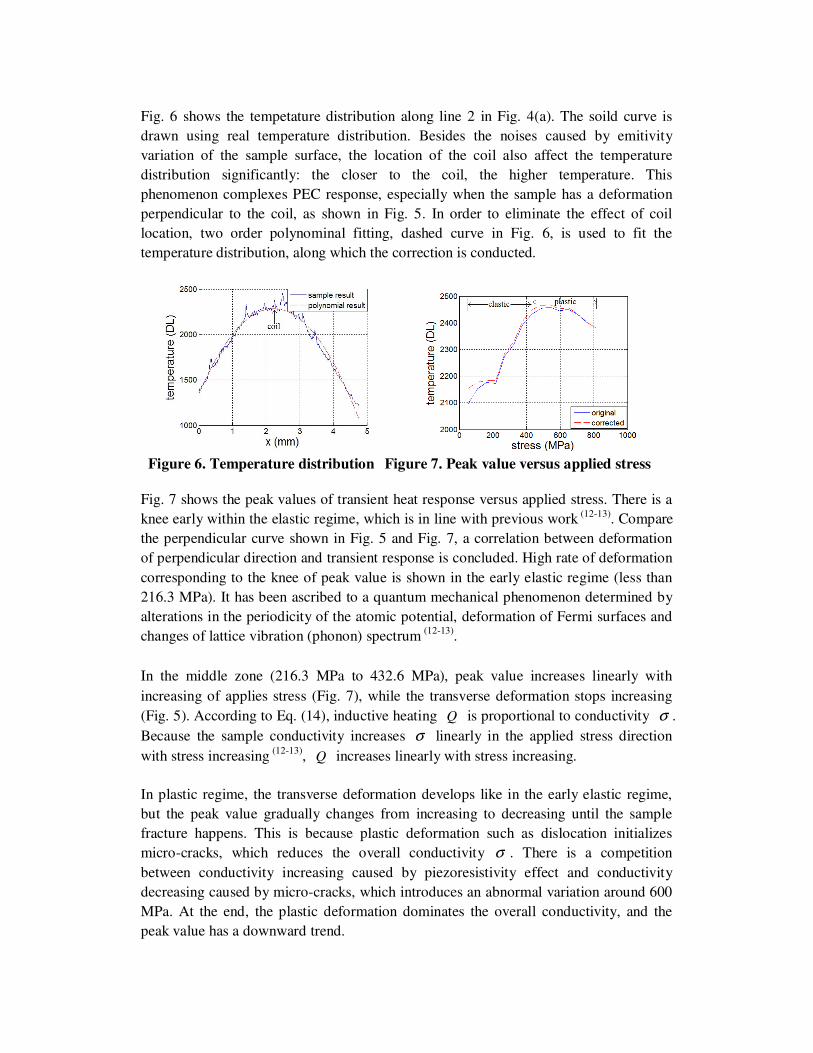
Fig. 6 shows the tempetature distribution along line 2 in Fig. 4(a). The soild curve is
drawn using real temperature distribution. Besides the noises caused by emitivity
variation of the sample surface, the location of the coil also affect the temperature
distribution significantly: the closer to the coil, the higher temperature. This
phenomenon complexes PEC response, especially when the sample has a deformation
perpendicular to the coil, as shown in Fig. 5. In order to eliminate the effect of coil
location, two order polynominal fitting, dashed curve in Fig. 6, is used to fit the
temperature distribution, along which the correction is conducted.
Fig. 7 shows the peak values of transient heat response versus applied stress. There is a
knee early within the elastic regime, which is in line with previous work (12-13). Compare
the perpendicular curve shown in Fig. 5 and Fig. 7, a correlation between deformation
of perpendicular direction and transient response is concluded. High rate of deformation
corresponding to the knee of peak value is shown in the early elastic regime (less than
216.3 MPa). It has been ascribed to a quantum mechanical phenomenon determined by
alterations in the periodicity of the atomic potential, deformation of Fermi surfaces and
changes of lattice vibration (phonon) spectrum (12-13)
.
In the middle zone (216.3 MPa to 432.6 MPa), peak value increases linearly with
increasing of applies stress (Fig. 7), while the transverse deformation stops increasing
(Fig. 5). According to Eq. (14), inductive heating Q is proportional to conductivity σ .
Because the sample conductivity increases σ linearly in the applied stress direction
with stress increasing (12-13)
, Q increases linearly with stress increasing.
In plastic regime, the transverse deformation develops like in the early elastic regime,
but the peak value gradually changes from increasing to decreasing until the sample
fracture happens. This is because plastic deformation such as dislocation initializes
micro-cracks, which reduces the overall conductivity σ . There is a competition
between conductivity increasing caused by piezoresistivity effect and conductivity
decreasing caused by micro-cracks, which introduces an abnormal variation around 600
MPa. At the end, the plastic deformation dominates the overall conductivity, and the
peak value has a downward trend.
Figure 6. Temperature distribution Figure 7. Peak value versus applied stress
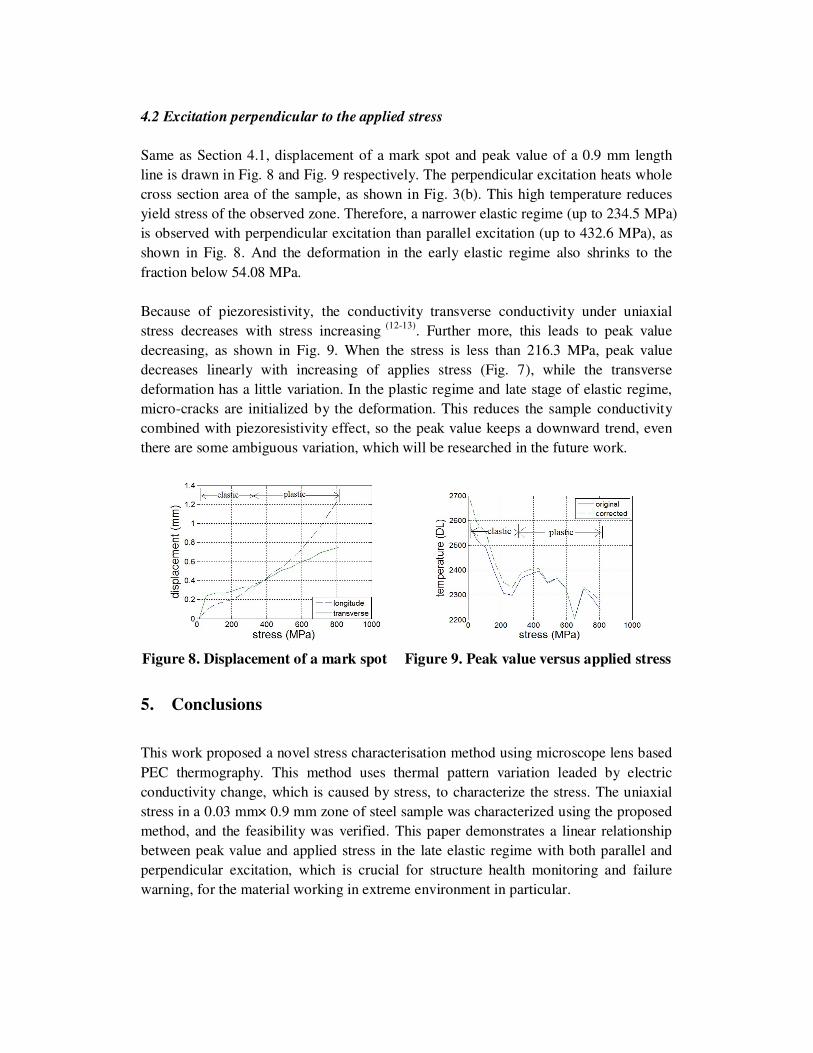
4.2 Excitation perpendicular to the applied stress
Same as Section 4.1, displacement of a mark spot and peak value of a 0.9 mm length
line is drawn in Fig. 8 and Fig. 9 respectively. The perpendicular excitation heats whole
cross section area of the sample, as shown in Fig. 3(b). This high temperature reduces
yield stress of the observed zone. Therefore, a narrower elastic regime (up to 234.5 MPa)
is observed with perpendicular excitation than parallel excitation (up to 432.6 MPa), as
shown in Fig. 8. And the deformation in the early elastic regime also shrinks to the
fraction below 54.08 MPa.
Because of piezoresistivity, the conductivity transverse conductivity under uniaxial
stress decreases with stress increasing (12-13)
. Further more, this leads to peak value
decreasing, as shown in Fig. 9. When the stress is less than 216.3 MPa, peak value
decreases linearly with increasing of applies stress (Fig. 7), while the transverse
deformation has a little variation. In the plastic regime and late stage of elastic regime,
micro-cracks are initialized by the deformation. This reduces the sample conductivity
combined with piezoresistivity effect, so the peak value keeps a downward trend, even
there are some ambiguous variation, which will be researched in the future work.
5. Conclusions
This work proposed a novel stress characterisation method using microscope lens based
PEC thermography. This method uses thermal pattern variation leaded by electric
conductivity change, which is caused by stress, to characterize the stress. The uniaxial
stress in a 0.03 mm× 0.9 mm zone of steel sample was characterized using the proposed
method, and the feasibility was verified. This paper demonstrates a linear relationship
between peak value and applied stress in the late elastic regime with both parallel and
perpendicular excitation, which is crucial for structure health monitoring and failure
warning, for the material working in extreme environment in particular.
Figure 8. Displacement of a mark spot Figure 9. Peak value versus applied stress

Acknowledgement
This work is funded by University of Electronic Science and Technology of China and
Newcastle University. This project is also funded by EPSRC (EP/E005071/1 ) and the
National Natural Science Foundation of China (Grant No. 61102141).
References
1. P J Withers, 'Residual Stress and Its Role in Failure', Reports on Progress in
Physics, Vol 70, No 12, pp 2211-2264, November 2007.
2. P J Bouchard. 'Residual Stress in Life and Structural Integrity Assessment', In:
Buschow KHJ, editor. Encyclopedia of Materials: Science and Technology.
Oxford: Elsevier, pp 8134-42, 2001.
3. P J Withers and H K D H Bhadeshia, 'Residual Stress, Part 1 Measurement
Techniques', Materials Science and Technology, Vol 17, No 4, pp 355-365, April
2001.
4. P J Withers, 'Depth Capabilities of Neutron and Synchrotron Diffraction Strain
Measurement Instruments. I. The Maximum Feasible Path Length', Journal of
Applied Crystallography, Vol 37, No 4, pp 596-606, August 2004.
5. G S Schajer, et al, 'Hole Drilling and Ring Core Methods', In: Lu J, editor.
Handbook of Measurement of Residual Stresses. Lilburn: Fairmont Press, pp 5-34,
1996.
6. M Roskosz, A Rusin and J Kotowicz, 'The Metal Magnetic Memory Method in
the Diagnostics of Power Machinery Component', Journal of Achievements in
Materials and Manufacturing Engineering. Vol 43, pp 362-370, November 2010.
7. D J Buttle D J and C Scruby, 'Residual Stresses: Measurement using
Magnetoelastic Effects', In: Buschow K H J, editor. Encyclopedia of materials:
Science and Technology. Oxford: Elsevier, pp8173-8180, 2001.
8. H J Wichmann, A Holst and H Budelmann, 'Magnetoelastic Stress Measurement
and Material Defect Detection in Prestressed Tendons using Coil Sensors',
Non-Destructive Testing in Civil Engineering Nantes, France, June 30th – July
3rd, 2009.
9. D J Hornbach, P S Prevey and M Blodgett. 'Review of Progress in Quantitative
NDE', Melville, NY: American Institute of Physics, Vol 24, pp 1379-1386, 2005.
10. F Yu F and P B Nagy, 'Simple Analytical Approximations for Eddy Current
Profiling of the Near Surface Residual Stress in Shot-Peened Metals', Journal of
Applied Physics, Vol 96, No 2, pp1257-1266, April 2004.
11. B A Abu-Nabah and P B Nagy. 'High-frequency Eddy Current Conductivity
Spectroscopy for Residual Stress Profiling in Surface-Treated Nickel-base
Superalloys', NDT and E International, Vol 40, No 5, pp 405-418, January 2007.

12. M Morozov, G Y Tian and P J Withers, 'The Pulsed Eddy Current Response to
Applied Loading of Various Aluminium Alloys', NDT & E International, Vol 43,
No 6, pp 493-500, January 2010.
13. M Morozov, G Y Tian and P J Withers, 'Noncontact Evaluation of the
Dependency of Electrical Conductivity on Stress for Various Al Alloys as a
Function of Plastic Deformation and annealing', Journal of Applied Physics, Vol
108, pp 024909, July 2010.
14. Y Y Hung, Y S Chen, S P Ng, L Liu, Y H Huang, B L Luk, R W L Ip, C M L Wu
and P S Chung, 'Review and Comparison of Shearography and Active
Thermography for Non-Destructive Evaluation', Materials Science and
Engineering: R: Reports, Vol 64, No 5-6, pp 73-112, May 2009.
15. X D Li, H Zhang, D L Wu, X Liu and J Y Liu, 'Adopting Lock-in Infrared
Thermography Technique for Rapid Determination of Fatigue Limit of Aluminum
alloy Riveted Component and Affection to Determined Result Caused by Initial
Stress', International Journal of Fatigue, Vol 36, No 1, pp 18-23, March 2012.
16. R Haj-Ali, B-S Wei, S Johnson and R El-Haijar, 'Thermoelastic and
Infrated-Thermography Methods for Surface Strains in Cracked Orthotropic
Composite Materials', Engineering Fracture Mechanics, Vol 75, No 1, pp 58-75,
January 2008.
17. J Wilson, G Y Tian, I Mukriz and D Almond, 'PEC Thermography for Imaging
Multiple Cracks from Rolling Contact Fatigue', NDT & E International, Vol 44,
No 6, pp 505-512, October 2011.
18. I Z Abidin, G Y Tian, J Wilson, S Yang and D Almond. 'Quantitative Evaluation
of Angular Defects by Pulsed Eddy Current Thermography', NDT & E
International, Vol 43, No 7, pp 537-546, October 2010.
19. L Cheng L and G Y Tian, 'Surface Crack Detection for Carbon fiber Reinforced
Plastic (CFRP) Materials using Pulsed Eddy Current Thermography', IEEE
Sensors Journal, Vol 11, No 12, pp 3261-3268, December 2011.
20. G Y Tian, A Sophian and S Rangarajan, 'Stress measurement using an eddy
current probe', BINDT04 2006.
21. G T Meaden, 'Electrical resistance of metals', London: Heywood Books, 1966.
22. J F Nye. 'Physical properties of crystals-their representation by tensors and
matrices'. Oxford: Clarendon, 1985.
23. D E Grady and M J Ginsberg, 'Piezoresistive Effects in Ytterbium stress
Transducers', Journal of Applied Physics, Vol 48, No 6, pp 2179-2181, 1977.
24. F Yu and P B Nagy, 'Dynamic Piezoresistivity Calibration for Eddy Current
Non-Destructive Residual Stress Measurements' Journal of Nondestructive
Evaluation, Vol 24, No 4, pp 143-151, December 2005.
25. G T Meaden, 'Electrical Resistance of Metals', London: Heywood Books, 1966.
26. K J R Rasmussen, 'Full-Range Stress-Strain Curves for Stainless Steel Alloys',
Journal of Constructional Steel Research, Vol 59, No 1, pp 47-61, January 2003.