Stress inversions to forecast magma pathways and eruptive ...statistics. Numerous theoretical and...
12
GEOPHYSICS Copyright © 2019 The Authors, some rights reserved; exclusive licensee American Association for the Advancement of Science. No claim to original U.S. Government Works. Distributed under a Creative Commons Attribution NonCommercial License 4.0 (CC BY-NC). Stress inversions to forecast magma pathways and eruptive vent location E. Rivalta 1 *, F. Corbi 1,2 , L. Passarelli 1,3 , V. Acocella 2 , T. Davis 1 , M. A. Di Vito 4 When a batch of magma reaches Earth’s surface, it forms a vent from which volcanic products are erupted. At many volcanoes, successive batches may open vents far away from previous ones, resulting in scattered, sometimes seemingly random spatial distributions. This exposes vast areas to volcanic hazards and makes forecasting difficult. Here, we show that magma pathways and thus future vent locations may be forecast by combining the physics of magma transport with a Monte Carlo inversion scheme for the volcano stress history. We validate our approach on a densely populated active volcanic field, Campi Flegrei (Italy), where we forecast future vents on an onshore semi- annular belt located between 2.3 and 4.2 km from the caldera center. Our approach offers a mechanical explanation for the vent migration over time at Campi Flegrei and at many calderas worldwide and may be applicable to volcanoes of any type. INTRODUCTION A basic, poorly investigated problem in volcano hazard studies is that we do not know where the next eruptive vent might form. This prob- lem affects, to some extent, all active volcanoes, as there is always at least some chance of eruptive fissures opening in unexpected loca- tions distant from the volcano summit. At central volcanoes with a characteristic cone shape (e.g., Hawaii or Etna), many eruptions are expected to occur on, or close to, the volcano summit. Eruptions also punctuate rift zones branching from the volcano summit, showing that new fissures may open at low altitude along the rifts, endanger- ing populated areas. Some types of volcanoes, however, do not show any cone-shaped edifice and lack a summit focusing eruptive activity. This is the case of calderas, kilometer-sized subcircular depressions resulting from the drainage of magma chambers and collapse of their roof. Calderas have fed some of the most catastrophic eruptions on Earth and are extremely hazardous (1). However, their eruptions are generally few and far apart; thus, hazard is often underestimated by the local population, which, at some calderas, approaches 1 million. As calderas are associated with large volcanic fields, with past eruptive vents scattered throughout, the problem of forecasting the location of future eruption is extremely challenging. Volcano hazard models, including lava and pyroclastic flow or plume expansion and fallout models, have reached high levels of so- phistication but remain poorly constrained because of the large uncer- tainties on where magma will breach Earth’s surface to create eruptive vents, especially at calderas (2). The need for probabilistic maps of fu- ture eruptive vents has typically been addressed empirically, on the basis of the surface distribution of past vents (3–5). This is generally more or less implicitly justified on the basis of two different underlying assumptions. On one hand, it is sometimes assumed that previous vents mark weaknesses or paths in the host rock that will guide as- cending magma. This assumption is not supported by observations, as many volcanoes are punctuated by monogenetic (e.g., used by only one eruption) vents, surrounded by tens of other monogenetic vents. According to a second rationale, the observed vents’ patterns reflect an unknown physical controlling mechanism (5), thereby justifying a data-driven approach to create probabilistic maps. An animation of the eruptive history in the last 15 thousand years (ka) before present at Campi Flegrei caldera (http://hazard-mapping.org/Campi-Flegrei. html) illustrates that after the initial phase, where vents are scattered, most vents open relatively close to clusters of previous vents. This qualitatively shows how data-driven approaches work better and bet- ter as the density distribution gets populated. However, the number of observed vents at volcanoes rarely exceeds a few tens; hence, the under- lying physical mechanism remains sampled by very few eruptions to provide a sharp representation of the vent distribution probability, re- sulting in very coarse maps. The animation shows that occasional erup- tions (including the last 1538 Monte Nuovo eruption) hit locations distant from previous vents: Forecasts for such low-probability locations will be affected by large uncertainties, as interpolation or extrapolation is needed where data are scarce or lacking. Such eruptions would have been hard to anticipate. Some studies have attempted to complement the limited statistics by considering fractures (6, 7), seismicity, tomo- graphic images, geochemistry, and gravity (8, 9). This is also prob- lematic, as there is no clear evidence that including such additional information improves vent forecasts. Fumaroles and fractures may have been caused by, rather than having been a driver of, dike propagation, thus forcing interpretation to a wrong conclusion. These approaches may be difficult to validate or falsify retrospectively. Forward validation is an outstanding issue for vent forecasts, as these maps are not routinely subject to testing. Performance testing generally involves partitioning the data into calibration and validation datasets. In the case of probabilistic vent opening maps, this translates into recalculating the maps on the basis of the earliest eruptions and verifying the performance on the most recent eruptions. Calculating maps for an arbitrary point in time may not be straightforward if the calculations rely on poorly dated datasets; some of these predictive models may be thus inherently hard to test. Moreover, partitioning the data would lower the number of points used to set up the map, exacerbating the issues linked to the need of extrapolating or inter- polating vent density. Despite these limitations, no better method has been proposed to address vent forecasting, hampering progress in vol- cano hazard modeling. Here, we propose a new concept to vent forecasting based on the combination of physical models of magma transport with Monte Carlo 1 GFZ German Research Centre for Geosciences, Telegrafenberg, Potsdam, Germany. 2 Department of Science, Roma Tre University, Rome, Italy. 3 King Abdullah University of Science and Technology (KAUST), Physical Sciences and Engineering Division (PSE), Thuwal 23955-6900, Saudi Arabia. 4 Istituto Nazionale di Geofisica e Vulcanologia, Osservatorio Vesuviano, Napoli, Italy. *Corresponding author. Email: [email protected] SCIENCE ADVANCES | RESEARCH ARTICLE Rivalta et al., Sci. Adv. 2019; 5 : eaau9784 31 July 2019 1 of 11 on February 17, 2020 http://advances.sciencemag.org/ Downloaded from
Transcript of Stress inversions to forecast magma pathways and eruptive ...statistics. Numerous theoretical and...

SC I ENCE ADVANCES | R E S EARCH ART I C L E
GEOPHYS I CS
1GFZ German Research Centre for Geosciences, Telegrafenberg, Potsdam, Germany.2Department of Science, Roma Tre University, Rome, Italy. 3King Abdullah Universityof Science and Technology (KAUST), Physical Sciences and Engineering Division(PSE), Thuwal 23955-6900, Saudi Arabia. 4Istituto Nazionale di Geofisica e Vulcanologia,Osservatorio Vesuviano, Napoli, Italy.*Corresponding author. Email: [email protected]
Rivalta et al., Sci. Adv. 2019;5 : eaau9784 31 July 2019
Copyright © 2019
The Authors, some
rights reserved;
exclusive licensee
American Association
for the Advancement
of Science. No claim to
originalU.S. Government
Works. Distributed
under a Creative
Commons Attribution
NonCommercial
License 4.0 (CC BY-NC).
Stress inversions to forecast magma pathways anderuptive vent locationE. Rivalta1*, F. Corbi1,2, L. Passarelli1,3, V. Acocella2, T. Davis1, M. A. Di Vito4
When a batch ofmagma reaches Earth’s surface, it forms a vent fromwhich volcanic products are erupted. Atmanyvolcanoes, successive batches may open vents far away from previous ones, resulting in scattered, sometimesseemingly random spatial distributions. This exposes vast areas to volcanic hazards andmakes forecasting difficult.Here, we show that magma pathways and thus future vent locations may be forecast by combining the physics ofmagma transport with aMonte Carlo inversion scheme for the volcano stress history. We validate our approach ona densely populated active volcanic field, Campi Flegrei (Italy), where we forecast future vents on an onshore semi-annular belt locatedbetween 2.3 and4.2 km from the caldera center. Our approach offers amechanical explanationfor the vent migration over time at Campi Flegrei and at many calderas worldwide and may be applicable tovolcanoes of any type.
Do
on February 17, 2020
http://advances.sciencemag.org/
wnloaded from
INTRODUCTIONAbasic, poorly investigated problem in volcano hazard studies is thatwe do not know where the next eruptive vent might form. This prob-lem affects, to some extent, all active volcanoes, as there is always atleast some chance of eruptive fissures opening in unexpected loca-tions distant from the volcano summit. At central volcanoes with acharacteristic cone shape (e.g., Hawaii or Etna), many eruptions areexpected to occur on, or close to, the volcano summit. Eruptions alsopunctuate rift zones branching from the volcano summit, showingthat new fissures may open at low altitude along the rifts, endanger-ing populated areas. Some types of volcanoes, however, do not showany cone-shaped edifice and lack a summit focusing eruptive activity.This is the case of calderas, kilometer-sized subcircular depressionsresulting from the drainage of magma chambers and collapse of theirroof. Calderas have fed some of the most catastrophic eruptions onEarth and are extremely hazardous (1). However, their eruptions aregenerally few and far apart; thus, hazard is often underestimated by thelocal population, which, at some calderas, approaches 1 million. Ascalderas are associated with large volcanic fields, with past eruptivevents scattered throughout, the problem of forecasting the locationof future eruption is extremely challenging.
Volcano hazard models, including lava and pyroclastic flow orplume expansion and fallout models, have reached high levels of so-phistication but remain poorly constrained because of the large uncer-tainties on where magma will breach Earth’s surface to create eruptivevents, especially at calderas (2). The need for probabilistic maps of fu-ture eruptive vents has typically been addressed empirically, on thebasis of the surface distribution of past vents (3–5). This is generallymore or less implicitly justified on the basis of two different underlyingassumptions. On one hand, it is sometimes assumed that previousvents mark weaknesses or paths in the host rock that will guide as-cending magma. This assumption is not supported by observations,as many volcanoes are punctuated by monogenetic (e.g., used by onlyone eruption) vents, surrounded by tens of other monogenetic vents.
According to a second rationale, the observed vents’ patterns reflect anunknown physical controlling mechanism (5), thereby justifying adata-driven approach to create probabilistic maps. An animation ofthe eruptive history in the last 15 thousand years (ka) before presentat Campi Flegrei caldera (http://hazard-mapping.org/Campi-Flegrei.html) illustrates that after the initial phase, where vents are scattered,most vents open relatively close to clusters of previous vents. Thisqualitatively shows how data-driven approaches work better and bet-ter as the density distribution gets populated. However, the number ofobserved vents at volcanoes rarely exceeds a few tens; hence, the under-lying physical mechanism remains sampled by very few eruptions toprovide a sharp representation of the vent distribution probability, re-sulting in very coarse maps. The animation shows that occasional erup-tions (including the last 1538 Monte Nuovo eruption) hit locationsdistant fromprevious vents: Forecasts for such low-probability locationswill be affected by large uncertainties, as interpolation or extrapolationis needed where data are scarce or lacking. Such eruptions would havebeen hard to anticipate. Some studies have attempted to complementthe limited statistics by considering fractures (6, 7), seismicity, tomo-graphic images, geochemistry, and gravity (8, 9). This is also prob-lematic, as there is no clear evidence that including such additionalinformation improves vent forecasts. Fumaroles and fracturesmay havebeen caused by, rather than having been a driver of, dike propagation,thus forcing interpretation to a wrong conclusion. These approachesmay be difficult to validate or falsify retrospectively.
Forward validation is an outstanding issue for vent forecasts, asthese maps are not routinely subject to testing. Performance testinggenerally involves partitioning the data into calibration and validationdatasets. In the case of probabilistic vent opening maps, this translatesinto recalculating the maps on the basis of the earliest eruptions andverifying the performance on the most recent eruptions. Calculatingmaps for an arbitrary point in time may not be straightforward if thecalculations rely on poorly dated datasets; some of these predictivemodels may be thus inherently hard to test. Moreover, partitioningthe data would lower the number of points used to set up the map,exacerbating the issues linked to the need of extrapolating or inter-polating vent density. Despite these limitations, no better method hasbeen proposed to address vent forecasting, hampering progress in vol-cano hazard modeling.
Here, we propose a new concept to vent forecasting based on thecombination of physical models of magma transport withMonte Carlo
1 of 11

SC I ENCE ADVANCES | R E S EARCH ART I C L E
statistics. Numerous theoretical and field studies have established thathost rock stresses dictate magma pathways: Magma-filled fractures(dikes) feed eruptions, and during ascent to the surface, the dikes alignthemselves with the most energy-efficient orientation, which is roughlyperpendicular to the least compressive principal stress axis, s3 (10–16).Contrary to intuition, preexisting faults appear of subordinate impor-tance in guiding magma (10–13), as their orientation in respect to thestress field is optimized for shearing movements; thus, opening alongsuch planes is inefficient. In this framework, dike trajectories can be pre-dicted, provided that we know, with sufficient resolution, the volcanostress field and the dike starting location (the magma chamber). Stressmagnitudes and directions in crustal rocks, however, are generally verypoorly constrained. Despite this, we show that magma trajectories, andthus eruptive vent locations, are so sensitive to stress variations that theprevious vent locations at a volcano can be used to constrain the stressfield to a sufficient degree of accuracy to render reliable physics-basedvent forecasts possible.
on February 17, 2020
http://advances.sciencemag.org/
Dow
nloaded from
RESULTS AND DISCUSSIONConcept of the vent forecast schemeWe propose a scheme based on three independent blocks: (i) a deter-ministic model for magma trajectories and thus vent opening wherethe dike trajectories intersect Earth’s surface; (ii) a deterministicmodelfor the volcano stress field, needed to calculate the dike trajectories;and (iii) a probabilistic scheme to constrain, on the basis of the ob-served vents, the posterior distributions of all models’ parameters.In other words, under the assumption that crustal stresses govern diketrajectories, we will retrieve the model parameters’ distributions thatleadmagma to propagate from the knownmagma reservoir’s locationto the location of the observed vents. Last, probabilistic forecasts areobtained by combining the deterministic models with the posteriorparameter distributions. In the following, we first introduce the gen-eral scheme and outline some of the options available to deal with thethree blocks described above. Next, we apply the scheme to vent fore-casting at Campi Flegrei caldera. For this first application, we opt forthe simplest deterministic and statistic models to enhance ease of ex-planation and model transparency.
State-of-the-art models for magma propagation trajectories arebased onmaximizing tensile stresses at the dike tip line (15) or energyrelease rate on prospective dike incremental elongations (14, 16).These models account for magma buoyancy pressure and allow formixed-mode propagation and are thus capable of accurately treatingthe effects of layering or the free surface. These methods, however, in-volve several parameters. In our application to Campi Flegrei, we use asimpler option: Magma propagates strictly perpendicular to the leastcompressive principal stress axis s3. According to this approximation,magma-driven fractures will be pure opening fractures (10, 11). Inother words, development of mixed-mode fractures resulting, e.g.,from the interaction of the dike with layering or the free-surface willbe neglected; the resulting bias on the trajectories is discussed below.In three dimensions, the directions perpendicular to s3 in every pointof space identify a family of surfaces on whichmagma is assumed topropagate; these will intersect Earth’s surface as a curve on whichthe eruptive fissure will lie. In two dimensions, the surfaces becomes3-perpendicular streamlines, i.e., curves aligned in every point tos1. These surfaces or curves are obtained from the eigenvalues andeigenvectors of the stress tensor in every point of the crustal volumeunder investigation.
Rivalta et al., Sci. Adv. 2019;5 : eaau9784 31 July 2019
Deterministic simulations of magma trajectories rely on a well-balanced stress model for the volcano. Layering affects edifice stressesand magma trajectories (16), but the benefit of considering it shouldbe weighed against the need of including detailed information on nu-merous, often poorly constrained, structural parameters. For ourapplication to Campi Flegrei, we take a simpler approach and assumea homogeneous half-space.
For the parameter inversions, efficient Bayesian resamplingmethods, such as Markov chain Monte Carlo (17), are probably thebest option for the general case. In our application to Campi Flegrei,we resort to the computationally inefficient but simple Sampling/Importance Resampling (SIR) algorithm (18, 19). The SIR is a non-iterative Bayesian Monte Carlo “perfect sampler” (17): A large num-ber of magma propagation trajectories are calculated at the beginningof the procedure on the basis of prior distributions for the modelparameters; from this set, a subset is selected (resampling) so thatthe modeled arrivals at Earth’s surface exactly reproduce the empir-ical distribution of observed vents. The resampling results in poste-rior distributions of themodel parameters, which can then be used inforward mode to compute a large number of magma trajectories andthus well-populated probabilistic vent forecasts.
In the following, we describe the details of the general conceptualscheme and present a simple application to Campi Flegrei. Last, wediscuss the potential and limits of the approach, considering thephysical plausibility of the inversion results and testing the forecasts’performance.
Parametric volcano stress modelWe assume that the background state of stress (i.e., before the estab-lishment of any volcanic edifice) is Andersonian (i.e., Earth’s surface isstress free and one of the principal stress axes is vertical). Under thisassumption, given that the equations of elasticity are linear, trajectorycalculationsmay rely just on the perturbations from a lithostatic stressstate (15). We assume that the local state of stress will evolve at anytime, t, and point in space, (x,y,z > 0), as the linear superposition ofboth slow and sudden processes affecting the volcano history
sTOTðx; y; z; tÞ ¼ sTðx; y; z; tÞ þ sCðx; y; z; tÞ þ sLðx; y; z; tÞ þsUðx; y; z; tÞ þ s Iðx; y; z; tÞ þ sEðx; y; z; tÞ ð1Þ
where sTOT(x,y,z,t) is the supralithostatic full stress tensor; sT(x,y,z,t)is the regional tectonic stress tensor; sC(x,y,z,t) is the stress perturba-tion due to magma chamber pressurization (20, 21); sL(x,y,z,t) is thestress perturbation due to edifice load (13, 14, 22); sU(x,y,z,t) is thestress perturbation due to unloading caused by mass redistributionsowing to, e.g., icecap melting (23), excavation of a caldera (24), or aflank collapse (25, 26); s I(x,y,z,t) is the stress tensor due to previousmagmatic intrusions; and sE(x,y,z,t) is the stress tensor due to previ-ous large earthquakes or slow slip events. Multiple or additional termsmay be appropriate in special cases. Coupling between these terms,where, for example, edifice loading influences magma chamber shapeand thus its stress perturbation, are neglected in this first-order linearapproach. Fully interacting approaches, relying on, e.g., boundary ele-ment calculations, are also compatible with our general scheme andcan be considered in future studies.
The terms in Eq. 1 are not all equally important: They are roughlyordered according to a decreasing extent of the stressed rock volume,since these stresses decay away from the source over a distance that
2 of 11
SC I ENCE ADVANCES | R E S EARCH ART I C L E
on February 17, 2020
http://advances.sciencemag.org/
Dow
nloaded from
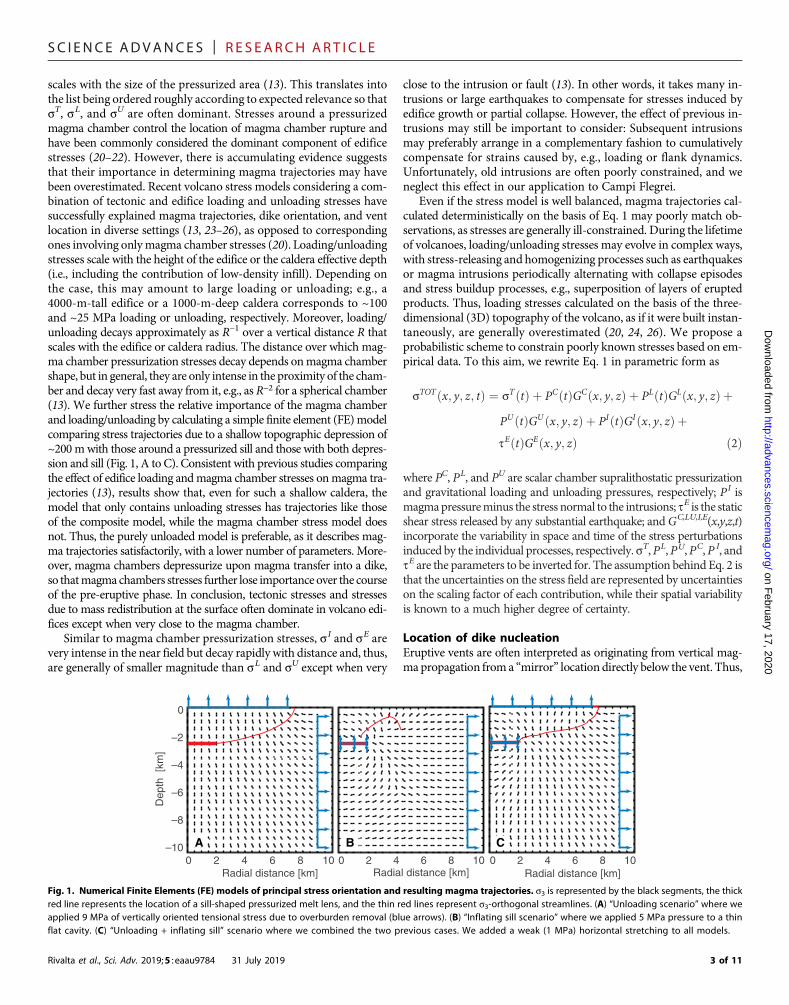
scales with the size of the pressurized area (13). This translates intothe list being ordered roughly according to expected relevance so thatsT, sL, and sU are often dominant. Stresses around a pressurizedmagma chamber control the location of magma chamber rupture andhave been commonly considered the dominant component of edificestresses (20–22). However, there is accumulating evidence suggeststhat their importance in determining magma trajectories may havebeen overestimated. Recent volcano stress models considering a com-bination of tectonic and edifice loading and unloading stresses havesuccessfully explained magma trajectories, dike orientation, and ventlocation in diverse settings (13, 23–26), as opposed to correspondingones involving onlymagma chamber stresses (20). Loading/unloadingstresses scale with the height of the edifice or the caldera effective depth(i.e., including the contribution of low-density infill). Depending onthe case, this may amount to large loading or unloading; e.g., a4000-m-tall edifice or a 1000-m-deep caldera corresponds to ~100and ~25 MPa loading or unloading, respectively. Moreover, loading/unloading decays approximately as R−1 over a vertical distance R thatscales with the edifice or caldera radius. The distance over which mag-ma chamber pressurization stresses decay depends onmagma chambershape, but in general, they are only intense in the proximity of the cham-ber and decay very fast away from it, e.g., as R−2 for a spherical chamber(13). We further stress the relative importance of the magma chamberand loading/unloading by calculating a simple finite element (FE)modelcomparing stress trajectories due to a shallow topographic depression of~200mwith those around a pressurized sill and those with both depres-sion and sill (Fig. 1, A to C). Consistent with previous studies comparingthe effect of edifice loading andmagma chamber stresses onmagma tra-jectories (13), results show that, even for such a shallow caldera, themodel that only contains unloading stresses has trajectories like thoseof the composite model, while the magma chamber stress model doesnot. Thus, the purely unloaded model is preferable, as it describes mag-ma trajectories satisfactorily, with a lower number of parameters. More-over, magma chambers depressurize upon magma transfer into a dike,so thatmagma chambers stresses further lose importance over the courseof the pre-eruptive phase. In conclusion, tectonic stresses and stressesdue to mass redistribution at the surface often dominate in volcano edi-fices except when very close to the magma chamber.
Similar to magma chamber pressurization stresses, s I and sE arevery intense in the near field but decay rapidly with distance and, thus,are generally of smaller magnitude than sL and sU except when very
Rivalta et al., Sci. Adv. 2019;5 : eaau9784 31 July 2019
close to the intrusion or fault (13). In other words, it takes many in-trusions or large earthquakes to compensate for stresses induced byedifice growth or partial collapse. However, the effect of previous in-trusions may still be important to consider: Subsequent intrusionsmay preferably arrange in a complementary fashion to cumulativelycompensate for strains caused by, e.g., loading or flank dynamics.Unfortunately, old intrusions are often poorly constrained, and weneglect this effect in our application to Campi Flegrei.
Even if the stress model is well balanced, magma trajectories cal-culated deterministically on the basis of Eq. 1 may poorly match ob-servations, as stresses are generally ill-constrained. During the lifetimeof volcanoes, loading/unloading stresses may evolve in complex ways,with stress-releasing and homogenizing processes such as earthquakesor magma intrusions periodically alternating with collapse episodesand stress buildup processes, e.g., superposition of layers of eruptedproducts. Thus, loading stresses calculated on the basis of the three-dimensional (3D) topography of the volcano, as if it were built instan-taneously, are generally overestimated (20, 24, 26). We propose aprobabilistic scheme to constrain poorly known stresses based on em-pirical data. To this aim, we rewrite Eq. 1 in parametric form as
sTOTðx; y; z; tÞ ¼ sTðtÞ þ PCðtÞGCðx; y; zÞ þ PLðtÞGLðx; y; zÞ þPUðtÞGUðx; y; zÞ þ PIðtÞGIðx; y; zÞ þtEðtÞGEðx; y; zÞ ð2Þ
where PC, PL, and PU are scalar chamber supralithostatic pressurizationand gravitational loading and unloading pressures, respectively; PI ismagmapressureminus the stress normal to the intrusions; tE is the staticshear stress released by any substantial earthquake; andGC,LU,I,E(x,y,z,t)incorporate the variability in space and time of the stress perturbationsinduced by the individual processes, respectively.sT,PL,PU,PC,P I, andtE are the parameters to be inverted for. The assumption behind Eq. 2 isthat the uncertainties on the stress field are represented by uncertaintieson the scaling factor of each contribution, while their spatial variabilityis known to a much higher degree of certainty.
Location of dike nucleationEruptive vents are often interpreted as originating from vertical mag-ma propagation from a “mirror” location directly below the vent. Thus,
0 2 4 6 8 10Radial distance [km]
–10
–8
–6
–4
–2
0
Dep
th [
km]
0 2 4 6 8 10Radial distance [km]
0 2 4 6 8 10Radial distance [km]
A B C
Fig. 1. Numerical Finite Elements (FE) models of principal stress orientation and resulting magma trajectories. s3 is represented by the black segments, the thickred line represents the location of a sill-shaped pressurized melt lens, and the thin red lines represent s3-orthogonal streamlines. (A) “Unloading scenario” where weapplied 9 MPa of vertically oriented tensional stress due to overburden removal (blue arrows). (B) “Inflating sill scenario” where we applied 5 MPa pressure to a thinflat cavity. (C) “Unloading + inflating sill” scenario where we combined the two previous cases. We added a weak (1 MPa) horizontal stretching to all models.
3 of 11

SC I ENCE ADVANCES | R E S EARCH ART I C L E
on February 17, 2020
http://advances.sciencemag.org/
Dow
nloaded from
when the vent distribution shows migration patterns, this is oftenattributed to a migration of the magma source. Here, we argue thatthe curvature of stress-controlled magma pathways may offset sig-nificantly vent location from their source at depth (14, 24, 26), add-ing uncertainty to the starting location of the dikes. In our approach,the dike starting location can be either assumed on the basis of in-dependent observations or treated as an additional unknown to beinverted for. We will show below that stresses and magma startinglocations cannot be both determined independently with a high degreeof accuracy, as they suffer from a strong trade-off. Thus, incorporatingindependent information on the magma starting locationmay be crit-ical to an accurate resolution of edifice stresses. Crustal deformationmay provide the most reliable constraint, as magma chamber shapestrongly influences the location of magma chamber rupture (21, 22).At many calderas, crustal deformation is often consistent with thinhorizontal penny-shaped cracks as sinks of melt accumulation. Suchpenny-shaped cracks are expected to rupture somewhere at their tipline, at a depth d and radial distance from the center r.
Probabilistic scheme and inversion procedureFirst, the stress field due to the individual contributions in Eq. 2 isestimated from the 3D topography, edifice history, and structuralinformation, e.g., by applying a distribution of loads on Earth’s sur-face to mimic topography (13, 14, 24–26). Once all G terms in Eq. 2have been estimated, prior distributions for the P terms, p(q), aredefined according to plausible ranges or any other prior informationavailable. On the basis of those prior distributions, a set of randomparameters are drawn, and the stress tensor (Eq. 2) is calculated anddiagonalized to obtain the principal stresses. Trajectories are thencalculated starting from the known location of the magma chamber,or, alternatively, depth d and radius r of dike nucleation can be in-cluded among the parameters inverted for. The dike arrivals at Earth’ssurface for all combination of random parameters result in a modeledvent distribution p(x). A Bayesian resampling scheme will return thelikelihood p(x|q) and the posterior distributions of the model param-eters p(q|x).
In the SIR scheme, the distribution p(x) is resampled by onlyretaining in each bin xi a fraction of modeled vents
wðxiÞ ¼ ½YoðxiÞ=YmðxiÞ�=Sj½YoðxjÞ=YmðxjÞ� ð3Þ
where w(xi) are the importance weights (18, 19) and Yo(xi) andYm(xi) are the distribution of the observed and modeled vents, re-spectively. The resulting likelihood exactly replicates the distribu-tion of the observations and restitutes posterior probabilities forthe model parameters. Combining such posteriors with the determi-nistic stress and trajectory models results in a probabilistic stressfield model that can be used to compute forecasts.
Explanatory models and forecastsWe now illustrate how our stress inversion procedure can help bothimprove the understanding of vent migration patterns during avolcano’s history and produce probabilistic forecasts that are testableat least in retrospective. We illustrate below this explanatory and pre-dictive potential with application to Campi Flegrei. For our explanatorymodel, we invert for stress parameters and location of dike nucleation.For our forecasts, wewill reduce the set of parameters by fixing themag-ma chamber depth and the radius to take advantage of informationfrom inversion of crustal deformation data.
Rivalta et al., Sci. Adv. 2019;5 : eaau9784 31 July 2019
A precondition for a stress inversion is that tectonic and edificestresses were roughly stable over the period of formation of a set ofvents. Such a stationary stress state is an idealization of reality, as eachbatch of magma will change the stress field with its eruption depositsor from permanent host rock deformation. Nevertheless, as discussedabove, a volcano eruptive history is often punctuated by a few domi-nant events. These events ideally partition the volcano’s eruptivehistory in a series of approximately stationary stress epochs that wecan use to partition the vent data for the inversions. Inversion resultsfromdifferent epochs can then be comparedwith the edifice history tolearn about how major edifice-modifying events are reflected in theestimated stresses. In particular, estimates of PL and PU obtainedfrom the inversion, PL,m and PU,m, are expected to amount to a frac-tion of PL,o = rLghL and PU,o = rUghU, i.e., those expected from theobserved 3D volcano structure, where rL and rU are the average den-sity of the added crustal material and the excavated volume, respec-tively; g is the acceleration due to gravity; and hL and hU are theheight of the edifice and the thickness of the overburden removal,respectively. The fractions RL = PL,m/PL,o and RU = PU,m/PU,o, wheresuperscripts m and o indicate pressures resulting from the inversionand modeled on the basis of the stratigraphy, respectively, are a proxyfor the longevity of elastic stresses in the volcanic edifice.
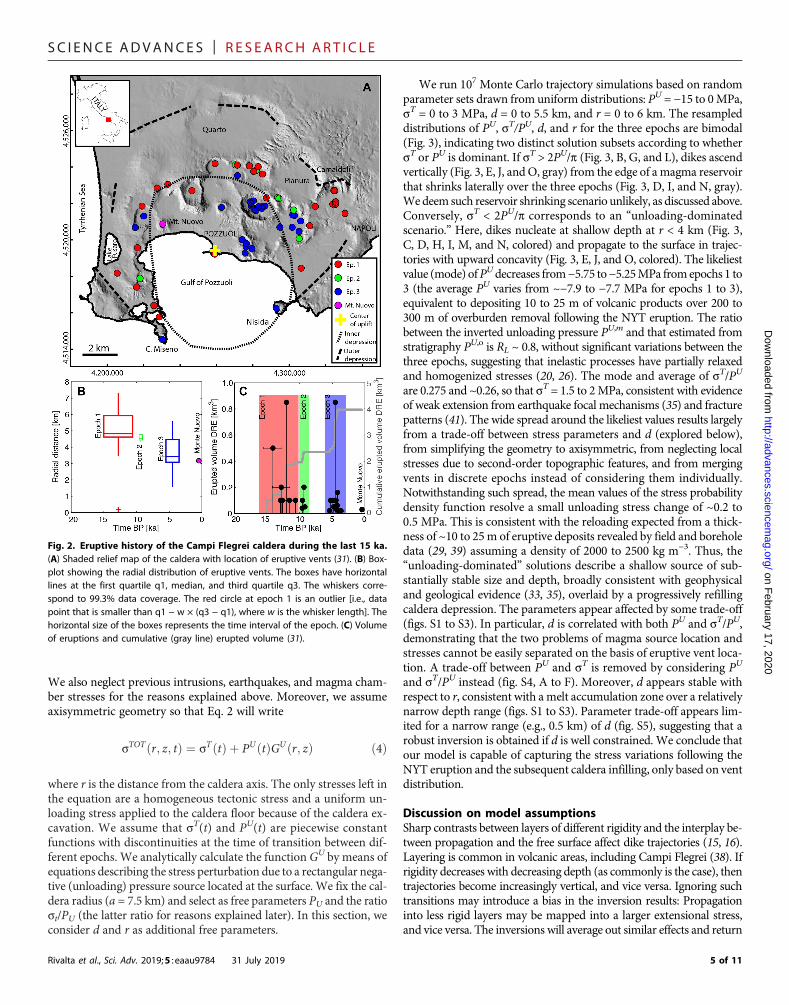
Application to Campi Flegrei calderaWe test our approach against the high-risk Campi Flegrei caldera(Italy). Campi Flegrei (Fig. 2A) caldera formed during the eruptionsof the Campanian Ignimbrite ~39 ka ago and the Neapolitan YellowTuff (NYT) ~15 ka ago (27, 28). Postcaldera volcanism developed >70monogenic vents focused in the northeast (NE), presently onshore,sector of the caldera. Eruptive activity migrated progressively inwardover epochs 1 (15 to 9.5 ka ago), 2 (8.6 to 8.2 ka ago), and 3 (4.8 to3.7 ka ago) (Fig. 2, A and B) (29–32). Deposition of 25- to 300-m-thick, 3- to 25-m-thick, and 5- to 80-m-thick eruptive products overthe three epochs, respectively, has partially refilled the inner caldera(29). Coeval resurgence uplifted the caldera central sector of ~180 m,of which >60 m ensued in the last ~5 ka ago (33). The last eruptionoccurred at Monte Nuovo, in 1538 (29, 34), whereas the most recentactivity consists of four unrest episodes in 1950 to 1952, 1969 to 1972,1982 to 1984, and 2005 to present, with an uplift of ~0.7, ~1.7, ~1.8,and ~0.4 m, respectively (35, 36). Inflation of a caldera-centered ob-late spheroidal magma chamber at a depth of ~3.5 km is consistentwith the deformation in the last ~600 years at least (34–37). The in-ward migration of post-collapse volcanism (Fig. 2B) and the onshorefocusing of vents (Fig. 2A) are both currently unexplained. A progres-sive shrinking of the magma chamber (38), invoked to explain the ob-served inward vent migration, is inconsistent with the approximatelyconstant eruptive rates in the last 15 ka ago (Fig. 2C) (35) and theinferred size of the stationary shallow magmatic source in the last~5 ka ago (34). Also, the onshore focusing of the vents, previously ex-plained by the activity of a tilted resurgent block (39), is in contrastwith later studies highlighting a nontilted resurgent dome (40).
Forward explanatory model for Campi FlegreiOur working hypothesis is that the inward vent migration observedover the last 15 ka has been caused by stress variations. We drasticallysimplify Eq. 2 with the aim of keeping the number of parameters low.Loading from the volcanic edificemay be neglected because of the lackof an important topography [we explore the effect of the existingapproximately SW (southwest)–NE topography gradient below].
4 of 11
SC I ENCE ADVANCES | R E S EARCH ART I C L E
on February 17, 2020
http://advances.sciencemag.org/
Dow
nloaded from
We also neglect previous intrusions, earthquakes, and magma cham-ber stresses for the reasons explained above. Moreover, we assumeaxisymmetric geometry so that Eq. 2 will write
sTOTðr; z; tÞ ¼ sTðtÞ þ PUðtÞGUðr; zÞ ð4Þ
where r is the distance from the caldera axis. The only stresses left inthe equation are a homogeneous tectonic stress and a uniform un-loading stress applied to the caldera floor because of the caldera ex-cavation. We assume that sT(t) and PU(t) are piecewise constantfunctions with discontinuities at the time of transition between dif-ferent epochs. We analytically calculate the function GU by means ofequations describing the stress perturbation due to a rectangular nega-tive (unloading) pressure source located at the surface. We fix the cal-dera radius (a = 7.5 km) and select as free parameters PU and the ratiost/PU (the latter ratio for reasons explained later). In this section, weconsider d and r as additional free parameters.
Rivalta et al., Sci. Adv. 2019;5 : eaau9784 31 July 2019
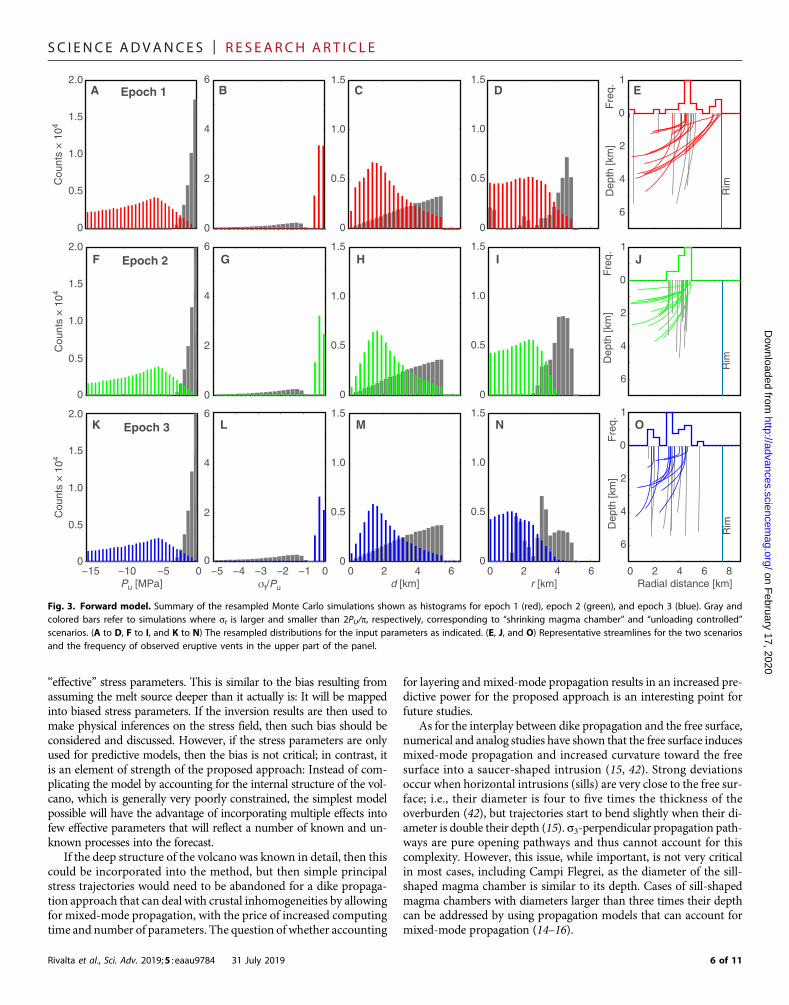
We run 107 Monte Carlo trajectory simulations based on randomparameter sets drawn from uniform distributions: PU = −15 to 0MPa,sT = 0 to 3 MPa, d = 0 to 5.5 km, and r = 0 to 6 km. The resampleddistributions of PU, sT/PU, d, and r for the three epochs are bimodal(Fig. 3), indicating two distinct solution subsets according to whethersT or PU is dominant. If sT > 2PU/p (Fig. 3, B, G, and L), dikes ascendvertically (Fig. 3, E, J, and O, gray) from the edge of a magma reservoirthat shrinks laterally over the three epochs (Fig. 3, D, I, and N, gray).Wedeem such reservoir shrinking scenario unlikely, as discussed above.Conversely, sT < 2PU/p corresponds to an “unloading-dominatedscenario.” Here, dikes nucleate at shallow depth at r < 4 km (Fig. 3,C, D, H, I, M, and N, colored) and propagate to the surface in trajec-tories with upward concavity (Fig. 3, E, J, and O, colored). The likeliestvalue (mode) ofPU decreases from−5.75 to−5.25MPa fromepochs 1 to3 (the average PU varies from ~−7.9 to −7.7 MPa for epochs 1 to 3),equivalent to depositing 10 to 25 m of volcanic products over 200 to300 m of overburden removal following the NYT eruption. The ratiobetween the inverted unloading pressure PU,m and that estimated fromstratigraphy PU,o is RL ~ 0.8, without significant variations between thethree epochs, suggesting that inelastic processes have partially relaxedand homogenized stresses (20, 26). The mode and average of sT/PU
are 0.275 and ~0.26, so that sT = 1.5 to 2MPa, consistent with evidenceof weak extension from earthquake focal mechanisms (35) and fracturepatterns (41). The wide spread around the likeliest values results largelyfrom a trade-off between stress parameters and d (explored below),from simplifying the geometry to axisymmetric, from neglecting localstresses due to second-order topographic features, and from mergingvents in discrete epochs instead of considering them individually.Notwithstanding such spread, the mean values of the stress probabilitydensity function resolve a small unloading stress change of ~0.2 to0.5 MPa. This is consistent with the reloading expected from a thick-ness of ~10 to 25m of eruptive deposits revealed by field and boreholedata (29, 39) assuming a density of 2000 to 2500 kg m−3. Thus, the“unloading-dominated” solutions describe a shallow source of sub-stantially stable size and depth, broadly consistent with geophysicaland geological evidence (33, 35), overlaid by a progressively refillingcaldera depression. The parameters appear affected by some trade-off(figs. S1 to S3). In particular, d is correlated with both PU and sT/PU,demonstrating that the two problems of magma source location andstresses cannot be easily separated on the basis of eruptive vent loca-tion. A trade-off between PU and sT is removed by considering PU
and sT/PU instead (fig. S4, A to F). Moreover, d appears stable withrespect to r, consistent with a melt accumulation zone over a relativelynarrow depth range (figs. S1 to S3). Parameter trade-off appears lim-ited for a narrow range (e.g., 0.5 km) of d (fig. S5), suggesting that arobust inversion is obtained if d is well constrained. We conclude thatour model is capable of capturing the stress variations following theNYT eruption and the subsequent caldera infilling, only based on ventdistribution.
Discussion on model assumptionsSharp contrasts between layers of different rigidity and the interplay be-tween propagation and the free surface affect dike trajectories (15, 16).Layering is common in volcanic areas, including Campi Flegrei (38). Ifrigidity decreases with decreasing depth (as commonly is the case), thentrajectories become increasingly vertical, and vice versa. Ignoring suchtransitions may introduce a bias in the inversion results: Propagationinto less rigid layers may be mapped into a larger extensional stress,and vice versa. The inversions will average out similar effects and return
Fig. 2. Eruptive history of the Campi Flegrei caldera during the last 15 ka.(A) Shaded relief map of the caldera with location of eruptive vents (31). (B) Box-plot showing the radial distribution of eruptive vents. The boxes have horizontallines at the first quartile q1, median, and third quartile q3. The whiskers corre-spond to 99.3% data coverage. The red circle at epoch 1 is an outlier [i.e., datapoint that is smaller than q1 − w × (q3 − q1), where w is the whisker length]. Thehorizontal size of the boxes represents the time interval of the epoch. (C) Volumeof eruptions and cumulative (gray line) erupted volume (31).
5 of 11
SC I ENCE ADVANCES | R E S EARCH ART I C L E
on February 17, 2020
http://advances.sciencemag.org/
Dow
nloaded from
“effective” stress parameters. This is similar to the bias resulting fromassuming the melt source deeper than it actually is: It will be mappedinto biased stress parameters. If the inversion results are then used tomake physical inferences on the stress field, then such bias should beconsidered and discussed. However, if the stress parameters are onlyused for predictive models, then the bias is not critical; in contrast, itis an element of strength of the proposed approach: Instead of com-plicating the model by accounting for the internal structure of the vol-cano, which is generally very poorly constrained, the simplest modelpossible will have the advantage of incorporating multiple effects intofew effective parameters that will reflect a number of known and un-known processes into the forecast.
If the deep structure of the volcano was known in detail, then thiscould be incorporated into the method, but then simple principalstress trajectories would need to be abandoned for a dike propaga-tion approach that can deal with crustal inhomogeneities by allowingfor mixed-mode propagation, with the price of increased computingtime and number of parameters. The question of whether accounting
Rivalta et al., Sci. Adv. 2019;5 : eaau9784 31 July 2019
for layering and mixed-mode propagation results in an increased pre-dictive power for the proposed approach is an interesting point forfuture studies.
As for the interplay between dike propagation and the free surface,numerical and analog studies have shown that the free surface inducesmixed-mode propagation and increased curvature toward the freesurface into a saucer-shaped intrusion (15, 42). Strong deviationsoccur when horizontal intrusions (sills) are very close to the free sur-face; i.e., their diameter is four to five times the thickness of theoverburden (42), but trajectories start to bend slightly when their di-ameter is double their depth (15). s3-perpendicular propagation path-ways are pure opening pathways and thus cannot account for thiscomplexity. However, this issue, while important, is not very criticalin most cases, including Campi Flegrei, as the diameter of the sill-shaped magma chamber is similar to its depth. Cases of sill-shapedmagma chambers with diameters larger than three times their depthcan be addressed by using propagation models that can account formixed-mode propagation (14–16).
0
0.5
1.0
1.5
2.0
Cou
nts
× 1
04
0
2
4
6
0
0.5
1.0
1.5
0
0
1.0
1.5
2.0
Cou
nts
× 1
04
0
2
4
6
0
−10 −5 0Pu [MPa]
0
0.5
1.0
2.0
Cou
nts
× 1
04
−5 −4 −3 −2 −1 00
2
4
6
0 2 4 6d [km]
0 2 4 6r [km]
0 2 4 6 8Radial distance [km]
1
0
2
4
6
Dep
th [k
m]
0
0.5
1.0
1.5
0
0.5
1.0
1.5
0.5
1.0
1.5
0.5
1.0
1.5
0
0.5
1.0
1.5
1
0
2
4
6
Dep
th [k
m]
1
0
2
4
6
Dep
th [k
m]
Fre
q.F
req.
Fre
q.
Rim
Rim
Rim
A B C D E
F G H I J
K L M N O
Epoch 1
Epoch 2
Epoch 3
0.5
1.5
−15
Fig. 3. Forward model. Summary of the resampled Monte Carlo simulations shown as histograms for epoch 1 (red), epoch 2 (green), and epoch 3 (blue). Gray andcolored bars refer to simulations where st is larger and smaller than 2PU/p, respectively, corresponding to “shrinking magma chamber” and “unloading controlled”scenarios. (A to D, F to I, and K to N) The resampled distributions for the input parameters as indicated. (E, J, and O) Representative streamlines for the two scenariosand the frequency of observed eruptive vents in the upper part of the panel.
6 of 11
SC I ENCE ADVANCES | R E S EARCH ART I C L E
on February 17, 2020
http://advances.sciencemag.org/
Dow
nloaded from
Rim
Rim
Rim
Rim
Radial distance [km]
0
2
4
1.5
1.0
0.5
0.10
0.05
0
0.20
0.15
10
5
0
20
15
Dep
th [k
m]
0.10
0.05
0
0.20
0.15
10
5
0
20
15
pdf0
2
4
1.5
1.0
0.5
Dep
th [k
m]
0 2 4 6 8 −15 −10 −5 0 −0.6 −0.4 −0.2
0
2
4
0.8
0.4
Dep
th [k
m]
0
2
4
0.4
0.2
Dep
th [k
m]
0.10
0.05
0
0.20
0.15
10
5
0
20
15
0.10
0.05
0
0.20
0.15
10
5
0
20
15
0 2 4 6 8−15 −10 −5 0 −0.6 −0.4 −0.2
Learning phase
Radial distance [km]PU
[MPa]
ForecastingParameter update Vent forecasting
D E F
G H I
J K L
M N O
0 2 4 6 8 −15 −10 −5 0 −0.6 −0.4 −0.2
0.10
0.05
0
0.20
0.15
10
5
0
15
0
2
4
1.5
1.0
0.5
Dep
th [k
m]
STATIONARY STRESS FORECAST
EVOLVING STRESS FORECAST
Radial distance [km] PU [MPa] t /PU
t /PU
t/PU
PU [MPa]
A B C
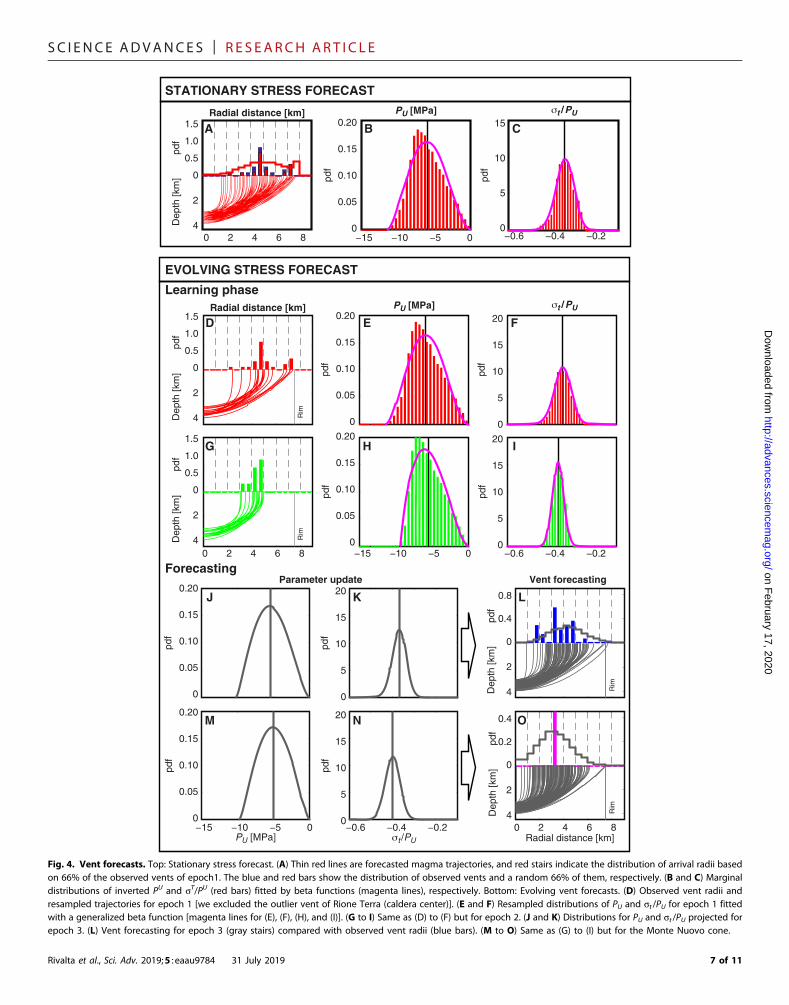
Fig. 4. Vent forecasts. Top: Stationary stress forecast. (A) Thin red lines are forecasted magma trajectories, and red stairs indicate the distribution of arrival radii basedon 66% of the observed vents of epoch1. The blue and red bars show the distribution of observed vents and a random 66% of them, respectively. (B and C) Marginaldistributions of inverted PU and sT/PU (red bars) fitted by beta functions (magenta lines), respectively. Bottom: Evolving vent forecasts. (D) Observed vent radii andresampled trajectories for epoch 1 [we excluded the outlier vent of Rione Terra (caldera center)]. (E and F) Resampled distributions of PU and st /PU for epoch 1 fittedwith a generalized beta function [magenta lines for (E), (F), (H), and (I)]. (G to I) Same as (D) to (F) but for epoch 2. (J and K) Distributions for PU and st /PU projected forepoch 3. (L) Vent forecasting for epoch 3 (gray stairs) compared with observed vent radii (blue bars). (M to O) Same as (G) to (I) but for the Monte Nuovo cone.
Rivalta et al., Sci. Adv. 2019;5 : eaau9784 31 July 2019 7 of 11
SC I ENCE ADVANCES | R E S EARCH ART I C L E
on February 1
http://advances.sciencemag.org/
Dow
nloaded from
Forecast for Campi FlegreiWe now construct and test a predictive version of our approach. Wereduce the number of free parameters by fixing the probabilitydistribution for magma chamber depth to a generalized beta function(a = b = 2) ranging between 3 and 4 km, based on the inversion resultsin (38), and the nucleation radius to r = 0, thus inverting for only PU
and sT/PU. Generalized beta functions are chosen here as they seem toprovide good fits. Note that no loss of generality occurs owing to ther = 0 condition, because dike trajectories are horizontal for small radii;i.e., they lie on the assumed sill-shaped melt lens before bendingtoward the surface.
We use the data from epoch 1 to illustrate a stable-stress forecast,assuming that the condition of a stable state of stress is met. We use arandom subset (two-thirds of the sample size, thus 20 of 31 vents) ofthe observed vent radii to resample PU and sT/PU. On the basis of theobtained posterior distributions, we produce a forecast by running 104
Monte Carlo simulations. Last, we test the forecast with the remain-ing one-third of the vents (Fig. 4, top). We find that this 2D forecastmatches the distribution of radii well for those vents not used to setup the forecast. Note that having the magma chamber geometryfixed leads to stress parameters that are numerically different fromthose obtained with the explanatory model above; this is expectedbecause of the trade-off highlighted above and does not invalidateeither model.
We have demonstrated that, on the basis of only a few stressparameters (here two parameters), it is possible to forecast the loca-tion of future vents, provided that the stress field has remainedapproximately stable over the time interval used for the stress inver-sion. However, what if we want to forecast vents following a majorstress-modifying event for the volcano, with no observed vents avail-able to invert those new stresses and constrain such forecast? Withthis purpose in mind, we have developed a forecast approach to ex-trapolate the modeled stresses into the future. The approach takesadvantage of the link between inverted stresses and stresses modeledaccording to the observed stratigraphy. We illustrate and test suchevolving-stress forecast by using vent maps for epochs 1 and 2, alongwith stratigraphy information, to produce forecasts for epoch 3 andMonte Nuovo. We first resample the distributions of PU and sT/PU
Rivalta et al., Sci. Adv. 2019;5 : eaau9784 31 July 2019
for epochs 1 and 2 using all available vents (Fig. 4, bottom, D to I).We then assume a linear relationship between inverted unloadingand excavation stresses estimated from stratigraphy (and any othergeological or geophysical information). This is equivalent to assum-ing that RU is approximately constant over the volcano history. Wethen assume that the average of the unloading pressure distributionPU,m and its support (minimum and maximum stress value) evolveas RU*DP
U,O, which is proportional to the unloading stress due to thedeposition observed during the successive epochs (Fig. 4, E, F, H, andI, and fig. S6).
PU0 is calculated as follows
PU0 ¼ �gðdbrb þ S hiriÞ ð5Þ
where g is the acceleration due to gravity; db = 2 km is the 40 kaCampanian Ignimbrite collapse depth; hi and ri are the thickness anddensity of the post-Campanian Ignimbrite deposits (ri ranges from2400 to 2000 kg m−3), respectively; and rb = 2600 kg m−3 is thedensity of the basement (table S1). Besides updating the averageof the unloading distribution (fig. S6A), we also update the lowerlimit of the support of PU,m, Min(PU,m), by applying the same shift⟨DPU,m⟩, on the assumption that a reloading of the caldera will af-fect both best guess and its lower limit. Since two possible updatesof Min(PU,m) are available (starting from epochs 1 and 2), we taketheir average. The upper limit remains 0. The estimated ⟨PU,m⟩ forepoch 3 and Monte Nuovo are used to update sT/PU for the respec-tive periods, assuming that the product ⟨PU,m⟩*⟨sT/PU⟩ remains con-stant (fig. S6B).
The forecast vent radii for epoch 3 have 56% of the observed ventsfalling within the first and third quartile (where 50% are expected) ofthe forecast distribution (Fig. 4L). For Monte Nuovo, the mode of theresampled distribution, corresponding to a 3.25-km radius, coincideswith the observed distance of Monte Nuovo from the caldera center(Fig. 4O). While only one vent is insufficient to validate a forecast, wehighlight that Monte Nuovo is located in a low-probability area fromprevious studies andwould have been hardly anticipated if thosemapshad been available before the eruption.
7, 2020
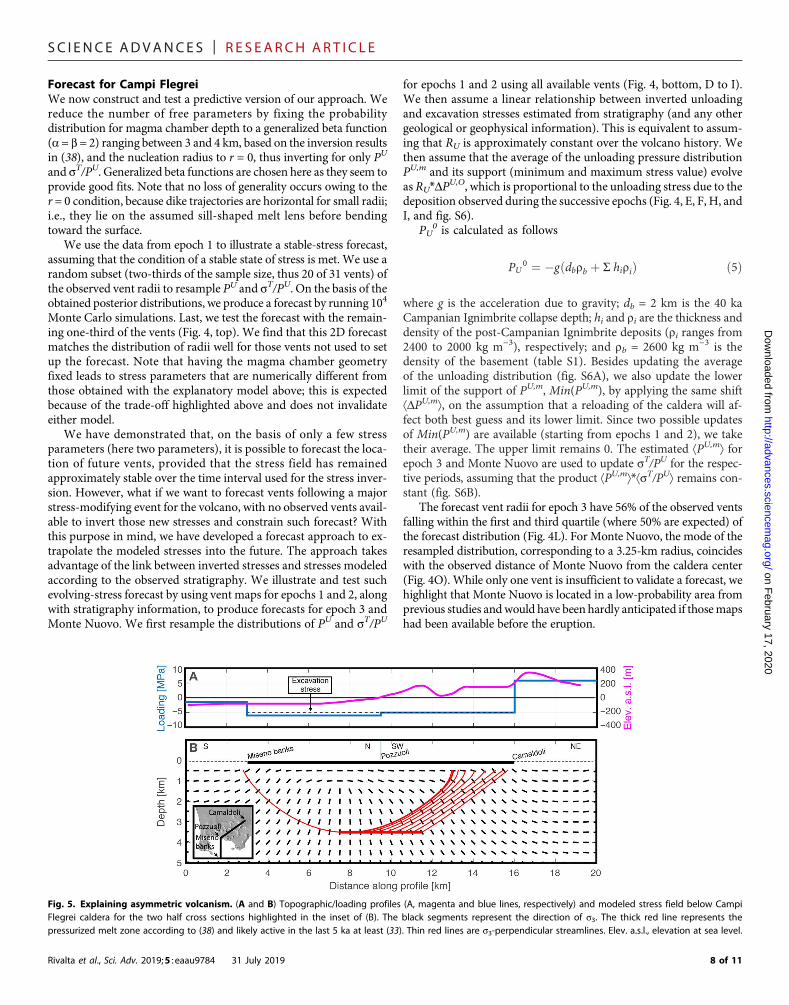
Fig. 5. Explaining asymmetric volcanism. (A and B) Topographic/loading profiles (A, magenta and blue lines, respectively) and modeled stress field below CampiFlegrei caldera for the two half cross sections highlighted in the inset of (B). The black segments represent the direction of s3. The thick red line represents thepressurized melt zone according to (38) and likely active in the last 5 ka at least (33). Thin red lines are s3-perpendicular streamlines. Elev. a.s.l., elevation at sea level.
8 of 11
SC I ENCE ADVANCES | R E S EARCH ART I C L E
on February 17, 2020
http://advances.sciencemag.org/
Dow
nloaded from
Explaining nonaxisymmetric volcanismOur axisymmetric approach returns a forecast for the radial distance,but not for the sector of the caldera (radial location) where the ventmay open. This informationmay be approximately obtained from our2D model by combining the stresses that we inverted for the end ofepoch 3 (PU = −5.0MPa and sT/PU = −0.4) with a first-order 2D stressperturbation created by the asymmetric topography of the caldera.Weconsider two end-member cross sections: a S-N offshore section withmaximum unloading (negative relief) and a SW-NE onshore sectionincluding the highest relief outside the caldera (Camaldoli). We con-sider an average bathymetry of−100m (offshore area) and an averagetopography of 300 m for Camaldoli (Fig. 5A). We use plane strainapproximation and assume a homogeneous elastic half-space. Thecomputed minimum compressive stress under the caldera floor issubvertical below 1.5 km and rotates progressively to subhorizontaltoward the caldera rim (Fig. 5B), leading to concave trajectories. Thelarger surface loading toward the NE rim results in an asymmetricstress pattern, whichdrivesmost streamlines northeastward away fromthe magma lens. Eruptions occur mainly within this NE, onland partof the caldera (Fig. 5B). Only a few streamlines propagate southwardand erupt outside the offshore caldera rim, consistent with the lownumber of observed vents (Fig. 2A). This suggests that the nonaxisym-metric distribution of the topography around the caldera may controlthe inhomogeneous distribution of its volcanism.
Our 2D results are broadly consistent with previous maps that in-dicate high probability of vents opening in the NE part of the caldera(6, 7). Yet, our results imply substantial vent opening density in loca-tions where previous studies give a low probability, i.e., the first andthird quartile of the forecast describe a predominantly onshore, ap-proximately annular belt located between 2.3 and 4.2 km from the cal-dera center, on which the Monte Nuovo vent lies.
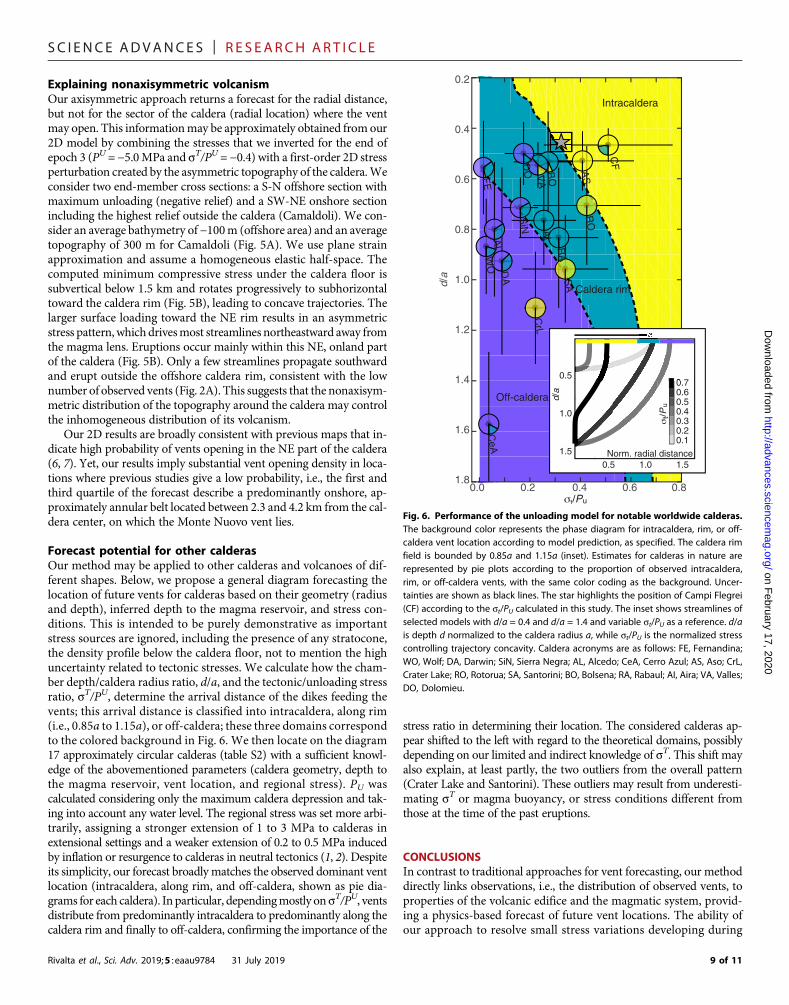
Forecast potential for other calderasOur method may be applied to other calderas and volcanoes of dif-ferent shapes. Below, we propose a general diagram forecasting thelocation of future vents for calderas based on their geometry (radiusand depth), inferred depth to the magma reservoir, and stress con-ditions. This is intended to be purely demonstrative as importantstress sources are ignored, including the presence of any stratocone,the density profile below the caldera floor, not to mention the highuncertainty related to tectonic stresses. We calculate how the cham-ber depth/caldera radius ratio, d/a, and the tectonic/unloading stressratio, sT/PU, determine the arrival distance of the dikes feeding thevents; this arrival distance is classified into intracaldera, along rim(i.e., 0.85a to 1.15a), or off-caldera; these three domains correspondto the colored background in Fig. 6. We then locate on the diagram17 approximately circular calderas (table S2) with a sufficient knowl-edge of the abovementioned parameters (caldera geometry, depth tothe magma reservoir, vent location, and regional stress). PU wascalculated considering only the maximum caldera depression and tak-ing into account any water level. The regional stress was set more arbi-trarily, assigning a stronger extension of 1 to 3 MPa to calderas inextensional settings and a weaker extension of 0.2 to 0.5 MPa inducedby inflation or resurgence to calderas in neutral tectonics (1, 2). Despiteits simplicity, our forecast broadlymatches the observed dominant ventlocation (intracaldera, along rim, and off-caldera, shown as pie dia-grams for each caldera). In particular, dependingmostly onsT/PU, ventsdistribute from predominantly intracaldera to predominantly along thecaldera rim and finally to off-caldera, confirming the importance of the
Rivalta et al., Sci. Adv. 2019;5 : eaau9784 31 July 2019
stress ratio in determining their location. The considered calderas ap-pear shifted to the left with regard to the theoretical domains, possiblydepending on our limited and indirect knowledge of sT. This shift mayalso explain, at least partly, the two outliers from the overall pattern(Crater Lake and Santorini). These outliers may result from underesti-mating sT or magma buoyancy, or stress conditions different fromthose at the time of the past eruptions.
CONCLUSIONSIn contrast to traditional approaches for vent forecasting, our methoddirectly links observations, i.e., the distribution of observed vents, toproperties of the volcanic edifice and the magmatic system, provid-ing a physics-based forecast of future vent locations. The ability ofour approach to resolve small stress variations developing during
FE
WO D
A
SiN
AL
CeA
CF
AS
CrL
RO
SA
BO
RA
AI
VA
DO
Intracaldera
Off-caldera
Caldera rimd/a 1.0
1.2
1.4
1.6
1.8
0.6
0.8
0.2
0.4
0.0 0.2 0.4 0.6 0.8
a
1.0
0.5
1.5
1.00.5 1.5
d/a
Norm. radial distance
0.10.20.30.40.50.60.7
Fig. 6. Performance of the unloading model for notable worldwide calderas.The background color represents the phase diagram for intracaldera, rim, or off-caldera vent location according to model prediction, as specified. The caldera rimfield is bounded by 0.85a and 1.15a (inset). Estimates for calderas in nature arerepresented by pie plots according to the proportion of observed intracaldera,rim, or off-caldera vents, with the same color coding as the background. Uncer-tainties are shown as black lines. The star highlights the position of Campi Flegrei(CF) according to the st/PU calculated in this study. The inset shows streamlines ofselected models with d/a = 0.4 and d/a = 1.4 and variable st/PU as a reference. d/ais depth d normalized to the caldera radius a, while st/PU is the normalized stresscontrolling trajectory concavity. Caldera acronyms are as follows: FE, Fernandina;WO, Wolf; DA, Darwin; SiN, Sierra Negra; AL, Alcedo; CeA, Cerro Azul; AS, Aso; CrL,Crater Lake; RO, Rotorua; SA, Santorini; BO, Bolsena; RA, Rabaul; AI, Aira; VA, Valles;DO, Dolomieu.
9 of 11
SC I ENCE ADVANCES | R E S EARCH ART I C L E
on Fe
http://advances.sciencemag.org/
Dow
nloaded from
the eruptive history of a caldera represents a first validation of itspotential. In the ideal case of detailed knowledge on the (re)dis-tribution of surface loads during each individual eruption, and evenstress change caused by any intruded magma, it would be possible toperform a stress inversion for each eruption. This could provide aquantitative approach to understand the evolution of stress over timeand recalculate vent radius probability based on any future stressperturbation.
Unlike previous models, our approach performs well on retrospec-tive tests: Our high-probability forecast for the location of MonteNuovo was obtained after removing knowledge of its location fromthemodel. Other geological and geophysical information on the struc-ture and dynamics of a calderamay be included to better constrain thestress field in the volcano edifice and, in particular, the termsGL(x,y,z)and GU(x,y,z) from Eq. 2, which should improve the quality of theforecasts.
By improving the individual components of the present forecast-ing model (3D stress computation, including an accurate distributionof deposit coverage in time), our method may also be used to producemaps of probability of vent opening at calderas and in volcanic edificesof different shapes. Combining our method with hazard simulationtools may result in more reliable hazard assessment, especially forsystems characterized by large vent location variability.
SUPPLEMENTARY MATERIALSSupplementary material for this article is available at http://advances.sciencemag.org/cgi/content/full/5/7/eaau9784/DC1Fig. S1. Probability distributions for model parameters of epoch 1.Fig. S2. Probability distributions for model parameters of epoch 2.Fig. S3. Probability distributions for model parameters of epoch 3.Fig. S4. Covariance distributions of st/PU versus PU and st versus PU for a set of simulations withstarting depth homogeneously distributed between 3 and 4 km and radius equal to 0 km.Fig. S5. Impact of variability of starting depth.Fig. S6. Parameters projection for the time-varying stress forecast.Table S1. Thicknesses and densities of deposits filling Campi Flegrei caldera with associatedloads.Table S2. Properties of notable worldwide calderas.
bruary 17, 2020
REFERENCES AND NOTES1. C. G. Newhall, D. Dzurisin, Historical unrest at large calderas of the world. USGS Bull. 1,
326–329 (1988).2. A. Neri, A. Bevilacqua, T. Esposti Ongaro, R. Isaia, W. P. Aspinall, M. Bisson, F. Flandoli,
P. J. Baxter, A. Bertagnini, E. Iannuzzi, S. Orsucci, S. Orsucci, M. Pistolesi, M. Rosi, S. Vitale,Quantifying volcanic hazard at Campi Flegrei caldera (Italy) with uncertainty assessment:2. Pyroclastic density current invasion maps. J. Geophys. Res. Solid Earth 120, 2330–2349(2015).
3. G. Wadge, P. A. V. Young, I. J. McKendrick, Mapping lava flow hazards using computersimulation. J. Geophys. Res. 99, 489–504 (1994).
4. C. B. Connor, B. E. Hill, Three nonhomogeneous Poisson models for the probabilityof basaltic volcanism: Application to the Yucca Mountain region, Nevada. J. Geophys. Res.100, 10107–10125 (1995).
5. A. Cappello, M. Neri, V. Acocella, G. Gallo, A. Vicari, C. Del Negro, Spatial vent openingprobability map for Etna volcano (Sicily, Italy). Bull. Volcanol. 74, 2083–2094 (2012).
6. J. Selva, G. Orsi, M. Di Vito, W. Marzocchi, L. Sandri, Probability hazard map for future ventopening at the Campi Flegrei caldera, Italy. Bull. Volcanol. 74, 497–510 (2012).
7. A. Bevilacqua, R. Isaia, A. Neri, S. Vitale, W. P. Aspinall, M. Bisson, F. Flandoli, P. J. Baxter,A. Bertagnini, T. Esposti Ongaro, E. Iannuzzi, M. Pistolesi, M. Rosi, Quantifying volcanichazard at Campi Flegrei caldera (Italy) with uncertainty assessment: 1. Vent openingmaps. J. Geophys. Res. Solid Earth 120, 2309–2329 (2015).
8. I. Alberico, L. Lirer, P. Petrosino, R. Scandone, A methodology for the evaluation oflong-term volcanic risk from pyroclastic flows in Campi Flegrei (Italy). J. Volcanol.Geotherm. Res. 116, 63–78 (2002).
9. A. J. Martin, K. Umeda, C. B. Connor, J. N. Weller, D. Zhao, M. Takahashi, Modelinglong-term volcanic hazards through Bayesian inference: An example from the Tohokuvolcanic arc, Japan. J. Geophys. Res. Solid Earth 109, B10208 (2004).
Rivalta et al., Sci. Adv. 2019;5 : eaau9784 31 July 2019
10. D. Pollard, Elementary fracture mechanics applied to the structural interpretation ofdikes. Geol. Assoc. Can. Spec. Pap. 34, 112–128 (1987).
11. E. M. Anderson, The Dynamics of Faulting and Dyke Formation with Applications to Britain(Oliver and Boyd, ed. 2, 1951).
12. A. Gudmundsson, Infrastructure and mechanics of volcanic systems in Iceland.J. Volcanol. Geotherm. Res. 64, 1–22 (1995).
13. A. Roman, C. Jaupart, The impact of a volcanic edifice on intrusive and eruptive activity.Earth Planet. Sci. Lett. 408, 1–8 (2014).
14. T. Dahm, Numerical simulations of the propagation path and the arrest of fluid-filledfractures in the Earth. Geophys. J. Int. 141, 623–638 (2000).
15. Y. Fialko, On origin of near-axis volcanism and faulting at fast spreading mid-oceanridges. Earth Planet. Sci. Lett. 190, 31–39 (2001).
16. F. Maccaferri, M. Bonafede, E. Rivalta, A numerical model of dyke propagation in layeredelastic media. Geophys. J. Int. 180, 1107–1123 (2010).
17. K. Mosegaard, T. M. Hansen, Inverse methods: Problem formulation and probabilisticsolutions, in Integrated Imaging of the Earth: Theory and Applications, M. Moorkamp,P. G. Lelièvre, N. Linde, A. Khan, Eds. (Geophysical Monograph Series, John Wileyand Sons, 2016), vol. 218, pp. 9–27.
18. D. B. Rubin, Using the SIR algorithm to simulate posterior distributions. Bayesian Stat. 3,395–402 (1988).
19. L. Passarelli, B. Sansò, L. Sandri, W. Marzocchi, Testing forecasts of a new Bayesiantime-predictable model of eruption occurrence. J. Volcanol. Geotherm. Res. 198, 57–75(2010).
20. W. W. Chadwick Jr., J. H. Dieterich, Mechanical modeling of circumferential andradial dike intrusion on Galapagos volcanoes. J. Volcanol. Geotherm. Res. 66, 37–52(1995).
21. A. Gudmundsson, Magma chambers: Formation, local stresses, excess pressures, andcompartments. J. Volcanol. Geotherm. Res. 237–238, 19–41 (2012).
22. V. Pinel, C. Jaupart, The effect of edifice load on magma ascent beneath a volcano.Philos. Trans. R. Soc. A Math. Phys. Eng. Sci. 358, 1515–1532 (2000).
23. A. Hooper, B. G. Ófeigsson, F. Sigmundsson, B. Lund, P. Einarsson, H. Geirsson, E. Sturkell,Increased capture of magma in the crust promoted by ice-cap retreat in Iceland.Nat. Geosci. 4, 783–786 (2011).
24. F. Corbi, E. Rivalta, V. Pinel, F. Maccaferri, M. Bagnardi, V. Acocella, How caldera collapseshapes the shallow emplacement and transfer of magma in active volcanoes.Earth Planet. Sci. Lett. 431, 287–293 (2015).
25. G. Ventura, G. Vilardo, P. P. Bruno, The role of flank failure in modifying the shallowplumbing system of volcanoes: An example from Somma-Vesuvius, Italy. Geophys. Res.Lett. 26, 3681–3684 (1999).
26. F. Maccaferri, N. Richter, T. Walter, The effect of giant flank collapses on magma pathwaysand location of volcanic vents. Nat. Commun. 8, 1097 (2017).
27. M. Rosi, A. Sbrana, Phlegrean Fields. CNR, Quad. La Ric. Sci. Roma, Italy. (1987).28. A. L. Deino, G. Orsi, S. de Vita, M. Piochi, The age of the Neapolitan Yellow Tuff
caldera-forming eruption (Campi Flegrei caldera - Italy) assessed by 40Ar/39Ar datingmethod. J. Volcanol. Geotherm. Res. 133, 157–170 (2004).
29. M. A. Di Vito, R. Isaia, G. Orsi, J. D. Southon, S. De Vita, M. D’Antonio, L. Pappalardo,M. Piochi, Volcanism and deformation since 12,000 years at the Campi Flegrei caldera(Italy). J. Volcanol. Geotherm. Res. 91, 221–246 (1999).
30. G. Orsi, M. A. Di Vito, R. Isaia, Volcanic hazard assessment at the restless Campi Flegreicaldera. Bull. Volcanol. 66, 514–530 (2004).
31. R. Isaia, P. Marianelli, A. Sbrana, Caldera unrest prior to intense volcanism in Campi Flegrei(Italy) at 4.0 ka B.P.: Implications for caldera dynamics and future eruptive scenarios.Geophys. Res. Lett. 36, 1–6 (2009).
32. V. C. Smith, R. Isaia, N. J. G. Pearce, Tephrostratigraphy and glass compositions of post-15kyr Campi Flegrei eruptions: Implications for eruption history and chronostratigraphicmarkers. Quat. Sci. Rev. 30, 3638–3660 (2011).
33. L. Steinmann, V. Spiess, M. Sacchi, Post-collapse evolution of a coastal caldera system:Insights from a 3D multichannel seismic survey from the Campi Flegrei caldera (Italy).J. Volcanol. Geotherm. Res. 349, 83–98 (2018).
34. M. A. Di Vito, V. Acocella, G. Aiello, D. Barra, M. Battaglia, A. Carandente, C. Del Gaudio,S. De Vita, G. P. Ricciardi, C. Ricco, R. Scandone, F. Terrasi, Magma transfer at CampiFlegrei caldera (Italy) before the 1538 AD eruption. Sci. Rep. 6, 32245 (2016).
35. L. D’Auria, B. Massa, E. Cristiano, C. Del Gaudio, F. Giudicepietro, G. Ricciardi, C. Ricco,Retrieving the stress field within the Campi Flegrei caldera (Southern Italy) through anintegrated geodetical and seismological approach. Pure Appl. Geophys. 172, 3247–3263(2015).
36. A. Amoruso, L. Crescentini, I. Sabbetta, Paired deformation sources of the Campi Flegreicaldera (Italy) required by recent (1980-2010) deformation history. J. Geophys. Res. SolidEarth 119, 858–879 (2014).
37. A. Amoruso, L. Crescentini, A. T. Linde, I. S. Sacks, R. Scarpa, P. Romano, A horizontal crackin a layered structure satisfies deformation for the 2004–2006 uplift of Campi Flegrei.Geophys. Res. Lett. 34, L22313 (2007).
10 of 11

SC I ENCE ADVANCES | R E S EARCH ART I C L E
38. F. Barberi, E. Cassano, P. La Torre, A. Sbrana, Structural evolution of Campi Flegrei calderain light of volcanological and geophysical data. J. Volcanol. Geotherm. Res. 48, 33–49(1991).
39. G. Orsi, S. De Vita, M. Di Vito, The restless, resurgent Campi Flegrei nested caldera (Italy):Constraints on its evolution and configuration. J. Volcanol. Geotherm. Res. 74, 179–214(1996).
40. V. Acocella, Evaluating fracture patterns within a resurgent caldera: Campi Flegrei, Italy.Bull. Volcanol. 72, 623–638 (2010).
41. S. Vitale, R. Isaia, Fractures and faults in volcanic rocks (Campi Flegrei, southern Italy):Insight into volcano-tectonic processes. Int. J. Earth Sci. 103, 801–819 (2014).
42. S. Polteau, E. C. Ferré, S. Planke, E. R. Neumann, L. Chevallier, How are saucer-shaped sillsemplaced? Constraints from the Golden Valley Sill, South Africa. J. Geophys. Res. SolidEarth 113, B12104 (2008).
Acknowledgments: We thank M. Bagnardi and D. Bindi for discussion. Funding: E.R. and F.C.were funded by the European Union Supersite MED-SUV project, grant agreement no. 308665.L.P. was funded by the German Federal Foreign Office through the German HumanitarianAssistance program, grant S05-41-321.50 IDN 03/16. V.A. was funded by the DPC-INGV project
Rivalta et al., Sci. Adv. 2019;5 : eaau9784 31 July 2019
V2, “Eruptive Precursors.” T.D. was funded by the DFG-ICDP, grant agreement no. RI 2782/3-1.M.A.D.V. was funded by the DPC-INGV projects V1 and V2. Author contributions: E.R.conceived the study and the conceptual model. E.R. and V.A. coordinated the work andwrote the manuscript. F.C. and E.R. carried out the numerical simulations. L.P., F.C., E.R.,and T.D. developed the statistical concept. M.A.D.V. provided geological and stratigraphicdata. All authors have read and revised the manuscript and contributed ideas to theresearch. Competing interests: The authors declare that they have no competinginterests. Data and materials availability: All data needed to evaluate the conclusionsin the paper are present in the paper and/or the Supplementary Materials. Additional datarelated to this paper may be requested from the authors.
Submitted 3 August 2018Accepted 24 June 2019Published 31 July 201910.1126/sciadv.aau9784
Citation: E. Rivalta, F. Corbi, L. Passarelli, V. Acocella, T. Davis, M. A. Di Vito, Stress inversions toforecast magma pathways and eruptive vent location. Sci. Adv. 5, eaau9784 (2019).
11 of 11
on February 17, 2020
http://advances.sciencemag.org/
Dow
nloaded from
Stress inversions to forecast magma pathways and eruptive vent locationE. Rivalta, F. Corbi, L. Passarelli, V. Acocella, T. Davis and M. A. Di Vito
DOI: 10.1126/sciadv.aau9784 (7), eaau9784.5Sci Adv
ARTICLE TOOLS http://advances.sciencemag.org/content/5/7/eaau9784
MATERIALSSUPPLEMENTARY http://advances.sciencemag.org/content/suppl/2019/07/29/5.7.eaau9784.DC1
REFERENCES
http://advances.sciencemag.org/content/5/7/eaau9784#BIBLThis article cites 39 articles, 0 of which you can access for free
PERMISSIONS http://www.sciencemag.org/help/reprints-and-permissions
Terms of ServiceUse of this article is subject to the
is a registered trademark of AAAS.Science AdvancesYork Avenue NW, Washington, DC 20005. The title (ISSN 2375-2548) is published by the American Association for the Advancement of Science, 1200 NewScience Advances
License 4.0 (CC BY-NC).Science. No claim to original U.S. Government Works. Distributed under a Creative Commons Attribution NonCommercial Copyright © 2019 The Authors, some rights reserved; exclusive licensee American Association for the Advancement of
on February 17, 2020
http://advances.sciencemag.org/
Dow
nloaded from