Strengthening Network Practice Through Evaluation
46
JULY | 2015 @leadershipera #leadershipnet Strengthening Network Practice Through Evaluation Presented by: Madeleine Taylor and Anne Whatley
-
Upload
leadership-learning-community -
Category
Education
-
view
84 -
download
1
Transcript of Strengthening Network Practice Through Evaluation

JULY | 2015
@leadershipera #leadershipnet
Strengthening Network Practice Through Evaluation
Presented by: Madeleine Taylor and Anne Whatley
LLC anticipates the future and is a dynamic catalyst capable of creating a link from today’s issues in leadership development to tomorrow’s solutions.
(Donna Stark, The Annie E. Casey Foundation)
Network Research Application
LEADERSHIP LEARNING COMMUNITY

LEADERSHIP FOR A NEW ERA
The value of collective leadership networks is in their capacity to solve problems quickly in an environment of uncertainty and
complexity (Watts, 2004)
Newest Publication

Strengthening Network Practice Through Evaluation
Presented by: • Madeleine Taylor, Founder and CEO at Network Impact• Anne Whatley, Senior Consultant at Network Impact
TODAY’S PRESENTERS

Network Impact serves social-change agents with a mix of strategies, tools, research, and consulting expertise to design and use networks for increased impact www.networkimpact.org
Strengthening Network Practice Through Evaluation
July 15, 2015

Intros
The voices you are hearing
Madeleine Taylor
Anne Whatley
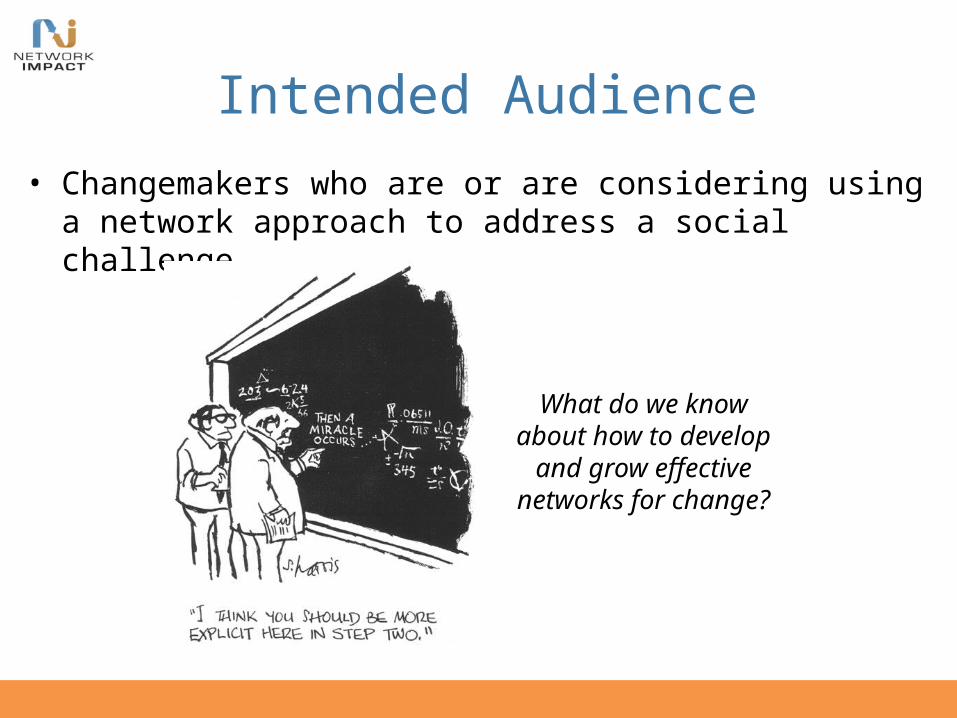
Intended Audience• Changemakers who are or are considering using a network approach
to address a social challenge
What do we know about how to develop
and grow effective networks for change?

Why a Network?
Networks provide social change agents with a fundamentally distinct and remarkably promising “organizing
principle” to achieve ambitious goals. Net Gains 2006

Network Advantage
•ACCESS•LEARNING•LEVERAGE•RESILIENCE

Network Building is a Practice
• Network Start Up• Network Management
– Governance – Coordination– Communications– Financial Stewardship– Network Health
• Network Monitoring and Evaluation

About Network Impact•We serve social-change agents with a mix of strategies, tools, research, and consulting expertise to design and use networks for increased impact
Research & Tools: Clients include:

Why are you here?• What questions
do you have?• What would you
like to hear about today?
• Please enter questions into the chat. (or raise your hand )

13
With our time today…
• Network basics• What makes a network thrive?• Network evaluation framework • Tools & Approaches to assess network
process and results

Anatomy of a Network
Core
Link Node
ClusterPeriphery
Hub
Illustration from Social Networks for Social Change, Monitor Institute 2010
Many specialized terms come from Social Network Analysis (SNA)

Generative Networks
Base of Connections
Members deliberately build, strengthen, and maintain ties so they can be activated again and again
Coalitions: Can be more or less formal, but are formed at particular historical moments focused on specific objectives. Often dissolve when the job is over (win or loss)
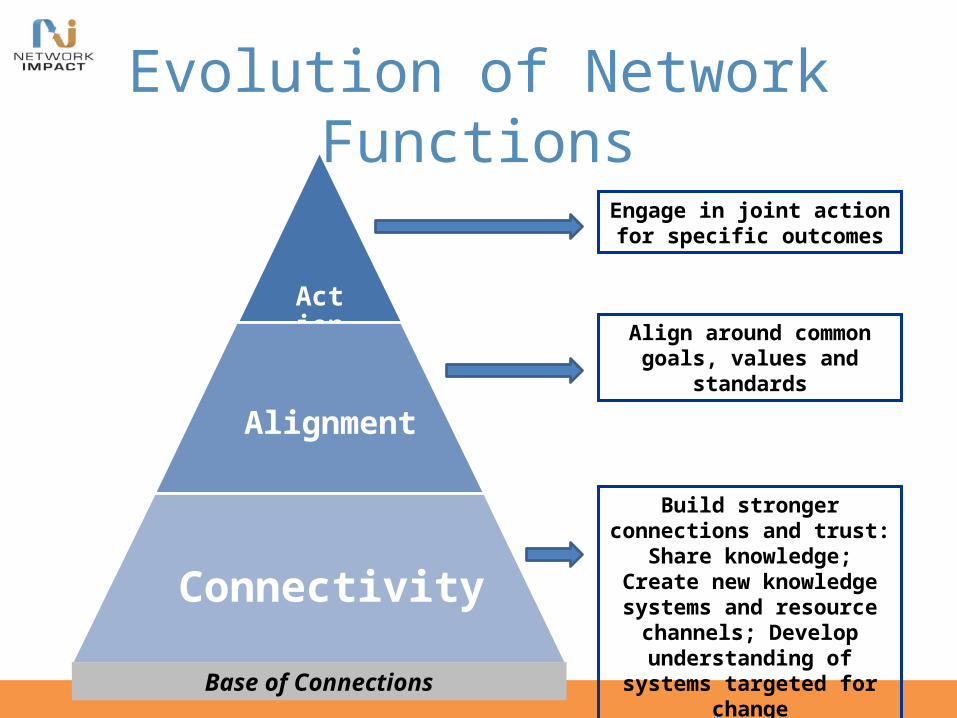
Evolution of Network Functions
Action
Alignment
Connectivity
Build stronger connections and trust: Share
knowledge; Create new knowledge systems and
resource channels; Develop understanding of systems
targeted for change
Align around common goals, values and standards
Engage in joint action for specific outcomes
Base of Connections
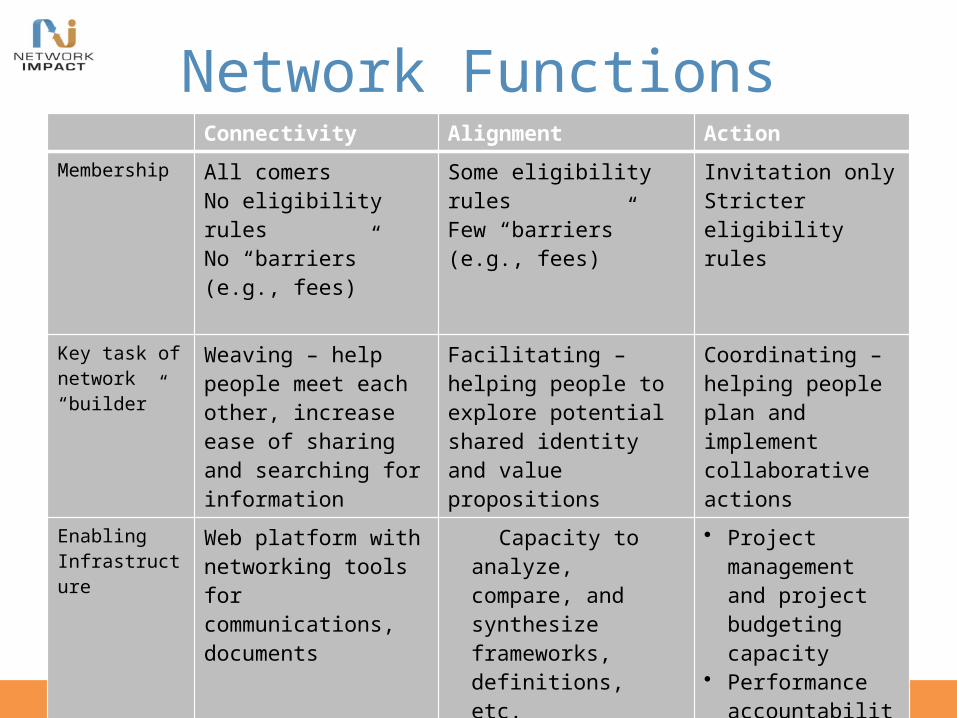
Network FunctionsConnectivity Alignment Action
Membership All comersNo eligibility rulesNo “barriers” (e.g., fees)
Some eligibility rulesFew “barriers” (e.g., fees)
Invitation onlyStricter eligibility rules
Key task of network “builder”
Weaving – help people meet each other, increase ease of sharing and searching for information
Facilitating – helping people to explore potential shared identity and value propositions
Coordinating – helping people plan and implement collaborative actions
Enabling Infrastructure
Web platform with networking tools for communications, documents
Capacity to analyze, compare, and synthesize frameworks, definitions, etc.
• Project management and project budgeting capacity
• Performance accountability mechanisms

Think about a network you are participating in
What conditions helped make it thrive?

• Value• Trust• Participation• Communication• Stewardship• Learning & Evolving
Conditions that make a network thrive include…

Network Evaluation Purposes & Benefits
NETWORK STRATEGY
Support strategic learning and continuous improvement.
ImpactInterim Outcomes
Examine network results or impact.
Ensure accountability for the use of resources.

Characteristics of Networks that Matter for Evaluation
• Networks have numerous players, many of whom enter and exit the network
• Networks are dynamic “moving targets” that adapt to changes in their context or changes among their membership
• It takes time to organize networks effectively and show results
• Networks have a “chain of impact”• Network shape and function matter

Network Dimensions
Connectivity• What can be
monitored:• Membership or the
people or organizations that participate in a network
• Structure or how connections between members are structured and what flows through those connections
Health • Resources or the
material resources a network needs to sustain itself (e.g., external funding)
• Infrastructure or the internal systems and structures that support the network (e.g., communication, rules and processes)
• Advantage or the network’s capacity for joint value creation
Results• Interim outcomes or
the results achieved as the network works toward its ultimate goal or intended impact
• The goal or intended impact itself (e.g., a policy outcome was achieved, a particular practice was spread, the community or its members changed in a certain way).
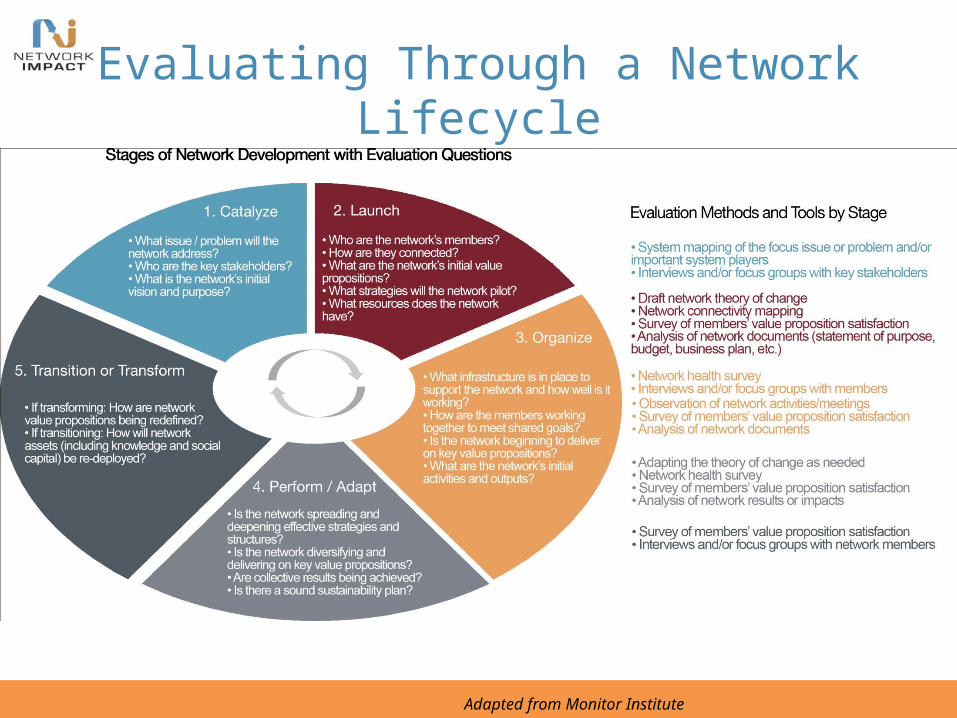
Evaluating Through a Network Lifecycle
Adapted from Monitor Institute

Social Network Analysis & Mapping
What? Social Network Analysis (SNA) is set of theories, tools, and processes for understanding the relationships and structures of a network
• Social relationships in SNA are represented as connections or links between “nodes”
• Nodes = people or organizations• Nodes may also represent ideas, issues or events
Why? Strategic learning and improvement - Understand and evaluate patterns of network connectivity that are difficult to decipher by other means

SNA answers questions like:
• Who is connected to whom and how? Who is not connected but should be?
• Has the network assembled members with the capacities needed to meet network goals (experience, skills, connections)?
• What is flowing through the network—information and other resources?
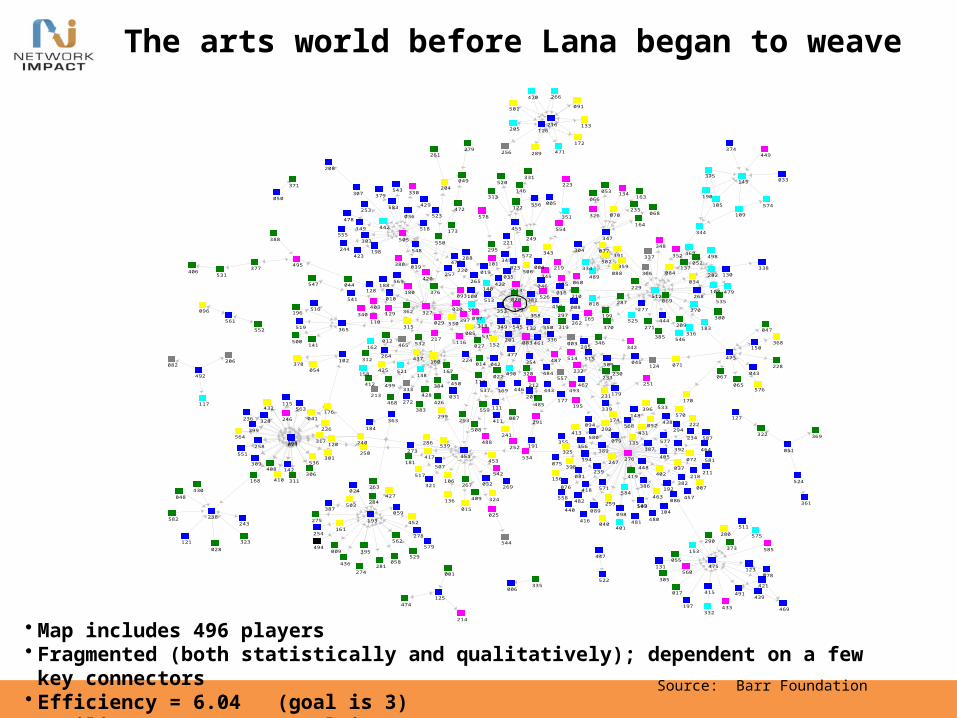
The arts world before Lana began to weave
• Map includes 496 players• Fragmented (both statistically and qualitatively); dependent on a few key connectors• Efficiency = 6.04 (goal is 3)• Resilience = 1.08% (goal is 20)
587
585
584
583
582
581
580
579
578
577
576
575
574
572
571
570
569
568
564
563
562
561
560
559
558
557
556
555554
552
551
550
549
548
547
546
545
544
543
542
541
539
538
537
536
535
534
533
532
531
530
529
526
525
524
523
522
521
520
519
518
517
516
515514
513512
511
509
508
507
506
505
503
502
501
500
499
498
495
494
493
492
491
490
489
488
487
485
484
482
481 480
479
478
477
476
475
474
473
472
471
470
469
468
467
465
464
463
462
461
458
457
455
453
452
451
450
449
448
447
446
444
443
442
440
439
438
437
436
433
432
431
430
429
428
427
426
425
423
422
421
420
419
418
417
416
415
413
412
411
410
409
408
406
405
403
402
401
399
398
397
396
395
392
391
390
389
388
387
386
385
384
383
382
381
380
379
378
377
376
375
374
373
371
370
369
368
366
365
363
362
361
359
358
356355
354
353
352
351
350349
348
347
346
345
344
343
342
340
339
338
337
336
335
334
333
332
331
330
329
328
327
326
325
324
323
322
321
320
319318
317
316315
313
312
311
309
308
307
306
305
304
303
301
300
299
297
295
294
293
292291
290
289
288
287
286
285
284
282
281
280
279
278
277
276
275
274
273
272
271
270
269
268
267
266
265
264
263
262
261
259
258
257
256
254
253
252
251
250
249
247
246
245
244
243
241
240
239
238
236
235
234
233232
231
230
229
228
226
224
223
222
221
220 219
218
217
216
214
213
212
211
210
209
208
207
206
205
204
201
199
198
197
196
195
194
193
192
191
190
188
187
184
183
181
180
179177
176
174
173
172
170
169
168
167
165
164
163
162
161
160
158
156
155
153
152150
149
148
146
145
142
141
140
138
137
136
135
134
133
132
131
130
129
128
127
126
125
124
123
122
121
120
117
116
115
113
112
111
110
109
108
106
105
104103
102
101
100
098
097
096
094
093
092
091
089
088
087
086
085
084
083
082
081
079
078
077
076
075072
071
070
069
068
067
066
065
060
059
058 055
054
053
052
051
050
049
048
047
046
045
044
043
042
041
040
039
037
036
035034
033
032
031
030
029
028
027
025
024
023
022
021
020
019
018
017
016
015
014
012
010
009
008
007
006
005
004
003
001
Source: Barr Foundation

Purposeful approach to enhancing the network
Also (more dispersed on map):• Arts and sports showcase• Curriculum development initiative
587
586
585
584
583
582
581
580
579
578
577
576
575
574
573
572
571
570
569
568
566
565
564
563
562
561
560
559
558
557
556
555
554
553
552
551
550
549
548
547
546
545
544
543
542
541
540
539
538
537
536
535
534
533
532
531
530
529
528
527
526
525
524
523
522
521
520
519
518
517
516
515
514
513
512
511
510
509
508
507
506
505
504
503
502
501
500
499
498
497
496
495
494
493
492
491
490
489
488
487
486
485
484
483
482
48148
0
479
478
477
476 47
5474
473
472
471
470
469
468
467
465
464
463
462
461
460
459
458
457
456
455
454
453
452
451
450
449
448
447
446
444
443
442
441
440
439
438
437
436
435
434
433
432
431
430
429
428
427
426
425
424
423
422
421
420
419
418
417
416
415
413
412
411
410
409
408
407
406
405
404
403
402
401
400
399
398
397
396
395
394
392
391
390
389
38838
7
386
385
384
383
382
381
380
379
378
377
376
375 37
4
373
372
371
370369
368
367
366
365
363
362
361
36035
9
358
357
356
355
354
353
352
351
350
349
348
347
346
345
344
343
342
340
339
338
337
336
335
334
333
332
331
330
329
328
327
326
325
324
323
322
32132
0319
318
317
316
315
313
312
311
310
309
308
307
306
305
304
303
302
301
300
299
298
297
296
295
294
293
292
291
290
289
288
287
286
285
284
283
282
281
280
279
278
277
276
275
274
273
272
271
270
269
268
267
266
265
26426
3
262
261
260
259
258
257
256
255
254
253
252
251
250
249
248
247
246
245
244
243
242
241
240
239
238
237
236
235
234
233
232
231
230
229
228
227
226
22522
4
223
222
221
220
219
218
217
216
214
213
212
211
210
209
208
207
206
205
204
203
201
199
198
197
196
195
194
193
192
191
190
189
188
187
185184
183
182 18
1
180
179
178
177
176
174
173
172
170
169
168
167
165
164
163
162
161
160
159
158
157
156
155
154
153
152
150
149
148
147
146
145
144
143
142
141
140
139
138
137
136
135
134
133
132
131
130
129
128
127
126
125
124
123
122
121
120
119
118
117
116
115
114
113
112
111
110
109
108
107
106
105
104
103
102
101
100
098
097
096
095
094
093
092
091
089
088
087
086
085
084
083
082
081
080
079
078
077
076
075
074
073
072
071
070
069
068
067
066
065
064
063
062
061
060
059
058
056
055
054
053
052
051
050
049
048
047
046
045
044
043
042
041
040
039
038
037
036
035
034
033
032
031
030
029
028
027
025
024
023
022
021
020
019
018
017
016
015
014
012
011
010
009
008
007
006
005
004
003
001
Community Dance Studio
Outreach Departments –
Visual Arts Colleges
Hyde Park Arts Initiative
Facilities Group Convening
Source: Barr Foundation

Network Mapping to Show Changes Over Time
2010
2011
Year # Density Avg # ties
2009 55 2.2% 1.2
2010 90 2.7% 2.4
2011 85 5.3% 4.5
2012 82 8% 6.88
2009
2012

CARN GPRPN
MRN MSN
NARP NURV
SWPRN Rural Assembly SC
Geographic Distribution of CARN connections to members of RPNs before WKKF grant (2006-2008)

CARN GPRPN
MRN MSN
NARP NURV
SWPRN Rural Assembly SC
Geographic Distribution of CARN connections to members of RPNs in March 2013

Measuring Cross-sector Connections Over Time
1
2
3
4
5
6 7
8
9
10
11 12
13
14
15
16
17
18
19
20
21
22
23
24
25
26
27
28
29
30
31
32
33
34
2005
Maps copyright © 2012 New Directions CollaborativeSource: Boston Green & Healthy Building Network, Beth Tener and Al Nierenberg, January 2008
1
2
3
4
5
6 7
8
9
10
11 12
13
14
15
16
17
18
19
20
21
22
23
24
25
26
27
28
29
30
31
32
33
34
2007

What is flowing between nodes?
•Durfee Foundation Stanton Fellowship awards two year grants to social change leaders in LA to think deeply and tease out solutions to intractable problems.

Before & After Led to New Thinking• Greatest increase,
>300%, connections that provided “information that led to new thinking or framing that has been useful...”
Did not respond to survey Name was not available on survey
n=27
Degree of connectivity

Post-Fellowship Connections By Cohort
• High level of connectivity between cohorts
• On average 70% of Fellows' connections were with Fellows from other cohorts.

Nodes sized by In-Degree and colored by type, Edges colored by fellow’s first or second priority
Did not respond to surveyn=27
Stanton Fellows and Priority Focus Areas

Resources
• NodeXL : a free network mapping software that works within Microsoft Excel
• Netdraw and UCINET: used by academics, free but a little harder to use
• Gephi : open source, no cost network visualization tool, tutorials
• Kumu.io : new, easy-to-use web-based tool, free to use if save map publically.

Network Health Monitoring Tools
What? Internal temperature check, insights into key dimensions of network
Why? • Clarify organizing principles that are fundamental to
network development • Provide practitioners with an overview of network
conditions to inform internal adjustments• Help guide technical assistance and professional
development opportunities • Triangulate other evaluation data

38
Network Health tools answer questions like:
• What are strengths and areas of growth for our network?
• Where are members seeing value?• What are the top priorities for members?


Network Health Scorecard22 questions to build a basic networkdiagnosis of strengths and areas of growth. www.networkimpact.org
Network Purpose
Network Performance
Network Operations
Network Capacity

Example: Southwest Rural Policy Network
Distributed the “network health scorecard” quarterly over 3 years.
Has been able to track its evolution relating to the purpose, performance, operations, and capacity around network activities.
Network Metrics Over Time
3.0
3.5
4.0
4.5
5.0
Jun-09 Oct-09 Jan-10 Apr-10 Jul-10 Feb-11 Jun-11 Sep-11 Feb-12 Jun-12
DateA
ve
rag
e M
etr
ic S
co
re
Purpose Performance Operations Capacity

The Evolution of a Regional NetworkThe Southwest Rural Policy Network (SWRPN) has been in development for over six years. Thirteen organizations representing the states of Arizona (7), and New Mexico (6) were funded by the W. K. Kellogg Foundation through an initiative called Rural People, Rural Policy (RPRP). RPRP’s specific purpose was to energize and equip rural organizations and networks to shape policy that will improve the vitality of rural communities and the lives of their residents.
The SWRPN has made great strides over the years in the development of its operational processes and performance. Through the use of a “network health scorecard”*, the SWRPN has been able to track its evolution relating to the purpose, performance, operations, and capacity around network activities. (*Arbor Consulting and Cause Communications)
:
Overview
Location of Network Members
Results
Conclusion
Results
Evaluation Method
Establishing a network made of up very diverse organizations takes time. There are many factors to consider that need to be monitored and addressed going forward if there is to be a sustainable and effective operating network.
Over the past six years, the SWRPN has been able to focus on policy efforts around economic development, health care, and the environment. The Network used the results of the scorecard to monitor its progress and work on areas needing improvement. All 13 organizations are committed going forward to have an impact on policy priorities affecting the rural communities of Arizona, New Mexico, and beyond.
Network Purpose Score
3.0
3.5
4.0
4.5
5.0
Jun-09 Oct-09 Jan-10 Apr-10 Jul-10 Feb-11 Jun-11 Sep-11 Feb-12 Jun-12
Date
Av
era
ge
Co
mp
on
en
t S
co
re
Network Purpose Score Trend Over Time
Network Performance Score
3.0
3.5
4.0
4.5
5.0
Jun-09 Oct-09 Jan-10 Apr-10 Jul-10 Feb-11 Jun-11 Sep-11 Feb-12 Jun-12
Date
Av
era
ge
Co
mp
on
en
t S
co
re
Network Performance Trend Over Time
Network Operations Score
3.0
3.5
4.0
4.5
5.0
Jun-09 Oct-09 Jan-10 Apr-10 Jul-10 Feb-11 Jun-11 Sep-11 Feb-12 Jun-12
Date
Av
era
ge
Co
mp
on
en
t S
co
re
Operations Trend Over Time
Network Capacity Score
3.0
3.5
4.0
4.5
Jun-09 Oct-09 Jan-10 Apr-10 Jul-10 Feb-11 Jun-11 Sep-11 Feb-12 Jun-12
Date
Av
era
ge
Co
mp
on
en
t S
co
re
Network Capacity Trend Over Time
Network Metrics Over Time
3.0
3.5
4.0
4.5
5.0
Jun-09 Oct-09 Jan-10 Apr-10 Jul-10 Feb-11 Jun-11 Sep-11 Feb-12 Jun-12
Date
Av
era
ge
Me
tric
Sc
ore
Purpose Performance Operations Capacity
Strategic Plan developed
Three Action Teams formed
Project Funds received
Value added by working together
Inability to attract needed funds
Network communication with stakeholders needs to be enhanced
Competent and Stable Network Coordinator
Quarterly face-to face- meetings/other ongoing communication
Unequal contribution by existing members
Member skills present to advance goals
Member connections help to advance goals
Lack material resources to attain goals
Advancement in the Network Purpose made great strides over the past 2 years. Small funding support for specific projects helped members begin to focus directly on policy work. Coordinator turnover stabilized Network Operations. Network Performance and Network Capacity continues on a positive trajectory.
Distributed the “network health scorecard” at each quarterly face to face meeting to each person attending the meeting.
Collected data starting in June 2009 until June 2012 yielding 10 data points for each of the 22 statements.
Ranked each statement using a 5 point Likert Scale -1 being ‘Not so much’ to 5 being ‘Totally’.
Statements categorized as follows: Network Purpose (3 statements); Network Performance (9 statements); Network Operations (7 statements); Network Capacity (3 statements).
Joyce A. Hospodar, MBA, MPA, PI and Jennifer Peters, BA, Co-PI

43
Resources
• ConnectingtoChangetheWorld.net• Network Evaluation Guide – Network Impact• Network Health Scorecard – Network Impact• Network Diagnostic – Monitor Group• Guide to Assessing Collective Impact - FSG

Questions?

GET INVOLVED
Register for the LLC Newsletter, then contribute your writing to our blog!
Blog [email protected]
blog
Register LeadershipLearning.org

SUPPORT THE WEBINAR SERIES
The suggested donation for this webinar is $30.
bit.ly/LLCDonate2013
Donate Today!
LLC THANKS YOU!