Strength Prediction in CFRP Woven Laminate Bolted Single ...epubs.surrey.ac.uk/805925/14/Composite...
28
1 Strength Prediction in CFRP Woven Laminate Bolted Single-Lap Joints under Quasi-static Loading using XFEM H. Ahmad 1 , A D Crocombe 2 , and P A Smith 2 1 Department of Structures and Materials Engineering, Faculty of Civil and Environmental Engineering, Universiti Tun Hussein Onn Malaysia, 86400 Parit Raja, Batu Pahat, Johor Darul Tak’zim, MALAYSIA. [email protected] Tel: +607-4564472 Fax: +607-4536588 2 Department of Mechanical Engineering Sciences, Faculty of Engineering and Physical Sciences, University of Surrey, Guildford, Surrey, GU2 7XH, UNITED KINGDOM. Abstract This paper is concerned with modelling damage and fracture in woven fabric CFRP single-lap bolted joints that fail by net-tension. The approach is based on the assumption that damage (matrix cracking, delamination and fibre tow fracture) initiates and propagates from the hole in a self-similar fashion. A traction-separation law (based on physically meaningful material parameters) is implemented within an Extended Finite Element Method (XFEM) framework and used to predict the joint strength. Reasonable agreement between model and experiment was obtained for test configurations covering different weave types and lay-ups, a range of joint geometries (two hole diameters and a range of normalised joint widths) and finger-tight and fully torqued clamp-up conditions. The greatest discrepancies were for situations where the tensile fracture mechanisms were more complex, and hence not captured fully in the model or when bearing failure occurred. Keywords – A. Textiles; B. Fracture; C. Finite element analysis (FEA); E. Joints
Transcript of Strength Prediction in CFRP Woven Laminate Bolted Single ...epubs.surrey.ac.uk/805925/14/Composite...
1
Strength Prediction in CFRP Woven Laminate Bolted
Single-Lap Joints under Quasi-static Loading using
XFEM
H. Ahmad1, A D Crocombe2, and P A Smith2
1Department of Structures and Materials Engineering,
Faculty of Civil and Environmental Engineering,
Universiti Tun Hussein Onn Malaysia,
86400 Parit Raja, Batu Pahat,
Johor Darul Tak’zim, MALAYSIA.
Tel: +607-4564472
Fax: +607-4536588
2Department of Mechanical Engineering Sciences,
Faculty of Engineering and Physical Sciences,
University of Surrey, Guildford,
Surrey, GU2 7XH,
UNITED KINGDOM.
Abstract
This paper is concerned with modelling damage and fracture in woven fabric CFRP single-lap
bolted joints that fail by net-tension. The approach is based on the assumption that damage (matrix
cracking, delamination and fibre tow fracture) initiates and propagates from the hole in a
self-similar fashion. A traction-separation law (based on physically meaningful material parameters)
is implemented within an Extended Finite Element Method (XFEM) framework and used to predict
the joint strength. Reasonable agreement between model and experiment was obtained for test
configurations covering different weave types and lay-ups, a range of joint geometries (two hole
diameters and a range of normalised joint widths) and finger-tight and fully torqued clamp-up
conditions. The greatest discrepancies were for situations where the tensile fracture mechanisms were
more complex, and hence not captured fully in the model or when bearing failure occurred.
Keywords – A. Textiles; B. Fracture; C. Finite element analysis (FEA); E. Joints
2
1. Introduction
Single-lap joints are an important class of bolted joint in the aerospace and automotive industries.
This type of joint is preferred as it can reduce weight and hence help to optimise fuel efficiency.
However, single-lap joints (SLJ) exhibit secondary bending due to the eccentricity of the applied
loads. Flexure of plates during loading alters the contact regions in the single-lap joint significantly,
resulting in geometrically non-linear behaviour and a stress gradient through the plate thickness.
These effects mean that the stress distribution (and hence the expected failure load) in a SLJ will be
different from an equivalent double-lap joint (DLJ). The present work is concerned with the
behaviour of single-lap bolted joints where one of the materials in the joint is a woven fabric
composite. Hence the remainder of this introduction considers background in terms of woven fabric
composite joints, general aspects of SLJ behaviour and relevant modelling methods.
Esendemir [1] and Kontolatis [2] investigated the effects of geometrical parameters on the failure
mode and failure loads of double-lap woven glass-epoxy composite bolted joints as a function of
joint geometry and bolt clamping load. As is expected from the non-woven counterpart, the bearing
strength of woven glass-epoxy laminate increased with increasing W/d (plate width to hole diameter
ratio) and e/d (end distance to hole diameter ratio). Esendemir [1] also found that as the clamping
load increased, the ultimate bearing strength showed a significant increase and the failure mode
became one of net-tension for a greater range of joint geometries. Nassar et. al. [3] investigated
experimentally the effect of bolt-torque on damage development in single-lap, woven glass-epoxy
composite joints using protruding head bolts. Their microscopic study showed that no significant
delamination occurred at the holes with fully-torqued bolts whereas delamination was observed at
holes with finger-tight bolts.
Smith et. al. [4] investigated the behaviour of non-woven cross-ply and quasi-isotropic CFRP
single-lap bolted joints and compared these with non-woven double-lap bolted joints. Single-lap
joints showed lower strengths and slightly different failure mechanisms due to the secondary
bending phenomenon and these effects were more significant for large W/d values. This is because
the controlling parameter for net-tension failures at low W/d values is the stress distribution along
the net-tension plane local to the hole and if the region is within the area constrained by the washers,
then effects due to bending are reduced. At higher W/d values, strength reductions of up to 25%
were observed for the quasi-isotropic lay-up single-lap bolted joints, compared with the equivalent
double lap joint; the strength reduction was slightly less for cross-ply lay-ups, possibly because of
3
the greater flexural stiffness compared to the quasi-isotropic lay-up. At the larger values of
normalised joint width, the joint rotation leads to the bolt/washer combination “digging in” to the
laminate and leading to a lower bearing strength than in double-lap joints where such rotation does
not occur. Overall similar failure mechanisms are seen in single-lap joints as double-lap joints with
damage initiation (one, or a combination, of local tension, shear or bearing) followed by further
damage and hole elongation before either a net-tension failure or catastrophic compression failure at
the washer edge (remote bearing) occur.
With regard to modelling strategies for composite bolted joints, many approaches tend to be
two-dimensional and strength prediction techniques often tend to involve the use of adjustable
material parameters or characteristic distances, e.g. [5]. Within these two-dimensional approaches,
however, there are some very useful models which provide a framework for predicting damage
initiation and growth – for example the Damage Zone Model developed by Hollmann [6]. In reality
the presence of a clamped bolt leads to load transfer by friction and this may modify the local
failure mechanisms, as captured approximately in [7]. Due to these factors, it is recognised
increasingly that through-thickness effects in composite bolted joints need to be understood in order
to develop engineering design methods [8]. This is particularly true for single-lap joints where the
overall bending cannot be captured without a full three-dimensional model.
McCarthy [9] and McCarthy et. al. [9, 10] conducted extensive 3-D modelling of single-bolt,
single-lap joint configurations. They discuss in detail the importance of capturing accurately the
contact between the bolt and the hole and the other contact regions in the problem. They are then
able to capture the through-thickness stress variation and out-of-plane stresses arising from
secondary bending. Although they did not undertake strength predictions, they compared stress,
strain and stiffness reduction with experimental data. They also considered a model for bearing
failure, based on using the Hashin failure criterion to evaluate the damage state along the hole
boundary where fibre compression failure initiated.
Riccio [11] developed a 3-D finite element model for single-lap bolted joints, which predicted
progressive damage based on Hashin’s failure criterion [12] and a ply property degradation rule,
according to which the elastic properties of a failed ply were set to 10% of their original value. In
this way Riccio analysed damage onset and propagation in detail and correlated the predictions with
experimental data for both protruding and countersunk bolt heads. The resulting numerical and
experimental load-displacement curves were shown to be in good agreement. Chisti et. al. [13]
investigated damage development in single-lap countersunk bolted composite joints of plain weave
4
carbon/epoxy using Hashin’s failure criterion and a crack-band based continuum damage mechanics
approach to track ply fracture. Both approaches were reported to predict the initial stiffness, damage
progression, and ultimate failure loads accurately. It was noted that both the experimental data and
the numerical model showed that bolt torque has a reduced effect on the strength of the joint for
increasing laminate thickness. They also considered delamination by using cohesive elements.
The present paper is part of a wider study to develop an improved (mechanism-based) strength
prediction methodology for woven fabric composite bolted joints that fail by net-tension. In a
previous paper [14] we showed that the strength of double-lap bolted joints could be modelled
reasonably well using a three-dimensional finite element model and a failure criterion based on the
formation of a damage zone for which the input parameters (unnotched strength, 𝜎0 and toughness,
𝐺𝑐 ) were taken from independent experiments. The methodology is based on experimental
observations of damage in the vicinity of holes in woven fabric composites, summarised in [14],
and was previously demonstrated for coupons containing open holes, using the same material
parameters [15]. The current paper is concerned with single-lap joints in which we would expect the
net-tension failure mode to be similar to that seen in an open hole and in double-lap bolted joints,
with similar local failure mechanisms being active, but obviously the stress field is not only
different, but also more complex.
The structure of the paper is as follows. First the results of an experimental programme to determine
the bearing strengths of woven fabric CFRP single lap joints are presented. The work includes a
variety of weave types and lay-up and the effects of joint geometry (bolt hole size and normalised
joint width) and bolt clamp-up are investigated. This is followed by the development of a
three-dimensional finite element model, which incorporates the bolt-hole interaction and frictional
load transfer in a realistic way. Crack propagation is simulated using XFEM with independently
determined input parameters and the predictions for the bearing strength are then compared with the
experimental values.
2. Experimental Work
2.1 Materials and test method
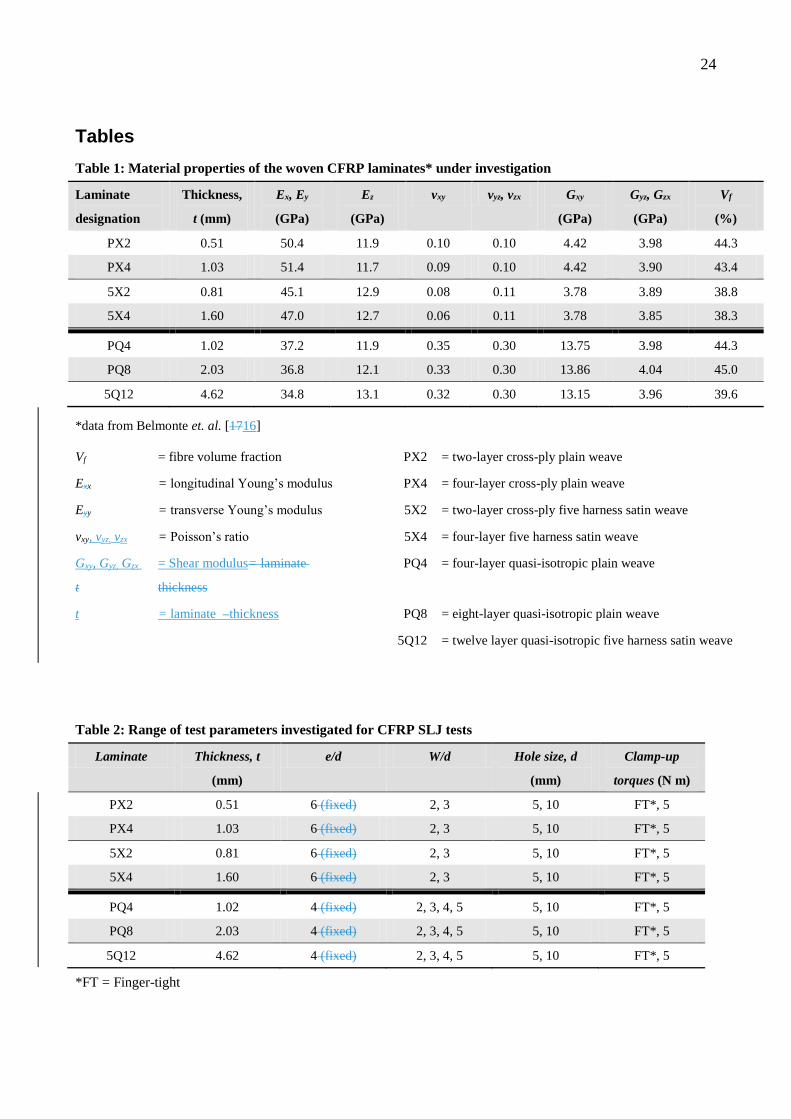
Seven different material/lay-up/thickness combinations of CFRP woven fabric systems are studied
in the current work. These represent a sub-set of those tested by Belmonte et. al. [16] in their
investigation of open-hole behaviour. Details of the lay-ups and some of their key mechanical

5
properties are shown in Table 1. Both weave types (plain weave and five harness satin weave) were
based on Toray T300 high strength carbon fibres and are manufactured using Primco prepregs with
a layer thickness of about 0.2 mm. The epoxy resin system, which controls the matrix dominated
properties such as the transverse strength, is MY750 produced by Vantico. All sets of CFRP woven
fabric laminates were fabricated by St. Bernard Composites Ltd. CFRP panels were sectioned with
a water-cooled diamond saw to prepare the coupons for testing. Holes of 5 mm or 10 mm diameter
(d) were introduced into each coupon using a high speed steel drill bit.
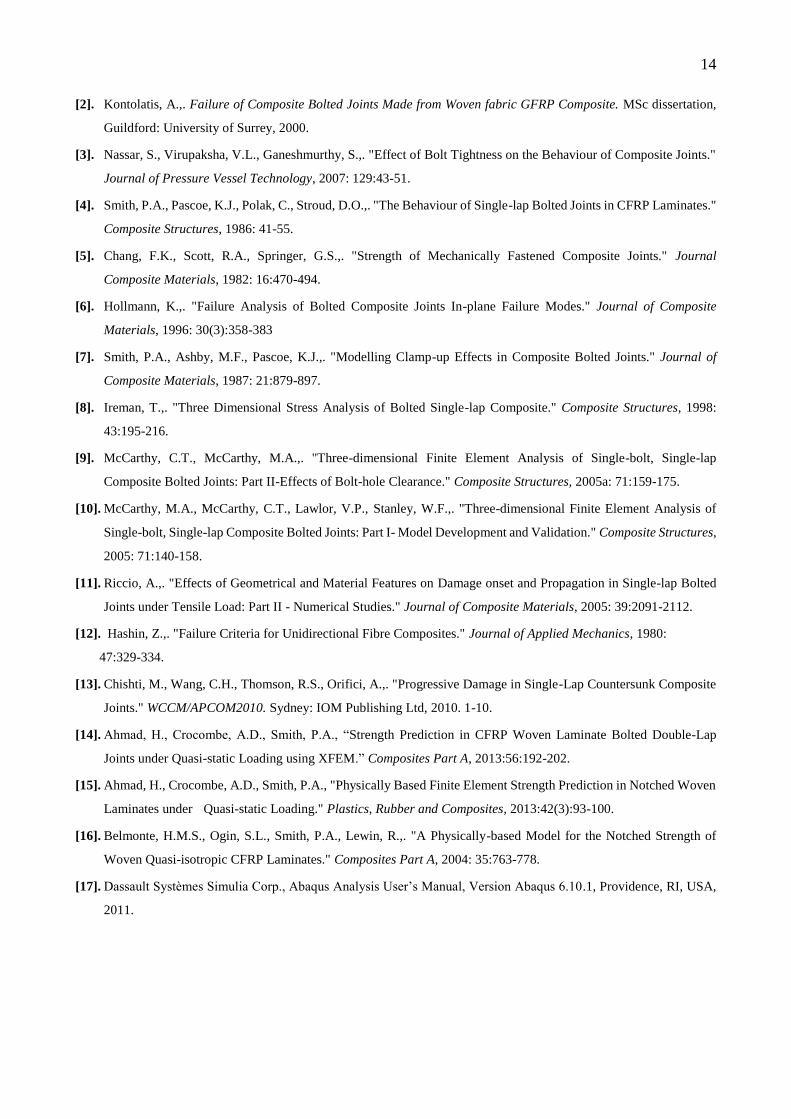
The single-lap bolted joints tested have one steel and one composite component, as illustrated in
Figure 1. A high yield strength stainless steel (with 𝜎𝑦 = 720 N/mm2) of thickness 3 mm was used.
This is sufficiently strong to ensure that joint failure occurs in the composite for all configurations
tested. M5 and M10 steel bolts and washers were used to fasten the joints with the 5 mm and 10
mm holes respectively. For each joint, two steel washers were used, one between the bolt head and
the composite, the other between the nut and the steel plate. The installation torques used were a
finger-tight (FT) condition (equivalent to about 0.5 N m) and a clamped condition of 5 N m. The
finger-tight condition is used in composite joint design in many applications as a worst case
scenario. Since the main aim in the current work was to study net-tension failure for any given
lay-up (material type and thickness), the end distance (e) was fixed and the joint width (W) was
varied accordingly. The test matrix is shown in Table 2.
At least three specimens for each joint configuration were tested to failure using an Instron test
machine with a 100 kN load cell and operating at a cross-head displacement rate of 0.5 mm/minute.
The load-displacement response was logged and the average bearing stress at failure (maximum
load divided by the product of the hole diameter and the plate thickness) was determined for each
specimen. Three specimens appeared sufficient for determining the strength since most test
configurations showed good reproducibility.
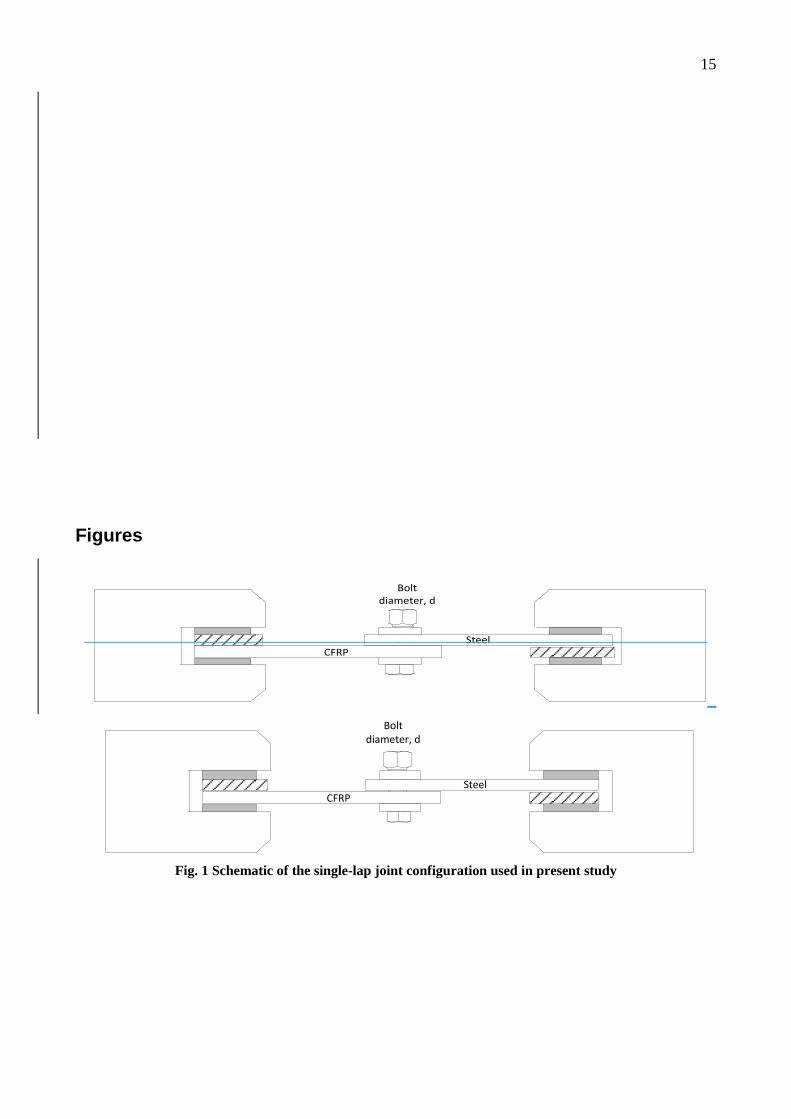
2.2 Load-displacement Behaviour
Representative load-displacement curves for net tension and bearing failures are shown in Figures
2a and 2b respectively. When compared with previously published data for double lap bolted joints
[14], the features on the curves for the single-lap and double-lap joints are similar.
Joint behaviour during a test can be divided conveniently into no-slip, slip and bearing damage
stages. At an early stage (no-slip), the load-displacement response is linear, (which gives the initial
stiffness of the bolted joint). There is no contact between the bolt and the hole (load is transferred
6
fully by friction) and so the joint stiffness depends upon the composite plate stiffness. The initial
stiffness of joints increases with increasing W/d. The maximum load carried by friction is 𝑃𝑡𝑜𝑡 =
2𝜇𝑃𝑏𝑜𝑙𝑡, where 𝑃𝑏𝑜𝑙𝑡 is the bolt tension. When 𝑃𝑡𝑜𝑡 > 2𝜇𝑃𝑏𝑜𝑙𝑡, friction is exceeded, the slipping
stage occurs and the bolt bears on the hole surface. Progressive contact will develop until full
contact between bolt shank and hole edge is reached. The load-displacement response shown in
Figure 2b is increasingly non-linear as sub-critical damage develops. Net-tension failures displayed
the lowest failure loads and failure is catastrophic at small W/d. The failure load increased with
increasing W/d and progressive bearing failures occurred at the larger W/d values. The secondary
bending effect does not lead to any obvious change in the shape of the load-displacement response
compared to DLJ tests from the same materials [14], but does modify the failure mechanisms and
affect the bearing stress at failure.
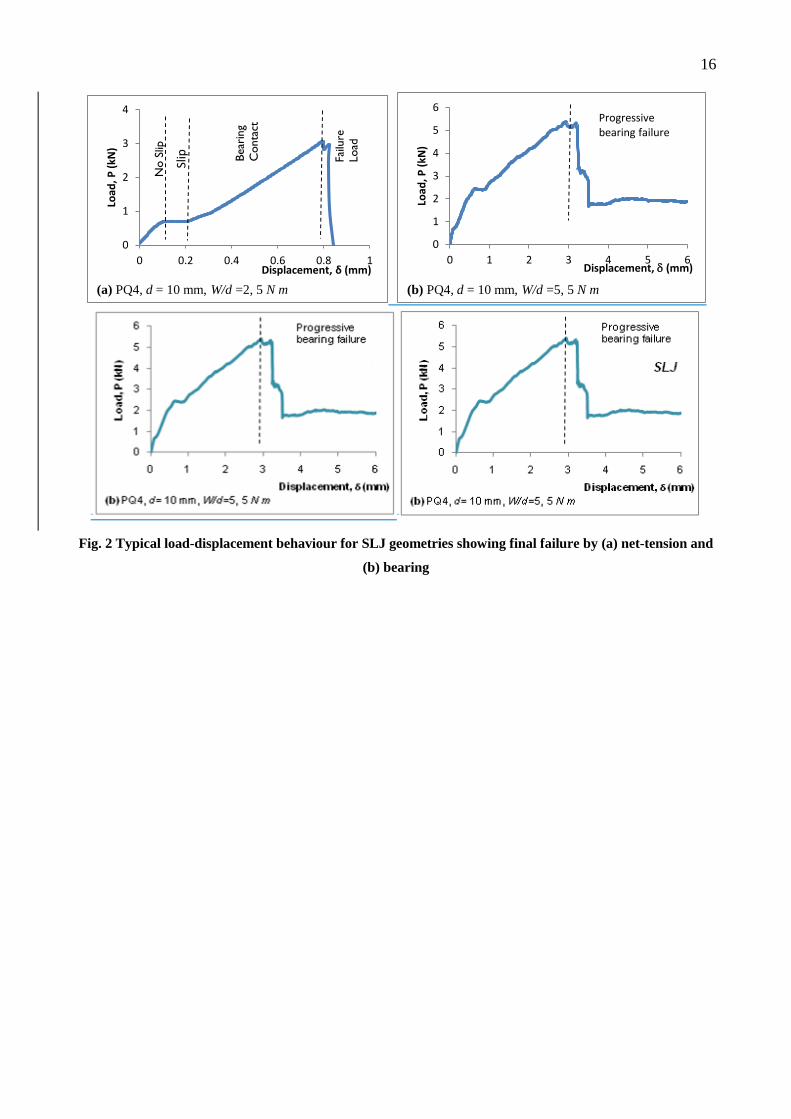
2.3 Joint Failure Mechanisms
Figure 3 shows photographs of failed single-lap joint coupons from the PQ4 lay-up in the clamped
condition over the full range of joint widths tested. At the smallest joint width (W/d = 2), the failure
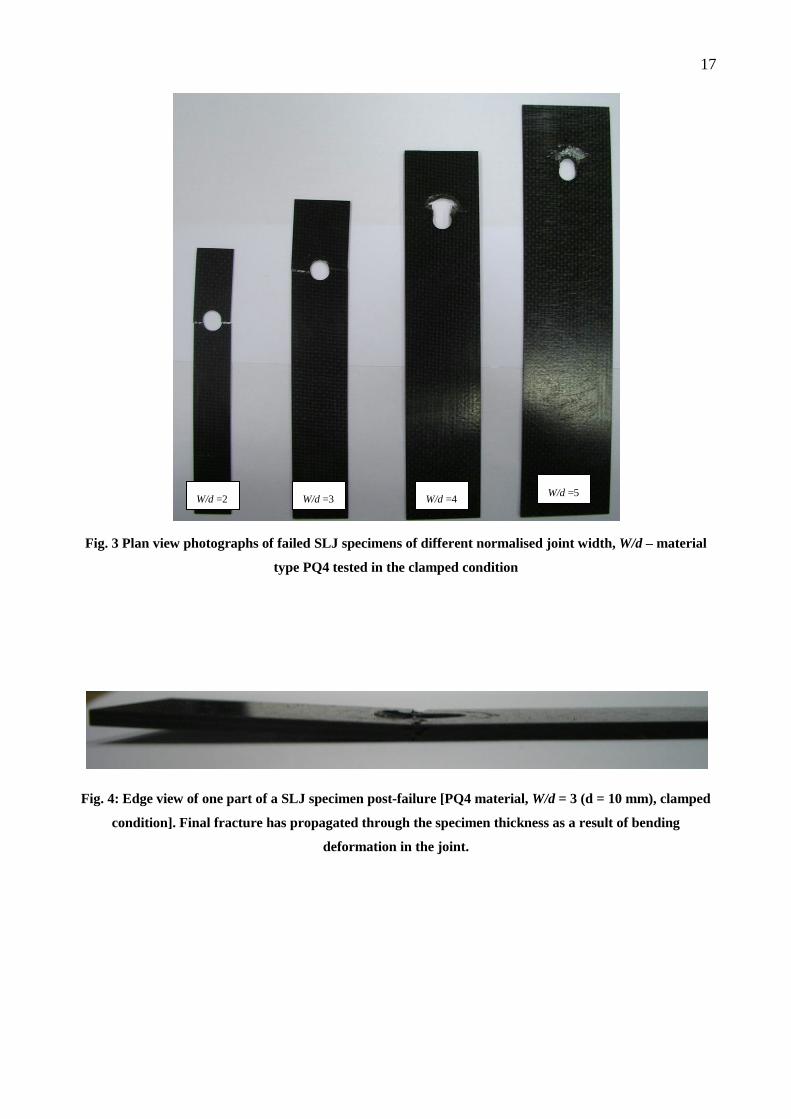
is by net tension, which is similar to that seen in double-lap joints. For W/d = 3, the failure is again
by net-tension, but closer inspection of the side view of the composite (Figure 4) suggests that the
final fracture path may be through the thickness (starting at the face with the higher tensile stress)
rather than across the width. This type of failure mechanism is not seen in double-lap joints and is
promoted by the bending that is introduced by the eccentric loading in the SLJ. This net-tension
failure involving an element of through-thickness crack growth was seen more in the thinner
laminates and in the quasi-isotropic (as opposed to cross-ply) lay-ups, presumably because of their
reduced stiffness and strength in flexure. For thicker and stiffer laminates the net-tension failure
appeared to be dominated by across the width crack propagation.
Cross-ply and quasi-isotropic lay-ups in SLJs demonstrated transition from net-tension to bearing/
bolt pull through failures at W/d = 3 and W/d = 4, respectively, with finger-tight conditions. In the
clamped condition, this value is increased to W/d = 5 in quasi-isotropic lay-up but all cross-ply
lay-ups failed in a net-tension mode (note that maximum normalised width tested for the cross-ply
is W/d = 3). For W/d = 4 (Figure 3) progressive bearing failure is apparent with final failure
showing the bolt pulling through the laminate. The washer penetration into the laminate is apparent
at the higher W/d ratios and again appears to occur more readily in thinner laminates. This
mechanism is also not found in the corresponding DLJs as these joints do not experience significant
bending deformation. This washer penetration was found to occur at W/d ratios ~ 4 for
7
quasi-isotropic composites and at W/d ratios ~ 3 for cross-ply composites. Applied bolt tightening
significantly increased the critical W/d ratio values.
2.4 Joint Failure Strengths
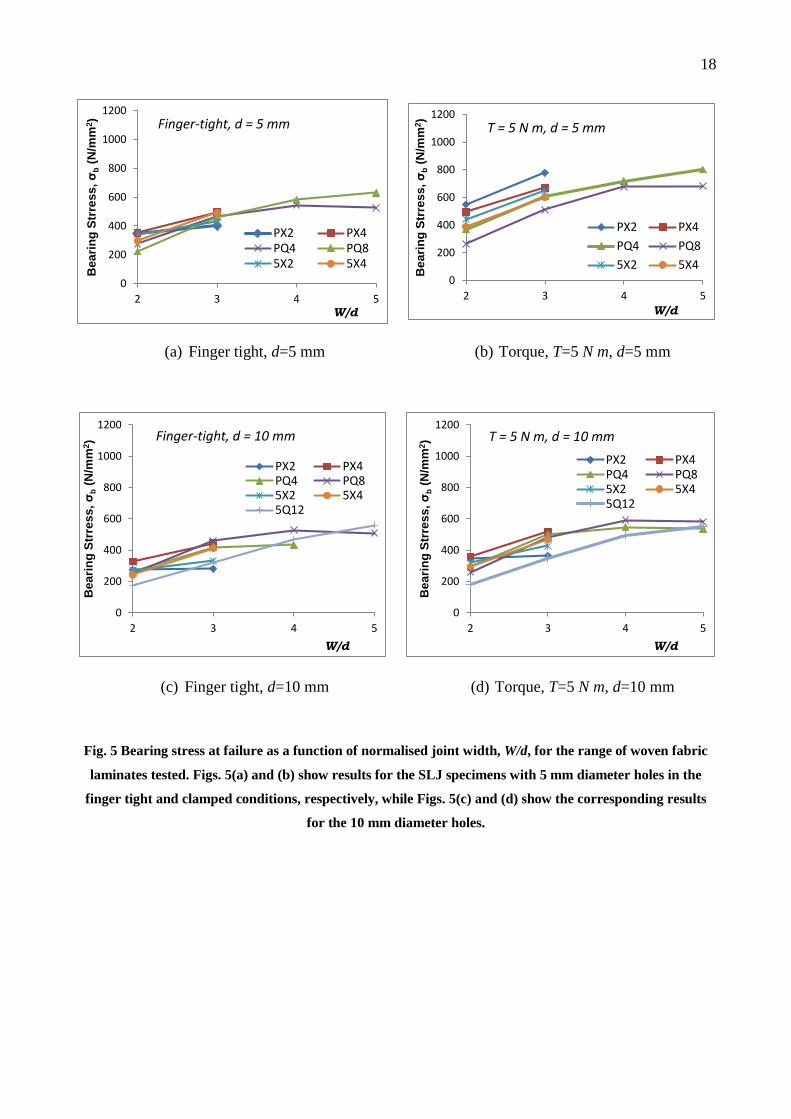
The experimental strengths for all the CFRP woven fabric SLJs tested are shown in Figure 5 and
Table 3. Interestingly, with regard to the magnitude of the bearing stresses at failure achieved, they
are greater than the base-line tensile strengths of the laminates, reported in Belmonte et. al. [16].
True bearing failure was seen more readily in the quasi-isotropic lay-ups compared to the cross-ply
lay-ups for the range of joint geometries investigated here. This reflects a combination of the stress
state around the hole and the relative values of the tension and (constrained) compression strengths
for the two lay-ups. It is likely that testing clamped cross-ply joints at larger W/d (W/d >3) could
lead to a further increase in strength and a change in failure mode. It is apparent that, for a given
W/d ratio, the bearing strength of the joints with the 5 mm diameter holes exceeds those of the joints
with 10 mm diameter holes. This is a consequence mainly of the greater role of the friction load
transfer in the joints with the smaller hole size, but may also reflect a hole size effect.
As indicated above, it was observed for some geometries that the final net tension failure crack
initiates at the bottom plane (most tensile) and propagates to the top plane (least tensile), due to the
secondary bending effects inherent in the SLJ. Although this secondary bending can be associated
with strength reduction, the net-tension failures in the SLJs did not show consistently lower
strengths than the corresponding DLJs [14]. It may be that in some SLJ geometries a redistribution
of load negates the bending effect, at least to some extent, and/or that for thicker laminates the
greater flexural stiffness reduces the influence of bending.
In general, the plain weave fabric systems showed higher bolted joint strength as compared to
five-harness satin fabric system. Similar trends are also observed by Belmonte [16] for open-hole
strength and are attributable to the higher fibre volume fraction of plain weave, even though plain
weave exhibits a higher degree of crimp as compared to equivalent five-harness satin fabric. The
higher fibre volume fraction in plain weave fabric is attributed to the ability of the fabric to nest the
fibres more tightly. There is a reduction in bearing stress with larger hole size regardless of the
failure mode. Although there is proportionately less frictional load transfer in specimens with the
larger hole size, the reduction in strength for the larger hole is greater than attributable to friction
alone. Hence there is a hole size effect associated with the larger volume of highly stressed material
for the larger hole size, even though the nominal stress concentration factor is independent of the
hole diameter at a given W/d. This agrees with Belmonte’s [16] (and with numerous other
8
researchers) findings for the open-hole geometry and this effect was also noted in the corresponding
DLJ tests [14]. The effect of clamp-up is more apparent in thin laminates than thicker laminates.
This is likely to be because the proportion of load transfer through friction is less in thicker
laminates. Hence for the thicker laminates, there is less difference in bearing stress at failure
between clamped and finger-tight conditions.
3. Finite Element Modelling
The elastic properties used for the composite in the current model are based on smeared-out (i.e.
averaged) properties, as used previously for DLJs [14], and are shown in Table 1. As bending
occurs in a single-lap joint, the use of averaged properties may not properly represent the bending
behaviour as the flexural rigidity of a stacked material is dependent on the layer sequence.
Cross-ply woven lay-up is arguably better represented through the averaged properties than the
quasi-isotropic material, because adjacent layers have the same properties. The other components of
the SLJs are made from steel which has a modulus elasticity of 210000 N/mm2 and Poisson’s ratio
of 0.3.
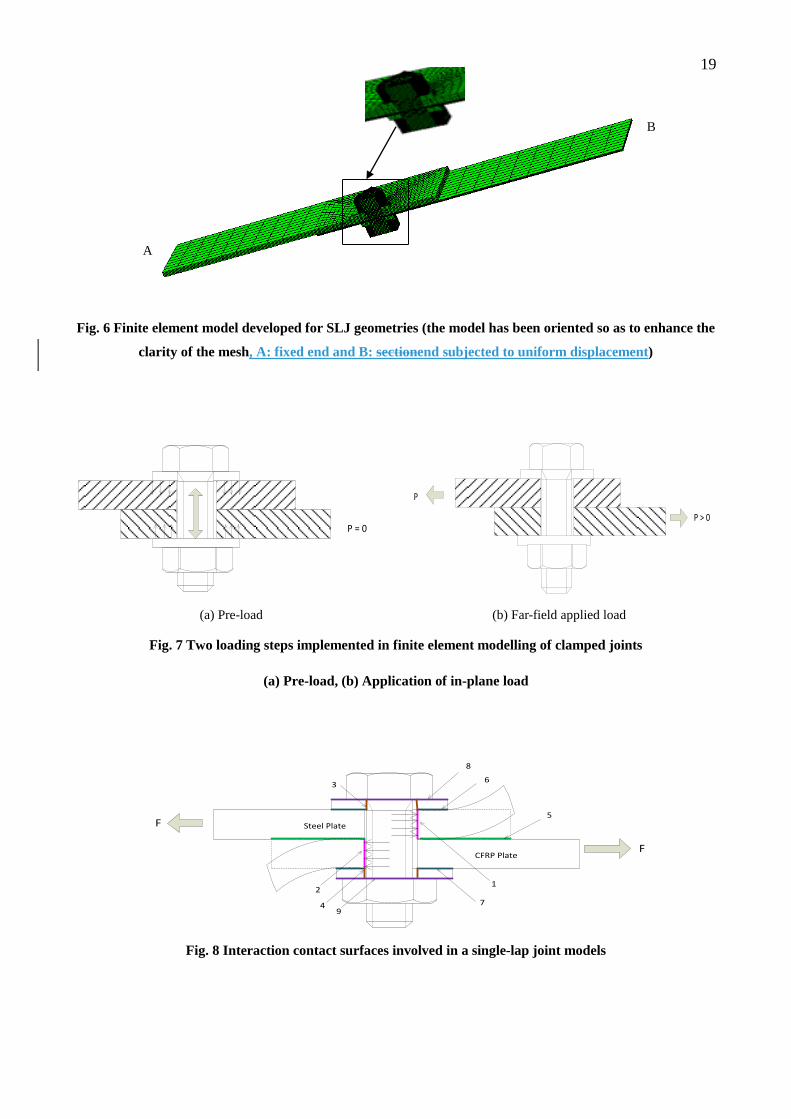
Six parts were assembled in each model of the single-lap joint. Parameters that were varied were
hole diameter d, width W, and lay-up. Sufficient mesh refinement was used to ensure the strength
predictions were mesh independent. An example of the mesh used in the 3-D model is shown in
Figure 6. The mesh is refined in the vicinity of the hole edge in the composite and steel plates and
the region under the washers, as ultimate failure occurred within these regions. The number of
degrees of freedom for the bolted joint models was about 100,000. Eight-node linear brick elements
(C3D8 in ABAQUS CAE [17]) are used because these elements are compatible with the
XFEM-based failure model. The boundary conditions are assigned so that end A is held fixed and a
displacement is applied to end B, as shown in Figure 6.
Two load steps are implemented which apply the clamping load (Step 1) and the far-field tensile
load (Step 2), both are shown in Figure 7. The 3-D models were able to include the bolt load and
friction load transfer directly. During the early stage of external loading (prior to plate sliding), the
load is transferred by friction. As the applied load increases the plates start to slide until the curved
inner surface of the hole bore and the bolt shank come into contact. From the experimental
9
load-displacement curve the onset of slipping can be seen when the displacement increases under
constant load, see Figure 2. At this point the friction load is overcome and the plate starts to slide,
(𝐹 ≥ 2𝜇𝑃𝑡𝑜𝑡). From this basic law of friction, assuming a friction coefficient of 0.3, the average
load in the bolt associated with CFRP experimental data was found to be 1250 N when a torque of 5
N m was applied to the bolt. A notional bolt load of 125 N was used in the finger tight condition.
The nine contact surfaces involved in the single-lap joint model are shown in Figure 8. Each contact
surface pair was assigned with master-slave interaction which included a static friction coefficient
of 0.3. This is an important step as load transfer will affect the stress distributions and therefore,
strength predictions.
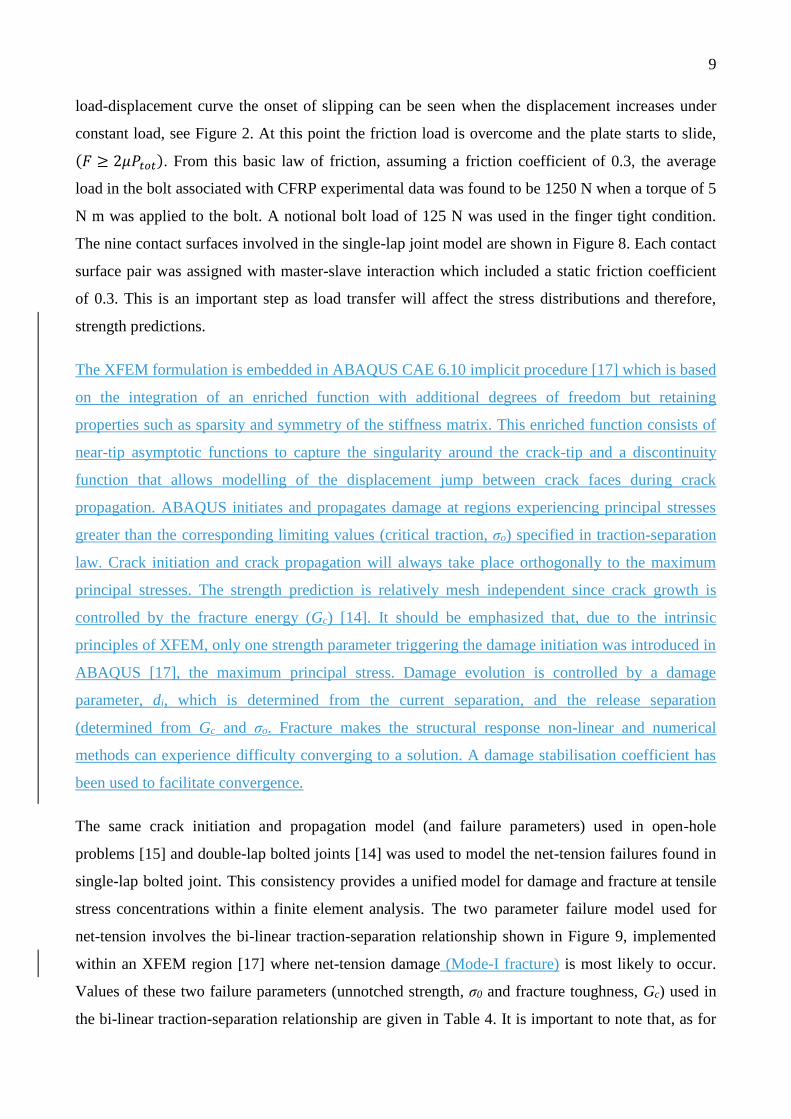
The XFEM formulation is embedded in ABAQUS CAE 6.10 implicit procedure [17] which is based
on the integration of an enriched function with additional degrees of freedom but retaining
properties such as sparsity and symmetry of the stiffness matrix. This enriched function consists of
near-tip asymptotic functions to capture the singularity around the crack-tip and a discontinuity
function that allows modelling of the displacement jump between crack faces during crack
propagation. ABAQUS initiates and propagates damage at regions experiencing principal stresses
greater than the corresponding limiting values (critical traction, σo) specified in traction-separation
law. Crack initiation and crack propagation will always take place orthogonally to the maximum
principal stresses. The strength prediction is relatively mesh independent since crack growth is
controlled by the fracture energy (Gc) [14]. It should be emphasized that, due to the intrinsic
principles of XFEM, only one strength parameter triggering the damage initiation was introduced in
ABAQUS [17], the maximum principal stress. Damage evolution is controlled by a damage
parameter, di, which is determined from the current separation, and the release separation
(determined from Gc and σo. Fracture makes the structural response non-linear and numerical
methods can experience difficulty converging to a solution. A damage stabilisation coefficient has
been used to facilitate convergence.
The same crack initiation and propagation model (and failure parameters) used in open-hole
problems [15] and double-lap bolted joints [14] was used to model the net-tension failures found in
single-lap bolted joint. This consistency provides a unified model for damage and fracture at tensile
stress concentrations within a finite element analysis. The two parameter failure model used for
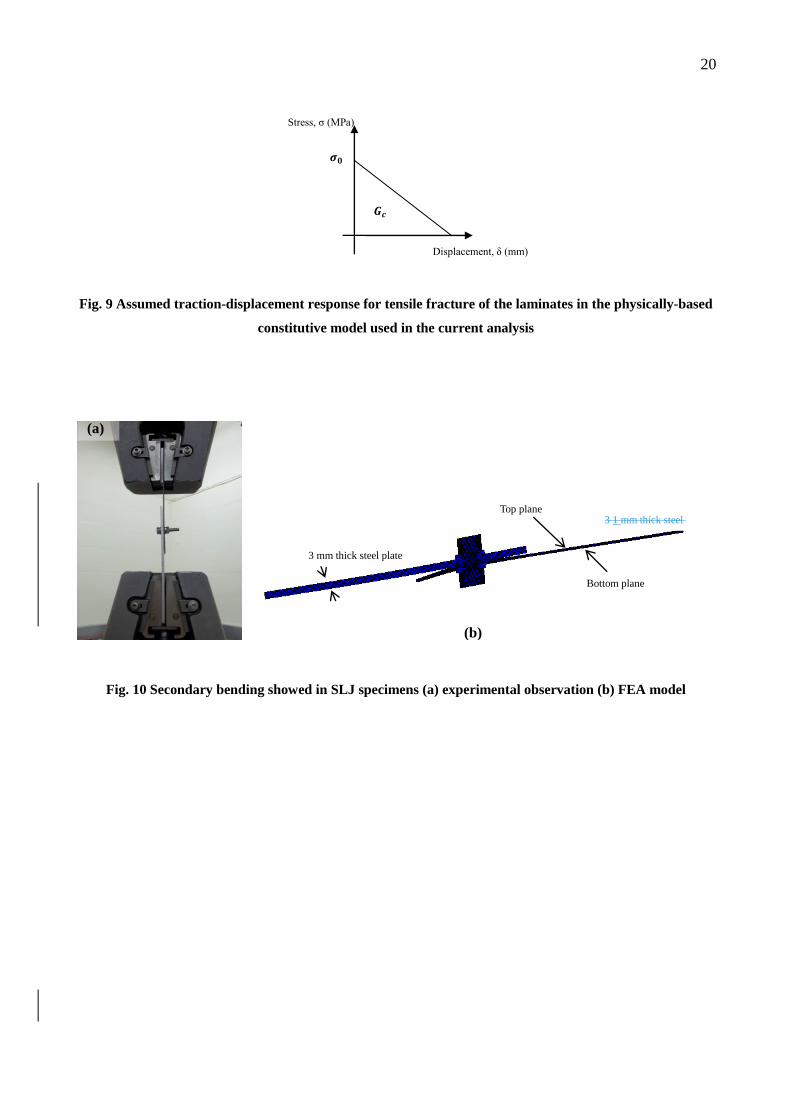
net-tension involves the bi-linear traction-separation relationship shown in Figure 9, implemented
within an XFEM region [17] where net-tension damage (Mode-I fracture) is most likely to occur.
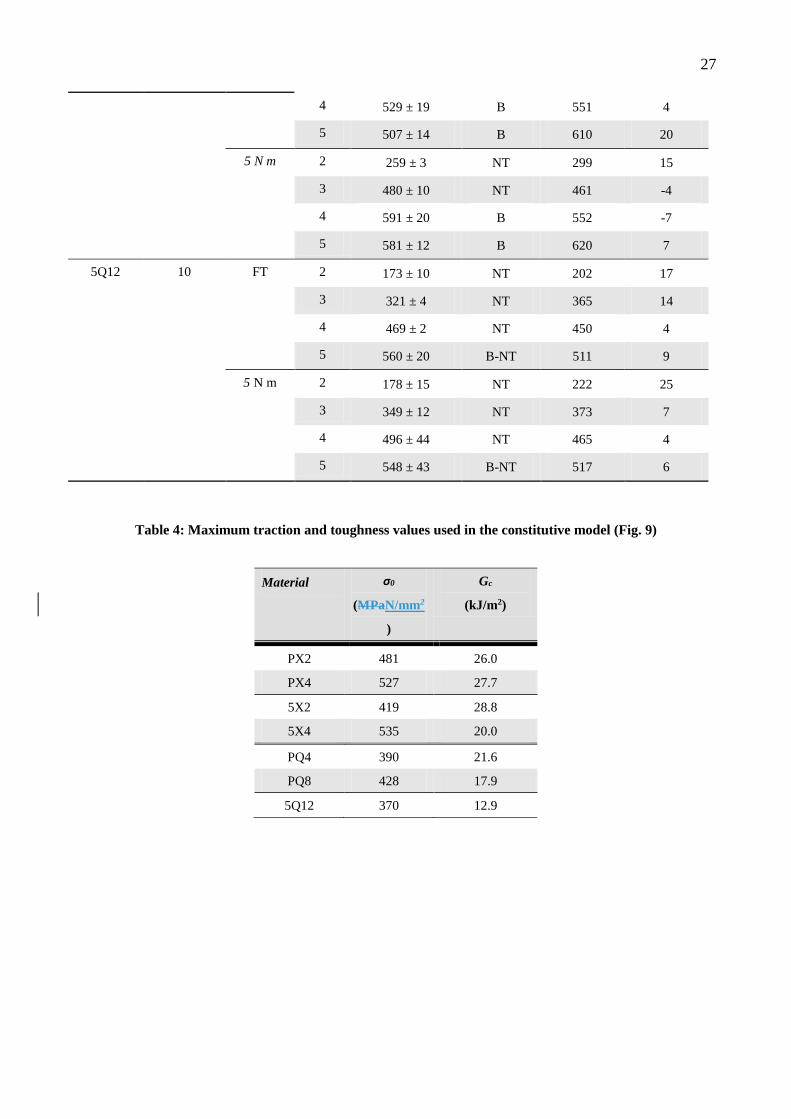
Values of these two failure parameters (unnotched strength, σ0 and fracture toughness, Gc) used in
the bi-linear traction-separation relationship are given in Table 4. It is important to note that, as for
10
the open-hole and the double lap joint problem, σ0 and Gc are taken from independently measured
un-notched strengths and toughnesses of the various woven composite lay-ups and are not
calibrated to fit the measured experimental lap joint strengths.
Large displacement analysis is also used to include the geometric non-linearity. This is essential in
order to incorporate the changes in geometry that occur as the joint rotates. Solution has been
achieved using the implicit solver (ABAQUS Standard). Small sliding surface to surface contact
formulation is assigned between surface interactions as the relative motion between surfaces is
small compared to the size of the element surface. The bolted joint configurations identified in the
test matrix (Table 2) have varying dimensions. All joints have a fixed e/d ratio but their W/d and/or
d/t ratios, and bolt tension may change. Although these variations may change the composite failure
mechanisms, the main aim is to predict net-tension failure mode joint strengths.
4. Stress Distribution and Strength Prediction
The issue of secondary bending has been considered by most researchers who investigate this joint
type. When compared to a double-lap joint, the single-lap joint exhibits an eccentric load path. As
shown in Figure 10, the CFRP plate flexes as the load is applied. This generates non-uniform
contact pressure between the fasteners and the plate. At the same time, the contact interface region
between the CFRP plate and the steel plate is reduced and this may change the friction load transfer.
Further, the rotation may also introduce a stress concentration as a result of bolt head tilting.
The degree of secondary bending depends on plate flexural rigidity (the product of the modulus of
elasticity, E and the second moment of area, I). Failure in a SLJ is more complex than in a DLJ as
the secondary bending modifies the stress distribution and can change the failure mechanisms. The
steel plate showed small (negligible) plate bending due to its higher EI.
Initially the stresses around the holes in the SLJ arising from the non-damaged FE modelling, with
no damage will be discussed and the effect of various parameters on the stress distribution
considered. Following this the damage will be incorporated in the modelling and the joint strengths
predicted and compared with the experimental results.
4.1 Stress Distribution
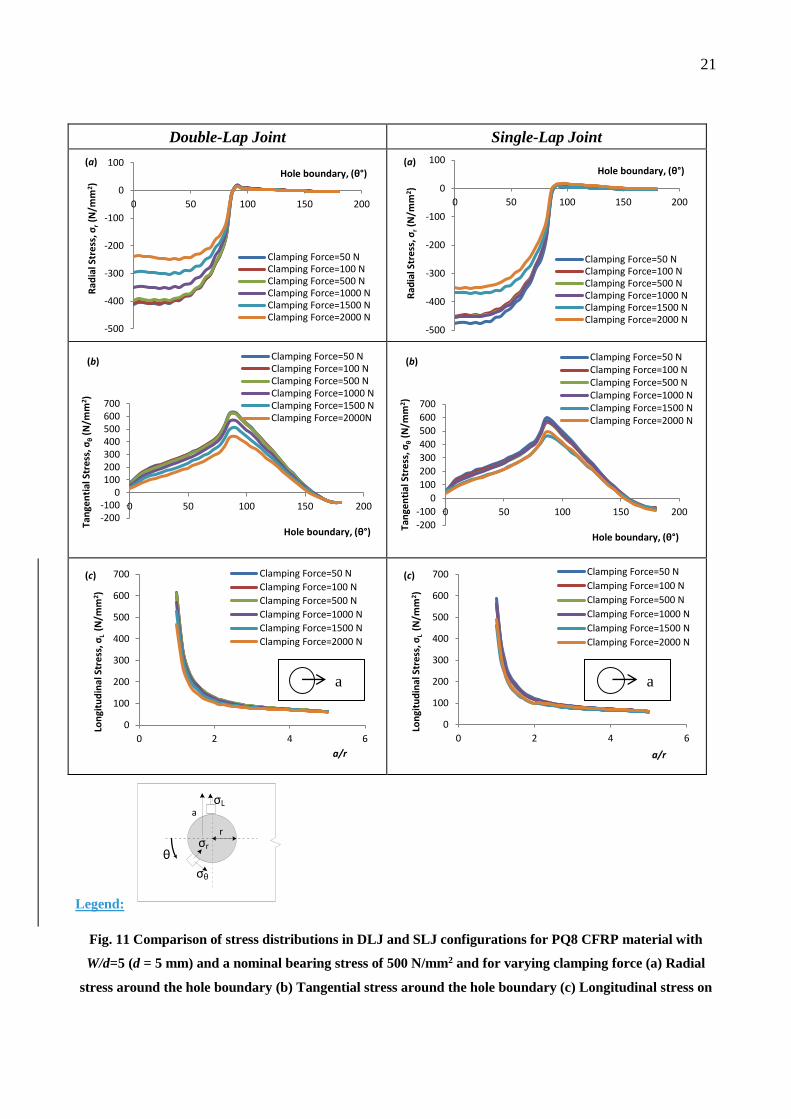
Figure 11 shows a comparison of stresses in the composite plate, in the vicinity of the hole edge,
between a single-lap and double-lap joint using PQ8 lay-up CFRP composite plates from an
11
undamaged elastic analysis. This provides an overview of the plate stresses prior to damage. Unless
specified otherwise the stresses plotted in this figure are mean stress values (averaging the stresses
throughout the plate thickness). Besides Boththe secondary bending in the joint and phenomenon,
bolt tilting also changes the stress gradientcause differences between the single lap joint and double
lap joint configurations and reduces the tensile stress (are more significant effects within thin
plates).
Combinations of these responses make the single lap joint stress distribution different from those of
the double lap joint. For double-lap configurations, aAt a fixed applied nominal bearing stress of
500 N/mm2, the tangential and radial stresses in both configurations, are observed to reduce with
increasing clamping force (as a higher proportion of the load is transferred through friction). Radial
stress in single-lap joint showed larger compressive stress around hole circumference compared to
the double-lap joint (Figure 11a), caused by bolt tilting and bending, which reduce the friction load
in the SLJ. No significant difference was found in tangential stresses or longitudinal stresses (Figure
11b,c) but the effect of clamping load was suppressed more for the single lap joint. It should be
noted that the longitudinal stresses shown in Figure 11c have been averaged across the thickness
and so the effect of plate bending in the single lap joint will be masked.
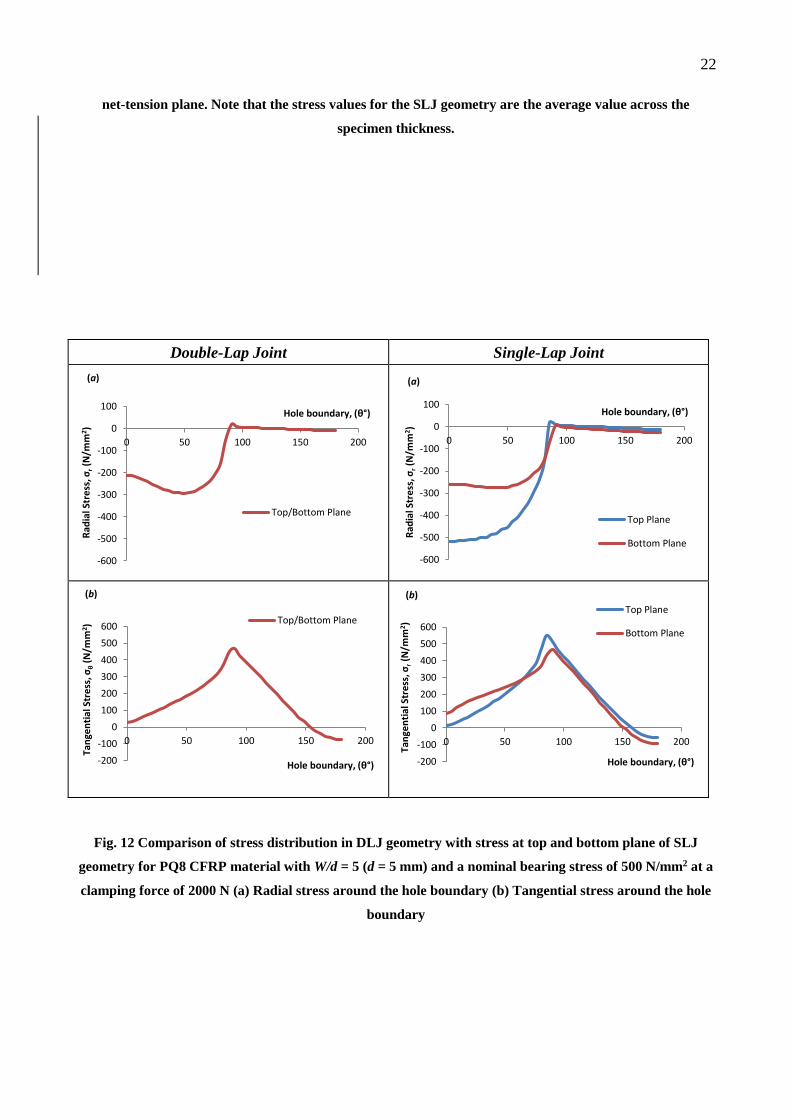
Double-lap joint configurations gave similar stresses in top plane and bottom plane (Figure 12a and
12b). However, as expected, there was a significant difference between top and bottom planes in the
single-lap joint response. The top plane showed larger compressive radial stress than the bottom
plane, due to bolt tilting. Average tangential stresses around the hole boundary are similar in both
configurations (Figure 11b) but the tangential stresses on the top and bottom planes in the SLJ are
different (Figure 12b) as secondary bending contributes to larger tensile stresses in top plane rather
than bottom plane. This study concentrates on net-tension failures, it is expected that there will not
be much difference in bearing stress at failure from both configurations (SLJ and DLJ) as
net-tension failures are largely dependent on stress concentrations at the hole edge (Smith et. al.
[4]).
4.2 Strength Prediction
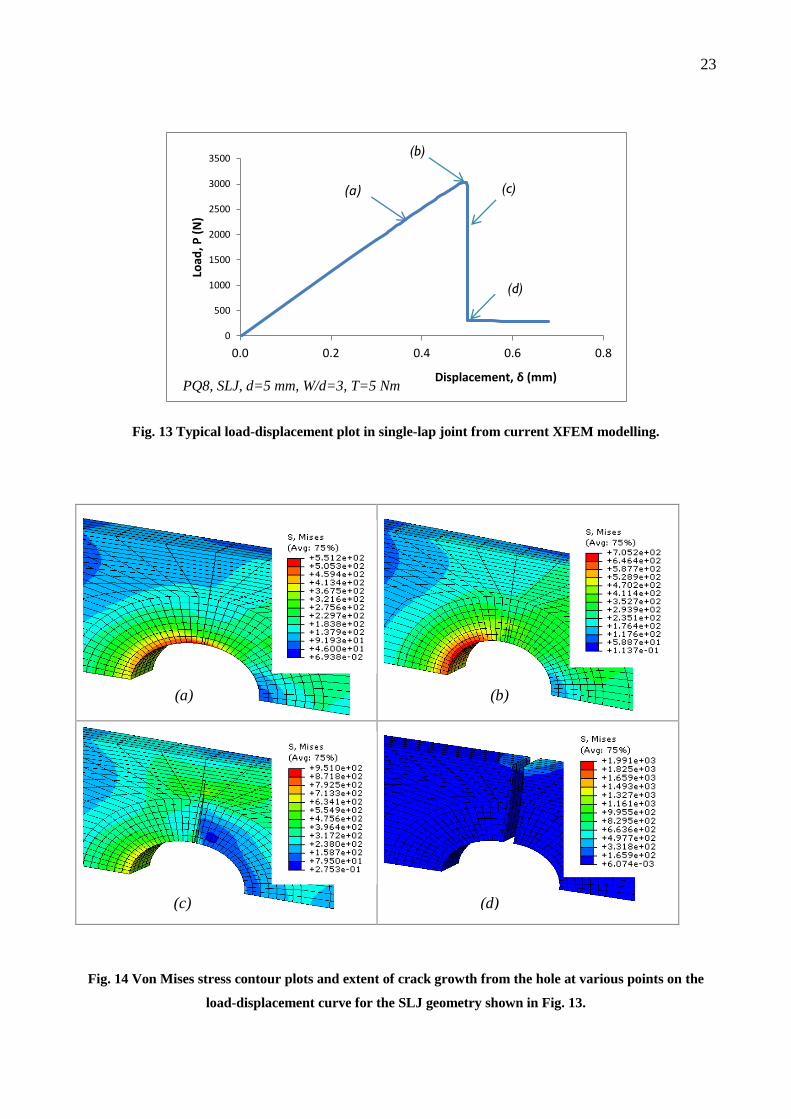
A typical, actual load-displacement curve resulting from the progressive damage FE analysis and
strength prediction of a single-lap joint exhibiting net tension failure is shown in Figure 13. At low
loads this appears different to the experimental data shown in Figure 2 for another specimen
showing net-tension failure. This is because the FE model assumes initial contact between the bolt
and the plates and so does not capture any slippage that occurs experimentally as the clearance is
12
taken up. Von Mises stress plots at the 4 points labelled on the load-displacement curve are shown
in Figure 14 to illustrate the initiation and damage propagation (cracking) in the failure region.
Damage initiation occurs when the maximum principal stress reaches the unnotched strength of the
laminate and evolves absorbing the fracture energy, critical parameters are summarised in Table 4.
Final failure is determined when the crack reaches a critical size and further crack growth can no
longer dissipate the fracture energy. Damage initiates at Point a, where it can be seen in Figure 14a
that the maximum stresses reach the unnotched strength of the material (Table 34). The damage
then propagates a certain distance before reaching the ultimate failure (Fig 13, Point b). The damage
path can be identified as a crack running just in front of the net tension plane in Figure 14b. Point b
is the main point of interest as this showed the peak load (strength) of the bolted joint studied. Point
c and Point d are associated with catastrophic failure, after which the plate cannot carry any more
load.
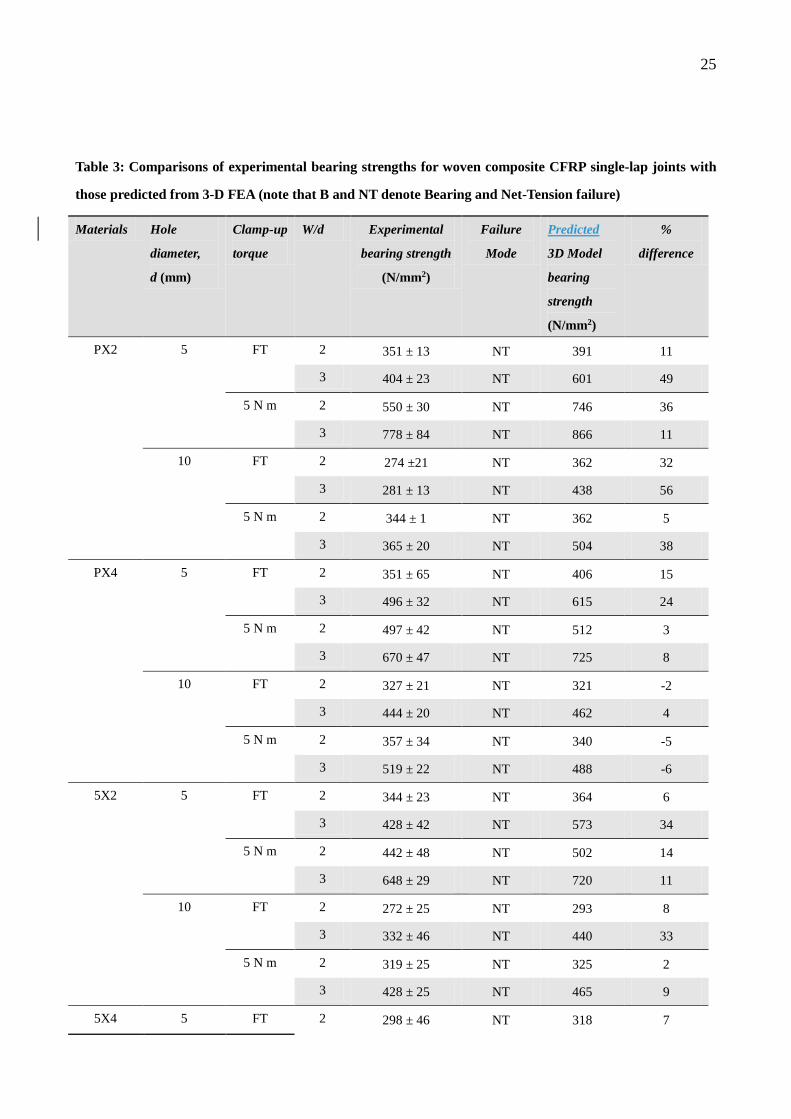
Damage analyses such as those described above were undertaken for every SLJ configuration tested
and the predicted net tension failure strength was extracted from each analysis. Table 4 3 reports the
predicted strength of all the single-lap joints and compares them with the experimental test data.
The average error over all the predictions was found to be around 15% (with over 60% of the
specimens having an error of less than this value) although there were a few with errors just over
50%. When comparing the predictions with the previously published DLJ data [14], it appears at
first that the latter were more accurate with all joints having errors in strength predictions of less
than 20%.
There are other laminates for which the experimental strength in bearing is much less than the
predicted strength based on net-tension and these are indicated in Table 3 as having a failure mode
of bearing [B] or bearing-net-tension [B-NT]. For these joints the predicted strength (based on
net-tension failure) would provide an upper bound on strength. As might be expected the average
error for this group (19%) was higher than the remainder (14%). . The mainOther errors in the
strength predictions appear to be are in situations where the failure mechanism while predominantly
tensile is not captured wellmore complex. We noted previously that in the thinner laminates with
W/d = 3 there was a tendency for the fracture to occur in a through-thickness direction rather than
across the laminate width and hence the current approach over-estimates these strengths. For PX2 at
W/d = 3, there are overestimates of strength of 49%, 11%, 56% and 38%, while for 5X2 there are
over-estimates of 34%, 11%, 33% and 9%. There are other laminates for which the experimental
strength in bearing is much less than the predicted strength based on net-tension. If the data are
examined with these factors in mind, then the predicted strengths are, in general, reasonably close to
13
the experimental data for most of the net-tension failure types. We note that the cross-ply lay-ups
perhaps exhibit better agreement than the quasi-isotropic lay-ups. This may be a consequence of
using averaged stiffness properties for the two laminate types. In the cross-ply, the properties are
the same from layer-to-layer whereas with the quasi-isotropic laminate the properties vary from
layer-to-layer. Given that there is a stress variation through the laminate thickness, the
approximation of constant properties may lead to some inaccuracies in the stress distributions (and
hence strengths) determined for the quasi-isotropic composites.
Overall agreement with experimental data is very reasonable given the complexity of the problem
and it is noteworthy that this modelling approach for tensile failure at stress concentrations has now
been shown to work for three rather different test problems (the open-hole [15], the double lap-joint
[14] and the single-lap joint, in the present work) using the same material input parameters.
5. Concluding Remarks
An extensive experimental study was carried out to determine bearing stress at failure and the
associated failure mode in a range of single-lap joints assembled from woven CFRP. The effect of
material lay-up, plate thickness, hole size and bolt clamp-up were investigated. At lower values of
W/d, joints failed primarily in net-tension. There was a transition to bearing/pull through failures in
SLJs with similar lay-ups around W/d = 4. Plain weave fabric and cross-ply systems showed higher
bolted joint strengths compared to the five-harness satin fabric system due to higher fibre volume
fraction of plain weave. There is a hole size effect and applied bolt clamping modifies the critical
W/d transition values. Strength prediction is implemented within an XFEM framework by
incorporating a constitutive law for net-tension failure, i.e. a traction-separation damage model for
which the material properties were obtained from independent experiments, rather than from fitting
notched strength data. Good agreement with the 72 configurations of the experimental dataset was
found, with an average error of 15%error of less than 15% in approximately 60% of the test
problems. The greatest discrepancies were for situations where the tensile fracture mechanisms
were more complex, and hence not captured fully in the model, or when bearing failure occurred.
The development and use of validated failure criteria remains a key to solve structural and material
failure in bolted joints.
References
[1]. Esendemir, U.,. "Failure Analysis of Woven Glass-epoxy Prepeg Bolted Joints under Different Clamping
Moments." Advanced Composites Letters, 2008: 17:165-175
14
[2]. Kontolatis, A.,. Failure of Composite Bolted Joints Made from Woven fabric GFRP Composite. MSc dissertation,
Guildford: University of Surrey, 2000.
[3]. Nassar, S., Virupaksha, V.L., Ganeshmurthy, S.,. "Effect of Bolt Tightness on the Behaviour of Composite Joints."
Journal of Pressure Vessel Technology, 2007: 129:43-51.
[4]. Smith, P.A., Pascoe, K.J., Polak, C., Stroud, D.O.,. "The Behaviour of Single-lap Bolted Joints in CFRP Laminates."
Composite Structures, 1986: 41-55.
[5]. Chang, F.K., Scott, R.A., Springer, G.S.,. "Strength of Mechanically Fastened Composite Joints." Journal
Composite Materials, 1982: 16:470-494.
[6]. Hollmann, K.,. "Failure Analysis of Bolted Composite Joints In-plane Failure Modes." Journal of Composite
Materials, 1996: 30(3):358-383
[7]. Smith, P.A., Ashby, M.F., Pascoe, K.J.,. "Modelling Clamp-up Effects in Composite Bolted Joints." Journal of
Composite Materials, 1987: 21:879-897.
[8]. Ireman, T.,. "Three Dimensional Stress Analysis of Bolted Single-lap Composite." Composite Structures, 1998:
43:195-216.
[9]. McCarthy, C.T., McCarthy, M.A.,. "Three-dimensional Finite Element Analysis of Single-bolt, Single-lap
Composite Bolted Joints: Part II-Effects of Bolt-hole Clearance." Composite Structures, 2005a: 71:159-175.
[10]. McCarthy, M.A., McCarthy, C.T., Lawlor, V.P., Stanley, W.F.,. "Three-dimensional Finite Element Analysis of
Single-bolt, Single-lap Composite Bolted Joints: Part I- Model Development and Validation." Composite Structures,
2005: 71:140-158.
[11]. Riccio, A.,. "Effects of Geometrical and Material Features on Damage onset and Propagation in Single-lap Bolted
Joints under Tensile Load: Part II - Numerical Studies." Journal of Composite Materials, 2005: 39:2091-2112.
[12]. Hashin, Z.,. "Failure Criteria for Unidirectional Fibre Composites." Journal of Applied Mechanics, 1980:
47:329-334.
[13]. Chishti, M., Wang, C.H., Thomson, R.S., Orifici, A.,. "Progressive Damage in Single-Lap Countersunk Composite
Joints." WCCM/APCOM2010. Sydney: IOM Publishing Ltd, 2010. 1-10.
[14]. Ahmad, H., Crocombe, A.D., Smith, P.A., “Strength Prediction in CFRP Woven Laminate Bolted Double-Lap
Joints under Quasi-static Loading using XFEM.” Composites Part A, 2013:56:192-202.
[15]. Ahmad, H., Crocombe, A.D., Smith, P.A., "Physically Based Finite Element Strength Prediction in Notched Woven
Laminates under Quasi-static Loading." Plastics, Rubber and Composites, 2013:42(3):93-100.
[16]. Belmonte, H.M.S., Ogin, S.L., Smith, P.A., Lewin, R.,. "A Physically-based Model for the Notched Strength of
Woven Quasi-isotropic CFRP Laminates." Composites Part A, 2004: 35:763-778.
[17]. Dassault Systèmes Simulia Corp., Abaqus Analysis User’s Manual, Version Abaqus 6.10.1, Providence, RI, USA,
2011.
15
Figures
CFRPSteel
Bolt diameter, d
CFRPSteel
Bolt diameter, d
Fig. 1 Schematic of the single-lap joint configuration used in present study
16
Fig. 2 Typical load-displacement behaviour for SLJ geometries showing final failure by (a) net-tension and
(b) bearing
0
1
2
3
4
0 0.2 0.4 0.6 0.8 1
Load
, P (
kN)
Displacement, δ (mm)
Slip
No S
lip
Bear
ing
Conta
ct
Fai
lure
Load
(a) PQ4, d = 10 mm, W/d =2, 5 N m
0
1
2
3
4
5
6
0 1 2 3 4 5 6
Load
, P (
kN)
Displacement, (mm)
(b) PQ4, d = 10 mm, W/d =5, 5 N m
Progressive bearing failure
17
Fig. 3 Plan view photographs of failed SLJ specimens of different normalised joint width, W/d – material
type PQ4 tested in the clamped condition
Fig. 4: Edge view of one part of a SLJ specimen post-failure [PQ4 material, W/d = 3 (d = 10 mm), clamped
condition]. Final fracture has propagated through the specimen thickness as a result of bending
deformation in the joint.
W/d =2 W/d =3 W/d =4 W/d =5
18
(a) Finger tight, d=5 mm (b) Torque, T=5 N m, d=5 mm
(c) Finger tight, d=10 mm (d) Torque, T=5 N m, d=10 mm
Fig. 5 Bearing stress at failure as a function of normalised joint width, W/d, for the range of woven fabric
laminates tested. Figs. 5(a) and (b) show results for the SLJ specimens with 5 mm diameter holes in the
finger tight and clamped conditions, respectively, while Figs. 5(c) and (d) show the corresponding results
for the 10 mm diameter holes.
0
200
400
600
800
1000
1200
2 3 4 5
Be
ari
ng
Str
res
s, σ
b(N
/mm
2)
W/d
PX2 PX4PQ4 PQ85X2 5X4
Finger-tight, d = 5 mm
0
200
400
600
800
1000
1200
2 3 4 5
Be
ari
ng
Str
res
s, σ
b(N
/mm
2)
W/d
PX2 PX4
PQ4 PQ8
5X2 5X4
T = 5 N m, d = 5 mm
0
200
400
600
800
1000
1200
2 3 4 5
Bea
rin
g S
trre
ss
, σ
b(N
/mm
2)
W/d
PX2 PX4PQ4 PQ85X2 5X45Q12
Finger-tight, d = 10 mm
0
200
400
600
800
1000
1200
2 3 4 5
Bea
rin
g S
trre
ss
, σ
b(N
/mm
2)
W/d
PX2 PX4PQ4 PQ85X2 5X45Q12
T = 5 N m, d = 10 mm
19
Fig. 6 Finite element model developed for SLJ geometries (the model has been oriented so as to enhance the
clarity of the mesh, A: fixed end and B: sectionend subjected to uniform displacement)
P = 0
P
P > 0
(a) Pre-load (b) Far-field applied load
Fig. 7 Two loading steps implemented in finite element modelling of clamped joints
(a) Pre-load, (b) Application of in-plane load
F
F CFRP Plate
Steel Plate
8
5
2
9
6
1
7
3
4
Fig. 8 Interaction contact surfaces involved in a single-lap joint models
A
B
20
Fig. 9 Assumed traction-displacement response for tensile fracture of the laminates in the physically-based
constitutive model used in the current analysis
Fig. 10 Secondary bending showed in SLJ specimens (a) experimental observation (b) FEA model
Stress, σ (MPa)
𝑮𝒄
Displacement, δ (mm)
𝝈𝟎
(a)
(b)
Top plane
Bottom plane
3 mm thick steel plate
3 1 mm thick steel
CFRP plate
21
Double-Lap Joint Single-Lap Joint
Legend:
a
θ
σL
rσr
σθ
Fig. 11 Comparison of stress distributions in DLJ and SLJ configurations for PQ8 CFRP material with
W/d=5 (d = 5 mm) and a nominal bearing stress of 500 N/mm2 and for varying clamping force (a) Radial
stress around the hole boundary (b) Tangential stress around the hole boundary (c) Longitudinal stress on
-500
-400
-300
-200
-100
0
100
0 50 100 150 200
Rad
ial S
tre
ss, σ
r(N
/mm
2)
Hole boundary, (θ°)
Clamping Force=50 NClamping Force=100 NClamping Force=500 NClamping Force=1000 NClamping Force=1500 NClamping Force=2000 N
(a)
-500
-400
-300
-200
-100
0
100
0 50 100 150 200
Rad
ial S
tre
ss, σ
r(N
/mm
2 )
Hole boundary, (θ°)
Clamping Force=50 NClamping Force=100 NClamping Force=500 NClamping Force=1000 NClamping Force=1500 NClamping Force=2000 N
(a)
-200-100
0100200300400500600700
0 50 100 150 200
Tan
gen
tial
Str
ess
, σθ
(N/m
m2 )
Hole boundary, (θ°)
Clamping Force=50 NClamping Force=100 NClamping Force=500 NClamping Force=1000 NClamping Force=1500 NClamping Force=2000N
(b)
-200
-100
0
100
200
300
400
500
600
700
0 50 100 150 200
Tan
gen
tial
Str
ess
, σθ
(N/m
m2 )
Hole boundary, (θ°)
Clamping Force=50 NClamping Force=100 NClamping Force=500 NClamping Force=1000 NClamping Force=1500 NClamping Force=2000 N
(b)
0
100
200
300
400
500
600
700
0 2 4 6
Lon
gitu
din
al S
tre
ss, σ
L (N
/mm
2 )
a/r
Clamping Force=50 N
Clamping Force=100 N
Clamping Force=500 N
Clamping Force=1000 N
Clamping Force=1500 N
Clamping Force=2000 N
(c)
0
100
200
300
400
500
600
700
0 2 4 6
Lon
gitu
din
al S
tre
ss, σ
L (N
/mm
2 )
a/r
Clamping Force=50 N
Clamping Force=100 N
Clamping Force=500 N
Clamping Force=1000 N
Clamping Force=1500 N
Clamping Force=2000 N
(c)
a a
22
net-tension plane. Note that the stress values for the SLJ geometry are the average value across the
specimen thickness.
Double-Lap Joint Single-Lap Joint
Fig. 12 Comparison of stress distribution in DLJ geometry with stress at top and bottom plane of SLJ
geometry for PQ8 CFRP material with W/d = 5 (d = 5 mm) and a nominal bearing stress of 500 N/mm2 at a
clamping force of 2000 N (a) Radial stress around the hole boundary (b) Tangential stress around the hole
boundary
-600
-500
-400
-300
-200
-100
0
100
0 50 100 150 200
Rad
ial S
tre
ss, σ
r(N
/mm
2 )
Hole boundary, (θ°)
Top/Bottom Plane
(a)
-600
-500
-400
-300
-200
-100
0
100
0 50 100 150 200
Rad
ial S
tre
ss, σ
r(N
/mm
2 )Hole boundary, (θ°)
Top Plane
Bottom Plane
(a)
-200
-100
0
100
200
300
400
500
600
0 50 100 150 200
Tan
gen
tial
Str
ess
, σθ
(N/m
m2 )
Hole boundary, (θ°)
Top/Bottom Plane
(b)
-200
-100
0
100
200
300
400
500
600
0 50 100 150 200
Tan
gen
tial
Str
ess
, σr
(N/m
m2 )
Hole boundary, (θ°)
Top Plane
Bottom Plane
(b)
23
Fig. 13 Typical load-displacement plot in single-lap joint from current XFEM modelling.
Fig. 14 Von Mises stress contour plots and extent of crack growth from the hole at various points on the
load-displacement curve for the SLJ geometry shown in Fig. 13.
0
500
1000
1500
2000
2500
3000
3500
0.0 0.2 0.4 0.6 0.8
Load
, P (
N)
Displacement, δ (mm)PQ8, SLJ, d=5 mm, W/d=3, T=5 Nm
(a)
(b)
(c)
(d)
(a) (b)
(c) (d)
24
Tables
Table 1: Material properties of the woven CFRP laminates* under investigation
Laminate
designation
Thickness,
t (mm)
Ex, Ey
(GPa)
Ez
(GPa)
vxy vyz, vzx Gxy
(GPa)
Gyz, Gzx
(GPa)
Vf
(%)
PX2 0.51 50.4 11.9 0.10 0.10 4.42 3.98 44.3
PX4 1.03 51.4 11.7 0.09 0.10 4.42 3.90 43.4
5X2 0.81 45.1 12.9 0.08 0.11 3.78 3.89 38.8
5X4 1.60 47.0 12.7 0.06 0.11 3.78 3.85 38.3
PQ4 1.02 37.2 11.9 0.35 0.30 13.75 3.98 44.3
PQ8 2.03 36.8 12.1 0.33 0.30 13.86 4.04 45.0
5Q12 4.62 34.8 13.1 0.32 0.30 13.15 3.96 39.6
*data from Belmonte et. al. [1716]
Vf = fibre volume fraction PX2 = two-layer cross-ply plain weave
Exx = longitudinal Young’s modulus PX4 = four-layer cross-ply plain weave
Eyy = transverse Young’s modulus 5X2 = two-layer cross-ply five harness satin weave
vxy, vyz, vzx = Poisson’s ratio 5X4 = four-layer five harness satin weave
Gxy, Gyz, Gzx
t
= Shear modulus= laminate
thickness
PQ4 = four-layer quasi-isotropic plain weave
t = laminate thickness PQ8 = eight-layer quasi-isotropic plain weave
5Q12 = twelve layer quasi-isotropic five harness satin weave
Table 2: Range of test parameters investigated for CFRP SLJ tests
Laminate Thickness, t
(mm)
e/d W/d Hole size, d
(mm)
Clamp-up
torques (N m)
PX2 0.51 6 (fixed) 2, 3 5, 10 FT*, 5
PX4 1.03 6 (fixed) 2, 3 5, 10 FT*, 5
5X2 0.81 6 (fixed) 2, 3 5, 10 FT*, 5
5X4 1.60 6 (fixed) 2, 3 5, 10 FT*, 5
PQ4 1.02 4 (fixed) 2, 3, 4, 5 5, 10 FT*, 5
PQ8 2.03 4 (fixed) 2, 3, 4, 5 5, 10 FT*, 5
5Q12 4.62 4 (fixed) 2, 3, 4, 5 5, 10 FT*, 5
*FT = Finger-tight
25
Table 3: Comparisons of experimental bearing strengths for woven composite CFRP single-lap joints with
those predicted from 3-D FEA (note that B and NT denote Bearing and Net-Tension failure)
Materials Hole
diameter,
d (mm)
Clamp-up
torque
W/d Experimental
bearing strength
(N/mm2)
Failure
Mode
Predicted
3D Model
bearing
strength
(N/mm2)
%
difference
PX2 5 FT 2 351 ± 13 NT 391 11
3 404 ± 23 NT 601 49
5 N m 2 550 ± 30 NT 746 36
3 778 ± 84 NT 866 11
10 FT 2 274 ±21 NT 362 32
3 281 ± 13 NT 438 56
5 N m 2 344 ± 1 NT 362 5
3 365 ± 20 NT 504 38
PX4 5 FT 2 351 ± 65 NT 406 15
3 496 ± 32 NT 615 24
5 N m 2 497 ± 42 NT 512 3
3 670 ± 47 NT 725 8
10 FT 2 327 ± 21 NT 321 -2
3 444 ± 20 NT 462 4
5 N m 2 357 ± 34 NT 340 -5
3 519 ± 22 NT 488 -6
5X2 5 FT 2 344 ± 23 NT 364 6
3 428 ± 42 NT 573 34
5 N m 2 442 ± 48 NT 502 14
3 648 ± 29 NT 720 11
10 FT 2 272 ± 25 NT 293 8
3 332 ± 46 NT 440 33
5 N m 2 319 ± 25 NT 325 2
3 428 ± 25 NT 465 9
5X4 5 FT 2 298 ± 46 NT 318 7
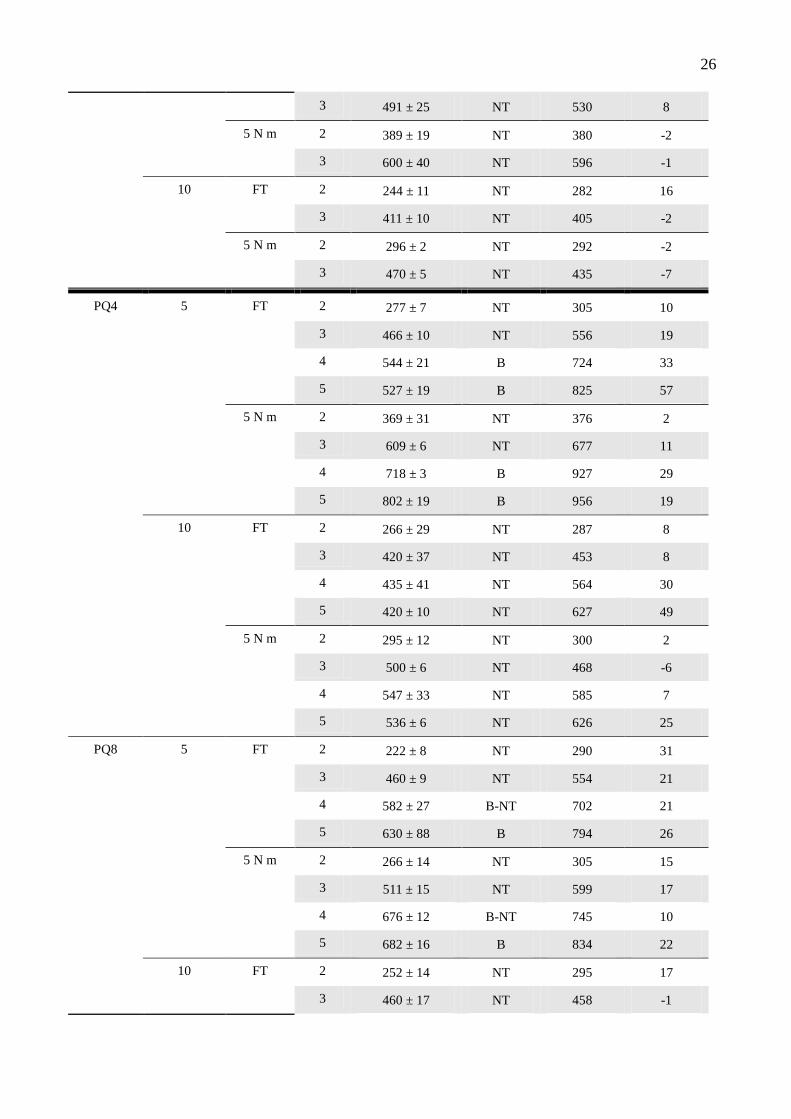
26
3 491 ± 25 NT 530 8
5 N m 2 389 ± 19 NT 380 -2
3 600 ± 40 NT 596 -1
10 FT 2 244 ± 11 NT 282 16
3 411 ± 10 NT 405 -2
5 N m 2 296 ± 2 NT 292 -2
3 470 ± 5 NT 435 -7
PQ4 5 FT 2 277 ± 7 NT 305 10
3 466 ± 10 NT 556 19
4 544 ± 21 B 724 33
5 527 ± 19 B 825 57
5 N m 2 369 ± 31 NT 376 2
3 609 ± 6 NT 677 11
4 718 ± 3 B 927 29
5 802 ± 19 B 956 19
10 FT 2 266 ± 29 NT 287 8
3 420 ± 37 NT 453 8
4 435 ± 41 NT 564 30
5 420 ± 10 NT 627 49
5 N m 2 295 ± 12 NT 300 2
3 500 ± 6 NT 468 -6
4 547 ± 33 NT 585 7
5 536 ± 6 NT 626 25
PQ8 5 FT 2 222 ± 8 NT 290 31
3 460 ± 9 NT 554 21
4 582 ± 27 B-NT 702 21
5 630 ± 88 B 794 26
5 N m 2 266 ± 14 NT 305 15
3 511 ± 15 NT 599 17
4 676 ± 12 B-NT 745 10
5 682 ± 16 B 834 22
10 FT 2 252 ± 14 NT 295 17
3 460 ± 17 NT 458 -1
27
4 529 ± 19 B 551 4
5 507 ± 14 B 610 20
5 N m 2 259 ± 3 NT 299 15
3 480 ± 10 NT 461 -4
4 591 ± 20 B 552 -7
5 581 ± 12 B 620 7
5Q12 10 FT 2 173 ± 10 NT 202 17
3 321 ± 4 NT 365 14
4 469 ± 2 NT 450 4
5 560 ± 20 B-NT 511 9
5 N m 2 178 ± 15 NT 222 25
3 349 ± 12 NT 373 7
4 496 ± 44 NT 465 4
5 548 ± 43 B-NT 517 6
Table 4: Maximum traction and toughness values used in the constitutive model (Fig. 9)
Material σ0
(MPaN/mm2
)
Gc
(kJ/m2)
PX2 481 26.0
PX4 527 27.7
5X2 419 28.8
5X4 535 20.0
PQ4 390 21.6
PQ8 428 17.9
5Q12 370 12.9

28


![CFRP [Wet-preg]](https://static.fdocuments.net/doc/165x107/546e6828b4af9faa268b4674/cfrp-wet-preg.jpg)