STRENGTH OF HORIZONTALLY CURVED - Lehigh …digital.lib.lehigh.edu/fritz/pdf/454_1.pdfSTRENGTH OF...
96
... STRENGTH OF HORIZONTALLY CURVED STEEL PLATE GIRDERS by Peter F. Schuenzel Ben T. Yen J. Hartley Daniels This work has been carried out as part of an investigation sponsored by the American Iron and Steel Institute Department of Civil Engineering Fritz Engineering Laboratory Lehigh University Bethlehem, Pennsylvania, 18015 July 1985 Fritz Engineering Laboratory Report No. 454.1
Transcript of STRENGTH OF HORIZONTALLY CURVED - Lehigh …digital.lib.lehigh.edu/fritz/pdf/454_1.pdfSTRENGTH OF...

...
STRENGTH OF HORIZONTALLY CURVED STEEL PLATE GIRDERS
by
Peter F. Schuenzel Ben T. Yen
J. Hartley Daniels
This work has been carried out as part of an investigation sponsored by the American Iron and Steel Institute
Department of Civil Engineering Fritz Engineering Laboratory
Lehigh University Bethlehem, Pennsylvania, 18015
July 1985
Fritz Engineering Laboratory Report No. 454.1

.•
..
ACKNOWLEDGMENTS
This study is being carried out as part of a research project which
has as its purpose the investigation of the strength of horizontally curved
steel plate and box bridge girders. The research which began in June of
1979 was sponsored by the American Iron and Steel Institute. Until June
of 1984 Dr. Lynn S. Beedle was Director of Fritz Engineering Laboratory and
Dr. David A. VanHorn was Chairman of the Department of Civil Engineering.
The authors wish to thank the Committee of Structural Steel Producers
and the Committee of Steel Plate Producers of the American Iron and Steel
Institute for thier support.
The guidance and suggestions of the AISI Bridge Task Force is recognized.
Members of the Task Force are Messrs. J. A. Gilligan, R. S. Fountain,
R. J. Behling, R. C. Cassano, T. M~ Dean, T. V. Galambos, E. V. Hourigan,
R. P. Knight, J. T. Kratzer, R. W. Lautensleger, D. A. Linger, W. A.
Milek, Jr., C. A. Pestotnik, F. D. Sears, W. M. Smith, L. M. Temple and
C. E. Thunman, Jr. The research was supervised by Mr. Richard P. Knight .
ii

The work of the Fritz Engineering Laboratory support staff in conducting
the tests is appreciated. Messrs. Hugh T. Sutherland and Russel Logenbach
supervised installation of strain gages and acquisition of strain data.
Messrs. Charles F. Hittinger and Robert Dales were responsible for the
test set-up and loading respectively. A special thank you to Mrs. Dorothy
Fielding for typing this report. The photographs were prepared by
Mr. R. N. Sopko and the drawings by Mr. J. M. Gera.
iii

, TABLE OF:C0NTENTS
Page
ABSTRACT 1
1. INTRODUCTION 2
1.1 Background 2
1.2 Objectives and Scope of Work 5
2. LIMIT STATES 7
2.1 Web Shear Capacity 7
2.2 Local Buckling 10 .li
2.3 Lateral Buckling 13
2.3.1 Elastic Buckling 13
2.3.2 Second-Order Effects 16
2.3.3 Culver's Proposed Specification 20
3. TESTING OF CURVED PLATE GIRDER ASSEMBLY 25
3.1 Description of Girder Assembly 25
3.2 Test Procedure 26
3.3 Instrumentation 27
3.4 Test Results 28
iv

,.
4.
5.
j
TABLE OF.· CONTENTS (continued)
EVALUATION OF TEST RESULTS AND MODIFICATION
OF ANALYSIS
4.1 Comparison of Theoretical and Test Results
4. 2 Effective Length
4.3 Reduction of Stresses at Diaphragms
4.4 Distortional Stresses
4.5 Radial Bending Stresses
SliMMAR.Y
TABLES
FIGURES
REFERENCES
NOMENCLATURE
v
Page
34
34
37
38
40
42
43
46
49
83
86

Tables
1
2
3
..
LIST OF TABLES
CROSS SECTION DIMENSIONS AND PARAMETERS
LOCATION OF INFLECTION POINTS AND THE EFFECTIVE
LENGTH
COMPARISON OF PREDICTED AND MEASURED
vi
Page
46
47
48

Figure
1
2
3
4
5
6
7
8
9
10
11
12
13
14
15
16
17
18
19
20
21
LIST OF FIGURES
Stresses on Cross-Section
Local Buckling Model
Displacement Components
Curved Plate Girder with End Loads
Internal Stress Resultants
Twist and Bimoment Ratio
Cross-Section Distortional Loading
Distribution of Internal Moments
Contribution of Effects - Straight Girder
Schematic Plan of Girder Assembly
Cross-Sectional View
Roller Support
Torsional Restraint
Test 1: First, Second and Third Phase
Location of Deflection Dials
Load versus Deflection, Test 1, Phase 1
Load versus Deflection, Test 1, Phase 2
Load versus Deflection, Test 1, Phase 3
Lateral Displacement, Test 1, Phase 1
Lateral Displacement, Test 1, Phase 2
Lateral Displacement; Test 1, Phase 3
vii
Page
49
50
51
52
53
54
55
56
57
58
59
60
61
62
63
64
65
66
67
68
69
LIST OF FIGURES (continued)
Figure ·Page
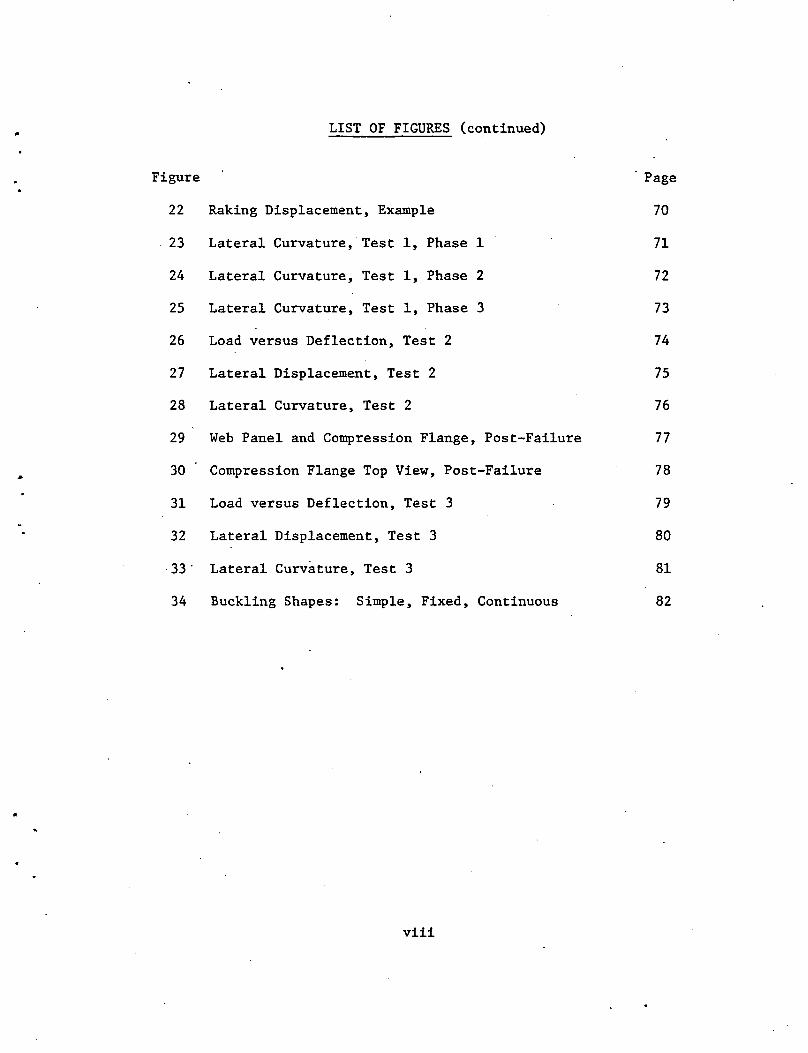
22 Raking Displacement, Example 70
23 Lateral Curvature, Test 1, Phase 1 71
24 Lateral Curvature, Test 1, Phase 2 72
25 Lateral Curvature, Test 1, Phase 3 73
26 Load versus Deflection, Test 2 74
27 Lateral Displacement, Test 2 75
28 Lateral Curvature, Test 2 76
29 Web Panel and Compression Flange, Post-Failure 77
• 30 Compression Flange Top View, Post-Failure 78
31 Load versus Deflection, Test 3 79
32 Lateral Displacement, Test 3 80
. 33. Lateral Curvature, Test 3 81
34 Buckling Shapes: Simple, Fixed, Continuous 82
viii

•
ABSTRACT
This thesis summarizes previous research that investigated
the limits states of horizontally curved plate girders and reports
on the testing of a curved plate girder assembly. Evaluation of
the testing results leads to the conclusion that the present
design specification is overly conservative. A modified approach
is developed so that a more accurate prediction of the strength
of curved plate girders can be obtained. The modified approach
includes using the effective length for lateral buckling, reducing
the stresses at the diaphragms, considering the effect of the
web in reducing distortion, and reducing the radial bending
stresses.
-1-

1. INTRODUCTION
1.1 Background
Horizontally curved girders are being used extensively for
highway and railway bridges. Curved girders permit more efficient
use of land and allow for more economical approach ways, as
opposed to using straight members as chords of an arc for a horiz-
ontally curved bridge or overpass.
The state of stress in curved girders is more complex than
in straight girders due to the inherent torsional loading. (l, 2)
Normal stresses acting on the cross-section include bending,
warping ,(non-uniform torsional), radial bending, distortional, and
residual stresses. Shear stresses are due to bending, St. Venant
(uniform) torsion, and non-uniform torsion. Figure 1 shows the
distribution of these stresses on the cross-section. The residual
.stress distribution is dependent upon the fabrication process, /
flame cut, heat curved or cold bending, and therefore not shown.
Due to the increasing use of curved girders and their
complexity of stress distribution, a Consortium of University
Research Teams (CURT) conducted an investigation into the analysis
and design of curved girders.()) Four universities, the University
of Rhode Island, the University of Pennsylvania, Syracuse University,
and Carnegie-Mellon University, participated in this investigation.
-2-

The University of Rhode Island conducted full-scale test
on two single span composite box girders. ~ 3) A modified grid
method of analysis taking into account non-uniform torsion was used
to determine stresses. Satisfactory agreement was obtained between
calculated and experimental results. Scaled model tests conducted
in the laboratory also showed good agreement.
The University of Pennsylvania conducted small scale model
tests using rolled beams. (3) An equivalent straight beam analysis
was used by modifying the stress resultants of a straight member.
Non-uniform torsion was neglected, and therefore, this method of
analysis is not very accurate.
Syracuse University used a three-dimensional method of
analysis of a scaled model composite plate girder. ( 3) The analysis
includes the effects of warping and assumes all members are straight
and full composite action would be achieved. By assuming a
"flexible" deck, analytical and test results of bending stresses
showed good agreement.
Charles Culver of Carnegie-Mellon University investigated
the limit states of curved girders. (4 ,S,G) The investigation
included studies of local buckling and lateral buckling of the
compression flange, web buckling, and combined bending and shear
failure.
Carnegie-Mellon conducted an extensive testing program.
It included 22 tests on eleven plate girders and 40 tests on eight
-3-

box girders. The test results and analytical results showed good
agreement in determining the bending strength beyond first yield
for compact sections and the combined bending and shear strength.
Test results also showed that due to curvature effects, ~he magnitude
of postbuckling shear strength was reduced from the predicted
strength using straight girder theory, and that the predicted
bending strength was conservative when considering lateral buckling
of the compression flange.
Based on the analytical and experimental studies made
primarily by CURT, tentative design specifications for horizontally
curved girders(7) were proposed in 1975. The tentative specification
was for allowable stress design considering only the elastic
behavior.
Washington University later restructured the tentative
specification into a load and resistance factor design criteria
type format. ( 3) However, the restructured design was still based
on elastic response onlv.
Research on the fatigue behavior of curved steel girders
was conducted at Lehigh University. (S) Analysis, design and testing
of five twin plate girder assemblies and three box girders were
carried out. Special analytical studies were conducted on the
influences on fatigue of stress range gradient, heat curving,
out-of-plane bending of webs, and diaphragm spacing. Five ultimate
strength tests(g) were also carried out to confirm overall failure
modes.
-4-

1.2 Objectives and Scope of Work.
First yield and fatigue criterion have been established
based on the research previously mentioned. However; the ultimate
strength of curved girders has not been defined, nor how the
geometry of the girder effects the ultimate strength. The American
Iron and Steel Institute is sponsoring a research project at Lehigh
University to investigate the ultimate strength of curved
girders. (lO) The purpose of the study is to develop a simple
analytical method to predict the load carrying capacity of curved
girders and develop a set of load factor design specifications based
on ultimate streQgth.
The work included in this project is the testing to
failure of two full sized curved plate girder assemblies and one
full sized curved steel box girder, the evaluation of test results
of these three tests and of the five ultimate strength test con-
ducted during the previous fatigue research project, develop an
analytical model for predicting the ultimate strength of curved
steel girders·, conduct a parametric study of curved girders using
the analytical model, and the formulation of new and rational load
factor design specifications.
The development of design specifications for and the
testing of horizontally curved plate girders is the subject of this
report. The previous work of Culver on local buckling, lateral
buckling, analysis and test results of curved plate girders is
analyzed and developed for application to ultimate strength analysis.
-5-

From this, the influence of geometry of the girder is examined.
The effects of the width-to~thickness ratio (b/t) of the flange,
the depth-to-thickness ratio (D/t ) of the web, the unbraced w
length of the flange to the width of the flange or slenderness
ratio (9.,/b), the.warping tobending stress ratio (R.,w/R.,b), and the
unbraced length of the flange to the radius of the girder or
curvature ratio (i/R) are studied. The te~ting ~~the curved plate girder assemblies is reported and future plans for the
testing of the other plate girder assembly as a proof test is
discussed.
-6-

2. LIMIT STATES
2.1 Web Shear Capacity
The major factors that influences the loa~ carrying
capacity of the web are the web slenderness ratio (D/~) and the
transverse stiffener spacing represented by the aspect ratio
(do/D), where Dis the depth and t the thickness of the web, and w
do is the stiffener spacing. To make the most effective use of
material, plate girder webs are very slender as compared to rolled
beams. Increasing the web slenderness will reduce the stiffness
of the web. Likewise, by increasing the aspect ratio, the stiffness
of the web is reduced. As the stiffness of the web decreases, its
resistance to buckling decreases and its lateral bending strength
decreases. Limiting the web slenderness ratio and transverse
stiffener spacing to sufficient levels will insure adequate per-
formance of the web.
The upper bound of the shear capacity is the plastic shear
load determined using Von Mise's yield condition for ~trength(ll)
given by
V = T D t p y w T = F /.ff y y
(1)
This capacity can be achieved only for stocky webs when buckling
is prevented.
-7-

For slender webs, web buckling will occur prior to
attaining the plastic shear capacity. Tests of straight plate
girders with slender webs and transverse stiffeners have shown that
considerable post-buckling strength can be developed. (ll) As a web
panel buckles, a diagonal tension field forms in the web panel
acting as a diagonal member of a truss with the transverse stiffen-
ers acting as vertical members of the truss in compression. The
ultimate shear capacity of a straight girder can be expressed as
the sum of the buckling and post-buckling strength. Basler(ll)
devel9ped the following shear capacity equations.
v u -= v p
where
T 1 - T /T [ cr + _1 cr y ] Ty 2 1 + (do/D) 2
T = T i when T i < 0.8 T cr cr cr - y
and T = 0.8 T T forT > 0.8 T cr y cri cri y
T = cri
k =
k =
2 k 1T E
12(1 -v2)(D/t ) 2 w
5.34 + 4.0 for (do/D) 2 do/D < 1.0
4.0 + 5.34 for do/D < 1.0 (do/D) 2
(2)
(3a)
(3b)
(4)
(Sa)
(Sb)
and E is.the modulus of elasticity, vis Poisson's ratio, and V p
and T are defined by Eq. (1). y
-8-

Tests of curved plate girders(4 ,S) with slender webs
and transverse stiffeners have shown that curved girders can also
develop post-buckling shear capacity. The buckling capacity of a
curved web panel has been determined to be greater than that of a
straight web. The post-buckling shear capacity of a curved web
panel has not been determined at this time. The overall effect of
curvature is to reduce the ultimate shear capacity of a curved web.
Test results have shown that straight girder theory, Eq. (2),
predicts. the shear capacity greater than measured results by about
10%.
Due to initial out-of-straightness of the web, out-of-plane
bending stresses develop in slender webs of straight plate
girders. (l2) Lateral bending stresses tend to be highest at trans
verse stiffeners. For very slender webs these stresses may be
sufficient to cause fatigue cracks to develop. By limiting the
depth-to-thickness of the web and the stiffener spacing, out-of
plane bending stresses can be limited to prevent fatigue cracking.
Curved girders have an inherent "out-of'straightness" due
to the curvature of the web. The measure of this curvature is the
stiffener spacing to radius ratio (do/R). In addition to the
curvature of the web, out-of-straightness due to fabrication must
also be considered in determining the bending stresses. By
modeling a web by a series of curved elements subjected to constant
bending moment and taking into account the curvature and out-of-
-9-

straightness of the web, out-of-plane bending stresses can be
determined. (l2)
(7 13) Tentative design specifications ' were developed to
sufficiently limit the calculated out-of-plane bending stresses and
insure the bending moment capacity of the girder is not appreciably
affected. Revised design specifications(S) were later developed
based on fatigue tests of transversely stiffened curved girders.
The requirement for curved girders is a reduction of the allowable
slenderness ratio of a straight girder, where the reduction is a
function of the curvature. The requirement for the slenderness
ratio is
D/t < 36500 [l _ 4 (do)] w- R Fy
(6)
where (do/R) is the measure of the curvature.
2.2 Local Buckling
The objective of designers is to obtain a certain level of
stress prior to local buckling of the compression flange. The
controlling parameter for local buckling is the width-to-thickness
ratio of the flange (b/t), Width-to-thickness requirements for
straight girders provides for attaining one of two stress levels,
the maximum stress just reaching the yield stress for non-compact
sections, and full yielding and rotational capacity for compact
sections.
-10-

Culver(l,l4) investigated the local buckling of curved
girder flanges using isotropic plate theory in the elastic range
and orthotropic plate theory in the inelastic range to determine
the governing characteristic differential equations. The flange
was modeled in two sections, the inner and outer half of the flange
as shown in Fig. 2. Although one-half of the flange will buckle
first, the rotational restraint of the other half of the flange was
conservatively ignored. The rotational restraint due to the web was
included in the model through the support conditions.
Normal stresses acting on the flange include bending,
warping, and residual stresses. Shear stresses were ignored, but
the maximum bending and warping stresses were conservatively
assumed to occur at the same location along the girder.
For the case of uniform stress acting on the flange
(bending stresses only) the characteristic equations result in a
set of homogeneous equations that can be solved to determine the
critical stress for a given b/t ratio, or the critical b/t ratio
for a given stress level. When the longitudinal stresses vary
across the width of the flange, the coefficients in the character
istic equations are not constant. For variable coefficients the
method of finite difference was used to determine the critical b/t
ratio for the state of stress. (l)
-11-

The general form of resulting of the b/t requirement is as
follows
b/t = k E (7)
where E is the modulus of elasticity, V is Poison's ratio, Fy is the
yield stress, and k is the buckling coefficient. Using experimen-
tally determined elastic and inelastic material properties, values
for the buckling coefficient were determined for various curvatures,
unbraced lengths, states of stress, boundary conditions, and
material properties. For uniform stress, bending only, the effect
of the curvature had little effect on k. For non-uniform stress,
warping and bending, the outside tip of the flange will yield first.
As a larger portion of the flange has yielded, the buckling coef-
ficient drops considerably. Yielding across only 20% of the flange
for example decreases k by over SO%.
Culver(!) determined width-to-thickness requirements by
using appropriate limiting values of the curvature, the rotational
restraint of the web, and the degree of lateral flange bending. The
resulting b/t requirements to insure full yielding across half of
the flange were similar to the requirements now used for straight
girders.
The effect of residual stress on local buckling varied due
to the different residual stress patterns resulting from different
fabrication methods. Test on non-compact sections verified the
predicted results for curved girders fabricated by welding flame-
-12-

cut curved plates and that the width-to-thickness requirements
determined are sufficient for heat curved girders also. For compact
flanges, test results show considerable post-yield strength in
bending could be developed.
The resulting width-to-thickness design requirements are
the same as those for straight girders.(]) Initial yield at the
flange tip is the maximum stress level that can be obtained for
non-compact sections,
32oot/FY < b/t ~ 44oo 1FY (Sa)
Full yielding of the flange can be obtained for compact sections if
adequate lateral bracing is provided,
b/t ~ 3200/fFY (8b)
where Fy is the yield strength.
2.3 Lateral Buckling
Culver and McManus( 2) developed a mathematical model to
determine the lateral buckling load and second-order effects for
horizontally curved girders. The derivation and summary of their
work are summarized in this section in three parts, Elastic Buckling,
Second-Order Effects, and Culver's Proposed Specification.
2.3.1 Elastic Buckling
The mathematical model used develops equilibrium equations
for a deformed structure in the elastic range. This may be
-13-

considered second-order theory. From the second-order equations,
linear departure equations from a reference state equilibrium
configuration were derived. Solution of the linear departure
equations will give the critical load for the structure.
Equilibrium equations for an element of a horizontally
curved plate girder are determined for the unloaded configuration,
state 0 of Fig. 3. The centroid of the element moves through
displacement u1 , v1 , w1 , and rotation 01 to the reference con
figuration state 1 of Fig. 3. In the reference configuration
the moment curvature relationships are derived. The girder is
assumed to retain its shape and is inextensible along the length.
The girder element is assumed to displace from the
reference configuration, state 1. by u2 , v2 , w2 , and 02 measured
in the x1 , Y1
, z1
axis to state 2 of Fig. 3. Equilibrium equations
and moment curvature relationships are derived for state 2 by
expressing the curvature and internal stress resultants as a sum
mation of those for the reference configuration, state 1, and the
departure from the reference configuration. By subtracting the
reference state equilibrium equations from the equilibrium equations
for state 2, equilibrium departure equations are obtained.
Similarly the moment curvature departure equations can be determined.
The departure equation is for the girder element moving from state
1 to state 2, or from an unbuckled position to a buckled position.
By assuming that the products of internal stress resultants
and displacement variables for the reference state can be neglected
-14-

and that the reference state curvature and twist can be taken as
equal to the unloaded values, a set of linear homogeneous differ-
ential equations are obtained. These equations can b~ used to
determine the critical values of the load parameters.
Culver considered a segment of a curved girder of length i
subjected to end moments and end bimoments as shown in Fig. 4. The
biomoment results from non-uniform torsion and is represented by
equal and opposite flange moments. The boundary conditions used
= U II 1
= v = 13 = 0 v 11 = M/EI and 0 11 + v 11 /R"= B/EI at 1 1 ' 1 x' 1 1 w
z1
= 0, i for first order theory.
First-order theory gives the internal stress resultants
for the reference configuration, state 1. Since the applied end
moments and bimoments are constant, the internal stress resultants
of the departure configurations, state 2, must equal those of the
reference configuration. From this the set of linear homogeneous
differential equations may be written in terms of the departure
state displacements (u2, v2, and 132) and their derivatives to
define the bu~kling equations for the segment of girder subjected
to end moments and bimoments.
To determine the accuracy of the determined governing
equations, the buckling load for a near straight girder (a = .0001)
was determined. The value of the critical moment was essentially
the same as published values for straight girders. The critical
moment was determined for several values of the central angle, of
the length-to-width of the flange ratio, of end bimoment, and of
-15-

moment gradient. The effect of curvature and end bimoment were
small and the effect of moment gradient was similar to that of
straight girders. The influence of the boundary conditions was
also considered. The critical moment for the case of fixed support
increases considerably for an increase in curvature.
(2) Culver determined that the critical Euler buckling loads
for a horizontally curved girder are essentially the same as those
for a corresponding straight girder with the same loads in the
elastic range. The second-order differential equations define the
criti~al loads for a curved girder, but not the second-order
deflections and the corresponding internal stress resultants.
2.3.2 Second-Order Effects
Culver(2) derived deflection amplification equations to
describe the bending of the girder from state 0 to state 2. By
adding the linearized equations of bending at state 1 to the depar-
ture equations, the girders bending response is fully described.
The deflection amplification problem leads to the same governing
equation as the departure analysis, but with non-homogeneous
boundary conditions. Solving the deflection amplification formula-
tion with the non-homogeneous boundary conditions does not give
values for the critical loads, bur rather the deflections for a
given load value. Load deflection curves obtained from the
solution of the deflection curves obtained from the solution of the
deflection curves obtained from the solution of the deflection
-16-

amplification formulation can be used to determine the internal
stress resultants.
First-order theory predicts values for vertical deflection
.:lnd rotation for a curved girder. ·rt does not predict the lateral
deflection that takes place. The deflection amplification formula-
tion takes into account second-order effects and gives values for
the lateral deflection. From the load deflection curve for
lateral deflection the internal moment about the Y axis can be
determined.
Figure 5 shows the distribution of the internal moments
and biomoment of a straight girder where M * = M I (M ) , M * = x x cr st y
M /(M ) · , and B* = B/t(M ) • The applied end biomoments were y cr st cr st
such that the ratio of warping to bending stresses at the end of the
girder, crw/crb' is- 0.5 (compression on outer edge of flange).
The internal moment about the y axis and the bimoment increase
significantly towards the center of the span.
Culver investigated the change of the displacements, twist,
internal moments and bimoment with respect to an increasing applied
end moment M*, where M* =..M/ (M ) t in the elastic range. The cr s
vertical deflection and internal moment about the X axis, M * agreed X
fairly well with linear theory for small curvatures. The lateral
deflection, twist, M * and B* grow linearly up to M* = 0.3, and _y
then grow rapidly in a non-linear fashion. The lateral displacement
and corresponding bending develop immediately upon loading. This
-17-

displacement and bending cause flange bending and results in
stresses larger than those predicted by linear theory. Figure 6
shows the increase in twist and bimoment over that predicted by
first-order theory, 01 and B1 , versus M*.
The computational effort involved in the deflection ampli-
fication formulation is very complicated. A simplified model was
developed to determine the internal lateral bending moment, M , from y
results obtained by linear theory. By assuming the twist and
vertical deflection in the departure state, state 2, can be approxi-
mated by the twist and vertical deflection predicted by first-order
linear theory, state 1, the internal lateral bending moment becomes
the project of the internal bending moment Mxl' and torque, Mzl'
predicted by linear theory about the y1
axis.
(9)
A comparison was made between results obtained from the
deflection amplification analysis and those from the simplified
model. For small values of M*, the agreement is good. At M* = 0.3,
the difference is less than 10% with the simplified model giving
the lower value. The reason for the lower value is because the
twist in the departure state increased non-linearly as M* increased,
and therefore, assuming the twist is the same in the reference and
departure state is not accurate.
The simplified model does not account for the large
increase in twist and bimoment due to second-order effects. A
-18-

amplification factor was derived by curve fitting Fig. 6 to
account for second-order effects. The amplification factor was
applied to the internal bimoment and the angle of twist, ~l' in
calculating the internal lateral bending moment, M • The following y
amplification factor was used.
Amplification Factor = 1 - 0.86 M* + 0.4 M* 2
1 - M* (10)
A comparison of results from lateral buckling tests with
the pred~cted stresses.from the deflection amplification analysis and
the simplified model was made to check the validity. The stresses
calculated· using the deflection amplification analysis and the
simplified model are almost identical. The measured bending
stresses are about 10% lower than the calculated values. The
warping stresses and radial bending stresses, those due to lateral
bending, were more difficult to predict due the undetermined re-
straint provided by the bracing during the tests. The predicted
warping and radial stresses do not compare well with test results
because the end restraint and resulting bimoment could not be
determined.
The deflection amplification and the simplified model
assumed that there was no cross-sectional deformation. Culver
accounted for the cross-sectional deformation by considering a
section of girder as shown in Fig. 7. Due-to bending thrust must
be resisted by a uniformly distributed radial load, crb A£/R.
Since the webs of curved plate girders are thin, they were assumed
-19-

not effective in providing resistance to cross-sectional deforma-
tion and could not provide the uniform radial load to resist the
flange thrust. Therefore, the flange was assumed to ~esist the load
by lateral bending. The flange was modeled as a fixed beam with
the uniform load crb Ar/R acting along the length.
2.3.3 Culver's Proposed Specification
The effect of curvature on lateral buckling for curved
plate girders is small provided local buckling is prevented. Due to
curvature, normal stresses develop faster for a given load than in
a corresponding straight girder. The level of stress must be known
to prevent a premature failure •
. Culver(2) c~nsidered a section of girder between lateral
bracing points, diaphragms, to determine the level of stress for
given values of end moment ·and bimoment. Figure 8 shows the distri-
bution of stresses along the length of the girder that were
considered. These stresses include bending stresses (crb) and
warping stresses (a ) due to the applied end moment, radial w
bending stresses (crR) due to the internal lateral bending moment,
and distortional stresses (crd).
For a given girder and a given ratio of applied end moment
to bimoment which defines crw/crb at the end of the span, the total
state.of stress can be defined in the elastic range. Linear theory,
the simplified model and the amplification factor are used to deter-
mine bending, warping and radial stresses. The fixed beam model
was used to determine the distortional stresses. Curves were -20-

developed that showed the end moment required to cause first yield.
First yield will occur at a tip of the compression fi.ange either
at the center or end of the span considered.
Figure 9 shows the relative contribution to the total stress
at the tip of the flange at first yield due to bending, warping and
radial bending stresses for straight girder (~/R = 1 x 10⁻⁶). No
distortion stresses develop in the straight girder. The amount of
radial bending stress becomes significant as ~/b increases. However,
this r~dial bending stress is not considered in straight girders.
A series of curves were developed to determine the ratio of
applied end moment to yield moment, M/My, where My = SFY. The
bottom curve in Fig. 9 which shows the amount of the total stress
due to bending is equivalent to the M/My curve for a straight
girder. The ratio is a function of Aw/Af, D/tw' tf/tw' ~/b, ~/R,
and crw/crw. In developing design specifications, Culver set Aw/Af =
1.0, D/tw = 150, and tf/tw = 3.0. The resulting curves are
dependent upon ~/b, ~/R, and fw/fb at the end of the span. The
inverse of the ratio M/My can be thought of as an amplification
factor for the bending stresses that will give the flange tip
stress due to bending, warping, lateral bending and distortion.
Culver developed an allowable stress design specification(l3)
that expressed the allowable stress in the form
p (11)
where Fbc is the allowable bending stress in a curved girder, Fbs is
-21-

the allowable bending stress in a straight girder and p is the
reduction factor that takes into account the increase in stresses
due to curvature, namely warping, radial, and distortional
stresses. By curve fitting the M/My curves, an equation for the
reduction factor was obtained. The equation was broken into two
parts, PB due to bending stresses (crw/crb = 0) and pw due to
warping stresses. The following equations were obtained
F = be Fbs p
Fbc = Fbs pb pw F
Fbs = 0.55 F [1 - 3 (i/b) 2 -L] y 1T2 E
pb 1
= (t/R) (t/b) 1 +
p- = 0.95 + (i/b)/[30 + 8000 (0.1- 1/R)2
] w 1 - 0.6 (fw/fb)
where (fw/fb) is the warping to bending stress ratio at the
diaphragm.
(11)
(12)
(13)
(14)
(15a)
(15b)
The smaller value obtained from Eqs. (15a) and (15b) should
be used. The maximum values for the variables are 0.1 for i/R, 25
The reduction factors were derived from curves that were
based on first yield of the girder. This is the same state of
stress that local buckling requirements for noncompact flanges were
-22-

derived. Therefore, Eqs. 14 through 15b are most applicable to
noncompact flanges.
The state of stress in the flange is allowed to reach full
yield for a compact flange. Since the flange tip yields first,
the inelastic response of the girder must be considered to attain
full yielding across the flange. To simplify the inelastic
response, it was assumed that yielding takes place at a single
cross-section and that the stiffness properties in the rest of the
girder remain constant. It was also assumed that failure would
occur whe~ the full cross-section has yielded. Due to some of the
conservative factors built into the elastic model, it was assumed
that the full web was effective in bending.
A series of curves were developed to determine the applied
end moment necessary to yield the entire cross-section considering
bending, warping, radial and deformational stresses and is expressed
by the ratio M/My• Again by curve-fitting, the following equations
were obtained for the reduction factor for compact sections to be
used in Eq. 11.
1
pb = 1 + (i/R - 0.01) 2 (i/b) [1 + ( /b/6]
P = 0.95 + 18 (0.1 - i/R)2
w
(fw/fb) [0.3- 0.1 (i/R)(i/b)]
F pb [1 - 3 (i/b) 2 _L_)
1T2 E
-23-
(16)
(17)

The product of the above equations shall not exceed 1.0, which
limits the overall capacity for an adequately braced girder to
The combined bending and warping stress calculated at the
support was limited to the maximum allowable stress. of 0.55 F • y
-24-

3. TESTING OF CURVED PLATE GIRDER ASSEMBLY
3.1 Description of Girder Assembly
The plate girder assembly tested consists of two 40 ft.
long plate girders curved to a radius of 120 ft. The two girders
are connected by five diaphragms, one at each end, at each quarter
point, and at the center. Schematic plan and cross-sectional
views are shown in Figs. 10 and 11. Table 1 summarizes the cross
section dimensions and the non-dimensional parameters discussed in
Chapter 2.
The girder assembly was designed for fatigue tests for the
previous research work on fatigue of curved girders done at Lehigh
University. Design details and fatigue test results are presented
in Refs. 15 and 16. Cracks due to the fatigue tests which could
influence the ultimate strength tests were repaired. Repairs con
sisted of welding small patch plates over the visible· cracks or
removing the crack tip. Other modifications-to the assembly from
the fatigue tests consisted of removing several intermediate web
stiffeners and adding several bearing stiffeners at the load and
support points of the ultimate strength tests.
The dimensions and parameters of the ultimate strength.
test of a similar curved plate girder assembly from the fatigue
research project are also presented in Table 1.
-25-

3.2 Test Procedure
Three tests were conducted on the curved plate girder
assembly. All tests were static loading of a simple supported
assembly. Figure 10 shows the load position for the three tests
(Tl, T2, T3). The tests were conducted in the 5,000,000 pound
Baldwin Universal Testing Machine located at Fritz Engineering
Laboratory, Lehigh University.
Roller supports as shown in Fig. 12 were placed at the
end of each plate girder to support the assembly. The supports
allowed for restraint free axial and transverse displacements and
flexural rotation of the assembly. Torsional restraint was
provided at each end as shown in Fig. 13. Load cells were used to
record the tie-down forces generated at the torsional restraint.
The concentrated load was applied to the center of the flange
through a series of bearing plates that permitted the top flange to
rotate with the girder assembly. However, the bearing plates
restricted the lateral displacement of the flange due to frictional
forces.
Test 1 was conducted in three phases. With the load at
the quarter point of the outside girder, see Fig. 14a, the load was
applied incrementally up to 161 kips at which point the load
deflection curve leveled off, and then was incrementally unloaded
to zero. Deflection and strain measurements were recorded at each
increment. The second phase was conducted in the same manner.
Three 4 x 4 x 3/8 in. angles were clamped to the compression flange
-26-

in the second quarter panel adjacent to the load at equal spacing,
see Fig. 14b. The maximum load in the second phase was 165 kips.
For the third phase, the angles were removed and matching transverse
web stiffeners were welded to the girder at the center of the second
quarter panel adjacent to the load, see Fig. 14c. The assembly
was then loaded to a maximum 161 kips and unloaded to complete the
third phase.
The outside girder was loaded at the other quarter point
for Test ·2. Deflection and strain measurements were recorded at
increasingly higher loads. A maximum load of 198 kips was attained.
Test 3 was conducted in the same manner with the load applied at the
quarter point of the inside girder. A maximum load of 198 kips was
attained.
3.3 Instrumentation
Electrical resistance strain gages were used to measure
live load strains. Strain gages were placed near the tips of the
flanges, on the diaphragm bracing and on the transverse web stiffeners.
stiffeners. Rosette strain gages were placed on the web. By
placing the strain gages at six cross-sections, the strain distri
bution along the length could be determined.
Vertical and horizontal displacement measurements were
recorded at a number of points along the girder. Ames dial gages
were used to take these measurements within .001 inch. Figure 15
-27-

shows the locations of the deflection dials for Test 1. Web
deflections at several cross-sections were also measured.
3.4 Test Results
Strain and deflection measurements to define the overall
behavior of the girder and the behavior of the compression flange in
the region of the load point will be presented here. The section of
the girder between the support and the load has a high shear load.
The section of the girder between the load and the center diaphragm
has a high moment and therefore is the most critical section of
the compression flange. The controlling limit state for all the
tests was the lateral deflection of the compression flange in this
critical section which developed into a lateral buckle.
The loading during the first two phases of Test 1 was
increased until the vertical and lateral deflection increased sub-
stantially for a small increase in load. Bracing for the second
phase was added to the compression flange to limit the lateral
deflection but little improvement was noticed. For the final phase
the girder was loaded past the ultimate load. In the region of the
maximum load, strain and deflection readings were taken after the
girder stabilized, that is when the load and deflection both
remained constant. In the post-ultimate load region, large increases
in deflection were recorded for small decreases in load.
The load versus vertical deflection of the girder
under the load point and horizontal displacement of the compression
-28-

flange midway between the load point and center diaphragm are shqwn
in Figs. 16 through 18 for the three phases of Test 1. The permanent
inelastic deformation from the previous tests are not included in
the deflection curves for the second and third phases. The
deflection of the supports represents the rigid body motion of the
girder. The plotted deflection is the difference between the
measured deflection and the rigid body motion.
The load versus vertical deflection curve for the first
phase is linear up to 100 kips. Thereafter, the curve becomes
non-linear due to residual stresses. Most of the residual stresses
were removed upon unloading. The vertical deflection curves for
the second and third phases remained linear to near the maximum
load •.
As the load approached the maximum load the lateral dis
placement of the compression flange increased extensively indicating
the formation of a lateral buckie in each phase of Test 1.
Figures 19 through 21 shows the lateral displacement along
the length of the compression and tension flange at 100 kips and at
maximum load for each phase of Test 1. The compression flange tends
to displace outward, or increase its curvature while the tension
flange tends to displace inward, or straighten out. The load point
does not move laterally and therefore restricts the movement of
the top flange. At 100 kips the lateral displacement of the top
fl~nge is very small and is not shown~
-29-
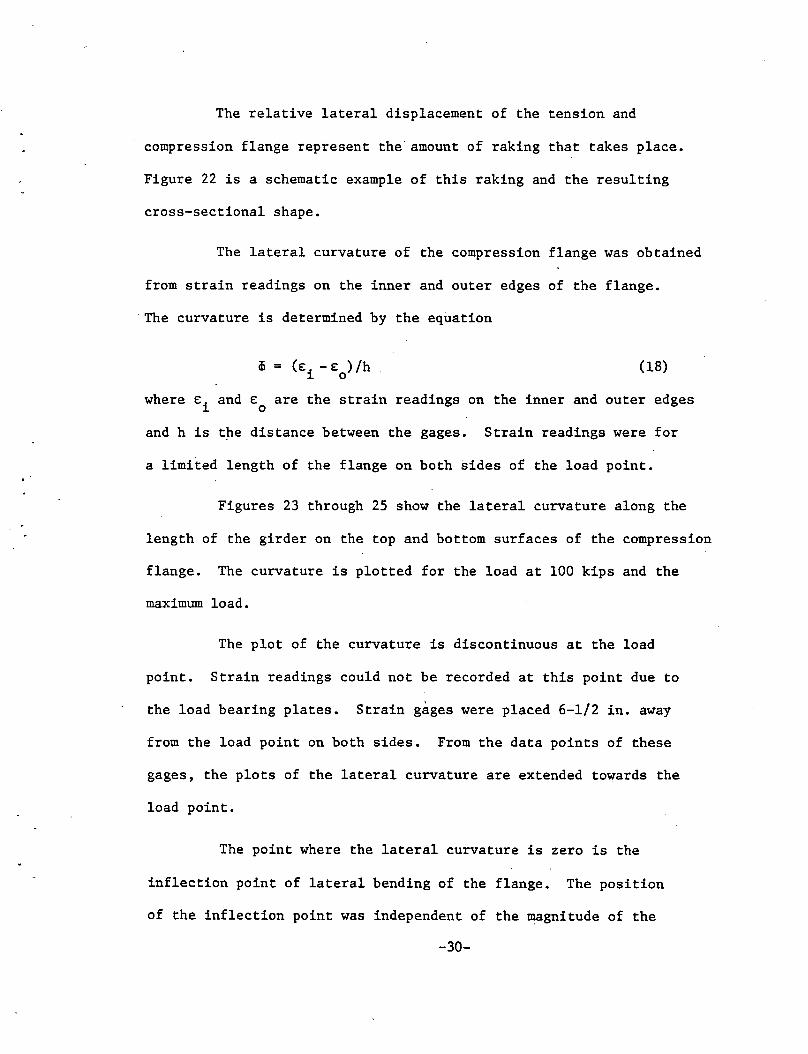
The relative lateral displacement of the tension and
compression flange represent the amount of raking that takes place.
Figure 22 is a schematic example of this raking and the resulting
cross-sectional shape.
The lateral curvature of the compression flange was obtained
from strain readings on the inner and outer edges of the flange.
The curvature is determined by the equation
iii = ( E i - E 0
) /h (18)
where Ei and E0
are the strain readings on the inner and outer edges
and h is the distance between the gages. Strain readings were for
a limited length of the flange on both sides of the load point • . . Figures 23 through 25 show the lateral curvature along the
length of the girder on the top and bottom surfaces of the compression
flange. The curvature is plotted for the load at 100 kips and the
maximum load.
The plot of the curvature is discontinuous at the load
point. Strain readings could not be recorded at this point due to
the load bearing plates. Strain gages were placed 6-1/2 in. away
from the load point on both sides. From the data points of these
gages, the plots of the lateral curvature are extended towards the
load point.
The point where the lateral curvature is zero is the
inflection point of lateral bending of the flange. The position
of the inflection point was independent of the magnitude of the
-30-

load. Table 2 lists the distance of the inflection point from the
load point (dip) as a ratio of the distance to the unbraced length
of the flange (t). If symmetry of the span is assumed, then another
inflection point would occur at the same distance from the center
diaphragm. The distance between the two inflection points would be
the effective length (teff) for lateral buckling. The ratio of the
effective length to unbraced length is also listed in Table 2.
Test 2 was conducted on the outside girder with the load at
the other quarter diaphragm. An angle was clamped from the outside
girder flange at the lateral buckle from Test 1 to the inside girder
to restrict horizontal deflections.
The load versus deflection curves for Test 2 are shown in
Fig. 26. The vertical deflection curve becomes non-linear near 100
kips due to residual stresses. Near the maximum load, a loud noise
was heard and the flange and web began to buckle laterally in the
span adjacent to the load. The bending stiffness of the girder
decreased rapidly with the formation of the lateral buckle. This
resulted in the leveling off of the load versus vertical deflection
curve. After the maximum load was attained, the load decreased
slowly as the deflection increased.
The results of Test 2 are very similar to those of Test 1.
The lateral displacement and lateral curvature of the flanges shown
in Figs. 27 and 28 have the same characteristics as those of Test 1.
Lateral curvature measurements were taken only for the top of the
compression flange.
-31-

The distance between the inflection points, the effective
length can be estimated directly by measurement of Fig. 28. The
accuracy of this measurement is not sufficient due to the limited
number gages used and the distance between the gages. Table 2
summarizes the position of the inflection points and the resulting
effective length.
Figure 29 shows the section of the girder adjacent to the
load point where the lateral buckle formed. The lateral buckle of
the flange extended into the web. The area where the white paint
has flaked off at the flange web intersection indicates that yielding
has taken place. Figure 30 shows a top view of the compression
flange in the region of the lateral buckle after unloading. Note
that the permanent deformation after failure is not very severe
and that the girder still has significant strength.
The inside girder was loaded at the quarter diaphragm for
Test 3. Figure 31 shows the load versus deflection curves. The
vertical deflection curve is much steeper than those of Tests 1
and 2. This shows the effect of load position which generated a
lower applied torsion as compared to loading the outside girder.
The lateral deflection of the compression and tension flange
are both outward as shown in Fig. 32. In Tests 1 and 2 the tension
flange tended to straighten out, but in Test 3 it deflected in a
similar manner to the compression flange. This is due to the
position of the load and the resulting torsion. The lateral curvature
-32-

for the compression flange is similar to those of Tests 1 and 2 as
shown in Fig. 33.
Yield lines were observed on the bottom of the compression
flange above the panels adjacent to the load point. The yield lines
were first observed at a load of 150 kips. At the ultimate load a
lateral buckle developed as in the previous tests.
-33~

4. EVALUATION OF TEST RESULTS AND MODIFICATION OF.ANALYSIS
4.1 Comparison of Theoretical and Test Results
The three limit states investigated by Culver were web
shear capacity, flange, local buckling and lateral buckling of the
compression flange. A testing program consisting of 22 tests on
curved plate girders was conducted to determine the accuracy of
the developed theory.
Straight girder theory was used to predict the web shear
capacity of curved girders~ Test results(4 ,S) indicate that
straight girder theory overestimates the strength of curved webs
by five to ten percent.
Local buckling requirements restricting the width-to-
thickness ratio (b/t) of the flange were determined by Culver to be
the same as for straight girders. (l) However, the state of stress
for curved girders is not the same as for straight girders. For
non-compact flanges, the maximum stress is the yield stress. For
straight girders, the maximum stress develops across the flange
width. The maximum stress in a curved girder develops at the edge
of the girder due to lateral flange bending stresses. It was
assumed that the distribution of stress was constant along the
length. However, the maximum stress may be very localized in
curved girders due to the distribution of these lateral flange
-34-

bending stresses along the length. For non-compact flanges, the
entire flange can be yielded.
Tests(4 , 5) show that considerable post-yield bending
strength can be developed for.girders with compact flanges if the
flange is adequately braced. For girders with non-compact flanges,
the post-yield bending strength is reduced due to the formation
of a local buckle. At the maximum width-to-thickness ratio, the
post-yield strength reduces to zero. The post-yield strength for
non-compact flanges has not been accounted for in the present (1982)
tenta~ive design specifications. ( 7)
Culver determined that the lateral buckling of a curved
girder is essentially the same as that of a straight girder.
However, due to second-order effects, additional stresses develop in
curved girders. Reduction factors were developed to account for
these stresses. The reduction factors were developed for non-
compact flanges based on first yield of the flange tip and for
compact flanges based on full plastification of the cross-section.
Test results show that the reduction factors are very
conservative. Table 3 lists the predicted and measured moment
(4 5 6) capacity from nine tests conducted by Culver ' ' , one earlier
test from Lehigh University(g), and the three tests reported here
in Chapter 3. The tests conducted at Lehigh were on two curved
girder assemblies. The yield moment calculated was for the entire
assembly for Test NPGl, and for one girder for Tests 1, 2 and 3.
For Test 3, the influence of the unloaded girder is greater than
-35~

in Tests 1 and 2, and therefore, the maximum load is much higher
than predicted.
The tentative design specifications(7) allows the use of
only the first yield reduction factors. This is extremely conserva
tive for girders with compact flanges. The measured strength was
more than twice the predicted strength using first yield for most
girders.
The average increase in the measured strength over the
predicted strength using first yield criterion for non-compact
sections and ultimate strength for compact sections is over 30%.
Culver(G) .suggests that the conservatism is in part due to the
neglectibn of the web and transverse stiffeners in determining
resisting deformation. Other reasons for the excessive conservatism
are that due to the continuous nature of the flange, the effective
lateral buckling length is reduced, that any redistribution of
stresses are ignored, and that radial bending stresses that are
neglected in straight girders are over-emphasized.
To obtain more accurate reduction factors, the above
considerations will be incorporated into Culver's deriVation to
develop new first yield and ultimate strength curve and obtain the
new reduction factors.
-36-

4.2 Effective Length
The critical Euler buckling load for a horizontally curved
girder is essentially the same as a corresponding straight girder
with the same loads in the elastic range. Due to residual stresses,
the girder becomes inelastic before the predicted stresses reach
yield. Culver assumed that the inelastic buckling behavior of
curved girders would also be the same as straight girders. The
inelastic buckling formula(l 7) is given by
F M = M [1 - 3 (~/b) 2 __y_
2 ]
cr y 1T E (18)
where (~/b) is the slenderness ratio of the flange.
The compression flange of a curved girder has to resist
lateral bending due to warping, radial bending, and distortion.
Because the flange is continuous.over the diaphragms, it acts like
a continuous beam over several supports.
The derivation of Eq. 18 assumed that laterally, the flange
was simply supported, with u" = 0 at both ends. For the case of
simple supports, the lateral buckling length is the distance between
supports. The effective buckling length of a curved flange is
reduced due to the continuous nature of the flange at the diaphragms.
Figure 34 shows the effective buckling length, the distance between
the inflection points, for three cases: simple supports, fixed
supports, and continuous at the diaphragms.
The lateral curvature diagrams presented in Chapter 3 verify
the continuous nature of the flange. Table 2 lists the effective
-37-

buckling length determined from lateral curvature diagrams. The
maximum effective length was 74% of unsupported length and the
average was 63%. ·For continuous beams subjected to a uniform
load(l8), the maximum distance between inflection points is 70%.
Considering the limited test data and the variability of
loading, the effective length is conservatively chosen as 80% of
the unsupported length. In order to keep the lateral buckling
formula the same, the benefit of having a shorter effective length
will be incorporated into the reduction factors.
4. 3 Reduction of Stresses·· at Diaphragms
Figure 8 shows the distribution of internal moments along
the length of the compression flange. The lateral bending moments
that develop due to bimomen·t, radial bending and distortion cause
the total moment diagram to have a maximum value at the center or end
of the flange span. The internal moment in the center region of the
span does not vary much. Near the end of the span by the diaphragm,
the moment has a high gradient. A short distance away from the
diaphragm, the moment is much less than at the diaphragm.
The stress distribution along the width of the flange is
constant for bending stresses and varies· linearly for warping, radial
bending and distortional stresses. These stresses cause the maximum
flange stress to occur at the edge of the flange as shown in Fig. 1.
Hence, when the maximum stress occurs at the diaphragm, it
is at the flange tip and is localized. Along the length the stress -38-

drops off quickly due to the decrease in lateral moment, and across
the width of the flange, the stress reduces quickly according to
the stress distribution pattern.
The first yield criterion becomes very conservative if the
maximum stress occurs at the diaphragm. If a large portion instead
of the total calculated warping and distortional stresses are used
for the flange at first yield, the condition is equivalent to that
a small width of the flange will be allowed to yield for a very
short length of the girder.
The ultimate strength . criterion is also conservative if
the masimum stress occurs at the diaphragm because the redistri-
bution of stresses that takes place is ignored. Reducing the
calculated warping and distortional stresses would allow more
yielding of cross-sections for a short length of the span.
Both the AASHTO Standard Specification for Highway
Bridges(l7) and the AISC Manual of Steel Construction(lS) allow a
reduction in the calculated stresses at the supports of continuous
beams. If the flange is thought of as a continuous beam and the
diaphragms are the supports, the lateral bending stresses should be
reduced at the diaphragms.
The distribution of lateral moment is assumed to come to a
sharp peak at the diaphragm. Due to the width of the diaphragm,·
the sharp peak in the moment diagram is rounded off, reducing the
calculated stresses at the diaphragms.
-39-

The calculated warping and distortional stresses shall be
reduced 20% in developing more accurate reduction factors. This is
the same reductioa permitted by ASSHTO(ll) at supports of continuous
girders. For the first yield criterion, a 20% reduction corresponds
to only 10% of the flange width yielding over a very short length
of the span. Local buckling requirements will not be effected
because the yield zone is very small and the diaphragm restrains the
flange.
4.4 Distortional Stresses
Culver assumed that the web and the transverse web
stiffeners were not effective in restraining the flanges from a
relative lateral displacement, raking, as shown in Fig. 22.
Ignoring the web and stiffeners, the distributed load in Fig. 7 must
be resisted by the flange alone. This approach is conservative and
leads to high calculated distortional stresses.
The restraining effect of the web is to be included in the
development of more rational reduction factors. The stiffness of
the web was determined by the use of finite differences. The web
was assumed fixed at the diaphragms and along the bottom flange, and
rotationally restrained, but free to move laterally along the top
flange. It was assumed that the distance between diaphragms was
2.5 .times the depth of the web. The stiffness of the web was
determined for a uniformly distributed transverse load, and is given
by
-40-

K = 2.2 E/(D/t ) 3 web w (19)
The stiffness of the flange subjected to a uniformly
distributed load with the flange fixed at both ends is given by
K = 38.4 __ E __ _
fl (D/t )(~/b)3 w
(20)
Because the stiffness of the flange and web were both determined for
the same type of load, the stiffness of the web flange system is
the sum of the individual stiffnesses.
The deformational stresses in the flange can be determined
by multiplying the calculated stresses considering the flange only by
the ratio of the stiffness of the flange to the stiffness of the
flange web system. The ratio is given by
.17.4/(~/b) 3
= --------~~~------~ 17.4/(~/b) 3 + 1/(D/t ) 2
w
(21)
This approach is also conservative for high web slenderness
ratios because the effect of the transverse stiffeners is not con-
sidered. The test results presented in Chapter 3 and those reported
(4 5 6) by Culver ' ' indicate that the transverse stiffeners are
effective in reducing distortion of the cross-section and therefore,
the distortional stresses.
-41-

4.5 Radial Bending Stresses
The reduction factors convert the load required to produce
a certain state of stress in a straight girder to the load required
to produce the same state of stress in a curved girder. Therefore,
the reduction factors should account for the difference in stresses
in a curved girder as compared to a straight girder with the same
load.
Radial bending stresses develop in both straight and curved
girders. Figure 9 shows the percentage of the maximum stress used
to resist radial bending. The reduction factors should account for
the difference in radial bending stresses that develop in straight
and curved girders. By subtracting the radial bending stresses in
an equivalent straight girder from the curved girder values, the
difference can be used in the derivation of more accurate reduction
factors.
-42-

.. 5 ~ ·:sUMMARY
Culver investigated the web shear capacity, the local
buckling of the compression flange, and the lateral buckling of the
compression flange of horizontally curved plate girders. The web
shear capacity was approximated by that of a straight girder. Test
results indicate that straight girder theory is unconservative for
curved girders. The local buckling and lateral buckling requirements
were determined to be essentially the same as straight girders. Test
. . (4 5 6) results reported in Chapter 3 and by Culver ' ' substantiate these
findings~
Additional stresses develop in curved girders due to
curvature. These stresses .include radial bending stresses, distor-
tional stresses and increased warping stresses due to second order
effects. Culver developed reduction factors to account for the
additional stresses. Test results have shown that these reduction
factors are overly conservative.
To develop more accurate reduction factors, modifications
to the development of the present reduction factors were obtained.
Four modifications were investigated to be included in the develop-
ment of new reduction factors. The modifications are:
1. The effective buckling length was observed in tests
to be less than the length between the diaphragms.
-43-

Measurements of the lateral cu~ature in the flange
led to the selection of using 0.80 of the length as
the effective length.
2. The warping and distortional stresses at the diaphragm
are very localized across the flange and along the
length. By allowing a small amount of yielding for
first yield criterion and some redistribution for
the ultimate strength criterion, 80% of the calculated
warping and distortional at the flange tip shall
be used for the modified approach.
3. The web and the transverse stiffeners share in
restraining the girder from distorting along with
the flange. The stiffness of the web was determined
and combined with the stiffness of flange to resist the
distortional load.
4. The reduction factor·converts a curved girder to an
equivalent straight girder. Therefore, the
reduction factors should account for the difference
between straight and curved girders. By subtracting
the radial bending stresses in a straight girder
from those of a curved girder, the radial bending
stresses are reduced and the resulting reduction
factors are more rational.
-44-

These modifications are to be incorporated into Culver's
procedure(2) for obtaining first yield and ultimate strength curves.
By curve fitting these curves, simplified and more accurate reduction
factors will be obtained~
-45-

TABLE 1· CROSS~SECTION DIMENSIONS AND PARAMETERS
Previous Test 1 Test 2 · Test 3 Test
Dimensions:
Span Length (1) 40 ft 40 40 40
Unbraced Length (R,) 10.2 ft 10.2 9.8 10.0
Radius (R) 122.5 ft 122.5 117.5 12o.'o
Web Depth (D) 58 in 58 58 52
Web Thickness (t ) w 5/16 in 5/16 3/8 3/8, 9/32
Stiffener Spacing (do) ~ 122 in 39 61 120
Flange Width (b) 10 in 10 8 12
Flange Thickness (t) 3/4 in 3/4 1/2 1
Parameters:
D/t w
186 186 155 144, 192
do/D 2.10 0.67 1.05 2.31
b/t 13.3 13.3 16.0 12.0
i/R 0.083 0.083 0.083 0.083
i/b 12.2 12.2 14.7 10.0
-46-

TABLE 2 LOCATION· OF: INFLECTION POINTS AND THE EFFECTIVE
.LENGTH
Flange Side:
Test 1
First Phase
Second Phase
Third Phase
Test 2
Test 3
Average
Top
0.17
0.17
0.17.
0.28
0.22
Bottom
0.14
0.13
0.13
0.23
Top
0.65
0.66
0.66
0.44
0.56
diP = distance from diaphragm to inflection point.
~ = distance between diaphragms
~eff = distance between inflection points
-47-
Bottom
0.72
0.74
0.74
0.54
0.63

. . .. . .
TABLE 3 COMPARISON OF PREDICTED AND MEASURED
Girder - Test M b/t R,/R R-/b crw/crb ** M max
M M max M y cr ·· cr
* First Ultimate First Ultimate
Culver's Tests kiE-in Yield Strength kiE-in Yield Strength
C8-2 20.0 0.05 8.0 0.15 '2420 1460 2241 1.42
· Ll-A 15.4 0.10 10.0 -.40 1950 696 1618 1830. 2.63 1.13
L2-A . 15:4 0.10 10.0 -.40 .1976 704 1639 1830 2.60 1.12
L2-B 15.4 0.10 10.0 0.24 1976 1066 1386 1833 1. 72 1.32
I L2-C 15.4 0.10 10.0 -.02 1976 952 1446 1944 2.04 1.31 .p. 00 Gl-3 7.8 0.05 7.7 -.24 1387 786 946 1636 2.08 1.20 I
Gl-4 7.8 0.05 7.7 -.24 1387 786 946 1675 2.13 1.23
Gl-5 7.8 0.10 15.3 -.50 1387 386 968 1377 3.74 1.42
G0-8 15.8 0.10 10.6 -.50 2152 705 1828 2120 3.00 1.16
Lehigh Tests
NPGl 12.0 0.08· 10.0 -.22 35148 15578 29985 44880 2.88 1.50
Test 1 13.0 0.08 12.2 -.30 21630 7363 18207 19800 2.69 1.09
Test 2 13.0 0.08 12.2 -.30 15530 4720 11985 23760, 5.03 1.98
Average 2. 71 1.31
* (4,5,6)
** First yield computed using Eqs. 14 and 15. Ultimate strength computed using Eqs. 16 and 17

Bending Warping
(a) NORMAL STRESSES
Distortional Radial Bending
St. Venant Torsion
1-:::: ~ ~--, ~,
~ --H ~~
t ~ H H
1~-:_-,_-----~ot... L,-::::::=--~ ........... 1
·Bending
Non-Uniform Torsion
(b) SHEARING STRESSES
FIG. 1 - STRESSES ON CROSS SECTION
-49-

FIG 2 - LOCAL BUCKLING MODEL
-50-

y 0
FIG 3 - DISPLACEMENT COMPONENTS
-51-
! . I

FIG_. 4 - CURVED PLATE GIRDER WITH END LOADS
-52-

M* X
M* y
B*
1.0 r-
~--------------~'--------------~ 0.0
0.2
0.1
o.o
0.03
0.02
0.01
o.o
0.5
Z/L
0.5
Z/L
0.5
Z/L
l/R=0.3, l/b=lS, D/b=3, tf/tw=3
D/t =165, f /fb=-0.5 w w FIG. 5 - INTERNAL STRESS RESULTANTS
-53-
1.0
1.0
1.0

1.0
.. 0.8
0.6
M* .
0.4
0.2 l/b =15, D/b=3, tf/tw=3
D/t =165 w
0.0~--------~------~~------~--------~---
1.0 2.0 3.0 4.0
Second-Order First-Order
FIG. 6 - TWIST AND BIMOMENT RATIO
-54-
5.0

I •
aw~ ----a~~ --~
FIG. 7 - CROSS SECTION DISTORTIONAL LOADING
-55-

M X
B
(due to M)
B
(due to end B)
M y
(due to distortion)
FIG. 8 - DISTRIBUTION OF INTERNAL MOMENTS
-56-

100
% F .y
80
60
40
20
0 10 20
!/b
RADIAL
BENDING
WARPING
BENDING
30 40
FIG. 9 - CONTRIBUTION OF EFFECTS - STRAIGHT GIRDER
-57-

TEST 3 .
Load Point
R = 120'
I I
A
I I I
Load Point
TEST 1 Load Point
see FIG. 11
FIG. 10 - SCHEMATIC PLAN OF GIRDER ASSEMBLY
-58-

60"
I I -
t~ ~ l. 3 X 3 X 3/8" 1/2" 8"
FIG. 11 - CROSS SECTIONAL VIEW
-59-
1...----;1-...Llh---L,l
-~~t 10" 3/4"

FIG. 12 - ROLLER SUPPORT
-60-
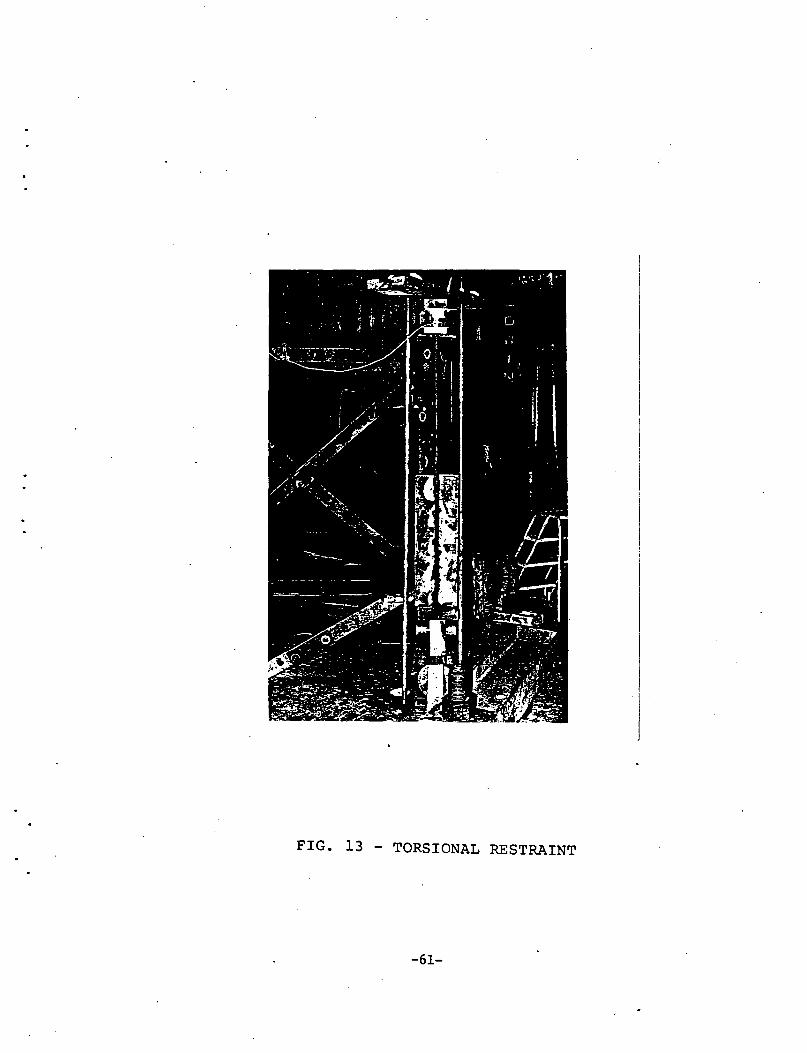
FIG. 13 - TORSIONAL RESTRAINT
-61-

(a) 'First 'Phase
--=t=++-t=+=-1
: II II \ II II \1
" " ll
===t= * II'· II l' = + +-1-1-:..
(b) Second -pnase
I --f
(c) 'third 'Phase
-62-

-- --
-®
-®
- -® -
-- --TOP BOTTOM.
~ Horizontai Dial ~ Vertical Dial
FIG. 15 - LOCATION OF DEFLECTION DIALS
-63-

200
150
LOAD
(kips)
100
50
,-----I I , I I I
--Horizontal
-Vertical
---------~
0.5 1.0 1.5 2.0 DEFLECTION (inches)
FIG. 16 - LOAD VS DEFLECTION, TEST 1, PHASE 1
-64-

200
150
LOAD
(kips)
100
50
I
I I I I
I I I
,-
--Horizon tal
-Vertical
---
0 ~------~--------~--------~------_. __ __ 0.5 1.0 1.5 2.0
DEFLECTION (inches)
FIG. 17 - LOAD VS DEFLECTION, TEST 1, PHASE 2
-65-

200
150
LOAD
(kips)
100
50
I I I I I I
I
,-------1
·I I
I
0.5 1.0
--Horizontal
-Vertical
1.5 2.0
DEFLECTION (inches)
FIG. 18 - LOAD VS DEFLECTION, TEST 1, PHASE 3
-66-

161 kips
-____ ___.:..---
Compression Flange
-------t./_1_61 k . 100 k ::::=:z;
Tension Flange
Maximum Load
FIG. 19 - LATERAL DISPLACEMENT, TEST 1, PHASE 1
-67-

= />'==--:::::;::::>" 161 kips
Compression Flange
/165 k 100 k /
2
Tension Flange
;--- <Tension
<::::::::::: __ ~-ion Flange
Maximum Load .
Flange
FtG. 20 - LATERAL DISPLACEMENT, TEST 1 , PHASE 2
-.68-
-

~-=---~--/~~---~~~~~---------------------161 kips
Compression Flange
~-----..::::::~/lOOk
Tension Flange
·:;;;;Tension Flange
crn;;;ession Flange
Maximum Load
FIG. 21 - LATERAL DISPLACEMENT, TEST 1, PHASE 3
-69-

I
!; II
/; It
II II
· =r, --~ II
/I I/
II II
lf~rake .I
r-- _jJ- --r.-.....1.1...--., '-------~-:.'--__,j
FIG. 22 - RAKING DISPLACEMENT, EXAMPLE
-70-

- Top Surface
-- Bottom Surface
II I II I
/ I I
~------......
.~ --------~ /
/ \
161 kips
....-:: ---------
FIG. 23 -LATERAL CURVATURE, TEST 1, PHASE 1
-71-

-Top Surface
--Bottom Surface
II II I I I
/ ~-------..... ------, ~ / -----I " kips
" /"
/</1 I / , I
FIG. 24 - LATERAL CURVATURE, TEST 1, PHASE 2
-72-

- Top Surface
--Bottom Surface
II I II I ~ , ______
/ ..... /
~ ------/ -----
FIG. 25 -LATERAL CURVATURE, TEST 1, PHASE 3
~73-

200
150 I
/ LOAD I
I (kips) I
I 100 I
--Horizontal
-Vertical
""' .... -;-I
/ /
/
0.5 1.0 1.5 2.0
DEFLECTION (inches)
FIG. 26 - LOAD VS DEFLECTION, TEST 2
-74-

- -Compression Flange
160 k ' s
198 k
' - ----- ==
Tension Flange
*=::::::::::::::=:/=C:o:m:p:r:e:s:si=o=n=F::;:a::n:(e::::~~·=~-=-Tension Flange
Maximum Load
FIG. 27 - LATERAL DISPLACEMENT, TEST 2
-75-

II I I I I II I
/
I I .
\-198 kips
FIG. 28 - LATERAL CURVATURE, TEST 2 ·
-76-

FIG. 29 - WEB PANEL AND COMPRESSION FLANGE, POST-FAILURE
-77-

-i·--·-
FIG. 30 - COMPRESSION FLANGE TOP VIEW, POST-FAILURE
-78-

200
150
LOAD
(kips)
100
50
I I
I I
I I
- ~ ./ /
I
--Horizontal
-Vertical
---------
I I I I
I
0.5 1.0 1.5 2.0
DEFLECTION (inches)
FIG. 31 - LOAD VS DEFLECTION, TEST 3
-79-

- -~---------==<:98 kips
Compression Flange
- -
Tension Flange
-~ ~::::::~==~====~-~~ ?
2
· Tension Flange Compression Fl.
-
Maximum Load
FIG. 32 - LATERAL DISPLACEMENT, TEST 3
-80-

II i I II I ----- --------
185 .kips
FIG. 33 - LATERAL CURVATURE, TEST 3
-81-

---.,.....- --- ...........
•
Simple Support
---.-
Fixed Support
--
Continuous Support
FIG. 34 - BUCKLING SHAPES: SIMPLE, FIXED, CONTINUOUS
-82-

REFERENCES
1. Culver, C. and Nasit, G. INSTABILITY OF HORIZONTALLY CURVED MEMBERS - FLANGE BUCKLING STUDIES, Carnegie-Mellon University Report submitted to the Pennsylvania-Department of Transportation, November 1969.
2. Culver, C. and MCManus, P. INSTABILITY OF HORIZONTALLY CURVED MEMBERS - LATERAL BUCKLING OF CURVED PLATE GIRDERS, Carnegie-Mellon University Report submitted to Pennsylvania .Department of Transportation, September 1971.
3. Galambos, T. V. and Stegmann, T. H. LOAD FACTOR DES-IGN CRITERIA FOR CURVED STEEL GIRDERS OF OPEN SECTION, Department of Civil Engineering,· Washington University, Research Report No. 43,
. April 1976 •. ·
4. Mozer, J. and Culver, C. HO~IZONTALLY CURVED HIGHWAY BRIDGES - STABILITY OF CURVED PLATE GIRDERS (Report No. Pl), Carnegie-Mellon University Report-submitted to CURT, September 1970.
5. Mozer, J., Ohlson, R. and Culver, C. HORIZONTALLY CURVED HIGHWAY BRIDGES - STABILITY OF CURVED PLATE GIRDERS (Report No. P2)., Carnegie-Mellon University Report submitted to CURT, September 1971.
6 •. Cook, J., Mozer, J. and Culver, C.· HORIZONTALLY CURVED HIGHWAY BRIDGES ~ STABILITY OF CURVED PLATE GIRDERS (Report No. P3) , Carnegie-Mellon University Report submitted to CURT, July 1972.
7. TENTATIVE DESIGN SPECIFICATIONS FOR HORIZONTALLY CURVED HIGHWAY BRIDGES, Prepared for Department of Transportation,
Federal Highway Administration, March 1975.
8. Daniels, J. H., Fisher~ J. W. and Yen, B. T. FATIGUE OF CURVED STEEL BRIDGE ELEMENTS - DESIGN RECOMMENDATIONS FOR FATIGUE OF CURVED PLATE GIRDER AND BOX GIRDER BRIDGES~ Federal Highway Administration Report No. FNHA-RD-79-138, April 1980.
-83-

REFERENCES (continued)
9. Daniels~ J. H. FATIGUE OF CURVED STEEL BRIDGE ELEMENTS - ULTIMATE STRENGTH TESTS -OF HORIZONTALLY CURVED PLATE AND BOX GIRDERS, U. S. Department of Transportation Report No. DOT-FH-11-8198.7 7 June 1978.
10. Daniels, J. H. and Yen, B. T. ULTIMATE STRENGTH OF. HORIZONTALLY CURVED STEEL BRIDGE GIRDERS - PRELIMINARY PROPOSAL TO AISI, Fritz Engineering Laboratory, Lehigh University, Bethlehem, PA., August 1977.
11. Basler, K. STRENGTH OF PLATE GIRDERS IN SHEAR, Journal of the Structural Division, ASCE, Vol. 87, No. ST7, October 1961.
12.· Culver, C., Dym, C. and Brogan, D. BENDING BEHAVIOR OF CYLINDRICAL WEB PANELS, Journal of the Structural Division, ASCE, Vol. 98, No. STlO, October 1972.
13. Culver, C. DESIGN RECOMMENDATION FOR CURVED HIGHWAY BRIDGES, Carnegie-Mellon University Report submi~ted to Pennsylvania Department of Transportation, June 1972.
14. Culver, C. and Frampton, R. LOCAL INSTABILITY OF HORIZONTALLY CURVED MEMBERS, Journal of the Structural Division, ASCE, Vol. 96, No. ST2, February 1970.
15. Daniels, J. H., Zettlemoyer, N., Abraham, D. and Ba tcheler, R. p •
ANALYSIS AND DESIGN OF PLATE GIRDER AND BOX GIRDER TEST ASSEMBLIES, Fritz Engineering Laboratory Report No. 398.1, Lehigh University, October ·1976.
16 •. Daniels, J. H. and Herbein, W. C. FATIGUE TESTS OF CURVED PLATE GIRDER ASSEMBLIES, Fritz . Engineering Laborato~y, Report No. 398.3, Lehigh Univ~rsity, May 1977.
-84-

•
17.
18.
19.
REFERENCES (continued)
STANDARD SPECIFICATIONS FOR HIGHWAY BRIDGES, Twe~fth Edition, American Association of State Highway Officials, Washington, D. C., 1977.
MANUAL OF STEEL CONSTRUCTION, Eighth Edition, American Institute of SteelConstruction, Chicago, Illinois, 1980.
Dabrowski, R. CURVED THIN-WALLED: -GIRDERS - THEORY AND ANALYSIS, Translated by C. V. Amerongen~ Cement and Concrete Association, New York, 1968.
-85-

B
B*
D
E
I X
Kfl
K . web
L
M, ~
(Mer) st
M,M,M X . y Z
M * M * X ' y
M*
.. NOMENCLATURE
Area of the flange
Area of the web
Bimoment
B/L (M ) cr st
Depth of web
Modulus of elasticity
Allowable bending stress in curved beam
Allowable bending stress in straight beam
Yield stress
Warping constant
Moment of inertia about X axis
Lateral bending stiffness of flange
Lateral bending stiffness of web
Span length
Applied moment and flange moment
Critical moment for straight beam
Internal moment about x,y and z axis
M/(M ) cr st
Yield moment
-86-

NOMENCLATURE (continued)
s Elastic section modulus
R Radius of curvature
v u Ultimate shear capacity
v p Plastic shear capacity
X, Y, z Orthoginal curvilinear coordinates
b Width of flange
d 0
Transverse stiffener spacing
fb Bending stress
f w Warping stress
h • Distance between strain gages
k Buckling coefficient
i Unsupported length, distance between diaphragms
ieff Effective unsupported length
t Thickness of flange
t Thickness of web w
u, v, w Displacements in x, y and z directions
(l Central angle
.1R Raking deflection
e: Strain reading
O'b Bending stress
• (J
d Distortional stress
(J
R Radial bending stress
(J
w Warping stress
-87-

NOMENCLATURE (continued)
.:
~ Curvature
<P Rotation about z axis
T Shear stress
T Buckling shear stress cr
T Shear yield stress y
v Poisson's _·ratio
p Curvature reduction factor
pb Curvature reduction factor - bending stresses
pw Curvature reduction factor - Warping stresses
•
-88-