Streamlined Life Cycle Assessment Study - OCW...
23
Environmental Resources Management Eaton House, Wallbrook Court, North Hinksey Lane Oxford OX2 0QS Telephone 01865 384800 Facsimile 01865 384848 Email [email protected] http://www.ermuk.com REPORT Study Prepared for Airdri Ltd. and Bobrick Washroom Equipment Inc. Streamlined Life Cycle Assessment Study August 2001
-
Upload
truongphuc -
Category
Documents
-
view
213 -
download
0
Transcript of Streamlined Life Cycle Assessment Study - OCW...
Environmental Resources ManagementEaton House, Wallbrook Court,
North Hinksey LaneOxford OX2 0QS
Telephone 01865 384800Facsimile 01865 384848Email [email protected]://www.ermuk.com
REPORT
Study Prepared for Airdri Ltd. and BobrickWashroom Equipment Inc.
Streamlined Life Cycle AssessmentStudy
August 2001
CONTENTS
1 INTRODUCTION 1
1.1 INTRODUCING LCA 11.2 THE JUSTIFICATION FOR USING LCA 2
2 GOAL AND SCOPE OF THE LIFE CYCLE ASSESSMENT 3
2.1 THE SYSTEM BOUNDARIES 32.2 DRIER SYSTEM 52.3 PAPER TOWEL SYSTEM 52.4 DATA REQUIREMENTS 62.5 FUNCTIONAL UNIT 7
3 ENVIRONMENTAL FOOTPRINT OF THE TWO PRODUCT SYSTEMS 8
3.1 LIFE CYCLE INVENTORY 83.2 IMPACT ASSESSMENT METHOD 83.3 IMPACT ASSESSMENT RESULTS 103.4 VALUATION 143.5 SENSITIVITY ANALYSIS 16
4 CONCLUSIONS 18
ANNEX A SUMMARY INVENTORY
ENVIRONMENTAL RESOURCES MANAGEMENT AIRDRI/BOBRICK
1
1 INTRODUCTION
This report summarises the results of the Streamlined Life Cycle Assessment(LCA) Study conducted for Airdri Ltd. and Bobrick Washroom EquipmentInc. by ERM.
The purpose of the study is to provide a comparison of the environmentalfootprints for two hand drying methods: paper towels and an electric hand airdrier as manufactured by Airdri and supplied by Bobrick. The environmentalprofile was generated by identifying and quantifying the 'cradle-to-grave'environmental consequences associated with the two product systems.
The drier system involves the manufacture and supply of the drier (pluspackaging), the consumption of electricity for the drying of hands and thedisposal of the drier at the end of its useful life.
The paper towel approach to drying hands requires the manufacture, supplyand disposal (at the end of their useful life) of:• a towel dispenser (plus packaging);• a bin for disposal of towels (plus packaging);• bags for use in the bin (plus packaging); and• paper towels (plus packaging).
The study quantifies the environmental footprint resulting from theproduction of materials and energy, the disposal of wastes and transport ofmaterials for the two product systems.
The models that have been constructed can be used:• to provide an indication as to which system places less burden on the
environment;• as a scoping study for further more detailed assessment of the products.
1.1 INTRODUCING LCA
Life Cycle Assessment (LCA) is a standardised technique for measuring andcomparing the environmental consequences of providing, using anddisposing of a product or a service.
LCAs have a number of interrelated stages: Goal Definition and Scoping,Inventory Analysis (LCI), Impact Assessment and Interpretation.
LCA users attempt to trace back to the environment all of the resourcesconsumed at all stages in the manufacture, use and disposal of products. Themethodology considers all of the emissions to air, water and land at each ofthese stages. In combination, data on each stage provide an inventory ofexchanges of substances between the product and the environment associated
ENVIRONMENTAL RESOURCES MANAGEMENT AIRDRI/BOBRICK
2
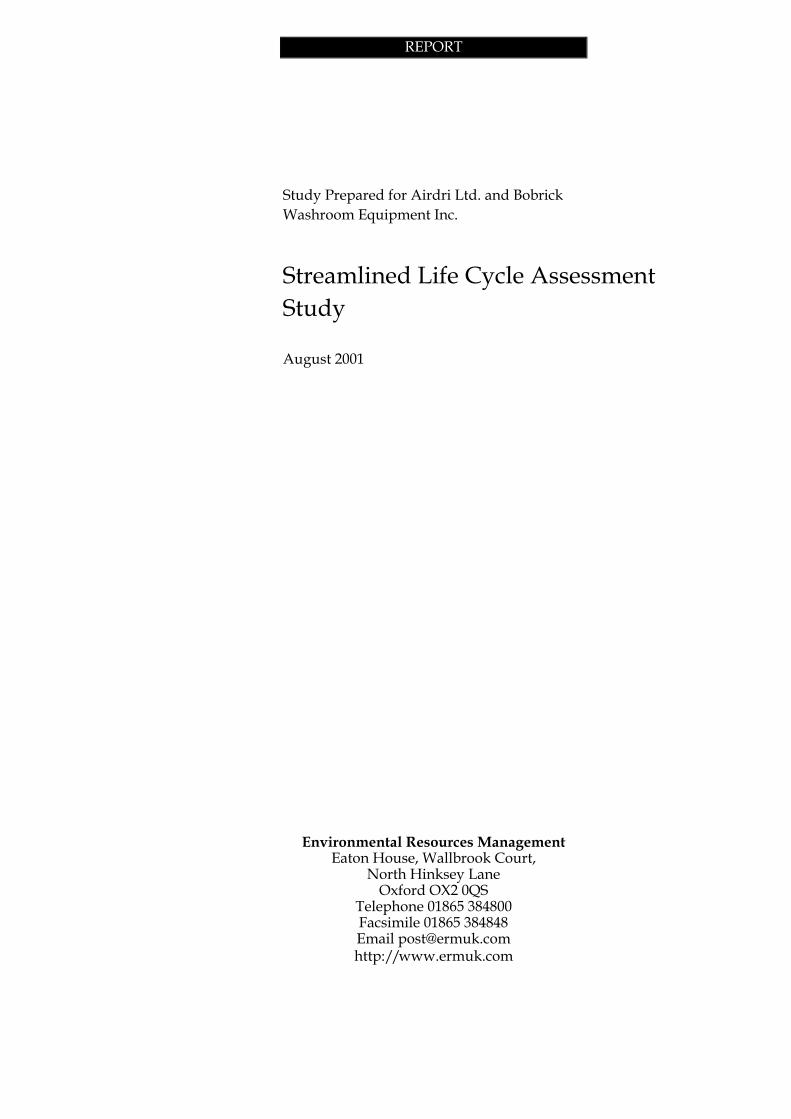
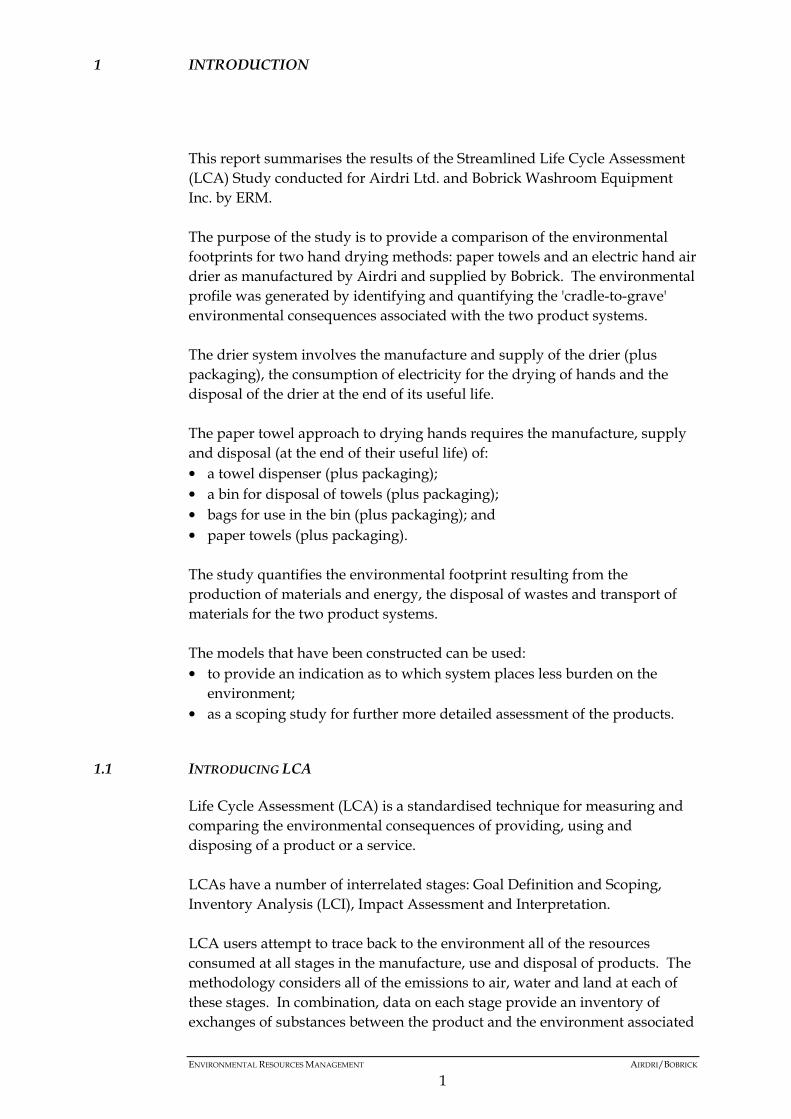
with the entire life cycle of the product, from the 'cradle to the grave'. A flowchart detailing the LCA process is shown in Figure 1.1.
Figure 1.1 LCA process
Impact Assessment is a technical, quantitative process to assess the effects ofthe environmental burdens identified in the inventory analysis. ImpactAssessment consists of three steps; classification, characterisation andvaluation.
At the Impact Assessment stage of an LCA a calculation is made of thepotential contribution made by each of the environmental exchanges in theInventory to important environmental effects such as global warming,acidification, photochemical smogs, human- and eco-toxicity, nutrificationand the depletion of non-renewable fossil fuel resources.
Classification groups the inventory data into a number of impact categories,eg global warming and ozone layer depletion. Characterisation involvesassessing the relative contribution of individual burdens to each impactcategory. The valuation step assesses the relative importance of the impactcategories by applying weighting factors to them.
A streamlined LCA involves limiting the scope of the LCA. By scope wemean the system to be studied, the resolution of the data collected and therange of environmental impacts/issues to be addressed. For example, we canomit life cycle stages if we believe them to be insignificant, we can use genericdata instead of collecting system specific data and we can address specificenvironmental impacts such as the global warming burden for the life cycle ifthis is a particularly relevant assessment criterion.
1.2 THE JUSTIFICATION FOR USING LCA
For the purpose of comparison and decision making, the best way ofconsidering the advantages of one product over another (assuming theyprovide the same function) is to compare environmental footprints (cradle tograve) of each product. LCA allows us to do this.
Establish Scope Collect Data Life Cycle Inventory
Convert to Impacts
Decision Making Interpretation Impact Assessment
ENVIRONMENTAL RESOURCES MANAGEMENT AIRDRI/BOBRICK
3
2 GOAL AND SCOPE OF THE LIFE CYCLE ASSESSMENT
The goal of this study is to quantify and compare the environmental profilesof the the paper towel system and the hand air drier system.
Due to resource limitations this study has not been subjected to external peerreview.
The scope defines the boundaries of the system to be studied, the datarequired and any assumptions and limitations.
As this study is a streamlined study, readily available data regarding theproduction of the materials and electricity have been used. No data has beensourced regarding the production of components for the air drier or thefabrication of the bin and dispenser. Nevertheless, it is expected that thesewould be insignificant in comparison to the production of the materialthemselves. A study of washing machines conducted by PA Consulting(1992) for the UK Eco-Labelling Board states that ‘machine production hasabout 5% of the environmental impact of materials production’.
It has been assumed for the purpose of comparison that the drier, bin anddispenser have an average life time of 5 years.
For both systems, the disposal of the equipment has been ignored as theweight of the bin and dispenser is of the same order of magnitude as that ofthe drier and are made of similar materials (steel). In addition it is expectedthat the scrap equipment will be recycled at the end of its life.
2.1 THE SYSTEM BOUNDARIES
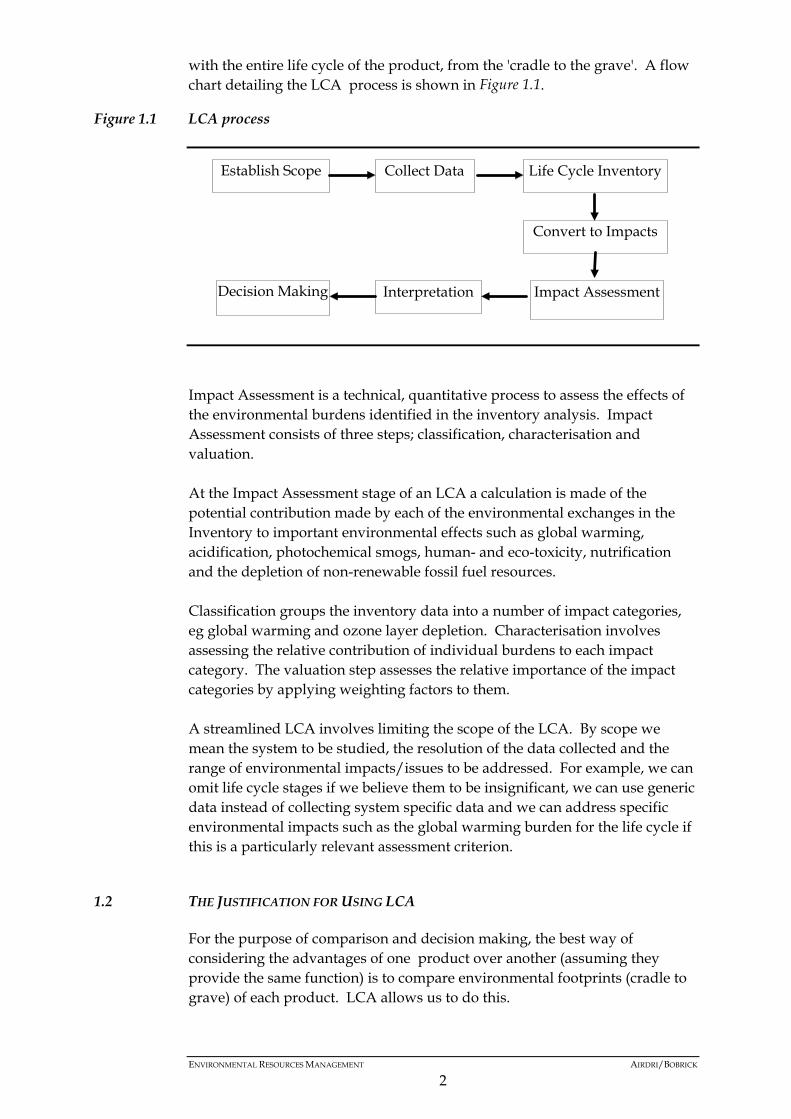
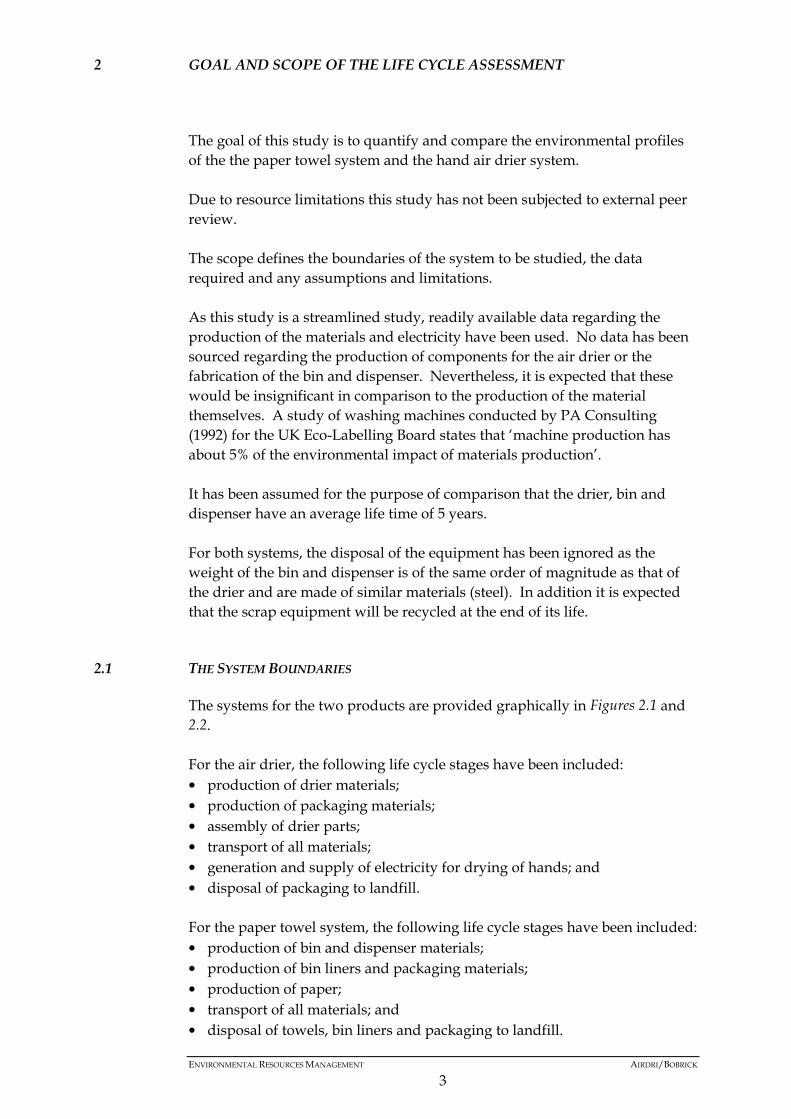
The systems for the two products are provided graphically in Figures 2.1 and2.2.
For the air drier, the following life cycle stages have been included:• production of drier materials;• production of packaging materials;• assembly of drier parts;• transport of all materials;• generation and supply of electricity for drying of hands; and• disposal of packaging to landfill.
For the paper towel system, the following life cycle stages have been included:• production of bin and dispenser materials;• production of bin liners and packaging materials;• production of paper;• transport of all materials; and• disposal of towels, bin liners and packaging to landfill.
ENVIRONMENTAL RESOURCES MANAGEMENT AIRDRI/BOBRICK
4
Figure 2.1 Drier system
Fuels & Energy
Environment: Resources
Environment: Air, Land and Water
Ener
gy S
uppl
y Sy
stem
s
Other Product System
s (Ancillary M
aterials)
Drier Assembly
Production ofDrier Materials
Consumer Use
PackagingMaterials
Transport
PackagingDisposal
Transport
Figure 2.2 Paper towel system
Fuels & Energy
Environment: Resources
Environment: Air, Land and Water
Ener
gy S
uppl
y Sy
stem
s
Other Product System
s (Ancillary M
aterials)
Consumer Use
Production PaperTowels
Bin Liner andTowel Disposal
PackagingMaterials
Transport
Packaging Disposal
Transport
Dispenser
Materials
Bin
MaterialsTransport
Transport
PackagingMaterials
Packaging Materiasl
Bin LinerMaterials
Transport
PackagingMaterials
ENVIRONMENTAL RESOURCES MANAGEMENT AIRDRI/BOBRICK
5
2.2 DRIER SYSTEM
2.2.1 Drier type
The hand drier that has been used for the basis of this comparison is theClassic model manufactured by Airdri (B-709 model as supplied by Bobrick).
Table 2.1 details the inventory of materials that are associated with the drier.
Table 2.1 Drier materials
Drier (includes Packaging) Materials Weight (g)Galvanised Steel 1900Steel 1125Al (Recycled) 843Al 843Zinc 484Card 444Copper 231wood 190Nylon 103Ceramic 91Polyethylene 54PBT 40Other materials 82Total 6430
2.2.2 Electricity use during assembly
Data relating to energy consumed to produce one drier was supplied byAirdri Ltd.
2.2.3 Electricity consumption during the use stage
It has been assumed that the drier is used 500 times per week and for anaverage of 30 seconds per dry. The drier has a power rating of 2.4 kW. Thisequates to an electricity consumption of 9360 MJ over the 5 year life time.
2.3 PAPER TOWEL SYSTEM
The paper towel system consists of a dispenser, bin, bin liners, paper towelsand the associated packaging.
ENVIRONMENTAL RESOURCES MANAGEMENT AIRDRI/BOBRICK
6
Table 2.2 Towel system materials
Material Input Weight(kg)
AssociatedPackaging (Card)
Metal bin 6.2 11 Polyethylene bin liner 0.033 0.0016Dispenser 2.605 0.195Average wt 1 C-Fold Towel 0.004 0.00018
2.3.1 Towel type
For the purposes of this study a ‘C-Fold towel’ with an average weight of3.79g has been assumed.
2.3.2 Dispenser and bin
A common mild steel dispenser weighing 2.6 kg has been modelled, togetherwith a common mild steel bin weighing 6.2 kg.
Associated with the bin is the daily use of a new polyethylene bag weighing33g. For the purpose of this study, 5 bags per week have been assumed to beused.
2.3.3 Life time towel consumption
For the purposes of this study an equal lifetime and equal number of dries tothat of the drier has been assumed.
For each dry it has been assumed that a person uses two paper towels.
2.4 DATA REQUIREMENTS
For the purposes of this study, readily available data have been used todescribe the system. With the exception of steel and one of the paper typesmodelled, the inventory data for materials, energy, transport and wastedisposal were sourced from the PEMS4 (1) databases. Life cycle inventorydata for steel products were provided by the International Iron and SteelInstitute.
Four different systems have been modelled for paper towels, using differentdatabases on then environmental impacts of paper. The only differencebetween the models is the paper data that has been used. This was done todetermine the sensitivity of the towel system to the paper data. One of thepaper databases used was created using the SCA Environmental Report, 2000,the other three were created using the databases in PEMS4 (ETH paper,bleached paper and unbleached paper).
(1) Pira Environmental Management System
ENVIRONMENTAL RESOURCES MANAGEMENT AIRDRI/BOBRICK
7
For the purposes of this comparison, all materials were assumed to betransported an equal distance by road and sea, a total of 1500 km.
All modelling and analysis was conducted using the PEMS4 LCA softwaretool.
All electricity inputs to the systems were modelled using an averageEuropean fuel mix.
2.5 FUNCTIONAL UNIT
The functional unit is a measure of the 'service' provided by the productsystems. It is used to normalise the environmental effects, allowingcomparisons with other periods, systems or scenarios which might provide anidentical service. In this case, the functional unit is based on a lifetime of fiveyears for the two systems and the same number of dries, 130,000.
ENVIRONMENTAL RESOURCES MANAGEMENT AIRDRI/BOBRICK
8
3 ENVIRONMENTAL FOOTPRINT OF THE TWO PRODUCT SYSTEMS
3.1 LIFE CYCLE INVENTORY
The system was described by quantifying all of the resources (materials andenergy) consumed, and the products and wastes produced, at each stage inthe system under investigation.
A summary inventory for each system is contained in Annex A.
3.2 IMPACT ASSESSMENT METHOD
Impact Assessment is a technical, quantitative and/or qualitative process tocharacterise and assess the effects of the environmental burdens identified inthe inventory.
The approach used to conduct the Impact Assessment is known as theProblem Oriented Approach. The data in the inventory were aggregatedaccording to relative contributions made to the following surveyableenvironmental concerns:
• resource depletion;• global warming;• ozone layer depletion;• acidification;• nutrification;• human toxicity;• ecotoxicity; and• photochemical smog.
3.2.1 Resource depletion
The classification of resource depletion is limited to non-renewable resourcesonly, i.e. coal, oil, gas and minerals. Resource depletion is calculated bymultiplying the amount of extracted resource (kg) by its individualclassification factor. The classification factors are calculated by dividing theglobal oil reserves by the global reserves of the specific resource. Theclassification results in ‘oil equivalents’ can then be summed.
3.2.2 Global warming
The gases involved in the greenhouse effect (eg carbon dioxide (CO2),methane (CH4), carbon monoxide (CO), nitrous oxide (N2O), sulphurhexafluoride (SF6)) all have the property of absorbing energy and emittingthermal infra-red radiation. An increase in the atmospheric concentration ofgreenhouse gases will change the absorption of infra red radiation in the
ENVIRONMENTAL RESOURCES MANAGEMENT AIRDRI/BOBRICK
9
atmosphere. This may lead to changes in climatic patterns and higheraverage global temperatures.
Global Warming Potentials (GWP) have been developed by the IPCC(Intergovernmental Panel on Climate Change) and can be used to express thepotential contribution of different gases to the greenhouse effect.
The Global Warming Potential (GWP) is a relative parameter that uses carbondioxide (CO2) as a reference gas. The emissions of each greenhouse gas aremultiplied by their GWP and the system’s potential contribution to thegreenhouse effect is expressed in a single score by summing the individualcontributions.
3.2.3 Ozone depletion
Changes in atmospheric ozone will modify the amount of harmful ultravioletradiation penetrating to the earth’s surface with potential effects on humanhealth. For gases that contribute to the depletion of the ozone layer (egchlorofluorocarbons), ozone depletion potentials (ODPs) have beendeveloped. These can be used to express the potential contribution that thesesubstances make to the depletion of the ozone layer. The ODP uses CFC 11 asa reference substance.
3.2.4 Acidification
Acidification results from the deposition of acids that lead to a decrease in thepH, a decrease in the mineral content of soil and increased concentrations ofpotentially toxic elements in groundwater. These effects are caused by acidrain and the major gaseous pollutants associated with this are sulphur dioxide(SO2) and nitrogen oxides (NOx). These are dissolved in rainwater andsubsequently deposited. The effects of acid deposition are very site specificand will vary depending on the receiving environment (ie the bufferingcapacity of the soil and any dilution effects which might occur).
Acidification Potential (AP) factors have been developed for potentiallyacidifying gases such as SO2, NOx, HCl, HF and NH3. The AP of a substanceis calculated on the basis of the number of hydrogen ions that can beproduced per mole of a substance, using SO2 as the reference substance.
3.2.5 Ecotoxicity
The ecotoxicity effect scores represent the quantity of aquatic or terrestrialecosystem potentially polluted to the maximum tolerable concentration. Itmust be stressed that classification factors for ecotoxicity are still in the earlystages of development and that, in practice, emissions may be dispersed anddiluted below a ‘no effect’ level.
The inventory output burdens categorised under this environmental burdeninclude releases to water of metals, non metals and organic compounds.
ENVIRONMENTAL RESOURCES MANAGEMENT AIRDRI/BOBRICK
10
3.2.6 Nutrification
This is caused by the addition of nutrients (eg NOx, nitrates, phosphates andammonia) to a soil or water system that leads to an increase in biomass. Anynutrient can have a nutrifying effect, however nitrogen and phosphorous arethe most important. Those substances that have the potential for causingnutrification are aggregated using nutrification potentials (NPs) which are ameasure of the capacity to form biomass compared to phosphate (PO4-3).
There are various issues surrounding this category and, as with acidification,the impact of pollutants will depend on the sensitivity of the receivingenvironment.
3.2.7 Human toxicity
The human toxicity effect score represents the potential for human bodyweight to be contaminated up to the maximum acceptable limit. It must bestressed that classification factors for human toxicity are still in the earlystages of development and that, in practice, emissions may be dispersed anddiluted below a ‘no effect’ level and an unknown fraction (less than one) willactually be taken in by humans.
The inventory output burdens categorised under this environmental burdeninclude releases of metals to air and water, organic compounds to water,volatile organic compounds, nitrogen oxides, ammonia and sulphur dioxide.
3.2.8 Photochemical Smog
Low level smog contains irritants that can adversely affect human health.Photochemical oxidant formation potential (POCP) factors have beendeveloped for substances (VOCs, CFCs) that contribute to the formation ofphotochemical oxidants/smog. The POCP is a measure of the capacity toform ozone in the lower atmosphere using ethylene as the referencesubstance.
3.3 IMPACT ASSESSMENT RESULTS
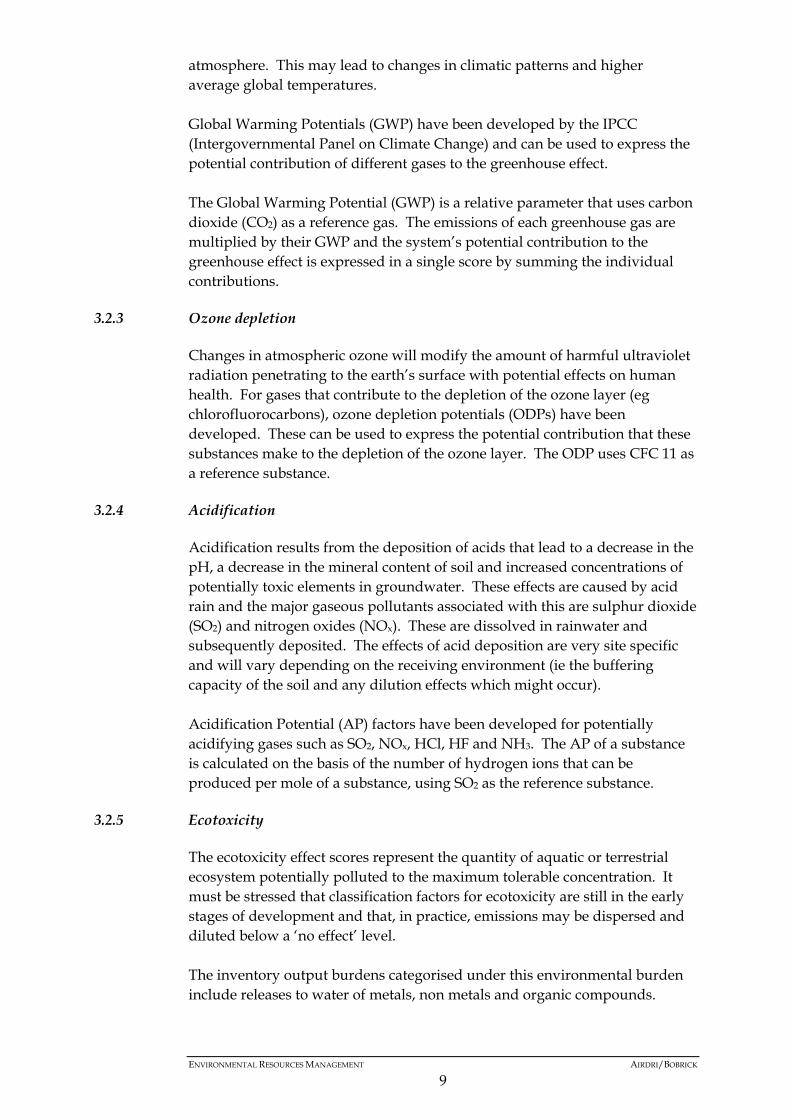
The figures in Table 3.1 are the potential contributions from the life cycle ineach of the impact categories for the towel and drier systems. Though energyconsumption is not an environmental impact it has been included in the tablefor the reader’s interest.
ENVIRONMENTAL RESOURCES MANAGEMENT AIRDRI/BOBRICK
11
Table 3.1 Impact burden for drier and towel systems
Impact Category Drier PaperType 1
PaperType 2
PaperType 3
PaperType 4
Towel: AveragePaper
Resource depletion (kg Oil equiv.) 1780 800 594 424 476 574Global Warming (CO2 equiv.) 1607 4330 2187 5574 6289 4595Acidification (kg SO2 equiv.) 10.2 12.4 15.3 12.4 15.3 13.8Ecotoxicity (Aquatic m3) 0.052 0.104 0.079 0.050 0.064 0.07Human Toxicity (kg/kg) 15.7 24.1 27.2 23.9 22.8 24.5Nutrification (kg PO4 equiv.) 1.2 1.7 0.9 1.4 1.6 1.38Ozone depletion (kg CFC 11 equiv.) 0.0003 0.0016 0.0009 0.0002 0.0002 0.00Smog (kg ethylene equiv.) 0.4 3.0 1.9 4.6 2.2 2.94Energy MJ 35999 38527 34167 76079 87084 58964
The drier system performs better than the average paper towel systems withthe exception of resource depletion (all the paper towel systems performbetter).
From Table 3.1 it can be see that a drier, over its life time, will result in a globalwarming burden of 1.6 tonnes of CO2. This is an equivalent burden to thatassociated with a car travelling 5 100 km. Over the same period, the use ofpaper towels would result in an average CO2 burden of 4.6 tonnes. This is anequivalent burden to that associated with a car travelling 14 500 km.
From Table 3.1 it can be seen that a drier over its life time will result in aacidification burden of 10.2 kg of SO2. This is an equivalent burden to thatassociated with a car travelling 5000 km. Over the same period, the use ofpaper towels would result in a average burden of 13.8 kg of SO2. This is anequivalent burden to that associated with a car travelling 6700 km.
3.3.1 Drier system
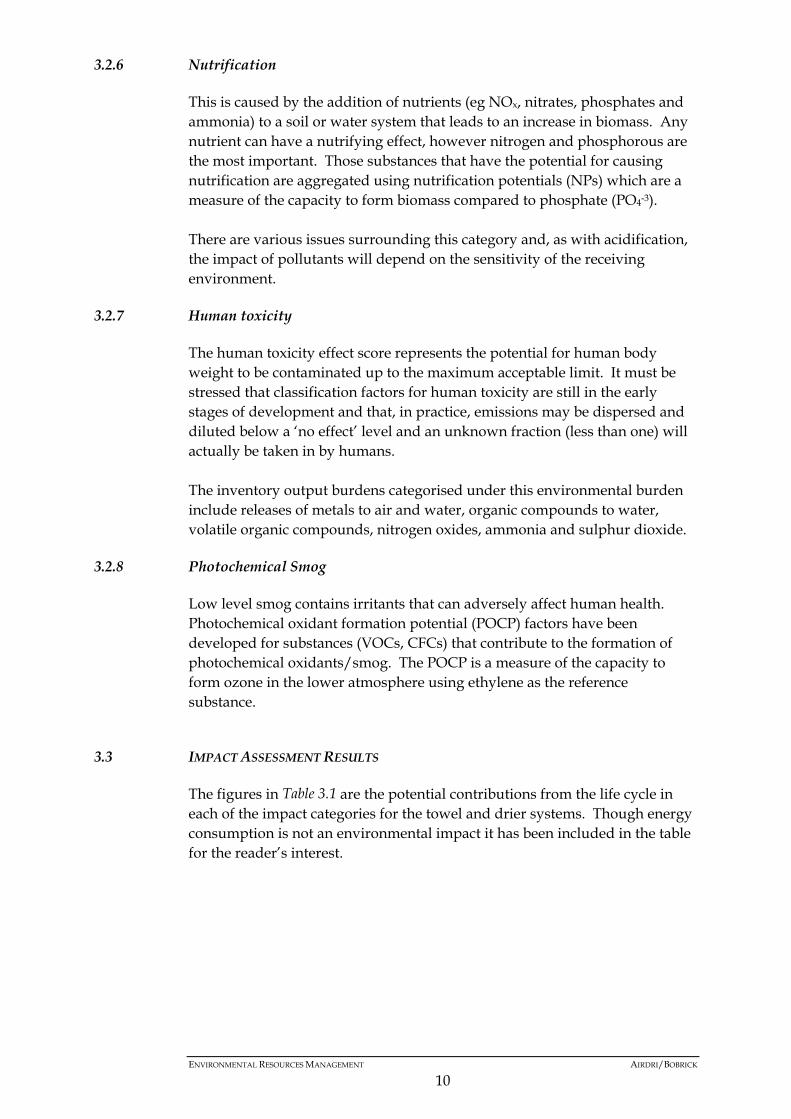
For the drier, by far the largest contributor to the environmental footprint isthe generation and supply of electricity, see Table 3.2. This table shows thatthe environmental profile of the drier is dependent on the quantity and natureof electricity used. By using European average data for electricity generationand supply, local and national variations have been ignored. There is widevariation in the generating methods of countries and these variations wouldaffect the results.
As the average European data is pre 1997 it is reasonable to expect theenvironmental burdens associated with electricity to reduce in the comingyears with the growing use of renewable energy and improvements ingenerating efficiency.
ENVIRONMENTAL RESOURCES MANAGEMENT AIRDRI/BOBRICK
12
Table 3.2 Percentage contribution of electricity use to each impact burden
Impact Category Drier Electricity Use(%)
Resource Depletion 69Global Warming 98Acidification 98Ecotoxicity 98Human Toxicity 95Nutrification 99Ozone Depletion 98 Smog 97
3.3.2 Paper towel system
For the paper towel system, the largest contributors to the environmentalfootprint are the production of the paper for the paper towels, the productionof polyethylene associated with the plastic bin bags, the disposal of the papertowels and the transport of materials, see Table 3.3. The bin, dispensermaterials and their transport have not been included in the table as theycontribute less than 0.5% of the burden in each impact category.
Table 3.3 indicates that assumptions and limitations associated with the datarelated to these stages of the life cycle have significant implications for theenvironmental profile of the paper towel system.
As waste paper towels are not considered suitable for recycling, the choice oflandfill as the disposal route is reasonable considering that landfill is the mainwaste disposal route in both the UK and USA. In the UK, USA and mainlandEurope incineration is playing an increasing role in waste disposal.Incineration of paper towels would result in different environmental burdens.Of particular note would be the reduction in greenhouse gas emissionsassociated with methane emissions from the waste disposal to landfill..However, incineration would result in larger releases of species with animpact on air quality.
The transport assumptions made are considered to underestimate theenvironmental burden as the distances are conservative. Road transport alsoassumed a 40 tonne truck, which is significantly more efficient for movingmaterial than the smaller capacity vehicles that might be used in practice. Inaddition, a 100% utility has been assumed for transport, where in practice,half or even empty loads could be expected.
ENVIRONMENTAL RESOURCES MANAGEMENT AIRDRI/BOBRICK
13
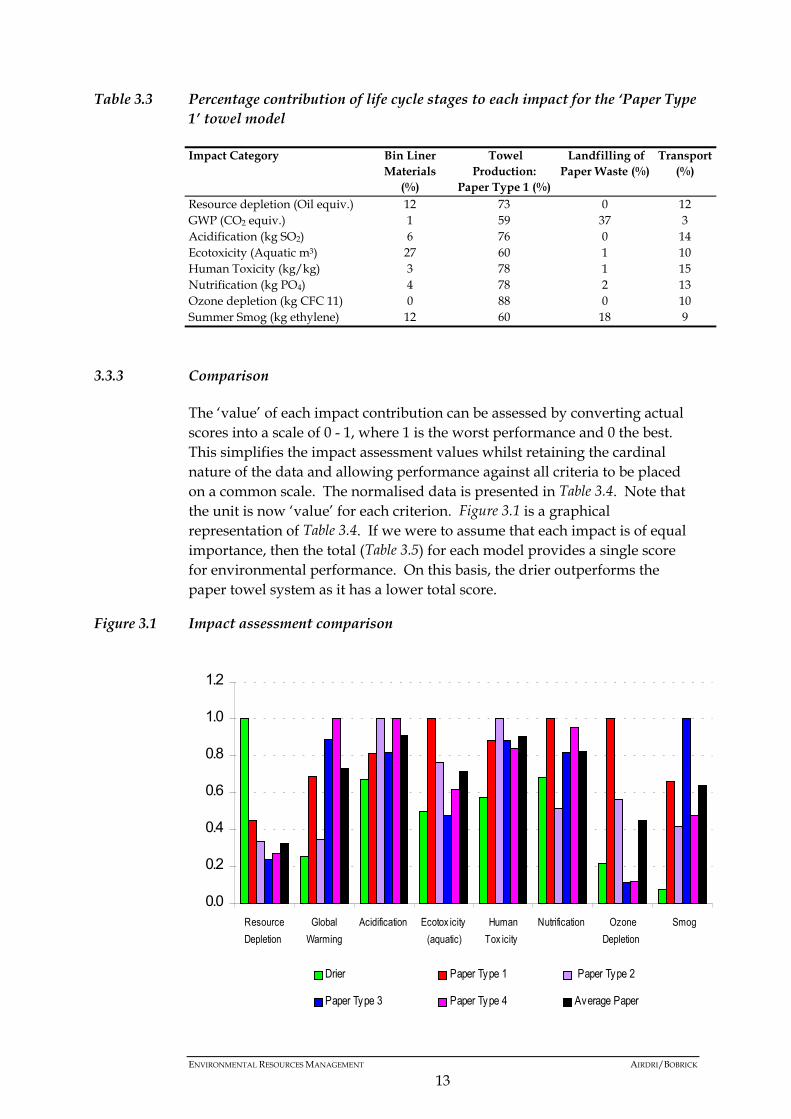
Table 3.3 Percentage contribution of life cycle stages to each impact for the ‘Paper Type1’ towel model
Impact Category Bin LinerMaterials
(%)
TowelProduction:
Paper Type 1 (%)
Landfilling ofPaper Waste (%)
Transport(%)
Resource depletion (Oil equiv.) 12 73 0 12GWP (CO2 equiv.) 1 59 37 3Acidification (kg SO2) 6 76 0 14Ecotoxicity (Aquatic m3) 27 60 1 10Human Toxicity (kg/kg) 3 78 1 15Nutrification (kg PO4) 4 78 2 13Ozone depletion (kg CFC 11) 0 88 0 10Summer Smog (kg ethylene) 12 60 18 9
3.3.3 Comparison
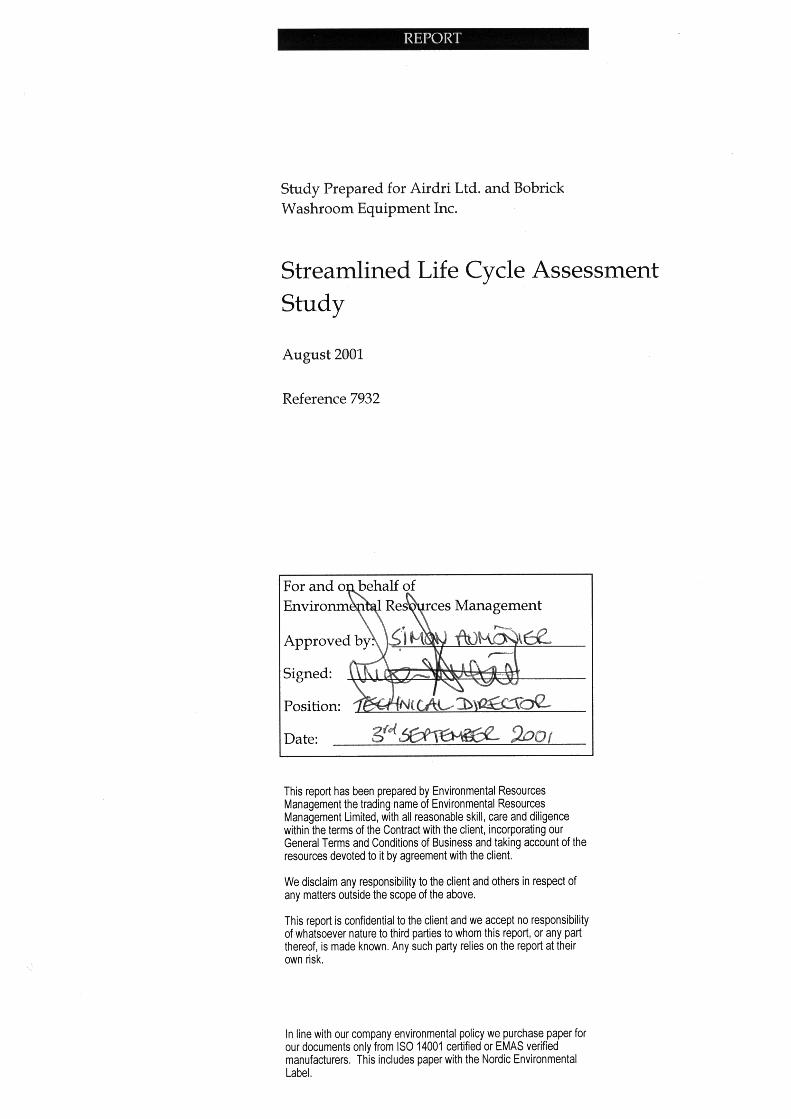
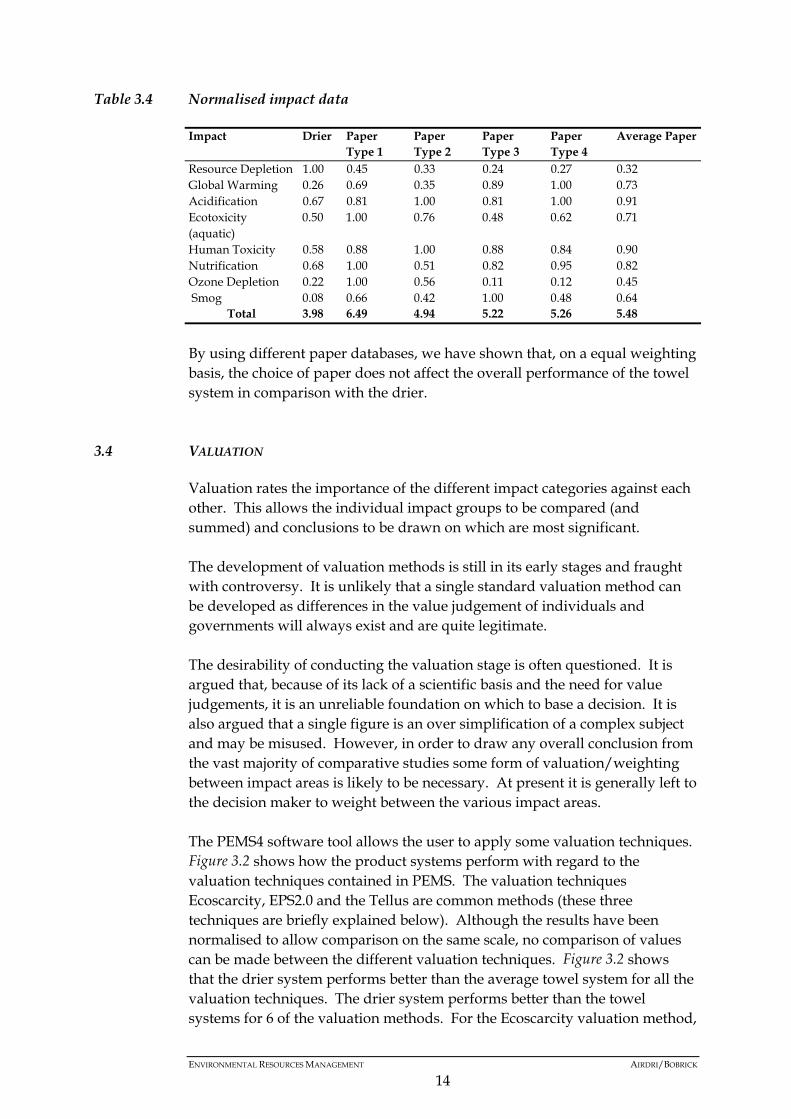
The ‘value’ of each impact contribution can be assessed by converting actualscores into a scale of 0 - 1, where 1 is the worst performance and 0 the best.This simplifies the impact assessment values whilst retaining the cardinalnature of the data and allowing performance against all criteria to be placedon a common scale. The normalised data is presented in Table 3.4. Note thatthe unit is now ‘value’ for each criterion. Figure 3.1 is a graphicalrepresentation of Table 3.4. If we were to assume that each impact is of equalimportance, then the total (Table 3.5) for each model provides a single scorefor environmental performance. On this basis, the drier outperforms thepaper towel system as it has a lower total score.
Figure 3.1 Impact assessment comparison
0.0
0.2
0.4
0.6
0.8
1.0
1.2
ResourceDepletion
GlobalWarming
Acidification Ecotox icity(aquatic)
HumanTox icity
Nutrification OzoneDepletion
Smog
Drier Paper Type 1 Paper Type 2
Paper Type 3 Paper Type 4 Average Paper
ENVIRONMENTAL RESOURCES MANAGEMENT AIRDRI/BOBRICK
14
Table 3.4 Normalised impact data
Impact Drier PaperType 1
PaperType 2
PaperType 3
PaperType 4
Average Paper
Resource Depletion 1.00 0.45 0.33 0.24 0.27 0.32Global Warming 0.26 0.69 0.35 0.89 1.00 0.73Acidification 0.67 0.81 1.00 0.81 1.00 0.91Ecotoxicity(aquatic)
0.50 1.00 0.76 0.48 0.62 0.71
Human Toxicity 0.58 0.88 1.00 0.88 0.84 0.90Nutrification 0.68 1.00 0.51 0.82 0.95 0.82Ozone Depletion 0.22 1.00 0.56 0.11 0.12 0.45 Smog 0.08 0.66 0.42 1.00 0.48 0.64
Total 3.98 6.49 4.94 5.22 5.26 5.48
By using different paper databases, we have shown that, on a equal weightingbasis, the choice of paper does not affect the overall performance of the towelsystem in comparison with the drier.
3.4 VALUATION
Valuation rates the importance of the different impact categories against eachother. This allows the individual impact groups to be compared (andsummed) and conclusions to be drawn on which are most significant.
The development of valuation methods is still in its early stages and fraughtwith controversy. It is unlikely that a single standard valuation method canbe developed as differences in the value judgement of individuals andgovernments will always exist and are quite legitimate.
The desirability of conducting the valuation stage is often questioned. It isargued that, because of its lack of a scientific basis and the need for valuejudgements, it is an unreliable foundation on which to base a decision. It isalso argued that a single figure is an over simplification of a complex subjectand may be misused. However, in order to draw any overall conclusion fromthe vast majority of comparative studies some form of valuation/weightingbetween impact areas is likely to be necessary. At present it is generally left tothe decision maker to weight between the various impact areas.
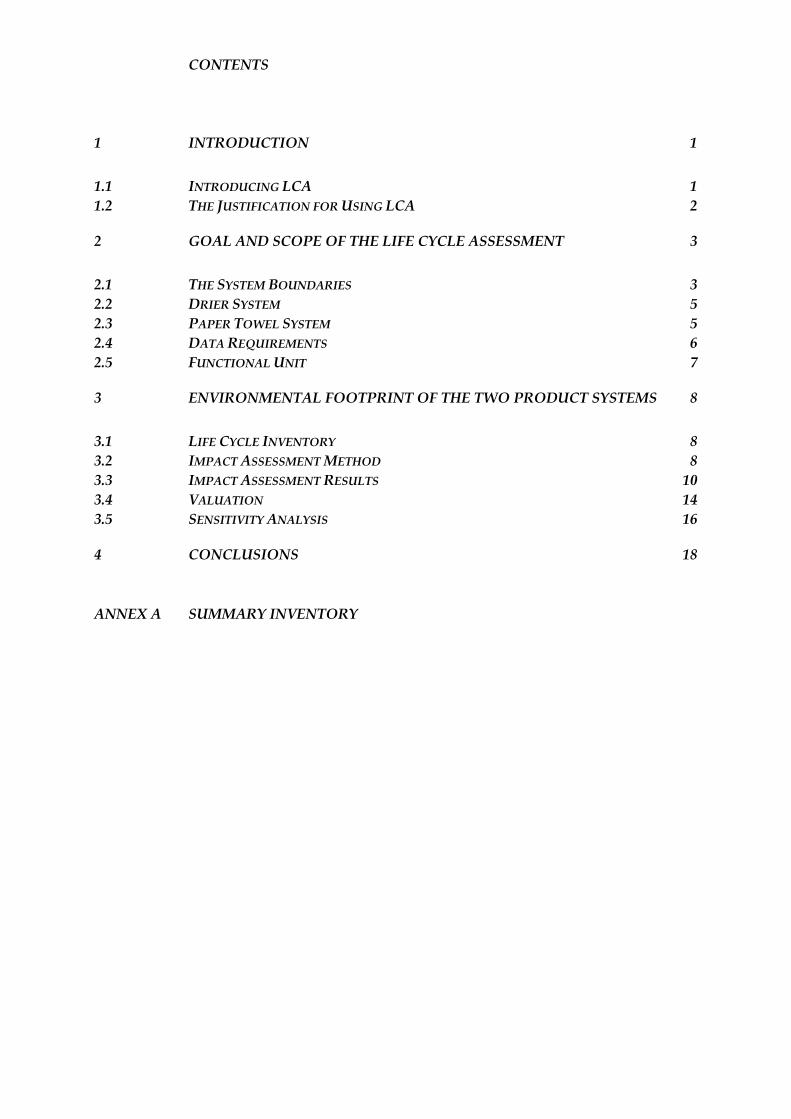
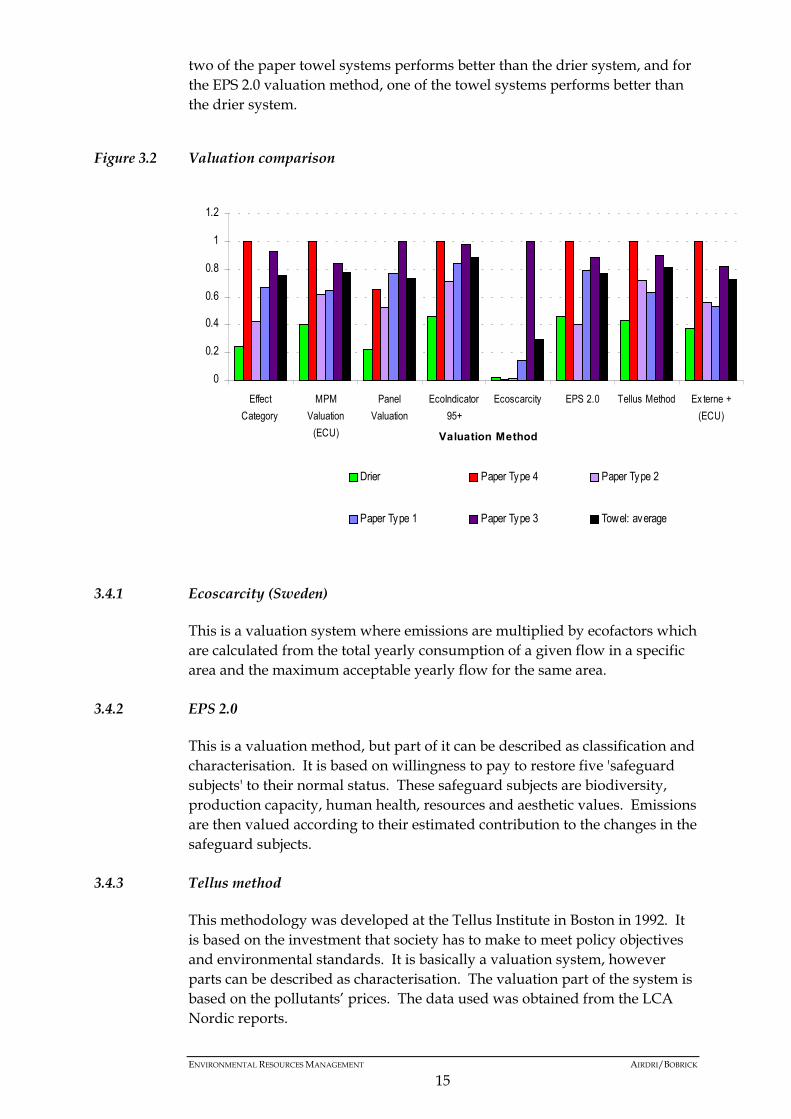
The PEMS4 software tool allows the user to apply some valuation techniques.Figure 3.2 shows how the product systems perform with regard to thevaluation techniques contained in PEMS. The valuation techniquesEcoscarcity, EPS2.0 and the Tellus are common methods (these threetechniques are briefly explained below). Although the results have beennormalised to allow comparison on the same scale, no comparison of valuescan be made between the different valuation techniques. Figure 3.2 showsthat the drier system performs better than the average towel system for all thevaluation techniques. The drier system performs better than the towelsystems for 6 of the valuation methods. For the Ecoscarcity valuation method,
ENVIRONMENTAL RESOURCES MANAGEMENT AIRDRI/BOBRICK
15
two of the paper towel systems performs better than the drier system, and forthe EPS 2.0 valuation method, one of the towel systems performs better thanthe drier system.
Figure 3.2 Valuation comparison
3.4.1 Ecoscarcity (Sweden)
This is a valuation system where emissions are multiplied by ecofactors whichare calculated from the total yearly consumption of a given flow in a specificarea and the maximum acceptable yearly flow for the same area.
3.4.2 EPS 2.0
This is a valuation method, but part of it can be described as classification andcharacterisation. It is based on willingness to pay to restore five 'safeguardsubjects' to their normal status. These safeguard subjects are biodiversity,production capacity, human health, resources and aesthetic values. Emissionsare then valued according to their estimated contribution to the changes in thesafeguard subjects.
3.4.3 Tellus method
This methodology was developed at the Tellus Institute in Boston in 1992. Itis based on the investment that society has to make to meet policy objectivesand environmental standards. It is basically a valuation system, howeverparts can be described as characterisation. The valuation part of the system isbased on the pollutants’ prices. The data used was obtained from the LCANordic reports.
0
0.2
0.4
0.6
0.8
1
1.2
EffectCategory
MPMValuation
(ECU)
PanelValuation
EcoIndicator95+
Ecoscarcity EPS 2.0 Tellus Method Ex terne +(ECU)
Valuation Method
Drier Paper Type 4 Paper Type 2
Paper Type 1 Paper Type 3 Towel: average
ENVIRONMENTAL RESOURCES MANAGEMENT AIRDRI/BOBRICK
16
3.5 SENSITIVITY ANALYSIS
The key assumption that a person will use two towels for each dry needs to beassessed as this has the greatest influence on the results for the paper towelsystems. Table 3.5 presents the impact burdens if one paper towel per dry wasto be used.
The figures in Table 3.5 are the potential contributions from the life cycle ineach of the impact categories for the towel and drier systems. Though energyconsumption is not an environmental impact, it has been included in the tablefor the readers’ interest.
Table 3.5 Impact burden for drier and towel systems
Impact Category Drier PaperType 1
PaperType 2
PaperType 3
PaperType 4
Towel:Average Paper
Resource depletion (kg Oil equiv.) 1780 444 341 258 281 331Global Warming (CO2 equiv.) 1607 2198 1127 2824 3107 2314Acidification (kg SO2 equiv.) 10.2 6.6 8.0 6.7 8.4 7.4Ecotoxicity (Aquatic m3) 0.052 0.064 0.052 0.039 0.048 0.05Human Toxicity (kg/kg) 15.7 12.5 14.1 12.7 12.4 12.91Nutrification (kg PO4 equiv.) 1.15 0.88 0.47 0.73 0.83 0.73Ozone depletion (kg CFC 11 equiv.) 0.00034 0.00078 0.00044 0.00010 0.00010 0.00Smog (kg ethylene equiv.) 0.36 1.69 1.12 2.47 1.28 1.64Energy MJ 36000 20229 18049 39068 43627 30243
The ‘value’ of each impact contribution has been assessed by convertingactual scores into a scale of 0 - 1, where 1 is the worst performance and 0 thebest. This simplifies the impact assessment values whilst retaining thecardinal nature of the data and allowing performance against all criteria to beplaced on a common scale. The normalised data is presented in Table 3.6.Note that the unit is now ‘value’ for each criterion. If we were to assume thateach impact is of equal importance then the total (Table 3.5) for each modelprovides a single score for environmental performance. On this basis, thedrier performs less well than the paper towel systems as it has a lower totalscore.
Table 3.6 Normalised impact data
Impact Drier PaperType 1
PaperType 2
PaperType 3
PaperType 4
Average Paper
Resource Depletion 1.00 0.25 0.19 0.14 0.16 0.19Global Warming 0.52 0.71 0.36 0.91 1.00 0.74Acidification 1.00 0.64 0.79 0.66 0.82 0.73Ecotoxicity(aquatic)
0.81 1.00 0.81 0.60 0.74 0.79
Human Toxicity 1.00 0.80 0.90 0.81 0.79 0.82Nutrification 1.00 0.76 0.41 0.64 0.72 0.63Ozone Depletion 0.43 1.00 0.57 0.12 0.12 0.45 Smog 0.15 0.68 0.45 1.00 0.52 0.66
Total 5.90 5.84 4.47 4.88 4.87 5.02
ENVIRONMENTAL RESOURCES MANAGEMENT AIRDRI/BOBRICK
17
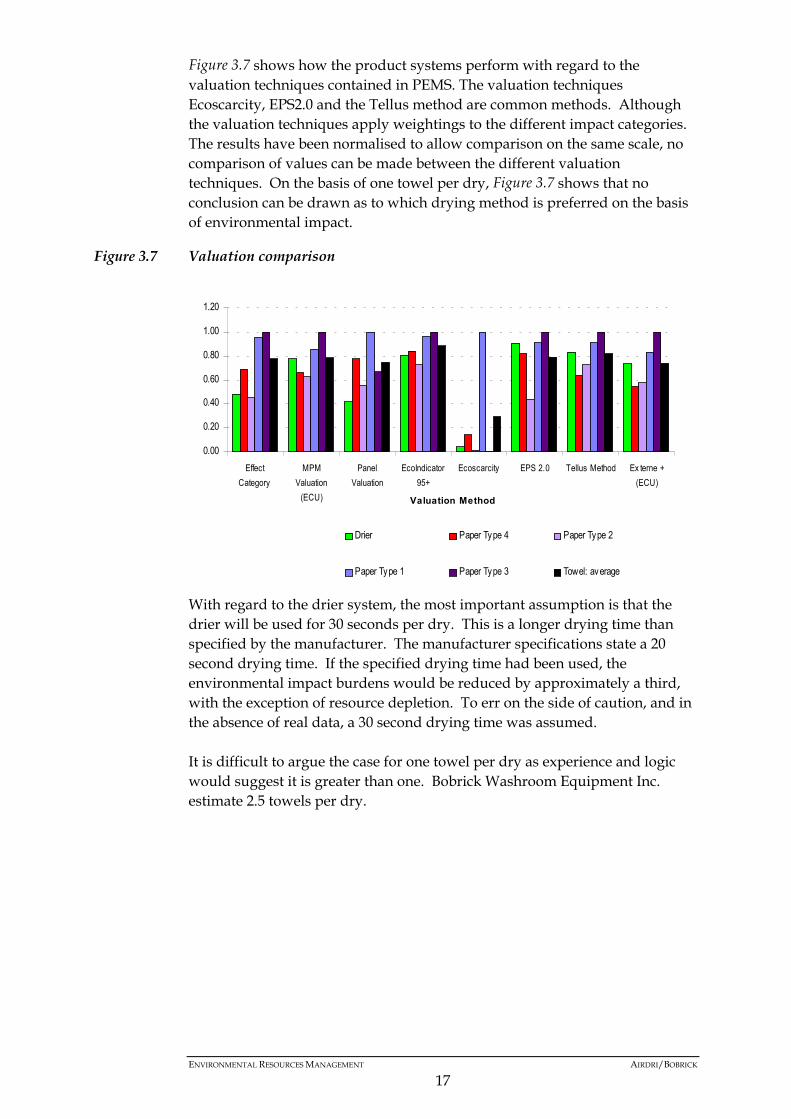
Figure 3.7 shows how the product systems perform with regard to thevaluation techniques contained in PEMS. The valuation techniquesEcoscarcity, EPS2.0 and the Tellus method are common methods. Althoughthe valuation techniques apply weightings to the different impact categories.The results have been normalised to allow comparison on the same scale, nocomparison of values can be made between the different valuationtechniques. On the basis of one towel per dry, Figure 3.7 shows that noconclusion can be drawn as to which drying method is preferred on the basisof environmental impact.
Figure 3.7 Valuation comparison
0.00
0.20
0.40
0.60
0.80
1.00
1.20
EffectCategory
MPMValuation
(ECU)
PanelValuation
EcoIndicator95+
Ecoscarcity EPS 2.0 Tellus Method Ex terne +(ECU)
Valuation Method
Drier Paper Type 4 Paper Type 2
Paper Type 1 Paper Type 3 Towel: average
With regard to the drier system, the most important assumption is that thedrier will be used for 30 seconds per dry. This is a longer drying time thanspecified by the manufacturer. The manufacturer specifications state a 20second drying time. If the specified drying time had been used, theenvironmental impact burdens would be reduced by approximately a third,with the exception of resource depletion. To err on the side of caution, and inthe absence of real data, a 30 second drying time was assumed.
It is difficult to argue the case for one towel per dry as experience and logicwould suggest it is greater than one. Bobrick Washroom Equipment Inc.estimate 2.5 towels per dry.
ENVIRONMENTAL RESOURCES MANAGEMENT AIRDRI/BOBRICK
18
4 CONCLUSIONS
The streamlined study shows that the use of hand air driers results in asmaller environmental footprint than the use of paper towels, though this isbased on a number of assumptions such as the use of two paper towels perdry and the use of the hand air drier for an average of 30 seconds per dry.
Due to the influence that the number of paper towels consumed and thedrying time have on the results of the study, it is our recommendation thatresearch is carried out to determine average consumption of towels and theaverage drying time (for hand air driers) per dry.
Though this study is not definitive, it does suggest that, with regard toenvironmental performance, paper towels should not be chosen in preferenceto the hand air drier modelled in this study.
The use of the drier results in lower global warming, acidification, ecotoxicity,human toxicity, nutrification, ozone depletion and photochemical smogburdens.
The use of paper towels results in a lower resource depletion burden than theuse of the drier.
The use of paper towels results in double the global warming burden whencompared to the use of the hand air drier.
A drier over its life time will result in a global warming burden of 1.6 tonnesof CO2. This is an equivalent burden to that associated with a car travelling5 100 km. Over the same period the use of paper towels would result in anaverage CO2 burden of 4.6 tonnes. This is an equivalent burden to thatassociated with a car travelling 14 500 km.
The results of this study are dependent on the assumptions made. Ofsignificance is the drying time, the electricity database used, the number oftowels used per dry, transport steps and the disposal paper wastes.
Annex A
Summary Inventory
ENVIRONMENTAL RESOURCES MANAGEMENT A1 AIRDRI/BOBRICK
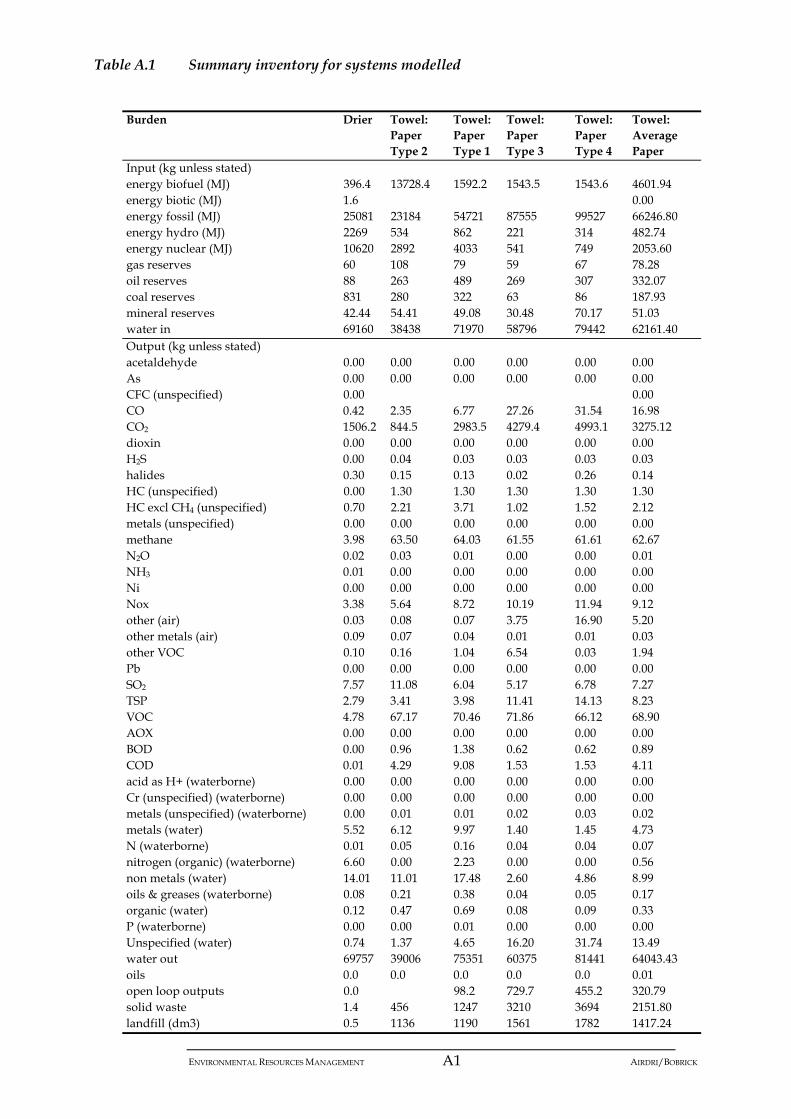
Table A.1 Summary inventory for systems modelled
Burden Drier Towel:PaperType 2
Towel:PaperType 1
Towel:PaperType 3
Towel:PaperType 4
Towel:AveragePaper
Input (kg unless stated)energy biofuel (MJ) 396.4 13728.4 1592.2 1543.5 1543.6 4601.94energy biotic (MJ) 1.6 0.00energy fossil (MJ) 25081 23184 54721 87555 99527 66246.80energy hydro (MJ) 2269 534 862 221 314 482.74energy nuclear (MJ) 10620 2892 4033 541 749 2053.60gas reserves 60 108 79 59 67 78.28oil reserves 88 263 489 269 307 332.07coal reserves 831 280 322 63 86 187.93mineral reserves 42.44 54.41 49.08 30.48 70.17 51.03water in 69160 38438 71970 58796 79442 62161.40Output (kg unless stated)acetaldehyde 0.00 0.00 0.00 0.00 0.00 0.00As 0.00 0.00 0.00 0.00 0.00 0.00CFC (unspecified) 0.00 0.00CO 0.42 2.35 6.77 27.26 31.54 16.98CO2 1506.2 844.5 2983.5 4279.4 4993.1 3275.12dioxin 0.00 0.00 0.00 0.00 0.00 0.00H2S 0.00 0.04 0.03 0.03 0.03 0.03halides 0.30 0.15 0.13 0.02 0.26 0.14HC (unspecified) 0.00 1.30 1.30 1.30 1.30 1.30HC excl CH4 (unspecified) 0.70 2.21 3.71 1.02 1.52 2.12metals (unspecified) 0.00 0.00 0.00 0.00 0.00 0.00methane 3.98 63.50 64.03 61.55 61.61 62.67N2O 0.02 0.03 0.01 0.00 0.00 0.01NH3 0.01 0.00 0.00 0.00 0.00 0.00Ni 0.00 0.00 0.00 0.00 0.00 0.00Nox 3.38 5.64 8.72 10.19 11.94 9.12other (air) 0.03 0.08 0.07 3.75 16.90 5.20other metals (air) 0.09 0.07 0.04 0.01 0.01 0.03other VOC 0.10 0.16 1.04 6.54 0.03 1.94Pb 0.00 0.00 0.00 0.00 0.00 0.00SO2 7.57 11.08 6.04 5.17 6.78 7.27TSP 2.79 3.41 3.98 11.41 14.13 8.23VOC 4.78 67.17 70.46 71.86 66.12 68.90AOX 0.00 0.00 0.00 0.00 0.00 0.00BOD 0.00 0.96 1.38 0.62 0.62 0.89COD 0.01 4.29 9.08 1.53 1.53 4.11acid as H+ (waterborne) 0.00 0.00 0.00 0.00 0.00 0.00Cr (unspecified) (waterborne) 0.00 0.00 0.00 0.00 0.00 0.00metals (unspecified) (waterborne) 0.00 0.01 0.01 0.02 0.03 0.02metals (water) 5.52 6.12 9.97 1.40 1.45 4.73N (waterborne) 0.01 0.05 0.16 0.04 0.04 0.07nitrogen (organic) (waterborne) 6.60 0.00 2.23 0.00 0.00 0.56non metals (water) 14.01 11.01 17.48 2.60 4.86 8.99oils & greases (waterborne) 0.08 0.21 0.38 0.04 0.05 0.17organic (water) 0.12 0.47 0.69 0.08 0.09 0.33P (waterborne) 0.00 0.00 0.01 0.00 0.00 0.00Unspecified (water) 0.74 1.37 4.65 16.20 31.74 13.49water out 69757 39006 75351 60375 81441 64043.43oils 0.0 0.0 0.0 0.0 0.0 0.01open loop outputs 0.0 98.2 729.7 455.2 320.79solid waste 1.4 456 1247 3210 3694 2151.80landfill (dm3) 0.5 1136 1190 1561 1782 1417.24


![Fases II [Modo de compatibilidad] - OCW UPMocw.upm.es/proyectos-de-ingenieria/sistemas-de-informacion... · generalmente denominado proyecto o espaciogeneralmente denominado proyecto](https://static.fdocuments.net/doc/165x107/5bad012009d3f217678c2941/fases-ii-modo-de-compatibilidad-ocw-generalmente-denominado-proyecto-o-espaciogeneralmente.jpg)