Stream Sediment Monitoring Sampling and Analysis Plan ... · King County i August 2012 Stream...
44
Stream Sediment Monitoring Sampling and Analysis Plan Green River Basin August 17, 2012 Final Alternate Formats Available 206-477-4800 TTY Relay: 711
Transcript of Stream Sediment Monitoring Sampling and Analysis Plan ... · King County i August 2012 Stream...

KingCounty i August2012
Stream Sediment Monitoring Sampling and Analysis Plan
Green River Basin
August 17, 2012
Final
Alternate Formats Available
206-477-4800 TTY Relay: 711

StreamSedimentMonitoringSamplingandAnalysisPlan:GreenRiverBasin
KingCounty ii August2012
THISPAGEINTENTIONALLYLEFTBLANK

StreamSedimentMonitoringSamplingandAnalysisPlan:GreenRiverBasin
KingCounty iii August2012
Stream Sediment Monitoring Sampling and Analysis Plan:
Green River Basin
Final
_____________________________________________________
DeanWilson,ProjectManagerStreamsSedimentMonitoring
_____________________________________________________
JeanPower,TechnicalCoordinatorKingCountyEnvironmentalLaboratory
_____________________________________________________
FritzGrothkopp,LaboratoryProjectManagerKingCountyEnvironmentalLaboratory
_____________________________________________________
ColinElliott,QAOfficerKingCountyEnvironmentalLaboratory

StreamSedimentMonitoringSamplingandAnalysisPlan:GreenRiverBasin
KingCounty iv August2012
Table of Contents 1.0. ProjectBackground..................................................................................................................................1
1.1 ScopeofWork.........................................................................................................................................1
1.2 ProjectQuestions..................................................................................................................................2
1.3 SamplingStrategy.................................................................................................................................2
1.3.1 MonitoringProgramStreams.....................................................................................................2
1.3.2 StreamBasinAnalysis....................................................................................................................2
1.4 Toolstobeusedinanalyzingthedata.........................................................................................4
1.5 DataRequirements...............................................................................................................................4
1.6 ChemicalTesting...................................................................................................................................4
1.6.1 DataQualityObjectives.................................................................................................................5
1.6.2 Precision,Accuracy,andBias......................................................................................................7
1.6.3 Representativeness.........................................................................................................................7
1.6.4 Completeness.....................................................................................................................................7
1.6.5 Comparability....................................................................................................................................8
2.0. SampleCollectionMethodsandTechniques.................................................................................9
2.1 SamplingEquipment...........................................................................................................................9
2.2 SampleCollectionLocation..............................................................................................................9
2.3 SampleCollectionandProcessing..............................................................................................10
2.4 SamplerDecontamination.............................................................................................................11
2.5 SampleDocumentation...................................................................................................................11
2.5.1 SampleNumbersandLabels....................................................................................................11
2.5.2 FieldNotes.......................................................................................................................................11
3.0. SampleHandlingProcedures............................................................................................................13
3.1 SampleContainersandLabels.....................................................................................................13
3.2 SamplePreservationandStorageRequirements................................................................14
3.3 Chain‐of‐CustodyProcedures.......................................................................................................15
4.0. LaboratoryAnalyticalMethods........................................................................................................16
4.1 ConventionalAnalysesandDetectionLimits........................................................................17
4.2 MetalAnalysesandDetectionLimits........................................................................................17

StreamSedimentMonitoringSamplingandAnalysisPlan:GreenRiverBasin
KingCounty v August2012
4.3 OrganicAnalysesandDetectionLimits....................................................................................18
4.4 Dioxin/FuranAnalysesandDetectionLimits.......................................................................21
4.5 QualityAssurance/QualityControl(QA/QC)Practices.....................................................22
4.5.1 AnalysesbyKCEL..........................................................................................................................23
4.5.2 Dioxin/Furans................................................................................................................................24
4.6 DataQualifiers.....................................................................................................................................25
5.0. DataReviewandRecordKeeping....................................................................................................26
5.1 DataReview..........................................................................................................................................26
5.2 RecordKeeping...................................................................................................................................26
6.0. HealthandSafetyRequirements......................................................................................................27
7.0. References..................................................................................................................................................28
Tables Table1. StationLocations..............................................................................................................................3
Table2. DepartmentofEcologyProposedFreshwaterSedimentGuidelines(2003).........5
Table3. Smithetal.Guidelines(1996).....................................................................................................6
Table4. SampleContainers,StorageConditions,PreservationandAnalyticalHoldTimes....................................................................................................................................................13
Table5. ConventionalsMethodsandDetectionLimits...................................................................17
Table6. TotalMetals,Methods,andDetectionLimits(mg/Kgwetweight)..........................17
Table7. SEMMetals,Methods,andDetectionLimits(mg/Kgwetweight)............................18
Table8. BNATargetAnalytesandDetectionLimits(µg/Kgwetweight)...............................19
Table9. ChlorinatedPesticide/PCBTargetAnalytesandDetectionLimits(g/Kgwetweight).......................................................................................................................................20
Table10. EDCTargetAnalytes,Methods,andDetectionLimits(µg/Kgwetweight)..........21
Table11. LabeledSurrogatesandRecoveryStandardsUsedforEPAMethod1613bDioxins/FuransCongenerAnalysis........................................................................................21
Table12. Dioxin/furansolidssampledetectionlimitgoalsinpg/gandlowercalibrationlimitgoals...................................................................................................................22
Table13. SedimentChemistryQualityControlSamples...................................................................23
Table14. QCAcceptanceCriteriaforSedimentChemistrySamples............................................23

StreamSedimentMonitoringSamplingandAnalysisPlan:GreenRiverBasin
KingCounty vi August2012
Table15. Dioxins/furansQA/QCFrequencyandAcceptanceCriteria........................................24
Table16. KCELDataQualifierFlagsandConditionstoQualify......................................................25
Appendices AppendixA. MetalsPerformance‐BasedQCLimitsTables
AppendixB. OrganicsPerformance‐BasedQCLimitsTables
AppendixC. LaboratoryInformationManagementSystem(Lims)ProductsandListTypes

StreamSedimentMonitoringSamplingandAnalysisPlan:GreenRiverBasin
KingCounty 1 August2012
1.0. PROJECT BACKGROUND
Thissamplingandanalysisplan(SAP)documentstheprojectinformationandsamplingandanalyticalmethodologiesfortheStreamsSedimentMonitoringProgram.TheSAPoutlinesthesamplecollectionandanalyticalmethodstoevaluatebulksedimentchemicalconcentrationsinfourstreambasinsthatdraintotheGreenRiver.Bulksedimentchemicalconcentrationswillbemonitoredtobetterunderstandthepotentialsourcesofsediment‐associatedchemicalstotheGreenandDuwamishRivers.
ThemethodsandsamplingstrategiesdocumentedherewerepartoftheKingCountyWaterandLandResourcesDivision(WLRD)10‐yearstreamsedimentmonitoringprogram,whichwasinitiatedin2004.Theprogramwasdevelopedusingstreamsedimentdatathathadbeencollectedbetween1987and2002.The10‐yearprogramwasdesignedtocollectdatafromtheupperportionsofstreambasinstoidentifypotentialcontaminantsourcesthatmayhavecontributedtoconcentrationsfoundatthestreammouthsintheearlierstudy.Itwasalsodesignedtobettercharacterizethevarietyofchemicalsfoundinstreamsedimentsbyevaluatingabroaderrangeofchemicalsincludingdifferentcategoriesoforganicchemicals.Inaddition,theoriginalstreamsedimentmonitoringprogramincludedalimitednumberofsamplinglocationsintheGreenRiverwatershed.Theupdated10‐yearprogramaddedseveralGreenRiverbasincreekstotheprogram.ForfurtherinformationontheStreamsSedimentProgramdesign,seetheStreamsSedimentMonitoringSamplingandAnalysisPlan(KingCounty2004).
However,budgetconstraintsresultedintheeliminationofthe10‐yearmonitoringprogrambeforeitcouldbecompleted.Severalstreamsthatwereslatedtobesampledbutwerenot,arelocatedintheGreenRiverbasin.InterestincharacterizingcontaminantswithintributariestotheGreenRiver,aswellaswithinupperandlowerboundarylocationsalongthemainstemoftheGreenRiverhasresultedinnewinvestigationsfocusedonunderstandingthesourcesofcontaminantstotheGreen/DuwamishRiversystem(e.g.,KingCounty2011).ThestreamssedimentsamplingintheGreenRiverBasinoutlinedinthisSAPwillsupportthesecharacterizationstudies.
1.1 Scope of Work ThisprojectwillinvolvecollectionofsedimentsamplesinwadeablestreamsintheGreenRiverBasinincluding:Mill(Hill)CreekinAuburn,MillCreekinKent,JenkinsCreek,andCovingtonCreek.SampleswillalsobecollectedinthemainstemGreenRiver,bothup‐anddownstreamofwherethestreamslistedabovedraintotheGreenRiver.Wherefeasible,bulksedimentsampleswillbecollectedapproximatelyeverymilebetweenthemouthandtheheadwatersofeachstream.Thesesampleswillbeanalyzedformetals,semi‐volatileorganiccompounds,polychlorinatedbiphenyls(PCBs),organochlorinepesticidesandconventionalparameters.AsubsetofsamplescollectedfromMill(Auburn)andMill(Kent)atthestationsclosesttothemouthsofthestreams,andfromtheGreenRiveratthestationfarthestupstream(FlamingGeyser)andthefarthestdownstream(FosterLinksgolfcourse)willbeanalyzedfordioxins/furans.SampleswerepreviouslycollectedfromSoos,

StreamSedimentMonitoringSamplingandAnalysisPlan:GreenRiverBasin
KingCounty 2 August2012
Newaukum,andSpringbrookCreeksandanalyzedforalloftheparameterslistedaboveexceptdioxins/furans.Therefore,compositesampleswillbecollectedatthemouthsofthesestreams(Soos,Newaukum,andSpringbrook)fortheanalysisofdioxinsandfurans.
1.2 Project Questions Questionsthestreamssedimentprogramwasdesignedtoanswerareasfollows:
Howdoessedimentqualityinstreamscomparetoavailablesedimentguidelinesorthresholds?
Arethereotherchemicalspresentinstreamsedimentsthatdonothaveguidelines?
Aretheredifferencesinsedimentqualitywithinamonitoredstreambasin?
AretheredifferencesinsedimentqualitybetweenthecreeksandtheGreenRiver?
Howissedimentqualitydifferentamongmonitoredstreamsthathavesimilarsamplingstrata?
1.3 Sampling Strategy
1.3.1 Monitoring Program Streams Atargetedstratifieddesignwasusedtoselectsamplinglocations.Streamswereselectedforinclusioninthesamplingprogramiftheymetcertaincriteria.Thissamplingdesignisbasedonexistingdataaswellasthetypesofenvironmentstobecharacterized.Streamsinthemonitoringareawerescreenedusingdataonbasinsize,streamgradient,roaddensity(asameasureofurbanization),elevation,existingsedimentqualitydata,andwhethersalmonidshadeverbeenpresent.
Thelistofscreeningcriteriaisasfollows:
Wadeablestreams
Basinsizebetween2000and36,000acres
Stationslocatedinareaswithastreamgradientfrom0to2percent
Historicusebysalmonids
ElevationcharacteristicofPugetSoundlowlandstreams
Urbandevelopmentisdominanthumanactivityinbasin
Existingsedimentqualitydatasuggestcurrentconditionsmaybeofconcerntotheaquaticcommunity
1.3.2 Stream Basin Analysis Streambasinanalyseswillyieldabetterunderstandingoftheprocessesthataffectsedimentquality,andallowuseofastatisticalapproachforthecharacterizationofsedimentqualityindepositionalareasintheGreenRiverwatershedstreambasins.

StreamSedimentMonitoringSamplingandAnalysisPlan:GreenRiverBasin
KingCounty 3 August2012
Stationshavebeenlocatedineverystreammilethatmeetsthecriterialistedabove.AreconnaissanceofthefourcreekbasinsandtheGreenRiverwasconductedandthefollowingsedimentsamplingstationswereestablishedasshowninTable1.
Table 1. Station Locations
Stream Sediment Sampling Stations Locator x plan y plan Notes
Mill Creek (Auburn)
1 A315 1289725 137218 Existing Site
2 SD315 1289415 133275
3 FR315 1290680 129960
4 TS315 1290765 127160
5 ED315 1290545 122530
6 MS315 1288980 115860
7 PR315 1287170 113555
8 PC315 1281940 117340
9 UH315 1281775 118130
10 LD315 1280650 126365
Mill Creek (Kent)
1 IT318 1292010 163195
2 DT318 1291450 158960
3 FS318 1291205 155285
4 CS318 1292480 150045
5 AA3t18 1294800 146780
6 EP318 1295940 142700
7 EG318 1301075 135305
8 SH318 1299685 137710
Covington Creek
1 AB320 1321350 119105
2 CC320 1324280 116570
3 C320 1327045 116490
4 CD320 1329470 113590
5 PT320 1338290 122575
6 Z320 1339866 124875 Existing Site
7 S320 1346550 126070
Jenkins Creek
1 D320 1319039 126881 Existing Site
2 WX320 1322235 129990
3 JK320 1325834 133151 Existing Site
4 FR320 1326790 137155

StreamSedimentMonitoringSamplingandAnalysisPlan:GreenRiverBasin
KingCounty 4 August2012
Stream Sediment Sampling Stations Locator x plan y plan Notes
5 DT320 1331205 140380
6 LW_20 1339395 140055
Green River
1 FL319 1288012 177997 Existing Site- Foster Links
2 0318 1294280 134927 Existing Site
3 A319 1307302 113108 Existing Site
4 FG319 1341097 104038 Existing Site-Flaming Geyser
1.4 Tools to be used in analyzing the data FreshwatersedimentqualitystandardsfortheStateofWashingtonarenot
available;therefore,chemicalconcentrationswillbecomparedtoEcology’sproposedfreshwatersedimentqualityguidelinesandotheravailablethresholdsandguidelines(i.e.WashingtonStateDepartmentofEcology&AvocetConsulting,2003,andSmithetal.,1996.)
GISwillbeusedtomapthespatialdistributionofchemicalconcentrationsandexceedancesofsedimentguidelinesorthresholds.
AVS/SEMratioswillbeusedtobetterunderstandthebioavailabilityofmetals.
1.5 Data Requirements Thedatarequirementsforbothcharacterizationsoftheparameterconcentrationsandcomparisonwithsedimentqualityguidelinesrequireindependentsamples.Fort‐testsandcalculationofmeansandstandarddeviationsnormallydistributeddataarerequired.Ifdataarenotnormallydistributed,appropriatestatisticsforusewillbedetermined.
1.6 Chemical Testing Sedimentsampleswillbecollectedforchemicaltestingusingstandardizedequipmentandprocedures.
Conventionalparameters.Particlesizedistribution(PSD),pH,totalsolids,totalorganiccarbon(TOC)andacidvolatilesulfides(AVS)willbeanalyzed.
Metals.Simultaneouslyextractablemetals(AVS/SEMforarsenic,cadmium,copper,lead,mercury,nickel,silver,andzinc).Totalmetalsanalysistoincludearsenic,cadmium,chromium,copper,lead,mercury,nickel,silver,andzinc.
Organics.Base/neutral/acidextractablesemivolatilecompounds(BNAs),endocrinedisruptingcompounds(EDCs)(4‐nonylphenol,bisphenolA,bis(2‐ethylhexyl)adipate,coprostanol),chlorinatedpesticides,andPCBs(asAroclors).
Dioxin/Furan.17dioxin/furan(D/F)congeners.

StreamSedimentMonitoringSamplingandAnalysisPlan:GreenRiverBasin
KingCounty 5 August2012
1.6.1 Data Quality Objectives Itistheintentofthisstudytoproducedataofsufficientqualitytobeabletomeetthefollowingprojectgoals:
Toevaluatesedimentqualityconditionsinstreambasins.
Tocomparesedimentdatatoavailableproposedsedimentqualityguidelines.Forconstituentsthatdonothaveproposedguidelines,literaturevaluesmaybeusedtobetterunderstandtheeffectsoftheconcentrationsfound.
ThesedimentqualityguidelineschosenforcomparisonandinterpretationofthestreamssedimentmonitoringdataareshowninTables2and3.
Table 2. Department of Ecology Proposed Freshwater Sediment Guidelines (2003)
Compound or Element Guideline Units (dry wt)
2-Methylnaphthalene 470 PPB
Acenaphthene 1060 PPB
Acenaphthylene 470 PPB
Anthracene 600 PPB
Antimony 0.4 PPM
Aroclor 1254 230 PPB
Arsenic 20 PPM
Benzo(a)anthracene 4260 PPB
Benzo(a)pyrene 3300 PPB
Benzo(g,h,i)perylene 4020 PPB
Bis(2-ethylhexyl) phthalate 230 PPB
Butyl benzyl phthalate 260 PPB
Cadmium 0.6 PPM
Chromium 95 PPM
Chrysene 5940 PPB
Copper 50 PPM
Dibenz(a,h)anthracene 300 PPB
Dibenzofuran 400 PPB
Dimethyl phthalate 46 PPB
Di-n-octyl phthalate 26 PPB
Fluoranthene 5000 PPB
Fluorene 200 PPB
Total HPAHs 3000 PPB
Indeno(1,2,3-c,d)pyrene 4120 PPB
Lead 335 PPM

StreamSedimentMonitoringSamplingandAnalysisPlan:GreenRiverBasin
KingCounty 6 August2012
Compound or Element Guideline Units (dry wt)
Total LPAHs 500 PPB
Mercury 0.5 PPM
Naphthalene 100 PPB
Nickel 55 PPM
Phenanthrene 6100 PPB
Pyrene 3000 PPB
Silver 0.55 PPM
Total Benzofluoranthenes (b,j,k) 450 PPB
Total PCBs 60 PPB
Zinc 140 PPM
Aroclor 1260 140 PPB
Notes:
HPAHs – High molecular weight PAHs
LPAHs–LowmolecularweightPAHs
TotalLPAHsisthesumofdetectednaphthalene,2‐methylnaphthalene,acenaphthylene,acenaphthene,fluorene,phenanthrene,andanthracene.
TotalHPAHsisthesumofdetectedfluoranthene,pyrene,benz(a)anthracene,chrysene,benzo(k)fluoranthene,benzo(b)fluoranthene,benzo(a)pyrene,indeno(1,2,3‐cd)pyrene,dibenz(a,h)anthracene,andbenzo(g,h,i)perylene.
TotalPCBsisthesumofthedetectedAroclors
Table 3. Smith et al. Guidelines (1996)
Compound or Element Guideline Units (dry wt)
Arsenic 5.9 PPM
BAA (Benzo(a)anthracene 31.7 PPB
BAP (Benzo(a)pyrene) 31.9 PPB
Cadmium 0.596 PPM
Chlordane 4.5 PPB
Chromium 37.3 PPM
Chrysene 57.1 PPB
Copper 35.7 PPM
Total DDT 7 PPB
Dieldrin 2.85 PPB
Endrin 2.67 PPB
Fluoranthene 111.3 PPB
HEPCL_EPOX (Heptachlor epoxide) 0.6 PPB
Lead 35 PPM
Lindane 0.94 PPB

StreamSedimentMonitoringSamplingandAnalysisPlan:GreenRiverBasin
KingCounty 7 August2012
Compound or Element Guideline Units (dry wt)
Mercury 0.174 PPM
Nickel 18 PPM
Total PCBs 34.1 PPB
Phenanthrene 41.9 PPB
4,4’-DDD 3.54 PPB
4,4’-DDE 1.42 PPB
Pyrene 53 PPB
Zinc 123.1 PPM
Projectdatawillundergorigorousqualityassurancereview,whichwillassess,amongotherthings,precisionandbias,representativeness,completeness,andcomparability.DatawillbereviewedaccordingtoQualityAssurance1(QA1)guidelines(PTI,1989a).
1.6.2 Precision, Accuracy, and Bias Precisionistheagreementofasetofresultsamongthemselvesandisameasureoftheabilitytoreproducearesult.Accuracyisanestimateofthedifferencebetweenthetruevalueandthedeterminedmeanvalue.Theaccuracyofaresultisaffectedbybothsystematicandrandomerrors.Biasisameasureofthedifference,duetoasystematicfactor,betweenananalyticalresultandthetruevalueofananalyte.Precision,accuracy,andbiasforanalyticalchemistrymaybemeasuredbytheanalysisofvariouslaboratoryQCsamplessuchasmethodblanks,matrixspikes,certifiedreferencematerials,andlaboratoryduplicatesortriplicates.
1.6.3 Representativeness Representativenessexpressesthedegreetowhichsampledataaccuratelyandpreciselyrepresentacharacteristicofapopulation,parametervariationsatthesamplingpoint,oranenvironmentalcondition.Sampleswillbecollectedfromstationswithpreselectedcoordinatestorepresentspecificsitelocations.Followingtheguidelinesdescribedforsamplerdecontamination,sampleacceptabilitycriteria,andsampleprocessingwillhelpensurethatsamplesarerepresentative.
1.6.4 Completeness Completenessisdefinedasthetotalnumberofsamplesanalyzedforwhichacceptableanalyticaldataaregenerated,comparedtothetotalnumberofsamplestobeanalyzed.Samplingatstationswithknownpositioncoordinatesinfavorableconditions,alongwithadherencetostandardizedsamplingandtestingprotocolswillaidinprovidingacompletesetofdataforthisproject.Thegoalforcompletenessis100percent.If100percentcompletenessisnotachieved,thestudyprojectmanagerwillevaluateifthedataqualityobjectivescanstillbemetorifadditionalsamplesmayneedtobecollectedandanalyzed.

StreamSedimentMonitoringSamplingandAnalysisPlan:GreenRiverBasin
KingCounty 8 August2012
1.6.5 Comparability Comparabilityisaqualitativeparameterexpressingtheconfidencewithwhichonedatasetcanbecomparedwithanother.Thisgoalisachievedthroughusingstandardtechniquestocollectandanalyzerepresentativesamples,alongwithstandardizeddatavalidationandreportingprocedures.ByfollowingtheguidanceofthisSAP,thegoalofcomparabilitywillbeachieved.

StreamSedimentMonitoringSamplingandAnalysisPlan:GreenRiverBasin
KingCounty 9 August2012
2.0. SAMPLE COLLECTION METHODS AND TECHNIQUES
Thissectiondescribessamplecollectionproceduresthatwillbefollowedtohelpensurethatprogramdataqualityobjectivesaremet.Includedinthissectionarehealthandsafetyrequirements,stationpositioning,samplecollectionandprocessingprocedures,andfielddocumentation.
2.1 Sampling Equipment Pre‐cleanedPVCcoretubes.KingCountyEnvironmentalLaboratory(KCEL)uses2
¾”x3’tubeswithoneendfiledtotaperededgestoformapenetratingedge.
PetitePonarsedimentsampler
Setofpre‐labeledsamplingcontainers.ForcurrentKingCountyroutinestreamsproject,thisincludescontainersformetals,organics,conventionals,andsubcontractedparameters.SeeSection3.1forcontainertype,preparation,andsamplevolumes.
Stainlesssteelspoonforcollectingsampleifcoretubeisnotappropriate
Stainlesssteelspatula,spoons,andbowlforcompositingandsplittingsample
SturdynitrileorPVCglovesforsamplecollectionfromstream
Labqualitynitrileglovesforcompositingandsplittingsamples
Fieldsheetswithaclipboardandwaterproofpens
Scientificcollectionpermitifappropriate
Fieldclothesandsafetygear,includingorangetrafficvest
Digitalcamera
HandheldGPS
Severalplastic5galloncarboysoflaboratoryROwaterforequipmentcleaning
Detergent8andscrubbrush
Coolerswithiceandplasticbarrier
2.2 Sample Collection Location AsoutlinedintheEPAmethodforsamplingstreamssediments(EPA,1999),“contaminantsaremorelikelytobeconcentratedinsedimentstypifiedbyfineparticlesizeandhighorganicmattercontent.Thistypeofsedimentismostlikelytobecollectedfromdepositionalzones.”Forthisreason,KCELpersonnelwillattempttoselectasamplinglocationwherefinesarepresent.Ifnosuchlocationcanbefound,alocationwiththe

StreamSedimentMonitoringSamplingandAnalysisPlan:GreenRiverBasin
KingCounty 10 August2012
smallestgrainsizeobservedwillbesampled,andthiswillbenotedonthefieldsheet.Ifappropriate,ahandheldGPSwillbeusedtoacquireandrecordNAD83coordinatesforlatitudeandlongitudeofthelocation.
2.3 Sample Collection and Processing Samplesfromthetributarystreamsarecollectedfrombeneathashallowaqueouslayer(<2ft)usingapre‐cleanedPVCcoretubetopenetratethebottomsedimentofthestreamtoadepthof5to10centimeters.Astainlesssteelspatulaorglovedhandisinsertedunderthecoretubemouthtotrapthesedimentinside,andthetubeisremovedfromthestream.Thetubecanbeslowlyangledtothesidetoallowexcesswatertodrainoff,butcareshouldbetakennottoallowanyfinestoescape.Thesedimentinthetubeisthentransferredintothestainlesssteelcompositingcontainer.Thisprocessisrepeatedaminimumoffivetimestoacquireanappropriateamountofmaterialtofillallsamplecontainersaftercompositing.Ifcoretubepenetrationispoor,orstreambedisrockyorgravelly,orifadditionalsedimentvolumeisneededtofillallsamplecontainers,additionalcoretubesmaybecollected.
Ifthereisexcesswaterinthecompositingcontaineraftermaterialiscollected,itwillbedecantedoffoncefineshavebeenallowedtosettle.Astainlesssteelspoonorspatulaisusedtohomogenizethesamplebystirring.Rocksorotherdebrisahalfinchindiameterorlargercanberemovedanddiscarded.
Iffinesedimentsatthesamplingsitearepresentbutareconfinedtoareassmallerthanapproximately3”x3”,apre‐cleanedstainlesssteelspoonwillbeusedtoacquirethesubsamples.Thismethodworkswellinareasthatareoutofthemainflowofthestream,whichiswheredepositionalareasarelocated.Carewillbetakentoinsurethatfinematerialwillnotbelostduringsubsamplecollection.
AttheFosterLinkssiteontheGreenRivermainstem,sedimentwillbecollectedusingaPetitePonardeviceloweredfromthegolfcartbridgeovertheriver.Aminimumofthreecastswillbecollectedfromthetop5to10centimetersandcompositedbeforehomogenizationofthesedimentinastainlesssteelbowl.Oncesufficientsedimenthasbeencollectedinthestainlesssteelbowl,itwillbethoroughlymixed.Anyparticlesgreaterthan2centimetersinsizewillberemovedfromthesampleandreturnedtotheriver.Aftermixing,sampleswillbeplacedintopre‐cleanedsamplecontainersprovidedbyKCEL.
Itispossiblethatnotallstationswillyieldsufficientsamplevolumetoallowcompletionofallrequestedanalyses.Analyseshavebeenrankedinorderofdecreasingpriority,asfollows:
TotalPCBs(asAroclors)
Metalsandmercury
Conventionalanalyses(PSD,totalsolids,TOC,andpH)
BNAandselectedotherorganiccompounds
Dioxin/Furan
Organochlorinepesticides

StreamSedimentMonitoringSamplingandAnalysisPlan:GreenRiverBasin
KingCounty 11 August2012
AVS/SEM
Note: The exception to the sediment compositing regime is the collection of a samplealiquotforanalysisofAVS/SEM.Thisaliquotshouldbecollectedfromthefirstacceptablegrabandplacedimmediatelyintotheappropriatecontainer(noheadspace).
2.4 Sampler Decontamination Priortoarrivingonsite,coretubesarecleanedinthelabwithdetergent8,soakingina5%acidsolution,andfinallyrinsedwithdeionizedwater.Afterairdrying,bothendsofthetubesarecoveredwithfoil.
Onceinthefield,boththePonarsamplerandthecoretubeswillbedecontaminatedbetweensamplingstationsbyscrubbingwithabrushtoremoveexcesssediment,andathoroughinsiturinsing.Theuseofaphosphate‐freedetergentsolutionwillbeoptional.Solventoraciddecontaminationofsamplersinthefieldisnotrecommendedtopreventtheintroductionofthesechemicalsintothesamplingenvironment.Apre‐cleanedstainlesssteelspoonandbowl(compositingcontainer)willbeusedateachlocationasnecessary.Spoonsandbowlsusedatonelocationwillbetransportedbacktothelaboratoryforcleaningbeforeanyadditionalfielduse.
2.5 Sample Documentation Thissectionprovidesguidancefordocumentingsamplinganddatagatheringactivities.Thedocumentationoffieldactivitiesprovidesimportantprojectinformationanddatathatcansupportdatageneratedbylaboratoryanalyses.
2.5.1 Sample Numbers and Labels Samplelocationswillbeidentifiedusingauniquelocatorname.Thelocatorname,thedateofcollectionandtheuniquesampleidentificationnumbergeneratedbyKCELwillidentifyindividualsamplescollectedateachlocation.Samplenumberswillbeassignedpriortothesamplingeventandwaterprooflabelsgeneratedforeachsamplecontainer.
2.5.2 Field Notes Fieldnoteswillbemaintainedforallfieldactivities,boththecollectionofsamplesandthegatheringofenvironmentaldata.Fieldnoteswillbekeptonwater‐resistantpaperandallfielddocumentationwillberecordedinindelible,blackorblueink.Fieldnoteswillberecordedonpre‐printedfieldsheets,preparedspecificallyforthisproject.Informationrecordedonfieldnoteswillinclude,butnotbelimitedto:
nameofrecorder
sampleorstationnumber
samplestationlocatorinformation
dateandtimeofsamplecollection

StreamSedimentMonitoringSamplingandAnalysisPlan:GreenRiverBasin
KingCounty 12 August2012
physicalcharacteristicsofsedimentsuchascolor,grossgrainsizedistribution,debris,andodor
GPScoordinates,ifcollected
#ofindividualgrabscollected
Additionalinformationthatmayberecordedonthefieldsheetsincludessamplingmethodologyandanydeviationsfromestablishedsamplingprotocols.Additionalanecdotalinformationpertainingtoobservationsofunusualsamplingeventsorcircumstancesmayalsoberecordedonthefieldsheets.

StreamSedimentMonitoringSamplingandAnalysisPlan:GreenRiverBasin
KingCounty 13 August2012
3.0. SAMPLE HANDLING PROCEDURES
Consistentsamplehandlingproceduresarenecessarytomaintainsampleintegrityandprovidehigh‐qualitydefensibledata.Thissectionprovidesrequirementsforpropersamplecontainers,labeling,preservationandstorage,andchain‐of‐custody.
3.1 Sample Containers and Labels Allsampleswillbecollectedintopre‐cleaned,laboratory‐suppliedcontainersaffixedwithcomputer‐generatedlabels.SamplecontainerswillbeselectedbasedonPugetSoundProtocolguidelines(PSEP,1996).Informationcontainedonsamplelabelswillinclude:auniquesamplenumber;informationaboutthesamplinglocation;thecollectiondate;therequestedanalyses;andinformationaboutanychemicalusedinsamplepreservation.SamplecontainersaresummarizedinTable4.
Table 4. Sample Containers, Storage Conditions, Preservation and Analytical Hold Times
Analyte Container Preferred Storage Conditions
Hold Time Acceptable Storage Conditions
Hold Time
Particle Size Distribution
16-oz. CWM PP or glass (collect one extra 16-oz container per 20 samples for QC)
refrigerate at 4C 6 months to analyze
N/A N/A
Total Organic Carbon (TOC)
4-oz. CWM PP or glass
freeze at -18C 6 months to analyze
refrigerate at 4C 14 days to analyze
Total Solids (collect w/ TOC)
4-oz. CWM PP or glass
freeze at -18C 6 months to analyze
refrigerate at 4C 14 days to analyze
pH 4-oz. CWM PP or glass
refrigerate at 4C 1 day N/A N/A
Acid Volatile Sulfide (AVS)
4-oz. CWM PP or glass
refrigerate at 4C
No headspace
14 days to analyze
N/A N/A
Mercury (Hg) (collect with other metals)
4-oz. CWM PP
freeze at -18C 28 days to analyze
N/A N/A
SEM Mercury (collect w/AVS; distill w/other SEM metals)
500-ml acid washed HDPE
room temperature
14 days to analyze
N/A N/A

StreamSedimentMonitoringSamplingandAnalysisPlan:GreenRiverBasin
KingCounty 14 August2012
Analyte Container Preferred Storage Conditions
Hold Time Acceptable Storage Conditions
Hold Time
Other Metals (collect w/Mercury
4-oz. CWM PP
freeze at -18C 2 years to analyze
refrigerate at 4C 6 months to analyze
SEM Metals (collect w/AVS; distill w/SEM Mercury)
500-ml acid washed HDPE
room temperature
14 days to analyze
N/A N/A
BNAs, including PAHs, phthalates, EDCs and other compounds
16-oz. glass freeze at -18C 1 year to extract
40 days to analyze
refrigerate at 4C 14 days to extract
40 days to analyze
Organochlorine pesticides/PCBs
16-oz. glass freeze at -18C 1 year to extract
40 days to analyze
refrigerate at 4C 14 days to extract
40 days to analyze
Dioxins/furans 8-oz. glass freeze at -10C 1 year to extract
1 year to analyze
N/A N/A
Notes:
BNAs–base/neutral/acidextractablesemivolatileorganiccompounds
PP‐polypropylene
CWMPP–Clear,wide‐mouthpolypropylene
3.2 Sample Preservation and Storage Requirements
Allsampleswillbekeptinice‐filledcoolersuntildeliverytoKCELonthedayofcollection.Noadditionalpreservativeisrequiredforsolidssamples.SedimentsampleswillbestoredunderchainofcustodyattheKCELandmaintainedassuchthroughouttheanalyticalprocess.Dependingonthetypeofanalysis,sampleswillbestoredeitherrefrigeratedatatemperatureofapproximately4Corfrozenatapproximately‐18C.Samplepreservationrequirementsandstorageconditionsaswellasanalyticalholdingtimesaresummarizedinthetableabove.
Dioxin/furansampleswillbewrappedinindividualZiplocbagsandshippedfrozenincoolerswithiceorfrozengelpackstoAXYSAnalyticalServices(AXYS)viaovernightdeliverywithinfourtoeightweeksofsamplecollection.Thetemperatureinsidethecooler(s)containingdioxin/furansampleswillbecheckeduponreceiptatAXYS.AXYSwillalsoassigneachdioxin/furansamplewithauniquelaboratorynumberfortrackingwithintheirsystem.

StreamSedimentMonitoringSamplingandAnalysisPlan:GreenRiverBasin
KingCounty 15 August2012
3.3 Chain-of-Custody Procedures Fieldchain‐of‐custody(COC)procedureswillbefollowedfromthetimeasampleiscollecteduntilitisrelinquishedtotheanalyticallaboratory.COCdocumentationwillbeinitiatedwhenthefirstsampleiscollectedandupdatedcontinuouslythroughoutthesamplingevent.Documentationwillbecompletedforeachdayoffieldsampling.Informationtobeincludedonthedocumentationissamplenumber,dateandtimeofsampling,namesofallsamplingpersonnelandrequestedanalyses.Asamplewillbeconsideredtobe“incustody”wheninthepossessionofsamplingpersonnelorinasecuredsamplingareasuchaslockedinafieldvehicle.Sampleswillnotbeconsideredincustodywhenleftunattendedinthefieldorinanunlockedfieldvehicle.Custodysealswillbeplacedonthesamplecoolerwhenitisnotinthecustodyofamemberofthesamplingteam.
COCwillbemaintainedthroughouttheanalyticalphaseoftheprojectaccordingtostandardKCELprotocolsandanysubcontractinglaboratorystandardoperatingprotocols.CopiesofCOCformswillaccompanydioxin/furansamplesbeingshippedtoAXYS.Oncecompleted,originalCOCformswillbearchivedintheprojectfileatKCEL.

StreamSedimentMonitoringSamplingandAnalysisPlan:GreenRiverBasin
KingCounty 16 August2012
4.0. LABORATORY ANALYTICAL METHODS
Thissectionpresentsthechemicalanalyticalmethodologiesthatwillbeemployedduringthisproject,alongwithassociateddetectionlimitswhereappropriate.Adherencetostandardizedanalyticalprotocolsandassociatedqualityassurance/qualitycontrol(QA/QC)guidelinesforchemicaltestingwillhelpproducedataabletoundergotherigorsofQA1dataanalysisandmeettheprojectgoalsandobjectives.KCELwillconductallchemicalandconventionalanalysesexceptdioxin/furans.Dioxin/furanswillbeanalyzedbyAXYSAnalyticalServices.
Forchemicalanalyses,theKCELdistinguishesbetweenamethoddetectionlimit(MDL)andareportingdetectionlimit(RDL).
TheMDLisdefinedastheminimumconcentrationofachemicalconstituentthatcanbedetected.
TheRDLisdefinedastheminimumconcentrationofachemicalconstituentthatcanbereliablyquantified.TheRDLcanbeconsideredequivalenttoaPracticalQuantitationLimit(PQL).
ActualKCELMDLsandRDLsmaydifferfromthetargetdetectionlimitgoalsasaresultofnecessaryanalyticaldilutionsorareductionofextractedsampleamountsbasedonapreliminaryexaminationofthesample(includingtotalsolidvalues).Whensampleextractsaredilutedbecausetheconcentrationsforoneormoretargetanalytesexceedtheupperendofthecalibrationcurveorparameterspecificinterferences,MDLsandRDLsfromtheoriginal,undilutedextractwillbereportedforparametersotherthanthetargetanalytesthatrequireddilution.EveryeffortwillbemadetomeettheMDL/RDLgoalslistedintheSAP.HowevertheremaybetimeswhentheMDL/RDLvaluesrisebecausethesamplemustberunatagreaterdilution.Thismaybeduetotheconcentrationofsometargetanalytesexceedingthecalibrationrange,interferingtargetornon‐targetcompounds,orrunQCnotpassing(e.g.,internalstandardfailures).Non‐detectedtargetanalyteswillbereportedfromthelowestdilutionpossible(nointerferencesandtherunQCmustpass).Targetanalytesthataredetectedmustbereportedfromanappropriatedilution.Thedilutionchosenmusthavenointerferences,therunQCmustpass,andwhereverpossiblethevaluethatisgreaterthantheRDLwillbechosen.
Fordioxin/furanhighresolutionisotopicdilutionbasedmethods,theMDLandRDLtermsarelessapplicablebecauselimitsofquantitationarederivedfromcalibrationcapabilitiesandubiquitousbuttypicallylowlevelequipmentandlaboratoryblankcontamination.Additionalreportinglimittermsusedfordioxin/furancongeneranalysesare:samplespecificdetectionlimit(SDL),andlowestmethodcalibrationlimits(LMCL).TheSDLisdeterminedbyconvertingtheareaequivalentto2.5timestheestimatedchromatographicnoiseheighttoaconcentration.SDLsaredeterminedindividuallyforeverycongenerofeachsampleanalysisrunandaccountsforanyeffectofmatrixonthedetectionsystemand

StreamSedimentMonitoringSamplingandAnalysisPlan:GreenRiverBasin
KingCounty 17 August2012
forrecoveryachievedthroughtheanalyticalwork‐up.LMCLsarebasedoncalibrationpointsfromstandardsolutions.Theyareproratedbysamplesizeandaresupportedbystatisticallyderivedmethodreportinglimit(MRL)values.Thedioxin/furancongenerdatawillbereportedtoLMCLandflaggedasestimatesdowntotheSDLvalue.InmanycasestheSDLmaybebelowtheLMCL.
4.1 Conventional Analyses and Detection Limits Conventionalanalyses,analyticalmethodsandassociateddetectionlimitsaresummarizedinTable5.AllconventionalanalyseswillbeperformedattheKCEL.
Table 5. Conventionals Methods and Detection Limits
Parameter LIMS
Product LIMS
Listtype Method MDL RDL Units
PSD (gravel and sand) PSD CVPSD ASTM D422 0.1 1 percent dry wt.
PSD (silt and clay) PSD CVPSD ASTM D422 0.5 1 percent dry wt.
Total Organic Carbon TOC CVTOC EPA 9060, PSEP 1996 500 1,000 mg/Kg wet wt.
pH PH CVPH SW846 9045D N/A N/A pH
Total Solids TOTS CVTOTS SM 2540-G 0.005 0.01 percent wet wt.
Acid Volatile Sulfide AVS CVAVS EPA, Dec 1991 0.25 1 mg/Kg wet wt.
PSD: particle size distrubtion
ATSTM - American Society for Testing and Materials
SM – Standard Methods
4.2 Metal Analyses and Detection Limits AllmetalsanalyseswillbeperformedbytheKCEL.Targetelements,analyticalmethods,andassociateddetectionlimitsaresummarizedinTable6.Withtheexceptionofmercury,allmetalswillbeanalyzedbyinductivelycoupledplasmamassspectroscopy(ICP‐MS).
Table 6. Total Metals, Methods, and Detection Limits (mg/Kg wet weight)
Analyte LIMS
Product LIMS listtype Method MDL RDL
Silver Ag-ICPMS MTICPMS-SED, 6-SED SW846 3050B*SW846 6020A 0.10 0.50
Arsenic As-ICPMS MTICPMS-SED, 6-SED SW846 3050B*SW846 6020A 0.025 0.125
Cadmium Cd-ICPMS MTICPMS-SED, 6-SED SW846 3050B*SW846 6020A 0.0125 0.0625
Chromium Cr-ICPMS MTICPMS-SED, 6-SED SW846 3050B*SW846 6020A 0.050 0.25
Copper Cu-ICPMS MTICPMS-SED, 6-SED SW846 3050B*SW846 6020A 0.10 0.50
Lead Pb-ICPMS MTICPMS-SED, 6-SED SW846 3050B*SW846 6020A 0.025 0.125
Mercury HG-CVAA-M MTHG-MIDS, 6-SED EPA 7471B 0.04 0.4
Nickel Ni-ICPMS MTICPMS-SED, 6-SED SW846 3050B*SW846 6020A 0.025 0.125
Zinc Zn-ICP MTICPMS-SED, 6-SED SW846 3050B*SW846 6020A 0.125 0.625

StreamSedimentMonitoringSamplingandAnalysisPlan:GreenRiverBasin
KingCounty 18 August2012
TheMDLsandRDLsarepresentedonawet‐weightbasis.TheTotalMetalsMDL/RDLsarebasedonaninitialanalyticalsampleweightof1(±0.05g)andafinalvolumeof100mLformercuryand50mLforallothermetals.Sampleweightswillbeincreasedifthetotalsolidsarelowenoughthat,whendry‐weightnormalized,thesample‐specificRDLwillnotmeetthefreshwatersedimentqualityreferencevalues.
SEM‐extractmetals,withtheexceptionofmercury,willbeanalyzedbyinductivelycoupledplasmaatomicemissionspectroscopy(ICP‐OES).SEM‐extractmercurywillbeanalyzedbycoldvaporatomicabsorption(CVAA).TargetSEMmetals,methodsandassociateddetectionlimitsaresummarizedinTable7.TheSEMMetalsMDL/RDLsarebasedonaninitialanalyticalsampleweightof10gandafinalvolumeof200mL.TheSEMMetalsareextractedbytheConventionalsunit.
Table 7. SEM Metals, Methods, and Detection Limits (mg/Kg wet weight)
Analyte LIMS Product LIMS listtype Method MDL RDL
Silver Ag-SEM, EXT MTICP-SEM, 6-SEM EPA 821 1991/200.7*SW846 6010C 0.08 0.40
Arsenic As-SEM, EXT MTICP-SEM, 6-SEM EPA 821 1991/200.7*SW846 6010C 0.5 2.5
Cadmium Cd-SEM, EXT MTICP-SEM, 6-SEM EPA 821 1991/200.7*SW846 6010C 0.04 0.20
Chromium Cr-SEM, EXT MTICP-SEM, 6-SEM EPA 821 1991/200.7*SW846 6010C 0.06 0.30
Copper Cu-SEM, EXT MTICP-SEM, 6-SEM EPA 821 1991/200.7*SW846 6010C 0.08 0.40
Lead Pb-SEM, EXT MTICP-SEM, 6-SEM EPA 821 1991/200.7*SW846 6010C 0.4 2.0
Mercury Hg-SEM, EXT MTHG-SEM, 6-SEM EPA 821 1991/200.7*SW846 6010C 0.001 0.003
Nickel Ni-SEM, EXT MTICP-SEM, 6-SEM EPA 821 1991/200.7*SW846 6010C 0.1 0.5
Zinc Zn-SEM, EXT MTICP-SEM, 6-SEM EPA 821 1991/200.7*SW846 6010C 0.1 0.5
4.3 Organic Analyses and Detection Limits Allorganicanalysesexceptdioxins/furanswillbeperformedbytheKCEL.OrganicparameterswillincludeBNAs,EDCs,organochlorinepesticidesandPCBs(asAroclors).Theanalyticalmethodsanddetectionlimitsforthetargetorganiccompoundsaresummarizedonawet‐weightbasisbelow.
ThedetectionlimitsforthetargetBNASMScompoundsaresummarizedinTable8.BNASMSanalysisisperformedaccordingtoEPAmethods3550C/8270D(SW846),whichemployssolventextractionwithsonicationandanalysisbygaschromatography/massspectroscopy(GC/MS).TheLIMSproductforreportingtheseanalyticalparametersisBNASMS,andthecorrespondinglisttypeisORBNASMS.

StreamSedimentMonitoringSamplingandAnalysisPlan:GreenRiverBasin
KingCounty 19 August2012
Table 8. BNA Target Analytes and Detection Limits (µg/Kg wet weight)
Analyte MDL RDL Analyte MDL RDL
1,2,4-Trichlorobenzene 0.53 1.07 Dibenzofuran 5.3 10.7
1,2-Dichlorobenzene 5.33 5.33 Diethyl phthalate 11 21.3
1,4-Dichlorobenzene 8.00 8.00 Dimethyl phthalate 10.7 10.7
2,4-Dimethylphenol 5.3 10.7 Di-n-butyl phthalate 11 21.3
2-Methylnaphthalene 5.3 10.7 Di-n-octyl phthalate 10.7 10.7
2-Methylphenol 5.3 10.7 Fluoranthene 5.3 10.7
3-,4-Methylphenol 27 53.3 Fluorene 5.3 10.7
Acenaphthene 5.3 10.7 Hexachlorobenzene 0.53 1.07
Acenaphthylene 5.3 10.7 Hexachlorobutadiene 2.7 5.33
Anthracene 5.3 10.7 Indeno(1,2,3-cd)pyrene 5.3 10.7
Benzo(a)anthracene 5.3 10.7 Naphthalene 5.3 10.7
Benzo(a)pyrene 5.3 10.7 N-Nitrosodiphenylamine 13.3 13.3
Benzo(b,j,k)fluoranthene 5.3 10.7 Pentachlorophenol 80.0 80.0
Benzo(g,h,i)perylene 5.3 10.7 Phenanthrene 5.3 10.7
Benzoic acid 107 107 Phenol 27 80.0
Benzyl alcohol 13.3 13.3 Pyrene 5.3 10.7
Benzyl butyl phthalate 8.00 8.00 Total LPAHs 5.3 10.7
Bis(2-ethylhexyl) phthalate 11 21.3 Total HPAHs 5.3 10.7
Chrysene 5.3 10.7 Total 4-nonylphenol 53 107
Dibenzo(a,h)anthracene 5.3 10.7 Carbazole*** 5.3 10.7
***CarbazolewillbeaddedtotheORBNASMSlisttypeforthepurposesofthisprojectonly.
Note:MDLandRDLsbaseduponastandard30gto1mlfinalvolumewithGPCcleanup
PriortoBNApreparationandanalysis,thetotalsolidresultswillbeusedtoverifythatthestandard30gto1mlextractionwillallowanalyteLIMSRDLstomeettheproposedfreshwatersedimentguidelines(seeTable2andTable3).Ifnecessary,theextractionsampleamountandfinalvolumeswillbeadjustedaccordinglytoensurethattheLIMSRDLisatorbelowtheappropriatecriteriavalue.
TheMDLandRDLforspecificanalytesrequiringdilution(e.g.,exceedanceofanalytecalibrationrange)willbeincreasedtoreflectthedilution.Incaseswhereadilutionisnecessitatedbyamatrixinterferenceorothersampleissue,andtheresultingLIMSRDLforaspecificanalyteexceedsthespecifiedcriteriaandtheanalyteisnotdetected,theLIMSRDLexceedanceofthecriteriawillbediscussedwiththeprojectmanagerandnotedintheappropriateanalyticalcasenarrative.
Thedetectionlimitsforthetargetchlorinatedpesticide/PCBcompoundsaresummarizedinTable9.Chlorinatedpesticide/PCBanalysisisperformedaccordingtoEPAmethods3550C/8081B/8082A(SW846),whichemployssolventextractionwithsonicationandanalysisbygaschromatography/electroncapturedetector(GC/ECD)withdualcolumnconfirmation.TheLIMSproductsforthisanalysisCLPESTandPCBandlisttypesareORCLPESTandORPCB.

StreamSedimentMonitoringSamplingandAnalysisPlan:GreenRiverBasin
KingCounty 20 August2012
Table 9. Chlorinated Pesticide/PCB Target Analytes and Detection Limits (g/Kg wet weight)
Analyte MDL RDL Analyte MDL RDL
Aroclor 1016 1.3 5.33 Delta-BHC 0.53 1.07
Aroclor 1221 2.7 5.33 Dieldrin 0.53 1.07
Aroclor 1232 2.7 5.33 Endosulfan I 0.53 1.07
Aroclor 1242 1.3 5.33 Endosulfan II 0.53 1.07
Aroclor 1248 1.3 5.33 Endosulfan Sulfate 0.53 1.07
Aroclor 1254 1.3 5.33 Endrin 0.53 1.07
Aroclor 1260 1.3 5.33 Endrin Aldehyde 0.53 1.07
4,4'-DDD 0.53 1.07 Gamma-BHC (Lindane) 0.53 1.07
4,4'-DDE 0.53 1.07 trans-Chlordane 0.53 1.07
4,4'-DDT 0.53 1.07 Heptachlor 0.53 1.07
Aldrin 0.53 1.07 Heptachlor Epoxide 0.53 1.07
Alpha-BHC 0.53 1.07 Methoxychlor 2.7 5.33
Alpha-Chlordane 0.53 1.07 Toxaphene 11 53.3
Beta-BHC 0.53 1.07
Note:MDLsandRDLsbaseduponasplit30gextractiontoafinalvolumeof2mlsforpesticidesand1mlforPCBswithGPCcleanup.
Priortopesticide/PCBpreparationandanalysis,thetotalsolidresultswillbeusedtoverifythattheplannedextractionregimewillallowanalyteLIMSRDLstomeettheproposedfreshwatersedimentguidelines(seeTable2andTable3).Ifnecessary,theextractionsampleamountandfinalvolumeswillbeadjustedaccordinglytoensurethattheLIMSRDLisatorbelowtheappropriatecriteriavalue.
TheMDLandRDLforspecificanalytesrequiringdilution(e.g.,exceedanceofanalytecalibrationrange)willbeincreasedtoreflectthedilution.Incaseswhereadilutionisnecessitatedbyamatrixinterferenceorothersampleissue,andtheresultingLIMSRDLforaspecificanalyteexceedsthespecifiedcriteriaandtheanalyteisnotdetected,theLIMSRDLexceedanceofthecriteriawillbediscussedwiththeprojectmanagerandnotedintheappropriateanalyticalcasenarrative.
ThetargetlistfortheEDCorganiccompoundsandassociatedMDLsandRDLsarelistedbelowinTable10.TheLIMSproductisEDCandthecorrespondinglisttypeisOREDC.

StreamSedimentMonitoringSamplingandAnalysisPlan:GreenRiverBasin
KingCounty 21 August2012
Table 10. EDC Target Analytes, Methods, and Detection Limits (µg/Kg wet weight)
Analyte LIMS Product LIMS listtype Method MDL RDL
Bis(2-ethylhexyl)adipate EDC OREDC SW846 3550B*SW846 8270D 110 * 533
Bisphenol A EDC OREDC SW846 3550B*SW846 8270D 110 * 533
Total 4-nonylphenols EDC OREDC SW846 3550B*SW846 8270D 110 * 533
Coprostanol EDC OREDC SW846 3550B*SW846 8270D 530 * 1070
*TherearenolistedcriteriaforanyoftheEDCcompounds.ThesewetweightdetectionlimitsmaychangebaseduponanyrequiredchangestotheBNASMSextractionnotedabove.
Note:MDLsandRDLsbaseduponatypical30gto1mlfinalvolumewithGPCcleanup.
4.4 Dioxin/Furan Analyses and Detection Limits Dioxin/furancongeneranalysiswillbeperformedaccordingtoEPAMethod1613B(EPA1994),whichisahigh‐resolutiongaschromatography/high‐resolutionmassspectroscopy(HRGC/HRMS)methodusinganisotopedilutioninternalstandardquantification.Thismethodprovidesreliableanalyteidentificationandverylowdetectionlimits.Labelednativeandsurrogatestandards(Table11)areaddedbeforesamplesareextracted.Dataare“recovery‐corrected”forlossesinextractionandcleanup,andanalytesarequantifiedagainsttheirlabeledanaloguesorarelatedlabeledcompound.
AXYSwillperformthisanalysisaccordingtotheirStandardOperatingProcedure(SOP)MLA‐017whichisbasedonEPAMethod1613bTetra‐throughOcta‐ChlorinatedDioxinsandFuransbyIsotopeDilutionHRGC/HRMS.Samplewillbeextractedfollowedbystandardmethodclean‐up,whichincludeslayeredAcid/BaseSilica,Florisil,andAlumina.
Table 11. Labeled Surrogates and Recovery Standards Used for EPA Method 1613b Dioxins/Furans Congener Analysis
13C-labeled Congener Surrogate Standards
Labeled analytes of interest are used for all dioxins and furans quantified except 1,2,3,7,8,9-HxCDD and OCDF
37Cl-labeled Cleanup Standards
2,3,7,8 TCDD
13C-labeled Internal (Recovery) Standards
1,2,3,4 TCDD 1,2,3,7,8,9 HxCDD
Table12liststhe17dioxin/furancongenersandtheirrespectivetargetSDLvalues.ThereportedSDLsforindividualsamplesmaydifferfromthoseinTable12sincetheyare

StreamSedimentMonitoringSamplingandAnalysisPlan:GreenRiverBasin
KingCounty 22 August2012
determinedbysignaltonoiseratiosandchangestofinalvolumes.Typicalsampledetectionlimitsareshown.
Table 12. Dioxin/furan solids sample detection limit goals in pg/g and lower calibration limit goals
Analyte Typical
Detection Limit/SDL
LMCL based on Low
Cal./RDL
Dioxins
2,3,7,8 TCDD 0.5 2.0
1,2,3,7,8 PeCDD 0.1 5.0
1,2,3,4,7,8 HxCDD 0.1 5.0
1,2,3,6,7,8 HxCDD 0.1 5.0
1,2,3,7,8,9 HxCDD 0.1 5.0
1,2,3,4,6,7,8 HpCDD 0.1 5.0
OCDD 0.5 10.0
Furan
2,3,7,8 TCDF 0.05 1.0
1,2,3,7,8 PeCDF 0.5 5.0
2,3,4,7,8 HxCDF 0.1 5.0
1,2,3,4,7,8 HxCDF 0.1 5.0
1,2,3,6,7,8 HxCDF 0.1 5.0
1,2,3,7,8,9 HxCDF 0.1 5.0
2,3,4,6,7,8 HxCDF 0.1 5.0
1,2,3,4,6,7,8 HpCDF 0.1 5.0
1,2,3,4,7,8,9 HpCDF 0.1 5.0
OCDF 0.55 10.0
SDL=sampledetectionlimitLMCL=lowermethodcalibrationlimitNote:SDLandLMCLbasedonEPAmethod1613b,AXYSAnalyticalServicesmethodMLA017.
4.5 Quality Assurance/Quality Control (QA/QC) Practices
ChemistrydatawillundergostandardsedimentQA1reviewaccordingtoPSDDAguidelines(PTI,1989a)anddatawillbeflaggedaccordingly.ThislevelofQAreviewisnecessarytoprovidetheprojectandprogrammanagerswiththelevelofinformationneededtocorrectlyinterpretthedataandallowevaluationsofbaselinesedimentqualityintheGreenRiverwatershed.QCdatatobeincludedwithaQA1reviewwillinclude(butnotbelimited

StreamSedimentMonitoringSamplingandAnalysisPlan:GreenRiverBasin
KingCounty 23 August2012
to)resultsformatrixspikesandmatrixspikeduplicates,surrogatespikes,methodblanks,certifiedreferencematerials,andanalyticalreplicates.
4.5.1 Analyses by KCEL TheQCsamplesthatwillbeanalyzedinassociationwithsedimentconventionalandchemicaltestingaresummarizedinTable13.
Table 13. Sediment Chemistry Quality Control Samples
Analyte Method Blank
Duplicate Triplicate Matrix Spike
SRM or LCS
Surrogates
PSD No No Yes No No No
TOC Yes No Yes Yes Yes No
pH No No Yes No No No
Total Solids Yes No Yes No No No
Acid Volatile Sulfide Yes No Yes Yes No No
Total Metals Yes Yes No Yes Yes No
SEM Metals Yes Yes No Yes No No
BNAs Yes* Yes No Yes** Yes Yes
Chlorinated Pesticides Yes* Yes No Yes** Yes Yes
EDC Yes* Yes No Yes** No Yes
PCBs Yes* Yes No Yes** Yes Yes
Yes*=Aspikedblankwillalsobeperformedwitheachbatch.
Yes**=Amatrixspikeduplicatewillalsobeperformedwitheachbatch.
SRM–StandardReferenceMaterial
LCS‐LaboratoryControlSample
TherecommendedQClimitsassociatedwithsedimentconventionalandchemistrytestingaresummarizedinTable14.Laboratoryperformance‐basedQClimitsarepresentedinappendicesAandBformetalsandorganiccompounds,respectively.
Table 14. QC Acceptance Criteria for Sediment Chemistry Samples
Analyte Method Blank
Duplicate Triplicate Matrix Spike
SRM/LCS Surrogates
PSD N/A N/A RSD < 20%s N/A N/A N/A
TOC < MDL N/A RSD < 20% 75 - 125% 80 - 120% N/A
pH N/A N/A RSD < 5% N/A N/A N/A

StreamSedimentMonitoringSamplingandAnalysisPlan:GreenRiverBasin
KingCounty 24 August2012
Analyte Method Blank
Duplicate Triplicate Matrix Spike
SRM/LCS Surrogates
Total Solids < MDL N/A RSD < 20% N/A N/A N/A
Acid Volatile Sulfide < MDL N/A RSD < 20% 65 – 135% N/A N/A
Metals/SEM Metals < MDL RPD < 20% N/A 75 - 125% perf-based N/A
BNAs < MDL RPD < 35% N/A perf-based perf-based perf-based
Chlor. Pesticides < MDL RPD < 35% N/A perf-based perf-based perf-based
PCBs < MDL RPD < 35% N/A perf-based perf-based perf-based
<MDL‐MethodBlankresultshouldbelessthanthemethoddetectionlimit.
RPD‐RelativePercentDifference
RSD‐RelativeStandardDeviation
N/A‐NotApplicable
Metals matrix spike limits of 75 to 125% apply when the sample concentration is less than 4 times the spikeconcentration.
MetalsperformancebasedSRMacceptancecriteriaarelistedinTableA1
QCresultsformatrixspike,SRM,andsurrogatesareinpercentrecoveryofanalyte.
Perf‐based‐The laboratory’sperformance‐basedcontrol limits thatare ineffectat thetimeofanalysiswillbeusedasqualitycontrollimits.
4.5.2 Dioxin/Furans Qualitycontrolsamplesincludemethodblanks,ongoing‐precisionandrecovery(OPR)samples,andsurrogatespikes.MethodblanksandOPRsamplesareeachincludedwitheachbatchofsamples.Surrogatespikesarelabeledcompoundsthatareincludedwitheachsample.Thesampleresultsarecorrectedfortherecoveriesassociatedwiththesesurrogatespikesaspartoftheisotopedilutionmethod.Inaddition,alaboratoryduplicatewillbeconductedwitheachbatchofsamples.Notethatamatrixspikeandmatrixspikeduplicatearenotrequired,normeaningfulunderMethod1613b.Method1613bhasspecificrequirementsformethodblanksthatmustbemetbeforesampledatacanbereported(seesection9.5.2ofMethod1613b).TheOPRsamplesmustshowacceptablerecoveries,accordingtoMethod1613b,inordertosamplestobeanalyzedanddatatobereported.AsummaryofthequalitycontrolsamplesareshowninTable15.
Table 15. Dioxins/furans QA/QC Frequency and Acceptance Criteria
Method Blank
Lab Duplicate (RSD)
OPR (% Recovery)
Surrogate Spikes
Frequency 1 per batch* 1 per batch* 1 per batch* Each sample
Dioxins/furans <LMCL a RPD <50% laboratory QC limits b laboratory QC limits b
batch=20samplesorlesspreparedasasetaEPAMethod1613Bblankcriteria(seeTable2ofthepublishedmethod)istobebelowtheMinimumLevels:0.5,1.0,and5pg/gforthetetra,pentathroughhepta,andoctarespectivelybThelaboratory’sperformance‐basedcontrollimitsthatareineffectatthetimeofanalysiswillbeusedasqualitycontrollimits.LMCL=LowestMethodCalibrationLimit

StreamSedimentMonitoringSamplingandAnalysisPlan:GreenRiverBasin
KingCounty 25 August2012
RSD=RelativeStandardDeviationOPR=ongoingprecisionandrecovery
4.6 Data Qualifiers ThedataqualificationflagswhichwillbeusedbytheKCELforthisprojectarepresentedinTable16.ThesedataqualifiersaddresssituationsthatrequirequalificationandconformtoQA1guidance(PTI,1989a).TheKCLabqualifiersindicating<MDLand<RDLhavebeenusedasreplacementsfortheTandUqualifierflagsspecifiedunderQA1guidance.QCresultsthatdonotmeettheacceptancecriteriaoutlinedinthisSAPwillbeevaluatedtodetermineiftheunacceptabledataindicatethatthereportedresultsmaybebiasedorotherwiseimpacted.Laboratoryinformationmanagementsystem(LIMS)productsandlisttypesarepresentedinAppendixC.
Table 16. KCEL Data Qualifier Flags and Conditions to Qualify
Condition to Qualify Flag Comment
Low matrix spike recovery JG
High matrix spike recovery JL
Low standard reference material recovery JG
High standard reference material recovery JL
High duplicate relative percent difference J
High triplicate relative standard deviation J
Less than the reporting detection limit <RDL
Less than the method detection limit <MDL
Contamination detected in method blank B >MDL and <5 times MB result1
Contamination detected in method blank B2 Common Lab Contaminants2
Contamination detected in method blank B3 All other parameters between 5 and 10 times MB result1
Biased data based on low surrogate recoveries JG At least 2 surrogates < limit for BNAs
Biased data based on high surrogate recoveries JL At least 2 surrogates > limit for BNAs
Rejected – unusable for all purposes R
A sample handling criteria has not been met SH Container, preservation
Holding time not met H
1ComparisonofthemethodblankandsampleresultsforapplyingBflagsmustbedoneonawet‐weightbasis.2CommonLabContaminants:bis(2‐ethylhexyl)phthalate,benzylbutylphthalate,di‐n‐butylphthalate.

StreamSedimentMonitoringSamplingandAnalysisPlan:GreenRiverBasin
KingCounty 26 August2012
5.0. DATA REVIEW AND RECORD KEEPING
5.1 Data Review AllsedimentchemistrydatawillbereportedinQA1format(PTI1989a).ThefinalQA1reportwillcontainthefollowinginformationanddeliverables:
AQA1narrativediscussingdataqualityinrelationtostudyobjectivesanddatacriteria;
AllassociatedQCdata(LIMSQCreportsandworklists);
CopiesoffieldsheetsandCOCforms;
Acomprehensivereportcontainingallanalyticalandfielddata(includingdataqualifierflags);and
DatafilesinEnvironmentalInformationManagementSystem(EIMS)formatfordeliverytoEcology.
AllKCELgeneratedchemicalanalysisandassociatedconventionaldatawillbevalidatedagainstrequirementsofthereferencemethodsaswellastherequirementsofthisSAP.DatavalidationwillbeperformedbytheKingCountyWLRDforalldatageneratedbyKCEL.
Allnecessarydataneededforindependentreviewofdioxin/furandatawillbeprovidedbyAXYS.Datavalidationfordioxin/furandatamaybeconductedbyeitheranoutsidepartyforthissurveyorbyKingCountyWLRD.Adatavalidationmemorandumwillbeproducedandmaintainedalongwiththeanalyticaldataaspartoftheprojectrecords.
ChemicaldatageneratedduringthisprojectwillbevalidatedaccordingtoacceptedEnvironmentalProtectionAgency(EPA)guidelines(EPA2001,2004and2005),whereapplicable.ValidationofdatageneratedbyKCELwillbeEPAStage2a.Thislevelofvalidationincludesreviewsofholdingtimes,methodblanks,andQA/QCsamples.
5.2 Record Keeping Allfieldandsamplingrecords,custodydocuments,rawlabdata,andsummariesandnarrativeswillbearchivedaccordingtoKCELpolicy,foraminimumof10yearsfromthedatesampleswerecollected.
Theserecordswillincludebothhardcopyandelectronicdata.Conventional,TraceMetalsandTraceOrganicsanalyticaldataproducedbytheKCELwillbemaintainedonitsLIMSdatabaseinperpetuity.AXYSwillprovideelectronicdeliverablesofdataandassociatedqualitycontrolresultstoKingCounty.WhileKCELwillmaintainacopyofdeliverablesfromAXYSAnalytical,copiesoffulldatapackagespertainingtoKingCountysamplesanalyzedbyAXYSwillbemaintainedbyAXYSfor10yearsfromtheanalysisdate.

StreamSedimentMonitoringSamplingandAnalysisPlan:GreenRiverBasin
KingCounty 27 August2012
6.0. HEALTH AND SAFETY REQUIREMENTS
Thefollowinggeneralhealthandsafetyguidelineshavebeenprovidedinlieuofasite‐specificHealthandSafetyPlan.Theseguidelineswillbereadandunderstoodbyallmembersofthesamplingcrewpriortoanysamplingactivities.
Samplingpersonnelwillwearchemical‐resistantgloveswhenevercomingintocontactwithsediment.
Allsamplingoperationswillbeconductedduringdaylighthours.
Allaccidents,“nearmisses,”andsymptomsofpossibleexposurewillbereportedtoasampler’ssupervisorwithin24hoursofoccurrence.
Allfieldmemberswillbeawareofthepotentialhazardsassociatedwithchemicalsusedduringthesamplingeffort.
Contactwithsedimentatsomesamplingstationsmaypresentahealthhazardfromchemicalconstituentsofthesediment.Potentialroutesofexposuretochemicalhazardsincludeinhalation,skinandeyeabsorption,ingestion,andinjection.
Fieldstaffwillexercisecautiontoavoidcomingintocontactwithsedimentatallstationsduringsamplingoperations.Protectiveequipmentwillincludechemical‐resistantgloves,safetyglassesorgoggles,andprotectiveclothing(e.g.,chemicalresistantcoveralls,etc.).Fieldstaffwillexercisegoodpersonalhygienepriortoeatingordrinking.

StreamSedimentMonitoringSamplingandAnalysisPlan:GreenRiverBasin
KingCounty 28 August2012
7.0. REFERENCES
EPA,1991.AnalyticalMethodforDeterminationofAcidVolatileSulfideandSelected
SimultaneouslyExtractableMetalsinSediment.OfficeofScienceandTechnology.
Washington,D.C.
EPA,1999.FieldSamplingGuidanceDocument#1215SedimentSampling.USEPARegion
9Laboratory.Richmond,California.
EPA2001.USEPAContractLaboratoryProgramNationalFunctionalGuidelinesforLow
ConcentrationOrganicDataReview.UnitedStatesEnvironmentalProtection
Agency.Washington,D.C.
EPA2004.USEPAContractLaboratoryProgramNationalFunctionalGuidelinesfor
InorganicDataReview.Availableat:http://www.epa.gov/superfund/programs/clp/download/inorgfg10‐08‐04.pdf
EPA.2005.Nationalfunctionalguidelinesforchlorinateddibenzo‐p‐dioxins(CDDs)andchlorinateddibenzofurans(CDFs)datareview.OSWER9240.1‐51.EPA540‐R‐05‐001.OfficeofSuperfundRemediationandTechnologyInnovation,USEnvironmentalProtectionAgency,Washington,DC.
KingCounty,2004.SamplingandAnalysisPlanfortheStreamSedimentMonitoringProgram.KingCountyWaterandLandResourcesDivision.Seattle,WA.
KingCounty,2011.GreenRiverStudy–SamplingandAnalysisPlan.PreparedbyKingCountyWaterandLandResourcesDivision.Seattle,WA.
PTIEnvironmentalServices,1989a.DataValidationGuidanceManualforSelected
SedimentVariables.WashingtonStateDepartmentofEcology.Olympia,WA.
PTIEnvironmentalServices,1989b.PugetSoundDredgedDisposalAnalysisGuidance
Manual;DataQualityEvaluationforProposedDredgedMaterialDisposalProjects.WashingtonStateDepartmentofEcology.Olympia,WA.
PSEP,1996.RecommendedProtocolsforMeasuringSelectedEnvironmentalVariablesin
PugetSound.PugetSoundEstuaryProgram.Olympia,WA.
Smith,S.S.,D.D.MacDonald,K.A.Keenleyside,C.G.Ingersoll,andL.J.Field.1996.A
preliminaryevaluationofsedimentqualityassessmentvaluesforfreshwater
ecosystems.J.GreatLakesRes.22(3):624‐638.Internat.Assoc.GreatLakesRes.

StreamSedimentMonitoringSamplingandAnalysisPlan:GreenRiverBasin
KingCounty 29 August2012
WashingtonStateDepartmentofEcology&AvocetConsulting.2003.Developmentof
FreshwaterSedimentQualityValuesforUseinWashingtonStatePhaseIIReport:
DevelopmentandRecommendationofSQVsforFreshwaterSedimentsin
WashingtonStateWashingtonStateDepartmentofEcology,Olympia,WA.
September2003.
https://fortress.wa.gov/ecy/publications/publications/1109054.pdf
StreamSedimentMonitoringSamplingandAnalysisPlan:GreenRiverBasin
KingCounty 30 August2012
THISPAGEINTENTIONALLYLEFTBLANK

StreamSedimentMonitoringSamplingandAnalysisPlan:GreenRiverBasin
KingCounty 31 August2012
Appendix A
METALSPERFORMANCE‐BASEDQCLIMITS
TABLESA‐1THROUGHA‐3
TableA‐1
LaboratoryQCLimitsforSedimentMetals,BuffaloRiverSedimentLCSRecoveries
Parameter LowerLimit(%) UpperLimit(%)Silver n/a n/aArsenic 80 120Cadmium 76 116Chromium 40 80Copper 81 105Lead 71 111Mercury n/a n/aNickel 80 120Zinc 69 109
TableA‐2
LaboratoryQCLimitsforSedimentMetals,ERASoilLCSRecoveries
Parameter LowerLimit(%) UpperLimit(%)Silver 66 134Arsenic 80 120Cadmium 80 120Chromium 80 120Copper 80 120Lead 80 120Mercury 71 129Nickel 80 120Zinc 80 120
TableA‐3
LaboratoryQCLimitsforSedimentMetals,WQB‐1LCSRecoveries
Parameter LowerLimit(%) UpperLimit(%)Mercury 80 120

StreamSedimentMonitoringSamplingandAnalysisPlan:GreenRiverBasin
KingCounty 32 August2012
APPENDIXB
TRACEORGANICSPERFORMANCE‐BASEDQCLIMITSFORSEDIMENTS
TABLESB‐1THROUGHB‐10
Performance‐basedcontrollimitsarestatisticallyderived,reviewedandpotentiallyupdatedonanannualbasis.Thelimitsbelowareaccurateforthe2012calendaryear.

StreamSedimentMonitoringSamplingandAnalysisPlan:GreenRiverBasin
KingCounty 33 August2012
TableB‐1LaboratoryQCLimitsforSedimentBNAs–MatrixSpikeRecoveries
ParameterLowerLimit
(%)UpperLimit
(%) ParameterLowerLimit
(%)UpperLimit
(%)
1,2,4‐Trichlorobenzene 22 95 Chrysene 47 1411,2‐Dichlorobenzene 20 110 Di‐N‐ButylPhthalate 64 1501,4‐Dichlorobenzene 20 105 Di‐N‐OctylPhthalate 43 1502,4‐Dimethylphenol 27 126 Dibenzo(a,h)anthracene 39 1502‐Methylnaphthalene 22 109 Dibenzofuran 49 1352‐Methylphenol 21 126 DiethylPhthalate 71 1303‐,4‐Methylphenol 24 129 DimethylPhthalate 66 128Acenaphthene 37 129 Fluoranthene 53 144Acenaphthylene 44 134 Fluorene 52 150Anthracene 37 150 Hexachlorobenzene 51 149Benzo(a)anthracene 52 149 Hexachlorobutadiene 20 133Benzo(a)pyrene 62 136 Indeno(1,2,3‐Cd)Pyrene 41 150Benzo(b,j,k)fluoranthene 48 135 N‐Nitrosodiphenylamine 58 140Benzo(g,h,i)perylene 27 150 Naphthalene 20 112BenzoicAcid 20 150 Pentachlorophenol 35 134BenzylAlcohol 28 111 Phenanthrene 51 136BenzylButylPhthalate 27 150 Phenol 21 142Bis(2‐Ethylhexyl)Phthalate 54 150 Pyrene 59 143
TableB‐2
LaboratoryQCLimitsforSedimentBNAs–BlankSpikeRecoveries
Parameter LowerLimit(%)
UpperLimit(%)
Parameter LowerLimit(%)
UpperLimit(%)
1,2,4‐Trichlorobenzene 39 94 Chrysene 45 1501,2‐Dichlorobenzene 44 105 Di‐N‐ButylPhthalate 71 1421,4‐Dichlorobenzene 40 103 Di‐N‐OctylPhthalate 43 1502,4‐Dimethylphenol 20 121 Dibenzo(a,h)anthracene 41 1502‐Methylnaphthalene 20 128 Dibenzofuran 52 1332‐Methylphenol 20 123 DiethylPhthalate 75 1313‐,4‐Methylphenol 22 119 DimethylPhthalate 70 129Acenaphthene 43 126 Fluoranthene 56 143Acenaphthylene 45 132 Fluorene 57 150Anthracene 48 149 Hexachlorobenzene 53 150Benzo(a)anthracene 51 150 Hexachlorobutadiene 20 135Benzo(a)pyrene 61 140 Indeno(1,2,3‐Cd)Pyrene 42 150Benzo(b,j,k)fluoranthene 45 143 N‐Nitrosodiphenylamine 57 136Benzo(g,h,i)perylene 28 150 Naphthalene 28 109BenzoicAcid 20 92 Pentachlorophenol 25 135BenzylAlcohol 26 111 Phenanthrene 47 141BenzylButylPhthalate 36 150 Phenol 26 136Bis(2‐Ethylhexyl)Phthalate 61 150 Pyrene 60 144

StreamSedimentMonitoringSamplingandAnalysisPlan:GreenRiverBasin
KingCounty 34 August2012
TableB‐3LaboratoryQCLimitsforSedimentBNAs–SurrogateRecoveries
Parameter LowerLimit(%) UpperLimit(%)2,4,6‐Tribromophenol 45 1502‐Fluorophenol 20 136d5‐Phenol 20 142d5‐Nitrobenzene 22 126d4‐2‐Chlorophenol 20 1272‐Fluorobiphenyl 22 135d14‐Terphenyl 25 150
TableB‐4LaboratoryQCLimitsforSedimentBNAs–SRMRecoveries
Parameter LowerLimit(%) UpperLimit(%)Benzo(a)anthracene 48 127Benzo(a)pyrene 48 119Benzo(b,j,k)fluoranthene 50 126Benzo(g,h,i)perylene 42 141Chrysene 64 150Dibenzo(a,h)anthracene 54 200Fluoranthene 56 137Indeno(1,2,3‐Cd)Pyrene 40 130Phenanthrene 49 124Pyrene 58 123
TableB‐5LaboratoryQCLimitsforSedimentPesticidesandPCBs
MatrixSpikeRecoveriesParameter LowerLimit(%) UpperLimit(%)4,4'‐DDD 53 1084,4'‐DDE 59 1064,4'‐DDT 50 110Aldrin 63 92Alpha‐BHC 65 90Alpha‐Chlordane 59 113Beta‐BHC 62 101Delta‐BHC 63 105Dieldrin 62 104EndosulfanI 20 113EndosulfanII 33 99EndosulfanSulfate 47 99Endrin 66 112EndrinAldehyde 30 68Gamma‐BHC(Lindane) 67 91

StreamSedimentMonitoringSamplingandAnalysisPlan:GreenRiverBasin
KingCounty 35 August2012
Parameter LowerLimit(%) UpperLimit(%)Heptachlor 60 102HeptachlorEpoxide 62 97Methoxychlor 63 107Trans‐Chlordane 40 131Aroclor1242 57 111Aroclor1260 33 105
TableB‐6
LaboratoryQCLimitsforSedimentPesticidesandPCBsBlankSpikeRecoveries
Parameter LowerLimit(%) UpperLimit(%)4,4'‐DDD 57 1074,4'‐DDE 62 994,4'‐DDT 47 131Aldrin 51 71Alpha‐BHC 35 77Alpha‐Chlordane 69 98Beta‐BHC 54 90Delta‐BHC 53 98Dieldrin 60 102EndosulfanI 27 104EndosulfanII 40 105EndosulfanSulfate 55 95Endrin 63 106EndrinAldehyde 36 63Gamma‐BHC(Lindane) 39 82Heptachlor 40 81HeptachlorEpoxide 54 94Methoxychlor 60 107Trans‐Chlordane 52 105Aroclor1242 23 92Aroclor1260 52 103
TableB‐7LaboratoryQCLimitsforSedimentPesticidesSRMandSurrogateRecoveries
Parameter LowerLimit(%) UpperLimit(%)Alpha‐Chlordane 69 136Decachlorobiphenyl 47 1222,4,5,6‐Tetrachloro‐m‐xylene 20 134
StreamSedimentMonitoringSamplingandAnalysisPlan:GreenRiverBasin
KingCounty 36 August2012
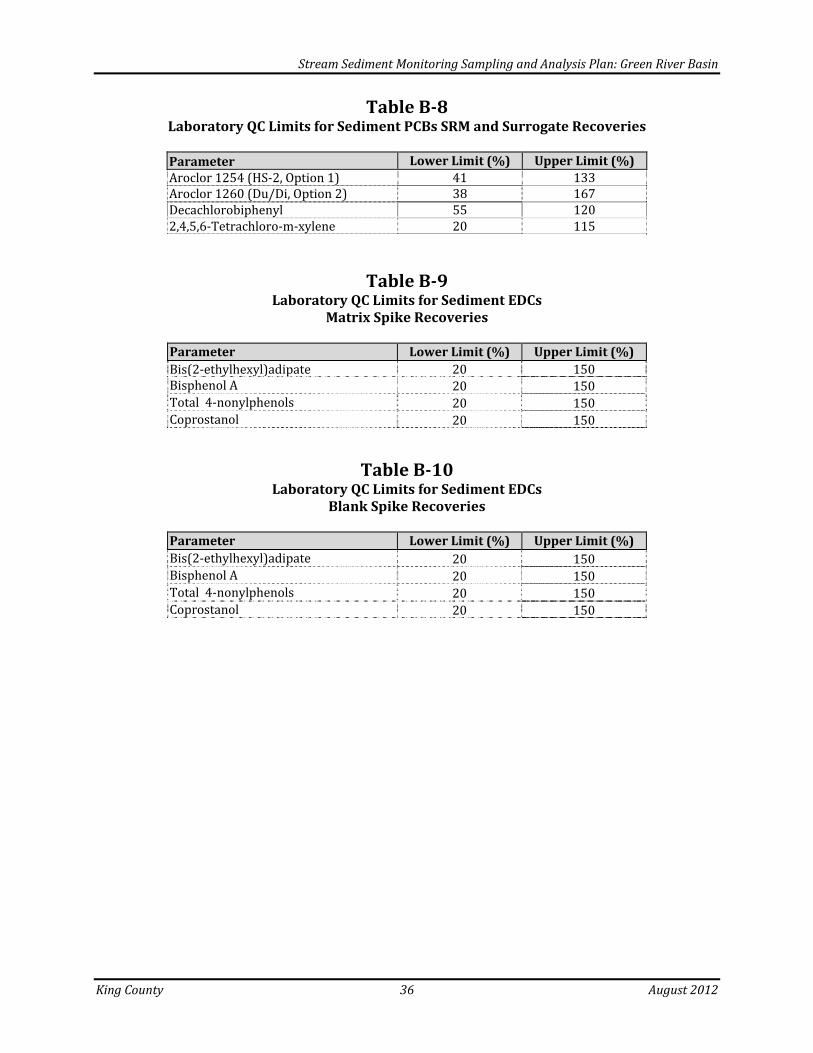
TableB‐8LaboratoryQCLimitsforSedimentPCBsSRMandSurrogateRecoveries
Parameter LowerLimit(%) UpperLimit(%)Aroclor1254(HS‐2,Option1) 41 133Aroclor1260(Du/Di,Option2) 38 167Decachlorobiphenyl 55 1202,4,5,6‐Tetrachloro‐m‐xylene 20 115
TableB‐9LaboratoryQCLimitsforSedimentEDCs
MatrixSpikeRecoveries
Parameter LowerLimit(%) UpperLimit(%)Bis(2‐ethylhexyl)adipate 20 150BisphenolA 20 150Total4‐nonylphenols 20 150Coprostanol 20 150
TableB‐10LaboratoryQCLimitsforSedimentEDCs
BlankSpikeRecoveries
Parameter LowerLimit(%) UpperLimit(%)Bis(2‐ethylhexyl)adipate 20 150BisphenolA 20 150Total4‐nonylphenols 20 150Coprostanol 20 150

StreamSedimentMonitoringSamplingandAnalysisPlan:GreenRiverBasin
KingCounty 37 August2012
APPENDIXC
LABORATORYINFORMATIONMANAGEMENTSYSTEM(LIMS)
PRODUCTSANDLISTTYPES
TABLEC‐1

StreamSedimentMonitoringSamplingandAnalysisPlan:GreenRiverBasin
KingCounty 38 August2012
TableC‐1
KingCountyEnvironmentalLaboratoryLaboratoryInformationManagementSystem(LIMS)
ProductsandListTypes
Parameter LIMSProduct LIMSListTypePSD PSD CVPSDTOC TOC CVTOCTotalSolids TOTS CVTOTSAcidVolatileSulfide AVS CVAVSMercurybyCVAA‐M(Sediments) HG‐CVAA‐M MTHG‐MIDS,6‐SEDMercury‐SEM(Sediments) HG‐SEM,EXT MTHG‐SEM,6‐SEM
TotalMetalsbyICPMS(Sediments)
AG‐ICPMS,AS‐ICPMS,CD‐ICPMS,CR‐ICPMS,CU‐ICPMS,PB‐ICPMS,NI‐ICPMS,P‐ICPMS,ZN‐ICPMS
MTICPMS‐SED,6‐SED
TotalMetals‐SEM(Sediments)AG‐SEM,EXT,AS‐SEM,EXT,CD‐SEM,EXT,CR‐SEM,EXT,CU‐SEM,EXT,PB‐SEM,EXT,NI‐SEM,EXT,ZN‐SEM,EXT
MTICP‐SEM,6‐SEM
BNASMSList* BNASMS* ORBNASMS*ChlorinatedPesticides CLPEST ORCLPESTEDCs EDC OREDCPCBs PCB ORPCB*CarbazolewillbeaddedtotheORBNASMSlisttypeforthepurposesofthisprojectonly.
CVAA–Coldvaporatomicabsorptionspectroscopy.
ICP–Inductivelycoupledplasmaopticemissionspectroscopy.
ICPMS–Inductivelycoupledplasmamassspectrometry
SEM–SimultaneouslyExtractableMetals