Stream Depletion Assessment of the Ashley River and ...
48
Transcript of Stream Depletion Assessment of the Ashley River and ...


Coastal aquifer saltwater intrusion assessment guidelines Report No. R04/18 ISBN 1-86937-543-2 Revised version of U02/35 Philippa Aitchison-Earl Marc Ettema Carl Hanson Shirley Hayward Rebecca Larking Russel Sanders David Scott Anna Veltman November 2003

Report R04/18 58 Kilmore Street PO Box 345 Christchurch Phone (03) 365 3828 Fax (03) 365 3194 75 Church Street PO Box 550 Timaru Phone (03) 688 9069 Fax (03) 688 9067 Website: www.ecan.govt.nz Customer Services Phone 0800 324 636
Coastal aquifer saltwater intrusion assessment guidelines
Executive summary Saltwater intrusion is the migration of saltwater into a freshwater aquifer. It occurs when there is a reduction in the freshwater head and flow at the sea water interface. This commonly occurs when there is over pumping or insufficient groundwater recharge of an aquifer in the coastal zone. To date coastal aquifer saltwater intrusion in response to pumping has been observed at only two sites in Canterbury, but there is potential for it to become more of an issue as the volumes of coastal groundwater abstraction increase especially in response to rising irrigation demand. These guidelines provide guidance for situations where saltwater intrusion from the sea or nearby brackish water bodies (e.g. estuaries, salty lakes, tidal rivers) may be a concern, and to provide tools to assess the significance of the issue.
Environment Canterbury Unpublished Technical Report 3

Coastal aquifer saltwater intrusion assessment guidelines
4 Environment Canterbury Unpublished Technical Report

Coastal aquifer saltwater intrusion assessment guidelines
Table of Contents
Executive summary ......................................................................................3
1 Background ........................................................................................7 1.1 The issue of saltwater intrusion.......................................................................7 1.2 Purpose of the guidelines................................................................................7 1.3 Structure of the guidelines ..............................................................................7
2 Types of saltwater intrusion..............................................................8
3 Water quality.....................................................................................10 3.1 Chemistry of seawater and groundwater ......................................................10 3.2 Potential hazards of saltwater intrusion ........................................................11
3.2.1 Drinking water...................................................................................11 3.2.2 Irrigation............................................................................................11 3.2.3 Other uses ........................................................................................12
3.3 Determination of saltwater intrusion..............................................................12 3.4 Examples of saltwater intrusion in Canterbury..............................................14 3.5 Water quality summary..................................................................................16
4 Modelling saltwater intrusion..........................................................17 4.1 Interface position equations ..........................................................................17
4.1.1 Ghyben-Herzberg formula................................................................17 4.1.2 Glover equation ................................................................................18
4.2 Upconing equations.......................................................................................19
5 Screening criteria for consents ......................................................20 5.1 Distance ........................................................................................................20 5.2 Calculation of potential effect ........................................................................22
5.2.1 Unconfined aquifers..........................................................................22 5.2.2 Semi-confined and confined aquifers...............................................23
6 Monitoring conditions .....................................................................24 6.1 Intrusion risk ..................................................................................................24 6.2 Monitoring types ............................................................................................24
6.2.1 Aquifer pressure monitoring .............................................................24 6.2.2 Water quality monitoring...................................................................25 6.2.3 Water usage monitoring ...................................................................25
6.3 Existing saltwater intrusion conditions ..........................................................25
7 References........................................................................................26
Appendix 1 Justification for maintaining a 1.5m piezometric head at the coast .......................................................................................27
Environment Canterbury Unpublished Technical Report 5

Coastal aquifer saltwater intrusion assessment guidelines
Appendix 2 Modelling potential effects of saltwater intrusion worked
examples of confined and unconfined aquifers .................31
Appendix 3 Examples of potential consent conditions based on risk assessment ............................................................................35
Appendix 4 Summary of existing groundwater takes in Canterbury with saltwater intrusion consent conditions...............................37
List of Figures Figure 2.1 Position of the salt-fresh water interface in unconfined and confined
aquifers (from Freeze and Cherry, 1979) ..........................................................8 Figure 2.2 Upconing and landward movement of the salt/fresh water interface
created by pumping ...........................................................................................9 Figure 2.3 Downwards seepage of saline water into an aquifer due to decreased
pressures in underlying aquifer..........................................................................9 Figure 3.1 Ideal mixing of groundwater and sea water. ....................................................13 Figure 3.2 Relationship between electrical conductivity and chloride concentration........14 Figure 3.3 Conductivity values and groundwater levels from well J40/0042 near
Makikihi.. ..........................................................................................................15 Figure 4.1 Schematic diagram of variables used in saltwater intrusion/ upconing
equations. ........................................................................................................18 Figure 4.2 Flow pattern near the coast (modified from Glover, 1964) ..............................19 Figure 4.3 Upconing of interface in response to pumping (Domenico and Schwartz,
1990)................................................................................................................20 Figure 5.1 Flow chart showing decision process for handling groundwater take
consents with potential saltwater intrusion issues ...........................................21 Figure 5.2 Example of wells above and below sea level ..................................................23
List of Tables Table 3.1 Comparison of dissolved ions in sea water and groundwater .........................10 Table 3.2 Drinking-water standards for saline water .......................................................11 Table 6.1 Risk Factors in Saltwater Intrusion Assessment .............................................24
Acknowledgements This report was reviewed by Peter Callander of Pattle Delamore Partners Ltd, and Richard de Joux of Environmental Consultancy Services.
6 Environment Canterbury Unpublished Technical Report
Coastal aquifer saltwater intrusion assessment guidelines
1 Background
1.1 The issue of saltwater intrusion Saltwater intrusion is the migration of saltwater into a freshwater aquifer. It occurs when there is a reduction in the freshwater head and flow at the sea water interface. This commonly occurs when there is over pumping or insufficient groundwater recharge of an aquifer in the coastal zone. To date coastal aquifer saltwater intrusion in response to pumping has been observed at only two sites in Canterbury, but there is potential for it to become more of an issue as the volumes of coastal groundwater abstraction increase especially in response to rising irrigation demand. There is an existing problem in the Woolston – Heathcote area where localised pressure reversal due to industrial and public supply pumping has caused groundwater levels to drop below the high tide level. This has allowed downwards penetration of seawater from the Avon - Heathcote estuary. A management regime is now in place to deal with this. Irrigation pumping from a coastal well in an unconfined aquifer near Makikihi has resulted in significantly raised chloride and conductivity levels in some summers. Water quality quickly returns to normal levels over the winter months. The owner now has consent conditions that allow for pumping restrictions at times when monitored water quality goes beyond a threshold level.
1.2 Purpose of the guidelines These guidelines have been prepared to provide guidance for situations where saltwater intrusion from the sea or nearby brackish water bodies (e.g. estuaries, salty lakes, tidal rivers) may be a concern, and to provide tools to assess the significance of the issue. To an extent these guidelines provide methods to complement the saltwater intrusion policies outlined in the discussion draft of the Natural Resources Regional Plan Water Quantity chapter. Although aquifer contamination can also occur in these coastal areas due to lowering of pressures under contaminated sites (e.g. abandoned landfills) inducing downward movement of contaminants this aspect is not dealt with in these guidelines.
1.3 Structure of the guidelines The guidelines have been organised into the following sections: Section 2: Types of Saltwater Intrusion An outline and illustrations of the three major types of saltwater
intrusion Section 3: Water Quality
A description of water chemistry and conductivity associated with salt water intrusion
Section 4: Modelling of Saltwater Intrusion
A description of the methods and equations for determining the position of the saltwater interface.
Environment Canterbury Unpublished Technical Report 7

Coastal aquifer saltwater intrusion assessment guidelines
Section 5: Screening Criteria for Consents
An outline of how to determine if a groundwater abstraction is likely to have an effect on saltwater intrusion.
Section 6: Monitoring Conditions
Examples of appropriate monitoring conditions to impose on groundwater abstractions regarded as having potential saltwater intrusion effects.
2 Types of saltwater intrusion Saltwater intrusion is the movement of saline groundwater into aquifers; because saltwater is denser than freshwater it can penetrate into coastal aquifers and underlie the fresh groundwater. The ‘interface’ is a term used to represent the transition from fresh to salt water, and is not a line, but a diffuse zone of mixing. There are three types of saltwater intrusion in the Canterbury region: (a) Lateral movement of the fresh/salt water interface in aquifers connected to the sea
(Figure 2.1); (b) Upconing of saltwater lying at depth within an aquifer (Figure 2.2); and (c) Downwards migration of saline water in estuaries and the coastal margin of streams
(Figure 2.3).
i) Salt-fresh water interface in an unconfined aquifer under hydrostatic conditions (on left) and under steady state seaward flow (on right)
ii) Salt-fresh water interface in a confined coastal aquifer under condtions of steady state seaward flow
(left) and seawater intrusion induced by pumping (right).
Figure 2.1 Position of the salt-fresh water interface in unconfined and confined aquifers (from Freeze and Cherry, 1979)
8 Environment Canterbury Unpublished Technical Report

Coastal aquifer saltwater intrusion assessment guidelines
Figure 2.2 Upconing and landward movement of the salt/fresh water interface
created by pumping
Saline Estuary
AQUITARD
AQUIFER
Q
Static Water Pressure
Pumped Water Pressure
Figure 2.3 Downwards seepage of saline water into an aquifer due to decreased
pressures in underlying aquifer.
Environment Canterbury Unpublished Technical Report 9

Coastal aquifer saltwater intrusion assessment guidelines
3 Water quality
3.1 Chemistry of seawater and groundwater The chemistry of sea water is very distinct from that of fresh groundwater, so the effects of saltwater intrusion can be quite dramatic. The total concentration of dissolved ions in sea water is about 35,000 milligrams per litre (mg/L), roughly 300 times that typically found in fresh Canterbury groundwater (Table 3.1). Moreover, the ions dissolved in sea water are dominated by chloride and sodium, whereas the ions in most Canterbury groundwater are dominated by bicarbonate1 and calcium.
Table 3.1 Comparison of dissolved ions in sea water and groundwater
Ion or property Units Sea water1 Canterbury groundwater2
Anions
Cl- mg/L 20,000 7.9 SO4
2- mg/L 2,560 7.7 HCO3
- (alkalinity) mg/L 132 53.0 NO3
- mg/L 0.28 3.1
Cations Na+ mg/L 11,000 9.7 Mg2+ mg/L 1,300 3.7 Ca2+ mg/L 420 15.0 K+ mg/L 410 1.0
Total dissolved solids (TDS) mg/L 35,900 112
Electrical conductivity mS/m 4,800 17 pH 8.1 6.8 mg/L = milligrams per litre mS/m = milliSiemens per metre SOURCES: 1: analysis of a sea water sample collected from Brighton Beach, Christchurch (site CRC303779), in June 1997; the values agree well with published values in Drake et al. (1978), Drever (1997), Krauskopf (1979), and the Open University (1989) 2: median values from 2001 annual groundwater quality survey of 243 wells in Canterbury
When a well begins to draw in seawater, the concentrations of all dissolved ions increase, and chloride and sodium concentrations increase relative to bicarbonate and calcium concentrations, respectively. The water becomes unpleasant to drink, or even unpotable, and it may become unsuitable for irrigation or other uses as well.
1 Bicarbonate (HCO3
- ) concentration is generally measured by titration and reported as alkalinity in mg/L HCO3-. At the pH levels generally found in Canterbury groundwater, the bicarbonate (HCO3
- ) ion accounts for virtually all of the measured alkalinity, so for the purposes of this paper, alkalinity and bicarbonate concentraton are assumed to be synonymous. However, it should be noted that at pH levels above 9 or 10, the carbonate ion (CO3
2- ) accounts for a significant portion of the alkalinity measurement.
10 Environment Canterbury Unpublished Technical Report

Coastal aquifer saltwater intrusion assessment guidelines
3.2 Potential hazards of saltwater intrusion 3.2.1 Drinking water Saltwater intrusion can affect the suitability of groundwater for both drinking and irrigation. Pure seawater is not potable, but there are no health guidelines for safe concentrations of TDS or any of the major ions in seawater. However, the Ministry of Health has set guideline values for aesthetic characteristics of water, mainly taste and corrosiveness (Table 3.2).
Table 3.2 Drinking-water standards for saline water
Ion / Property Guideline Value (mg/L) Comments
sodium 200 taste
chloride 250 taste, corrosion
sulphate 250 taste, corrosion
hardness (Ca + Mg) 200 scale deposition, possible corrosion
TDS 1000 taste
If the groundwater described in Table 3.1 were contaminated with only 2% seawater (i.e. a mixture of 98% groundwater and 2% seawater), the sodium and chloride concentrations would exceed the Guideline Values listed in Table 3.2 (see Figure 3.2). 3.2.2 Irrigation Irrigation with saline water can damage soils and crops. The main effects are salinity and sodicity. 3.2.2.1 Salinity In dry climates, where the evaporation rates are high relative to the amount of water that leaches through the soil profile, irrigation with saline water can cause salts to accumulate in the soils. Over time, the soils can become too saline to support plant growth. The long-term development of saline soils through poor irrigation practices is probably not a threat in New Zealand because winter rainfall is generally sufficient to leach any salts that might accumulate over the summer irrigation season. However, irrigation with saline water could damage the crops that are irrigated, depending on the salinity of the water and the salt tolerance of the crops. A thorough assessment of the salt tolerances of different crops is beyond the scope of these guidelines, and the reader is referred to other documents like the ANZECC (2000) guidelines. 3.2.2.2 Sodicity If soil pore water contains too much dissolved sodium relative to calcium and magnesium, the sodium ions can replace calcium and magnesium ions that are adsorbed to the clay particles in the soil. This can destroy the soil structure, making the soils difficult to cultivate and reducing water availability in the soil profile (ANZECC, 2000). The ratio of sodium to calcium and magnesium is commonly assessed by the sodium adsorption ratio (SAR):
( )( ) ( )
2
++++
+
+=
MgCA
NASAR (1)
Environment Canterbury Unpublished Technical Report 11

Coastal aquifer saltwater intrusion assessment guidelines
The median Canterbury groundwater in Table 3.1 has an SAR of 0.8, while seawater has an SAR of 83. According to Handbook 60 (USSL 1954), an old publication of the United States Department of Agriculture that is still widely cited, irrigation water with an SAR less than 10 poses a low risk to soils, though the risk increases somewhat with TDS ( measured by electrical conductivity). In contrast, the ANZECC (2000) guidelines suggest that at low TDS concentrations, water with SAR > 5 can cause soil structure problems, but the soil can tolerate water much higher SAR values if the TDS concentration is high. Soil type is an important factor in determining the vulnerability of soils to sodicity. Soils with high clay content are the most vulnerable, while sandy soils can tolerate more sodic irrigation water with little effect. 3.2.3 Other uses Saltwater contamination can also affect the suitability of water for stockwater or commercial/industrial uses. According to the ANZECC guidelines (ANZECC, 2000), stock may be reluctant to drink water with total dissolved solids concentrations above 2,000 to 5,000 mg/L, though decline in health may only occur with higher concentrations (3,000 to 10,000 mg/L). Water quality limits for industries may vary widely depending on the type of industry.
3.3 Determination of saltwater intrusion When a well is affected by saltwater intrusion, there is a dramatic increase in the concentration of dissolved solids in the well water, and the ratios of chloride:bicarbonate and sodium:calcium increase. Figure 3.1 shows a simplified picture of how the chemistry of a sample of typical Canterbury groundwater might change as it is contaminated with pure sea water in a laboratory environment. Chloride and sodium concentrations increase dramatically with even small amounts of seawater contamination, while bicarbonate and calcium concentrations remain relatively unaffected. In the real world, the change in water chemistry can be quite complex due to cation exchange processes and other processes in the aquifer, but the general pattern will be similar to that shown in Figure 3.1.
12 Environment Canterbury Unpublished Technical Report

Coastal aquifer saltwater intrusion assessment guidelines
0
100
200
300
400
500
600
700
800
900
1000
0% 1% 2% 3% 4% 5%
Percentage of sea water in mixture
Con
cent
ratio
n (m
g/L) chloride
sodium
calciumalkalinity
Figure 3.1 Ideal mixing of groundwater and sea water. Based on the concentrations
relatively cheap and convenient way to screen for the effects of saltwater intrusion is to
d
,
nvironment Canterbury records conductivity in units of milliSiemens per metre (mS/m), but
nits ng
or the range of values commonly measured in coastal Canterbury groundwater, the .2),
y = 2.3x – 33 (2)
here y is the chloride concentration in mg/L and x is the conductivity in mS/m. Based on the
for groundwater and sea water given in Table 3.1. The graph represents the results of mixing with no interaction between the water and the surrounding aquifer material. On the x-axis, 0% indicates pure groundwater, 100% would indicate pure sea water.
Amonitor electrical conductivity. Conductivity is a measure of how well electricity is conductethrough a given distance of water, and it is directly related to the concentration of dissolved ions in the water. Since saltwater contamination causes a sharp rise in total dissolved solidsit will also cause a sharp rise in conductivity. It must be noted, however, that other contamination can also cause conductivity to increase, so care must be taken wheninterpreting conductivity results. Eother units are often used, so care must be taken when recording and interpreting measurements. In fact, most field meters display measurement results in different udepending on the magnitude of the result, so a user needs to be very careful when readithe meter. Other units commonly in use for conductivity values include microSiemens per centimetre (1 uS/cm = 0.1 mS/m) and deciSiemens per metre (1 dS/m = 100 mS/m). Frelationship between conductivity and chloride concentration is almost linear (Figure 3and chloride concentration can be estimated from conductivity using the formula
wdata in Figure 3.2, the chloride concentration exceeds the aesthetic Guideline Value of 250 mg/L when conductivity exceeds about 100 - 120 mS/m. This is much higher than most conductivity values measured in Canterbury groundwater.
Environment Canterbury Unpublished Technical Report 13

Coastal aquifer saltwater intrusion assessment guidelines
y = 2.3x - 32.8R 2 = 0.9
0
50
100
150
200
250
300
350
400
450
500
0 20 40 60 80 100 120 140 160 180 200
Electrical conductivity (mS/m)
Chl
orid
e (m
g/L)
MoH Guideline Value250 mg/L
Figure 3.2 Relationship between electrical conductivity and chloride concentration. Based on data from 1320 samples collected from wells (220 total) within 2 kilometres of the Canterbury coast during the period January 1990 through June 2003. The linear regression equation is calculated using only samples with conductivity values less than 200 mS/m.
A conductivity measurement is much cheaper than a full chemical analysis for major ion concentrations, and it can even be made in the field using a portable meter. Such field measurements are generally reliable, provided that the meter is maintained properly and calibrated regularly. It is also good practice to collect periodic samples for laboratory analysis as another quality control check. Conductivity is affected by temperature, so measurements are typically corrected to 25ºC. Most field instruments have the capability to do this. Conductivity is also affected by pressure, but at the pressures of most groundwater samples, the variation is minor. Finally, as mentioned above, care must be taken with field meters to record the conductivity values in the correct units.
3.4 Examples of saltwater intrusion in Canterbury An example of a well that is probably affected by saltwater intrusion is well J39/0042, a 7-metre deep well in southern Canterbury that is located less than 400 metres from the coast (this well was mentioned in Section 1.1 above). The well is part of Environment Canterbury’s regular monthly monitoring programme. For much of the year, the conductivities in this well are in the range of 20-40 mS/m, but in some late summer periods, when the well has been pumped for irrigation, the conductivity rises to over 500 mS/m (Figure 3.3). The chloride concentration rises to 1000-2000 mg/L at these times, whereas it is normally less than 50 mg/L. In contrast, the bicarbonate concentration remains between 40 and 60 mg/L. This pattern is much like the ideal mixing pattern shown in Figure 3.1.
14 Environment Canterbury Unpublished Technical Report

Coastal aquifer saltwater intrusion assessment guidelines
0
100
200
300
400
500
600
700
800
900
1000
Jan-98 Jan-99 Jan-00 Jan-01 Jan-02 Jan-03
Date
Con
dcut
ivity
(mS/
m)
-10
-9
-8
-7
-6
-5
-4
-3
-2
-1
0
Gro
undw
ater
leve
l (m
)
conductivity groundwater depth
Figure 3.3 Conductivity values and groundwater levels from well J40/0042 near Makikihi. Groundwater levels are shown such that more negative values indicate deeper groundwater levels.
Sodium and calcium are only monitored quarterly in well J39/0042, and they have been analysed during a high-conductivity event on only one occasion. Sodium concentrations are usually in the range of about 20-40 mg/L, but on this occasion the concentration rose to 890 mg/L, while the calcium concentration, which is normally in the range of 10-40 mg/L, rose to only 210 mg/L. The chemical data from the well are consistent with saltwater intrusion, where prolonged pumping draws the saltwater/freshwater interface closer to the well. Well M36/1159, located in the Woolston area of Christchurch, is another well affected by saltwater intrusion. Samples from this well never have low conductivity values. Instead, the values are generally in the range of 500 to 600 mS/m. Chloride concentrations are around 2000 mg/L and sodium concentrations around 400-500 mg/L, in contrast to bicarbonate concentrations around 70 mg/L and calcium and magnesium concentrations each around 200-400 mg/L. The ion proportions are much more like those in sea water than in groundwater, and they probably indicate persistent salt water contamination, in contrast to the periodic saltwater intrusion seen in well J39/0042. High conductivity values can be caused by other factors than saltwater intrusion. For example, groundwater in limestone aquifers commonly has elevated concentrations of dissolved calcium, magnesium, and bicarbonate ions that can cause high conductivity values. Wells O33/0061 and N33/0091, located in the Cheviot-Mina area in northern Canterbury, consistently have conductivity values between 50 and 100 mS/m. They have high sodium and chloride concentrations, but the concentrations of calcium and bicarbonate are higher, and this reflects limestone and marine sediments in the aquifers rather than saltwater intrusion. Well J39/0259, located at Redruth just south of Timaru, has high conductivity values (commonly in the range of 80-90 mS/m) and sodium concentrations much greater than calcium, but the bicarbonate concentration is generally a bit higher than chloride concentration, though both are high (bicarbonate is around 200-230 mg/L, chloride is around 160-180 mg/L). The well is located near Saltwater Creek, which is tidal, and the chemistry in the wells may result from a combination of the infiltration of saline water from the creek, together with interactions with the aquifer sediments.
Environment Canterbury Unpublished Technical Report 15
Coastal aquifer saltwater intrusion assessment guidelines
Groundwater contamination from landfills and industrial sites can also cause increases in dissolved ion concentrations. Well M35/3085, located in the Wigram area south of Christchurch, is directly down gradient of a landfill. Conductivities have been measured in the range from 73 to 146, but the ions are dominated by bicarbonate and calcium rather than sodium and chloride. The well also has high concentrations of ammonia, iron, and manganese, which are commonly indicative of landfill leachate. Finally, there are situations where contamination by sea water or seawater salts may not be due to saltwater intrusion. If aquifer sediments contain old sea water from the time of sediment deposition (called “connate” water), a well penetrating these sediments will produce saline water, even though it has not reached the saltwater/freshwater interface. If the well is close to such sediments, prolonged pumping may eventually draw the saline connate water into the well. Saline connate water can be found in inland basins as well as in coastal areas. Near the coast, rain water has higher concentrations of sea salts than it does further inland, and this, combined with the deposition of sea spray, commonly increases the salt content of soils near the coast. The salts are leached through the soils to the water table, and the groundwater becomes slightly saline. The salinity is low, but since the ion proportions are similar to those in sea water, the chemistry can be mistaken for early signs of saltwater intrusion. However, the effect will probably be greatest when groundwater levels are high as a result of high recharge; this is the opposite pattern to that seen in most cases of saltwater intrusion. Saline rainfall and sea spray have been suggested as part of the cause of elevated salinity in the groundwater at the Amberley golf course (Moore, 1995, also Appendix 3), though saltwater intrusion cannot be ruled out there. The effects of sea spray may also be responsible for the salinity observed in a well at Woodend (M35/0527), where conductivities decreased during a pumping test. It may be that at the start of pumping, the well was drawing shallow groundwater that was contaminated by leached salt, and as the test progressed, the well began to draw deeper water with lower salinity.
3.5 Water quality summary In summary, the best evidence for saltwater intrusion is proximity to the coast and a distinct rise in conductivity coincident with pumping or low groundwater levels. The rise in conductivity would be accompanied by increasing ratios of chloride:bicarbonate and sodium:calcium. Where a well has high conductivity values from the first time it is tested, additional chemistry may provide clues as to whether the water is contaminated with sea water, affected by interactions with soluble aquifer material like limestone or some volcanic sediments, or affected by industrial contamination. Changes in chemistry with pumping can also indicate whether a well is drawing in more sea water or more fresh water over time.
16 Environment Canterbury Unpublished Technical Report

Coastal aquifer saltwater intrusion assessment guidelines
4 Modelling saltwater intrusion
4.1 Interface position equations The fresh-salt water interface is a transitional zone caused by dispersion, however, often the width of this zone is small compared to the aquifer thickness, and it is appropriate to assume an abrupt interface approximation (Walton, 1991). The Ghyben-Herzberg and Glover equations are such estimations, and are outlined below. 4.1.1 Ghyben-Herzberg formula Initial studies of saltwater intrusion were independently undertaken by Ghyben, (1889), and Herzberg (1901), who demonstrated that saltwater in coastal areas occurred at depths below sea level equivalent to approximately 40 times the height of fresh water above sea level. This is referred to as the Ghyben-Herzberg formula.
ffs
f hz
−=
ρρρ
(3)
Where z is the depth below sea level to a point on the interface, hf is the height of the fresh water aquifer level above sea level, ρf is the fresh water density and ρs is the salt water density (Figure 4.1). If the fresh and saltwater densities are taken as ρf = 1 and ρs = 1.025, the formula is simplified as:
z = 40hf (4) This suggests that if the water table in an unconfined aquifer is lowered by 1 m there will be a 40 m rise in the saltwater interface. Consequently, relatively small water level decreases in a fresh water aquifer may have relatively large impacts on the intrusion of saltwater into that aquifer. The Ghyben-Herzberg relationship is an equilibrium model and does not take into account variables such as fresh water inflow and hydraulic gradient changes.
Environment Canterbury Unpublished Technical Report 17

Coastal aquifer saltwater intrusion assessment guidelines
SEA
Salt Water
Fresh Water
Mean Sea level
d z
hfWell
Depth
Salt-fresh water interface
Ground levelWater table
Figure 4.1 Schematic diagram of variables used in saltwater intrusion/ upconing equations.
4.1.2 Glover equation The Glover (1964) equation accounts for the effect of freshwater flow pushing the interface to greater depths (Figure 4.2). Where:
2
02
)('
)('2
−+
−=
fs
f
fs
f
KQ
KxQ
zρρ
ρρρρ
(5)
• Q’ is the pumping rate • K is the hydraulic conductivity • χ0 is the distance from the shoreline
The greater the flow to the sea the deeper the interface. The Glover equation allows calculation of the interface position at any point inland of the coast, allowing the geometry of the saltwater wedge to be determined. Since Darcy’s law r3elates flow, conductivity and gradient, Glovers’s equation can be rewritten as:
( ) ( )2
2 2
−+
−=
fs
f
fs
imimzρρ
ρρρ
(6)
Where:
• i is the freshwater hydraulic gradient, and
• m is aquifer thickness
18 Environment Canterbury Unpublished Technical Report

Coastal aquifer saltwater intrusion assessment guidelines
Land surface
Fresh water
Water table
Seepage face
X0
Z0
Saline water
Interface
Ocean
Figure 4.2 Flow pattern near the coast (modified from Glover, 1964)
4.2 Upconing equations Upconing of the interface can occur when the aquifer head is lowered by pumping at a well(s) (Figure 2.2). An approximate analytical solution for upconing that calculates a new equilibrium elevation of the interface is response to pumping is given by Schmorak and Mercado (1969) (Figure 4.3) as:
)(2 fs
f
dKQ
zρρπ
ρ−
= (7)
where: • z is the new equilibrium elevation (the distance between the upconed and original
interface) • Q is the pumping rate This relationship only holds for very small rises in the interface and there exists a critical elevation at which the interface is no longer stable and salt water flows to the well. Dagan and Bear (1968) suggest that the interface will be stable where upconed heights do not exceed one third of d which provides a basis for a maximum permitted pumping rate of:
−≤
s
fsKdQρ
ρρπ 2
max 6.0 (8)
Environment Canterbury Unpublished Technical Report 19

Coastal aquifer saltwater intrusion assessment guidelines
d z
Pumping
Upconed interface
Original interface
Figure 4.3 Upconing of interface in response to pumping (Domenico and Schwartz,
1990)
Upconing can also occur in semi-confined aquifers where a well partially penetrates the fresh-water zone, and is described in Motz (1992).
5 Screening criteria for consents Suggested criteria for screening consent applications to determine the potential salt-water contamination effect are outlined below, and summarised in a flow chart (Figure 5.1).
5.1 Distance The first screening of potentially affected wells is a distance criterion. All wells within 1500m of the coast, and all wells within 2000m of the coast that have a proposed pumping rate of greater than 30 l/sec should be considered. These values have been selected in line with the Ecan’s well interference guidelines (ECan, 2004) as the maximum distances that a significant well pumping effect could be expected to propagate. In an area where cumulative drawdown effects of pumping are already significant, or the applicant’s take is very large (say in excess of 80 l/s), there may be grounds for extending the distance further.
20 Environment Canterbury Unpublished Technical Report

Coastal aquifer saltwater intrusion assessment guidelines
he well.
Yes No
No
Yes
Yes Yes
No
No
Refuse Consent
Can saltwater intrusion effects be mitigated?
Saltwater intrusion is not an issue
Propose Consent Conditions depending on assessed risk of saltwater intrusion. Types of monitoring may include: • Water quality/conductivity
monitoring • Aquifer pressure monitoring • Water usage monitoring.
Does previous monitoring suggest a potential saltwater risk?
Confined Aquifer 1) Use the most appropriate
method (e.g. Theis, Hunt (2002)) to assess drawdown at the coast created by pumping from t
2) Assess whether this calculated drawdown will maintain a 1.5m aquifer head at the coast.
3) If there are other groundwater takes in the vicinity assess whether a 1.5m head will be maintained at the coast in response to the cumulative impact of these and the applicant.
4) Does previous monitoring suggest a potential saltwater problem
Is saltwater intrusion a potential?
Unconfined Aquifer 1) Use Ghyben-Herzberg and/or
Glover equation to assess position of interface using conservative water levels (Section 4.1)
2) Assess the risk of upconing using the Schmorak and Mercado equation (Section 4.2):
3) Decide if there is a potential for upconing/landward movement of the interface.
4) Assess the cumulative impact of neighbouring bores, and of the applicant.
5) Does previous monitoring suggest a potential saltwater problem?
Is saltwater intrusion a potential?
Decide if aquifer is Confined or Unconfined.
Is well within 1500m of the coast, or within 2000m and
pumping at > 30l/s?
Figure 5.1 Flow chart showing decision process for handling groundwater take consents with potential saltwater intrusion issues
Environment Canterbury Unpublished Technical Report 21

Coastal aquifer saltwater intrusion assessment guidelines
5.2 Calculation of potential effect 5.2.1 Unconfined aquifers The position of the saltwater/interface should be initially modelled using the Ghyben-Herzberg analysis. This requires knowledge of the elevation of the aquifer’s head above mean sea level to be known. This data can be found using (in order or accuracy) • actual surveyed levels for the well in question • extrapolated data using wells in the immediate area with relative levels • estimated levels from topographic maps The most conservative assessment of aquifer head must be made (i.e. the lowest number in term of height above mean sea level) especially when the elevation of the well head is estimated rather than measured. The Glover solution may be used as a more refined estimation if the hydraulic conductivity, or hydraulic gradient are known. Sources of transmissivity data are covered in ‘Guidelines for Well Interference’ (ECan, 2004). Hydraulic conductivity can be determined if the thickness of the aquifer is known (where transmissivity = hydraulic conductivity times aquifer thickness). Hydraulic gradients can be determined from piezometric contours. Once the position of the interface is established, the potential for up-coning needs to be estimated using the Schmorak and Mercado (1969) (Section 4.2). Upconing can only occur when there is saline water within an aquifer underlying the pumping well. If the interface is known to be greater than the base of the aquifer, then it is not appropriate to assess for upconing. Input parameters required are: aquifer hydraulic conductivity; and the distance from the bottom of the well to the interface position calculated using Ghyben-Herzberg (d). Though pumping from one well may not create saltwater intrusion, pumping from a number of wells in one area will move the position of the interface landward, and may potentially create problems with saltwater intrusion. To assess the cumulative effect, all wells within 1500m (or 2000m if >30 l/sec) of the pumping well should be assessed. The distance to the interface and the risk of upconing should be calculated for each well, factoring in the cumulative drawdowns of all wells upon each other using Multiwell. The results of the Multiwell assessment should be evaluated in light of the historical range of water level fluctuations that occur in the area, to ensure that the calculation results are realistic. The effect of the new take on the existing wells can then be calculated by re-assessing the interface position and up-coning potential based on the additional drawdown created by the new take’s interference effect. The total effect for each well should not exceed one third of d (Dagan and Bear, 1968). Figure 5.1 illustrates two wells in an unconfined aquifer. Well A is shallower than sea level, and Well B is deeper. Pumping from Well A is unlikely to lead to contamination of Well A, but could lead to overall water level lowering, and thus movement of the salt-fresh water interface. Pumping from Well B can result in movement of the interface, and contamination of Well B. It would not be appropriate to require water quality or conductivity in Well A in regard to monitoring conditions, as the well is unlikely to be contaminated as a result of its own pumping.
22 Environment Canterbury Unpublished Technical Report

Coastal aquifer saltwater intrusion assessment guidelines
Aquitard
OceanSea level
Water table
Well BWell A
Figure 5.2 Example of wells above and below sea level
A worked case example is included in Appendix 2. 5.2.2 Semi-confined and confined aquifers
Semi-confined and confined aquifers do not fit the conceptual model that is assumed in the Ghyben-Herzberg and Dagan and Bear equations. The best way to prevent the potential saltwater intrusion into a semi-confined or confined aquifer is to maintain water pressures at the coast above mean sea level. A value of 1.5m above mean sea level (amsl) has been selected as appropriate (for justification see Appendix 1). Coastal monitoring bores at Woodend, New Brighton, Ellesmere and Seafield all currently record coastal first confined aquifer pressures at above 1.5m amsl. For deeper aquifers, such as the second to fourth aquifers in Christchurch, or deeper aquifers in the Rakaia-Ashburton Plains, maintaining an upwards hydraulic gradient between aquifers at the coast is also important. There are a relatively small number of wells in these aquifers, and it is recommended they are assessed in consultation with ECan’s Groundwater Resources Section. For a proposed groundwater take, a drawdown at the coast should be calculated using an appropriate method (e.g. Theis). This calculated drawdown should then be superimposed on the lowest measured water level at the coast in the same aquifer to ensure the proposed new take will not reduce this level below 1.5m amsl. If data is available it may be reasonable to use the 24 hour mean level on this lowest day (i.e. take account of tidal variation). If the new take will theoretically lower the first aquifer pressure below 1.5m, then the option of collecting further information such as aquifer testing to more accurately measure drawdowns and obtain aquifer parameters exists. If the effect is still to lower the first aquifer pressure below 1.5m, then consent conditions and mitigation options as discussed in Section 7 will be required. To assess cumulative effects all wells within 2000m of a point at the coast (determined in a direct line from the well under application) should be assessed in terms of drawdown at the coast. This is easily accomplished within Multiwell where a dummy well with co-ordinates at
Environment Canterbury Unpublished Technical Report 23

Coastal aquifer saltwater intrusion assessment guidelines
the coastline is added. The total calculated drawdowns should not lower the aquifer pressure below 1.5m amsl. A worked case example is included in Appendix 2.
6 Monitoring conditions
6.1 Intrusion risk Monitoring conditions should be imposed on abstractions that have been assessed as having a potential risk of saltwater intrusion. The prescriptiveness of conditions will depend on the perceived risk of intrusion. Table 6.1 outlines some examples of high and low risk factors in saltwater intrusion.
Unconfined Aquifer Semi-confined to confined aquifer Low Risk • Low pump rate
• Large distance between coast and well • Shallow well • Few nearby wells
• Low pump rate • Large distance between coast and well • No other wells between well and coast
High Risk • High pump rate • Small distance between coast and well • Deeper well • Many nearby wells • Water quality monitoring in past has
indicated a risk
• High pump rate • Small distance between coast and well • Other wells between the well and coast • Water quality monitoring in past has
indicated a risk.
Table 6.1 Risk Factors in Saltwater Intrusion Assessment
Some examples of potential conditions based on risk factors are summarised in Appendix 3.
6.2 Monitoring types The three main types of monitoring required are: aquifer pressure; water quality; and water usage. All three types are outlined below. 6.2.1 Aquifer pressure monitoring Monitoring aquifer pressures is an important means of checking that pressures are maintained and do not permit saltwater intrusion to occur. It is essentially a preventative measure, and is preferable to directly measuring water quality, which only detects intrusion after it has already occurred. Aquifer pressures may be monitored at the pumping well itself, or preferably at a ‘Sentinel Well’ (a ‘Sentinel Well’ refers to a well that would act as an early warning of salt-water intrusion). A sentinel well should be located between the pumped bore and the coast. For consents that have a moderate to high risk of saltwater intrusion, monitoring water pressures (and water quality) at a sentinel well is recommended. For consents with a low risk of saltwater intrusion, monitoring pressures at the pumped well is acceptable. A pumped well should generally be turned off for at least 24 hours before a water pressure is measured.
24 Environment Canterbury Unpublished Technical Report

Coastal aquifer saltwater intrusion assessment guidelines
6.2.2 Water quality monitoring Water quality monitoring should be implemented where analysis indicates a risk of saltwater intrusion/contamination. The level and frequency of monitoring required will depend on the assessed risk. For low risk areas, annual or bi-annual samples of conductivity and chlorides concentration may be sufficient. For higher risk takes more frequent monitoring and more complete water quality measurements may be appropriate. The frequency of monitoring will also be affected by the type of saltwater intrusion the aquifer is at risk from. For landward movement of the salt/fresh water interface, longer term measurements such as biannually will be sufficient to measure a trend, as the interface will move slowly. For upconing it may be appropriate to have measurements at much more frequent intervals, especially during the irrigation season as upconing can develop and recede quickly. Measurements from a sentinel well will be more appropriate for landward movements of the interface, as any decrease in water quality will therefore be measured at this well before the pumped well. For upconing however the greatest effect will be at the pumped well itself, and measurements should be taken from this well. 6.2.3 Water usage monitoring The total usage of groundwater in the coastal zone is very important from a management perspective. Having actual usage figures in combination with groundwater modelling will allow sustainable limits of groundwater usage to be set in coastal areas, to reduce the risk of saltwater intrusion. On a localised scale, knowing the total usage combined with water quality and pressure measurements may allow a relationship between upconing and usage to be developed, so that abstractors can manage their takes to levels that prevent the development of upconing. Water usage monitoring is ideally through the installation of water meters, with the frequency of measurements at a scale to suit the potential risk (e.g weekly measurements to detect upconing, monthly for landwards intrusion).
6.3 Existing saltwater intrusion conditions A summary of existing groundwater takes that have saltwater intrusion conditions is included in Appendix 5. The conditions have often been non-standard, but there are now some standard conditions, including WG010, WG011, WG012 that specifically relate to conductivity measurement, as well as several water use and water level measurement conditions.
Environment Canterbury Unpublished Technical Report 25

Coastal aquifer saltwater intrusion assessment guidelines
7 References ANZECC, 2000: Australian and New Zealand Guidelines for Fresh and Marine Water
Quality, Volume 1, The Guidelines (Chapters 1-7). Australian and New Zealand Environment and Conservation Council (ANZECC) and Agriculture and Resource Management Council of Australia and New Zealand (ARMCANZ), Paper No. 4 - Volume 1 (Chapters 1-7), October 2000, ISBN 09578245 0 5 (set), ISSN 1038 7072 .
Dagan, G., Bear, J., 1968: Solving the problem of local interface upconing in a coastal
aquifer by the method of small perturbations. Journal of Hydrological Research, v.6, p. 15 – 44.
Domenico, P.A., and Schwartz, F.W., 1990: Physical and Chemical Hydrogeology. John
Wiley and Sons Inc, New York. Drake, C. L., Imbrie, J., Knauss, J.A., and Turekian, K.K., 1978: Oceanography. Holt,
Rinehart, and Winston, New York, 445 pages. Drever, J. I., 1997: The Geochemistry of Natural Waters. Third edition. Prentice Hall, New
Jersey. 436 pages. ECan, 2004: Guidelines for the auditing of well interference effects. Environment Canterbury
Unpublished Technical Report U03/7. Freeze, R.A., Cherry, J.A., 1979: Groundwater. Prentice-Hall Inc, New Jersey. Glover, R. E, 1964, ‘The pattern of freshwater flowing in a coastal aquifer, in seawater in
coastal aquifers’ US Geological Survey Water Supply Paper 1613-C, p32-35 Hertel, I (1998): Groundwater contamination in the Heathcote/Woolston area, Christchurch,
New Zealand. University of Canterbury M.Sc. Thesis. June, 1998. Krauskopf, K. B., 1979: Introduction to Geochemistry (2nd edition). McGraw-Hill, New York,
617 pages. Moore, C.R., 1995: Groundwater quality in the shallow aquifer at Amberly Golf Course, North
Canterbury. Environment Canterbury report U94/19, file number PU1C/05207. Christchurch.
Motz, L. H. 1992., ‘’”Salt-water upconing in an aquifer overlain by a leaky confining bed
’Groundwater’ Vol 30. No 2, p 192-198 Schmorak, S., and Mercado, A., 1969: Upconing of freshwater-seawater interface below
pumping wells. Water Resources Research, v5, p1290-1311. The Open University, 1989: Ocean Chemistry and Deep-Sea Sediments. Oceanography
Series, Volume 5. Pergamon Press, Oxford, Sydney. 120 pages. USSL (United States Salinity Laboratory) 1954: Diagnosis and improvement of saline and
alkali soils. Agricultural Handbook 60, US Department of Agriculture, Washington DC.
Walton, W.C., 1991, ‘Principles of Groundwater Engineering’., Lewis Publishers Inc,
Michigan.
26 Environment Canterbury Unpublished Technical Report

Coastal aquifer saltwater intrusion assessment guidelines
Appendix 1 Justification for maintaining a 1.5m piezometric head at the coast R Sanders Introduction Chapter 5 of the Canterbury NRRP Discussion Draft sets out a policy to “manage abstractions so that the groundwater level in the first confined aquifer is always maintained at least 1.5 metres above mean sea level” (Policy WQN7a). Discussions at a coastal aquifer management workshop in Blenheim in April 2001 suggested that there was some consensus among regional councils regarding a 1.5m level, but the most useful research to date regarding levels in New Zealand has been in two main areas:
1. Research by a University of Canterbury Masters student in the coastal aquifers of Christchurch (Hertel, 1998);
2. Wellington Regional Council have determined foreshore trigger levels for the Waiwhetu Aquifer in the Hutt Valley based on groundwater monitoring and modelling and Ghyben-Herzberg analyses.
The Canterbury Situation The Christchurch research used a numerical model called SHARP to assess the position of the freshwater/saltwater interface in the Christchurch confined aquifers. Hertel (1998) estimated that the interface in the middle of the first confined aquifer (Riccarton Gravel) was about 3.3 km offshore. She also used the Ghyben-Herzberg relationship to assess the interface position as 3.1 km offshore. Her conclusion was that the Ghyben-Herzberg relationship was suitable to estimate interface position in the confined aquifers and that: “to ensure that the freshwater/seawater interface does not migrate onshore the Ghyben-Herzberg relationship should be applied to calculate sustainable water levels. For example, if the aquifer (base) is 50m deep (below mean sea level), according to the Ghyben-Herzberg relationship a freshwater hydraulic head of 1.25m should keep the interface offshore”. She went on to recommend that the value of head determined to keep the interface below the base of the aquifer should be doubled so to provide a conservative minimum water level at the coast. However, the Ghyben-Herzberg relationship is generally a conservative estimate because it neglects the influence of freshwater flow which causes the interface to occur at greater depths. On this basis it may be sufficient to set a minimum coastal water level that keeps the predicted interface below the aquifer base. Table A1 shows the range that these levels could be set at based on aquifer depths along the Canterbury coast. It is apparent that the deeper the aquifer base the higher the water level needs to be relative to sea level. The calculated range of values is between 0.7 and 1.52m amsl. If a default figure to be used throughout Canterbury is to be chosen then it would be prudent to choose a value at the upper end of this range (i.e. 1.5m) with some leeway to vary this if hydrogeological conditions allow. All of the tabulated coastal sites (Table A1) have lowest water levels above the 1.5m figure. However Kaikoura, Woodend Beach, and Kaitorete Spit are close to these limits and a case could possibly be made for having a lower figure for shallow aquifers (say 1m for Kaikoura or Woodend Beach).
Environment Canterbury Unpublished Technical Report 27

Coastal aquifer saltwater intrusion assessment guidelines
Table A1: Data related to selected Canterbury coastal monitoring sites (first confined aquifer).
Location ECan Monitoring Well No.
Base of First Confined Aquifer(m
below mean sea level)
Piezometric Head at Coast required to Keep Saltwater
Below Base of Aquifer (Ghyben-Herzberg)
(m above mean sea level)
Calculated Minimum Groundwater Elevation
Measured at ECan Coastal Monitoring
Well (m above mean sea level)
Kaikoura O31/0115
28 0.7 1.72
Woodend Beach M35/7079
31.6 0.79 1.85
Christchurch M36/5893 (Plover St)
52.1 1.30 3.34
Kaitorete Spit M37/0287
51 1.28 1.72
Ashburton-Rakaia L37/0693
61 1.52 2.97
The Wellington Example The Wellington Regional Council (WRC) have produced a draft report on management of saltwater intrusion in the Waiwhetu Artesian Aquifer, Lower Hutt. This alluvial aquifer (laid down by the Hutt River) is the equivalent of the Canterbury first confined aquifers and is subject to heavy abstraction for industrial use and Wellington public water supply. The aquifer has been the subject of numerous studies related to saltwater intrusion dating back to 1977 and is covered by a calibrated groundwater model. Aquifer throughflow is lost to the sea:
1. where it intercepts the seabed near the entrance to Wellington Harbour; 2. through diffuse loss through the overlying aquitard (Petone Beds, equivalent to our
Christchurch Formation) within the Harbour; and 3. through large submarine springs that have been mapped as depressions in the
Harbour bed. The latter have been of concern to the WRC since they provide a route for saltwater intrusion if pressures in the springs fall below critical levels. Also of significance is that between 80 and 90% of the aquifer’s natural throughflow is captured by pumping. Ingress of saltwater could occur either through causing the postulated existing saltwater interface to move towards the shore, and/or through the backflow of harbour waters at submarine discharge sites close to the foreshore. Should the lowermost part of the Waiwhetu Aquifer contain saltwater in the vicinity of a major abstraction bore there would be a serious risk of the bore becoming contaminated through upconing. Pumping from the aquifer could cause critical aquifer conditions leading to saltwater intrusion, including:
• cessation of aquifer throughflow • cessation of submarine spring discharge • reversal of offshore groundwater gradients • foreshore water levels less than the calculated minimum Ghyben-Herzberg safe
level • offshore groundwater levels lower than harbour pressures at potential saltwater
entry sites.
28 Environment Canterbury Unpublished Technical Report

Coastal aquifer saltwater intrusion assessment guidelines
WRC have found it most appropriate and practical to assess the critical saltwater intrusion risk conditions in terms of foreshore water levels. Table A2: Minimum Petone Foreshore Water Levels Associated With Saltwater Intrusion Risk Aquifer Conditions
Aquifer Condition Critical Foreshore
Level m amsl (24 hour mean)
Method of Determination
Cessation of aquifer throughflow at foreshore Cessation of submarine spring discharge Reversal of offshore hydraulic gradients Ghyben-Herzberg minimum foreshore level
2.5
2.3
2.3 – 2.5
2.0
Model + offshore flow gradients Analytical assessment Monitored data Ghyben-Herzberg analysis using aquifer base (up to 80m below mean sea level).
It should be noted that in this area the Ghyben-Herzberg level was not considered conservative because throughflow is only about 10 – 20% of abstraction. On the basis of the above figures the following tiered foreshore aquifer management levels have been recommended (24 hour means): Warning level: 2.5m amsl (start planning how to react to situation) Critical level: 2.3m amsl (start reducing borefield pumping) Minimum allowable foreshore level 2.0m amsl (all pumping ceases) Interestingly these figures are proposed for inclusion in the WRC plan for the area. The current level is 1.4m and this has never been met and saltwater intrusion to the borefields has not been detected. Conclusions
1. Based on our current limited knowledge of the Canterbury coastal aquifers it is reasonable to use the Ghyben-Herzberg analysis to determine groundwater levels to be maintained at the coast to ensure that saltwater intrusion into the first confined aquifer does not occur.
2. Initially a blanket value of 1.5m amsl seems appropriate since for most first confined aquifer depths (down to 60m below mean sea level) in Canterbury such a level should keep the saltwater interface offshore.
3. There may be grounds for adjusting the 1.5m value at a later date if hydrogeological knowledge suggests this or if saltwater intrusion appears
References Hertel, I (1998): Groundwater contamination in the Heathcote/Woolston area, Christchurch, New Zealand. University of Canterbury M.Sc. Thesis. June, 1998. Phreatos Limited, 2001: Waiwhetu Artesian aquifer saltwater intrusion risk management review. Draft report for Wellington Regional Council, April 2001.
Environment Canterbury Unpublished Technical Report 29

Coastal aquifer saltwater intrusion assessment guidelines
30 Environment Canterbury Unpublished Technical Report
Coastal aquifer saltwater intrusion assessment guidelines
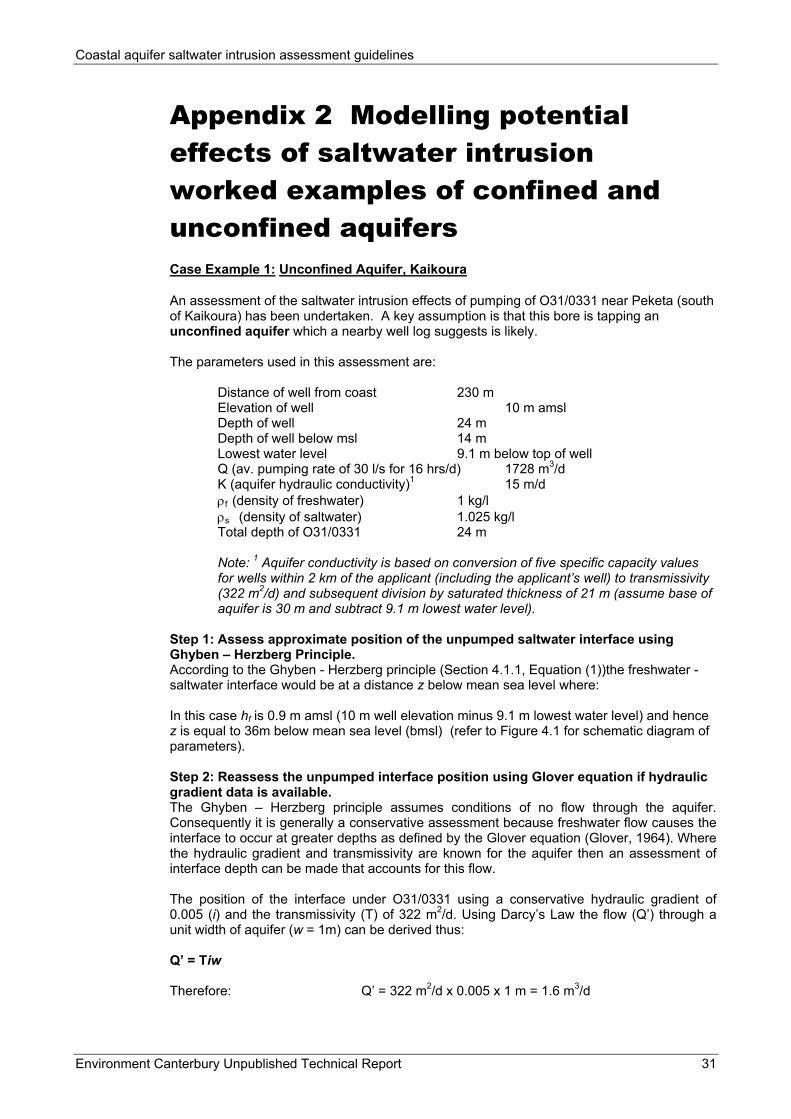
Appendix 2 Modelling potential effects of saltwater intrusion worked examples of confined and unconfined aquifers Case Example 1: Unconfined Aquifer, Kaikoura An assessment of the saltwater intrusion effects of pumping of O31/0331 near Peketa (south of Kaikoura) has been undertaken. A key assumption is that this bore is tapping an unconfined aquifer which a nearby well log suggests is likely. The parameters used in this assessment are:
Distance of well from coast 230 m Elevation of well 10 m amsl Depth of well 24 m Depth of well below msl 14 m Lowest water level 9.1 m below top of well Q (av. pumping rate of 30 l/s for 16 hrs/d) 1728 m3/d K (aquifer hydraulic conductivity)1 15 m/d ρf (density of freshwater) 1 kg/l ρs (density of saltwater) 1.025 kg/l Total depth of O31/0331 24 m Note: 1 Aquifer conductivity is based on conversion of five specific capacity values for wells within 2 km of the applicant (including the applicant’s well) to transmissivity (322 m2/d) and subsequent division by saturated thickness of 21 m (assume base of aquifer is 30 m and subtract 9.1 m lowest water level).
Step 1: Assess approximate position of the unpumped saltwater interface using Ghyben – Herzberg Principle. According to the Ghyben - Herzberg principle (Section 4.1.1, Equation (1))the freshwater - saltwater interface would be at a distance z below mean sea level where: In this case hf is 0.9 m amsl (10 m well elevation minus 9.1 m lowest water level) and hence z is equal to 36m below mean sea level (bmsl) (refer to Figure 4.1 for schematic diagram of parameters). Step 2: Reassess the unpumped interface position using Glover equation if hydraulic gradient data is available. The Ghyben – Herzberg principle assumes conditions of no flow through the aquifer. Consequently it is generally a conservative assessment because freshwater flow causes the interface to occur at greater depths as defined by the Glover equation (Glover, 1964). Where the hydraulic gradient and transmissivity are known for the aquifer then an assessment of interface depth can be made that accounts for this flow. The position of the interface under O31/0331 using a conservative hydraulic gradient of 0.005 (i) and the transmissivity (T) of 322 m2/d. Using Darcy’s Law the flow (Q’) through a unit width of aquifer (w = 1m) can be derived thus: Q’ = Tiw Therefore: Q’ = 322 m2/d x 0.005 x 1 m = 1.6 m3/d
Environment Canterbury Unpublished Technical Report 31

Coastal aquifer saltwater intrusion assessment guidelines
The Glover equation (Section 4.1.2, Equation (3)) can be applied where:
Q’ is the flow through the unit width of aquifer 1.6 m3/d x is the distance from the coast 230 m K is the aquifer hydraulic conductivity 15 m/d
Hence for the case in point the calculated value of z is 44.5 m, i.e. 8.5 m deeper than the depth predicted by the Ghyben – Herzberg method. This illustrates the conservative nature of the latter. Step 3: Use the method of Schmorak and Mercado (1969) to assess the degree of upconing due to pumping. The method of Schmorak and Mercado is used to assess the degree of upconing of the interface that would occur in response to pumping from the well. In this case the z value is different than in the preceding equations in that it refers to the size of the upconing. Using Equation 5 (Section 4.2) where:
Q is the av. pumping rate 1728 m3/d d is the distance between the bottom of the well screen and the assessed unpumped interface 22 m (using Ghyben-Herzburg) 30.5 (using Glover) K is the aquifer hydraulic conductivity 15 m/d
Thus the upconing z is calculated as 33.3 m (using G-H interface) and 24 m (using the Glover interface). Step 4: Assess the significance of the size of the upconing. Dagan and Bear (1968) suggest that the interface will be stable for upconed heights that do not exceed one-third of d (Section 4.2). For both cases of d calculated in Step 3 the upconed heights exceed one-third of d (Table B1) and so even at 30 l/s pumping there should be saltwater intrusion conditions for this applicant. Table B.1: Application of Dagan and Bear test to O31/0331.
Method of assessing d
Upconing z
Depth of interface below
well d
One-third of d Does z exceed one third of d?
Ghyben – Herzberg method 33.3 m 22 m 7.3 m Y
Glover equation
24 m 30.5 m 10.2 m Y
Step 5: What pumping rate could be applied without being subject to saltwater intrusion conditions? Dagan and Bear also provide an equation (Section 4.2 Equation (6)) for calculating the maximum pumping rate that will not lead to instability from a saltwater intrusion point of view. The results are shown in Table B2.
32 Environment Canterbury Unpublished Technical Report

Coastal aquifer saltwater intrusion assessment guidelines
Table B2: Assessment of maximum pumping rates that would allow exclusion from saltwater intrusion conditions.
Method of assessing d
Depth of interface below
well d
Qmax m3/d
Qmax l/s
(16 hrs/d)
Ghyben – Herzberg method 22 m 342 5.9
Glover equation
30.5 m 657 11.4
Conclusion The stepped assessment of saltwater intrusion potential based on a revision of consent CRC021423 shows that cutting the consented pumping rate from 47 l/s to 30 l/s (16 hours per day) still requires saltwater intrusion conditions to be imposed. This is the case whether the more conservative Ghyben-Herzberg method or the Glover equation is used to assess effects. The latter was based on assumptions of parameters and would only have been used if the applicant had provided more details for assessment of hydraulic gradient (including levels) and transmissivity.
Case Example 2: Semi-Confined Aquifer, Kyle, Ashburton-Rakaia Plains L37/0976 has a proposed abstraction of 98 l/sec from an aquifer screened at 67.5-70.5m. The well is located 840m from the coast (Figure B2). Transmissivity was estimated using the TCalc program at 3200 m2/day and storativity at 0.0001 to represent a semi-confined aquifer. A Theis drawdown at the coast generates a drawdown of 1.94m. A Multiwell analysis of the additional 2 wells in the same aquifer within 2000m of the coast, (L37/0431 pumping at 90 l/sec and L37/0577 pumping at 70 l/sec) generated a total drawdown at the coast of 4.535m. L37/0693 an ECan monitor well at the coast 6800m south-west of L37/0976 has a minimum water pressure in the same aquifer of 3.119m above mean sea level. Hence the individual effect of pumping at L37/0976 is to drop the aquifer pressure to 1.18m amsl, and the cumulative effect of all three wells pumping is to drop the aquifer pressure to –1.46m amsl. This effect is greater than the minimum recommended aquifer pressure of 1.5m amsl, and thus either further information needs to be provided to assess this effect, or stringent monitoring conditions need to be imposed. It is noted that wells near L37/0693, the ECan monitoring bore, are calculated to drop the aquifer pressures to below mean sea level. This effect has not been seen in the monitored data at L37/0693, and thus underlines how the Theis method is overestimating the actual drawdowns.
Environment Canterbury Unpublished Technical Report 33

Coastal aquifer saltwater intrusion assessment guidelines
AquitardAquifer
Aquifer
Drawdown Cone
Piezometric headat coast = 3.12m
Additional drawdown at coast (1.94m)New piezometric head = 1.18m
840 m
Transmissivity = 3200m2/dayStorativity = 0.0001
Figure B1 Schematic of Semi-confined aquifer for Case Example
34 Environment Canterbury Unpublished Technical Report

Coastal aquifer saltwater intrusion assessment guidelines
Appendix 3 Examples of potential consent conditions based on risk assessment Risk: Unconfined well with a low risk of upconing/landwards intrusion. Proposed Conditions: Monthly water level measurement at the well Monthly water usage measurements at the well Biannual water quality measurements at the well Risk: Unconfined well with high risk of upconing Proposed Conditions: Weekly water level measurements at the well Weekly water usage measurements at the well Monthly water quality measurements at the well Risk: Confined aquifer well with a calculated drawdown at the coast that will lower the water level below 1.5m amsl. Proposed Conditions: Install a sentinel well at the coast Monthly water level measurements at sentinel well
Measure water quality if water level measurements indicate coastal pressures dropping below 1.5m amsl
Monthly water usage measurements Risk: Semi-confined aquifer with calculated drawdown at coast that will not significantly lower the water level Proposed Conditions No special saltwater related conditions
Environment Canterbury Unpublished Technical Report 35

Coastal aquifer saltwater intrusion assessment guidelines
36 Environment Canterbury Unpublished Technical Report

Coastal aquifer saltwater intrusion assessment guidelines
Appendix 4 Summary of existing groundwater takes in Canterbury with saltwater intrusion consent conditions CRC940557/8 Kaituna Valley This consent is for spray irrigation of an orchard and pasture in the vicinity of the brackish Lake Ellesmere. Consent conditions require that the abstraction cease whenever the standing water level in three specified trigger wells (M36/1421, M36/0727 and M36/1436) falls below a specified level and if conductivity of the water from the well is greater than 10 mS/m above the conductivity recorded during the preceding July. In addition the abstraction must cease if the water level in the same three trigger wells falls below a specified level to mitigate against potential well interference effects. Monitoring of these consents has indicated compliance. CRC010751 – New Zealand King Salmon Company, Southbridge The consent is for groundwater for salmon farming from three bores: M37/0130 (depth 46.5 metres), M37/0242 (depth: 19.6 metres) and M37/0131 (depth: 17.5 metres). Concern was held for saltwater intrusion due to the size of the proposed takes and proximity to the coast (350-400m). It was calculated that 1.4 metres of water above sea level would remain at the coast after allowing for lowest water level and drawdown due to the effects of the 3 wells pumping. The consent has conditions restricting the maximum rate of take and the daily volume that can be abstracted. A condition is attached allowing the applicant to apply to have the saltwater intrusion conditions removed. The monitoring conditions include: 1. A sample of water shall be taken from either bore M37/0242 or bore M37/0131 where
any water has been taken via that bore in the preceding calendar month, in accordance with the following schedule: (a) At least once every calendar month throughout the year. (b) All samples shall be analysed for conductivity. (c) The laboratory carrying out the analyses shall be accredited to a NZS/ISO/IEC
Guide 17025 or equivalent defined by an accreditation body recognised as operating to ISO/IEC Guide 58 for those analyses.
(d) The results of each analysis, and the date and time of sampling, along with the date and time the sample is sent to the laboratory, shall be provided to the Canterbury Regional Council within 10 working days of the receipt of the analytical result from the laboratory.
2. Whenever analysis of any sample of water taken from either bore M37/0242 or bore M37/0131 indicates conductivity exceeding 100 millisiemens per metre, the taking of water in terms of this consent from bores M37/0242 and M37/0131 shall cease, and shall not recommence until analysis of a sample of water taken from the bore from which the sample was taken where conductivity was measured above 100 millisiemens, indicates conductivity is less than 100 millisiemens per metre.
CRC011915 – Amberley Golf Club, Amberley Beach This consent is for golf course irrigation from 4 bores (depths: 75, 7.6, 7.6 and 0 metres) at a maximum rate of 23 L/s. Bore N34/0062 is situated less than 250 metres from the coastline. Moore (1995)2 described saltwater intrusion at the Amberley Golf Club ‘Saltwater intrusion is not considered an immediate threat to water quality in the area.’ This report did
2 Moore, CR, 1995, Groundwater quality in the shallow aquifer at Amberley Golf Course, North Canterbury,
Environment Canterbury unpublished report U94(19)
Environment Canterbury Unpublished Technical Report 37
Coastal aquifer saltwater intrusion assessment guidelines
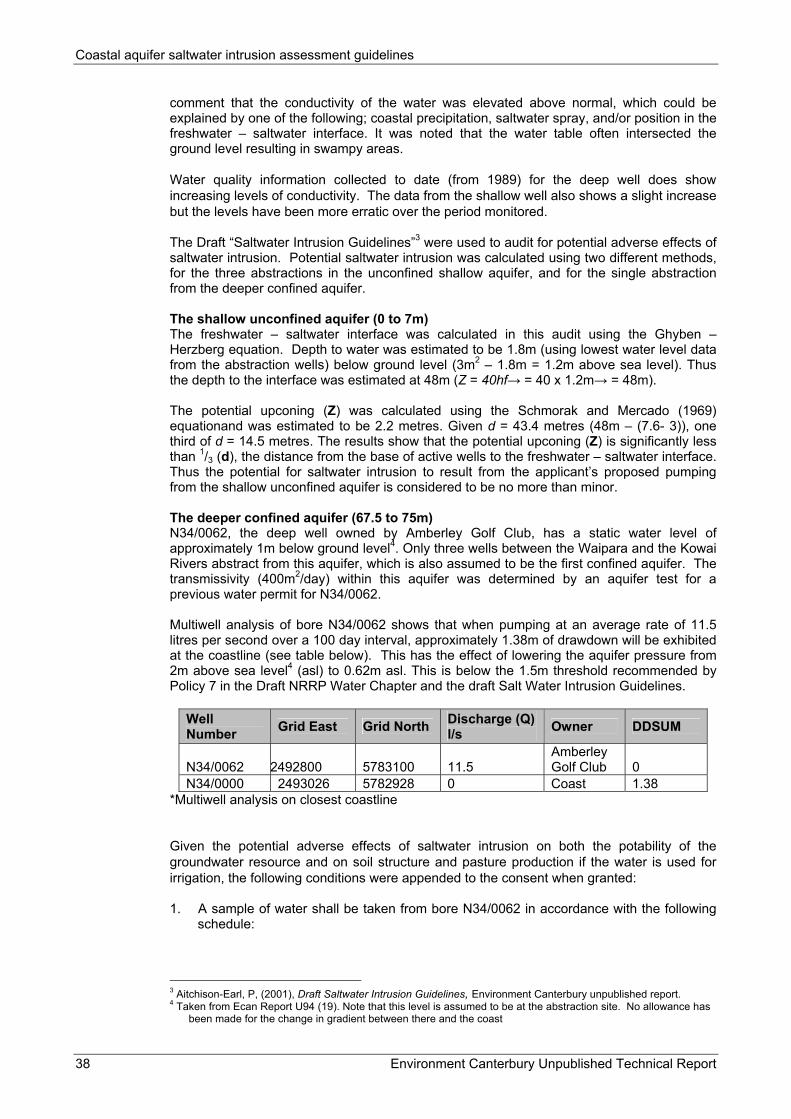
comment that the conductivity of the water was elevated above normal, which could be explained by one of the following; coastal precipitation, saltwater spray, and/or position in the freshwater – saltwater interface. It was noted that the water table often intersected the ground level resulting in swampy areas. Water quality information collected to date (from 1989) for the deep well does show increasing levels of conductivity. The data from the shallow well also shows a slight increase but the levels have been more erratic over the period monitored. The Draft “Saltwater Intrusion Guidelines”3 were used to audit for potential adverse effects of saltwater intrusion. Potential saltwater intrusion was calculated using two different methods, for the three abstractions in the unconfined shallow aquifer, and for the single abstraction from the deeper confined aquifer. The shallow unconfined aquifer (0 to 7m) The freshwater – saltwater interface was calculated in this audit using the Ghyben – Herzberg equation. Depth to water was estimated to be 1.8m (using lowest water level data from the abstraction wells) below ground level (3m2 – 1.8m = 1.2m above sea level). Thus the depth to the interface was estimated at 48m (Z = 40hf→ = 40 x 1.2m→ = 48m). The potential upconing (Z) was calculated using the Schmorak and Mercado (1969) equationand was estimated to be 2.2 metres. Given d = 43.4 metres (48m – (7.6- 3)), one third of d = 14.5 metres. The results show that the potential upconing (Z) is significantly less than 1/3 (d), the distance from the base of active wells to the freshwater – saltwater interface. Thus the potential for saltwater intrusion to result from the applicant’s proposed pumping from the shallow unconfined aquifer is considered to be no more than minor. The deeper confined aquifer (67.5 to 75m) N34/0062, the deep well owned by Amberley Golf Club, has a static water level of approximately 1m below ground level4. Only three wells between the Waipara and the Kowai Rivers abstract from this aquifer, which is also assumed to be the first confined aquifer. The transmissivity (400m2/day) within this aquifer was determined by an aquifer test for a previous water permit for N34/0062. Multiwell analysis of bore N34/0062 shows that when pumping at an average rate of 11.5 litres per second over a 100 day interval, approximately 1.38m of drawdown will be exhibited at the coastline (see table below). This has the effect of lowering the aquifer pressure from 2m above sea level4 (asl) to 0.62m asl. This is below the 1.5m threshold recommended by Policy 7 in the Draft NRRP Water Chapter and the draft Salt Water Intrusion Guidelines.
Well Number Grid East Grid North Discharge (Q)
l/s Owner DDSUM
N34/0062 2492800 5783100 11.5 Amberley Golf Club 0
N34/0000 2493026 5782928 0 Coast 1.38 *Multiwell analysis on closest coastline Given the potential adverse effects of saltwater intrusion on both the potability of the groundwater resource and on soil structure and pasture production if the water is used for irrigation, the following conditions were appended to the consent when granted: 1. A sample of water shall be taken from bore N34/0062 in accordance with the following
schedule:
3 Aitchison-Earl, P, (2001), Draft Saltwater Intrusion Guidelines, Environment Canterbury unpublished report. 4 Taken from Ecan Report U94 (19). Note that this level is assumed to be at the abstraction site. No allowance has
been made for the change in gradient between there and the coast
38 Environment Canterbury Unpublished Technical Report

Coastal aquifer saltwater intrusion assessment guidelines
(a) once a month during the period commencing on the last week in September and
ending the last week of April, except no sample need be taken where no water has been taken from the bore during the preceding month.
(b) All samples shall be analysed for conductivity. (c) The laboratory carrying out the analyses shall be accredited to a NZS/ISO/IEC
Guide 17025 or equivalent defined by an accreditation body recognised as operating to ISO/IEC Guide 58 for those analyses.
(d) The results of each analysis, and the date and time of sampling, along wit the date and time the sample is sent to the laboratory, shall be provided to the Canterbury Regional Council within 10 working days of the receipt of the analytical result from the laboratory.
2. Whenever analysis of any sample of water taken from bore N34/0062 indicates conductivity exceeding 100 millisiemens per metre, the taking of water in terms of this consent from the bore shall cease, and shall not recommence until analysis of a sample of water taken from the bore indicates conductivity is less than 100 millisiemens per metre.
3. The pumping water level, related to mean sea level datum, in bore N34/0062 shall be measured and recorded monthly in a lag kept for that purpose, except no measurement need be taken where no water has been taken from the bore during the preceding month. A copy of the records shall be provided before 31 may each year to the Canterbury Regional Council.
CRC012590 Makikihi This irrigation consent is for well J40/0042 (6.78m deep), 460m from the coast at Makikihi. The well has monthly water quality measurements as part of an ECan sampling programme, that indicated significantly increased chloride and conductivity levels in the summer months of some years. The landowner had noticed that the problem began occurring in the drought years of the last 1990’s when pumping was sustained for much longer periods than in the past. Water quality measurements quickly return to normal levels over the winter months. This is a classic case of upconing in an unconfined aquifer, which should be able to be managed though avoiding overpumping. There is a very strong correlation between conductivity levels and concentration of both chloride and sodium (R2 = 0.9944 & 0.9985 respectively) in the water sampled from the well. It was recommended that in order to establish some sort of relationship between the chloride levels and pumpage, it would be prudent to collect accurate usage data (preferably from an installed water meter) in conjunction with regular monitoring of the chloride/conductivity, and static water levels. The highest recorded level of conductivity of the irrigation water pumped from well J40/0042 to date has been 660 mS/m or 6.6 dS/m. To determine if long term sustained application of irrigation water with this level of salinity is likely to result in detrimental effects on soil structure and pasture production, the ANZECC guidelines for determining the average root zone salinity (ECse) have been used. The average root zone salinity (ECse) can be estimated using the equation ECse = ECi / 2.2 x LF Assuming an average root zone Leaching Fraction (LF) for loam of 0.33, and the electrical conductivity of irrigation water (ECi) of 6.6 dS/m, the ECse will be approximately 9.1 dS/m. This level falls within the range 7.7 – 12.2 dS/m, which is considered a very high water or soil salinity rating. Only very tolerant crops could be grown in this. The Guidelines indicate that white clover, a major species in New Zealand pasture, if grown in a loam soil, can tolerate an ECi of 1.4 dS/m, and has ECse threshold of 1 dS/m. In order to address both of these potential adverse effects, a groundwater conductivity trigger level of 100mS/m was set. This level corresponds to a chloride and sodium
Environment Canterbury Unpublished Technical Report 39

Coastal aquifer saltwater intrusion assessment guidelines
concentration of 273 and 116 mg/L respectively (based on the regression curves from water test results for the applicant’s well). This corresponds to a slightly higher than recommended chloride level in the NZ Drinking Water Guidelines (GV = 250 mg/L), with the sodium concentration being only half of the recommended concentration (GV for sodium = 200 mg/L). The trigger level of 100 mS/m also corresponds to an ECse of 1.4 dS/m, which falls within the range 0.95 – 1.9 dS/m considered a low soil salinity rating by the ANZECC Guidelines and the threshold for white clover on loam soils. In addition, a conductivity reading of 100 mS/m is clearly above the general background levels of 10 – 55 mS/m and provides a good indication that the well is beginning to draw saline groundwater. The applicant has conditions restricting maximum rate at which water can be abstracted. The applicant must install a water meter within 3 months of the commencement o f the consent and must measure the rate and volume of water abstracted within 10% accuracy once per month. The applicant has a condition allowing them to apply to have the saltwater intrusion monitoring conditions removed. The saltwater monitoring conditions include: 1. (a) A sample of water shall be taken from bore X once every 14 days during the period
commencing on any of the last seven days in September and ending on any of the last seven working days of April each year.
(b) All samples shall be analysed for conductivity. (c) The laboratory carrying out the analyses shall be accredited to a NZS/ISO/IEC Guide
17025 or equivalent defined by an accreditation body recognised as operating to ISO/IEC Guide 58 for those analyses.
(d) The results of this analysis, and the date and time of sampling, shall be provided to the Canterbury Regional Council within 10 working days of the receipt of the analytical result from the laboratory.
2. Whenever analysis of any sample of water taken from bore X indicates conductivity
exceeding 100 millisiemens per metre, the taking of water in terms of this consent from the bore shall cease, and shall not recommence until analysis of a sample of water taken from the bore indicates conductivity is less than 100 millisiemens per metres.
CRC012749 – Makikihi The applicant’s bore is screened below sea level at 50 – 58 metre below ground level and the bore is approximately 2,000 metres from the coast. A drawdown estimate of 2m at the coast was made using the Theis equation. Concern was raised because water quality monitoring carried out by Environment Canterbury over the last three – four years in the area between the applicants’ well and the coast has shown that there are a number of shallow wells in the area that have had elevated levels of conductivity, as well as elevated concentrations of chloride and sodium recorded. These elevated levels tend to occur in low recharge years and following sustained pumping in the summer period. The wells with these recordings are located between 1,000 – 1,500 metres east of the applicants’ well. The applicant indicated that he had a water quality test carried out on a sample of the water from the well and he provided these test results as further information. The test results show that the conductivity was 136 µS/cm (13.6 mS/m), while the chloride concentration was 9.9 g/m3. These levels are similar to other recordings for wells J40/0314 (depth: 42 metres) and J40/0085 (depth: 69.5 metres), which have conductivity levels ranging between 23 – 32 mS/m, and chloride concentrations ranging between 22 – 40 g/m3. Based on this information, water abstracted from the applicant’s well appears to have normal concentrations of chloride at present. The applicant has conditions restricting the maximum rate of take. The applicant must install within 12 months of the commencement of the consent a water flow measurement device
40 Environment Canterbury Unpublished Technical Report
Coastal aquifer saltwater intrusion assessment guidelines
that will measure the rate at which water is taken to within an accuracy of 10%. The applicant must also record the rate and volume at which water is abstracted to within an accuracy of 10%. A condition is attached allowing the applicant to apply to remove the saltwater intrusions monitoring conditions. The saltwater intrusion monitoring conditions are as follows: 1. (a) A sample of water shall be taken from bore X within the last seven days in
September and within the last seven working days of April each year. (b) All samples shall be analysed for conductivity. (c) The laboratory carrying out the analyses shall be accredited to a NZS/ISO/IEC
Guide 17025 or equivalent defined by an accreditation body recognised as operating to ISO/IEC Guide 58 for those analyses.
(d) Each year, before the last working day of June, the results of the analyses of any of the samples collected in the preceding ten months shall be provided to the Canterbury Regional Council.
CRC020261 – Birdlings Flat This consent is for irrigation of pasture and draws on well M36/6816 (89m deep, 900m from the brackish Lake Forsyth and 1800m from the sea). The applicant indicated in his assessment of environmental effects that there will be no adverse effect from saltwater intrusion, as the well has been test pumped and is located over one kilometre from the sea. Given the well location, relative to both Lake Forsyth and the sea, there was considered to be some potential for saltwater contamination. This was originally discussed with the applicant, who then indicated a water sample from the well had been tested. The results indicate a conductivity of 154 mS/m, and a chloride concentration of 499 mg/L. These levels are considered high, and indicative of some saltwater contamination. There are a number of factors that indicated potential for saltwater intrusion to occur as a result of pumping from the applicant’s well. These factors include:- • there is no indication for a separate aquifer as water levels did not vary much as the well
was drilled deeper (owner’s own observations); • the main water body in the valley is Lake Forsyth, with brackish water of between 2000 –
4000 mg/L chloride concentration. It is possible that there is fresh water floating on salty water layers, and that over time, saltwater from Lake Forsyth could eventually be the main recharge source for the applicant’s well. The only water quality monitoring data available relates to two wells, M37/0094 (depth: 15.2 metres) and M37/0103 (depth: 15 metres). There are only two readings, taken in 1974 and 1989 respectively. These were 80 and 530 g/m3 chloride concentration respectively. The conductivity was only available for well M37/0103, and was 198 mS/m when the chloride concentration was 530 g/m3. This is considered insufficient information on from which to determine ambient chloride concentrations or conductivity levels. The New Zealand Drinking Water Standards set a level of 250 mg/L for chloride and 200 mg/L for sodium as the level when the water will be affected aesthetically for taste and odour for drinking water purposes. Given the water sample test result indicates the chloride concentration is 499 mg/L, this is already in excess of the Guidelines. Thus the existing water quality is already unlikely to be suitable for potable use. There are a number of areas on the Banks Peninsula where this has been found to be the case. For example, on-going investigations to identify a reliable potable water source for Akaroa, have included drilling deep wells in the vicinity of the township. However, none have proved suitable, and this is due to the fact that the water has tested high for conductivity and has elevated chloride concentrations.
Environment Canterbury Unpublished Technical Report 41

Coastal aquifer saltwater intrusion assessment guidelines
Thus the water is already not suitable for potable use. Given this fact, the proposal is not considered likely to have any further significant effect on water quality for potable use, and no mitigation is specifically required. The ANZECC Water Quality Guidelines for Fresh and Marine Water5 state that salinity (presence of soluble salts in or on soils) and sodicity (presence of a high proportion of sodium ions relative to other cations in soil or water) of irrigation water can result in reduced plant productivity and degradation of soil properties. This is because the soil becomes more dispersible and erodible. However the effects of irrigation water salinity and sodicity on land under irrigation depend on a variety of interactive factors including irrigation water quality, soil properties, plant salt tolerance, climate, landscape (including geological and hydrological features), as well as water and soil management. The only recorded level of conductivity of the irrigation water pumped from well M36/6816 to date has been 154 mS/m or 1.5 dS/m. To determine if long term sustained application of irrigation water, with this level of salinity, is likely to result in detrimental effects to soil structure and pasture production, the ANZECC guidelines for determining the average root zone salinity (ECse) have been referred to. The Guidelines indicate that average root zone salinity (ECse) can be estimated using the equation
ECse = ECi / 2.2 x LF Assuming an average root zone Leaching Fraction (LF) for sandy loam of 0.4, and the electrical conductivity of irrigation water (ECi) of 1.5 dS/m, the ECse will be approximately 1.8 dS/m. This level falls within the range 0.95 – 1.9 dS/m, which is considered a low water or soil salinity rating. This is a moderately sensitive range, and is within the range tolerated by white clover for sandy to loamy soils (1.4 – 2.5 dS/m). The applicant is intending to irrigate pasture for sheep and beef grazing predominantly, and has been advised to select salt tolerant pasture species by an environmental consultant. It is likely that he will establish some of the area in lucerne, which is more tolerant of saline conditions. The soil type is Taumutu very gravely sandy loam, and as such can tolerate a higher level of irrigation water salinity than a clay loam soil type. This is because soils with higher clay content have a higher cation exchange potential, and are therefore more sensitive to cation displacement that causes the soil structure to degrade. The Sodium Adsorption Ratio (SAR) for the irrigation water has been estimated as 9.5, using the water sample analysis data supplied by the applicant and the ANZECC guidelines. Given the relationship between the electrical conductivity and SAR of the irrigation water (depicted in the Guidelines in Figure 4.2.2), the likelihood of soil structural problems will depend on soil properties and rainfall. An SAR/ECi relationship estimated in this instance is not predicted to result directly in soil structural problems. However, if the electrical conductivity of the water was to increase over time, there is the potential for soil structural problems to occur. The rate of take and the volume of water abstracted during an 11 day return period has been restricted. The applicant, within 3 months of the commencement of the consent, must install a water flow measurement device that will measure the rate at which water is taken to within an accuracy of 10%. The rate and volume of water taken shall also be measured to within an accuracy of 10% and recorded monthly. A condition is attached allowing the applicant to
5 Australia and New Zealand Environment and Conservation Council
42 Environment Canterbury Unpublished Technical Report

Coastal aquifer saltwater intrusion assessment guidelines
apply to remove the saltwater monitoring conditions from consent. The saltwater intrusion monitoring conditions include: 1. (a) A sample of water shall be taken from bore X every 33 days during the period
commencing on any of the last seven working days in September and ending on any of the last seven working days in April each year.
(b) All samples shall be analysed for conductivity. (c) The laboratory carrying out the analyses shall be accredited to a NZS/ISO/IEC
Guide 17025 or equivalent defined by an accreditation body recognised as operating to ISO/IEC Guide 58 for those analyses.
(d) The results of each analysis, and the date and time of sampling shall be provided to the Canterbury Regional Council within 10 working days of the receipt of the analytical results.
2. Whenever analysis of any sample of water taken from bore X indicates that conductivity exceeds 300 millisiemens per metre, the taking of water in terms of this consent from the bore shall cease, and shall not recommence until analysis of a sample of water taken from the bore indicates conductivity is less than 300 millisiemens per metre.
CRC020461 – Dorie (Ashburton – Rakaia Plains) This consent has a high abstraction rate (96 L/s) and the proximity of the bore to the coast (839 metres). The bore (L37/0976, depth: 70.5 metres) is located in the first confined aquifer in the area. An audit was undertaken where water level at the coast was calculated after allowing for lowest water level and drawdown at the coast due to the applicant pumping. This concluded that the water level at the coast would drop below 1.5m amsl. The applicant was asked to provide further information on the potential adverse effect. The applicant employed a consultant who: • Reviewed existing depth to groundwater information in the Dorie area and discussed
amending the lowest water level measurements for tidal influences. • Commented that “Cumulative abstractions of water at rates of up to 765 L/s within a
radius of 2.5 km from monitoring bore result in a recorded drawdown of up to 2 metres”. The consultant concluded that the effect at the coast of pumping bore L37/0976, either by itself or combined with other abstractions will still retain the piezometric level within the aquifer in excess of 1.5 metres above sea level.
Environment Canterbury staff concluded that a reasonable case had been made to exclude the consent from saltwater intrusion restrictions. CRC021423 –Kaikoura (2.5km south of Kowhai River) The applicant’s bore is approximately 230 metres from the coast, situated approximately 10 metres above mean sea level. The application falls into the ‘high risk’ category due to its high pump rate, low transmissivity, small distance between coast and well, deep well, and nearby wells used for public water supply. The depth of the interface between fresh and salt water using the Ghyben-Herzberg formula
was calculated as z = 36m, where the top of the applicant’s bore is assumed to be 10 metres above sea level and the lowest water level in the area is assumed to be 9.1 mbgl. It must be noted that the height of the applicant’s well above sea level has been assumed. Even small changes in this figure can have a large effect on z and d. The risk of upconing was assessed using Schmorak and Mercado (1969) where: • Q = 2707m3/day • K = 9 (based on a T value of 272 and an aquifer thickness of 30 metres) • ρs = 1.025 • ρf = 1 • d = 23.8 (using the assumption made for the Ghyben-Herzberg formual2)
Environment Canterbury Unpublished Technical Report 43

Coastal aquifer saltwater intrusion assessment guidelines
Therefore, z = 50 metres From the calculations made it can be seen that z is more than double d. The applicant accepted saltwater intrusion monitoring conditions which include: 1. A sample of water shall be taken from bore O31/0331, in accordance with the following
schedule: (a) During the first two years after the first exercise of this consent, every 14 days during the
period commencing on the last week in September and ending the last week in April, and
(b) Thereafter, once a month during the period commencing on the last week in September and ending the last week or April.
(c) All samples shall be analysed for conductivity. (d) The laboratory carrying out the analyses shall be accredited to a NZS/ISO/IEC Guide
17025 or equivalent defined by an accreditation body recognised as operating to ISO/IEC Guide 58 for those analyses.
(e) The results of each analysis, and the date and time of sampling, along with the date and time the sample is sent to the laboratory, shall be provided to the Canterbury Regional Council within 10 working days of the receipt of the analytical result from the laboratory.
2. Whenever analysis of any sample of water taken from bore O31/0331 indicates conductivity exceeding 100 millisiemens per metre, the taking of water in terms of this consent from the bore shall cease, and shall not recommence until analysis of a sample of water taken from the bore indicates conductivity is less than 100 millisiemens per metre.
CRC010664.1 – Alach Holdings Ltd, Doyleston This consent was for a change of conditions to an existing consent. The applicant proposed to deepen a shallow well, to avoid a minimum flow restriction on Doyleston Drain. As the well as 1300m from the coast, the issue of saltwater intrusion was raised. The applicants consultant conducted a drawdown assessment at the coast, that indicated artesian pressures would be around 6m AMSL when the applicants bore was pumping, but the cumulative effect of all users within 2000m of the coast was to lower the artesian pressure to below the 1.5m AMSL guideline in the NRRP. However the potential for contamination was considered low due to the lack of historical contamination, and the strong positive artesian pressures in the area. The following condition was attached to the revised consent: (a) A Sample of water shall be taken from bore M36/2634 once every month during the
period commencing on any of the last seven days in September and ending on any of the last seven working days of April each year whenever irrigation has taken place during the preceding month.
(b) All samples shall be analysed for conductivity (c) A single water sample taken from bore M36/2634, during the time period specified in
condition 6(a), shall be analysed for the following: Calcium, magnesium, Sodium, Potassium, Iron, Manganese, Sulphate, Chloride, Bicarbonate, Nitrate-Nitrogen, Ammoniacal-Nitrogen.
(d) The laboratory carrying out the analyses shall be accredited to a NZS/IOS/IEC Guide 17025 or equivalent defined by an accreditation body recognised as operating to IOS/IEC Guide 58 for those analyses.
(e) The results of each analyses, and the date and time of sampling, shall be provided to the Canterbury Regional Council within 10 workings days of the receipt of the analytical result from the laboratory.
CRC031115 – Middlemiss, Lower Waihao The applicants bore was located 950m from the coast, taking from a shallow unconfined aquifer. Existing one-off conductivity measurements from the bore and a nearby domestic well were elevated at above 50 mS/m, which indicated potential contamination (although not necessarily salt-water induced). The applicants consultant acknowledged the potential for saltwater contamination, and proposed the following monitoring condition: (4) (a) Samples of water shall be taken from bore J40/0188, in accordance with the following
schedule: During the first two years after the first exercise of this consent, once
44 Environment Canterbury Unpublished Technical Report

Coastal aquifer saltwater intrusion assessment guidelines
every month during the period commencing the last week in September and ending the last week in April, and All samples shall be analysed for conductivity. The laboratory carrying out the analyses shall be accredited to a NZS/ISO/IEC Guide 17025 or equivalent defined by an accreditation body recognised as operating to ISO/IEC. Guide 58 for those analyses. The results of each analysis, and the date and time of sampling, along with the date and time the samples sent to the laboratory, shall be provided to the Canterbury Regional Council within 10 working days of the receipt of the analytical result from the laboratory.(b) Whenever analysis of any sample of water taken from bore J40/0188 indicates conductivity exceeding 100 millisiemens per metre, the taking of water in terms of this consent from the bore shall cease, and shall not recommence until analysis of a sample of water taken from the bore indicates conductivity is less than 100 millisiemens per metre.(c) The standing water level, related to mean sea level datum, in the bore specified in this consent shall be measured and recorded monthly in a log kept for that purpose and a copy of the records provided before 31 May each year to the Canterbury Regional Council.(d) The taking of water in terms of this permit shall cease for a period of at least 24hours prior to recording the standing water level as required in condition (4).(e) The consent holder may apply, once a year, on any working day during January, to the Canterbury Regional Council, under Section 127(1) of the Resource Management Act 1991, to change or cancel conditions (4)(a), (b), (c),(d) and (e) of the consent.
CRC040053 – Ashbourne Farm Limited – Lower Otaio Valley The applicants 138m deep bore is located 500m from the coast, hence an assessment of saltwater intrusion effects was requested. There was uncertainty in the bore-head elevation, and therefore of the height of water above sea level, making any drawdown assessment upon the coast difficult. The applicant acknowledged the potential for saltwater intrusion, and proposed conductivity monitoring on a monthly basis, and surveying of the bore head elevation. As part of this consent the option of using a conductivity meter rather than the more expensive monthly water samples previously required was raised. It was agreed by ECan staff that 3-4 tests would be carried out over the irrigation season until the applicant established how much drift occurred in the conductivity meter. The applicant also requested the provision for a reduction in monitoring if results indicated little problem. The following conditions were included in the consent granted: (9) The conductivity of water abstracted from the bore(s) specified in this permit shall be
measured, using a calibrated measuring device, and recorded monthly in a log kept for that purpose and a copy of the records provided before 31 May each year to the Canterbury Regional Council. The consent holder shall ensure that a suitably qualified person carries out the measurements.
(10) The consent holder may apply, once a year, on any working day during June or
November, to the Canterbury Regional Council, under Section 127(1) of the Resource Management Act 1991, to change or cancel conditions (8) and/or (9) of this consent.
and a standard monthly water level monitoring condition CRC951480.1 – Houston, Lower Orari The consent application was for a change on conditions for an existing consent, with the installation of a new bore, but no change in rate. Saltwater contamination effects had not been considered in the original application, but were considered in the change of conditions. The well is located around 1200m from the coast. The potential for saltwater contamination had already been highlighted in the initial stages of CRC011012 (originally proposed to abstract from a shallow well, around 600m north of the applicant). Analysis of the proposed activity using these guidelines in draft format indicated that whether the aquifer was considered as confined or unconfined, the potential for intrusion could not be ruled out. The
Environment Canterbury Unpublished Technical Report 45

Coastal aquifer saltwater intrusion assessment guidelines
applicant therefore proposed to mitigate by the: monthly measuring of water levels; monitoring of water use; and biannual conductivity samples, with the option to change the conditions if monitoring results did not indicate any adverse effect. The IO proposed the monitoring of conductivity to be monthly, and the following condition was appended to the consent: (6) The conductivity of water abstracted from the bore K38/1272 shall be measured,
using a calibrated measuring device, twice per year, once within five days of commencement of the irrigation season for bore K38/1272 and the other in April of each year. Measurements shall be recorded in a log kept for that purpose and a copy of the records provided before 31 May each year to the Canterbury Regional Council The consent holder shall ensure that a suitably qualified person carries out the measurements.
CRC022024- Quinns Farming Co Ltd, Makikihi This consent involved a 48.5m deep 613m from the coast a Makikihi, an area known to have existing saltwater contamination issues (refer to consent above CRC012590). The applicant acknowledged the take would be a ‘high risk’ consent with regards to saltwater intrusion and proposed mitigation of setting a trigger level of 100sS/m conductivity (as in CRC012590), with the provision to cease sampling or change the trigger is monitoring indicated no adverse effects. The following conditions were attached to the consent: (2) A sample of water shall be taken from bore J40/0003, in accordance with the
following schedule:(a) During the first two years after the first exercise of this consent, once every month during the period commencing the last week in September and ending the last week in April, and(b) All samples shall be analysed for conductivity.(c) The laboratory carrying out the analyses shall be accredited to a NZS/ISO/IEC Guide 17025 or equivalent defined by an accreditation body recognised as operating to ISO/IEC Guide 58 for those analyses.(d) The results of each analysis, and the date and time of sampling, along with the date and time the sample is sent to the laboratory, shall be provided to the Canterbury Regional Council within 10 working days of the receipt of the analytical result from the laboratory.
(3) Whenever analysis of any sample of water taken from bore J40/0003 indicates
conductivity exceeding 100 millisiemens per metre, the taking of water in terms of this consent from the bore shall cease, and shall not recommence until analysis of a sample of water taken from the bore indicates conductivity is less than 100 millisiemens per metre.
along with a standard measurement of monthly water levels condition.
46 Environment Canterbury Unpublished Technical Report