STRAX AB - Cision · STRAX AB INTERIM REPORT JANUARY - JUNE 2019 3 LICENSED BRANDS culture design...
15
Q2 2019
Transcript of STRAX AB - Cision · STRAX AB INTERIM REPORT JANUARY - JUNE 2019 3 LICENSED BRANDS culture design...

ST
RA
X A
B A
NN
UA
L R
EP
OR
T 2
017
Q2 2019

STRAX AB INTERIM REPORT JANUARY - JUNE 2019 1
STRAX Q2 2019 driven by Urbanista and cost reductions implemented in 2018 The Group’s sales for the period January 1 – June 30, 2019, amounted to MEUR 44.6
(45.8), corresponding to a decrease of 2.6 percent, with a gross margin of 24.6 (32.5) percent.
The Group’s result for the period January 1 – June 30, 2019, amounted to MEUR -3.2 (-0.9) corresponding to EUR -0,02 (0.00) per share. Equity as of June 30 2019 amounted to MEUR 18.3 (20.9) corresponding to EUR 0.17 (0.18) per share.
EBITDA for the period January 1 – June 30, 2019, amounted to MEUR 2.1 (2.6).
Year over year reduction in OPEX amounts to MEUR 3.2 for H1 2019 as a result of cost
reductions implemented in 2018, corresponding to approximately 25 percent, and tracking towards MEUR 7-8 reduction in 2019.
Sales and gross margins declined in H1 2019 following the sale of Gear4, as expected.
STRAX does not expect sales to materially decline in 2019 despite the sale of Gear4 and gross margin is expected to remain stable or improve in 2019.
The positive development of Urbanista continued in Q2 2019 with YoY growth of 80%,
creating valuable asset for STRAX.
During the first six months interest-bearing debts decreased by MEUR 12 as a result of repayment of loans and lower utilization of working capital lines.
With the effective date of April 1, 2019, STRAX acquired all outstanding shares in
Brandvault, a business focused on sales through e-commerce marketplaces globally.
”I’m pleased with our Q2 2019 performance in a challenging external environment. Most of our geographic markets held up in terms of sales, whilst the strong development for Urbanista with 80% YoY quarterly sales growth increased its significance of sales and profitability for the group. Our aggressive OPEX reduction in 2018 also contributed to profitability during the quarter and we are on track to deliver the previously communicated MEUR 7-8 in cost savings this year”.
Gudmundur Palmason, CEO
This information is information that STRAX AB is obliged to make public pursuant to the EU Market Abuse Regulation and the Securities Markets Act. The information was submitted for publication, through the agency of the contact person set out above, at 08:55 CEST on August 28, 2019.

STRAX AB INTERIM REPORT JANUARY - JUNE 2019 2
WE INNOVATE, WE CREATE, WE INSPIRE, WE DELIVER.
STRAX is a market-leading global company specializing in mobile accessories. STRAX has built a House of Brands to complement its value-added customer-specific solutions and services. STRAX House of Brands includes proprietary brands: XQISIT, Urbanista, THOR and Clckr and licensed brands: adidas and bugatti. In addition, STRAX represents over 40 major mobile accessory brands. STRAX sells into all key channels ranging from telecom operators, mass merchants and consumer electronics to lifestyle retailers and direct to consumers online. STRAX was founded in Miami and Hong Kong in 1995 and has since grown across the world. Today, STRAX has over 190 employees in 13 countries with its operational HQ and logistics center based in Germany. STRAX is listed on the Nasdaq Stockholm Stock Exchange. PROPRIETARY BRANDS
INNOVATIVE PROTECTION, AUDIO, POWER & CHARGING SOLUTIONS With an extensive product portfolio ranging from protection to audio and power, XQISIT brings mid-priced innovative, quality design and functionality to value-conscious consumers.
PREMIUM STRENGHT GLASS SCREEN PROTECTION DESIGNED FOR A SEAMLESS FIT Responding to the growing market demand for tempered glass protection, THOR is a higher quality, premium product, priding itself on being meticulously designed to fit any phone perfectly.
A UNIVERSAL PHONE GRIP AND STAND A patented universal and multi-functional phone grip that helps prevents users dropping their phone, enables better quality selfies and a more enhanced mobile video watching experience. A thin and stylish design, Clckr is easy to apply using 3M-adhesive which will not leave residue.
HIP AUDIO ACCESSORIES WITH SCANDINAVIAN DESIGN Based in Stockholm, Urbanista is a market leader in its region, combining avant-garde design with the latest in audio technology. The products are designed for a life in motion and built to inspire and endure.

STRAX AB INTERIM REPORT JANUARY - JUNE 2019 3
LICENSED BRANDS
STREET WEAR INSPIRED PROTECTION adidas Originals continues to evolve the brand’s legacy through its commitment to product innovation. Inspired by the creativity and courage found in sporting arenas, the adidas Originals smartphone cases combine contemporary youth culture design with resilient protection features.
FOR ACTIVE USE IN THE GYM AND OUTDOORS adidas Sports aims to set a new bar in the fast-growing market of tech accessories. The new collection of sports cases consists of a variety of flexible armbands, smart waist straps and highly protective anti-slip and anti-shock cases. The adidas Sports cases are carefully designed to protect smartphones during intense workouts or outdoor activities.
CHIC AND REFINED PROTECTION The bugatti brand aims to reflect the cultural and creative diversity of Europe. bugatti’s handmade smartphone cases are crafted from high-quality full grain leather and come in a range of timeless colors, epitomizing elegance and quality workmanship.

STRAX AB INTERIM REPORT JANUARY - JUNE 2019 4
COMMENTS FROM THE CEO ”I’m pleased with our Q2 2019 performance in a challenging external environment. Most of our geographic markets held up in terms of sales, whilst the strong development for Urbanista with 80% YoY quarterly sales growth increased its significance of sales and profitability for the group. Our aggressive OPEX reduction in 2018 also contributed to improved profitability during the quarter and we are on track to deliver the previously communicated MEUR 7-8 in cost savings this year.
During the second quarter 2019 sales decreased MEUR 1.6 over same period last year and are down 7% year-over-year (YoY). Sales in Q2 2019 were MEUR 22.0 (23.7) and EBITDA amounted to MEUR 0.7 (1.6). TTM sales growth stands at 3.3%, whilst TTM EBITDA is MEUR 6.5 and has decreased by 18%. Proprietary brands represented 50.1% (68.6%) of sales in the second quarter and given Urbanista’s growth trajectory we expect to reach prior year levels within 12-18 months. The impact of the Gear4 divestment is in line with our expectations and this past quarter we continued to realize impact related to our headcount and general cost reductions implemented last year.
The mobile accessories industry continues to be challenging with smartphone sales declining globally, where consumers are now holding onto their existing phones for 32-36 months because of incremental improvements in recently launched hero smartphones. We do believe that 5G adoption will reach mass consumers in the back-end of 2020 which could lead to one or even two smartphone upgrade “super” cycles with corresponding growth in mobile accessories sales. The state of our industry does not in itself alter our strategic framework, although it does increase our commitment to find a suitable joint venture partner for our European distribution business to achieve greater scale and generate synergies. Our 2016 strategic framework therefore continues to evolve around the five independent yet interlinked activities of: brand portfolio management through House of Brands proposition; eCommerce; focused geographic expansion; acquisitions; and operational excellence – all of which are aimed at delivering growth, profitability, shareholder value, happy employees and ultimately successful customers. We have a great team and I believe that our strategy coupled with sound execution will deliver strong shareholder value for years to come.
Urbanista has performed exceptionally well in in 2019 with 50% YoY sales growth, 80% in Q2, and where eCommerce sales have grown more than 400%. The brand has established itself in the Nordics and is now getting meaningful traction in several other markets. The Stockholm true wireless headset has been Urbanista’s most successful product launch to date and the portfolio roadmap is ambitious, well rounded and rationalized at the same time. We have had good initial success with Clckr, which is the first brand we launch out of S/X Innovations, our product and brand incubator entity. Clckr is a differentiated product that is protected by intellectual property with promising potential that could easily become one of our main proprietary brands within not too long.
Brandvault has now been fully integrated and as a result we’ve experienced eCommerce marketplace growth across all our brands. Brandvault has also signed several partner brands as their full global marketplace service provider. Our direct brand website business is also experiencing promising results, e.g. Urbanista.com and adidascases.com, and we are all very excited about our recently launched adidascases.com website. To ensure that we optimize the eCommerce channels we have established a centralized digital marketing team in Stockholm that will steer campaigns and marketing activities for all our proprietary and licensed brands throughout all global eCommerce marketplaces and direct brand websites to maximize the reach of our advertising and promotional spend.
These developments outlined above are integral components on our journey to future proof STRAX. Our plans and tactics are materializing, and we currently have good momentum in all our sales entities. The entire STRAX team is engaged and committed to work tirelessly to deliver strong returns for our shareholders. I feel good about our strategy, tactics and current positioning in the global mobile accessories industry and believe that our outlook is quite positive overall.”

STRAX AB INTERIM REPORT JANUARY - JUNE 2019 5 The Board of Directors and the CEO of Strax AB hereby summit the interim report for the period January 1 – June 30, 2019 All amounts are provided in EUR thousands unless otherwise stated. Figures in parentheses refer to the corresponding period the previous financial year. Information provided refers to the group and the parent company unless otherwise stated. Result and financial position January 1 – June 30, 2019
The Group’s net sales for the period January 1 – June 30, 2019 amounted to 44 560 (45 768). Gross profit amounted to 10 946 (14 881) and gross margin amounted to 24.6 (32.5) percent, decreasing as a result of product/brand mix and the sale of Gear4 in November 2018. Operating profit amounted to 756 (1 133). Result for the period amounted to -3 182 (-90). The result included gross profit 10 946 (14 881) selling expenses -6 881 (-9 160), administrative expenses -3 077 (-4 032), other operating expenses -3 422 (-2 740), other operating income 3 190 (2 184), net financial items -3 533 (-756) and tax 39 (-200). Financial expenses have been impacted by costs relating to prepayment penalties of loans to the amount of 252. Included in financial expenses are also changes in value relating to shares in ZAGG to be received as part of the consideration for the sale of Gear4 to the amount of MEUR -2.3. As of June 30, 2019 total assets amounted to 68 004 (81 804), of which equity totaled 18 284 (20 938), corresponding to equity/assets ratio of 25.6 (25.6) percent. Interest-bearing liabilities as of June 30, 2019, amounted to 17 008 (28 938). The group’s cash and cash equivalents amounted to 1 748 (3 846). During the first six months interest-bearing debt decreased by MEUR 12 as a result of repayment of loans and lower utilization of working capital lines. Significant events during the period In accordance with the resolved proposal by the EGM held on December 28, 2018, distribution of MEUR 12.8 to the shareholders was completed on January 30, 2019. With the effective date of April 1, 2019, STRAX increased its ownership in BrandVault Global Services Ltd from 10 percent to 100 percent. BrandVault is a business focused on sales through e-commerce market places globally.
Seasonal and phone launch fluctuations STRAX operations have defined fluctuations between seasons, whereby the strongest period is September-November. This means the greater part of the STRAX result is generated during the second half of the year provided the trends from the last five years continue. Timing and supply of hero smartphone launches, e.g. iPhone and Samsung Galaxy, also impacts STRAX results, with these being hard to predict and sometimes challenging to manage. Investments Investments during the period amounted to a total of 1 158 (1 621), of which investments in intangible assets amounted to 788 (2), property, plant and equipment amounted to 370 (1 623) and investments in financial assets amounted to - (-). Divestment of non-current assets amounted to - (-). The parent company’s result for the period amounted to -1 (-1). The result included gross profit of 472 (499), administrative expenses -491 (-460) and net financial items -1 (-1). As of June 30, 2019 total assets amounted to 75 932 (77 540) of which equity totaled 62 978 (75 723). Cash and cash equivalents amounted to - (-).
Significant events after the end of the period Urbanista has established a very strong position in the important and fast growing True Wireless Headsets category with 20 percent of sold units in Sweden in June 2019 and that Urbanista has doubled the market share during the past twelve months in the UK, according to GfK. Urbanista´s growth in 2019 is at approximately 50 percent so far and increasing, whereby eCommerce growth is at 400%.

STRAX AB INTERIM REPORT JANUARY - JUNE 2019 6 Future development STRAX will play an active role in shaping the mobile accessories industry both offline and online in all of its targeted geographic markets. We will continue to execute against our strategic framework launched in 2016 while simultaneously strengthening the operational platform to enable us to carry out our House of Brands strategy through offline and online sales channels globally with fewer resources relatively. STRAX will retain market share in Western Europe while at the same time invest and grow at an accelerated rate in North America, Japan and strategic markets in ROW. STRAX will furthermore invest in the e-commerce sales channel in an effort to improve margins, diversify its traditional retail customer base and secure growth. STRAX has experienced positive development in sales in recent years. Having achieved headcount and annualized operating expense reduction of 25% in 2019 we expect our profitability to improve, whilst 2019 sales remain relatively flat as a result of the Gear4 divestment. We expect that our online sales will grow significantly albeit from a low base and to achieve 50% of our sales through e-commerce in 3-5 years. Currently the industry is undergoing consolidation, and STRAX intends to play an active role in the ongoing consolidation process through acquisitions, divestments and partnerships.
Risks and uncertainties Risk assessment, i.e. the identification and evaluation of the company’s risks is an annual process at STRAX. Risk assessment is done in the form of self-evaluation and also includes establishing action plans to mitigate identified risks. The primary risks present in STRAX business activities are commercial risk, operative risk, financial risk relating to outstanding receivables, obsolete inventory and currency risk. Other risks that impact the company’s financial operations are liquidity, interest rate and credit risk. The company is to some extent dependent on a key number of senior executives and other key personnel in order to run its operations, and is dependent on a functioning distribution chain, logistics and warehousing. For further information on risks and risk management, reference is made to the 2018 annual report.

STRAX AB INTERIM REPORT JANUARY - JUNE 2019 7
FINANCIAL CALENDAR: November 28, 2019 Interim Report January – September 2019
The report has been prepared in Swedish and translated into English. In the event of any discrepancies between the Swedish and English translation, the
former shall have precedence.
The undersigned declare that the interim report provides a true and fair overview of the parent company’s and the group’s operations, financial position, performance and result
and describes material risks and uncertainties facing the parent company and other companies in the group.
Stockholm, August 27, 2019
Bertil Villard Chairman
Anders Lönnqvist Gudmundur Palmason Director Director/CEO Ingvi T. Tomasson Pia Anderberg Director Director
This report has not been subject to an audit by the company auditor
For further information contact: Gudmundur Palmason (CEO) Johan Heijbel (CFO) Strax AB (publ) Mäster Samuelsgatan 10 111 44 Stockholm Sweden Corp.id: 556539-7709 Tel: +46 (0)8-545 017 50 [email protected] www.strax.com The Board is registered in Stockholm, Sweden.
STRAX AB INTERIM REPORT JANUARY - JUNE 2019 8
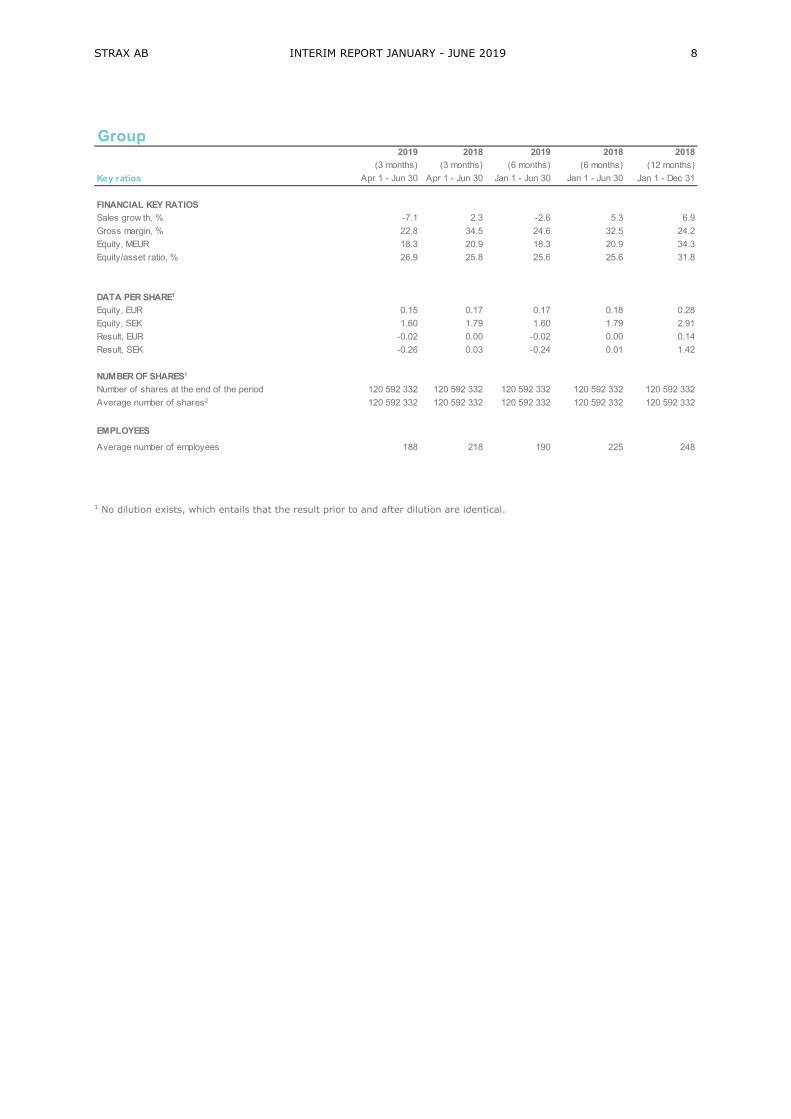
1 No dilution exists, which entails that the result prior to and after dilution are identical.
Group2019 2018 2019 2018 2018
(3 months) (3 months) (6 months) (6 months) (12 months)
Key ratios Apr 1 - Jun 30 Apr 1 - Jun 30 Jan 1 - Jun 30 Jan 1 - Jun 30 Jan 1 - Dec 31
FINANCIAL KEY RATIOS
Sales grow th, % -7.1 2.3 -2.6 5.3 6.9
Gross margin, % 22.8 34.5 24.6 32.5 24.2
Equity, MEUR 18.3 20.9 18.3 20.9 34.3
Equity/asset ratio, % 26.9 25.8 25.6 25.6 31.8
DATA PER SHARE1
Equity, EUR 0.15 0.17 0.17 0.18 0.28
Equity, SEK 1.60 1.79 1.60 1.79 2.91
Result, EUR -0.02 0.00 -0.02 0.00 0.14
Result, SEK -0.26 0.03 -0.24 0.01 1.42
NUMBER OF SHARES1
Number of shares at the end of the period 120 592 332 120 592 332 120 592 332 120 592 332 120 592 332
Average number of shares2 120 592 332 120 592 332 120 592 332 120 592 332 120 592 332
EMPLOYEES
Average number of employees 188 218 190 225 248

STRAX AB INTERIM REPORT JANUARY - JUNE 2019 9
(1) Depreciation and amortization for the period January 1 – June 30, 2019, amounted to 1 362 (1 455). (2) The result for the period, respectively the total comprehensive income is attributed to the parent company’s shareholders.
Group2019 2018 2019 2018 2018
(3 months) (3 months) (6 months) (6 months) (12 months)
Summary income statements, KEUR Apr 1 - Jun 30 Apr 1 - Jun 30 Jan 1 - Jun 30 Jan 1 - Jun 30 Jan 1- Dec 31
Net sales 22 011 23 705 44 560 45 768 106 967
Cost of goods sold -16 987 -15 532 -33 614 -30 886 -81 090
Gross profit 5 024 8 173 10 946 14 881 25 877
Selling expenses -3 678 -4 542 -6 881 -9 160 -20 875
Administrative expenses(1) -1 203 -2 533 -3 077 -4 032 -8 968
Other operating expenses -2 089 - 811 -3 422 -2 740 -2 388
Other operating income 1 751 362 3 190 2 184 4 216
Operating profit - 194 649 756 1 133 -2 139
Financial income 313 - 30 - 26 392
Financial expenses -2 905 - 475 -3 563 - 756 -2 317
Net financial items -2 590 - 475 -3 533 - 756 24 075
Profit before tax -2 786 378 -2 777 378 21 936
Tax - 175 - 65 39 - 200 -5 190
PROFIT OR LOSS FOR THE PERIOD(2) -2 960 313 -2 738 178 16 747
Result per share before dilution, EUR -0,02 0,00 -0,02 0,00 0,14
Result per share after dilution, EUR -0,02 0,00 -0,02 0,00 0,13
Average number of shares during the period 120 592 332 120 592 332 120 592 332 120 592 332 120 592 332
Average number of shares during the period after dilution 124 687 332 124 687 332 124 687 332 124 687 332 124 687 332
Result for the period -2 960 313 -2 738 178 16 747
Other comprehensive income, translation gains/losses on consolidation -444 -124 -444 -268 -3 510
Total comprehensive income for the period -3 404 189 -3 182 -90 13 237
Statement of comprehensive income, KEUR
Q2 2019 Q2 2018 Q2 2019 Q2 2018 Q2 2019 Q2 2018 Q2 2019 Q2 2018 Q2 2019 Q2 2018 Q2 2019 Q2 2018
Revenues 25 119 28 081 3 867 6 464 13 920 8 103 459 464 1 196 2 656 44 560 45 768
Cost of Sales -18 736 -19 406 -3 014 -2 544 -10 450 -6 252 - 435 - 446 - 980 -2 238 -33 614 -33 703
Gross Profit 6 383 8 674 853 3 920 3 470 1 851 24 18 216 418 10 946 12 064
Selling expenses -4 013 -6 453 - 536 - 881 -2 182 -1 478 - 15 - 14 - 135 - 334 -6 881 -9 160
General Administrative Expenses
-1 507 -2 666 - 201 - 363 - 820 - 608 - 6 - 6 - 51 - 138 -2 585 -3 780
Other Operating Expenses -2 272 -2 129 - 304 - 292 -1 235 - 490 - 9 - 5 - 77 - 111 -3 897 -3 027
Other Operating Income 1 861 3 548 249 -2 334 1 012 813 7 8 63 184 3 190 5 036
Operating profit 451 973 60 51 245 88 2 1 15 20 773 1 133
TotalProtection Power Audio Connected Devices Other

STRAX AB INTERIM REPORT JANUARY - JUNE 2019 10
Group2019 2018 2018
Summary balance sheets, KEUR Jun 30 Jun 30 Dec 31
ASSETS
NON-CURRENT ASSETS
Goodw ill 20 902 26 560 20 902
Other intangible assets 2 795 3 056 902
Property, Plant & Equipment 1 241 3 207 1 136
Other assets 350 315 1 532
Deferred tax assets 62 620 62
Total non-current assets 25 351 33 757 24 534
CURRENT ASSETS
Inventories 14 349 13 471 14 980
Tax receivables 1 405 963 1 244
Accounts receivable 15 224 22 963 28 423
Other assets 9 927 6 803 13 875
Cash and cash equivalents 1 748 3 846 24 845
Total current assets 42 653 48 047 83 366
TOTAL ASSETS 68 004 81 804 107 900
EQUITY AND LIABILITIES
Equity 18 284 20 938 34 265
NON-CURRENT LIABILITIES:
Tax liabilities 3 3 3
Other liabilities 3 027 605 616
Interest-bearing liabilities 1 881 9 967 8 403
Deferred tax liabilities 819 1 295 1 149
Total non-current liabilities 5 730 11 871 10 170
Current liabilities:
Provisions 939 1 272 1 742
Interest-bearing liabilities 15 127 18 971 20 652
Accounts payable 9 569 14 103 21 825
Tax liabilities 5 843 2 921 6 470
Other liabilities 12 510 11 729 12 775
Total current liabilities 43 990 48 996 63 464
Total liabilities 49 720 60 867 73 634
TOTAL EQUITY AND LIABILITIES 68 004 81 804 107 900
Summary of changes in equity, KEUR
Equity as of December 31, 2017 21 028
Total Comprehensive income Jan 1 - Jun 30, 2018 - 90
Equity as of June 30, 2018 20 938
Total Comprehensive income Jul 1 - Dec 31, 2018 13 327
Equity as of December 31, 2018 34 265
Distribution to shareholders -12 742
Cost related to distribution to shareholders - 57
Total Comprehensive income Jan 1 - Jun 30, 2019 -3 182
Equity as of June 30, 2019 18 284

STRAX AB INTERIM REPORT JANUARY - JUNE 2019 11
NOTE 1 REFERENCES Seasonal and phone launch fluctuations, see page 5 Reporting per business segment see page 9 For further information on accounting principles reference is made to the 2018 annual report For events after the end of the period see page 5
NOTE 2 ACCOUNTING PRINCIPLES As of the financial year 2017 the currency of the Parent Company is Euro (EUR), which is also the reporting currency of the parent company and the Group. STRAX prepares consolidated financial statements in accordance with International Financial Reporting Standards (IFRS) and with the restrictions which apply due to the Swedish national legislative when preparing the parent company’s financial statements. The Interim report for the group has been prepared in accordance with IAS 34 ”Interim Reporting” and applicable sections of the Annual Accounts Act. The section of the report applicable to the parent company has been prepared in accordance with Annual Accounts Act, Chapter 9.
Group2019 2018 2019 2018 2018
(3 months) (3 months) (6 months) (6 months) (12 months)
Summary cash flow statements, KEUR Apr 1 - Jun 30 Apr 1 - Jun 30 Jan 1 - Jun 30 Jan 1 - Jun 30 Jan 1 - Dec 31
OPERATING ACTIVITIES
Result before tax -2 786 174 -2 777 378 21 936
Paid taxes - 147 - 114 - 593 - 200 -1 055
Cash flow from operations prior to changes in working capital
- 216 956 400 1 633 - 64
Cash f low from changes in w orking capital:
Increase (-)/decrease (+) in inventories 337 - 223 632 -3 054 -7 121
Increase (-)/decrease (+) current receivables 3 162 - 300 10 170 2 546 -3 323
Increase (-)/decrease (+) in non current receivables 648 342 1 182 196 - 961
Increase (+)/decrease (-) current liabilities -1 561 - 10 - 57 - 10 1
Increase (+)/decrease (-) in current liabilities -1 455 1 244 -9 477 -3 500 8 604
Cash flow from operations 915 2 010 2 850 -2 188 -2 865
INVESTMENT ACTIVITIES
Investments in intangible assets - 787 2 - 788 2 1 356
Investments in tangible assets - 289 -1 517 - 370 -1 623 -2 178
Investments in subsidiaries - 317 - - -
Divestment of subsidiaries - - - - 23 137
Costs relating to sale of subsidiaries - - - - -1 588
Cash flow from investment activities -1 077 -1 198 -1 158 -1 621 20 727
FINANCING ACTIVITIES
Interest-bearing liabilities 1 419 173 -5 298 3 956 5 637
Amortization of interest-bearing liabilities - 795 - 513 -6 545 -1 263 -2 827
Distribution to the shareholders - - -12 742 - -
Paid interest and other expenses - - 288 - 204 - 458 -1 520
Cash flow from financing activities 624 - 628 -24 789 2 235 1 291
Cash flow for the period 461 183 -23 097 -1 575 19 152
Exchange rate differences in cash and cash equivalents - - 269 - - 268 3
Cash and cash equivalents at the beginning of the period 1 286 3 932 24 845 5 689 5 689
CASH AND CASH EQUIVALENTS AT THE END OF THE PERIOD 1 748 3 846 1 748 3 846 24 845
3 770 1 455 -20 946Adjustment for items not included in cash flow from operations or items not affecting cash f low
2 717 896

STRAX AB INTERIM REPORT JANUARY - JUNE 2019 12 The Group has previously carried out investment activities and was an investment company as defined in IFRS 10, with the effect all shares in subsidiaries and associated companies were reported at fair value through profit or loss, the same principle applied for other investments. Due to the reverse acquisition the group’s line of business is since the reverse acquisition in 2016 as an operational company meaning that participations in subsidiaries as well as affiliated companies are consolidated instead of recognized at fair value through profit or loss. The same accounting principles are applied as in the annual report for 2018, new standards IFRS 9 Financial instruments, IFRS 15 Revenue from contracts with customers have been implemented without material effects due to the fact the STRAX group have seen historically low default numbers in combination with the fact most of the accounts receivables have been secured with credit insurances. As of January 1, 2019, IFRS 16, Leasing, was implemented. The first time implementation had an impact on the balance sheet, increasing non-current assets by MEUR 2.2 with the corresponding increase in non-current liabilities. The initial effect has not impacted the cash flow statement. In the income statement a portion of the leasing expenses has been reclassified t interest expenses and the remaining part has been reclassified to depreciation. The impact on interest expenses for the period amounts to KEUR 10. In the cash flow for the period the reclassification of leasing expenses to depreciation has impacted the cash flow by KEUR 195. Accounting and valuation of shares and participations Shares and participations in subsidiaries and associated companies are in the parent company accounted for at acquisition cost with the fair value of the earlier holding in Strax at the time of acquisition comprised of fair value to the part to which it relates. NOTE 3 FAIR VALUE: FINANCIAL ASSETS AND LIABILITIES
Since the group’s interest-bearing liabilities consist of variable rate loans and the margin in the contracts are expected to be the same if the group should raise equivalent loans at the reporting date, the fair value of the loans is expected to be in all material respects equal to their carrying amount. The groups other financial assets and liabilities mainly comprises of receivables which are current assets and current liabilities. As the duration of these are short-term, the carrying amount and fair value are in all material respects equal. NOTE 4 FAIR VALUE: HIERARCHY The total sales proceeds emanating from the sale of Gear4 amounted to MEUR 33.7. An amount of MEUR 7.2 is held back as collateral for seller guarantees, whereof the contract states that MEUR 5.7 will be settled through payment of shares in ZAGG Inc. This receivable has to the part it will be settled in shares been valued at fair value through profit and loss (fair value hierarchy level 1) on the share price of the ZAGG share per the balance sheet date. STRAX has no other financial instruments recognized at fair value. DEFINITIONS
Key ratio Calculation What it measures or represents
Equity/Asset ratio Equity as a percentage of the total assets.This measure refelects the f inancial position and the long term solvency and resistance to periods of economic dow ntrun.
Equity per shareEquity in relation to the number of shares at the end of the period.
Measures development of equity in relation to number of outstanding shares at the end of the period, captures both changes in equity and changes in number of outstanding shares.
Number of shares at the end of the periodThe number of shares at the end of each period adjusted for bonus issue and share buy-back etc.
Calculation bases for all balance sheet per shares based key ratios.
Items affecting comparabilityItems affecting comparisons as they do not recur w ith the same regularity as other items.
Guidance of normalized EBITDA.
Gross prof it Sales less the cost of goods sold.Measures how w ell prices to customers in relation to cost of goods solad are maintained including costs to deliver sold goods.
Gross marginGross profit in relation to sales expressed as a percentage.
Gross profit in relation to Sales, eff icency measure presented in percentage.
Operating profit/lossOperating income minus operating costs for the specif ied period before f inancial items and taxes.
Meausures over all profitability from operations and ongoing business activities including depreciation and amortization.
EBITDA Operating profit/loss plus depreciations. Measures over all prof itability from operations and ongoing business activities including depreciation and amortization.
ADJUSTED EBITDAEBITDA adjusted for items affecting comparability and currency effects.
Measures over all prof itability from operations and ongoing business activities including depreciation and amortization, adjusted for items affecting comparability and currency effects.

STRAX AB INTERIM REPORT JANUARY - JUNE 2019 13
STRAX recognizes items affecting comparability separately to distinguish the performance of the underlying operations. Items affecting comparability refer to items that affect comparisons due to the fact they do not recur with the same regularity as other terms.
Group2019 2018 2019 2018 2018
(3 months) (3 months) (6 months) (6 months) (12 months)
Bridge to adjusted EBITDA, KEUR Apr 1 - Jun 30 Apr 1 - Jun 30 Jan 1 - Jun 30 Jan 1 - Jun 30 Jan 1 - Dec 31
EBITDA
Operating profit -194 649 756 1 133 -2 139
+ Depreciation & amortization 912 940 1 362 1 455 3 630
EBITDA 718 1 589 2 118 2 588 1 491
ADJUSTED EBITDA
EBITDA 718 1 589 2 119 2 588 1 491
+ Items affecting comparability - - - - 5 578
+ Currency effects -105 - 305 - 202 - 498 - 381
ADJUSTED EBITDA 613 1 284 1 917 2 090 6 687
Items affecting comparability
- One time charges ‐ ‐ - - 5 578
Total items affecting comparability - - - - 5 578

STRAX AB INTERIM REPORT JANUARY - JUNE 2019 14
Parent Company2019 2018 2019 2018 2018
(3 months) (3 months) (6 months) (6 months) (12 months)
Summary income statements, KEUR Apr 1 - Jun 30 Apr 1 - Jun 30 Jan 1 - Jun 30 Jan 1 - Jun 30 Jan 1 - Dec 31
INVESTMENT ACTIVITIES
Net Sales 472 288 472 499 1 208
Gross profit 472 288 472 499 1 208
Administrative expenses -491 -252 -491 -460 -1 192
Operating income -19 36 -19 39 16
Net f inancial items 18 -35 18 -40 55
Result after financial items -1 1 -1 -1 71
Current taxes - - - - -
RESULT FOR THE PERIOD -1 1 -1 -1 71
Statement of comprehensive income, KEUR
Result for the period -1 1 -1 -1 71
Other comprehensive income - - - - -
TOTAL COMPREHENSIVE INCOME FOR THE PERIOD -1 1 -1 -1 71
2019 2018 2018
Summary balance sheets, KEUR Jun 30 Jun 30 Dec 31
ASSETS
Non-current assets 130 129 130
Non-current f inancial assets 75 695 75 693 75 694
Total non-current assets 75 825 75 822 75 824
Shares and participations held for sale 1 4 3
Current receivables 106 1 714 1 857
Cash and bank balances - - 2
Total current assets 107 1 718 1 862
TOTAL ASSETS 75 932 77 540 77 685
EQUITY AND LIABILITIES
Equity 62 978 75 723 75 795
Current liabilities 12 954 1 817 1 890
Total liabilities 12 954 1 817 1 890
TOTAL EQUITY AND LIABILITIES 75 932 77 540 77 685
Summary of changes in equity, KEUR
Equity as of December 31, 2017 75 724
Comprehensive income Jan 1 - Jun 30, 2018 -1
Equity as of June 30, 2018 75 723
Comprehensive income April 1 - Dec 31, 2018 73
Equity as of December 31, 2018 75 795
Distribution to shareholders -12 742
Cost related to distribution to shareholders -57
Comprehensive income Jan 1 - June 30, 2019 -18
Equity as of June 30, 2019 62 978