Strategies for Assembly Line Re-Balancing with focus on...
96
i KUNGLIGA TEKNISKA HÖGSKOLAN Strategies for Assembly Line Re-Balancing with focus on Level of Automation A Case Study brought out at Electrolux Abhiram REDDAM, Emre OZUGUREL Department of Production Engineering and Management School of Industrial Engineering and Management 2011, KTH, Stockholm Supervisor: K. Dencker Examinor: A.Hansson
-
Upload
truongngoc -
Category
Documents
-
view
217 -
download
2
Transcript of Strategies for Assembly Line Re-Balancing with focus on...

i
KUNGLIGA TEKNISKA HÖGSKOLAN
Strategies for Assembly Line Re-Balancing with
focus on Level of Automation
A Case Study brought out at Electrolux
Abhiram REDDAM, Emre OZUGUREL
Department of Production Engineering and Management
School of Industrial Engineering and Management
2011, KTH, Stockholm
Supervisor: K. Dencker
Examinor: A.Hansson

ii
Acknowledgment
This thesis would not have been possible if not for the counsel, guidance and understanding of several
people who have helped us along this journey.
We would like to express our sincere gratitude to our KTH supervisor Kerstin Dencker, who not only
provided us with the opportunity to work on this project but also helped and guided us in times of
uncertainty. We would furthermore, like to thank her colleague Gunnar Backstrand at SWEREA for
offering us assistance when required.
Special thanks to Frank Börkey and his colleagues at Electrolux, Mariestad for their interest in our
work and for going out of their way to assist us and provide us with direction in our work. The
operators at the plant deserve special mention for their cooperation and understanding.
We would like to thank the Department of Production Engineering, KTH for providing us with the
education and the skill set which equipped us to deal with the challenges during this period, our
colleagues Daði Janusson and Vilhjálmur Alvar Þórarinsson, who contributed with their ideas and
made working enjoyable.
Moreover, exceptional thanks to Aimeric Mathey, Esteban Berty, Serdar Kumbasar, Begüm Kültür,
Erkut Kavak for their support, friendship and making the life in Sweden fun even in the coldest and
darkest days for the last 2 years.
Also, we would like to thank Hakan Akillioglu for his help, guidance and friendship throughout this
project.
Last but not least we would like to thank our family and all friends for their support which helped us
successfully to complete our work.
Stockholm, June 2011
Abhiram Reddam
Emre Ozugurel

iii
Abstract
Production companies often encounter changes that have to be met because of changing market tastes.
This requires them to be flexible in their production process. In order to achieve this flexibility the
efficiency of the production line is sometimes compromised. Efficiency of the production line and its
flexibility has to go hand in hand if the company is to compete successfully in this dynamic market.
Line balancing is an important feature in ensuring that a production line is efficient and producing at
its optimum. The process of Line balancing attempts to equalize the load on each workstation of the
production line.
This thesis wishes to address the requirements of three organizations, KTH, SWEREA and Electrolux.
We are required to submit a Master‟s thesis in order to be eligible to receive a Masters degree from the
Department of Production Engineering and Management at KTH.
Swedish research group SWEREA has been involved in a project titled COMPLEX in collaboration
with academic and industrial organizations, which aims to define the „complexity „of a production
system and help manage it. This project was founded by VINNOVA.
Electrolux is a stakeholder in the COMPLEX project and has hence provided us with this opportunity
of doing our Master‟s thesis at their plant. The Electrolux factory at Mariestad has undergone
significant renovation. This has been done in order to reach higher levels of flexibility and efficiency
in order to deal with constantly changing markets. To help rebalance their new production line by
focusing on the Level of Automation at inefficient workstations is a priority along with supporting
them during this phase of reconstruction.
We will work on satisfying all three organizations simultaneously. On completion of this thesis, we
wish to have contributed towards rebalancing the new assembly line with special focus on Level of
Automation at the Electrolux factory in Mariestad along with supporting them during this phase of
reconstruction. We also hope to contribute significantly in developing the definition of complexity and
possible ways to deal with it.

iv
Table of Contents
Acknowledgment..................................................................................................................................... ii
Abstract .................................................................................................................................................. iii
1 INTRODUCTION ........................................................................................................................... 1
1.1 Background ............................................................................................................................. 1
1.1.1 Complex Project .............................................................................................................. 1
1.1.2 Electrolux Factory in Mariestad ...................................................................................... 2
1.1.3 Previous Work ................................................................................................................. 2
1.2 Aim and Objective ................................................................................................................... 2
1.3 Delimitations ........................................................................................................................... 3
1.4 Thesis Outline .......................................................................................................................... 4
2 RESEARCH APPROACH .............................................................................................................. 5
2.1 Case study................................................................................................................................ 5
2.2 Literature review ..................................................................................................................... 6
3 FRAME OF REFERENCE ............................................................................................................ 7
3.1 Human Machine systems ......................................................................................................... 7
3.2 Automation .............................................................................................................................. 7
3.3 Assembly ................................................................................................................................. 8
3.3.1 Significance of Assembly ................................................................................................ 9
3.3.2 Manual vs. Automatic Assembly..................................................................................... 9
3.3.3 Strategies for optimizing assembly systems: ................................................................. 10
3.4 Levels of the system .............................................................................................................. 12
3.4.1 Production system ......................................................................................................... 12
3.4.2 Assembly system ........................................................................................................... 13
3.5 Time....................................................................................................................................... 13
3.5.1 Time Parameters ............................................................................................................ 13
3.5.2 Time Measurement units ............................................................................................... 14
3.6 Assembly Line Balancing...................................................................................................... 14
3.6.1 Assembly lines .............................................................................................................. 14
3.6.2 Line balancing ............................................................................................................... 15
3.6.3 Rebalancing ................................................................................................................... 15
3.7 LOA and HTA in DYNAMO Methodology ......................................................................... 16
3.7.1 Level of automation (LOA) ........................................................................................... 16
3.7.2 Hierarchical task analysis (HTA) .................................................................................. 17
3.7.3 Dynamo Methodology ................................................................................................... 18
3.8 Flexibility .................................................................................................................................... 20
3.8.1 Flexible Manufacturing systems ........................................................................................... 21

v
3.9 Proactivity in Assembly systems ............................................................................................. 22
3.10 Lean Philosophy .................................................................................................................... 23
3.10.1 Lean Production............................................................................................................. 23
3.11 Complexity ............................................................................................................................ 24
3.11.1 Complexity in production systems ..................................................................................... 25
4 RESEARCH PROCESS AND PRACTICAL STUDIES .............................................................. 28
4.1 COMPLEX Project ................................................................................................................ 28
4.2 Electrolux at Mariestad.......................................................................................................... 29
4.3 Presentation of the new assembly line ................................................................................... 31
4.3.1 Testing Area: ................................................................................................................. 33
4.3.2 Variant area: .................................................................................................................. 34
4.5 Dynamo Methodology ........................................................................................................... 35
4.6 Time study ............................................................................................................................. 36
4.7 Line Balancing ...................................................................................................................... 38
4.7.1 Rebalancing ................................................................................................................... 39
4.7.2 Line balancing losses ..................................................................................................... 40
4.5 Station analysis and Optimization ............................................................................................. 40
4.5.1 Value Adding Time (VAT) Analysis ................................................................................ 40
4.5.2 Station analysis .............................................................................................................. 41
4.6 Complexity Analysis ................................................................................................................... 44
5 RESULTS ...................................................................................................................................... 44
5.1 Level of Automation ............................................................................................................. 44
5.1.1 LoA Results for Stations 50, 51, 52 .............................................................................. 45
5.2 Line Balancing results ........................................................................................................... 46
5.2.1 Difference between Electrolux provided times and observed times ............................. 46
5.3 Station Analysis and Optimization .............................................................................................. 49
5.3.1 VAT analysis results............................................................................................................. 49
5.3.2. Station analysis results ........................................................................................................ 50
5.3.3 Cognitive Solutions ....................................................................................................... 61
6 DISCUSSION ............................................................................................................................... 64
6.1 Discussion of results .............................................................................................................. 64
6.1.1 Line balancing and LoA ................................................................................................ 64
6.1.2 Complexity .................................................................................................................... 64
6.2 Situation at Electrolux ........................................................................................................... 64
6.3 Research Quality and problems faced ................................................................................... 65
6.4 Further research ..................................................................................................................... 66
7 SUMMARY AND CONCLUSION .............................................................................................. 67
vi
8 REFERENCES .............................................................................................................................. 69
9 APPENDICES ................................................................................................................................. 1
Appendix 1 HTA & LoA ..................................................................................................................... 1
Appendix 2 Times of model 927150531 for Line Balancing .............................................................. 5
Appendix 3 Times for Station Analysis .............................................................................................. 9
Appendix 4 Time study for testing area, wheels station, variant area ............................................... 17

vii
Table of Figures
Figure 1 Automation degrees ...................................................................................................................... 8
Figure 2 Key data of a single station in an interlinked assembly ..................................................................... 10
Figure 3 Deficiencies and optimization approaches ....................................................................................... 11
Figure 4 Types of assembly lines ................................................................................................................ 15
Figure 5 Square of Possible Improvements .................................................................................................. 20
Figure 6 Framework proposed .................................................................................................................. 21
Figure 7 Complexity Framework ............................................................................................................... 26
Figure 8 Old Layout ................................................................................................................................ 30
Figure 9 Current Layout .......................................................................................................................... 30
Figure 10 New Assembly lines ................................................................................................................... 32
Figure 11 SOPI for station 52, sub operation “Tighten Wheels” ..................................................................... 46
Figure 12 Operation Times ....................................................................................................................... 47
Figure 13 Balancing Loss Comparison ....................................................................................................... 48
Figure 14 VAT distribution for station 51 ................................................................................................... 49
Figure 15 Layout of the analysed stations ................................................................................................... 50
Figure 16 Operation Times for testing, wheel station and variant area ............................................................ 51
Figure 17 Comparison between operator work time, time on conveyor and other activities for station 50 ............. 52
Figure 18 Comparison between operator work time, time on conveyor and other activities for station 51 ............. 53
Figure 19 Comparison between operator work time, time on conveyor and other activities station 50 in line 72 .... 56
Figure 20 Comparison between operator work time, time on conveyor and other activities station 50 in line 72 .... 58
Figure 21 Suction cap .............................................................................................................................. 59
Figure 22 Benefits of measuring actual operating times ................................................................................ 62

viii
Table of Tables
Table 1 Level of Automation ..................................................................................................................... 17
Table 2 Dynamo Methodology steps .......................................................................................................... 18
Table 3 Dynamo Methodology steps .......................................................................................................... 35
Table 4 Example of the data sampling table ................................................................................................ 37
Table 5 Example of the balancing loss calculation table ................................................................................ 39
Table 6 Example of the VAT analysis ........................................................................................................ 41
Table 7 Example of the time study with dramatically increased cycle times ..................................................... 42
Table 8 Example of the work sequence comparison ..................................................................................... 43
Table 9 Example of the data sampling for wheel station ............................................................................... 43
Table 10 Complexity analysis data sample ................................................................................................. 44
Table 11 Example of the HTA with LoA .................................................................................................... 45
Table 12 HTA showing VAT results .......................................................................................................... 49
Table 13 Time study results for station 50 .................................................................................................. 51
Table 14 Work sequence comparison for station 50 ..................................................................................... 52
Table 15 Time study results for station 51 .................................................................................................. 53
Table 16 Work sequence comparison for station 51 ..................................................................................... 54
Table 17 Time study with drastically increase in cycle time .......................................................................... 55
Table 18 Time study results for station 50 freezer line.................................................................................. 56
Table 19 Work content comparison station 50 freezer line ............................................................................ 57
Table 20 Time study results for station 51 freezer line.................................................................................. 57
Table 21 Work Content Comparison station 51 freezer line .......................................................................... 58
Table 22 Time study results for station 52 .................................................................................................. 59

1
1 INTRODUCTION
Production companies face the challenge of constant up-gradation and development of production
technologies in order to cater to changing market needs. The dynamic nature of today‟s markets has
resulted in a larger number of product variants with shorter product lifecycles. The customer today
looks for a product which is distinct and seeks features that will set his/her product apart from that of
his peers. In this light, customization has gained tremendous importance. With increased demand for
customization and a larger range of products, production companies face a host of new challenges.
Standardization of work, operator training and learning, assembly line re-balancing, smoother
introduction of new products into the assembly line, quicker identification of problems associated
with the introduction of these new products to the production system become significant challenges
with the phenomenal growth in the number of products with short lifecycles. Simplifying the
operator‟s instructions as well as the means of instructing during assembly gains priority because of
the frequency with which changes are made which result from the introduction of new products. This
challenge takes on special meaning in the context of the Swedish Manufacturing industry since a
sizeable amount of the workforce is constituted by temporary and inexperienced workers in the
Swedish summers.
The importance of flexible assembly systems cannot be underscored since inflexible assembly systems
will greatly increase the complexity of the production process itself. The focus therefore has to be on
reducing the complexity of the production process in order to deal with varying degrees of product
complexity.
1.1 Background
1.1.1 Complex Project
The COMPLEX project was started by SWEREA IVF in conjunction with several stakeholders in the
manufacturing industry .The aim is to contribute to the development of sustainable production systems
by increased understanding of the concept of production complexity, providing means to measure,
compare and manage added complexity. In order to obtain a competitive advantage, production
systems in Sweden have to be slim and readily adjustable. This fact gains importance in the light of
shorter life cycles for products and frequent changes in technology, products, processes and suppliers.
The production systems must continuously be optimized and re-balanced, due to changes in product
mixes, volumes and sequences. For manual assembly operations, standardized operation instruction
sheets are important for efficiency and quality assurance. For the development of sustainable
production systems, optimization has to take place on station, line, shop and plant level. Man hour

2
planning and control are key issues and consists in this context of “direct work”, “indirect work”,
“competence” and “information”.
1.1.2 Electrolux Factory in Mariestad
Electrolux is a global leader in household appliances and appliances for professional use, selling more
than 40 million products to customers in more than 150 markets every year. It was founded in the year
1919. Electrolux products include refrigerators, dishwashers, washing machines, vacuum cleaners,
cookers and air conditioners sold under several esteemed brands.
The Electrolux factory in Mariestad houses a manufacturing facility which produces refrigerators and
freezers for the Nordic markets. Certain models which are relatively complex to manufacture are
produced only here and nowhere else in the world.
1.1.3 Previous Work
The current thesis work is an extension of the thesis titled „An approach to How Complexity is
affected by the Level of Automation in a Production System‟ by Linus Andersson and Maria
Björnelund. The foundation for the current thesis was laid in the aforementioned thesis. Their work
targeted at meeting the following goals:
To create and support a practical platform of documentation at Electrolux
To support Electrolux during the phase of reconstruction and to see
How the changes in Level of Automation can affect the value adding time in Assembly
systems.
In their thesis they analyzed the base assembly of the refrigerator model ERE 38500 X R RFR R SC
with respect to the LOA, documented the situation at the time in Electrolux and made suggestion for
the future. We have attempted to extend their work and take it forward.
1.2 Aim and Objective
The main objective is to identify ways to rebalance the assembly line by altering the Level of
Automation. It also aims to compare the line balancing data generated by Electrolux with actual times
to see how much of a deviation exists. The development of a practical platform of documentation has
been continued but with focus on the testing and variant area. This area was chosen in accordance with
Electrolux as this was a prime area of concern in the new assembly line. Also there was no previous
data as the earlier thesis focused on the base assembly of the refrigerator.
With the data gathered, this thesis also aims to contribute to the definition of complexity. The thesis
hence aims to do the following:
Further develop the definition of „Complexity‟

3
Analyze the affect of Level of automation, with focus on cognitive LOA
A comparison of the Line balancing data generated by Electrolux with realistic times
Develop suggestions for existing problems at assembly stations in order to improve
efficiency.
1.3 Delimitations
The new production layout consists of two dedicated assembly lines, one for refrigerators and one for
freezers. Each assembly line in turn consists of 60 work stations; given our time constraint we have
restricted our field of study to the testing area and the variants section following it. This part of the
assembly line was chosen in accordance with Electrolux as they were facing immediate problems here.
The testing area was a bottleneck for them in the assembly line. In addition to this we have also
analyzed the testing stations in the freezer area in order to support their current objective of improving
efficiency.
The variant area which follows the testing area was identified as an area of improvement because of
the very low cognitive level of automation. This effectively made the process heavily operator
dependent and relied greatly on their experience. The improvement of cognitive level of automation is
an important field of study in the COMPLEX project being run by SWEREA. Hence the testing area
and the variant area were chosen in accordance with SWEREA and Electrolux.
For the purpose of making a comparison between the generated line balancing data and actual times
we followed a single refrigerator model along the entire assembly line.
The analysis for the testing stations and those following it was carried out on a more generic level
which can be used to optimize the working of the stations itself without particular regard to models.
The value stream mapping of the whole assembly has been carried out earlier. We have therefore
decided to use this, but in addition to this we aim to do a detailed VAT analysis of the testing area and
the variant section, which will build on the earlier work carried out at Electrolux.
Production planning, batch size and production mix has not been taken into consideration in this work
due to the time and resource limitations of the thesis.

4
1.4 Thesis Outline
Section Content
1. Introduction This section provides information about the background of
the study area, aim and objectives with delimitations and
outline of the thesis.
2. Research Approach This section describes the approaches, both emphirical and
theoretical methods used carry out this thesis.
3. Frame of Reference In this section all the theories, methodologies, terminalogies
and references are explained in order to provide the reader the
necessary knowledge to understand this thesis.
4. Research Process and
Practical Studies
This section describes the Complexs project, the new
assembly line in Electrolux Mariestad factory, DYNAMO
methodology, the data gathering process, line balancing
techniques used, VAT analysis and brief description of the
focused stations.
5. Results This section gives detailed results of the studies carried out in
section 4.
6. Discussion In the discussion section the results are presented and
discussed on how the results can be implemented to improve
the assembly lines.
7. Summary and Conclusion In this section a brief summary of the thesis is presented with
some brief suggestions.

5
2 RESEARCH APPROACH
Scientific work and research can be done in two ways. The relation between theory and empirical data
can be explained in two ways either by deduction or by induction. An inductive approach starts with
empirical data based on which a hypothesis is formed whereas in a deductive approach a hypothesis is
formed and then the data is used to either validate it or reject it. In this thesis an inductive approach
was used. (Fasth,2009)
2.1 Case study
A case study is to investigate a current phenomenon within its real-life context; when the boundaries
between the phenomenon and context are not clearly evident; multiple sources of evidence are used
(Ying, 2003). Focus is on the process rather than the results, on the context rather than specific
variables and the aim is to discover rather than to prove (Merriam, 1994)
This thesis is based on empirical data recorded at the Electrolux Factory in Mariestad. The data for this
thesis was collected in the following ways; by recording actual times, by open interviews with the
operators, production technicians and production leaders and by gathering existing data at the plant.
Considerable amount of time was spent in observing and understanding the assembly system. Time
spent at the assembly line was valuable as it provided us with a better insight. The interviews with the
operators and the employees complemented our understanding of the assembly line and helped in
identifying the obstacles to the smooth running of the line. Interviewing the production technicians
also provided us with direction in our thesis, for future possible improvements.
To familiarize ourselves with their production system and identifying an area on which we can focus
was a time consuming process. Once this decision was made to get access to their systems and the
necessary permissions to carry out the time studies was smooth as the Electrolux management was
extremely cooperative and helpful.
Identifying a single product that could be followed to make a line balancing comparison was hard as
we had to find a product that was produced in a large batch which constituted a significant amount of
their annual production.
Tools such as Hierarchical Task Analysis, DYNAMO and VAT analysis were used partially or
completely in order to obtain successful results. This led to a broad stream of knowledge which helped
us make useful recommendations to deal with current and future challenges.
6
2.2 Literature review
To increase our understanding of production and assembly systems, we referred several books journals
and papers. The literature review is focused on Level of automation, assembly systems and
Proactivity. The above factors form the basis for effective strategies to rebalance an assembly line.

7
3 FRAME OF REFERENCE
3.1 Human Machine systems
The term human-machine systems refer to all conditions where humans (individuals as well as groups)
use control or supervise tools, machines or technological systems. (Wieringa and Stassen, 1999)
According to Wieringa and Stassen (1999) there are three different modes of human interaction with
technology:
Direct control (human-tool control): The tool serves as an extension of the human physical
form and uses human motor skills, sensory properties and cognitive capabilities. A physical
contact exists between the human and the tool and most sensory and motor skills are used for
control. The dynamic properties of the humans are important for the overall performance.
Humans here are continuously „in the loop‟.
Intermittent control (human-technological system control): Technological systems which are
designed to enhance human skills way beyond their capacity such as cranes and cars.
Information input is through direct vision sight, visual displays and movements induced on the
body while control. This kind of interaction employs human motor skills, visual and cognitive
capabilities. Humans here are not continuously „in the loop‟. They use intermittent control;
adjust and wait for reactions.
Supervisory control (human-technological system supervision): The human acts as the
supervisor of an automated system. The human supervisory tasks are mainly to perform
start/stop operations, to change set-points, monitor system performance and product quality
and to perform fault diagnosis. Such systems put the human for the most part outside the
control loop. For these systems to work well a proper human-machine interface is very
important apart from operational procedures, operator training and learning capabilities which
are important to maintain such systems.
3.2 Automation
Automation is a large subject and has tremendous impact on civilization and humanity. When
discussing the term it has various definitions to the professional domain in which it is used (Nof,
2009). In general, according to Cambridge Dictionary Automation has the definition:
“To make a process in a factory or office operate by machines or computers, in order to reduce the
amount of work done by humans and the time taken to do the work”

8
The term “Automation” was first coined in 1952 by D. S. Harder of Ford Company to involve
methodology which analyzes, organizes and controls the production means such that all material,
machine and human resources are used in the best way. The aim of automation is to get the maximum
productivity obtained over a human effort both in muscular and mental. Today, the term automation is
used in all cases where the system operation is automated to various degrees (Tzafestas, 2009).
Figure 1- Automation degrees
According to Shimon Y. Nof, automation implies operating or acting, or self regulating, independently
without human intervention. It involves machines, tools, devices installations and systems developed
by humans to perform a given set of activities without human involvement during these activities.
Automation is used mainly to (Mikler, 2010):
1. Shorten setup times
2. Reduce batch sizes
3. Reduce boring, danger and/or exhausting jobs
4. Uncouple operators from machines
5. Reduce influence of experience curve(“Learning‟s curve)
6. Speed up information exchange along the production line
3.3 Assembly
Assembly is defined as “the fitting together of manufactured parts into a complete machine, structure
or unit of machine” (Alsterman, 2010). More general it means that building up products from
components and subassemblies. Sub assembling is a simple assembly operation where component is
assembled with another component, base object or smaller sub assembly.
Rampersad (1995) classifies assembly into three elementary methods:
Manual assembly
Robotic assembly

9
Mechanized assembly
The assembly of parts into a product may be done differently according to the production volume,
variety, batch size and flexibility. Completely manual (Manual assembly) is when a person does the
assembly, with or without tools. It could also be done completely automatically (Mechanized
assembly), or be done manually and automatically in combination (Robotic assembly), with any
degree of automation, where handling and composing operations are performed by one or more robots
(Rampersad, 1995).
3.3.1 Significance of Assembly
Assembly still requires higher proportion of manual work and labour cost compared to various
industrial production steps. This is due to the following reasons (Mikler, 2010):
Product life is getting shorter and shorter, batch sizes are decreasing and the diversity of
variants are increasing. The increased cost of automated assembly through investment in
assembly automatons and in additional expenditure involved in work planning is no longer
viable.
Any errors occurring during planning, product development and initial production have an
effect on assembly. Above all, it is apparent that during the development phase, much greater
consideration is given to product usage than assembly functions. Through assembly-oriented
product development, it has been possible to simplify both manual and automatic assembly, or
to actually facilitate automatic assembly in the first place.
The operational aspects of assembly are extremely diverse and necessitate corresponding
flexibility, which in turn requires a high level of personnel commitment.
Past experience and optimisation of assembly is generally product-specific and cannot simply
be applied to other products.
3.3.2 Manual vs. Automatic Assembly
An important decision by producing a new product is the assembly method, whether do it manually or
automatically. Both alternatives have advantages and disadvantages. Manual assembly is less risky
since it requires low investment if the product turns out to be a failure. This is mainly due to the low
flexibility of the automatic assembly systems. These systems are product specific, consisting of design
and manufacturing of special applications, and cannot be reused for other products (Alsterman, 2010).
Automated systems have big advantages when used for high volume production. With these systems
the possibility of industrial injuries as well as uneven quality are reduced. In manual assembly, small
fluctuations in market can be handled by overtime, but big fluctuations must be met by the changes in

10
the number of workers and employing temporary workers and educating time takes time and money.
Simpler assembly work requires less time for education, however the workers suffer both physically
and psychologically from just repeating a few single movements. It is difficult to motivate skilled
workers if the work does not give simulation enough. Moreover, when the parts of a product become
smaller, manual assembly becomes harder, sometimes impossible (Alsterman, 2010).
3.3.3 Strategies for optimizing assembly systems:
Assembly systems require high investments and hence are required to operate at maximum efficiency.
Inefficiency in the assembly systems can lead to low productivity which translates to significant losses
for the organization. Efficiency is affected by technical and organizational standstills; therefore the
reduction of standstills and the optimization of assembly processes can save large amounts of money.
(Köhrmann and Wiendahl, 1998)
Figure 2 - Key data of a single station in an interlinked assembly (Köhrmann and Wiendahl, 1998)
According to Köhrmann and Wiendahl, 1998 the significant deficits and optimization approaches for
the areas, data capturing, data processing and personnel are as follows:

11
Figure 3 - Deficiencies and optimization approaches
The optimization of assembly systems should hence be based on exact and true data. Faulty and
omitted operator data entry can distort the results; therefore the capture of data which is used to
describe operational behavior should be automatic (Köhrmann and Wiendahl, 1998).
3.3.4 Standard Work:
Standardizing the work content that needs to be followed at an assembly station is very important.
This helps eliminate the fluctuations in operation times because of operators following different work
sequences. Having a standardized work sequence also makes it simpler for new operators to follow the
instructions and learn. Most importantly it facilitates the improvement of the instruction sequence by
eliminating redundant activities.
According to Heiser et al (2004) the following factors are of great importance in order to make
effective assembly instructions:
1) Every assembly action must be shown in a diagram and no sequence should be omitted
2) Assembly sequence should be made explicit by numbering each step
3) Parts added in each step should be visible
4) Mode of attachment should be visual
5) Action diagrams include structural information; depicting the action is necessary for assembly
tasks
6) Arrows and guidelines to indicate attachment
7) Changing viewpoints of the object must be avoided.
8) Important to show orientations of the object in a manner that is physically realizable.

12
3.3.5 Operator Learning:
Operator learning is influenced by a variety of factors, of which the significant ones are:
1) The longer the task, the slower the learning in general not only in terms of the total time
required to reach a particular level of performance but also the number of repetitions required
to reach that level.
2) The complexity of the task
3) Capability or skill of an operator and familiarity with the type of work
4) Similarity of task to previously undertaken tasks
5) Operator motivation
6) External influences, e.g. physical conditions
3.4 Levels of the system
3.4.1 Production system
A production system is the design process by which elements are transformed into useful products. A
process is an organized procedure for accomplishing the conversion of inputs into outputs. A unit of
output generally requires several types of inputs. In an industrial process most of the inputs account
for most of the variable cost of production.
Any system is a collection of interacting components. Each component could be a system unto itself in
a descending order of simplicity. Systems are distinguished by their objectives; the objective of one
system could be to produce a component which is to be assembled with other components in order to
achieve a larger system.
According to Bellgran and Säfsen (2005) a production system can be classified into three different
perspectives:
The functional perspective- Describes the system as the “black box” that transforms input to
output
The structural perspective- Describes the system as a structure of elements and the relations
between them.
The hierarchical perspective: Describes the system as an element in a greater system. This
hierarchy determines a systems relation or position in comparison to a greater system or in the
other way round.

13
3.4.2 Assembly system
The assembly system operates as an integral part of the total production system, which in turn consists
of all the elements that support the manufacturing system (Cochran, 1998)
According to Rampersad (1995) the assembly system is subdivided into:
System Layout: This element entails an arranged positioning of concrete system components
in the assembly system. The location of, and the relations between those components are
determined in detail for this purpose. The system layout results from the system structure;
System structure: This element involves a collection of system components which are
mutually related to each other. The location of the system components is determined globally
for this purpose;
System components: This element comprises the subsystems of the assembly system which
fulfill functions in the system.
3.5 Time
Measuring various time parameters in an assembly line is of immense value for the improvement and
optimization of the assembly line. It gives us an exact idea of the current state of operations. The
necessary changes can then be made in order to take the system to a desired state.
3.5.1 Time Parameters
The following time parameters are of relevant in this thesis work:
Cycle time: The time it takes to manufacture one individual product, (Mattson, 2004) and for
the operator to finish all of his/hers work tasks (Rother and Shook,2002)
Set up time: The time it takes to setup a machine or a machine group. There are two different
types of set-up times (Mattson, 2004)
o Internal set up means task that have to be performed within a machine when it is
stopped and not producing
o External set up refers to tasks that can be performed outside the producing machine, it
can be done when the machine is producing
Operation time: Operation time is referred to as lead-time for carrying out one manufacturing
step. It includes waiting time, transport time, transport and handling time to the production
group, set-up time and production time. It represents one part of the throughput time.
(Mattson, 2004)
Throughput time: The throughput time is the time it takes to manufacture an article from
material and start of the first operation to delivery of a finished quality approved product. The
14
throughput time is a part of the lead time and includes transport times, queuing time, set-up
time and producing time (Mattson, 2004)
3.5.2 Time Measurement units
Taylor and Gilbreth, the pioneers in work design, suggested the established of determined time
standards for each element in an operation. The first book published on this subject in 1948, described
the Methods time Measurement (MTM), the first and only system of predetermined times whose
complete data are publically available.
Methods time Measurement is a procedure which analyzes any manual operation or method into the
basic operations required to perform it and assigns to each motion a predetermined time standard
which is determined by the nature of the motion and the conditions under which it is made.
Durations of motions are given in Time Measurement Units (TMU) with each equal to 0.0006 minutes
or 0.036 seconds.
3.6 Assembly Line Balancing
3.6.1 Assembly lines
Assembly lines are flow oriented production systems which are still typical in the industrial production
of high quantity standardized commodities and even gain importance in low volume production of
customized products. (Becker and Scholl, 2004)
Based on the type and intermixing of the variants, three different kinds of assembly lines arise:
If only one product is assembled and all work pieces are identical it is called a single model
line.
A mixed model line produces the units of different models in an arbitrarily intermixed
sequence (Bukchin et al.,2002)
A multi-model line produces a sequence of batches (each containing units of only one model or
a group of similar models) with intermediate setup operations.

15
Figure 4 - Types of assembly lines
3.6.2 Line balancing
Assembly Line Balancing, or simply Line Balancing (LB), is the problem of assigning operations to
workstations along an assembly line, in such a way that the assignment be optimal in some sense. Ever
since Henry Ford‟s introduction of assembly lines, Line Balancing has been an optimization problem
of significant industrial importance, the efficiency difference between an optimal and a sub-optimal
assignment can yield economies (or waste) reaching millions of dollars per year. (Emanuel
Falkenauer, 2005)
Slack et al. (2004) defines line balancing shortly, as an attempt to equalize the load on each station, a
part of a line layout or mass production. It is a decision that defines which of the tasks that goes into
making a product and which one should be allocated to each station.
3.6.3 Rebalancing
A Line Balancing tool gives theoretical input on how best to balance an assembly line, but the
situation in reality is far removed from this because of several factors which are not accounted for by
the line balancing software.
Many of the OR approaches implicitly assume that the problem to be solved involves a new, yet-to-be
built assembly line, possibly housed in a new , yet-to-be –built factory. The vast majority of real-world
line balancing tasks to be rebalanced rather than balanced, the need arising from changes in the
product or the mix of models being assembled in the line, the assembly technology, the available
workforce, or the production targets. (Emanuel Falkenauer, 2005)

16
Rebalancing therefore has to be done continuously because of newer products with shorter life cycles,
changing workforce, difference in the skill level of operators and the product mix; also in order to
account for higher production volumes or lower production volumes.
3.7 LOA and HTA in DYNAMO Methodology
3.7.1 Level of automation (LOA)
As mentioned in section “Automation” Shimon Y. Nof defines automation as operating without
human intervention. However, today in the industry there are many systems which contain both
computers and human operators, that means both mechanical and computerized tasks (Frohm, 2008).
The concept “Level of Automation” (LoA) is defined to measure the level of interaction between
human and technology (Granell, et al., 2007). Frohm defines Level of Automation as:
“The allocation of physical and cognitive tasks between humans and technology, described as a
continuum raging from totally manual to totally automatic”
Level of Automation has both mechanical and cognitive tasks in human machine systems. Mechanical
LoA measures the physical support in mechanical activities as replacement or support of human
muscle power, where cognitive LoA measures support for carrying out control and information tasks
(Frohm, 2008).

17
The measurements of LoA are done through the reference scale shown in Table 1:
LoA Mechanical and Equipment Information and Control
1 Totally Manual: Totally manual work, no
tools are used, only the users own muscle
power. E.g. The user‟s own muscle power
Totally Manual: The user creates his/her
own understanding of the situation and
develops his/her course of action based on
his/her experience and knowledge
2. Static hand tool: Manual work with the
support of a flexible tool. E.g. adjustable
spanner
Decision giving: The used gets information
about what to do or a proposal for how the
task can be achieved. E.g. Work order
3. Flexible hand tool: Manual work with the
support of a flexible hand tool. E.g.
adjustable spanner
Teaching: The used gets instructions about
how the task can be achieved. E.g. Checklist,
manuals
4. Automated hand tool: Manual work with
the support of an automated tool. E.g.
hydraulic bolt driver
Questioning: The technology questions the
execution, if the execution deviates from
what the technology considers suitable. E.g.
Verification before action
5. Static machine/workstation: Automatic
work by a machine that is designed for a
specific task. E.g. Lathe
Supervision: The technology calls for the
present task. E.g. Alarms
6. Flexible machine/workstation: Automatic
work by a machine that can be reconfigured
for different tasks. E.g. CNC Machine
Intervene: The technology takes over and
corrects the action, if the executions deviate
from what the technology considers suitable.
E.g. Thermostat
7. Totally Automatic: Totally automatic work.
The machine solves all deviations or
problems that occur by itself. E.g.
Autonomous systems
Totally Automatic: All information and
control are handled by the technology. The
user is never involved. E.g. Autonomous
systems Table 1 - Level of Automation
Sometimes, the tasks cannot be allocated to either the human or the technical system. In this situation
each of the reference scales can individually be delimited by the relevant maximum and minimum
LoA for each task (Frohm, 2008).
3.7.2 Hierarchical task analysis (HTA)
Hierarchical Task Analysis (HTA) provides a convenient way to identify, organize and represent the
constituent tasks and sub-tasks that are involved in a complex activity (Ainsworth, 2004). HTA starts
with a high-level description of the main goal of an activity. Afterwards, the analyst redescribes this
main goal in greater detail as a small, but comprehensive set of sub goals. This redescription process is
then continued to develop a hierarchically organized set of task descriptions, such that at the lowest
levels of this hierarchy the tasks are described in sufficient detail for the analyst (Ainsworth, 2004).
According to Akillioglu, A HTA has the basics to answers the question: “What must one know or be
able to do to achieve this task?”:
Hierarchical task analysis is developed bottom up, from general to specific.
18
Hierarchical task analysis represented in terms of levels and tasks. Each level should represent
one learning level. The highest level is the most complex. Lower levels form prerequisite
skills for higher levels. Lines connect tasks between levels. Each task can be broken down into
one or more tasks from one level to the next.
3.7.3 Dynamo Methodology
Dynamo Methodology (Dynamic Levels of Automation) is “a set of principles of method” developed
to measure, assess and analyze the Level of Automation (Checkland,1999), (Granell, et al., 2007). Its
focus is to get an accurate picture of today‟s information flow and measuring of automation level in
production systems (Dencker et al.,2008) When measuring LoA, the focus is on the tasks performed
by human, technology or both. Measurement of LoA should be understood as judging the level of
interaction between the human and the two types of technology; mechanization and computerization
(e.g. information systems). The tasks are judged by the type of interaction between the human and
the technology (Granell, et al., 2007).
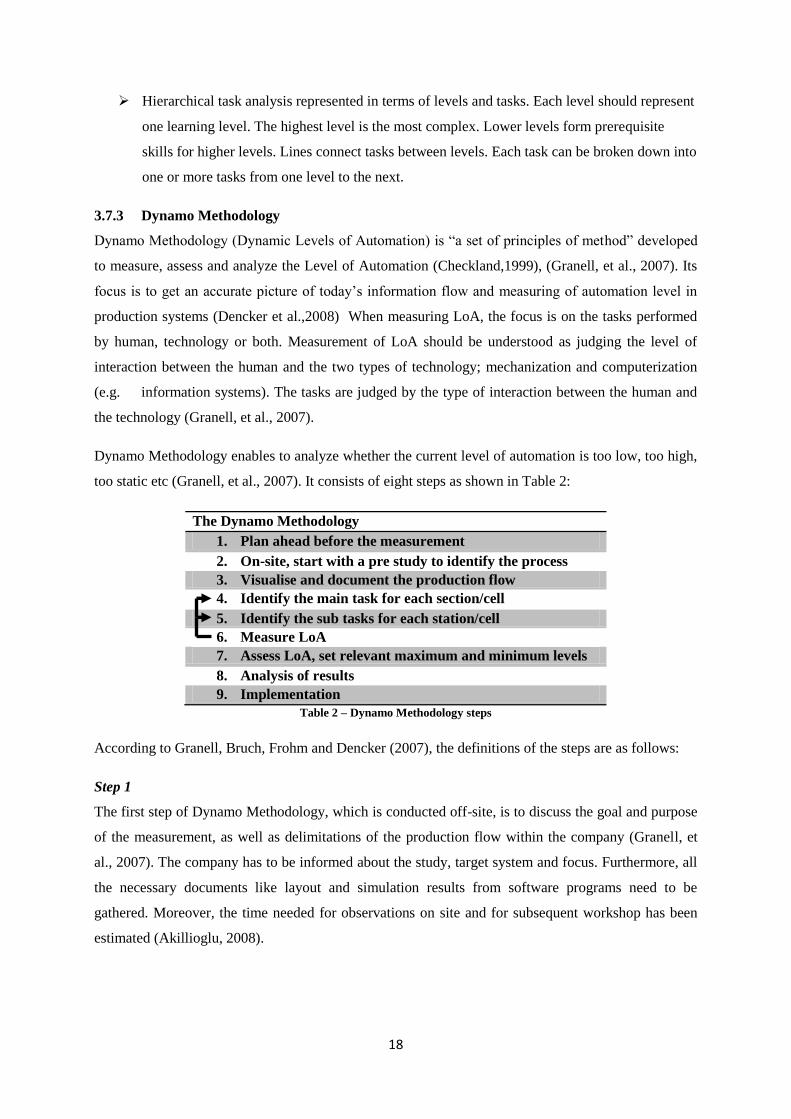
Dynamo Methodology enables to analyze whether the current level of automation is too low, too high,
too static etc (Granell, et al., 2007). It consists of eight steps as shown in Table 2:
The Dynamo Methodology
1. Plan ahead before the measurement
2. On-site, start with a pre study to identify the process
3. Visualise and document the production flow
4. Identify the main task for each section/cell
5. Identify the sub tasks for each station/cell
6. Measure LoA
7. Assess LoA, set relevant maximum and minimum levels
8. Analysis of results
9. Implementation
Table 2 – Dynamo Methodology steps
According to Granell, Bruch, Frohm and Dencker (2007), the definitions of the steps are as follows:
Step 1
The first step of Dynamo Methodology, which is conducted off-site, is to discuss the goal and purpose
of the measurement, as well as delimitations of the production flow within the company (Granell, et
al., 2007). The company has to be informed about the study, target system and focus. Furthermore, all
the necessary documents like layout and simulation results from software programs need to be
gathered. Moreover, the time needed for observations on site and for subsequent workshop has been
estimated (Akillioglu, 2008).

19
Step 2
The second step, which is conducted on-site, is to carry out a pre-study to identify and document the
purpose of the production flow and where it starts and ends. In this step the number of products and
variants produced within the production flow are identified and documented, as well as work
organization and the purpose of the machines and humans.
Step 3
After the basic data for the production flow has been documented and understood, the next step is to
visualize the production flow. This is done by “walk the process” and defining which sections/cells the
production flow consists of. Data such as the number of products and variants that pass through a
section/cell or buffer, the physical and cognitive tasks that have been allocated to the technology or to
the human, the number of operators that are allocated to the section/cell or buffer, and if the operator is
responsible for more then one section/cell or buffer has to be documented.
Step 4
After the production flow has been understood, visualized and documented, the identification of the
main task should be finished in step 4.
Step 5
The identification of the sub-tasks is done once the main task is identified. Furthermore, in step 5, the
identification of sub-tasks is done by observing how the main task is achieved, which is done by
breaking down the task until it reaches a level of operations, where only the human or the technology
can be responsible for achieving the task. In support of the observation, the operation instructions are
used as a starting point and explanation of what is going to be observed. By using the documentation
of the task from the company, the measurement crew can easily identify the sub-tasks and deviations
from how the task is intend to be done. To simplify and structure the down breaking of the main tasks
in to sub-tasks, Hierarchical Task Analysis (HTA) is used. The HTA is a method for description of
activities under analysis in terms of a hierarchy of goals, sub-goals, operations, and plans (Stanton et
al, 2005).
Step 6
After the tasks have been broken down and identified, the LoA is judged based on the two reference
scales for mechanical and information LoA and an observation of the sub-tasks performed and
described in the HTA in step 5. The judged LoA for each task is than based on how the task is
conducted, and what type of interaction that is observed for fulfilling the task. The type of interaction
for each sub-task is mapped against the reference scale. By observing more than one operator it is
possible to increase the strength of the observations, and also to identify if tasks are conducted with
different LoA:s depending on which operator that conducts the task. If the case is conducted under
different LoA:s, the task can then be said to be a dynamic LoA.

20
Step 7
After the measurement of the observed LoA-values have been judged, the observer together with the
operator or/and production technician on-site estimates the relevant maximum and minimum LoA for
each measured task. By using respondents that has an understanding on how the tasks that has been
observed is conducted, a good estimation on the relevant maximum and minimum can be assessed
during the discussion.
Step 8
The final step of the Dynamo measurement methodology is to analyse the collected data from the
LoA-measurement on-site, with the assessed data on relevant maximum and minimum of LoA. The
analysis starts with placing the LoA value from the observed LoA value as a black dot in the
Mechanical-Information-LoA diagram for all documented sub-tasks. By drawing the boarders for the
relevant maximum and minimum of each LoA, a potential area of automation of the task is given (see
figure 2). Depending on the purpose of the LoA-measurement, an analysis of the Mechanical-
Information-LoA diagram indicates how to take advantage of the automation potential. For example, if
the purpose is to maximize the automation of different reasons by the company, the task is then to
move the actual LoA to the upper right corner of the max-min LoA square in Figure 5:
Figure 5 – Square of Possible Improvements
3.8 Flexibility
Flexibility in production systems is of more importance now than ever if an organization is to compete
in the global markets. Production companies no more produce a single product for long periods of
time. Increasingly dynamic markets now require production systems to be adaptable and flexible in
order to produce to changing customer tastes .The following reasons make it imperative for companies
to embrace flexible production:

21
Increasingly dynamic markets
Greater demand for customization
Greater variants
Frequent development of newer products with shorter lifecycles
A production system should therefore be able to handle a significant amount of variety, since
reconfiguring it every time a new product or variant is launched requires considerable investment it
becomes necessary to have flexible production systems.
Flexibility above all other manufacturing performance measures, is cited as a solution in the present
situation where customers demand a more rapid response and a wider variety of updated products and
competitors achieve levels of performance above those considered feasible a few years ago (Slack,
2005)
3.8.1 Flexible Manufacturing systems
Many authors considered manufacturing flexibility as the strategic answer to the current dynamic
situation and the high degree of turbulence that affects the markets (Slack 1983, Gerwin 1987; Kumar
1987; Sethi and Sethi 1990; Chen and Tirupati 2002).
The contribution proposed by Zhang et al. (2003) described manufacturing flexibility as an integral
component of value chain flexibility, and discussed its sub-dimensions. It also provided a research
theoretical model linking flexible manufacturing competencies with volume flexibility and mix
flexibility and with customer satisfaction.
Figure 6 - Framework proposed by Zhang et al

22
3.9 Proactivity in Assembly systems
The manufacturing competence of an organization relies heavily on its ability to reconfigure its
production and assembly systems. Several organizations act reactively to the occurrences of rapid
product change, both at higher strategic levels and at functional machine level, the treatment is similar
to the introduction and ramp up of a new product like a unique event rather than a continuous process
which is integral to the functioning of the enterprise. (Dencker et al, 2007)
A new assembly line or system is developed in response to the existing problems; this hence becomes
a highly reactive solution and focuses on immediate resolution of the existing problem. Whether this
solution is cost efficient or effective for the long term growth of the company is debatable. In contrast
to this assembly systems need to be more dynamic and evolvable with the ability to proactively meet
emerging and long-term requirements.
According to Dencker et al (2007) a proactive system should have the capability to prepare for:
Changes and disturbances during operations
Planned long-term, sustainable evolution of the assembly system
And, the main features required to prepare the assembly system are:
Flexibility
Robustness, speed of change
Ability to handle frequent changes
Evolvability
According to Mehrabi et al (2000) characteristics of reconfigurable manufacturing systems are
modularity of system components, integrability of, ready system parts and future technology,
convertibility, diagnosability and customization.
Dencker et al (2007) suggest that the following three parameters strongly contribute to proactivity:
Level of Automation (LoA): Flexible and quickly adjustable levels of automation in the
assembly system. This applies to physical as well as cognitive levels of automation.
Level of Information (LoI): Efficient and dynamic flow of information among all levels of the
organization
Level of competence among operators (LoC): Quick and efficient development of assembly
operators‟ competence.
As suggested above it is of great importance to take the level of information and the operators‟
competence into account in order to make the system proactive. Over automation under automation

23
can drastically bring down the flexibility of a system. The operators who are the most flexible have to
therefore be taken into account while designing a proactive assembly system.
An assembly system can hence be proactive if technical systems as well as operators are integrated in
its development. Proactivity of an assembly system can result in the reduction of product lead times.
3.10 Lean Philosophy
3.10.1 Lean Production
Lean production is the production method reflected by “lean thinking”, which dominated the
manufacturing trends for the last 15 years (Liker, 2004). It is a new way of production pioneered by
the Toyota Company to create a better way to organize and manage customer relations, the supply
chain, product development, and production operations (Womack&Jones, 2003). The aim is to identify
“muda”, which is the Japanese word for “waste”, and reduce it as much as possible. To be a lean
manufacturer requires a way of thinking that focuses on making the product flow through value-
adding processes without interrupting (one-piece flow), a “pull” system that cascades back from
customer demand by replenishing only what the next operation takes away at short intervals, and a
culture in which everyone is striving continuously to improve (Liker, 2004).
Womack and Jones describe wastes in their masterpiece book “Lean Thinking” as any human activity
which absorbs resources but creates zero value by:
Mistakes which require rectification,
Production of items no one want so that inventories and remaindered goods pile up,
Processing steps which are not actually needed,
Movements of employees and transport of goods from one place to another without any
purpose,
Groups of people in a downstream activity because an upstream activity has not delivered on
time,
Goods and services which do not meet the needs of the customer.
The main idea of lean production is to satisfy the customer and to do it five-step processes are needed:
defining customer value, defining the value stream, making it “flow”, “pulling” from the customer
back, and striving for perfection (Womack&Jones, 2003).
Value is the focus of the lean thinking. It can only be defined by the customer, and it is only
meaningful when expressed in terms of a specific product (a good or a service, and often both at once)
which meets the customer‟s needs at a specific price at a specific time (Womack&Jones, 2003).

24
Another important idea in lean production is the concept of “pull system”, which means that the
upstream process should not make (replenish) its parts until the downstream process after it uses up its
original supply of parts from the upstream step. In other words, when the downstream process is down
to a small amount of safety stock, this triggers a signal to upstream process asking it for more parts
(Liker, 2004). This triggering operation is done mostly by “kanban” cards to signal the previous step
when its parts heed to be replenished. In this way a pull is created, which continues cascading
backwards to the beginning of the manufacturing cycle. Without this pull system just in time (JIT)
cannot be possible (Liker, 2004).
JIT production is another sub-idea of lean production that allows you to deliver the right items at the
right time in the right amounts. It is a set of principles, tools and techniques that allows a company to
produce and deliver products in small quantities, with short lead times to meet specific customer needs
(Liker, 2004).
3.11 Complexity
The original Latin word complexus signifies “entwined”, twisted together (Heylighen, 1996).
According to Heylighen (1996) this may be interpreted as:
“in order to have a complex you need two or more components, which is joined in such a way that is
difficult to separate them”
One way to identify a complex task is a problem where the number of distinct possibilities that must
be considered, anticipated or dealt with is substantially larger than can be reasonably named or
enumerated. Intuitively, the complexity of a task is the number of wrong choices for every right choice
(Y. Bar Yam, 2003). The source of complex tasks is complex systems. Complex systems are systems
with interdependent parts. Interdependence means that we cannot identify the system behavior by just
considering each of the parts and combining them. Instead we must consider how the relationships
between the parts affect the behavior of the whole. Thus a complex task is also one for which many
factors must be considered to determine the outcome of an action. While complex systems give rise to
complex systems, reliable responses to complex tasks can only be achieved by complex systems (Y.
Bar Yam, 2003).
The complexity of a problem situation stems from its openness, interdependence of contributing
factors and multi-scalarity which together produce the following characteristic and problematic
features (Joseph K. De Rosa et al, 2008):
The situation cannot be unambiguously bounded since there are always significant interactions
with elements of the wider context, and some of these may be changing at a rate comparable

25
to that of the situation itself. Moreover, some long latency processes may appear insignificant
within the situation but ultimately produce serious consequences.
Both the situation and the wider context contain entities (people, groups, systems) which act in
their own interests and react to support or oppose every intervention in the problem, in ways
that cannot be precisely predicated.
The propagation lengths of disturbances may span the entire situation and its wider context -
i.e. local changes may have global effects. As a corollary the impact of local interventions
must be evaluated in the global context.
Most seriously, the number of possible “solutions” grows at least exponentially with the
number of entities in the situation creating a huge possibility space which cannot be pre-stated
or analyzed in any compact way.
The duration of such problems tends to be ongoing-there is a continuing need to influence and manage
the situation, rather than solving it once and for all. This implies the need for a system to enable the
continuous management of the situation (Joseph K. De Rosa et al, 2008).
3.11.1 Complexity in production systems
Future production systems need to be extremely flexible but still remain efficient. Mass customization
of consumer products increases the number of product variants, shortens product cycles, and
frequently results in increasingly complex production systems. This is a major contribution to
complexity. In order to handle challenges related to production complexity, new support is needed for
measurement and development of work towards efficiency, highly flexible and sustainable production.
The production complexity in assembly systems therefore needs to be defined, described and broken
down into relevant components that can be used for measurements, analyses and support tool for
development (T. Fässberg et al, 2011). T.Fässberg et al, 2011 proposed a framework based on a
literature study which takes a holistic view on production complexity acknowledging the need to
account
Complexity drivers; Causes/complexity parameters
The production context
Objective and subjective complexity
Impact and effects of complexity
Complexity management

26
Figure 7: Complexity Framework
In the context of the production system, complexity drivers and causes may be initiated by external
changes (new product, equipment) or from within the system (e.g. schedule or routing changes).
Regarding objective production complexity, measurable parameters are important since they provide a
hint of complexity as several experiences it independent of who the user is. Objective data can capture
both dynamic and static aspects of complexity. The static complexity of a system or a sub-system can
be modeled measuring parameters such as number of stations, work tasks, parts and Levels of
Automation. The dynamic complexity is modeled in order to include time and dynamics, like
deviations from plans, and uncertainty.
Regarding subjective complexity, the same production system or situation maybe perceived in a
different way depending on a number of different factors such as individual skills, competence and
experience.
Perceived complexity is in research closely related to managing and handling critical events,
production disturbances, frequent changes, new unknown situations, unpredicted situations, and
difficult work tasks as problem solving. As production systems become more complex there is more
that can go wrong in several ways, and is increasingly difficult to predict faults (T. Fässberg et al,
2011).
As we can see several factors account for production complexity. The study of production complexity
in itself is complex. It is therefore of great importance to study the different aspects that account for

27
this complexity. Understanding complexity will help formulate strategies and models to deal with
future complexity challenges.

28
4 RESEARCH PROCESS AND PRACTICAL STUDIES
4.1 COMPLEX Project
The COMPLEX project, as mentioned earlier is an alliance between SWEREA IVF and several
stakeholders in the industry who are working towards dealing with future production challenges. This
project specially wishes to address the issue of production complexity. It attempts to define
„Complexity‟ and identify ways and means of managing this complexity.
This project will develop generic models and methods to support strategies, planning, managing and
optimizing of complex production. The added complexity will be studied and a definition of
complexity will be developed along with methods to mange complexity, competence and information
requirements. The principal investigators and project leader is SWEREA IVF in collaboration with
Chalmers, Volvo cars, Parker Hannifin, Stoneridge Electronics and AB Volvo. The project is carried
out from 2009-12-01 to 2013-06-30 with a total budget of 12 MSEK.
Continual demands on production are quality, cost production volume, deliverability, enhanced
efficiency and added flexibility. In addition, a major challenge for the industry is to achieve
sustainability. The new range of products that reduce environmental impact requires new production
methods and challenges the entire production value chain, increasing complexity of products and thus
processes and production. The overall goal is to support management of dynamic production changes
and added complexity, thus optimizing the use of production resources towards sustainability.
For example, introduction of new engines (hybrid, electrical) in production of passenger cars is
expected to lead to an acute increase of the number of components and variants in parallel, shorter life-
cycles for products, and frequent changes (in technology, products, processes and suppliers). This
affects the processes and the whole production flow, body shop to assembly. Volvo Cars Corporation
expects the number of car components to increase by 50-100% within 3 years.
Understanding „Complexity‟ and finding ways to tackle it is therefore of great importance in the
context of prevailing diverse and dynamic markets.
Continuous re-balancing and optimization of the production system is necessary to deal with the
different product mixes and new variants. In the industry IT tools for line balancing are available but
analysis procedures are still inefficient. As the frequency of re-balancing will radically increase,
further development of methods and tools is certainly required.
Standardized operation instructions are important in order to ensure efficiency and quality assurance.
These are not easily maintained or updated in case of changes made. Thus a risk of increased
production complexity is adding difficulty of using work standards.

29
It is therefore evident that the rise in new products with shorter life cycles will challenge existing
production systems. The need for production systems to be flexible and deal with varying degrees of
complexity therefore becomes fundamental for the evolution of production systems. The COMPLEX
project addresses these challenges and ways to deal with them.
4.2 Electrolux at Mariestad
The Electrolux factory in Mariestad produces refrigerators and freezers. The products manufactured at
this plant cater primarily to the Nordic market. They currently produce 153 different products. They
produce the following brands at this plant; AEG, Husqvarna, Electrolux, Elektro Helios and Rosenlew.
The production of several different brands under the same roof adds to the complexity of the
production process.
The existing system is based on push production and hence results in significant buffers. In an effort to
make the process more cost-efficient and flexible to deal with dynamic markets, the factory has
undergone significant renovation in the past one year. This renovation was carried out with the aim of
achieving the following goals:
Reduce facility space by 40%
Reduce work in progress by 50%
Reduce direct man hours working on cabinets by 15%
Reduce indirect manning by 20%
There earlier existed 5 assembly lines on which both refrigerators and freezers were produced. They
now have two assembly lines. One is dedicated to the production of refrigerators and the other to the
production of freezers. As a result the assembly lines are much longer. This eliminates lot of transport
and material handling as compared to the earlier assembly lines which were shorter but this new
configuration poses a different set of challenges. As the assembly line now consists of many more
stations (60 stations) it is important to ensure that all the stations are able to produce to the takt in
order to prevent disruptions along the assembly line.
Several changes being implemented at the same time have presented many obstacles to the smooth
running of the plant. The introduction of new products accompanying the above changes has presented
problems not only on the material handling, layout, flow and balancing front but also on the personnel
front.
The factory layout before the renovation is as shown below:

30
.
Figure 8 - Old Layout
After the renovation the assembly area was moved to a different location as shown above. This was
carried out in order to free up space. The freed up space will be rented out to suppliers. The new layout
is as follows:
Figure 9 - Current Layout

31
Several operations are carried out before the final assembly. We can see in the above figure the
locations of all these operations with respect to the new assembly lines.
4.3 Presentation of the new assembly line
One of the objectives of the thesis is to compare the line balancing times generated by Electrolux with
actual ones to observe the deviation. For this purpose a model with PNC 927150531 was chosen. It
was carried out only for a single model because of the time constraint and unavailability of a several
PNC‟s produced in large batches so that we may follow them through all the stations on the assembly
line.
It also analyzes testing stations and the stations that follow it on the refrigerator line and the testing
stations on the freezer line to provide a comparison between the testing stations on both the lines. The
focus is on improving the efficiency of the stations and optimize them irrespective of the model or
PNC being assembled. We have therefore tried to do a generic analysis of the stations with respect to
operating times, work content and cycle times.
In order to carry out the research we carried out time studies and work content analysis. In order to
carry out the time studies we used an excel program to make time stamps at different stages during
work at the assembly stations. In order to carry out the work content analysis we filmed the operators
at work and then analyzed them. The stations we chose had operations which were mostly generic
with a few exceptions for certain variants.
The new assembly layout consists of two dedicated assembly lines as stated earlier; one each for
refrigerator and freezer assembly. Each assembly line consists of 60 stations, but product does not go
through all the stations during assembly. Every product goes through an average of 28-32 stations
before it leaves the assembly line. The new assembly lines are as follows:
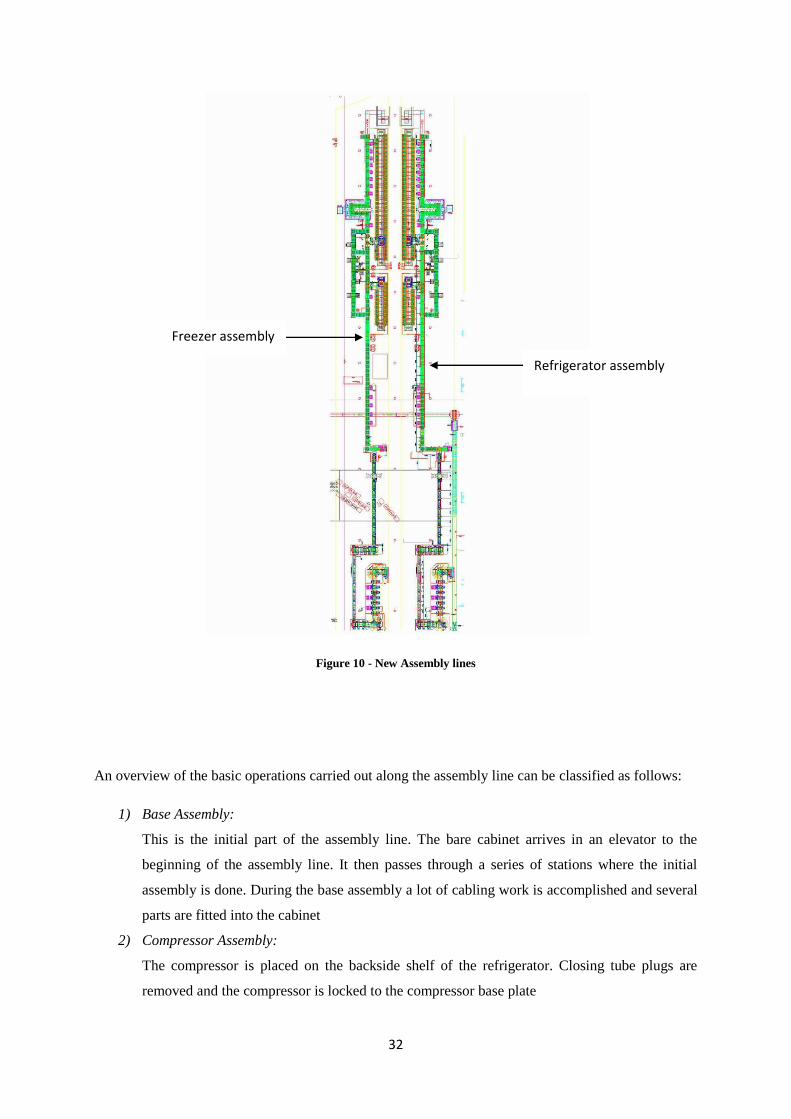
32
Figure 10 - New Assembly lines
An overview of the basic operations carried out along the assembly line can be classified as follows:
1) Base Assembly:
This is the initial part of the assembly line. The bare cabinet arrives in an elevator to the
beginning of the assembly line. It then passes through a series of stations where the initial
assembly is done. During the base assembly a lot of cabling work is accomplished and several
parts are fitted into the cabinet
2) Compressor Assembly:
The compressor is placed on the backside shelf of the refrigerator. Closing tube plugs are
removed and the compressor is locked to the compressor base plate
Refrigerator assembly
Freezer assembly

33
3) Evacuating, testing and filling:
This part starts with the evacuation of the system. If the evacuation has been carried out
correctly and there are no inconsistencies, it then moves to the filling station. After the filling
process and leak testing the cabinet goes to the testing area. After the test, cabinets with any
defects or malfunction go to the repair area parallel to the testing area.
4) Variant assembly:
This is the very end of the assembly line and here the refrigerator gets shelves, trays, holders.
The operators at these stations look at a paper in the cabinet which says which refrigerator
needs what add-ons. They pick these out manually from the different components available to
them and place them in the refrigerator. The last station at the end of this line also serves as a
check point to ensure that the entire assembly has been carried out correctly.
5) Packaging:
In the packaging section the refrigerators are packed in Styrofoam and then sent to a plastic
film heater which encases it in plastic before it is sent to the storage.
This thesis focuses on stations at the end of the assembly line comprising the testing and the variant
area.
4.3.1 Testing Area:
In the testing area the products are tested on several parameters that need to be satisfied in order to
certify that they are functioning well. Each and every product is tested before it goes to the next stage
in the assembly line. The duration for which they are tested differs from model to model and ranges
between 30 and 60 minutes. The parameters on which they are tested are as follows:
Ambient temperature
Power
Phase shift factor
Air temperature inside
Condenser temperature and
Compressor temperature
There are two work stations associated with the testing area:
Station 50 (Test in):
At this station the operator clips two thermocouples on the back of the refrigerator and a third
thermocouple inside the refrigerator on the door. The plug is then inserted into the socket provided on
the table on which the refrigerator stands. The refrigerator then moves on the conveyor to the testing
area where it is tested for a certain duration based on the model. Here it is checked for various cooling
parameters that need to be satisfied.

34
Station 51 (Test out):
After the refrigerator comes out of the testing area it arrives at station 51. At this station the operator
unplugs the refrigerator from the socket, removes all the thermocouples and winds them up before
clipping or hanging them on the stand. The empty stand then moves back to station 51 and the
refrigerator moves to the next station. A refrigerator that fails the test is taken out of the line. It is then
checked and repaired before it enters the assembly line. It re-enters the assembly line before station 50.
Station 52:
The refrigerator on passing the test, exits station 51 and enters this station. At this station wheels are
put on the refrigerator. There are two kinds of wheels which are put on all the refrigerators. The door
of the refrigerator is then opened and kept open at an angle using a door opener. After this set of
operations the refrigerator leaves this station to enter an oven where it is dried.
4.3.2 Variant area:
The variant area consists of 8 assembly stations out of which 4 are used. In this section the refrigerator
gets shelves and holders. There are a lot of different variants present in this area depending on the
brand of the refrigerator. There is also an element of sub-assembly work involved here with certain
variants. The station at the end of the line checks to ensure that all the assembly that has taken place
along the line has been done correctly.
Station 53:
At this station the refrigerators get compartments, holders and shelves. There are a total of 14 different
components present at this station. Certain variants involve sub-assembly work to be carried out
before the parts are put in the refrigerator.
Station 56:
At this station the glass shelves are put in. There are 5 different kinds of glass shelves, based on the
brands of the refrigerators.
Station 58:
Egg trays, butter trays covers, butter tray bottoms and door pockets are put on here.There are 9
different components to choose from here.
Station 60:
At this station which is the final station on this assembly line, an instruction sheet is stuck on the door,
the door opener is removed. The operator then checks to ensure that the right shelves have been placed
in the refrigerator and that all the assembly has been carried out correctly.

35
4.5 Dynamo Methodology
Dynamo Methodology is used to gather information and decide the automation level in production
systems. As shown before in Table 3 the methodology has nine steps to be implemented.
The Dynamo Methodology
10. Plan ahead before the measurement
11. On-site, start with a pre study to identify the process
12. Visualise and document the production flow
13. Identify the main task for each section/cell
14. Identify the sub tasks for each station/cell
15. Measure LoA
16. Assess LoA, set relevant maximum and minimum levels
17. Analysis of results
18. Implementation
Table 3 – Dynamo Methodology steps
The following steps are done to have a complete knowledge about Level of Automation in line 73:
Step 1
For the first step all the requirements for the measurements are identified. In line 73, the testing
stations and those following it have been analyzed.Readings for two different operators were taken at
every station to take into account variation in operation times due to operator skill. In addition, the
work content sheets provided by CASAT PE Ver 3.2.0 are gathered and translated into English.
Step 2
A pre study is conducted to understand how much time is needed for a complete measurement and
stations are observed to have pre knowledge about the stations, operator characteristics and average
times to be expected.
Step 3
All the stations are analyzed, documented and recorded by “walking the process”. The main operations
done by the operator are noted and time for each operation is measured. Moreover, the mechanical and
cognitive tools for each station are documented for further studies. For the detailed work analysis and
HTA the video recording are used.
Step 4
The main task for each station is noted with verification of every operation shown in the work content
sheets taken from Electrolux. Every extra or missing operation is documented.

36
Step 5
Through the video recordings Hierarchical Task Analysis is done and every sub task in each station is
documented and the operation times are measured (See appendix 1).
Step 6
Through the LoA reference scale and HTA, both mechanical and cognitive level of automation is
defined and documented. The values obtained in this step are used in VAT analysis and determination
of VA, nVA, nVAbn operations in the stations See appendix 1).
Step 7
In this step, the maximum and minimum LoA is decided according to the observations, thoughts of
Line balancing managers, operators and writers of this thesis. By doing this, the requirements,
performance of each station and the operation time differences between operators are taken into
account.
Step 8
After deciding the maximum and minimum LoA, the Square of Potential Improvements for every
operation is created and the possibility of the implementation of the suggested LoA is discussed with
the Line Balancing managers.
In the decision process the effects of the improvements, their costs-benefit analysis and the future plan
for production are taken into account.
Step 9
The suggestions are evaluated by the management team and some of the ideas are implemented
immediately, however some of them are left to be decided in the future. The suggestions can be seen
in the “Results” section.
4.6 Time study
Time study is used to determine the time required by a qualified and well trained person working at a
normal pace to do a specific task. In general the purposes of time studies are the number of machines
possible for one worker to operate, determining the machine efficiency, the number of operators at a
line process and as a help tool in balancing assembly lines and work done on a conveyor. (Akillioglu,
2008)
Time studies are of great importance to organizations although their value is generally underestimated.
For a decision be made the availability of data is a necessity. The need for time studies is hence
important to make any change / improvement to the process.

37
According to Chris A. Ortiz (2006) at least 8 samples must be taken for every task.
The time study for this thesis is done using three tools:
1) A stopwatch
2) A video camera to document the work content
3) An excel tool developed in visual basic by our colleague Vilhjálmur Alvar Þórarinsson to
make time stamps at different phases of an operation.
The time study was carried out for the following purposes:
1) To follow a single refrigerator along the assembly line 73 to compare actual times with
Electrolux times. This was done in order to see the deviation that exists in reality. For this
purpose a stop watch was used. The time for which an operator worked on the product at each
station was recorded. Multiple observations were made.
2) The excel tool was used to make time stamps at different stages at a work station to observe
how the time at a workstation was distributed. This data was in turn used to optimize the
stations.
An example of the data captured is as follows:
PNC
Time to
enter
station
Operator
ends
Leaves
station
Enters
next
station
Time for
which
operator
works
Time
spent on
conveyor
922164036 00:05 00:24 00:49 00:54 00:19 00:10
922164036 00:05 00:20 00:48 00:53 00:15 00:10
922164036 00:05 00:25 00:48 00:53 00:20 00:10
922164036 00:05 00:20 00:27 00:33 00:15 00:11
922164036 00:05 00:26 00:53 00:56 00:21 00:08
922164036 00:05 00:22 00:49 00:54 00:17 00:10
922643825 00:04 00:26 00:30 00:35 00:22 00:09
Table 4 – Example of the data sampling table
The above data was recorded for two operators at each station to take into account the
variation in operation times brought in by operator skill.
3) A video camera was used to film the work content, to capture the work sequence. This was
done with the following three objectives in mind:
a) In order to identify whether this work sequence conformed with the Electrolux defined
work sequence

38
b) To see if the work sequence followed by two different operators contributed to different
operation times and
c) To identify non value adding activities which can be eliminated and propose ways to make
the operation more efficient.
The validity of the time samples was checked with the help of an excel tool. The formula used is as
follows:
Where N 1
= required number of observations for given confidence and accuracy
N = actual number of observations recorded
x = each observed time element
This formula helps check whether the number of time samples taken are sufficient. Ther result from
the formula provides the number of required observations at 90% confidence level with a ± 10%
precision level.
The initial phase of finding a single product with large enough batch size took a fair amount of our
work and time. After which the constraints of time and batch size prevented us from recording several
time samples at every station. While we believe it would have been worthwhile to collect more data,
nevertheless the recorded data was still found to be of significance to Electrolux as well as SWEREA
for further research work.
4.7 Line Balancing
Throughout this thesis the focus was mainly timing the operation time of the stations, compare the
values and the balancing losses to the data provided by Electrolux. As mentioned before, the data in
this section belongs to the model with the PNC number 927150531. The reason behind is to observe
the balancing losses of one product through the entire line.
Electrolux uses the software CASAT PE Ver 3.2.0 to balance the lines and the software uses standard
times for general operations like screwing a bolt, crouching, picking a bolt etc. Moreover, the
experience of the operators facilitates quick operation times. Therefore, the deviation between
Electrolux times and observed times is inevitable.
The real time measurements are taken by a stop watch provided by Electrolux. The timing is started
when the operator starts to work on a cabinet. This means that the measured times include picking up a
tool or doing a sub assembly during the transportation between the stations. The aim of this technique

39
is to observe the idle time of the workers and how much time they spend when they do not attach
anything to the cabinet.
The times provided by Electrolux are in TMU values and since the stop watch was working in seconds
the Electrolux times needed to be converted into seconds. We decided to make the comparison in
seconds to make the visualization easier for a third person.
Electrolux aims to use 50 takt, thus cycle time of 72 seconds in general. However, after the station 43,
for evacuation and security test, the cycle time decreases to 60 seconds to compensate the long
transportation times between stations. Thus, after station 43, 60 sec is used to calculate the balancing
losses. The Table below shows the data from station 47, which is the 22nd
operation of the product.
Since the stations are after 43, all values are calculated by cycle time 60 sec.
Table 5 – Example of the balancing loss calculation table
4.7.1 Rebalancing
Line balancing is not a one-time task. Rebalancing the assembly line is a continuous process which
needs to be done on a regular basis in order to ensure the continuous improvement of the efficiency of
the assembly line. Rebalancing has to be done regularly taking into account the following factors:
1) New products
2) New variants
3) New Assembly equipment
4) Operator skill
5) Waste identification
We found that there was no existing system to measure the time taken by an operator to complete an
operation. Rebalancing a poorly defined job does not serve its purpose. It is therefore of immense

40
value to identify whether a task is inherently difficult to perform because of the complexity of the task
or if it is hard to perform because of the lack of operator skill. Knowing this will help make changes
accordingly to smoothen out the process and rebalance the line.
Identifying this can result in the following consequences:
1) To redesign the job itself so that it is easier to perform or distribute it among one or more
stations
2) Provide adequate operator training to ensure that all operators working on that station follow
the same work sequence resulting in similar operation times.
The above results will go a long way in helping to rebalance an assembly line.
4.7.2 Line balancing losses
The line balancing loss is the time wasted through the unequal allocation of work as a percentage of
the total time invested in the processing the product. (Slack et al., 2004) It is calculated through the
formula below:
As an example, the balancing loss according to Electrolux provided time for station 49 is:
In the old assembly line, the operator was responsible to keep up with the takt and press the push
button when they finish the job. In the new assembly line, a new system is introduced, where the
cabinet leaves the station automatically after the cycle time is over. The operators now press the stop
button only if they cannot finish the job in the given time.
4.5 Station analysis and Optimization
4.5.1 Value Adding Time (VAT) Analysis
As the Electrolux plant manager Frank Börkey emphasizes, to balance a line, waste has to be detected
and eliminated first. The aim of doing a Value adding time analysis is to have a picture of the

41
situation by detecting weather the operation is value adding, non value adding but necessary or non
value adding operation and reducing the non value adding operations as much as possible.
Value adding (VA) operations are the ones in which the process improves and adds value to the
product for the customer to be willing to pay for it (Andersson, Björnelund, 2010).
Non value adding but necessary (nVAbn) operations are activities which ensure that value adding
steps can be/has been properly completed (Andersson, Björnelung, 2010). In this thesis testing area is
mainly a non value adding but necessary operation, since it does not add value, but to continue the
value adding operations it is necessary to do.
Non value adding (nVA) operations are the activities that do not directly add more value to the
product. They are also referred as waste (Plenert, 2002).
To carry out the VAT analysis, the HTA of the stations 50, 51 and 52 are used and the VA, nVA and
nVAbn operations are detected.
A sample of the HTA is shown in Table 6 below. A green box means that the operations is value
adding, red one means that the operation is non value adding and orange one represents a non value
adding but necessary operation:
1.2 Station 51 Cabinet out
1.2.1 Transportation in
1.2.2 Unmount termoelement(static)
1.2.2.1 pick termoelement(static)
1.2.2.2 wind termoelement cable
1.2.3 Swivel cabinet for 180 degrees
1.2.4 Untape the door
1.2.5 Open door
1.2.6 Mount the DME Tack slice
1.2.6.1 pick DME Tack slice
1.2.6.2 attach DME Tack slice
1.2.7 Unmount termoelement(air)
1.2.7.1 deattach termoelement(air)
1.2.8 Close door Table 6 – Example of the VAT analysis
4.5.2 Station analysis
During the study the line balancing team informed us that the testing area is a bottleneck and the
stations afterwards are the most problematic ones. This section explains the observations and analysis

42
done to understand the problem in these stations, what can be done to overcome the problems and
explore the possibility of having a single operator run both the stations.
4.5.2.1 Testing stations (Station 50&51)
To have an overview of the problem, time studies and work content analysis are carried out in both the
stations. Moreover, the same analysis is performed for both freezer and refrigerator lines (Line 72 and
Line 73) to have a comparison between them. For these purposes we studied two different operators at
each station. Work content analysis was carried out by filming the operators and then identifying the
work sequence that was optimal. Time studies were carried out by using an excel program which
allowed as to make time stamps at different points in the cycle. The Table below shows a sample of
the time study for station 50, Cabinet in.
Time
taken to
enter the
station
Operator
stops
working
Product
Leaves End of conveyor
Time for
which
operator
works on
product
Time spent on
conveyor
00:05 00:37 00:51 00:57 00:32 00:11
00:06 00:40 00:55 01:01 00:34 00:12
00:04 00:36 00:54 01:01 00:32 00:11
00:05 00:37 00:51 00:57 00:32 00:11
00:05 00:46 00:55 01:02 00:41 00:12
00:07 00:43 00:56 01:02 00:36 00:13
00:05 00:41 00:56 01:02 00:36 00:11
00:06 01:46 03:29 03:36 01:40 00:13
00:05 02:18 02:29 02:34 02:13 00:10
00:05 00:34 00:46 00:52 00:29 00:11
00:05 00:41 00:50 00:57 00:36 00:12
00:05 00:40 00:53 00:59 00:35 00:11
00:05 00:40 00:55 01:01 00:35 00:11 Table 7 – Example of the time study with dramatically increased cycle times
The above is a sample of the data obtained for a certain operator at Station 50 for the refrigerator line
73. “Time taken to enter the station” is the time, in which a cabinet starts to move in to the station.
After it reaches the station and stops, the operators starts working immediately and finishes the job at
the time “Operator stops working”. Afterwards, at the time “Product Leaves”, the product starts to
move out of the station and at time “End of conveyor” it leaves the station fully.
In some cases the cycle time increases dramatically as marked in red and this was caused by the entry
of a frost free freezer. Normally, in line 73 always refrigerators are produced, but sometimes freezers
are produced according to the demand. The management team explains that this is a temporary process
and in the forthcoming weeks both freezers and refrigerators will be produced in their own line only.

43
In the work content analysis the operators are checked, if they follow the work order provided by
Electrolux or not. The table below shows the work content provided by Electrolux and the fastest
observed work sequence, which is followed by the operators, including the time spend for the whole
operation.
Work Sequence Comparison
S.No Electrolux-defined work sequence Fastest observed work sequence
1 Lift board Mount Termoelement(static)
2 Connect the power corde Swivel the cabinet for 180 degrees
3 Mount Termoelement Untape door
4 Mount Termoelement(static) Open door
5 Swivel the cabinet for 180 degrees Mount Termoelement(air)
6 Open door Close door
7 Mount Termoelement(air) Tape door
8 Close door Swivel the cabinet for 180 degrees
9 Swivel the cabinet for 180 degrees Lift board
10 Lower the board Mount Termoelement
11 Connect the power corde
12 Lower the board
Time
taken 43 Min: 27; Avg (29) Table 8 – Example of the work sequence comparison
4.5.2.2 Wheel station (Station 52)
For the wheel station the same analysis like testing area is done. We tried to observe how the operators
and different models affect the cycle and operation times for this station.
The Table below shows a sample of the data gathered:
PNC
Time taken to
enter the
station
Operator
ends
working
Product
leaves
station
927090320 6 53 64
927090320 5 47 62
927090325 4 55 57
927090325 3 60 65
927090325 5 50 58
927090325 4 50 61
Table 9 – Example of the data sampling for wheel station
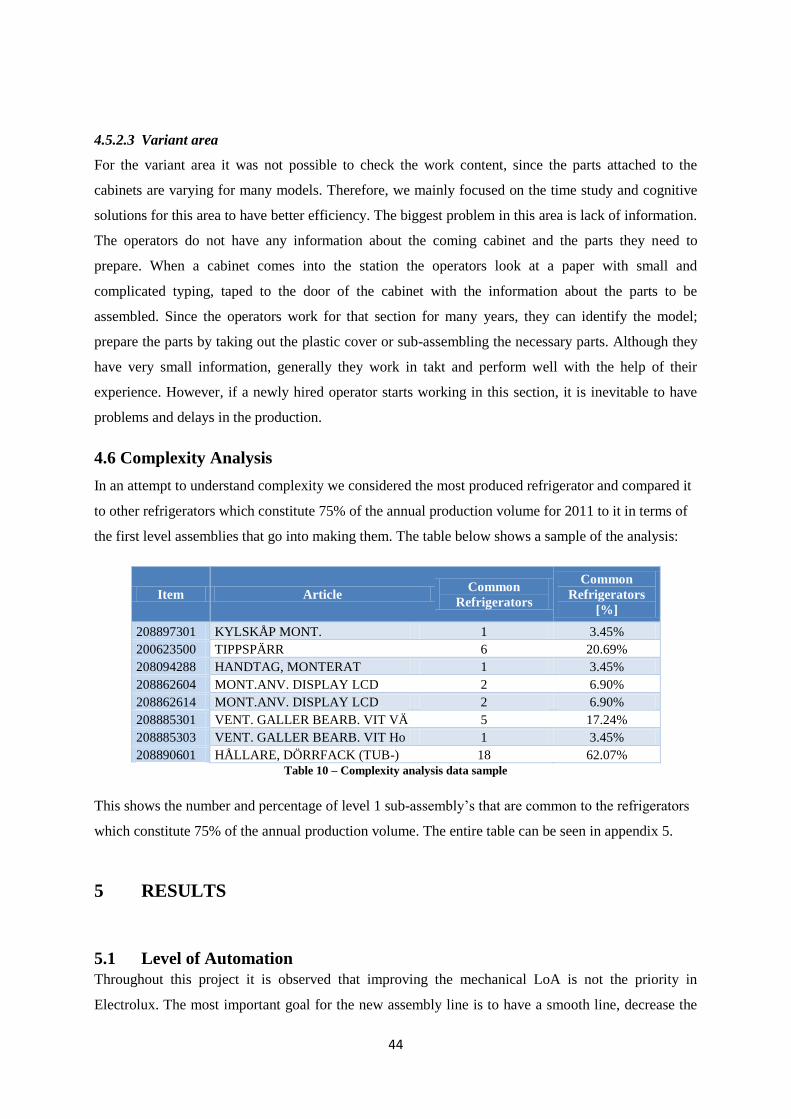
44
4.5.2.3 Variant area
For the variant area it was not possible to check the work content, since the parts attached to the
cabinets are varying for many models. Therefore, we mainly focused on the time study and cognitive
solutions for this area to have better efficiency. The biggest problem in this area is lack of information.
The operators do not have any information about the coming cabinet and the parts they need to
prepare. When a cabinet comes into the station the operators look at a paper with small and
complicated typing, taped to the door of the cabinet with the information about the parts to be
assembled. Since the operators work for that section for many years, they can identify the model;
prepare the parts by taking out the plastic cover or sub-assembling the necessary parts. Although they
have very small information, generally they work in takt and perform well with the help of their
experience. However, if a newly hired operator starts working in this section, it is inevitable to have
problems and delays in the production.
4.6 Complexity Analysis
In an attempt to understand complexity we considered the most produced refrigerator and compared it
to other refrigerators which constitute 75% of the annual production volume for 2011 to it in terms of
the first level assemblies that go into making them. The table below shows a sample of the analysis:
Item Article Common
Refrigerators
Common
Refrigerators
[%]
208897301 KYLSKÅP MONT. 1 3.45%
200623500 TIPPSPÄRR 6 20.69%
208094288 HANDTAG, MONTERAT 1 3.45%
208862604 MONT.ANV. DISPLAY LCD 2 6.90%
208862614 MONT.ANV. DISPLAY LCD 2 6.90%
208885301 VENT. GALLER BEARB. VIT VÄ 5 17.24%
208885303 VENT. GALLER BEARB. VIT Ho 1 3.45%
208890601 HÅLLARE, DÖRRFACK (TUB-) 18 62.07%
Table 10 – Complexity analysis data sample
This shows the number and percentage of level 1 sub-assembly‟s that are common to the refrigerators
which constitute 75% of the annual production volume. The entire table can be seen in appendix 5.
5 RESULTS
5.1 Level of Automation
Throughout this project it is observed that improving the mechanical LoA is not the priority in
Electrolux. The most important goal for the new assembly line is to have a smooth line, decrease the

45
down times and have a smooth flow. Therefore, this section focuses more on observations on the
cognitive LoA and suggestions about the same.
5.1.1 LoA Results for Stations 50, 51, 52
With the help of the Dynamo methodology and HTA, the LoA for the stations in testing area 50
(Cabinet in), 51 (Cabinet out), and station 52 (Wheels), are created. The step 5 of the Dynamo
methodology –identify the sub tasks for each cell/operation- cannot be applied to the variant area since
the parts assembled to the cabinets vary among most of the models in this section. Therefore, it was
not possible to identify the sub tasks and measure the LoA for each of them. General information
about the variant area will be given in section 5.3.2.3.
The figure below shows the sub tasks and measured LoA for station 52 (Wheels). The tables for
stations 50 and 51 can be seen in Appendix 1:
Mechanical Cognitive
Measured Times TMU
obs. min max obs min max
average min max
1.3 Station 52 Wheels 3 3 4 1 1 4
1.3.1 Transport in
5,4 5,4 5,5 150
1.3.2 Mount the wheels 3 3 4 1 1 4
15,2 14,4 18,6 422
1.3.2.1 pick wheels 1 1 1 1 1 1
1 1 1 28
1.3.2.2 put them in position 1 1 1 1 1 3
4,2 3,8 4,5 117
1.3.2.3 pick nippers 1 1 1 1 1 1
1 1 1 28
1.3.2.4 tighten wheels 3 3 4 1 1 4
7,8 7 9,5 217
1.3.2.5 put nippers back 1 1 1 1 1 1
1 1 1 28
1.3.3 Swivel cabinet for 180 degrees 1 1 5 1 1 1
3 2,8 3,1 83
1.3.3.1 push button 1 1 1 1 1 1
1 1 1 28
1.3.3.2 Swivel 1 1 5 1 1 1
2 2 2 56
1.3.4 Open door 1 1 1 1 1 1
2 1,8 2,1 56
1.3.5 Mount door holder 1 1 1 1 1 4
16,2 14,3 20 450
1.3.5.1 pick door holder 1 1 1 1 1 1
3 2,8 3,4 83
1.3.5.2 attach door holder to the board 1 1 1 1 1 4
4,2 3,8 4,5 117
1.3.5.3 clean vacuum cap 1 1 1 1 1 2
2 1,8 2,3 56
1.3.5.4 clamp holder to door 1 1 1 1 1 3
6,8 6,2 7,8 189
1.3.6 Press push button 1 1 1 1 1 1
1 1 1 28
1.3.7 Lower the board 1 1 1 1 1 1
3 3 3 83
1.3.8 Transport out
3,5 3,5 3,5 97
Table 11 – Example of the HTA with LoA
The cognitive LoA is always 1 because of the absence of a standardized work sheet and work order.
Through the interviews we learned that in the old assembly line there were work order sheets
explaining how the task should be achieved, however for the new assembly line the sheets were not
ready for the time being. Generally, for these stations the cognitive LoA can be maximum 4 with the
tools that verify if the parts are attached correctly.
For some operations like “pick wheels” and “push button” it is not possible to increase both
mechanical and cognitive LoA, since they are regular operations. For other operations like “tighten

46
wheels” both mechanical and cognitive LoA can be increased. For instance, the nipper used is manual
and it can be a hydraulic one. Moreover, for the cognitive LoA the wheel can be checked if they are
attached correctly as mentioned above.
These improvements for “1.3.2.4.tighten Wheels” can be shown by a square of possible improvements
(SoPI) as suggested in the Dynamo methodology for the potential maximum and minimum values.
Figure 11 – SOPI for station 52, sub operation “Tighten Wheels”
5.2 Line Balancing results
5.2.1 Difference between Electrolux provided times and observed times
This section is done for the model 927150531 for all the stations to identify the deviation that exists in
theoretical balancing data and actual balancing data. As mentioned earlier there is a deviation in
Electrolux provided operation times from the observed times. The following figure shows the
difference that exists.

47
Figure 12 – Operation Times
As seen from the figure there are time differences in every station throughout the assembly line. This
difference is mainly due to the experienced workers and the standard times Electrolux used for general
operations. Generally, the operators working in this area are in this factory for about 20 years and they
do the operation with big pace and confidence. In addition, the line balancing engineers use a data
sheet for general operations like screwing, pushing a button and crouching to prepare the work content
sheets and the software program CASAT PE ver 3.2.0 uses these datas, which is done by the
operators significantly faster.
The figure above also shows that the observed times are lower than Electrolux‟s times and since the
operation times are lower, the balancing loss for the observed times are more than expected as shown
in the figure below:
0.00
10.00
20.00
30.00
40.00
50.00
60.00
70.00
80.00
1 2 3 4 5 6 7 8 9 101112131415161718192021222324252627282930
Electrolux Data
Observed Data
Takt
Takt 72
Takt 60
Secon
ds
Operations

48
Figure 13 - Balancing Loss Comparison
As mentioned in section 4.7.2 Line Balancing, the formula for the balancing loss calculations is:
When the average of the balancing losses of all stations is calculated, we got the data:
This calculations show that the real balancing loss is more than twice of the expected one from
Electrolux.
In this project one of our aims was to look at the testing area for the availability to make one operator
work for more than one station. Through this data it can be concluded that some of the stations can be
optimized by combining them and making one operator work for these stations. Our calculations and
suggestions for the testing area are under the section “Station Analysis”.
0%
10%
20%
30%
40%
50%
60%
70%
80%
90%
100%
1 3 5 7 9 11 13 15 17 19 21 23 25 27 29
Electrolux Balancing Loss
Observed Balancing Loss
Operations

49
5.3 Station Analysis and Optimization
5.3.1 VAT analysis results
The VAT analysis shows that testing station is mainly consists of nVAbn operations, since in this area
no new part -except the DME tack slice- is assembled to the product. The nVA operations are the
transportation in and out of the station, and winding, unwinding of the cables. This operations can be
taken out of the work sequence by arranging the cable lengths or finding a way to wind them
automatically. The HTA showing VAT analysis can be seen in Appendix 1.
Measured Times TMU
average min max
1.2 Station 51 Cabinet out
1.2.1 Transportation in 4,6 4,5 4,8 128
1.2.2 Unmount termoelement(static) 2,2 2 2,6 61
1.2.2.1 pick termoelement(static) 1 1 1 28
1.2.2.2 wind termoelement cable 2,2 1 3 61
1.2.3 Swivel cabinet for 180 degrees 3 2,8 3,2 83
1.2.4 Untape the door 1 1 1 28
1.2.5 Open door 1,5 1,4 1,7 42
1.2.6 Mount the DME Tack slice 5,8 5,4 7,2 161
1.2.6.1 pick DME Tack slice 1 1 1 28
1.2.6.2 attach DME Tack slice 5 4,2 5,4 139
1.2.7 Unmount termoelement(air) 3 1,7 4,5 83
1.2.7.1 deattach termoelement(air) 3 1,7 4,5 83
1.2.8 Close door 1 1 1 28
1.2.9 Swivel cabinet for 180 degrees 3 2,8 3,2 83
1.2.10 Lift board 5,5 3,4 6 153
1.2.10.1 press the push button 5,5 3,4 6 153
1.2.10.2 wind termoelement cable 3,2 2,6 3,6 89
1.2.10.3 put termoelement to its place 1 1 1 28
1.2.11 Unmount termoelement(clamp) 3,5 2,7 4,2 97
1.2.11.1 deattach termoelement(clamp) 1 1 1 28
1.2.11.2 wind termoelement cable 2,8 2,5 3 78
1.2.11.3 put termoelement to its place 1 1 1 28
1.2.12 Unmount powder corde 3,2 3 3,4 89
1.2.12.1 put powder corde in plastic cap 3,2 3 3,4 89
1.2.13 Lower the board 3,3 2,4 3,5 92
1.2.13.1 press the push button 1 1 1 28
1.2.14 Transportation out 5,6 5,5 5,7 156
1.2.15 Board out 7 7 7 194 Table 12 – HTA showing VAT results
For station 51 in line 73, the average operation time without the transport times is 42 seconds. The
figure below shows the distribution of this time to VA, nVA and nVAbn operations:

50
Figure 14 – VAT distribution for station 51
5.3.2. Station analysis results
This part shows the results for the stations in the testing area, “Wheel” station and the variant area
with suggestions for improvement. These stations constitute the end of the assembly line as shown
below.
Figure 15 – Layout of the analysed stations
12%
20%
68%
VA
nVA
nVAbn
Variant area
Wheels station
Testing area
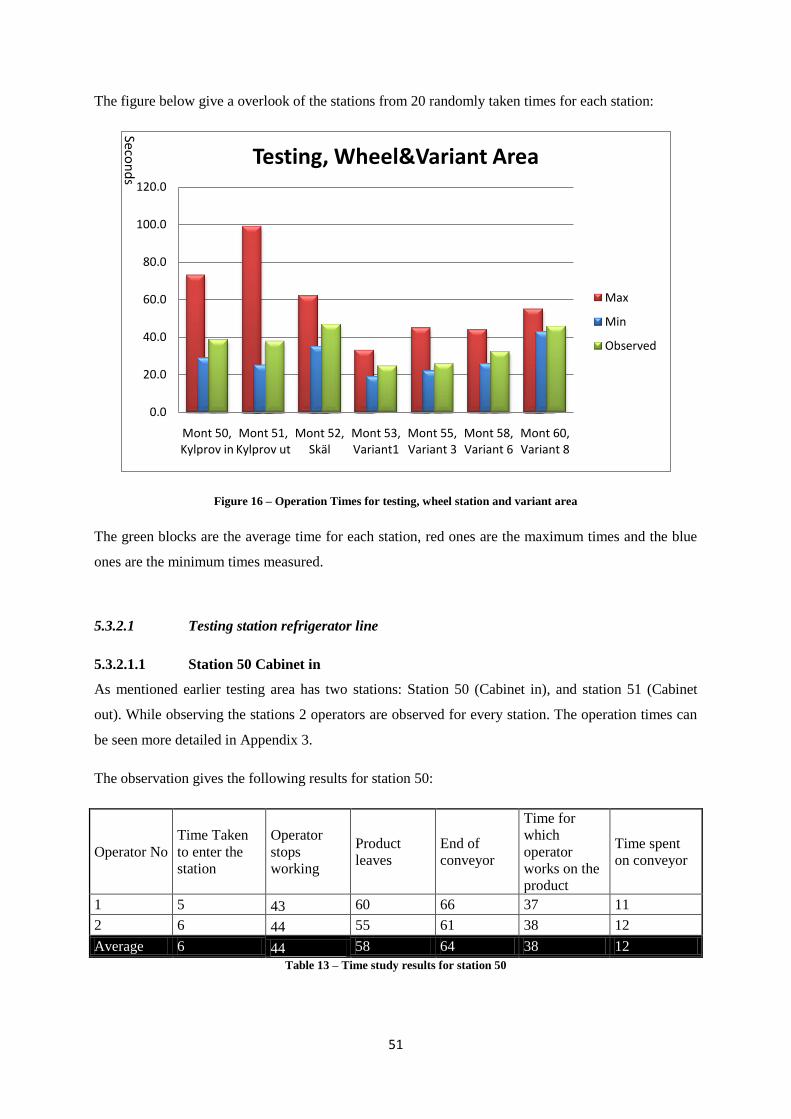
51
The figure below give a overlook of the stations from 20 randomly taken times for each station:
Figure 16 – Operation Times for testing, wheel station and variant area
The green blocks are the average time for each station, red ones are the maximum times and the blue
ones are the minimum times measured.
5.3.2.1 Testing station refrigerator line
5.3.2.1.1 Station 50 Cabinet in
As mentioned earlier testing area has two stations: Station 50 (Cabinet in), and station 51 (Cabinet
out). While observing the stations 2 operators are observed for every station. The operation times can
be seen more detailed in Appendix 3.
The observation gives the following results for station 50:
Operator No
Time Taken
to enter the
station
Operator
stops
working
Product
leaves
End of
conveyor
Time for
which
operator
works on the
product
Time spent
on conveyor
1 5 43 60 66 37 11
2 6 44 55 61 38 12
Average 6 44 58 64 38 12
Table 13 – Time study results for station 50
0.0
20.0
40.0
60.0
80.0
100.0
120.0
Mont 50, Kylprov in
Mont 51, Kylprov ut
Mont 52, Skäl
Mont 53, Variant1
Mont 55, Variant 3
Mont 58, Variant 6
Mont 60, Variant 8
Testing, Wheel&Variant Area
Max
Min
Observed
Secon
ds

52
This table shows that the operation times do not differ a lot for both operators. From this result we can
understand that both operators were equally skilled at this operation and hence kept the takt time.
Figure 17 – Comparison between operator work time, time on conveyor and other activities for station 50
An important thing we observed during the study is that the operators for the testing area were not
following the work sequence they got from Electrolux. They were working in different orders, which
they feel more comfortable. After observing different work sequences and timing them we found that
the work sequence shown in Table 14 is the fastest one:
Work Sequence Comparison
S.No Electrolux-defined work sequence Fastest observed work sequence
1 Lift board Mount Termoelement(static)
2 Connect the power corde Swivel the cabinet for 180 degrees
3 Mount Termoelement Untape door
4 Mount Termoelement(static) Open door
5 Swivel the cabinet for 180 degrees Mount Termoelement(air)
6 Open door Close door
7 Mount Termoelement(air) Tape door
8 Close door Swivel the cabinet for 180 degrees
9 Swivel the cabinet for 180 degrees Lift board
10 Lower the board Mount Termoelement
11 Connect the power corde
12 Lower the board
Time
taken (Electrolux) 43 Min: 27; Avg (38) Table 14 – Work sequence comparison for station 50
59%19%
22%
Station 50 Analysis
Operator working time
Time spent on conveyor
Other

53
5.3.2.1.2 Station 51 Cabinet out
The average results for station 51 are as follows:
Operator No
Time Taken
to enter the
station
Operator
stops
working
Product
leaves
End of
conveyor
Time for
which
operator
works on the
product
Time spent
on conveyor
1 4 34 55 61 30 10
2 5 37 47 57 32 6
Average 5 36 51 59 31 10
Table 15 – Time study results for station 51
As seen from the table the operators work for the same time period on the product like in station 50.
The difference in “the time spend on conveyor” comes from the fact that two different ending points
were considered in each of the cases. In case 1, the time spent on the conveyor included the time till it
reached the next station, whereas in case 2 it only included the time until it reached the buffer between
both these stations.
Figure 18 – Comparison between operator work time, time on conveyor and other activities for station 51
53%
17%
30%
Station 51 Analysis
Operator working time
Time on conveyor
Other

54
Like in station 50, the operators are not following the work sequence provided by Electrolux. Current
work sequence and the fastest observed work sequence are as follows:
Work Sequence Comparison
S.No Electrolux-defined work sequence Fastest observed work sequence
1 Lift board Unmount Termoelement(static)
2 Unmount termoelement(clamp) Swivel the cabinet for 180 degrees
3 Unmount power corde Untape the door
4 Swivel the cabinet for 180 degrees Open door
5 Open door Mount the DME Tack slice
6 Unmount termoelement(air) Unmount Termoelement(air)
7 Mount the DME Tack slice Close door
8 Close door Tape door
9 Lower the board Lift board
10 Swivel the cabinet for 180 degrees Unmount Termoelement(clamp)
11 Unmount Termoelement(static) Unmount power corde
12 Lower the board
Time
taken (Electrolux) 43 27 ; Avg (30) Table 16 – Work sequence comparison for station 51
The general observations for both stations are:
The workers spend a considerable time on winding and unwinding the cables of the testing
devices. Handling of cables at the stand is not simple and the length of the cables are longer
than required and hence takes more time than it should. Moreover, the cables need o be
winded every time not to touch the ground or get stuck at some place.
When there is a change in refrigerator model from right hinged to left hinged, plenty of time is
spent/ wasted on getting used to the change.
The cycle time increases drastically when a frost free freezer arrives. The testing operation for
frost free freezers is different than refrigerators and they need additional operations. An extra
cable needs to be attached to the inside of the cabinet and it should be taped to top part. To do
that, the worker needs to identify the frost free cabinet, unwind the extra cable and take a piece
of tape first and start attaching them, which increases the cycle time drastically as marked red
in Table 17;

55
PNC
Time
taken to
enter the
station
Operator
stops
working
Product
Leaves
End of
conveyor
Time for
which
operator
works
on
product
Time
spent on
conveyor
922446020 00:04 00:35 00:56 01:02 00:31 00:10
922446020 00:05 00:37 00:56 01:04 00:32 00:13
922446020 00:04 00:34 00:55 01:02 00:30 00:11
922446020 00:04 00:35 00:56 01:04 00:31 00:12
922446020 00:04 00:33 00:55 01:02 00:29 00:11
922446020 00:04 00:37 00:55 01:02 00:33 00:11
922446020 00:03 00:36 00:53 01:00 00:33 00:10
922270840 00:08 01:51 02:00 02:08 01:43 00:16
922446020 00:04 00:33 00:55 01:02 00:29 00:11
922446020 00:06 00:39 00:55 01:02 00:33 00:13 Table 17 – Time study with drastical increase in cycle time
It is good to document the fastest work sequence and standardize it.
5.3.2.1.3 Suggestions for Testing Area
We can see very clearly from the data that there is no reason for the above stations to be a bottleneck
in the assembly line. The following improvements will ensure that the stations can operate well within
the takt time:
Reduction of the wire length
Replacing the taping and untaping operation since it is time consuming
Simpler wire handling at the stand
Standardization of the work sequence
Skilled worker pool
Platform has to be lowered as soon as operator finishes working
The time between the departure of a cabinet from the workstation and the arrival of the next cabinet at
the same workstation is on an average 19 seconds for station 50 and 18 seconds for station 51. During
this time both operators cannot do anything. If a single operator is required to work both the station‟s
this waste of time is to be eliminated.
5.3.2.2 Testing station freezer line
The same analysis is done for the freezer line 72 in order to compare both lines and implement best
practices in the testing area. The difference between line 72 and 73 is that the operators in the testing
area work interchangably. This allows them to avoid winding and unwinding all the cables as they
exchange them as they interchange the stations. Moreover, most of the time they work on frost free
models, in which they need to attach an extra cable for testing.
5.3.2.2.1 Station 50 Cabinet in
Time study for station 50 is as follows:

56
Operator No Time taken to
enter the station
Operator
stops
working
Product
Leaves
End of
conveyor
Time for
which
operator
works on
product
Time
spent on
conveyor
1 6 44 53 59 39 12
2 5 54 60 66 49 12
Average 6 49 57 63 44 12
Table 18 – Time study results for station 50 freezer line
This time it is observed that there is a 10 seconds difference between operators. In the freezer line lots
of frost free freezers are produced and attaching the testing equipment requires more skills than the
ones in refrigerator line. Therefore, mostly operation time varies between operators.
Figure 19 – Comparison between operator work time, time on conveyor and other activities for station 50 in line 72
69%
19%
12%
Station 50 Analysis
Operator Working time
Time on conveyor
Other

57
Like in the refrigerator line, the work sequence differs from operators to Electrolux provided work
sequence sheets as show in Table 19 below:
Work Sequence Comparison
S.No Electrolux-defined work sequence Fastest observed work sequence
1 Lift board Mount Termoelement(static)
2 Connect the power corde Swivel the cabinet for 180 degrees
3 Mount Termoelement Untape door
4 Mount Termoelement(static) Open door
5 Swivel the cabinet for 180 degrees Mount Termoelement(air)
6 Open door Mount Termoelement(tape)
7 Mount Termoelement(air) Close door
8 Mount Termoelement(tape) Tape door
9 Close door Swivel the cabinet for 180 degrees
10 Swivel the cabinet for 180 degrees Lift board
11 Lower the board Mount Termoelement
12 Connect the power corde
Lower the board
Time
taken (Electrolux) 62 Min (33); Avg (44) Table 19 – Work content comparison station 50 freezer line
5.3.2.2.2 Station 51 Cabinet out
The Table below shows that the operator work time is the same for different operators. In this station,
unlike station 50, the operation does not require skill. The operators need to take out the testing
devices and the taped extra cable in order to finish the job.
Operator No
Time
taken to
enter
Operator
ends
Leaves
station
Enters
next
station
Operator
works
Time on
conveyor
1 4 29 36 41 24 9
2 5 28 40 45 23 10
Average 5 29 38 43 24 10 Table 20 – Time study results for station 50 freezer line

58
Figure 20 – Comparison between operator work time, time on conveyor and other activities for station 51 in line 72
Like in line 73, this station has different work sequence with the Electrolux provided one. The table
below shows the fastest observed work sequence, minimum and average time by the Electrolux
defined work sequence.
Work Sequence Comparison
S.No Electrolux-defined work sequence Fastest observed work sequence
1 Lift board Unmount Termoelement(static)
2 Unmount termoelement(clamp) Lift board
3 Unmount power corde Unmount Termoelement(clamp)
4 Swivel the cabinet for 180 degrees Unmount power corde
5 Open door Lower the board
6 Unmount termoelement(untape) Swivel the cabinet for 180 degrees
7 Unmount termoelement(air) Untape door
8 Close door Open door
9 Lower the board Unmount termoelement(air)
10 Swivel the cabinet for 180 degrees Unmount termoelement(untape)
11 Unmount Termoelement(static) Close door
12 Swivel the cabinet for 180 degrees
Time
taken (Electrolux) 55 Min: 23 ; Avg (24) Table 21 – Work Content Comparison station 51 freezer line
5.3.2.2.3 Suggestions for Testing Area
We can make all the suggestions given for the refrigerator line to the freezer line as well. The
difference between two lines is that due to the collaborated work of the operators they do not need to
wind and unwind the cables during the operation, which allows them to save time as compared to the
same station on line 73. In station 50 they do not spend time with the cables, however due to the taping
56%23%
21%
Station 51 Analysis
Operator working time
Time on coneyor
Other

59
and sticking the cable in the backside of the cabinet for the frost free models the average time is higher
than in line 73.
Another improvement for both stations can be achieved by using a simple suction cap instead of taping
the cable to the cabinet. With a suction cap it is easier to clamp the cable to the cabinet and due to its
low price (around 15 Euro for 50 suction caps) in long run it will be more effective than using tape.
Figure 21 – Suction cap
5.3.2.2 Station 52 Wheels
For the Wheels station time study results are shown in Table 22 below:
Operator No
Time Taken to
enter the station
Operator stops
working
Product
leaves
Time for
which
operator
works on
the product
1 5 47 60 42
2 6 56 68 51
Average 5 52 64 46 Table 22 – Time study results for station 52
The Wheels station is greatly dependent on the operator and in our observations we noticed that the
operation times increase dramatically when an operator is not well trained and have problems in
assembling the metal wheels, since the metal wheels require good skills to be assembled. This
observation is supported by the values in Table .. above. “Time for which operator works on the
product” differs by 9 seconds between two operators.
Moreover, the operators follow the work sequence they receive from Electrolux, however they do not
have any information on which wheel they need to assemble to which model. They identify the cabinet
with their experience and choose the right wheel. The operators do not make any mistake since they

60
are very experienced, but if a less experienced operator makes a mistake, it will not be possible to send
the cabinet to the repairing area since the cabinet has already passed station 51 to enter the area.
To solve these problems, a visual system can be introduced to the station, by which the model and the
wheels to be attached get identified. In addition, the workers can be offered training to enhance their
experience on assembling the wheels.
5.3.2.3 Variant area
As explained before, in variant section drawers and shelves for different models are assembled in three
stations, and in the last station another control is done before sending the cabinet to the packaging
area.
This area relies heavily on operator experience, in order to ensure error free work. Since there are
several components to pick from, they rely greatly on their existing knowledge of the products. Their
decision to choose the right component is supplemented by a sheet on the refreigerator, which mention
which component is to be picked. Because the sub-assembly work is also done by the operators, the
number of parts at each station increases. Removing the sub-assembly work from the stations would
free up space in order to organize the parts better. This would make for a better work space. Removing
the sub assembly work would also allow two operators to man the three stations.
Pick to Light System
A pick to light system would be a good solution to deal with the following problems:
Heavy reliance on operator experience and product knowledge
Having to look at the sheet of paper which states which product has to be picked out
Possibility of picking the wrong parts
New operators working at these stations
Cost Benefit Analysis
Cost of 3 pick to light control units: 25,000 * 3 = 75,000 SEK
Time spemt by a single operator on looking up the sheet : 5 seconds/per product
Time spent in one hour: 5*60(since 60 takt) =300 secs
Time spent in an 8 hour shift:= 2400 secs
Time spent by three operators in a single day = 2400*3 = 7200 secs
Assuming a 220 day work year, time spent annually = 220*7200secs = 440 hours
Wages per hour = 200 SEK

61
Cost involved = 88,000 SEK
5.3.3 Cognitive Solutions
In this section general suggestions are given to improve cognitive Level of Automation.
5.3.3.1 Standardized Work Sequence
The Electrolux factory is active for more than 40 years and most of the operators are working in this
factory for more than 20 years. They know the products very well and they do not seek for instructions
about the way of assembling different parts. Hence none of the operators follow an instruction sheet
they develop their own work sequence, which leads to work time differences between operators.
This situation is seen especially in the testing area by stations 50 (Cabinet in) and 51 (Cabinet out).
During the studies it is observed that in these stations the operators follow the assembly operations
which they find more comfortable and every operator has a different work time.
For the time being is not a big problem since the operators are experienced and working on the
products for many years. However, in the summer period the company will hire lots of temporary
workers due to the vacation breaks of the experienced workers and therefore there will be big
fluctuations of the work times for the inexperienced workers, until they figure out which work
sequence is more comfortable for them.
This problem can be solved by identifying the fastest operator sequence and standardizing this in
agreement with the other operators. Afterwards a standard work sequence sheet should be prepared
and the operators should be encouraged to follow these instructions at all times. In this way, the
variation in operation times due to different operators can be drastically reduced.
5.3.3.2 Performance Measurement
In the old assembly line the operators needed to push a button to signal the end of an operation and
then the station is ready for the next cabinet. In the new assembly line the system the cabinets enter a
station and stays there as long as the takt time, 72 seconds until the station 43, Pre evacuation and
Security Test, 60 seconds afterwards, and as soon as the takt time is over they move to another station.
The operator should press the stop button only if the job is not finished. For all the stations the data
about the frequency of stops are collected and then analyzed by the line balancing team to find the
bottlenecks and problematic areas. However, this data only provides knowledge about the time spent
in excess of the takt time to finish an operation but nothing about the actual operation time.
It is crucial to gather data about the operation and idle times for workers to be able to decrease the
balancing losses and have a more balanced assembly line; therefore a new system with 2 push buttons
can be implemented to measure the times. The operator should press the first button when he/she starts

62
working for the new product, and the second button when he/she finishes the job. Through this data
the time fluctuations between operators, by integration of a new product, the difference between the
time provided by CASAT PE Ver 3.2.0 and the real situation can be observed and analyzed.
However, this system will add extra work and this work will be a non value adding operation.
Therefore, it can be used only when the management sees it as necessary. Although it is a non-value
adding activity by definition it will give valuable data which will help rebalance the line based on real
data and not on theoretical data.
Figure 22 – Benefits of measuring actual operating times
5.3.3.3 Visual Support System
Electrolux has a very flexible factory with around 160 different products to fulfil the market demands,
however high flexibility brings along higher complexity. One of the other problems with the current
system is the operators need to identify the products before they come to the station and prepare for
that specific product. The cabinets are produced in batches of 20 and multiples of 20. This sequence is
preserved until the testing area, however after the testing area the cabinets can go to repair or a
repaired one can come in between cabinets. The operators after the testing area must see and prepare
for the coming model in couple of seconds.
Currently, the operators are very experienced and they can understand quickly which product is
coming, but there is always the risk of a mistake in identifying the product. Especially in the variant
assembly area the risk increases more than the stations before. To inform the workers about which
shelves are to be assembled in which model and where, an information sheet is taped to the door,
however this sheet is has a lot of detail which is not very comfortable to read and is hence time
consuming. Therefore, the operators generally look to the previous station or to the specific properties
of the cabinet like handles and hinges to decide which parts are needs to be assembled in order to pick
Actual operation times from assembly
stations
Consistently long times
Redesign work content,address
inherent complexity of the task
Consistently short times
Very less work content,possible
reallocation of work
No definite pattern
Variation in operator skill
Product specific complexity

63
them in advance from the large number of variants available to them. In this way they earn some time
to prepare before the cabinet comes to the station, but if the previous operator makes a mistake by
assembling a wrong piece, there is a chance that the forthcoming operators follow this mistake and
assemble the wrong components. To be able to deal with this problem a new system with monitors can
be used in the variants area. Since the sequence of the cabinets do not change after station 51 (Cabinet
out) in station 52 the barcode of the cabinet can be red and displayed in the variants section, thus the
operators have a clear idea which model is coming and which components are needed for that product.
To increase the cognitive LoA and make the operators‟ work easier this system should be supported by
a pick light system.

64
6 DISCUSSION
6.1 Discussion of results
6.1.1 Line balancing and LoA
Line Balancing was not the top priority in the old layout system, because previously in the old layout
there were several assembly lines and even if there was an error in one of the lines the others could
work uninterrupted. However, with the implementation of the new assembly line, Line balancing has
become more important since the new system has 60 stations in total and when a problem in one of the
stations occurs it affects every station down- and upstream, in this way the general production.
Therefore, now it is a priority in Electrolux to pay attention to Line balancing and make the system
work more efficiently.
Throughout this project it is observed that the main problems with the line balancing and the reasons
for balancing losses are the absence of standardized work, work time deviations between operators,
deviations between work content provided by Electrolux and the ones operators follow, non value
adding operations like long transportation between stations, lack of information about the performance
of the stations. To be able to deal with these problems the cognitive LoA should be increased and
information about the stations must be made available in order to rebalance according to the existing,
actual situation.
6.1.2 Complexity
This project mainly focuses on finding the optimum cognitive LoA to reduce the decision making by
the operators and providing the management team more information. Through our ideas and
suggestion on cognitive Level of Automation we also tried to tackle the driver, information, of
complexity. Today in Electrolux one of the biggest problems is the lack of information between
workers and management team. Therefore, it is observed that many a time the lack of information flow
causes the stop of the assembly line. We believe that our suggestions on standardized work, pick-to-
light system, performance measurement and visual support asystem will provide better information
flow between departments and improve the productivity.
6.2 Situation at Electrolux
Nowadays Electrolux factory is going through major changes. The factory has changed their assembly
system and it has affected all the departments from production planning to material handling and they
are struggling to keep up with the planned production. The new assembly line will increase the

65
efficiency and decrease the buffers in long run; however it has some side effects as well. A problem in
one station affects all the line and stops the production, which causes major losses in the daily
production. Moreover, the workers are trying to adapt to the new system and complain a lot about the
increase stress level and work load. In addition, the production will continue in summer and Electrolux
will hire temporary workers due to vacation breaks. These workers will have less experience and will
have huge problems since a standardized work schedule is not yet available.
The management team needs to try implementing the Lean thinking to the factory to solve these
problems. With the implementation of the new assembly system the buffers will be reduced, however
the factory has a huge inventory of finished and half finished products, which increases the costs
dramatically. In addition, the workers in many stations finish their jobs before the takt time and wait
for the next product to come into the station. Through Lean Manufacturing techniques like Continuous
Improvement, 5S, Total Quality Management, decreasing the non value adding operations for all
stations the company can increase its profit in great numbers. Moreover, a pull system with Kanban
cards would decrease the inventory and improve the production efficiency highly. In addition, as
discussed above, standardized work sheets for all stations need to be available to the workers as soon
as possible to minimize the operations time fluctuations between workers and have a smoother
production process.
6.3 Research Quality and problems faced
Electrolux uses the TMU units for all operations as a time unit and through the research and data
sampling all the measurements provided by Electrolux needed to be translated into seconds to be able
to compare the results, since in our observations a stop watch with time unit “seconds” is used.
Moreover, during the time measurements another problem was with the inconsistencies between the
work content provided by Electrolux and observed work sequence. In some stations some of the
operations were interchanged between stations and that made it hard to compare the real times and by
Electrolux provided ones.
Another problem faced during this thesis was long break downs in the assembly line. Since the
assembly line is newly established the material handling department struggled to keep up with the
pace and provide necessary parts for the new assembly lines, industrial cell line, and also the old
assembly lines, where the refrigerators with baskets were produced. Therefore, in the first weeks we
experienced difficulties to observe and time the production for a long period of time.
It also took us some time to decide the parameters of value which need to be timed. The timing
process itself was done accurately as possible but is not error free.

66
6.4 Further research
As stated before, Electrolux is going through major changes and they face lots of problems in this
period. Through this study we tried to find and solve problems mainly in the testing area and
afterwards in line 72, and we focused on assembly of only couple of models which are produced most
due to limited time and resources. This study would be a great support to Electrolux management team
if it can be extended to all the products in both lines. Measuring the cycle and operation times is a
comprehensive and tough job, but to understand the reasons for balancing losses and to eliminate them
these values need to be measured and noted for all the different products.
Measuring operation times for temporary workers over the summer will show the difference in
operation times between trained and untrained operators and provide an opportunity to identify the
information that needs to make available to an inexperienced operator which will allow him/her to
perform to the required mark in a new environment. It will also help understand the instructions and
information that need to be made explicitly available to everyone, which does not exist now because
majority of the operators are vastly experienced.
Moreover, due to the time limitation this project contributes the complexity project by making some
suggestions to decrease the complexity in information flow. The complexity analysis which was
carried out and described in section 4.6 can be further extended to focus on the product driver of the
complexity by analysing if the number of parts can be reduced if the number of base models can be
reduced which can lead to reduced buffers.

67
7 SUMMARY AND CONCLUSION
This project has looked to support Electrolux in this phase where they have adopted a new assembly
line which requires every station to keep to the takt. This being a new system has posed several
challenges to all the departments at Electrolux. It also analyzes the level of automation with particular
focus on the cognitive aspect in order to make information more readily available which is necessary
for the smooth running of the plant. Lastly we looked at re-balancing which is an ongoing and
continual activity and how best it can be done.
In order to support Electrolux we analyzed some of their stations which were their bottlenecks and
provided them with suggestions in order to optimize them. In our analysis we found that the ability
and sequence with which an operator performs a task has a significant effect on the operation times.
A huge portion of the workforce consists of vastly experienced workers who are familiar with the
systems and the products. Most of the operators „just know‟ what to do and how to do it because they
have been there for so long. With the arrival of a new workforce the plant will face significant
challenges in its present state because of lack of standardization and standard practices. We have tried
to address this problem in the variant area. By increasing the amount of information available about
how the task needs to be done, dependence on the experience of an operator can be reduced and the
task can be interchanged between several operators. This will have positive ramifications in the
summer months and with new employees. It will greatly strengthen the process in the long run.
Re-balancing which is a continual task is not done on the basis of concrete empirical data. We have
suggested that they employ a feedback loop from the assembly stations providing them with actual
operating times. Having actual operating times on which the rebalancing can be based is very
beneficial, since it is not based on theoretical data. Having actual operating times has the following
benefits, It can help identify whether a station is clocking high operation times because of the:
Inherent Complexity in performing the task
Operator inefficiency
In either case corrective action can be taken to rectify the situation.
In the event that there is a station clocking consistently low operating times, tasks can be spread out,
causing greater balance in the line.
The complexity analysis performed is a first step in identifying whether the number of components
can be reduced, or the number of base models can be reduced. A reduction that can be brought about
in either one of these will lead to lower buffers, lower level of inventory and will move forward in a
direction of less complex products. The complexity analysis carried out in this thesis pertains only to

68
the level 1 sub assemblies and is not detailed enough to give any conclusive results, but can be used as
a starting point for further research.

69
8 REFERENCES
1. Ainsworth, L., (2004). Task Analysis. Sandom, C., Harvey, R., Human Factors for Engineers.
Retrieved from: http://books.google.com/
2. Akillioglu, A. H. (2008). PROACT PROJECT Dynamo Methodology and its applications @
Rexroth Bosch. Industrial Engineering and Management. Stockholm, Sweden: Kungliga
Tekniska högskolan
3. Alsterman, H. (2010) Operations Management:MG2205 [Lecture Notes] Stockholm, Sweden:
Kungliga Tekniska högskolan, Department of Production Engineering
4. Bar-Yam, Y. (2003). Unifying principles in Complex systems.
5. Christian Becker, Armin Scholl: A survey on problems and methods in generalized assembly
line balancing. European Journal of Operational Research 168(3): 694-715 (2006)
6. Dencker, K., Stahre, J., Fasth, Å., Gröndahl, P., Mårtensson, L., & Lundholm, T. (2008).
Characteristics of a Proactive Assembly System. Manufacturing Systems ans Technologies for
the New Frontier (p. Procedings of CIRP08). Tokyo: 41st CIRP Conference on Manufacturing
Systems.
7. Dencker, K., Stahre, J., Gröndahl, P., Mårtensson, L., Lundholm, T., Johansson, C. (2007). An
approach to Proactive Assembly systems, Paper from Assembly and Manufacturing. ISAM
'07. IEEE International Symposium, Retrieved from IEEE Explore
8. DeRosa, J. K. (2008). Anne-Marie Grisogono. Alex J. Ryan, Douglas 0. Norman, A Research
Agenda for the Engineering of Complex Systems, 2008 - IEEE International Systems
Conference
9. Falkenauer, E. (2005): Line Balancing in the Real World. Proceedings of the International
Conference on Product Lifecycle Management PLM´05, 360 – 370
10. Fässberg, T., Harlin, U., Garmer, K., Gullander, P., Fasth, A., Matsson,S., Dencker, K.,
Davidsson, A., Stahre, J. (2011) An empirical study towards a definition of production
complexity.
11. Fasth, A., 2009, Measuring and analyzing Levels of automation in assembly systems-For
Future production systems. Licentiate thesis, Department of Product and Production
Development, Chalmers University of Technology
12. Frohm, j. (2008). Levels of Automation in Production Systems, Göteborg, Sweden:Chalmers
University of Technology
13. Granell, V., Frohm, J., Bruch, J., Dencker, K., (2007). Validation of the dynamo methodology
for measuring and assessing levels of automation.
14. Heiser, J., Phan, D., Agrawala, M., Tversky, B., Hanrahan, P. (2004), Identification and
Validation of Cognitive Design Principles for Automated Generation of Assembly

70
Instructions, Proceedings of the working conference on Advanced visual interfaces., Retrieved
from ACM digital library.
15. James L.Riggs, J. L., (1999) Production systems: Planning, Analysis and Control
16. Köhrmann, C., Wiendahl, H. P., International Strategies used for availability optimization of
assembly systems, Journal for Manufacturing Science and Production. Volume 2, Issue 4,
Pages 217–226
17. Liker, J. K., (2004). The Toyota Way. 14 Management Principles from the World’s Greatest
Manufacturer. McGraw-Hill Books: New York
18. Mikler, J. (2010) Operations Management:MG2205 [Lecture Notes] Stockholm, Sweden:
Kungliga Tekniska högskolan, Department of Production Engineering
19. Mikler, J. (2010). Process Control and Management: MG2203 [Lecture Notes]. Stockholm,
Sweden: Kungliga Tekniska högskolan, Department of Production Engineering.
20. Nof, S. (2009). Springer Handbook of Automation. Automation: What is meant to us around
the world? Retrieved from Springerlink database.
21. Rampersad, H. K. (1995). An integral assembly model, Journal of Intelligent Manufacturing,
Volume 6, Number 1, 41-51, Retrieved from Springerlink database
22. Rother, M., & Shook, J., (2008), Learning to see: value stream mapping to create value and
eliminate muda. Retrieved from: http://books.google.com
23. Slack, N., Chambers, S., Johnston, R. (2004). Operations Management. Fourth Edition.
England: Prentice Hall.
24. Stanton, N. A., Salmon, P. M., Walker, G. H., Baber, C. and Jenkins, D. P. (2005) Human
Factors and Methods - A Practical Guide for Engineering and Design, Ashgate
25. Tolio, T. (2009). Design of Flexible Production Systems, Methodologies and Tools. Publisher:
Springer
26. Tzafestas, S. (2010). Human and Nature Minding Automation. Automation, Human, Nature
and Development. Retrieved from Springerlink database.
27. Wieringa, P. A., Stassen, H. G. (1999), Human machine systems. Transactions of the Institute
of Measurement and Control, Retrieved from Sage Publications
28. Wild Ray, (1980) Essentials of Production and Operations Management
29. Womack, J. P., Jones, D. T., (2003). Lean Thinking. Banish Waste and Create Wealth in Your
Corporation. Simon & Schuster: USA
30. Cambrigde Dictionary. Retrieved from:
http://dictionary.cambridge.org/
Akillioglu, H., PhD student IIP, KTH, Stockholm – mar 2011
71
Börkey, F., Plant manager, Electrolux, Mariestad, mar 2011
Eklund, J., Product development manager, Electrolux, Mariestad, mar 2011
Bloomberg, S., Production engineer, Electrolux, Mariestad, mar 2011
Burman, A., Production engineer, Electrolux, Mariestad, apr 2011
Soderberg, R., Production engineer, Electrolux, Mariestad, apr 2011
Dencker, K., KTH/SWEREA IVF, Stockholm – feb 2011
Backstrand, G., KTH/SWEREA IVF, Stockholm – apr 2011

1
9 APPENDICES
Appendix 1 HTA & LoA
This table shows the HTA for the testing area and the Wheels station (Stations 50, 51, 52) in the
refrigerator line
Mechanical Cognitive Measured Times TMU
obs. min max obs min max
average min max
1.1 Station 50 Cabinet in
1 1 2 1 1 4
1.1.1 Transport in
6 5,8 6,1 167
1.1.2 Mount termoelement(static) 1 1 1 1 1 3
4,2 3,4 7,8 117
1.1.2.1 pick termoelement 1 1 1 1 1 1
1 1 1 28
1.1.2.2 unwind termoelement cable 1 1 4 1 1 1
2 1 6 56
1.1.2.3 attach termoelement 1 1 1 1 1 4
1 1 1 28
1.1.2.4 pick termoelement(air) 1 1 1 1 1 1
1 1 1 28
1.1.3 Swivel cabinet for 180 degrees 1 1 5 1 1 1
3,7 3,3 4 103
1.1.4 Untape door 1 1 1 1 1 1
1 1 1 28
1.1.5 Open door 1 1 1 1 1 1
1,2 1 1,6 33
1.1.6 Mount termoelement(air) 1 1 1 1 1 3
3,2 2,4 4 89
1.1.7 Close door 1 1 1 1 1 1
1 1 1 28
1.1.7.1 arrange the cable length 1 1 2 1 1 1
1 1 1 28
1.1.8 Tape door 1 1 1 1 1 1
1 1 1 28
1.1.9 Swivel cabinet for 180 degrees 1 1 5 1 1 1
3 2,52 3,2 83
1.1.10 Lift board 1 1 1 1 1 1
6,3 5,4 9 175
1.1.10.1 press the push button 1 1 1 1 1 1
6,3 5,4 9 175
1.1.11 Mount termoelement 1 1 1 1 1 3
4,5 4 5,1 125
1.1.11.1 pick termoelement 1 1 1 1 1 1
1 1 1 28
1.1.11.2 unwind termoelement cable 1 1 4 1 1 1
2 1,5 4 56
1.1.11.3 attach termoelement 1 1 1 1 1 4
1 1 1 28
1.1.12 Connect the power corde 1 1 1 1 1 3
1 1 1 28
1.1.13 Lower the board 1 1 1 1 1 1
3,8 2,8 4,7 106
1.1.13.1 press the push button 1 1 1 1 1 1
1 1 1 28
1.1.14 Transport out
4,1 4 4,2 114
1.1.15 Board in
8 7,8 8,1 222
1.2 Station 51 Cabinet out
1 1 2 1 1 4
1.2.1 Transportation in
4,6 4,5 4,8 128
1.2.2 Unmount termoelement(static) 1 1 1 1 1 1
2,2 2 2,6 61
1.2.2.1 pick termoelement(static) 1 1 1 1 1 1
1 1 1 28
1.2.2.2 wind termoelement cable 1 1 4 1 1 1
2,2 1 3 61
1.2.3 Swivel cabinet for 180 degrees 1 1 5 1 1 1
3 2,8 3,2 83

2
1.2.4 Untape the door 1 1 1 1 1 1
1 1 1 28
1.2.5 Open door 1 1 1 1 1 1
1,5 1,4 1,7 42
1.2.6 Mount the DME Tack slice 1 1 1 1 1 4
5,8 5,4 7,2 161
1.2.6.1 pick DME Tack slice 1 1 1 1 1 1
1 1 1 28
1.2.6.2 attach DME Tack slice 1 1 1 1 1 2
5 4,2 5,4 139
1.2.7 Unmount termoelement(air) 1 1 1 1 1 1
3 1,7 4,5 83
1.2.7.1 deattach termoelement(air) 1 1 1 1 1 1
3 1,7 4,5 83
1.2.8 Close door 1 1 1 1 1 1
1 1 1 28
1.2.9 Swivel cabinet for 180 degrees 1 1 5 1 1 1
3 2,8 3,2 83
1.2.10 Lift board 1 1 1 1 1 1
5,5 3,4 6 153
1.2.10.1 press the push button 1 1 1 1 1 1
5,5 3,4 6 153
1.2.10.2 wind termoelement cable 1 1 4 1 1 1
3,2 2,6 3,6 89
1.2.10.3 put termoelement to its place 1 1 1 1 1 1
1 1 1 28
1.2.11 Unmount termoelement(clamp) 1 1 1 1 1 1
3,5 2,7 4,2 97
1.2.11.1 deattach termoelement(clamp) 1 1 1 1 1 1
1 1 1 28
1.2.11.2 wind termoelement cable 1 1 4 1 1 1
2,8 2,5 3 78
1.2.11.3 put termoelement to its place 1 1 1 1 1 1
1 1 1 28
1.2.12 Unmount powder corde 1 1 1 1 1 1
3,2 3 3,4 89
1.2.12.1 put powder corde in plastic cap 1 1 1 1 1 2
3,2 3 3,4 89
1.2.13 Lower the board 1 1 1 1 1 1
3,3 2,4 3,5 92
1.2.13.1 press the push button 1 1 1 1 1 1
1 1 1 28
1.2.14 Transportation out
5,6 5,5 5,7 156
1.2.15 Board out
7 7 7 194
1.3 Station 52 Wheels
3 3 4 1 1 4
1.3.1 Transport in
5,4 5,4 5,5 150
1.3.2 Mount the wheels 3 3 4 1 1 4
15,2 14,4 18,6 422
1.3.2.1 pick wheels 1 1 1 1 1 1
1 1 1 28
1.3.2.2 put them in position 1 1 1 1 1 3
4,2 3,8 4,5 117
1.3.2.3 pick nippers 1 1 1 1 1 1
1 1 1 28
1.3.2.4 tighten wheels 3 3 4 1 1 4
7,8 7 9,5 217
1.3.2.5 put nippers back 1 1 1 1 1 1
1 1 1 28
1.3.3 Swivel cabinet for 180 degrees 1 1 5 1 1 1
3 2,8 3,1 83
1.3.3.1 push button 1 1 1 1 1 1
1 1 1 28
1.3.3.2 Swivel 1 1 5 1 1 1
2 2 2 56
1.3.4 Open door 1 1 1 1 1 1
2 1,8 2,1 56
1.3.5 Mount door holder 1 1 1 1 1 4
16,2 14,3 20 450
1.3.5.1 pick door holder 1 1 1 1 1 1
3 2,8 3,4 83
1.3.5.2 attach door holder to the board 1 1 1 1 1 4
4,2 3,8 4,5 117
1.3.5.3 clean vacuum cap 1 1 1 1 1 2
2 1,8 2,3 56
1.3.5.4 clamp holder to door 1 1 1 1 1 3
6,8 6,2 7,8 189
1.3.6 Press push button 1 1 1 1 1 1
1 1 1 28
1.3.7 Lower the board 1 1 1 1 1 1
3 3 3 83

3
1.3.8 Transport out
3,5 3,5 3,5 97
This table below shows the HTA for the testing area and the Wheels station (Stations 50, 51, 52) in the
refrigerator line
Mechanical Cognitive
Measured Times TMU
obs. min max obs min max
average min max
1.1 Station 50 Cabinet in
1 1 2 1 1 4
1.1.1 Transport in
6,2 5,8 6,5 172
1.1.1.1 pick tape 1 1 1 1 1 3
2,2 2 2,4 61
1.1.1.2 pick termoelement(air) 1 1 1 1 1 1
1 1 1 28
1.1.2 Mount termoelement(static) 1 1 1 1 1 3
4,2 3,4 5 117
1.1.2.1 pick termoelement 1 1 1 1 1 1
1 1 1 28
1.1.2.2 unwind termoelement cable 1 1 4 1 1 1
2,1 1,5 2,5 58
1.1.2.3 attach termoelement 1 1 1 1 1 4
1 1 1 28
1.1.3 Swivel cabinet for 180 degrees 1 1 5 1 1 1
3,8 3,5 4 106
1.1.4 Untape door 1 1 1 1 1 1
1 1 1 28
1.1.5 Open door 1 1 1 1 1 1
1,2 1 1,6 33
1.1.6 Mount termoelement(air) 1 1 1 1 1 3
3 1,8 4 83
1.1.7 Mount termoelement(tape) 1 1 1 1 1 3
6 5,2 6,9 167
1.1.7.1 put the t. Element in the spot 1 1 2 1 1 4
4,2 3,5 4,6 117
1.1.7.2 tape the cable to the cabinet 1 1 2 1 1 4
2 1 2,5 56
1.1.8 Close door 1 1 1 1 1 1
3,6 3 4,2 100
1.1.8.1 arrange the cable length 1 1 2 1 1 1
3,6 3 4,2 100
1.1.9 Tape door 1 1 1 1 1 1
1 1 1 28
1.1.10 Swivel cabinet for 180 degrees 1 1 5 1 1 1
3 2,52 3,2 83
1.1.11 Lift board 1 1 1 1 1 1
5,5 4,6 6,4 153
1.1.11.1 press the push button 1 1 1 1 1 1
5,5 4,6 6,4 153
1.1.12 Mount termoelement 1 1 1 1 1 3
4,4 4 5,1 122
1.1.12.1 pick termoelement 1 1 1 1 1 1
1 1 1 28
1.1.12.2 unwind termoelement cable 1 1 4 1 1 1
2,4 2 3 67
1.1.12.3 attach termoelement 1 1 1 1 1 4
1 1 1 28
1.1.13 Connect the power corde 1 1 1 1 1 3
1 1 1 28
1.1.14 Lower the board 1 1 1 1 1 1
3,8 2,8 4,7 106
1.1.14.1 press the push button 1 1 1 1 1 1
1 1 1 28
1.1.15 Transport out
4,1 4 4,2 114
1.1.16 Board in
8 7,8 8,1 222
1.2 Station 51 Cabinet out
1 1 2 1 1 4

4
1.2.1 Transportation in
4,6 4,5 4,8 128
1.2.2 Unmount termoelement(static) 1 1 1 1 1 1
2,2 1,7 2,6 61
1.2.2.1 pick termoelement(static) 1 1 1 1 1 1
1 1 1 28
1.2.2.2 wind termoelement cable 1 1 4 1 1 1
1,5 1 1,8 42
1.2.3 Lift board 1 1 1 1 1 1
5,7 5,5 6,2 158
1.2.3.1 press the push button 1 1 1 1 1 1
5,7 5,5 6,2 158
1.2.4 Unmount termoelement(clamp) 1 1 1 1 1 1
3,7 3,3 4 103
1.2.4.1 deattach termoelement(clamp) 1 1 1 1 1 1
1 1 1 28
1.2.4.2 wind termoelement cable 1 1 4 1 1 1
1,5 1 2 42
1.2.4.3 put termoelement to its place 1 1 1 1 1 1
1 1 1 28
1.2.5 Unmount powder corde 1 1 1 1 1 1
2,2 2 2,4 61
1.2.5.1 put powder corde in plastic cap 1 1 1 1 1 2
2,2 2 2,4 61
1.2.6 Lower the board 1 1 1 1 1 1
3,2 3 3,5 89
1.2.6.1 press the push button 1 1 1 1 1 1
1 1 1 28
1.2.7 Swivel cabinet for 180 degrees 1 1 5 1 1 1
3 2,8 3,2 83
1.2.8 Untape the door 1 1 1 1 1 1
1 1 1 28
1.2.9 Open door 1 1 1 1 1 1
1,5 1,4 1,7 42
1.2.10 Unmount termoelement(air) 1 1 1 1 1 1
1,5 1 2 42
1.2.10.1 deattach termoelement(air) 1 1 1 1 1 1
1,5 1 2 42
1.1.11 Unmount termoelement(tape) 1 1 1 1 1 3
3,3 3 4,2 92
1.1.11.1 take out the tape 1 1 2 1 1 4
2,8 2,5 3,2 78
take out the cable
1 1 1 28
1.2.12 Close door 1 1 1 1 1 1
1 1 1 28
1.2.13 Swivel cabinet for 180 degrees 1 1 5 1 1 1
3 2,8 3,2 83
1.2.14 Transportation out
5,6 5,5 5,7 156
1.2.15 Board out
7 7 7 194
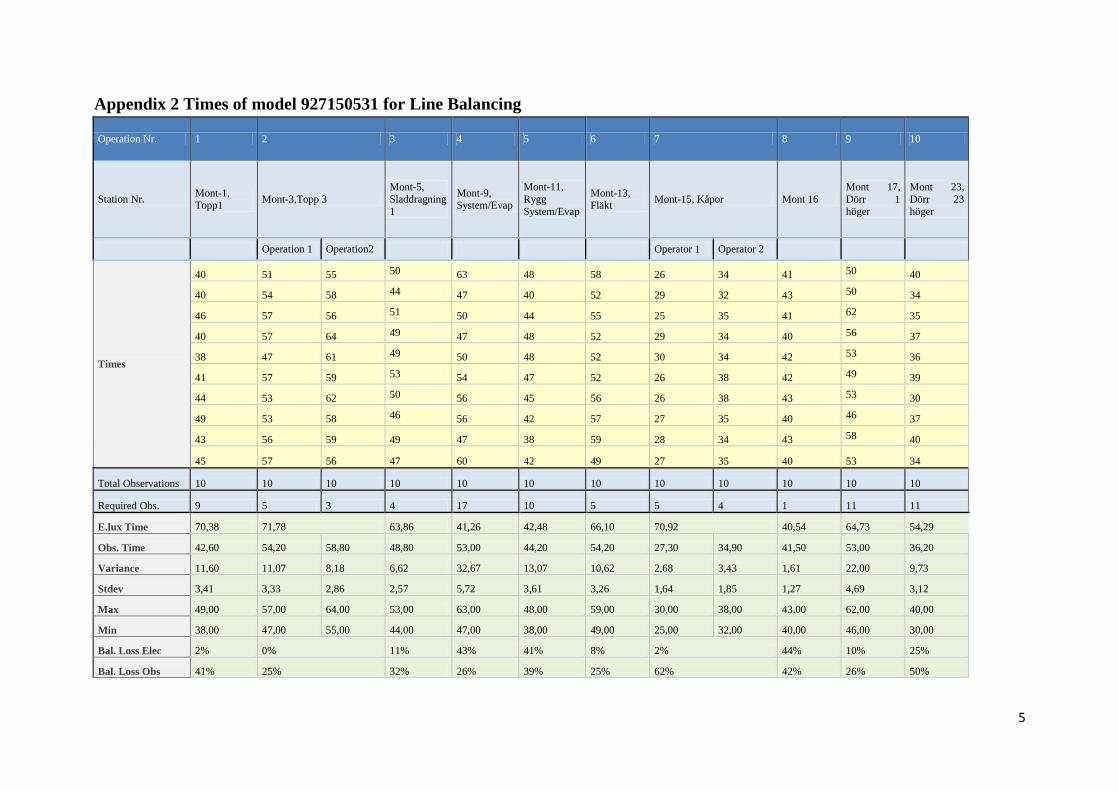
5
Appendix 2 Times of model 927150531 for Line Balancing
Operation Nr. 1 2 3 4 5 6 7 8 9 10
Station Nr. Mont-1, Topp1
Mont-3,Topp 3
Mont-5,
Sladdragning
1
Mont-9, System/Evap
Mont-11,
Rygg
System/Evap
Mont-13, Fläkt
Mont-15, Kåpor Mont 16
Mont 17,
Dörr 1
höger
Mont 23,
Dörr 23
höger
Operation 1 Operation2 Operator 1 Operator 2
Times
40 51 55 50 63 48 58 26 34 41 50 40
40 54 58 44 47 40 52 29 32 43 50 34
46 57 56 51 50 44 55 25 35 41 62 35
40 57 64 49 47 48 52 29 34 40 56 37
38 47 61 49 50 48 52 30 34 42 53 36
41 57 59 53 54 47 52 26 38 42 49 39
44 53 62 50 56 45 56 26 38 43 53 30
49 53 58 46 56 42 57 27 35 40 46 37
43 56 59 49 47 38 59 28 34 43 58 40
45 57 56 47 60 42 49 27 35 40 53 34
Total Observations 10 10 10 10 10 10 10 10 10 10 10 10
Required Obs. 9 5 3 4 17 10 5 5 4 1 11 11
E.lux Time 70,38 71,78 63,86 41,26 42,48 66,10 70,92 40,54 64,73 54,29
Obs. Time 42,60 54,20 58,80 48,80 53,00 44,20 54,20 27,30 34,90 41,50 53,00 36,20
Variance 11,60 11,07 8,18 6,62 32,67 13,07 10,62 2,68 3,43 1,61 22,00 9,73
Stdev 3,41 3,33 2,86 2,57 5,72 3,61 3,26 1,64 1,85 1,27 4,69 3,12
Max 49,00 57,00 64,00 53,00 63,00 48,00 59,00 30,00 38,00 43,00 62,00 40,00
Min 38,00 47,00 55,00 44,00 47,00 38,00 49,00 25,00 32,00 40,00 46,00 30,00
Bal. Loss Elec 2% 0% 11% 43% 41% 8% 2% 44% 10% 25%
Bal. Loss Obs 41% 25% 32% 26% 39% 25% 62% 42% 26% 50%

7
Operation Nr. 11 12 13 14 15 16 17 18 19 20
Station Nr. Mont 28, Rygg 1
Mont 31, Rygg 4
Mont 32, Rygg 5
Mont 33, Kompressor
Mont 34, Process 1
Mont 35, Process 2
Mont 37, Process 3
Mont 41, Process6
Mont 43,
Förevakuering,
Säkerhetstest
Mont 45, Funktionstest
Times
56 58 56 60 40 45 26 45 25 54
49 56 57 58 45 43 27 48 25 50
52 52 55 58 60 44 25 41 26 50
59 52 60 64 56 45 20 40 25 57
51 55 55 51 55 42 21 37 27 56
45 52 52 53 57 42 24 43 26 52
45 58 56 60 59 44 24 40 26 51
50 58 47 60 57 45 26 39 25 52
51 54 57 70 57 49 24 42 25 56
50 56 46 69 55 41 26 41 26 61
Total Observations 10 10 10 10 10 10 10 10 10 10
Required Obs. 10 3 10 15 20 4 12 8 1 6
E.lux Time 69,77 63,94 72,07 69,41 69,48 49,10 54,5 65,0 53,3 71,5
Obs. Time 50,80 55,10 54,10 60,30 54,10 44,00 24,3 41,6 25,6 53,9
Variance 18,62 6,32 20,10 37,12 41,21 5,11 5,1 9,8 0,5 12,8
Stdev 4,32 2,51 4,48 6,09 6,42 2,26 2,3 3,1 0,7 3,6
Max 59,00 58,00 60,00 70,00 60,00 49,00 27,0 48,0 27,0 61,0
Min 45,00 52,00 46,00 51,00 40,00 41,00 20,0 37,0 25,0 50,0
Bal. Loss Elec 3% 11% 0% 4% 3% 32% 24% 10% 11% 0%
Bal. Loss Obs 29% 23% 25% 16% 25% 39% 66% 42% 57% 10%
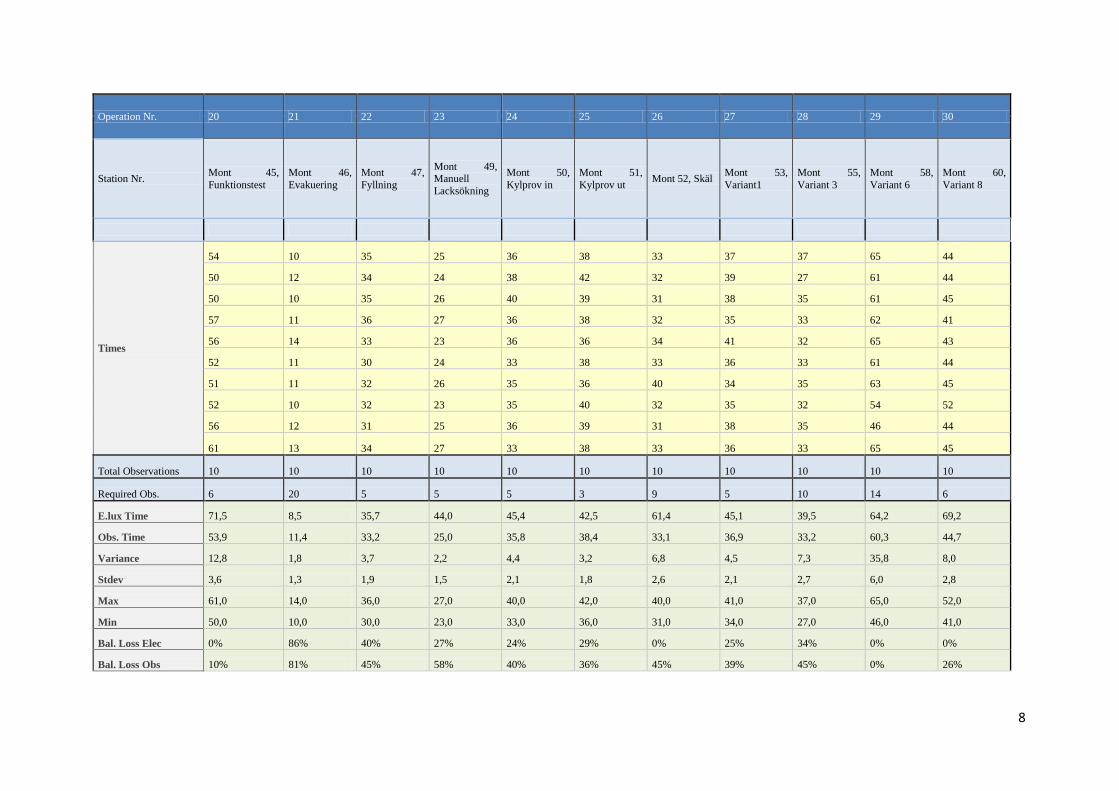
8
Operation Nr. 20 21 22 23 24 25 26 27 28 29 30
Station Nr. Mont 45,
Funktionstest
Mont 46,
Evakuering
Mont 47,
Fyllning
Mont 49, Manuell
Lacksökning
Mont 50,
Kylprov in
Mont 51,
Kylprov ut Mont 52, Skäl
Mont 53,
Variant1
Mont 55,
Variant 3
Mont 58,
Variant 6
Mont 60,
Variant 8
Times
54 10 35 25 36 38 33 37 37 65 44
50 12 34 24 38 42 32 39 27 61 44
50 10 35 26 40 39 31 38 35 61 45
57 11 36 27 36 38 32 35 33 62 41
56 14 33 23 36 36 34 41 32 65 43
52 11 30 24 33 38 33 36 33 61 44
51 11 32 26 35 36 40 34 35 63 45
52 10 32 23 35 40 32 35 32 54 52
56 12 31 25 36 39 31 38 35 46 44
61 13 34 27 33 38 33 36 33 65 45
Total Observations 10 10 10 10 10 10 10 10 10 10 10
Required Obs. 6 20 5 5 5 3 9 5 10 14 6
E.lux Time 71,5 8,5 35,7 44,0 45,4 42,5 61,4 45,1 39,5 64,2 69,2
Obs. Time 53,9 11,4 33,2 25,0 35,8 38,4 33,1 36,9 33,2 60,3 44,7
Variance 12,8 1,8 3,7 2,2 4,4 3,2 6,8 4,5 7,3 35,8 8,0
Stdev 3,6 1,3 1,9 1,5 2,1 1,8 2,6 2,1 2,7 6,0 2,8
Max 61,0 14,0 36,0 27,0 40,0 42,0 40,0 41,0 37,0 65,0 52,0
Min 50,0 10,0 30,0 23,0 33,0 36,0 31,0 34,0 27,0 46,0 41,0
Bal. Loss Elec 0% 86% 40% 27% 24% 29% 0% 25% 34% 0% 0%
Bal. Loss Obs 10% 81% 45% 58% 40% 36% 45% 39% 45% 0% 26%

9
Appendix 3 Times for Station Analysis
Table below shows the data for station 50 (Cabinet in) for Operator 1, refrigerator line:
PNC
Time taken to
enter the station
Operator
stops
working
Product
Leaves
End of
conveyor
Time for which
operator works on
product
Time
spent on
conveyor
927150821 00:05 00:32 00:45 00:51 00:27 00:11
927150821 00:05 00:40 00:55 01:01 00:35 00:11
927150821 00:05 00:40 00:52 00:58 00:35 00:11
927150821 00:05 00:38 00:57 01:03 00:33 00:11
927150821 00:05 00:40 00:49 00:54 00:35 00:10
922251220 00:02 01:13 01:23 01:30 01:11 00:09
927150821 00:03 00:29 00:49 00:55 00:26 00:09
927150821 00:05 00:36 00:47 00:53 00:31 00:11
927150821 00:06 00:37 00:48 00:54 00:31 00:12
927150821 00:05 00:40 00:55 01:02 00:35 00:12
927151021 00:05 00:32 00:54 01:00 00:27 00:11
927150821 00:05 00:41 00:55 01:01 00:36 00:11
927151021 00:03 00:35 00:54 01:01 00:32 00:10
927150821 00:05 00:34 02:14 02:20 00:29 00:11
927150821 00:06 00:35 00:48 00:54 00:29 00:12
927150821 00:05 00:35 00:55 01:01 00:30 00:11
927150821 00:05 00:38 00:56 01:02 00:33 00:11
927150821 00:05 00:34 00:47 00:53 00:29 00:11
927150821 00:05 00:38 00:55 01:02 00:33 00:12
927150821 00:05 00:35 00:55 01:01 00:30 00:11
927150531 00:05 00:41 00:55 01:01 00:36 00:11
927150531 00:05 00:42 01:12 01:18 00:37 00:11
927150531 00:06 00:41 00:55 01:01 00:35 00:12
927150531 00:05 00:35 00:53 01:00 00:30 00:12
927150531 00:06 00:43 00:56 01:03 00:37 00:13
927150531 00:06 00:40 00:56 01:02 00:34 00:12
927150531 00:05 00:41 00:56 01:03 00:36 00:12
927150531 00:05 00:37 00:48 00:55 00:32 00:12
927150531 00:08 00:35 00:46 00:52 00:27 00:14
927151021 00:06 00:42 00:52 00:58 00:36 00:12
927150531 00:05 00:42 00:56 01:02 00:37 00:11
927151021 00:06 00:37 00:52 00:58 00:31 00:12
927150531 00:05 00:55 00:59 01:00 00:50 00:06
927150531 00:05 00:37 00:51 00:57 00:32 00:11
927150531 00:06 00:40 00:55 01:01 00:34 00:12
927150531 00:04 00:36 00:54 01:01 00:32 00:11
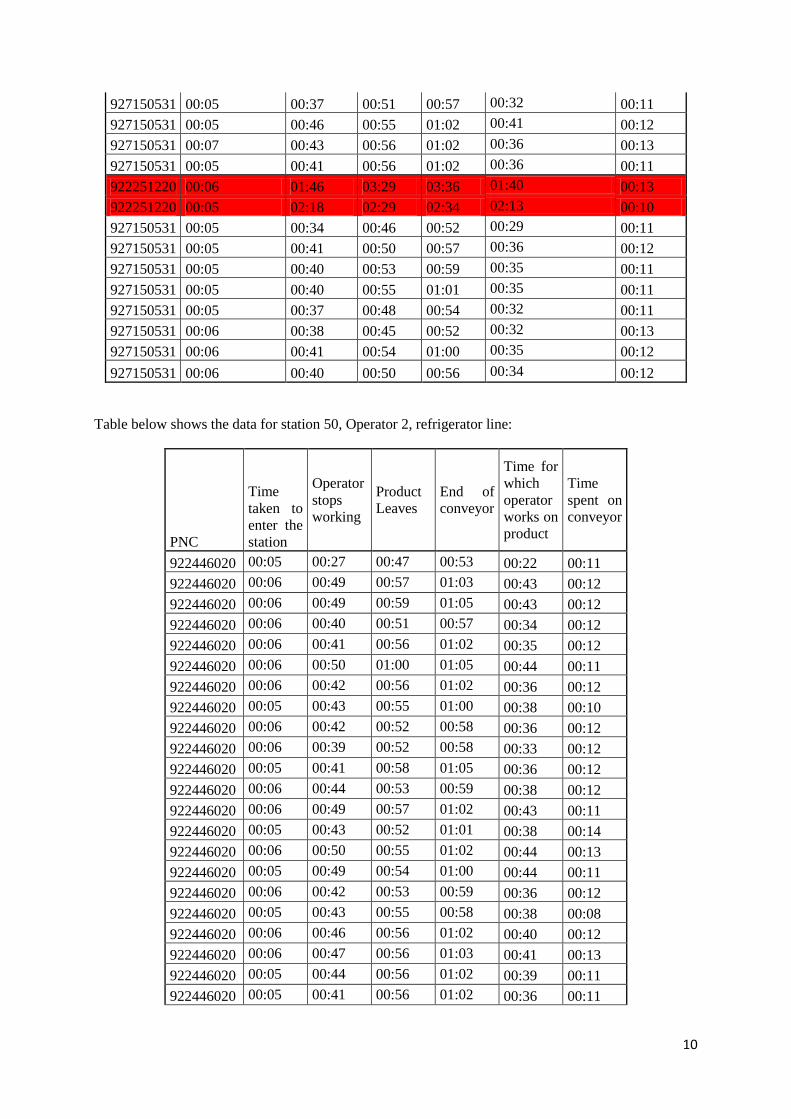
10
927150531 00:05 00:37 00:51 00:57 00:32 00:11
927150531 00:05 00:46 00:55 01:02 00:41 00:12
927150531 00:07 00:43 00:56 01:02 00:36 00:13
927150531 00:05 00:41 00:56 01:02 00:36 00:11
922251220 00:06 01:46 03:29 03:36 01:40 00:13
922251220 00:05 02:18 02:29 02:34 02:13 00:10
927150531 00:05 00:34 00:46 00:52 00:29 00:11
927150531 00:05 00:41 00:50 00:57 00:36 00:12
927150531 00:05 00:40 00:53 00:59 00:35 00:11
927150531 00:05 00:40 00:55 01:01 00:35 00:11
927150531 00:05 00:37 00:48 00:54 00:32 00:11
927150531 00:06 00:38 00:45 00:52 00:32 00:13
927150531 00:06 00:41 00:54 01:00 00:35 00:12
927150531 00:06 00:40 00:50 00:56 00:34 00:12
Table below shows the data for station 50, Operator 2, refrigerator line:
PNC
Time
taken to
enter the
station
Operator
stops
working
Product
Leaves
End of
conveyor
Time for
which
operator
works on
product
Time
spent on
conveyor
922446020 00:05 00:27 00:47 00:53 00:22 00:11
922446020 00:06 00:49 00:57 01:03 00:43 00:12
922446020 00:06 00:49 00:59 01:05 00:43 00:12
922446020 00:06 00:40 00:51 00:57 00:34 00:12
922446020 00:06 00:41 00:56 01:02 00:35 00:12
922446020 00:06 00:50 01:00 01:05 00:44 00:11
922446020 00:06 00:42 00:56 01:02 00:36 00:12
922446020 00:05 00:43 00:55 01:00 00:38 00:10
922446020 00:06 00:42 00:52 00:58 00:36 00:12
922446020 00:06 00:39 00:52 00:58 00:33 00:12
922446020 00:05 00:41 00:58 01:05 00:36 00:12
922446020 00:06 00:44 00:53 00:59 00:38 00:12
922446020 00:06 00:49 00:57 01:02 00:43 00:11
922446020 00:05 00:43 00:52 01:01 00:38 00:14
922446020 00:06 00:50 00:55 01:02 00:44 00:13
922446020 00:05 00:49 00:54 01:00 00:44 00:11
922446020 00:06 00:42 00:53 00:59 00:36 00:12
922446020 00:05 00:43 00:55 00:58 00:38 00:08
922446020 00:06 00:46 00:56 01:02 00:40 00:12
922446020 00:06 00:47 00:56 01:03 00:41 00:13
922446020 00:05 00:44 00:56 01:02 00:39 00:11
922446020 00:05 00:41 00:56 01:02 00:36 00:11

11
922270840 00:06 01:05 01:14 01:20 00:59 00:12
922446020 00:05 00:41 00:56 01:02 00:36 00:11
927140720 00:06 00:37 00:47 00:54 00:31 00:13
922446020 00:06 00:43 00:56 01:02 00:37 00:12
922446020 00:05 00:45 00:56 01:02 00:40 00:11
922446020 00:05 00:46 00:55 01:01 00:41 00:11
922446020 00:06 00:40 00:56 01:02 00:34 00:12
922446020 00:06 00:37 00:57 01:03 00:31 00:12
922446020 00:06 00:39 00:49 00:55 00:33 00:12
922446020 00:06 00:42 00:56 01:02 00:36 00:12
922446020 00:04 00:49 00:54 01:00 00:45 00:10
922446020 00:05 00:40 00:56 01:02 00:35 00:11
Table below shows the data for station 51 (Cabinet out), Operator 1, refrigerator line:
PNC
Time
taken to
enter the
station
Operator
stops
working
Product
Leaves
End of
conveyor
Time for
which
operator
works on
product
Time
spent on
conveyor
927024020 00:05 01:03 01:12 00:58
927024020 00:05 01:39 00:49 02:15 01:34
927024025 00:05 00:30 00:52 00:54 00:25 00:07
927024025 00:04 00:25 00:51 00:53 00:21 00:06
927024025 00:05 00:25 00:51 00:53 00:20 00:07
927024025 00:05 00:35 00:51 00:53 00:30 00:07
927024020 00:04 00:27 00:51 00:52 00:23 00:05
927024025 00:04 00:47 00:51 00:52 00:43 00:05
927024025 00:05 00:32 00:52 00:53 00:27 00:06
927024025 00:04 00:26 00:55 00:22
927024020 00:04 00:45 00:51 00:52 00:41 00:05
927024025 00:04 00:28 00:50 00:53 00:24 00:07
927024025 00:05 00:41 00:52 00:54 00:36 00:07
927024025 00:05 00:29 00:51 00:53 00:24 00:07
927024025 00:05 00:32 00:51 00:53 00:27 00:07
927024025 00:04 00:46 00:51 00:52 00:42 00:05
927024220 00:05 00:48 00:50 00:52 00:43 00:07
927024220 00:04 00:29 00:51 00:53 00:25 00:06
927024220 00:05 00:32 00:52 00:54 00:27 00:07
927024220 00:04 00:37 00:51 00:53 00:33 00:06
927024220 00:05 00:40 00:52 00:54 00:35 00:07
927024025 00:05 00:26 00:51 00:52 00:21 00:06
927024020 00:04 00:39 00:50 00:52 00:35 00:06
927024020 00:04 00:32 00:50 00:52 00:28 00:06

12
927024220 00:04 00:31 00:51 00:52 00:27 00:05
927024220 00:05 00:27 00:52 00:53 00:22 00:06
927024220 00:05 00:31 00:51 00:53 00:26 00:07
927024220 00:04 00:30 00:51 00:54 00:26 00:07
Table below shows station 51, Operator 2, refrigerator line:
PNC
Time
taken to
enter the
station
Operator
stops
working
Product
Leaves
End of
conveyor
Time for
which
operator
works on
product
Time
spent on
conveyor
922446020 00:04 00:35 00:56 01:02 00:31 00:10
922446020 00:05 00:37 00:56 01:04 00:32 00:13
922446020 00:34 00:55 01:02 00:34 00:07
922446020 00:04 00:35 00:56 01:04 00:31 00:12
922446020 00:04 00:33 00:55 01:02 00:29 00:11
922446020 00:04 00:37 00:55 01:02 00:33 00:11
922446020 00:03 00:36 00:53 01:00 00:33 00:10
922270840 00:08 01:51 02:00 02:08 01:43 00:16
922446020 00:04 00:33 00:55 01:02 00:29 00:11
922446020 00:06 00:39 00:55 01:02 00:33 00:13
922446020 00:05 00:33 00:55 01:02 00:28 00:12
922446020 00:03 00:32 00:52 01:03 00:29 00:14
922446020 00:05 00:41 00:55 01:03 00:36 00:13
922446020 00:04 00:42 00:55 00:57 00:38 00:06
922446020 00:05 00:37 00:56 00:58 00:32 00:07
922446020 00:05 00:36 00:55 00:57 00:31 00:07
922446020 00:04 00:37 00:55 00:57 00:33 00:06
922446120 00:04 00:34 00:55 00:57 00:30 00:06
922446020 00:04 00:46 00:56 00:59 00:42 00:07
922446025 00:04 00:32 00:54 00:59 00:28 00:09

13
Table below shows station 52 (Wheels), Operator 1, refrigerator line:
Time taken to
enter the station
Operator ends
working
Product leaves
station
Time for which
operator works
on the product
00:06 00:53 01:04 47
00:05 00:47 01:02 42
00:04 00:55 00:57 51
00:03 01:00 01:05 57
00:05 00:50 00:58 45
00:04 00:50 01:01 46
00:05 00:54 01:02 49
00:05 00:46 00:55 41
00:07 00:50 01:07 43
00:07 00:41 00:58 34
00:05 00:46 01:02 41
00:03 00:45 00:53 42
00:06 00:45 00:57 39
00:04 00:48 00:59 44
00:03 00:43 00:53 40
00:07 00:37 00:58 30
00:07 00:36 00:57 29
00:04 00:38 01:05 34
00:02 00:44 00:52 42
00:07 00:35 00:57 28
00:05 00:57 01:06 52
00:05 01:02 01:09 57
00:06 00:36 00:56 30
00:05 00:39 00:57 34
00:08 00:53 01:03 45
00:03 00:49 00:58 46
Table below shows station 52, Operator 2, refrigerator line:
Time
taken to
enter the
station
Operator
ends
working
Product
leaves
station
Time for
which
operator
works on
the product
00:04 00:38 00:55 34
00:06 00:37 00:56 31
00:05 00:46 00:56 41
00:05 00:57 01:07 52
00:06 00:56 01:05 50
00:06 00:55 01:02 49

14
00:06 01:07 01:15 61
00:06 01:33 01:42 87
00:05 01:06 01:15 61
00:06 00:45 00:57 39
00:04 00:43 00:56 39
00:08 00:44 00:58 36
00:07 00:41 00:58 34
00:06 00:44 00:57 38
00:07 00:50 00:59 43
00:04 01:10 01:17 66
00:06 00:49 00:59 43
00:05 00:48 00:56 43
00:06 00:49 00:58 43
00:06 00:51 01:00 45
00:07 01:08 01:17 61
00:05 00:45 00:57 40
00:05 03:13 03:22 188
00:08 00:40 00:51 32
00:06 00:39 00:49 33
00:05 00:33 00:55 28
The table below shows the data for station 50, operator 1, freezer line:
PNC Time taken to enter
the station
Operator
stops working
Product
Leaves
End of
conveyor
Time for which
operator works
on product
Time spent
on conveyor
922343851 00:05 00:47 00:54 01:00 00:42 00:11
922343851 00:05 00:43 00:49 00:55 00:38 00:11
922343851 00:05 00:38 00:54 01:01 00:33 00:12
922343851 00:06 00:51 00:55 01:02 00:45 00:13
922343851 00:06 00:47 00:53 00:59 00:41 00:12
922343851 00:05 00:44 00:54 01:01 00:39 00:12
922343851 00:05 00:52 00:57 01:04 00:47 00:12
922343851 00:05 00:44 00:52 00:58 00:39 00:11
922343851 00:05 00:43 00:54 01:00 00:38 00:11
922343851 00:05 00:47 00:53 00:59 00:42 00:11
922644125 00:06 00:43 00:56 01:01 00:37 00:11
922644125 00:06 00:39 00:45 00:51 00:33 00:12
922644125 00:06 00:36 00:55 01:02 00:30 00:13
922644125 00:06 00:48 00:53 01:00 00:42 00:13
922644125 00:06 00:50 00:54 01:01 00:44 00:13
922644125 00:06 00:45 00:52 00:58 00:39 00:12
922644125 00:05 00:45 00:51 00:58 00:40 00:12
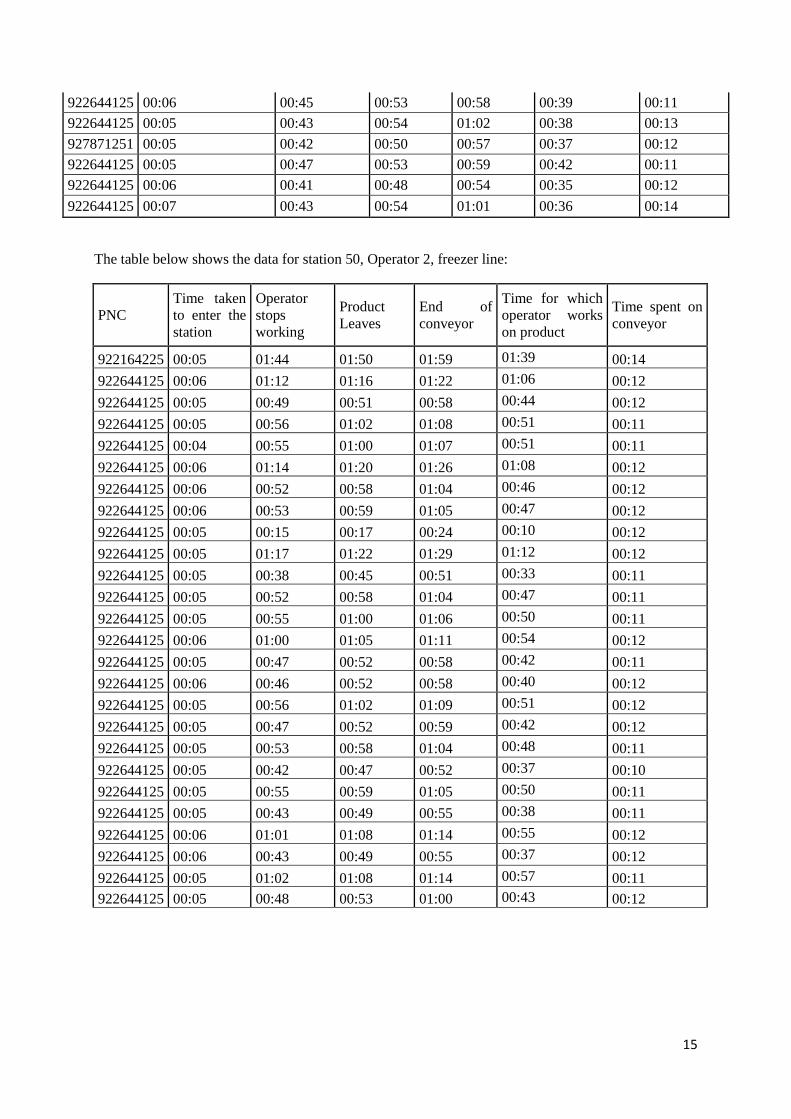
15
922644125 00:06 00:45 00:53 00:58 00:39 00:11
922644125 00:05 00:43 00:54 01:02 00:38 00:13
927871251 00:05 00:42 00:50 00:57 00:37 00:12
922644125 00:05 00:47 00:53 00:59 00:42 00:11
922644125 00:06 00:41 00:48 00:54 00:35 00:12
922644125 00:07 00:43 00:54 01:01 00:36 00:14
The table below shows the data for station 50, Operator 2, freezer line:
PNC
Time taken
to enter the
station
Operator
stops
working
Product
Leaves
End of
conveyor
Time for which
operator works
on product
Time spent on
conveyor
922164225 00:05 01:44 01:50 01:59 01:39 00:14
922644125 00:06 01:12 01:16 01:22 01:06 00:12
922644125 00:05 00:49 00:51 00:58 00:44 00:12
922644125 00:05 00:56 01:02 01:08 00:51 00:11
922644125 00:04 00:55 01:00 01:07 00:51 00:11
922644125 00:06 01:14 01:20 01:26 01:08 00:12
922644125 00:06 00:52 00:58 01:04 00:46 00:12
922644125 00:06 00:53 00:59 01:05 00:47 00:12
922644125 00:05 00:15 00:17 00:24 00:10 00:12
922644125 00:05 01:17 01:22 01:29 01:12 00:12
922644125 00:05 00:38 00:45 00:51 00:33 00:11
922644125 00:05 00:52 00:58 01:04 00:47 00:11
922644125 00:05 00:55 01:00 01:06 00:50 00:11
922644125 00:06 01:00 01:05 01:11 00:54 00:12
922644125 00:05 00:47 00:52 00:58 00:42 00:11
922644125 00:06 00:46 00:52 00:58 00:40 00:12
922644125 00:05 00:56 01:02 01:09 00:51 00:12
922644125 00:05 00:47 00:52 00:59 00:42 00:12
922644125 00:05 00:53 00:58 01:04 00:48 00:11
922644125 00:05 00:42 00:47 00:52 00:37 00:10
922644125 00:05 00:55 00:59 01:05 00:50 00:11
922644125 00:05 00:43 00:49 00:55 00:38 00:11
922644125 00:06 01:01 01:08 01:14 00:55 00:12
922644125 00:06 00:43 00:49 00:55 00:37 00:12
922644125 00:05 01:02 01:08 01:14 00:57 00:11
922644125 00:05 00:48 00:53 01:00 00:43 00:12

16
The table below shows the data for station 51, Operator 1, freezer line:
PNC
Time to
enter
station
Operator
ends
Leaves
station
Enters
next
station
Time for
which
operator
works
Time
spent on
conveyor
922164036 00:05 00:24 00:49 00:54 00:19 00:10
922164036 00:05 00:20 00:48 00:53 00:15 00:10
922164036 00:05 00:25 00:48 00:53 00:20 00:10
922164036 00:05 00:20 00:27 00:33 00:15 00:11
922164036 00:05 00:26 00:53 00:56 00:21 00:08
922164036 00:05 00:22 00:49 00:54 00:17 00:10
922643825 00:04 00:26 00:30 00:35 00:22 00:09
922643825 00:04 00:24 00:30 00:35 00:20 00:09
922643825 00:05 00:32 00:37 00:43 00:27 00:11
922643825 00:04 01:08 01:14 01:19 01:04 00:09
922643825 00:04 00:29 00:36 00:40 00:25 00:08
922643825 00:05 00:23 00:29 00:34 00:18 00:10
922643825 00:05 00:23 00:25 00:30 00:18 00:10
922643825 00:04 00:32 00:35 00:41 00:28 00:10
922643825 00:04 00:24 00:27 00:33 00:20 00:10
The table below shows the data for station 51, Operator 2, freezer line:
PNC
Time
taken to
enter
Operator
ends
Leaves
station
Enters
next
station
Operator
works
Time on
conveyor
922644125 00:05 00:26 00:52 00:55 00:21 00:08
922644125 00:05 00:25 00:30 00:33 00:20 00:08
922644125 00:04 00:30 00:47 00:54 00:26 00:11
922644125 00:04 00:22 00:30 00:39 00:18 00:13
922644125 00:03 00:24 00:27 00:31 00:21 00:07
922092025 00:04 00:27 00:29 00:34 00:23 00:09
922092025 00:03 00:22 00:25 00:30 00:19 00:08
922644125 00:05 00:29 00:32 00:37 00:24 00:10
922343856 00:04 00:31 00:32 00:36 00:27 00:08
922092025 00:02 00:21 00:24 00:29 00:19 00:07
922092025 00:05 00:23 00:27 00:32 00:18 00:10
922092025 00:07 00:23 00:25 00:30 00:16 00:12
922092025 00:04 00:28 00:31 00:34 00:24 00:07
922092020 00:05 00:23 00:31 00:33 00:18 00:07
922092020 00:04 00:24 00:27 00:32 00:20 00:09
922092025 00:04 00:25 00:28 00:33 00:21 00:09
922092025 00:05 00:42 00:44 00:49 00:37 00:10

17
Appendix 4 Time study for testing area, wheels station, variant area
This appendix shows the data used for the testing area, wheels station and variant area.
Operation Nr. 24 25 26 27 28 29 30
Station Nr.
Mont 50,
Kylprov
in
Mont 51,
Kylprov
ut
Mont 52,
Skäl
Mont 53,
Variant1
Mont 55,
Variant 3
Mont 58,
Variant 6
Mont 60,
Variant 8
Observ
ed T
imes
32 63 53 24 25 44 45
40 99 47 28 28 42 52
40 30 55 28 28 28 47
38 25 60 21 23 32 43
40 25 50 23 25 35 46
73 35 50 24 24 32 45
29 27 54 19 24 28 45
36 47 46 26 24 40 48
37 32 50 28 22 26 44
40 26 41 22 27 31 55
32 45 46 22 27 28 44
41 28 45 33 22 29 43
35 41 45 24 24 32 46
34 29 48 24 24 28 44
35 32 43 23 23 32 46
35 46 37 24 26 31 43
38 48 36 26 23 44
34 29 38 24 45
38 32 44 26 23
35 37 35 29 30
41 40 57 23 30
42 26 62 22 26
41 39 36 23 24
35 32 39 24 23
43 31 53 26 25
Total Observations 25 25 25 25 25 16 17
Required Obs. 10% 17 67 10 6 12 10 2
E.lux Time 45,1 45,1 45,1 45,1 39,5 64,2 69,2
Obs. Time 38,6 37,8 46,8 24,6 25,8 32,4 45,9
Variance 64,0 247,0 58,7 8,7 21,1 28,4 10,5
Stdev 8,0 15,7 7,7 3,0 4,6 5,3 3,2
Max 73,0 99,0 62,0 33,0 45,0 44,0 55,0
Min 29,0 25,0 35,0 19,0 22,0 26,0 43,0

18
Appendix 5 Complexity Analysis
Item Article Common
Refrigerators
Common
Refrigerators
[%]
208897301 KYLSKÅP MONT. 1 3.45%
200623500 TIPPSPÄRR 6 20.69%
208094288 HANDTAG, MONTERAT 1 3.45%
208862604 MONT.ANV. DISPLAY LCD 2 6.90%
208862614 MONT.ANV. DISPLAY LCD 2 6.90%
208885301 VENT. GALLER BEARB. VIT VÄ 5 17.24%
208885303 VENT. GALLER BEARB. VIT HÖ 1 3.45%
208890601 HÅLLARE, DÖRRFACK (TUB-) 18 62.07%
224612725 DÖRRFACK 7 24.14%
224612806 DÖRRFACK (TUB-) 5 17.24%
227362745 FLASKFACK TRP 7 24.14%
242515309 FLASKHÅLLARE 7 24.14%
208890502 GLASHYLLA KPL. 13 44.83%
208890504 GLASHYLLA KPL. 7 24.14%
208960703 GRÖNSAKSLÅDA 195 TRP 7 24.14%
208971501 GLASHYLLA KPL. 11 37.93%
208816710 DÖRR KPL. KYL 1 3.45%
208094423 ETIKETT, MONT.ANV. 23 79.31%
298178183 LITT.SATS KYL, FRYS 1 3.45%
818376900 TILLÄGGSBLAD, VENTG. 100-S. 23 79.31%
855814800 BRUKSANVISNING SV 2 6.90%
298133001 DISTANSSATS 23 79.31%
90438015 EMBALLERING INREDN. 21 72.41%
90438029 EMBALLERING INREDN. 21 72.41%
90438076 EMBALLERING INREDN. 22 75.86%
90668997 EMBALLAGE KPL 2 6.90%
208003001 ISOBUTAN 23 79.31%
208878800B KOPPL.SCHEMA REV. B 2 6.90%
298132100 PRODUKTDATA 23 79.31%
Average 10 34.13%