Supply Chain Management Socially Responsible Supply Chain Management.
STRATEGIC SUPPLY CHAIN MANAGEMENT
SECOND EDITION
THE FIVE DISCIPLINES FOR TOP PERFORMANCE
SHOSHANAH COHEN & JOSEPH ROUSSEL
New York Chicago San Francisco Lisbon LondonMadrid Mexico City New Delhi San Juan
Seoul Singapore Sydney Toronto
00_Cohen_FM.indd iii 5/1/13 3:51:49 PM
vii
CONTENTS
Preface xiAcknowledgments xv
CHAPTER ONE
DISCIPLINE 1: ALIGN YOUR SUPPLY CHAIN WITH YOUR BUSINESS STRATEGY 1
The Core Strategic Vision 2
How Companies Use Their Supply Chain to Compete 3
Key Elements of Supply Chain Strategy 9
Tests of a Good Supply Chain Strategy 21
SUPPLY CHAIN MANAGEMENT PROFILE
BASF: INCREASING FARM YIELDS THROUGH INNOVATIONS IN CHEMISTRY 31
CHAPTER TWO
DISCIPLINE 2: DEVELOP AN END-TO-END PROCESS ARCHITECTURE 41
Designing an Integrated Supply Chain Process Architecture 42
Key Processes for End-to-End Supply Chain Management 48
Tests for a Good Supply Chain Architecture 61
SUPPLY CHAIN MANAGEMENT PROFILE
ESSILOR: BUILDING AN EFFICIENT SUPPLY CHAIN TO SERVE THE COMPANY’S MISSION 77
00_Cohen_FM.indd vii 5/1/13 3:51:49 PM
viii Contents
CHAPTER THREE
DISCIPLINE 3: DESIGN A HIGH-PERFORMING SUPPLY CHAIN ORGANIZATION 91
Three Activities Essential for Designing Your Company’s Supply Chain Organization 93
Other Defi ning Characteristics of Exceptional Supply Chain Organizations 108
SUPPLY CHAIN MANAGEMENT PROFILE
HAIER: PURSUING THE CUSTOMER-INSPIRED SUPPLY CHAIN 117
CHAPTER FOUR
DISCIPLINE 4: BUILD THE RIGHT COLLABORATIVE MODEL 129
Understanding Collaboration 130
The Path to Successful Collaboration 140
Tests of Successful Collaboration 158
SUPPLY CHAIN MANAGEMENT PROFILE
KAISER PERMANENTE: THRIVING UNDER PRESSURE 161
CHAPTER FIVE
DISCIPLINE 5: USE METRICS TO DRIVE PERFORMANCE 171
Supply Chain Performance Measurement: Selecting the Right Metrics 174
Supply Chain Performance Management: Making Metrics Matter 188
SUPPLY CHAIN MANAGEMENT PROFILE
LENOVO: MOVING FULL-SPEED AHEAD 201
CHAPTER SIX
BENCHMARKING RESULTS: THE BEST-IN-CLASS PERFORMANCE ADVANTAGE 213
The Relationship Between Supply Chain Performance and Financial Performance 214
00_Cohen_FM.indd viii 5/1/13 3:51:49 PM

Contents ix
Driving Supply Chain Performance 217
Mastering Complexity for Superior Performance 223
SUPPLY CHAIN MANAGEMENT PROFILE
SCHLUMBERGER: INTEGRATING PEOPLE AND TECHNOLOGY FOR SERVICE EXCELLENCE 231
CHAPTER SEVEN
TRANSFORM YOUR SUPPLY CHAIN 243
Setting Improvement Priorities 245
Designing the Transformation Road Map 251
Implementing the Change 258
Notes 269Bibliography 277Index 285
00_Cohen_FM.indd ix 5/1/13 3:51:50 PM

213
CHAPTER SIX
BENCHMARKING RESULTS:THE BEST-IN-CLASS PERFORMANCE ADVANTAGE
Benchmarking data demonstrate that companies that exhibit superior supply chain performance also experience superior fi nancial performance. These best-in-class com-panies have honed certain Plan, Source, Make, and Deliver practices to diff erentiate themselves from the competition. They also manage supply chain complexity to their advantage. This chapter illuminates these practices as well as the size of the improve-ment opportunity available to companies aspiring to be best in class.
Most companies know supply chain performance matters. But leading companies know how to use it to drive business success.
PwC’s Performance Measurement Group (PMG) studied some of these leading, best-in-class companies (BICCs) specifi cally for the purposes of this book. (See Sidebar “Benchmarking Supply Chain Performance” on page 226.) PMG found that BICCs frequently achieve greater revenue growth and profi t-ability than their competitors. Survey results and years of work with clients support this claim.1 (See Sidebar “About PMG” on page 228.)
PMG found that BICCs derive tremendous value from excelling in critical supply chain areas such as cash-to-cash cycle time and total supply
06_Cohen.indd 213 5/1/13 1:47:35 PM

214 Strategic Supply Chain Management
chain cost management. These companies’ best practices are instructive for any company, regardless of industry.
PMG’s research has revealed three key truths about supply chain performance:
■ Superior supply chain performance is frequently related to superior fi nancial performance.
■ Expertise at specifi c Plan, Source, Make, and Deliver practices can provide an edge.
■ Complexity, when managed well, is a source of signifi cant competitive advantage.
THE RELATIONSHIP BETWEEN SUPPLY CHAIN PERFORMANCE AND FINANCIAL PERFORMANCE
PMG’s research reveals a relationship between superior supply chain performance and superior fi nancial performance. Companies with the best-performing supply chains outperform others in their industry on key fi nancial metrics.
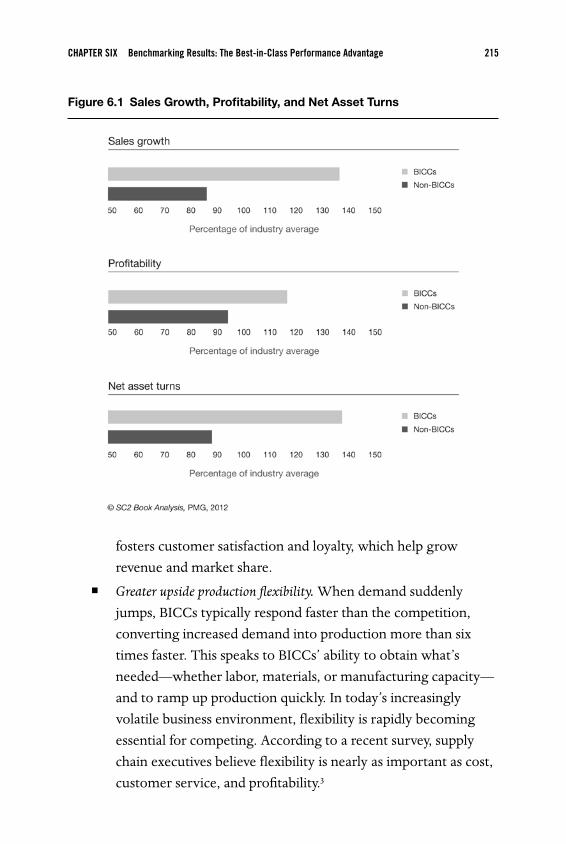
According to PMG’s survey data,2 BICCs’ average annual sales growth is approximately 50 percent higher than that of other companies in their respective industries, and BICCs’ profi tability is about 20 percent higher. BICCs also demonstrate better asset turnover, with performance about 50 percent better than the industry average (Figure 6.1).
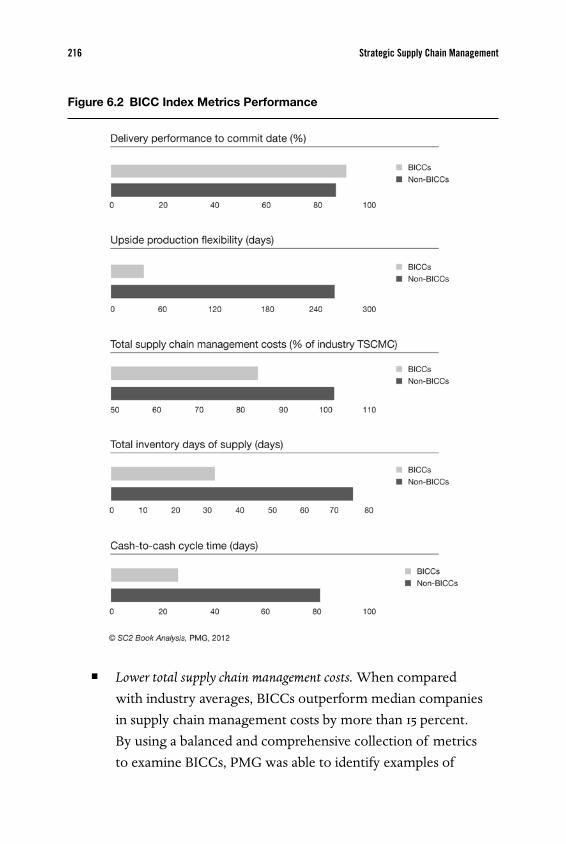
By defi nition, BICCs exhibit superior supply chain performance. Just how much better are they? Figure 6.2 provides a snapshot of key perfor-mance data on fi ve key metrics.
■ Better delivery performance against customer request date. BICCs schedule a higher percentage of orders in accordance with the dates requested by customers and deliver the goods on the committed date more often. Superior delivery performance
06_Cohen.indd 214 5/1/13 1:47:36 PM
CHAPTER SIX Benchmarking Results: The Best-in-Class Performance Advantage 215
Figure 6.1 Sales Growth, Profi tability, and Net Asset Turns
fosters customer satisfaction and loyalty, which help grow revenue and market share.
■ Greater upside production fl exibility. When demand suddenly jumps, BICCs typically respond faster than the competition, converting increased demand into production more than six times faster. This speaks to BICCs’ ability to obtain what’s needed—whether labor, materials, or manufacturing capacity—and to ramp up production quickly. In today’s increasingly volatile business environment, fl exibility is rapidly becoming essential for competing. According to a recent survey, supply chain executives believe fl exibility is nearly as important as cost, customer service, and profi tability.3
06_Cohen.indd 215 5/1/13 1:47:36 PM
216 Strategic Supply Chain Management
■ Lower total supply chain management costs. When compared with industry averages, BICCs outperform median companies in supply chain management costs by more than 15 percent. By using a balanced and comprehensive collection of metrics to examine BICCs, PMG was able to identify examples of
Figure 6.2 BICC Index Metrics Performance
06_Cohen.indd 216 5/1/13 1:47:36 PM
CHAPTER SIX Benchmarking Results: The Best-in-Class Performance Advantage 217
companies that manage assets and costs well without sacrifi cing fl exibility or service levels.
■ Lower total inventory. BICCs operate with only about one month of inventory, in contrast to other companies, which operate with two to three times as much. Managing with lower inventory levels can dramatically improve cash fl ow. The ability to do so without sacrifi cing delivery performance is a testament to superior supply chain practices.
■ Shorter cash-to-cash cycle time. Signifi cantly lower inventory days of supply is highly correlated with lower cash-to-cash cycle time. Defi ned as the time it takes to turn a dollar of spending into a dollar of revenue, cash-to-cash cycle time is calculated as days of inventory plus days of receivables net days of payables. BICCs exhibit a cash-to-cash cycle time of approximately three weeks, whereas median companies require more than triple that amount of time.
The size of the gap between BICCs and their industry peers varies across these diff erent metrics. BICCs outperform their competitors far more on inventory management than on cost, for example. Overall, how-ever, the gap is substantial. This is important because it refl ects the size of the opportunity available to companies that aspire to be among the best in class.
DRIVING SUPPLY CHAIN PERFORMANCE
BICCs consistently outperform their peers across supply chain metrics because they have fi nely honed the practices most critical for getting prod-ucts and services to customers.
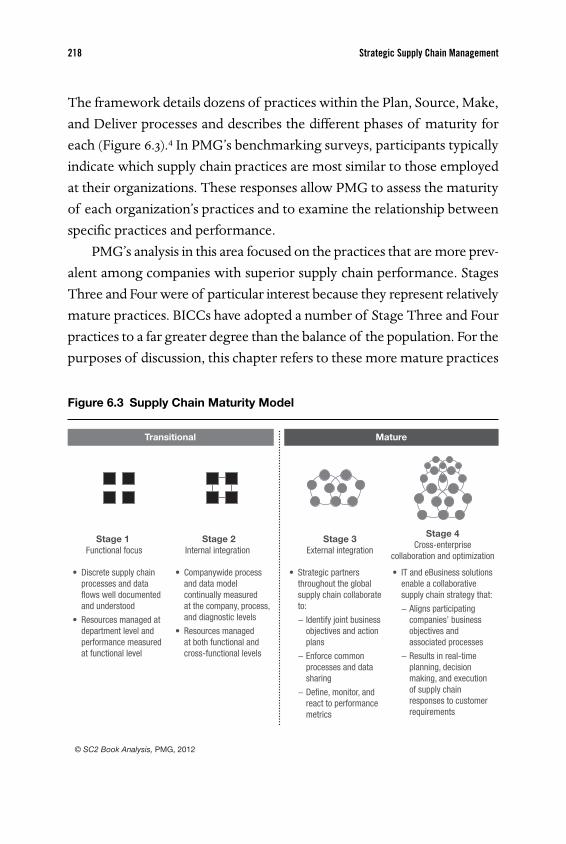
PMG’s Supply Chain Maturity Model provides a high-level perspec-tive on the supply chain practices that BICCs and other companies deploy.
06_Cohen.indd 217 5/1/13 1:47:36 PM
218 Strategic Supply Chain Management
The framework details dozens of practices within the Plan, Source, Make, and Deliver processes and describes the diff erent phases of maturity for each (Figure 6.3).4 In PMG’s benchmarking surveys, participants typically indicate which supply chain practices are most similar to those employed at their organizations. These responses allow PMG to assess the maturity of each organization’s practices and to examine the relationship between specifi c practices and performance.
PMG’s analysis in this area focused on the practices that are more prev-alent among companies with superior supply chain performance. Stages Three and Four were of particular interest because they represent relatively mature practices. BICCs have adopted a number of Stage Three and Four practices to a far greater degree than the balance of the population. For the purposes of discussion, this chapter refers to these more mature practices
Figure 6.3 Supply Chain Maturity Model
© SC2 Book Analysis, PMG, 2012
MatureTransitional
Stage 1 Functional focus
Stage 2Internal integration
Stage 3External integration
Stage 4Cross-enterprise
collaboration and optimization
• Discrete supply chain processes and data flows well documented and understood
• Resources managed at department level and performance measured at functional level
• Companywide process and data model continually measured at the company, process, and diagnostic levels
• Resources managed at both functional and cross-functional levels
• Strategic partners throughout the global supply chain collaborate to:
− Identify joint business objectives and action plans
− Enforce common processes and data sharing
− Define, monitor, and react to performance metrics
• IT and eBusiness solutions enable a collaborative supply chain strategy that:
− Aligns participating companies’ business objectives and associated processes
− Results in real-time planning, decision making, and execution of supply chain responses to customer requirements
06_Cohen.indd 218 5/1/13 1:47:36 PM

CHAPTER SIX Benchmarking Results: The Best-in-Class Performance Advantage 219
as “diff erentiators.” PMG’s data suggest these diff erentiating practices help drive signifi cant improvements in performance. By contrast, practices used by more than 65 percent of the companies in PMG’s study are described as “widely implemented”—basic practices all companies need to embrace to compete in their industries.
The following discussion focuses primarily on the diff erentiators because they off er the most learning and the biggest opportunities for non-BICCs. The omission of some important supply chain practices by no means suggests their irrelevance; rather, it refl ects the absence of a relationship identifi ed with PMG’s particular sample and criteria.
PLANOf all the major supply chain processes, Plan shows the greatest number of diff erentiating processes. BICCs are clearly focusing to a higher degree on developing more-mature planning processes and systems so as to bet-ter forecast demand and coordinate activities across their customer and supplier networks. A detailed review of the specifi c diff erentiating Plan practices shows that BICCs:
■ Collaborate more with customers and suppliers in the development of long-range strategic plans
■ Integrate key suppliers into the supply-planning process■ Develop clear rules and requirements with customers and
suppliers for managing demand-and-supply exceptions■ Address demand-and-supply exceptions from a cross-functional
perspective
These fi ndings are especially interesting in light of another fi nding of the survey: BICCs outperformed non-BICCs on unit-based forecast accu-racy by 18 percent. Clearly, the Plan practices that diff erentiate BICCs are instrumental for better demand forecasting.
06_Cohen.indd 219 5/1/13 1:47:37 PM

220 Strategic Supply Chain Management
Planning is the conductor that orchestrates the performance of the entire supply chain. BICCs focus on planning to gain access to better infor-mation from their extended supply chains, and—as importantly—process that information into faster and better decisions. When translated into execution, faster and better decision making is the diff erentiated capabil-ity that allows BICCs to provide better service, with greater fl exibility and lower costs.
SOURCEWhile Plan provides the greatest opportunities for improvement, Source is the most evolved: nearly all of the Source practices listed in the survey have been implemented by at least 15 percent of the survey population. Additionally, several Source practices are what PMG categorizes as widely implemented practices; these include the use of cross-functional sourcing teams, the development of sourcing strategies to achieve the lowest total cost, and the integration of suppliers into the sourcing process.
However, there are still some Source practices where BICCs stand out from competitors. BICCs show a higher degree of collaborative interaction with their suppliers, as they do in Plan. In Source, BICCs do this by:
■ Using electronic data exchange to get real-time data■ Sharing with suppliers a richer set of data, including forecasts,
inventory levels, production schedules, engineering changes, and their own performance scorecards
■ Collaborating on joint process improvements to reduce costs instead of just applying price reduction pressure
The BICC lesson is clear. In an environment where most companies have adopted many of the best Source practices, BICCs have gone one step further, sharing more of their own data with suppliers in exchange for greater access to real-time data and increased participation in cost reduction eff orts. These eff orts add up to deeper, more eff ective supplier relationships.
06_Cohen.indd 220 5/1/13 1:47:37 PM

CHAPTER SIX Benchmarking Results: The Best-in-Class Performance Advantage 221
MAKEThe Make process has a long history of process improvement “inside the four walls”; accordingly, many of the Make practices are widely imple-mented across the survey population. Nearly all of the companies employ systematic methods for cycle time and in-plant inventory reduction, and are able to rapidly identify disruptions, reprioritize and reschedule production, and communicate implications to customers and suppliers.
BICCs, by contrast, make more extensive use of pull-based mecha-nisms to drive production activity. The largest diff erentiating practice for BICCs, though, lies in the engagement of the Make function in product design and life cycle management. BICCs make greater use of design-for-manufacturing (DFM) practices and related mass customization and late-stage postponement. As a result, they are able to get new products into mass production faster, more reliably, and less expensively than the competition.
DELIVERThe heightened focus on delivery reliability and customer service over the past decade has led to the wide implementation of many of the core Deliver practices. These center on order processing and include automat-ing basic transaction information, order status reporting, and delivery date commitment.
BICCs take a broader perspective of the Deliver process because they incorporate customer, supplier, and benchmark information into supply chain footprint decisions. These top-performing companies are also three times more likely to employ diff erentiated supply chain service levels and policies for diff erent customer segments. Furthermore, they are more likely to tailor specifi c supply chains to diff erent customer segment needs for speed, fl exibility, product variety, cost, or new product introduction. As the 2013 PwC global supply chain study demonstrates, BICCs operate 40 percent more supply chain confi gurations or operating models than average companies.5
06_Cohen.indd 221 5/1/13 1:47:37 PM

222 Strategic Supply Chain Management
Such tailoring, deployed in conjunction with superior planning pro-cesses, is the key to BICCs’ success. Breaking through the classic trade-off barriers, these companies have achieved superior service, fl exibility, cost, and working-capital performance.
SUPPLY CHAIN STRATEGY, ORGANIZATION, AND PERFORMANCE MANAGEMENTBICCs also employ practices that cut across the major supply chain processes. Consistent with PMG’s general experience, BICCs more fre-quently exhibit key practices that align to the core disciplines of strategy, process, organization, collaboration, and performance measurement. In particular, they:
■ Develop an integrated process architecture across Plan, Source, Make, Deliver, and Return and explicitly defi ne the links to product development, sales, marketing, and fi nance functions
■ Establish end-to-end performance metrics and targets, including key measures such as cash-to-cash cycle time and total supply chain management cost
■ Measure and include supply chain complexity drivers in their key performance indicators
■ Defi ne and incorporate supply chain competency requirements into recruiting, staffi ng, and training plans
Having elevated supply chain performance to a business priority, BICCs more explicitly defi ne and manage their supply chain performance. These companies use specifi c Plan, Source, Make, and Deliver practices to drive better execution across the end-to-end supply chain. At the same time, they use the fi ve core disciplines to maintain that level of performance on an ongoing basis.
06_Cohen.indd 222 5/1/13 1:47:37 PM
CHAPTER SIX Benchmarking Results: The Best-in-Class Performance Advantage 223
MASTERING COMPLEXITY FOR SUPERIOR PERFORMANCE
Employing mature practices is a critical step toward stronger supply chain performance. Yet there are other considerations that companies need to keep in mind if they want to become best-in-class. One that has become extremely important in today’s global business environment is complexity.
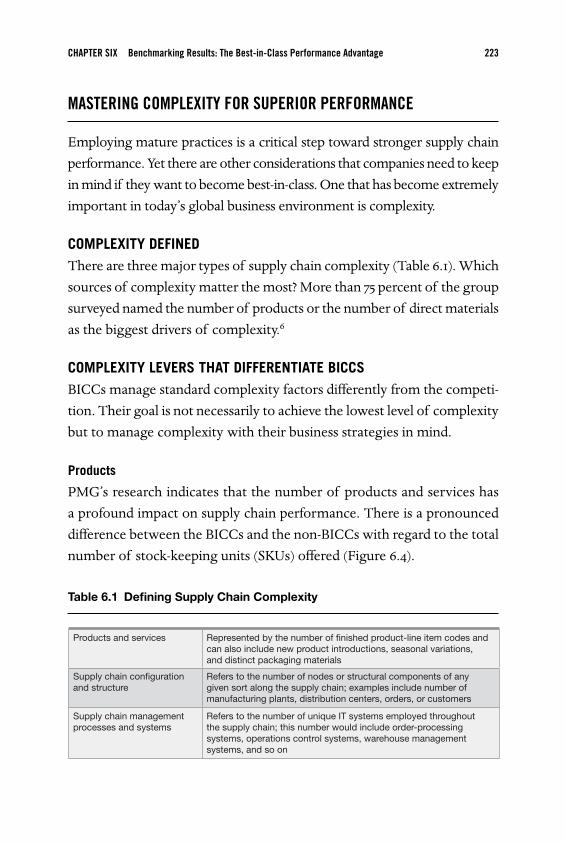
COMPLEXITY DEFINEDThere are three major types of supply chain complexity (Table 6.1). Which sources of complexity matter the most? More than 75 percent of the group surveyed named the number of products or the number of direct materials as the biggest drivers of complexity.6
COMPLEXITY LEVERS THAT DIFFERENTIATE BICCSBICCs manage standard complexity factors diff erently from the competi-tion. Their goal is not necessarily to achieve the lowest level of complexity but to manage complexity with their business strategies in mind.
Products
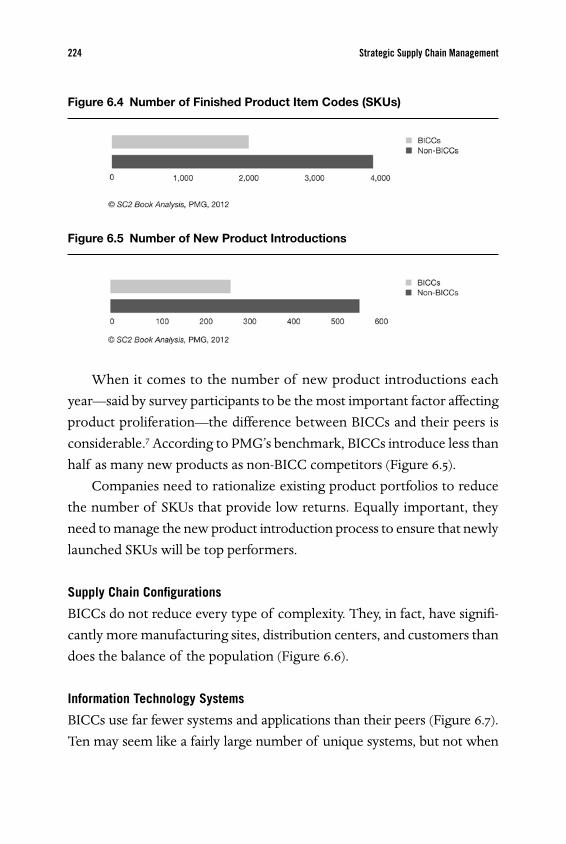
PMG’s research indicates that the number of products and services has a profound impact on supply chain performance. There is a pronounced diff erence between the BICCs and the non-BICCs with regard to the total number of stock-keeping units (SKUs) off ered (Figure 6.4).
Table 6.1 Defi ning Supply Chain Complexity
Represented by the number of finished product-line item codes andcan also include new product introductions, seasonal variations,and distinct packaging materials
Refers to the number of nodes or structural components of anygiven sort along the supply chain; examples include number ofmanufacturing plants, distribution centers, orders, or customers
Refers to the number of unique IT systems employed throughoutthe supply chain; this number would include order-processingsystems, operations control systems, warehouse managementsystems, and so on
Supply chain configurationand structure
Supply chain managementprocesses and systems
Products and services
06_Cohen.indd 223 5/1/13 1:47:37 PM
224 Strategic Supply Chain Management
When it comes to the number of new product introductions each year—said by survey participants to be the most important factor aff ecting product proliferation—the diff erence between BICCs and their peers is considerable.7 According to PMG’s benchmark, BICCs introduce less than half as many new products as non-BICC competitors (Figure 6.5).
Companies need to rationalize existing product portfolios to reduce the number of SKUs that provide low returns. Equally important, they need to manage the new product introduction process to ensure that newly launched SKUs will be top performers.
Supply Chain Confi gurations
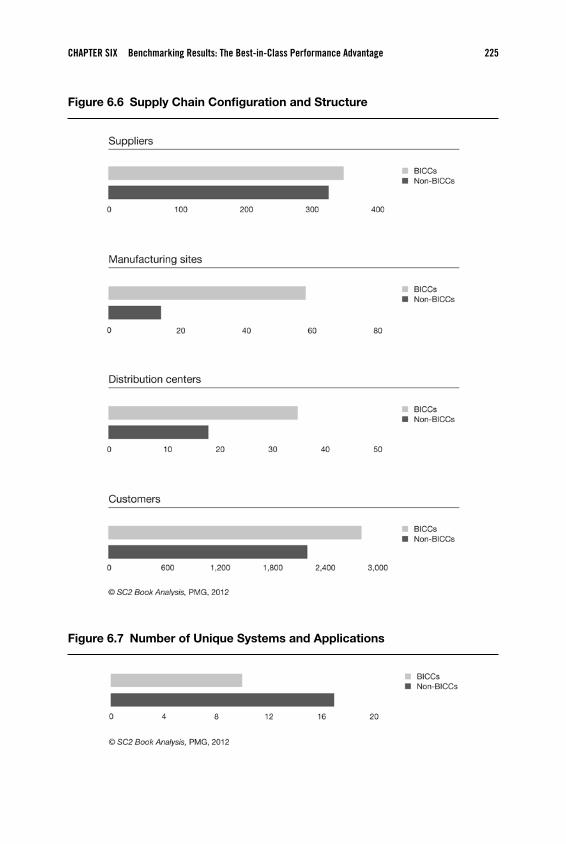
BICCs do not reduce every type of complexity. They, in fact, have signifi -cantly more manufacturing sites, distribution centers, and customers than does the balance of the population (Figure 6.6).
Information Technology Systems
BICCs use far fewer systems and applications than their peers (Figure 6.7). Ten may seem like a fairly large number of unique systems, but not when
Figure 6.4 Number of Finished Product Item Codes (SKUs)
Figure 6.5 Number of New Product Introductions
06_Cohen.indd 224 5/1/13 1:47:37 PM
CHAPTER SIX Benchmarking Results: The Best-in-Class Performance Advantage 225
Figure 6.6 Supply Chain Confi guration and Structure
Figure 6.7 Number of Unique Systems and Applications
06_Cohen.indd 225 5/1/13 1:47:38 PM

226 Strategic Supply Chain Management
compared with the 17 deployed by the non-BICC group. Therefore, reducing the number of systems used across the supply chain can potentially contrib-ute to improved performance.
In sum, BICCs manage overall complexity in three ways. They introduce fewer new products than the non-BICC competition, which helps suppress the number of SKUs in the portfolio. Moreover, they streamline the number of systems in use to improve management reporting and control.
At the same time, BICCS confi gure their supply chains in accordance with the needs of the customer base. They use better practices to manage the atten-dant complexity in the realization that it is necessary for competitiveness.
The benchmark data presented here make a compelling case for the importance of supply chain performance. Companies with superior per-formance enjoy superior fi nancial results. Understanding the supply chain’s strategic potential, they have honed the practices most critical for getting their products and services to customers. For any company aspiring to become best in class, these practices point the way forward.
BENCHMARKING SUPPLY CHAIN PERFORMANCE
Quality benchmarks are rooted in the age-old phrase “an apples-to-apples comparison.” To be eff ective, a benchmark must be defi ned in a way that allows it to be applied consistently across companies. Bench-marks can be quantitative (metrics) or qualitative (practice measures). A metric requires a clear description of the formula and the data sources; a practice measure requires a detailed characterization of the practice and an assessment of how consistently it is used in the organization.
The BICC Index
To distinguish companies with top-performing supply chains, PMG developed the “BICC Index,” which consists of fi ve metrics: delivery performance to commit date, upside production fl exibility, total supply
06_Cohen.indd 226 5/1/13 1:47:38 PM

CHAPTER SIX Benchmarking Results: The Best-in-Class Performance Advantage 227
chain management cost, inventory days of supply, and cash-to-cash cycle time. These metrics are defi ned and calculated in the same way as those used in PMG’s ongoing supply chain benchmarking survey, which are based on those in the Supply Chain Operations Reference (SCOR®) model framework.
BICC Index Metrics Overview
Metric
Delivery performanceto commit date
A customer-facing metric thatcaptures the percentage oforders delivered on time to thecustomer commit date
Companies have more controlover performance that theycommit to than they doover delivery performanceto request, which can varyconsiderably
Upside productionflexibility
The number of days requiredto achieve an unplannedsustainable 20 percent increasein quantity delivered withthe assumption of no otherconstraints
Companies with more-flexiblemanufacturing capacity arebetter able to rapidly respond tochanges in market conditions
Total supply chainmanagement cost
Total cost to manage orderprocessing, acquire materials,manage inventory, and managesupply chain finance, planning,and IT costs; it is inclusive ofsalary, benefits, space andfacilities, and general andadministrative allocations
This is the best way to measurecosts across the end-to-endsupply chain
Cash-to-cash cycle time This metric has acomprehensive view ofpayables, receivables, andinventory levels
Inventory days of supply This metric is used acrossindustries and reflects anefficient use of assets andstreamlined supply chainthroughout
The number of days thatinventories would satisfydemand; it includes onlyinventory that is on the booksand currently owned by thebusiness entity
The length of time, in days, thatit takes for cash to flow backinto a company after it has beenspent for raw materials
Definition Rationale for selection
The metrics that make up the BICC Index are SCOR Level 1 mea-surements. They are high-level metrics calculated from companies’ responses to detailed SCOR Level 2 and 3 questions. For example, delivery performance to commit is calculated from the number of orders delivered on the date requested by the customer, divided by the total number of orders delivered.
06_Cohen.indd 227 5/1/13 1:47:38 PM
228 Strategic Supply Chain Management
The quantitative part of the survey also includes questions that provide further insight into supply chain operations—for example, the number of weeks of fi rm forecast needed in advance of a ship date window.
Normalization
To remove industry bias, every company’s performance on each of the fi ve BICC Index metrics was normalized according to the company’s industry. In other words, the performance of the individual company was divided by the industry average for that particular metric. For example, if a specific consumer-goods company’s delivery performance is 99 percent and the consumer goods industry average for delivery performance is 90 percent, then the company’s normalized delivery performance value is calculated as 99/90, or 1.1. The BICC Index represents the score derived from the sum of the fi ve normalized values.
Of course, the metrics in the BICC Index are not the only mea-sures appropriate for measuring overall supply chain performance. The net-asset-turns metric, for example, is still widely used, but it was not included in the BICC Index because it is aff ected by capital struc-ture (i.e., short- and long-term debt-to-asset ratio). Similarly, order fulfi llment lead time was not included because it can vary widely as a result of the primary operating model in use.
ABOUT PMG
The benchmarking data and analysis presented in this book are drawn from the studies conducted by the Performance Measurement Group (PMG), an internal PwC organization. Experts in the design and
06_Cohen.indd 228 5/1/13 1:47:38 PM
CHAPTER SIX Benchmarking Results: The Best-in-Class Performance Advantage 229
KEY TAKEAWAYS
■ Companies with the best-performing supply chains also outper-form their competitors on key fi nancial metrics.
■ Best-in-class companies consistently—and signifi cantly—do better than the competition across a range of supply chain metrics because they have honed the Plan, Source, Make, and Deliver practices most critical for getting products and services to customers.
■ Managing the number of SKUs through the new product intro-duction process is the single most eff ective technique for reducing supply chain complexity.
management of supply chain performance metrics, the people who constitute today’s PMG played a key role in the development of the SCOR model in the 1990s.
PMG conducts an ongoing benchmarking of companies world-wide to determine median and best-in-class supply chain performance levels, dominant and emerging supply chain practices, and related complexity levels. These data are maintained in a repository; com-panies that wish to assess their supply chain performance against an appropriate comparison population are given access to aggregate metric data in exchange for completing an extensive questionnaire regarding their own performance and practices.
To ensure data integrity, PMG provides support and logical esti-mation techniques to participants during data collection and vali-dates all survey submissions. Only companies that provide a certain minimum number of data points are included; extreme outliers are screened out. PMG updates its benchmarks on a regular basis with the latest survey submissions. To ensure confi dentiality, only aggre-gate benchmarks—no company-specifi c data—are disclosed.
06_Cohen.indd 229 5/1/13 1:47:38 PM

This page intentionally left blank

231
SUPPLY CHAIN MANAGEMENT PROFILE
SCHLUMBERGER:INTEGRATING PEOPLE AND TECHNOLOGY FOR SERVICE EXCELLENCE
Imagine that you have built a “smart” house on the coast of California. In building this house, you have hired the best experts you can fi nd. They’ve fi gured out exactly where the foundation should be placed. They’ve even perfectly wired everything in the kitchen, bedrooms, and media room.
After months of nail-biting, you move into this dream house to fi nd that this team has perfectly installed all your plumbing, heating, fuel, and electrical systems. The team has tested everything to make sure it all works. They even stick around long after moving day, checking in by remote con-trol to make sure everything is working in top condition.
Multiply the complexity of that undertaking by 100 or even 1,000 times, and on a far larger and riskier scale, in oil and gas fi elds around the world.
Founded in 1926, Schlumberger, the world’s leading oil-fi eld services company, performs such logistical feats for its oil and gas customers every day, whether in the tundra of western Siberia or in the deep waters off the coast of Brazil. With headquarters offi ces in Paris, Houston, and The Hague, Schlumberger is also the fi rst truly global company in its industry. With 115,000-plus employees, the company provides services at the wellsite thousands of times a year in some 85 countries the world
06_Cohen.indd 231 5/1/13 1:47:39 PM
232 Strategic Supply Chain Management
over. Schlumberger employees and equipment operate anywhere energy sources are found. Revenue in 2011 was $39.54 billion.
Schlumberger provides a full range of exploration, development, and production services for its customers, which include international opera-tors like ExxonMobil, national oil companies such as Saudi Aramco, and independent producers like Chesapeake. Schlumberger supplies the intel-lectual know-how, technology, information solutions, and integrated proj-ect management needed not just to extract energy from the earth but also to cover the entire life cycle of its customers’ oil and gas reservoirs.
Simply stated, Schlumberger is number one because, thanks to its people and technology, it provides the widest range of services, the broad-est geographical reach, and the strongest focus on execution.
GETTING TO FIRST OIL
Because most of the earth’s easily accessible oil and gas supply has been discovered and much is already in production, exploration increasingly occurs in remote places. The challenge in fi nding and tapping such reserves is huge, and the mobilization of people, equipment, technology, and raw materials to service these operations is a massively complex undertaking.
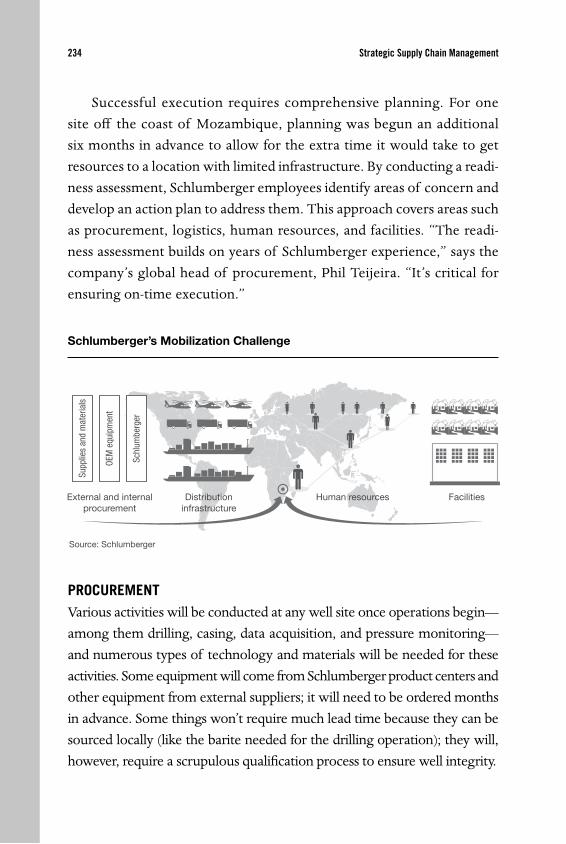
Schlumberger Services Throughout an Oil-Field Life Cycle
Schlumberger services cover the three phases of an oil-field life cycle: exploration, development, and production.
Source: Schlumberger
Exploration—Oil company scientists identify locations that contain subsurface oil or gas reservoirs andcontract companies like Schlumberger to perform various geophysical and geological surveys to build amodel of the subsurface. Schlumberger refers to this phase as “reservoir characterization.” The goal isto understand where and how much oil or gas is present and whether it is economical to produce it.One or more exploration wells are needed to confirm reservoir potential.
Development—Oil company engineers design how they are going to develop the field and drill it toproduce oil or gas. The goal is to place the wells in the reservoir as effectively and efficiently as possibleto meet production goals.
Production—Schlumberger provides different services and products to ensure that the well continuesto produce throughout its life cycle. The goal is to maximize reservoir recovery.
06_Cohen.indd 232 5/1/13 1:47:39 PM

PROFILE Schlumberger: Integrating People and Technology for Service Excellence 233
If drilling can’t start on the scheduled date, the delay drives extra costs for the oil company of between $0.5 million and $1 million per day for each deepwater oil rig it deploys in an off shore environment, not to mention one fewer day of revenue. So Schlumberger must do everything right the fi rst time. This challenge is especially daunting in remote locations, where the risks are that much higher.
In a typical off shore project, the oil and gas company hires a mobile off shore-drilling unit from a drilling contractor. Off shore rigs vary in type from platforms that “jack up” on legs standing on the sea bottom, to drillships or semi-submersible structures for deeper waters. Schlumberger provides almost all the products and services needed to drill and complete the well.
After the drilling unit is positioned above the selected location, which in this case is located beneath the sea fl oor, drilling begins, using a drill-string made up of 30-foot sections of drillpipe that are screwed together and that convey the drill bit and its measurement equipment into the well. As the drill advances, the drill bit cuts the rock, and the cuttings are conveyed up to the surface, where they can be analyzed. From time to time, drilling stops and measurements are made of the physical parameters of the rock formations through which the well has been drilled. Once the reservoir has been reached, the drill is removed from the hole, and steel tubes known as casings are run into the well to provide a permanent protective sheath once cemented in place. With this done, the well can be completed with the valves and gauges needed for production.
THE MOBILIZATION CHALLENGE
That’s the way a typical off shore well is drilled. Now imagine starting a well site from scratch in a country with a developing oil and gas industry, like Mozambique in East Africa. In this situation, Schlumberger has to get the right people, equipment, and infrastructure in place so that preparation of the well site can start without delay and, even more important, so that drilling can start without a glitch.
06_Cohen.indd 233 5/1/13 1:47:39 PM
234 Strategic Supply Chain Management
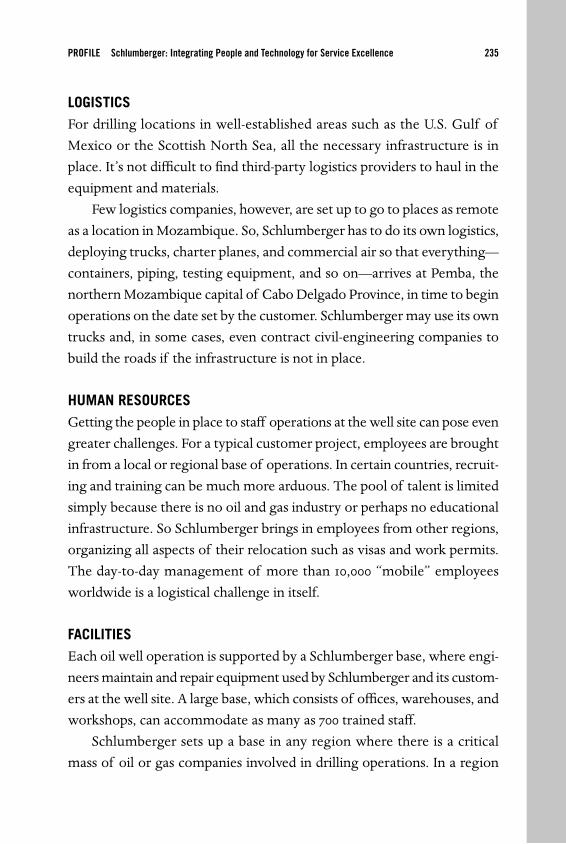
Successful execution requires comprehensive planning. For one site off the coast of Mozambique, planning was begun an additional six months in advance to allow for the extra time it would take to get resources to a location with limited infrastructure. By conducting a readi-ness assessment, Schlumberger employees identify areas of concern and develop an action plan to address them. This approach covers areas such as procurement, logistics, human resources, and facilities. “The readi-ness assessment builds on years of Schlumberger experience,” says the company’s global head of procurement, Phil Teijeira. “It’s critical for ensuring on-time execution.”
PROCUREMENTVarious activities will be conducted at any well site once operations begin—among them drilling, casing, data acquisition, and pressure monitoring—and numerous types of technology and materials will be needed for these activities. Some equipment will come from Schlumberger product centers and other equipment from external suppliers; it will need to be ordered months in advance. Some things won’t require much lead time because they can be sourced locally (like the barite needed for the drilling operation); they will, however, require a scrupulous qualifi cation process to ensure well integrity.
Schlumberger’s Mobilization Challenge
Human resourcesExternal and internalprocurement
Facilities
Schl
umbe
rger
OEM
equ
ipm
ent
Supp
lies
and
mat
eria
ls
Distributioninfrastructure
Source: Schlumberger
06_Cohen.indd 234 5/1/13 1:47:39 PM
PROFILE Schlumberger: Integrating People and Technology for Service Excellence 235
LOGISTICSFor drilling locations in well-established areas such as the U.S. Gulf of Mexico or the Scottish North Sea, all the necessary infrastructure is in place. It’s not diffi cult to fi nd third-party logistics providers to haul in the equipment and materials.
Few logistics companies, however, are set up to go to places as remote as a location in Mozambique. So, Schlumberger has to do its own logistics, deploying trucks, charter planes, and commercial air so that everything—containers, piping, testing equipment, and so on—arrives at Pemba, the northern Mozambique capital of Cabo Delgado Province, in time to begin operations on the date set by the customer. Schlumberger may use its own trucks and, in some cases, even contract civil-engineering companies to build the roads if the infrastructure is not in place.
HUMAN RESOURCESGetting the people in place to staff operations at the well site can pose even greater challenges. For a typical customer project, employees are brought in from a local or regional base of operations. In certain countries, recruit-ing and training can be much more arduous. The pool of talent is limited simply because there is no oil and gas industry or perhaps no educational infrastructure. So Schlumberger brings in employees from other regions, organizing all aspects of their relocation such as visas and work permits. The day-to-day management of more than 10,000 “mobile” employees worldwide is a logistical challenge in itself.
FACILITIESEach oil well operation is supported by a Schlumberger base, where engi-neers maintain and repair equipment used by Schlumberger and its custom-ers at the well site. A large base, which consists of offi ces, warehouses, and workshops, can accommodate as many as 700 trained staff .
Schlumberger sets up a base in any region where there is a critical mass of oil or gas companies involved in drilling operations. In a region
06_Cohen.indd 235 5/1/13 1:47:39 PM

236 Strategic Supply Chain Management
where hydrocarbons have not yet been discovered in substantial quanti-ties, Schlumberger provides support from a remote base. In the case of Mozambique, Schlumberger used the base in Angola and set up contain-ers to serve as temporary quarters. Later, when large gas discoveries were made, Schlumberger built a more permanent location. The company has amassed a solid network of bases over the years. All told, more than 1,000 are currently in operation worldwide.
While offshore rigs are self-contained and provide sleeping and dining for all crew members, land-based staff also need a place to live. Schlumberger therefore often has to rent houses and apartments in advance. In some cases, remote locations lack even such accommodations, so Schlumberger may need to have housing built.
MAKING THE SERVICE SUPPLY CHAIN WORK
Each step in the oil-fi eld development is a complex operation involving multiple Schlumberger product lines that work in tight coordination with the customer-facing “GeoMarket” organization that provides core management, human resources (HR), fi nance, and infrastructure sup-port. There are more than 30 GeoMarkets in all. Some consist of just one country, like Angola, while others, like Continental Europe, cover many countries.
GLOBAL SHARED SERVICESOrchestrating these resources across the company is critical for creating value for the customer. That’s where Global Shared Services comes in. The “functional backbone” of Schlumberger, this 12,000-person umbrella organization includes the functions of procurement, logistics, materials, facilities, information technology (IT), contract management, fi nance back-offi ce, and HR administration.
06_Cohen.indd 236 5/1/13 1:47:39 PM
PROFILE Schlumberger: Integrating People and Technology for Service Excellence 237
By providing these services to all the product lines in all the GeoMarkets across Schlumberger, Global Shared Services is able to standardize ways of working and leverage best practices. The organization aims to improve the quality and cost-eff ectiveness of the support that the various functions provide to the fi eld operation—support that in turn helps improve the quality of the services Schlumberger provides its customers.
“ONE FIRM”The shared services model is a good example of how Schlumberger’s “one fi rm” way of operating drives organizational agility. “Other companies talk about subsidiaries and internal board meetings, whereas for us, it’s all about making it happen for the customer,” head of Global Shared Services Stéphane Biguet notes. “There are no barriers. We just pick up the phone and call. When we go into a new country, it’s the same structure as on the other side of the world, so communication is much easier and we can quickly implement our standard processes.”
CUTTING-EDGE TECHNOLOGY AND THE EQUIPMENT SUPPLY CHAIN
Behind the services that take place at customer sites is an array of tools and equipment, made possible by the Schlumberger technology-development organization. This organization runs the gamut: fundamental research, proprietary technology development, original equipment manufacturer (OEM) integration, and product testing. The technology it develops pro-vides a critical source of diff erentiation for Schlumberger.
Providing cutting-edge technology is under the purview of Research, Engineering, Manufacturing, and Sustaining (REMS), an organization of about 10,000 people that is designed to support the technology needs of all the company’s diff erent product lines. REMS includes manufacturing and engineering centers, which are often located near each other.
06_Cohen.indd 237 5/1/13 1:47:40 PM
238 Strategic Supply Chain Management
PRODUCT DEVELOPMENTSchlumberger designs and produces its equipment, both internally and externally. Internally, the company has R&D centers in Brazil, the United Kingdom, Saudi Arabia, Russia, Norway, the United States, Canada, Japan, Singapore, and France, where it designs and develops proprietary tools and equipment. Notably, Schlumberger spends more on R&D than its two closest competitors combined.
Consider, for example, a wireline logging tool, a technology used for acquiring reservoir characterization data from the bottom of an oil well via an electric cable. A tube measuring only 3⅜ inches in diameter, this logging tool contains ten times the electronics of a laptop computer. Moreover, it is able to withstand intense pressure, extreme vibration, and temperatures of up to 150 degrees centigrade. “It’s as if I took my computer and dropped it 1,000 times on the concrete fl oor and then put it in the oven,” notes Magali Anderson, vice president of Shared Services for Europe and Africa. “Those are the kinds of extreme conditions our technology has to deal with.”
Schlumberger also uses equipment produced by OEMs. In a process called “external integration,” suppliers manufacture products such as engines and transmissions according to Schlumberger’s exact specifi cations. Because reliability and safety are essential, suppliers go through an exhaus-tive vetting process. They are evaluated on quality, reliability, and safety standards. The oversight doesn’t end there. After passing the Schlumberger test, each supplier works with a Schlumberger engineer to ensure equipment is consistently produced to Schlumberger’s high standards, with performance reviewed through a quarterly business-review process.
PRODUCT CENTERSSchlumberger’s various “product centers” provide equipment for the company’s 17 product lines. Well Services, for example, is supported by product centers in the United States, France, and Singapore. The Well Services product centers provide the equipment—pumps, cementing units, and so on—for well services conducted on trailers and trucks or installed as
06_Cohen.indd 238 5/1/13 1:47:40 PM

PROFILE Schlumberger: Integrating People and Technology for Service Excellence 239
skids on off shore rigs or fl oating vessels. They are responsible for managing design, sourcing, and manufacturing.
The product centers always remain accountable for the quality and reliability of what they supply. Each center continuously solicits and gets feedback on product issues from fi eld personnel, which it uses to solve problems as well as to improve product designs for future use.
Take, for example, the internal suction damper (ISD) used in certain types of well site pumps. On the basis of extensive feedback from the fi eld, the product center designed a new ISD that weighed a lot less, cost less, and functioned better.
Having the perspective of internal customers is paramount. “We regularly hire people with fi eld experience for positions in the product center,” notes the product group supply chain manager for pressure pumping and chemistry, Tammy Macaluso. “That way people in the product center can understand how the customer feels when the product arrives late or doesn’t function correctly. It gives us more integrity as an organization.”
PEOPLE: MAKING THE DIFFERENCE
While Schlumberger’s services and technologies are important, its people are the key reason for the company’s success. To retain its leading edge in service delivery, the company makes an enormous investment in its employees, going to great lengths to fi nd the best and the brightest and then developing them through rigorous training and career management.
HIRING THE BESTSchlumberger hires a staggering number of engineers and scientists—some 5,000 a year. Finding that many qualifi ed people requires combing top universities for students completing degrees in mechanical, electrical, and industrial engineering as well as physics, chemistry, and geophysical sciences.
06_Cohen.indd 239 5/1/13 1:47:40 PM
240 Strategic Supply Chain Management
Typically, new hires become fi eld engineers, the key entry-level position. Since engineering programs don’t generally provide the hands-on knowledge needed in an oil well operation, fi eld engineers go through an intensive training program that lasts six to seven months. The Schlumberger way is to promote from within, so training as well as job rotation play a key role in the development of technical and managerial skills.
Field engineers typically progress toward promotion to operations managers, who are responsible for a particular product line in their loca-tion or GeoMarket. They may be in charge of drilling operations in East Africa, for example, or production operations in Australia. The opera-tions manager oversees everything related to that activity. “The ops man-ager basically runs the business of that segment,” Magali Anderson notes. “That’s everything—managing the customers, getting the tenders, winning the tenders, and organizing the operations. He is running his or her little company.”
DEVELOPING A GLOBAL TALENT POOLFor fi eld engineers, service managers, and operations managers alike, Schlumberger’s goal is to develop a global talent pool. The company makes a practice of sending people to other countries where they can learn directly about diff erent fi eld operations, technology development, and more. As these employees gain skills and knowledge, they are given the opportunity to try other locales or to return to their country of origin. Schlumberger provides this opportunity while at the same time developing the diversity among the workforce that only a truly global organization can achieve.
Some operations managers go on to hold senior management posi-tions. Many of the company’s senior managers, in fact, started out in the fi eld. “Schlumberger challenges people with high potential to learn the entire business. They’ll put a fi eld guy in assignments in human resources, or in procurement,” says Phil Teijeira. “By the time they’re
06_Cohen.indd 240 5/1/13 1:47:40 PM

PROFILE Schlumberger: Integrating People and Technology for Service Excellence 241
in a senior management position, these people have been in every role, and understand every region and every operation.”
Schlumberger does not limit professional development to engineers. Functional staff , such as sourcing experts, logistics specialists, IT technicians, and accountants, are required to participate in the company’s competency-management program.
EXCEEDING CUSTOMER EXPECTATIONS
Despite all of the oil and gas drilling technology currently in use and the new methods in development, a question remains: Will the world have enough energy to meet its needs? The International Energy Agency forecasts the global demand for primary energy to grow by approximately 35 percent from 2011 through 2035 and that oil and gas, along with coal, will still dominate the energy mix.1
Meeting this demand requires a wide range of energy resources. When it comes to oil and gas, the majority of new reservoirs are located in uncon-ventional and diffi cult-to-access places. Doing jobs right the fi rst time in the worst conditions will require Schlumberger to keep doing what it has been doing—maintain its focus on service execution, technology, and people while aspiring to always exceed customer expectations.
06_Cohen.indd 241 5/1/13 1:47:40 PM

ABOUT THE AUTHORS
Shoshanah Cohen is director of the Global Supply Chain Management Forum, an academic/industry partnership at Stanford University’s Graduate School of Business. Prior to joining Stanford, she was a senior partner at PRTM Management Consulting, where she led PRTM’s Global Supply Chain Innovation practice. She is a frequent writer and speaker on global operations strategy. She holds a BS in Industrial Engineering from Stanford University, an MA in Technology Strategy from Boston University, and an MBA from Harvard University.
Joseph Roussel is a partner in PwC’s Strategy and Operations practice. Prior to joining PwC, he was a partner at PRTM Management Consulting, where he helped develop the original SCOR® model. A graduate of Louisiana State University, l’Université Libre de Bruxelles, and The Fletcher School at Tufts University, he regularly leads executive education in operations innovation and transformation.
10_Cohen_Index.indd 299 5/1/13 1:23:05 PM

Copyright © 2013 Shoshanah Cohen and Pricewaterhousecoopers Advisory. All rights reserved. Except as permitted under the United States Copyright Act of 1976, no part of this publication may be reproduced or distributed in any form or by any means, or stored in a database or retrieval system, without the prior written permission of the publisher.
ISBN: 978-0-07-181309-9
MHID: 0-07-181309-8
The material in this eBook also appears in the print version of this title: ISBN: 978-0-07-181308-2, MHID: 0-07-181308-X.
All trademarks are trademarks of their respective owners. Rather than put a trademark symbol after every occurrence of a trademarked name, we use names in an editorial fashion only, and to the benefi t of the trademark owner, with no intention of infringement of the trademark. Where such designations appear in this book, they have been printed with initial caps.
McGraw-Hill Education books are available at special quantity discounts to use as premiums and sales promotions or for use in corporate training programs. To contact a representative, please e-mail us at [email protected].
TERMS OF USE
This is a copyrighted work and McGraw-Hill Education and its licensors reserve all rights in and to the work. Use of this work is subject to these terms. Except as permitted under the Copyright Act of 1976 and the right to store and retrieve one copy of the work, you may not decompile, disassemble, reverse engineer, reproduce, modify, create derivative works based upon, transmit, distribute, disseminate, sell, publish or sublicense the work or any part of it without McGraw-Hill Education’s prior consent. You may use the work for your own noncommercial and personal use; any other use of the work is strictly prohibited. Your right to use the work may be terminated if you fail to comply with these terms.
THE WORK IS PROVIDED “AS IS.” McGRAW-HILL EDUCATION AND ITS LICENSORS MAKE NO GUARANTEES OR WARRANTIES AS TO THE ACCURACY, ADEQUACY OR COMPLETENESS OF OR RESULTS TO BE OBTAINED FROM USING THE WORK, INCLUDING ANY INFORMATION THAT CAN BE ACCESSED THROUGH THE WORK VIA HYPERLINK OR OTHERWISE, AND EXPRESSLY DISCLAIM ANY WARRANTY, EXPRESS OR IMPLIED, INCLUDING BUT NOT LIMITED TO IMPLIED WARRANTIES OF MERCHANTABILITY OR FITNESS FOR A PARTICULAR PURPOSE. McGraw-Hill Education and its licensors do not warrant or guarantee that the functions contained in the work will meet your requirements or that its operation will be uninterrupted or error free. Neither McGraw-Hill Education nor its licensors shall be liable to you or anyone else for any inaccuracy, error or omission, regardless of cause, in the work or for any damages resulting therefrom. McGraw-Hill Education has no responsibility for the content of any information accessed through the work. Under no circumstances shall McGraw-Hill Education and/or its licensors be liable for any indirect, incidental, special, punitive, consequential or similar damages that result from the use of or inability to use the work, even if any of them has been advised of the possibility of such damages. This limitation of liability shall apply to any claim or cause whatsoever whether such claim or cause arises in contract, tort or otherwise.
![GLOBAL SUPPLY CHAIN MANAGEMENT [Author] [Institution] › portfolio › Global Supply Cha… · GLOBAL SUPPLY CHAIN MANAGEMENT [Author] [Institution] GLOBAL SUPPLY CHAIN MANAGEMENT](https://static.fdocuments.net/doc/165x107/5f0434ae7e708231d40cd5e9/global-supply-chain-management-author-institution-a-portfolio-a-global-supply.jpg)