Strategic Plan to Address Homelessness Houston/ … · o Ritalinda D’Andrea, Ph.D. University of...
141
Strategic Plan to Address Homelessness Houston/ Harris County Blue Ribbon Commission to End Chronic Homelessness Houston/Harris County May 2006
Transcript of Strategic Plan to Address Homelessness Houston/ … · o Ritalinda D’Andrea, Ph.D. University of...
Strategic Plan to Address Homelessness Houston/ Harris County
Blue Ribbon Commission to End Chronic Homelessness Houston/Harris County
May 2006
Table of Contents COMPONENTS OF THE 10 YEAR PLAN
1. Strategic Plan to Address Homelessness……………………………………Tab 1 a. Context b. Synthesis of Research Findings c. Strategic Plan Goals d. Summary of Year 1 Action Steps e. Funding Requirements f. Summary of Data Report Findings g. Models used to Develop Plan
2. Summary of System Management Function…………………………………Tab 2
3. Enumeration and Needs Assessment………………………………………...Tab 3 a. Enumeration b. Community Profile c. Profiles of Specific Sub-Populations d. Conclusions e. Recommendations
4. Gaps Analysis……………………...………………………………………...…..Tab 4
5. Rapid Re-housing Demonstration Report………………………………….....Tab 5 a. Pierce Intervention Evaluation
6. Open Doors Report………………………………………………………………Tab 6 a. Rapid Assessment of Needs of Hurricane Evacuees

Blue Ribbon Commission to End Chronic Homelessness Anna Babin United Way of the Texas Gulf Coast David Benson Harris County Commissioners Court David S Buck, MD, MPH Department of Family & Community Medicine Baylor College of Medicine James Calaway Center for Houston’s Future Robert Eury Central Houston, Inc. The Most Reverend Bishop Fiorenza The Diocese of Galveston – Houston Skip Kasdorf Greater Houston Partnership Richard Lapin City of Houston Anna Leal Houston Endowment, Inc.
The Honorable Pat Lykos Harris County Anthony Love Coalition for the Homeless of Houston/Harris County Barry Mandel Houston Downtown Alliance Jackie Martin J.S. Martin Associates, LP Vickie L. McBride City of Houston Department of Housing & Community Development The Honorable Gordon Quan Former City Council Member At Large, Position 2 Sally Shipman The United States Interagency Council on Homelessness Region VI Coordinator – Southwestern States Richard Wilson Operations Specialist, U.S. Dept. HUD
Participating Provider Organizations: Executive Directors Group
AIDS Foundation Houston John Huckaby
Catholic Charities of the Diocese of Galveston-Houston Joe Rubio
Children at Risk Barbara McCormick
City of Houston Vickie McBride
Coalition for the Homeless Anthony Love Anne Thomas
Healthcare for the Homeless-Houston Frances Isbell
The Houston Housing Corporation Earl Hatcher Caroline Zorn Pickens
Houston Veterans Administration Medical Center George Castillo Vincent Clancy David Sands
Mental Health and Mental Retardation Administration of Harris County Tom Mitchell
Ryan White Planning Council Tori Williams
SEARCH Sandy Kessler Tao Costa Cathy Crouch
Salvation Army Major Henry Gonzales Major John Jones
Star of Hope Mission Randy Tabor Gary Brown
The Women’s Home Paula Paust Debbie Drake
United Way of the Texas Gulf Coast Linda O’Black Jeff Stys
U.S. Veterans Todd Johnson
Research Team • Enumeration, Needs Assessment and Gap Analysis
o Ritalinda D’Andrea, Ph.D. University of Houston Graduate College of Social Work o Cache Steinberg, Ph.D. University of Houston Graduate College of Social Work o Lalita Sen, Ph.D. Texas Southern University
Supported by the City of Houston Department of Housing and Community Development, Houston Downtown Management District, United Way of the Texas Gulf Coast and the Michael E. DeBakey Veterans Administration Medical Center
• Pierce Intervention
o Ritalinda D’Andrea, Ph.D. University of Houston Graduate College of Social Work o Anthony Love, Coalition for the Homeless
Supported by the Houston Downtown Management District, City of Houston Department of Housing and Community Development, Houston Endowment, United Way of the Texas Gulf Coast, METRO, Houston Downtown Alliance and Midtown Management District
• Open Doors Assessment
o Ritalinda D’Andrea, Ph.D. University of Houston Graduate College of Social Work o Jeff Stys, United Way of the Texas Gulf Coast
Supported by the Houston Downtown Management District and United Way of the Texas Gulf Coast

1
STRATEGIC PLAN TO ADDRESS HOMELESSNESS For Houston and Harris County
—prevention, intervention, re-housing, stability— Submitted by the Blue Ribbon Commission to End Chronic Homelessness
May, 2006 To be homeless, living on the streets, is to carry in your backpack not just all that you own, but also the heavy weight of misconceptions about who you are, why you live as you do and what it would take for you to change your circumstances. You walk among the housed but no one looks directly at you anymore, as though your presence threatens to expose the fragility of health, mental health, economic security and unnamed, frightening circumstances that color judgment and choice. Not just yours, but theirs. Regardless of the context, efforts to confront homelessness consistently seem to try first to answer the question, “why?” Research from numerous sources reveals a constellation of factors that surround homelessness. Ultimately, homelessness is most often associated with situational or generational poverty that is brought about by a range of possible situations. Among them:
o Lack of a source of income o Lack of affordable housing o Substance abuse o Disability or illness o Mental illness o Lack of access to employment o Displacement from natural disaster o Inadequate access to, availability or efficacy of prevention or intervention services o Lack of education o Domestic violence o Incarceration o Return from military service o Discriminatory practices in housing and hiring
As communities and policy makers haggle over causes, individuals at risk of homelessness lose whatever shelter they may have had. This is the scope of “why.” While there are similarities among individuals, the balance between extrinsic and intrinsic is unique to each and is best served by very effective individual-level interventions. Individual-level interventions alone are, however, inadequate to solve the challenge of ending homelessness. Moving beyond the debate and the limitations requires a more thorough examination of the phenomenon of homelessness at a level beyond that of the individual. “What,” “Where” and “Who” questions become more important than the repeated, “Why?” Examples of these questions include:
o How many homeless persons live within a particular area? o What are their common characteristics? o Where do they congregate? o What services do they seek and receive? o What is the effect of those services?
2
o What is the portfolio of permanent housing units for low-income and no-income individuals?
o What long-term accommodations can be made for persons displaced by natural disasters?
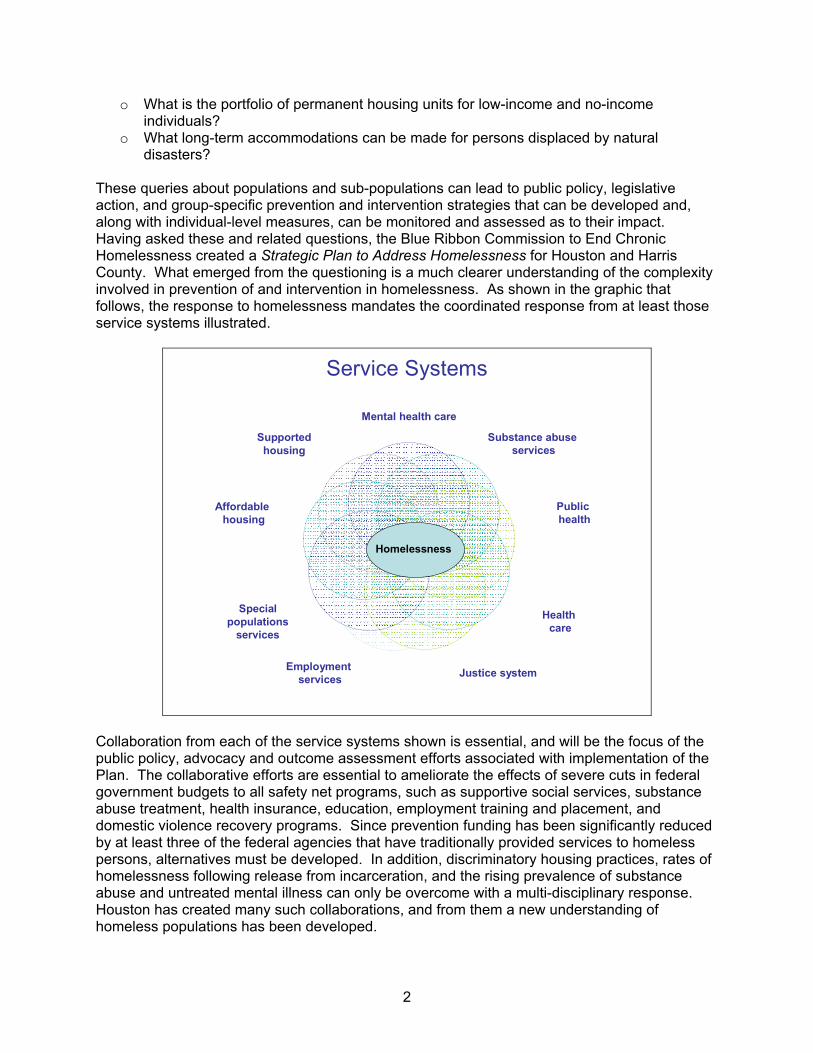
These queries about populations and sub-populations can lead to public policy, legislative action, and group-specific prevention and intervention strategies that can be developed and, along with individual-level measures, can be monitored and assessed as to their impact. Having asked these and related questions, the Blue Ribbon Commission to End Chronic Homelessness created a Strategic Plan to Address Homelessness for Houston and Harris County. What emerged from the questioning is a much clearer understanding of the complexity involved in prevention of and intervention in homelessness. As shown in the graphic that follows, the response to homelessness mandates the coordinated response from at least those service systems illustrated.
Service Systems
Mental health care
Substance abuse services
Public health
Health care
Justice systemEmployment services
Specialpopulations
services
Affordable housing
Supportedhousing
Homelessness
Collaboration from each of the service systems shown is essential, and will be the focus of the public policy, advocacy and outcome assessment efforts associated with implementation of the Plan. The collaborative efforts are essential to ameliorate the effects of severe cuts in federal government budgets to all safety net programs, such as supportive social services, substance abuse treatment, health insurance, education, employment training and placement, and domestic violence recovery programs. Since prevention funding has been significantly reduced by at least three of the federal agencies that have traditionally provided services to homeless persons, alternatives must be developed. In addition, discriminatory housing practices, rates of homelessness following release from incarceration, and the rising prevalence of substance abuse and untreated mental illness can only be overcome with a multi-disciplinary response. Houston has created many such collaborations, and from them a new understanding of homeless populations has been developed.

3
Shift in Understanding of Homeless Populations Models of treatment often assume that the endpoint for clients is the ability to work at jobs that can sustain them in stable and secure housing, however, as the research upon which this Plan is based has shown, this assumption is inaccurate. The research found that in order to maintain permanent housing, 35% of homeless persons will require lifelong, extensive care; 55% will need on-going contact with at least one service provider, and only 10% are affected by short-term, one-time homelessness. As shown on Tab 1 of this document, the current Continuum of Care within which homeless services are provided would be best reconfigured as three interrelated systems of care to serve each of these groups. To maintain permanent housing, an estimated 35% of homeless persons require lifelong care from a range of service providers due to disabilities or conditions that are very debilitating and intractable. Within this group are persons who have a major mental illness such as schizophrenia, or are developmentally delayed, or have untreated, severe substance abuse or a serious medical condition or disability that precludes their ability to work or live in an unsupervised setting. Services to this population might include intensive case management, long-term medical care, psychiatric treatment and medication monitoring, substance abuse treatment, social skills training. All will require supervised, supportive, permanent housing in clinical and non-clinical settings. It is noteworthy that many of the services provided to this group are reimbursable through public programs such as Medicaid and HUD-sponsored housing. Recidivism among clients in food programs, clinical services and even supported health care is often interpreted as “treatment failure” and yet, for 55% of clients, continued participation in these activities is necessary to prevent their future homelessness. Within this group are persons whose compromises fall into many of the same categories found in the extensive care group, but with less severity. As long as they maintain continued contact with the system of care, most will be able to work, at least episodically, and many will be able to live in independent housing — some in market rate housing and others in residences designated for persons with low income. In addition to the services listed above, many in this group will benefit from job training, job placement and asset building services. Finally, 10% of homeless persons will be able to permanently exit the system of care within a year if they receive assistance that is focused, re-establishing their financial security. Rental and utility assistance are examples of the types of services that are useful to this group, although some also benefit from employment-related services, medical care, and mental health or substance abuse treatment. Though most of the efforts and resources of service providers are expended on the chronically homeless, many of whom fall in the 35% group, service delivery models are too often based on the service needs of the 10% group. This can leave clients underserved and providers frustrated with the mandate to accomplish outcomes based on expectations that are not appropriate to their clients. They are further challenged with a service demand far beyond current capacity. For example, in 2005 there were approximately 12,000 homeless persons identified in a point-in-time count, and 51% resided on the streets. At that same time, the community had access to only 900 supported permanent housing units, and that was prior to August, 2005, and the onslaught of Hurricanes Katrina and Rita.
4
Displaced Persons — The New At-Risk Population To these groups, another emerged when the Houston community received approximately 300,000 evacuees from Hurricanes Katrina and Rita. Of these, 130,000 persons remained housed in supported housing units, 6 months after their displacement. The persons for the most part were employed and housed prior to their relocation. What they will require to rebuild their lives is as yet unknown. What is known is that assistance to evacuees requires a unique service model, with overlap in homeless services, especially prevention services. That model emerged as a result of the exceptional collaboration between the private and public sectors in response to the evacuation. It assumes that the provision of housing is the most basic service and that non-traditional, non-clinical sites can be procured and supported for a limited time. On-going communication among providers and with clients as well as monitoring of the status of clients has kept most people housed since their relocation. New challenges are arising, as federal support is in jeopardy. While options are being generated, the outcome is uncertain. Sustainability System Management and Support Implementation of this Plan requires the creation of a management system for advocacy, oversight, assessment and reporting. This is proposed to be a function of the Coalition for the Homeless under the direction of Board of Directors with defined accountability to the community at large. Support of the implementation will necessitate the strategic spending of current levels of funding for programs and housing that meet standards of care, and represent the practices that are documented to be effective in preventing homelessness and assisting homeless persons to stabilize in permanent housing. The infusion of outcome assessment in each aspect of this Plan will allow for monitoring the return on the investment in each program and provide the basis for decisions about future spending. This may begin by redirecting current funds to programs that document the greatest effect for persons at each level of care. It may also motivate federal and philanthropic sources to increase resources and support the more coordinated service delivery model that is proposed in the Plan.
5
CONTEXT The purpose of this Strategic Plan is to provide guidelines to assure that permanent, secure and safe housing for all eligible persons will be acquired and maintained through the creation and implementation of: 1) public policies; 2) system management; 3) housing stock; and, 4) effective social services, public health and economic infrastructures that eradicate chronic homelessness and prevent and intervene in episodic and intermittent homelessness in a context that is compassionate, effective and sustainable. The Plan was developed under the auspices of the Blue Ribbon Commission to End Chronic Homelessness (BRC). The Commission was formed in April 2004 to collaborate with the Coalition for the Homeless of Houston/Harris County (Coalition), city and county officials and service providers to mobilize resources in Houston/Harris County to assure that no one in the community will be driven to homelessness due to lack of income, support services or access to affordable housing. As part of their mission, the BRC has overseen the planning process that will lead to the development of a Strategic Plan to Address Homelessness, which would comply with the mandate of the Interagency Council. Members of the BRC include city and county officials, a representative from the Interagency Council to End Chronic Homelessness and HUD, business leaders, economic development professionals, philanthropic organizations, a healthcare representative, and the Coalition. Administrative support to the BRC is provided by United Way. The BRC directed the development of the Plan to End Chronic Homelessness, advocated for support of homeless services with relevant planning and policy groups, and generated funding for the Plan.
The BRC was instrumental in the formation of the Executive Directors Group, a collaboration of directors of agencies that serve homeless persons. This group actively participated in the collection and interpretation of data from the Enumeration and Needs Assessment of homeless persons and, with the Coalition, will enact, direct and evaluate the interventions included in the Plan. These planning groups (BRC, Directors Group, Coalition) created a comprehensive strategic action plan that is based on social science research and interventions that have been proven to be effective and sound public policy. The Plan is based on findings from the following community research studies: 2005 Enumeration and Needs Assessment of Homeless Persons in Houston/Harris County
(Section 3 of this report)
o This comprehensive study of the service needs, rates of service use and perceptions of access involved more than 2,200 currently homeless individuals who were surveyed and an additional 100 who participated in focus groups. In addition, providers of services to homeless persons participated in focus groups and interviews to report on the service and housing resources, gaps and barriers to access. The study also included five monthly counts of sheltered and unsheltered homeless persons.
2005 Resource Gap Analysis (Section 4 of this report)
o Data were gathered from provider surveys and secondary sources, such as IRS Form
990s, federal grant applications, to further assess the resources and gaps in housing and services for homeless persons.
6
2005 Evaluation of the Rapid Re-housing Intervention (Section 5 of this report)
o Process monitoring and qualitative evaluation were conducted at intake and four weeks after a street-based re-housing intervention for chronically homeless persons who were residing under the highway overpass at Pierce Street in Houston.
2005 Rapid Needs Assessment of Hurricane Evacuees (Section 6 of this report)
o A assessment to determine the pre-evacuation status and current perception of basic
services, social services, health care and mental health care needs of more than 5,200 heads of households, representing 19,200 individuals was conducted within the first four weeks following the evacuation to Houston of survivors of Hurricanes Katrina and Rita.
7
SYNTHESIS OF RESEARCH FINDINGS From this diverse collection of data, several conclusions can be drawn.
• The immediate cause of homeless is poverty, whether generational or situational. Poverty results from a constellation of factors that are intrinsic or extrinsic to the homeless person. These may include any combination of conditions such as unemployment, mental illness, substance abuse, medical conditions, aging out of foster care, history of incarceration, re-entry from military service, domestic violence, limited education, lack of job skills, discrimination, and faltering economy.
• The availability of and access to services has diminished due to severe funding cuts at
all levels of government across the spectrum of housing options and supportive services.
• More accurate data about current resources, expenditures and costs of housing and services must be generated to support more effective planning.
• When chronically homeless persons were offered housing in either clinical or non-clinical
settings, none refused and after 30 days, most remained housed.
• Within Houston and Harris County, Rapid Re-housing Intervention for more than 34,000 households (130,000 persons) displaced by Hurricanes Katrina and Rita was accomplished with existing community resources and with federal funding.
• The resettlement model enacted for Houston’s hurricane evacuees created a replicable
services model for housing the chronically homeless.
• With the variability and limited duration of public support available for persons displaced to Houston by the 2005 hurricanes, there remains a risk of dramatic increases in homelessness in the region.
• Intervention should be developed for the population of homeless persons based on their
levels of service need or acuity: long-term care for 35% of the population; on-going, periodic care for 55% of the population; temporary care for 10% of the population.
• To eliminate homelessness, individuals must be able to meet needs at the following four
levels: o Material (housing, food, clothing, transportation, etc.) o Social (sense of belonging, friendships, etc.) o Income (living wage) o Psychological (self-worth, personal responsibility, sense of contribution, etc.)
• Homelessness is a multi-faceted public health problem that requires policies and
intervention at three levels: o Community-level interventions (CLI) o Group-level interventions (GLI) o Individual-level interventions (ILI)
The Plan is a flexible document that will be subject to annual revision based on the findings of ongoing outcome assessment, documented changes in client need, public will and availability of

8
resources. The planners of this document believe that homelessness can and will be addressed by the collective efforts of the Houston community, which has well documented the capacity for compassion, innovation and successful resolution of significant challenges. Unmet Permanent Housing Needs Analysis The unwavering goal of this Plan is to address the need for persons who are homeless or at risk of homelessness to obtain, maintain and sustain permanent housing. Based on the findings of the Needs Assessment (see Section 3 of this Plan), it was determined that for 10% of homeless persons (Temporary care group), re-housing would require brief shelter, variable levels of services, and a possible term in transitional housing. With that help, they would be capable of self-support with no need for supported housing. For 35% (Extensive care group) of the 12,000 homeless persons, there is need for extensive care and lifelong services that include supported permanent housing. For the final 55% (Ongoing care group), it is assumed that they require some level of care throughout their lives, but that would range from individuals who require supported housing and services — slightly less than is required by the extensive care group — to individuals who have no need for permanent supported housing, but require some level of support services, more like those in the temporary care group. For planning purposes, it is assumed 30% of the Ongoing care group would not need supported housing, though they may require affordable housing. Thus, as shown in the following table, using the inventory of permanent housing reported in the 2006 Continuum of Care grant, the unmet housing need as of the date of this Plan is 7,289 beds.
Number of Homeless person in 2005 enumeration 12,000
2006 Inventory of Permanent housing beds 1,531
Number of persons in Temporary care group 1,200
Number of persons in Ongoing care group who will not need supported housing 1,980
TOTAL Deductions 4,711
TOTAL unmet need 7,289

9
STRATEGIC PLAN GOALS Assuming the accuracy of this analysis, implementation of the Plan should accomplish the following goals, as measured by the progress measures included with each. These indicators will be analyzed annually as part of the HUD Continuum of Care (Super NofA) process and will be presented to the community in an annual report. It is important to note that this Plan will be a work-in-progress, as it must be, with refinements coming with each update from the annual data reports, assessments of client outcome and changes in the external factors that affect a community’s susceptibility or resilience to homelessness. 1. Housing and Re-housing
• Premise: o An essential requirement for ending homelessness is the generation of additional
permanent housing units Based on the current statistics, there are approximately 12,000 homeless
persons in any point in time. Thirty-five percent of these individuals will require fully subsidized housing and related services, 55% will require varying levels of support over the course of their lifetimes. This Plan proposes to bridge the deficits in permanent housing in 2 ways: 1) development of additional scattered site and congregate properties each year and, 2) leasing of scattered site and congregate properties each year, until an adequate number of housing options are secured. These sites will be service enriched at the level determined by the need of the clients and funds available.
Goal 1A
• Permanent housing is the goal of all programs that serve the homeless and those who are at risk of homelessness, with the assumption that 35% of clients will need extensive care, 55% will be intermittently involved with the service system throughout their lives and 10% will need only one-time, short-term assistance, as illustrated in the Houston Model to End Chronic Homelessness. Progress measures:
Number of homeless persons as measured by annual street and shelter counts and Homeless Management Information System (HMIS) reports of unduplicated clients
Analysis of HMIS data for rates of entry and re-entry into the system of care, duration and types of services
Point in time count to be held during the third week in January Year 1 outcomes
5% decrease per year in number of persons who are homeless as measured by point-in-time counts and census reported in HMIS
100% participation in HMIS of HUD-funded homeless shelter and housing and service agencies
Goal 1B
• The stock of affordable housing will include an adequate number of units including Single Resident Occupancy units (SROs) for low-income and no-income residents.
10
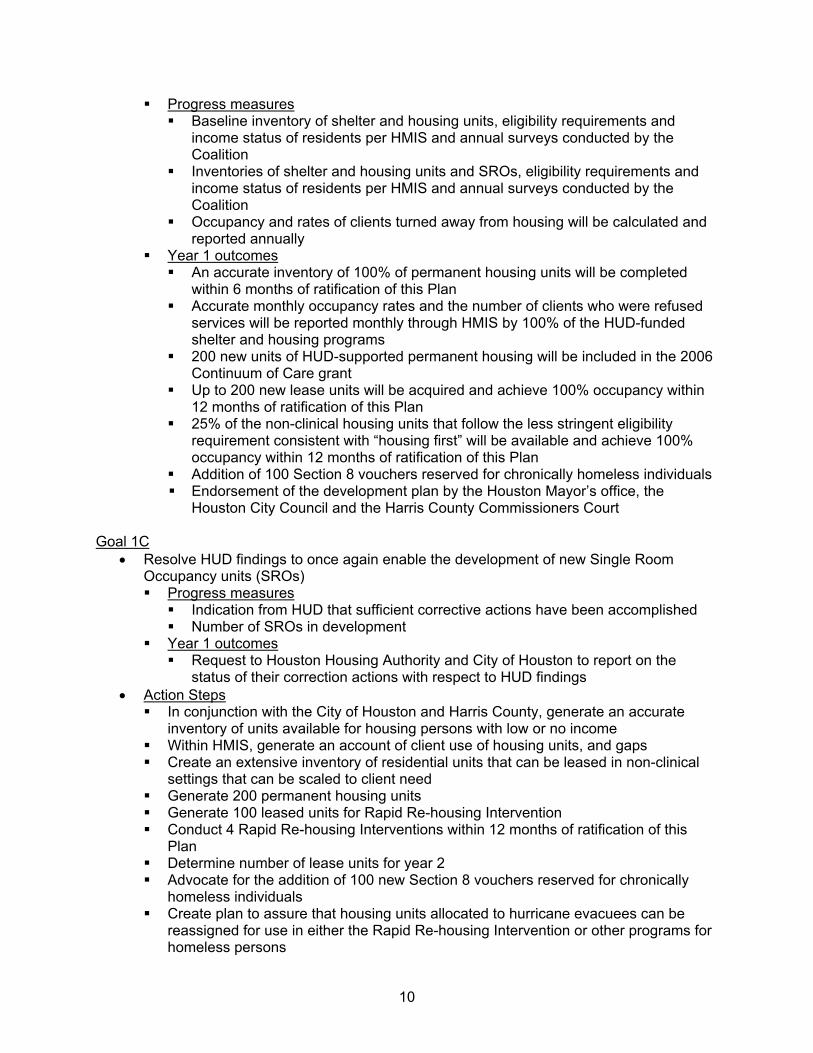
Progress measures Baseline inventory of shelter and housing units, eligibility requirements and
income status of residents per HMIS and annual surveys conducted by the Coalition
Inventories of shelter and housing units and SROs, eligibility requirements and income status of residents per HMIS and annual surveys conducted by the Coalition
Occupancy and rates of clients turned away from housing will be calculated and reported annually
Year 1 outcomes An accurate inventory of 100% of permanent housing units will be completed
within 6 months of ratification of this Plan Accurate monthly occupancy rates and the number of clients who were refused
services will be reported monthly through HMIS by 100% of the HUD-funded shelter and housing programs
200 new units of HUD-supported permanent housing will be included in the 2006 Continuum of Care grant
Up to 200 new lease units will be acquired and achieve 100% occupancy within 12 months of ratification of this Plan
25% of the non-clinical housing units that follow the less stringent eligibility requirement consistent with “housing first” will be available and achieve 100% occupancy within 12 months of ratification of this Plan
Addition of 100 Section 8 vouchers reserved for chronically homeless individuals Endorsement of the development plan by the Houston Mayor’s office, the
Houston City Council and the Harris County Commissioners Court Goal 1C
• Resolve HUD findings to once again enable the development of new Single Room Occupancy units (SROs) Progress measures
Indication from HUD that sufficient corrective actions have been accomplished Number of SROs in development
Year 1 outcomes Request to Houston Housing Authority and City of Houston to report on the
status of their correction actions with respect to HUD findings • Action Steps
In conjunction with the City of Houston and Harris County, generate an accurate inventory of units available for housing persons with low or no income
Within HMIS, generate an account of client use of housing units, and gaps Create an extensive inventory of residential units that can be leased in non-clinical
settings that can be scaled to client need Generate 200 permanent housing units Generate 100 leased units for Rapid Re-housing Intervention Conduct 4 Rapid Re-housing Interventions within 12 months of ratification of this
Plan Determine number of lease units for year 2 Advocate for the addition of 100 new Section 8 vouchers reserved for chronically
homeless individuals Create plan to assure that housing units allocated to hurricane evacuees can be
reassigned for use in either the Rapid Re-housing Intervention or other programs for homeless persons
11
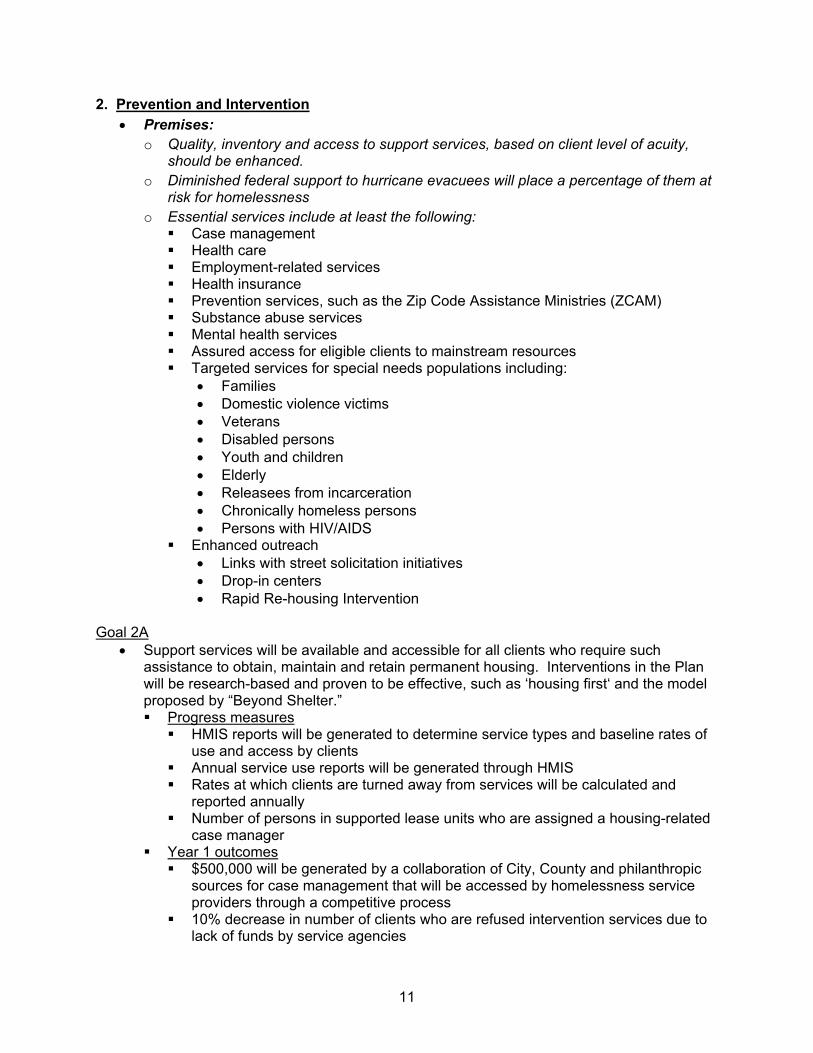
2. Prevention and Intervention • Premises:
o Quality, inventory and access to support services, based on client level of acuity, should be enhanced.
o Diminished federal support to hurricane evacuees will place a percentage of them at risk for homelessness
o Essential services include at least the following: Case management Health care Employment-related services Health insurance Prevention services, such as the Zip Code Assistance Ministries (ZCAM) Substance abuse services Mental health services Assured access for eligible clients to mainstream resources Targeted services for special needs populations including:
• Families • Domestic violence victims • Veterans • Disabled persons • Youth and children • Elderly • Releasees from incarceration • Chronically homeless persons • Persons with HIV/AIDS
Enhanced outreach • Links with street solicitation initiatives • Drop-in centers • Rapid Re-housing Intervention
Goal 2A
• Support services will be available and accessible for all clients who require such assistance to obtain, maintain and retain permanent housing. Interventions in the Plan will be research-based and proven to be effective, such as ‘housing first‘ and the model proposed by “Beyond Shelter.” Progress measures
HMIS reports will be generated to determine service types and baseline rates of use and access by clients
Annual service use reports will be generated through HMIS Rates at which clients are turned away from services will be calculated and
reported annually Number of persons in supported lease units who are assigned a housing-related
case manager Year 1 outcomes
$500,000 will be generated by a collaboration of City, County and philanthropic sources for case management that will be accessed by homelessness service providers through a competitive process
10% decrease in number of clients who are refused intervention services due to lack of funds by service agencies

12
100% of clients who are provided residence in clinical and non-clinical lease units as a result of the Rapid Re-housing intervention will be assigned a housing-related case manager
System manager will develop and release an request for proposals for outreach coordination
Goal 2B
• Prevention services will be available and accessible for those in a housing crisis or otherwise at risk of homelessness. Progress measures
HMIS reports will be generated to determine service types and baseline rates of use and access by clients
At intake, rates of prevention service by type and frequency of use by newly homeless clients will be recorded and reported annually
Rates at which clients are turned away from services will be calculated and reported annually
Number of persons at risk for homelessness who receive rental and/or utility assistance
Year 1 outcomes $500,00 will be generated by a collaboration of City, County and philanthropic
sources for rental and utility payment assistance that will be accessed by homelessness services providers through a competitive process
10% decrease in number of clients who are refused prevention services due to lack of funds by service agencies
Goal 2C
• Public/private partnerships that address the causes of homelessness will be developed with policy makers and providers of mental health care, medical care, substance abuse prevention and treatment, health insurance, and housing. Progress measures
In the first year following implementation of the Plan, through collaborations with designated policy makers, an inventory of number of service slots in each of the above areas, available and accessible to homeless persons will be conducted.
Through collaborations, annual updates to needs assessments in each of the above areas will be conducted
A collaboratively developed services funding plan will be developed within 24 months of acceptance of this Plan
Changes in the number and types of service units and other outcomes incorporated into the services funding plan will be conducted annually
Year 1 outcomes Of the 200 new permanent housing units included in the 2006 Continuum of Care
application, 30% will be designated for homeless clients with diagnosed mental health conditions
All new housing programs, whether leased units or new construction, will designate 30% for persons with substance abuse conditions
Through the Coalition, a conference for public policy makers will be conducted that presents the findings of the Plan
13
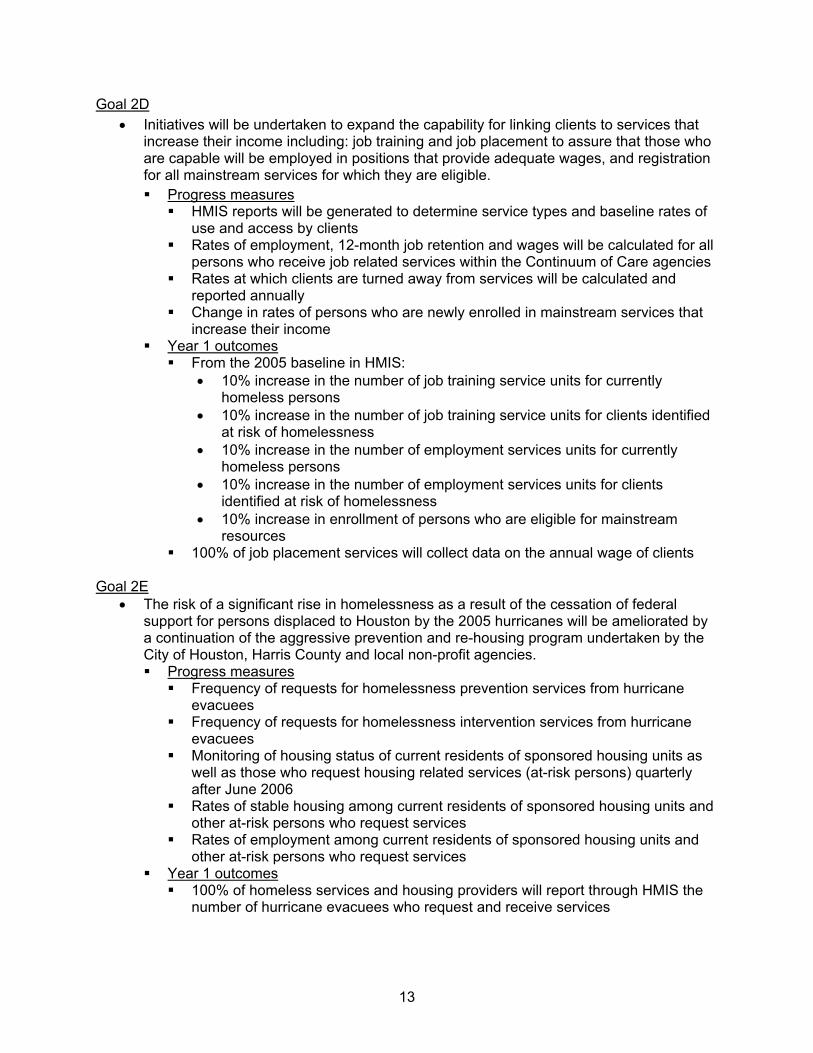
Goal 2D • Initiatives will be undertaken to expand the capability for linking clients to services that
increase their income including: job training and job placement to assure that those who are capable will be employed in positions that provide adequate wages, and registration for all mainstream services for which they are eligible. Progress measures
HMIS reports will be generated to determine service types and baseline rates of use and access by clients
Rates of employment, 12-month job retention and wages will be calculated for all persons who receive job related services within the Continuum of Care agencies
Rates at which clients are turned away from services will be calculated and reported annually
Change in rates of persons who are newly enrolled in mainstream services that increase their income
Year 1 outcomes From the 2005 baseline in HMIS:
• 10% increase in the number of job training service units for currently homeless persons
• 10% increase in the number of job training service units for clients identified at risk of homelessness
• 10% increase in the number of employment services units for currently homeless persons
• 10% increase in the number of employment services units for clients identified at risk of homelessness
• 10% increase in enrollment of persons who are eligible for mainstream resources
100% of job placement services will collect data on the annual wage of clients Goal 2E
• The risk of a significant rise in homelessness as a result of the cessation of federal support for persons displaced to Houston by the 2005 hurricanes will be ameliorated by a continuation of the aggressive prevention and re-housing program undertaken by the City of Houston, Harris County and local non-profit agencies. Progress measures
Frequency of requests for homelessness prevention services from hurricane evacuees
Frequency of requests for homelessness intervention services from hurricane evacuees
Monitoring of housing status of current residents of sponsored housing units as well as those who request housing related services (at-risk persons) quarterly after June 2006
Rates of stable housing among current residents of sponsored housing units and other at-risk persons who request services
Rates of employment among current residents of sponsored housing units and other at-risk persons who request services
Year 1 outcomes 100% of homeless services and housing providers will report through HMIS the
number of hurricane evacuees who request and receive services
14
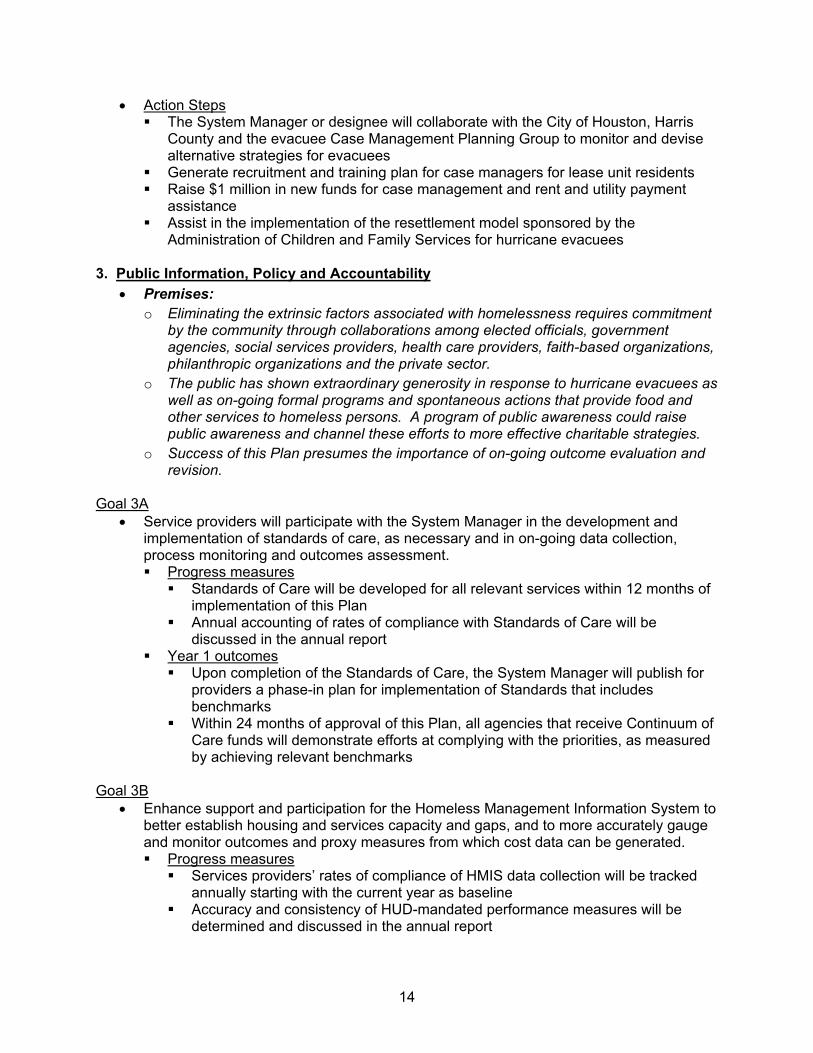
• Action Steps The System Manager or designee will collaborate with the City of Houston, Harris
County and the evacuee Case Management Planning Group to monitor and devise alternative strategies for evacuees
Generate recruitment and training plan for case managers for lease unit residents Raise $1 million in new funds for case management and rent and utility payment
assistance Assist in the implementation of the resettlement model sponsored by the
Administration of Children and Family Services for hurricane evacuees 3. Public Information, Policy and Accountability
• Premises: o Eliminating the extrinsic factors associated with homelessness requires commitment
by the community through collaborations among elected officials, government agencies, social services providers, health care providers, faith-based organizations, philanthropic organizations and the private sector.
o The public has shown extraordinary generosity in response to hurricane evacuees as well as on-going formal programs and spontaneous actions that provide food and other services to homeless persons. A program of public awareness could raise public awareness and channel these efforts to more effective charitable strategies.
o Success of this Plan presumes the importance of on-going outcome evaluation and revision.
Goal 3A
• Service providers will participate with the System Manager in the development and implementation of standards of care, as necessary and in on-going data collection, process monitoring and outcomes assessment. Progress measures
Standards of Care will be developed for all relevant services within 12 months of implementation of this Plan
Annual accounting of rates of compliance with Standards of Care will be discussed in the annual report
Year 1 outcomes Upon completion of the Standards of Care, the System Manager will publish for
providers a phase-in plan for implementation of Standards that includes benchmarks
Within 24 months of approval of this Plan, all agencies that receive Continuum of Care funds will demonstrate efforts at complying with the priorities, as measured by achieving relevant benchmarks
Goal 3B
• Enhance support and participation for the Homeless Management Information System to better establish housing and services capacity and gaps, and to more accurately gauge and monitor outcomes and proxy measures from which cost data can be generated. Progress measures
Services providers’ rates of compliance of HMIS data collection will be tracked annually starting with the current year as baseline
Accuracy and consistency of HUD-mandated performance measures will be determined and discussed in the annual report
15
Year 1 outcomes 100% of respondents to the 2007 Continuum of Care grant will participate in
HMIS and be able to provide the Coalition all data and performance measures requested by HUD in Exhibit 1 and Exhibit 2 of the grant application.
Goal 3C
• The City-sponsored on-going campaign to end street solicitation will be linked to public awareness, fund-raising and outreach for homelessness prevention and intervention services. Information gathered about the number of panhandlers will also be used as a an additional data point in calculating unmet need for homelessness prevention and intervention services. Progress measures
Changes in number of panhandlers reported by a Mayor-appointed task force charged with the intervention at 3, 6 and 12 months following the intervention
Changes in rates of observation of persons who give money, food or other commodities to panhandlers, as reported by the task force
Increase in donations given for homelessness prevention and intervention services, either to a fund established for that purpose or directly to a designated service agency
Year 1 outcomes 65% of respondents to a random telephone survey will be able to list at least one
alternative strategy to direct donation to panhandlers, within 30 days of the launch of the City’s street solicitation intervention and the simultaneous public information campaign
200 information cards that list homelessness prevention and intervention services will be distributed to persons contacted through the street solicitation intervention
50% of church-sponsored programs that provide direct donation to panhandlers will participate in a short training about alternative strategies within 6 months of launch of the street solicitor intervention
Goal 3D
• The System Manager will convene an annual conference for providers, client representatives and other stakeholders to set the legislative agenda for the year. Progress measure
Prior to the reconvening of the state legislature, a policy agenda will be prepared through the office of the System Manager in collaboration with providers, clients and other stakeholders and presented to local legislators
Year 1 outcomes 100% of prevention and intervention service providers or their designees, who
receive Continuum of Care funds, will participate in the development of the policy recommendations that will be completed for presentation at the first legislative session following ratification of this Plan
• Action Steps Convene homeless service providers to generate, ratify and implement standards of
care as needed for prevention and intervention services Using HMIS as a basis, create community-wide unit cost analysis for a list of
prevention and intervention services deemed by research findings and providers to be essential
Participate in the planning and implementation of the Street Solicitation Initiative Develop the Year 1 policy agenda
16
4. Specialized Outreach to Chronically Homeless Persons • Premise
o Chronic homelessness is a complex and multifaceted challenge that is best addressed with specialized housing and service programs.
Goal 4A
• Continue to sponsor with public funds, specially-trained, multi-disciplinary outreach teams to offer street-based, harm-reduction services Progress measures
Number of outreach teams and frequency of service delivery to unsheltered chronically homeless persons
Changes in rates of chronically homeless persons who present for agency-bases services
Rates of public funding applied to outreach teams Year 1 outcomes
50% increase in public funding for specialized outreach teams 10% increase in the number of specialized outreach teams who provide onsite
services to unsheltered homeless persons (based on an inventory of the numbers of teams to be completed within 6 months of Plan ratification)
1,000 unsheltered chronically homeless persons will complete at least one referral to agency-based services, as monitored in HMIS
Goal 4B
• Each quarter, a Rapid Re-housing Intervention (RRI) will be conducted that targets the chronically homeless and includes both clinical and non-clinical housing options, in the model of the “Pierce Re-housing Intervention.” Progress measures
Rates and location of re-housing and duration and frequency of homelessness for clients in the quarterly intensive interventions will be reported annually
12-month follow-ups will be conducted and status of clients will be reported annually
Year 1 outcomes In each of four RRIs, a minimum of 50 persons will be contacted and re-housed
for an initial period of 90 days in clinical or non-clinical sites At six months post-intervention, at least 85% of persons who were re-housed in
the RRI intervention will remain in sponsored or independent housing, as documented by HMIS reports
100% of the Rapid Re-housing Interventions outreach teams will include at least: one mental health provider, one health care provider, one representative of an agency that serves veterans, and one outreach worker trained to interact with chronically homeless persons
Goal 4C
• Drop-in centers that are always open and equipped with basic services will be developed throughout the area to provide one type of point-of-entry into services. Use of the centers will be promoted by outreach workers to unsheltered homeless persons Progress measures
Number and type of centers that are developed Numbers of duplicated and unduplicated clients using the sites will be calculated
and reported annually
17
Rates at referral and completion of referrals will be calculated and reported annually
Year 1 outcomes Plans for the development, funding and completion of two new sites will be
drafted within 12 months of ratification of this Plan
• Action Steps Commitment of an additional $250,000 in public/private funds for the augmentation
of specialized outreach to chronically homeless persons System manager will develop and release an request for proposals for outreach
coordination 5. Establish a System Management Function (see Section 2 of this report)
• Premise o Exemplary management of the system of housing/shelter supply, services, case
management and funding will maximize the effectiveness of this Plan to ensure the opportunity that individuals will be able to obtain, maintain and sustain housing and care.
Goal 5A
• Effective system management that is a collaboration of the City of Houston, Harris County, the Coalition for the Homeless and private sponsors to maintain decision-making information, assess situations, make strategic decisions, allocate resources, and expand the resources available to prevent and intervene in homelessness. o Progress measures
Number or Rapid Re-housing Interventions that are initiated by the manager and conducted by service providers
Monthly updates of status of Plan outcomes that can be used for strategic decision making
o Year 1 outcomes 12 monthly reports of Plan outcomes produced by the System Manager 12 monthly meeting reports of the restructured Homeless Services Coordinating
Council (see Action Steps that follow) A capacity building and technical assistance plan to increase the capability of
agencies to create permanent supported housing options will be developed by System Manager
• Action Steps
o Create System Management function o Identify key stakeholders for the Advisory Board who can advance the ongoing
planning, implementation and funding of Plan o Conduct an annual presentation to the City, County and private funders of the Plan
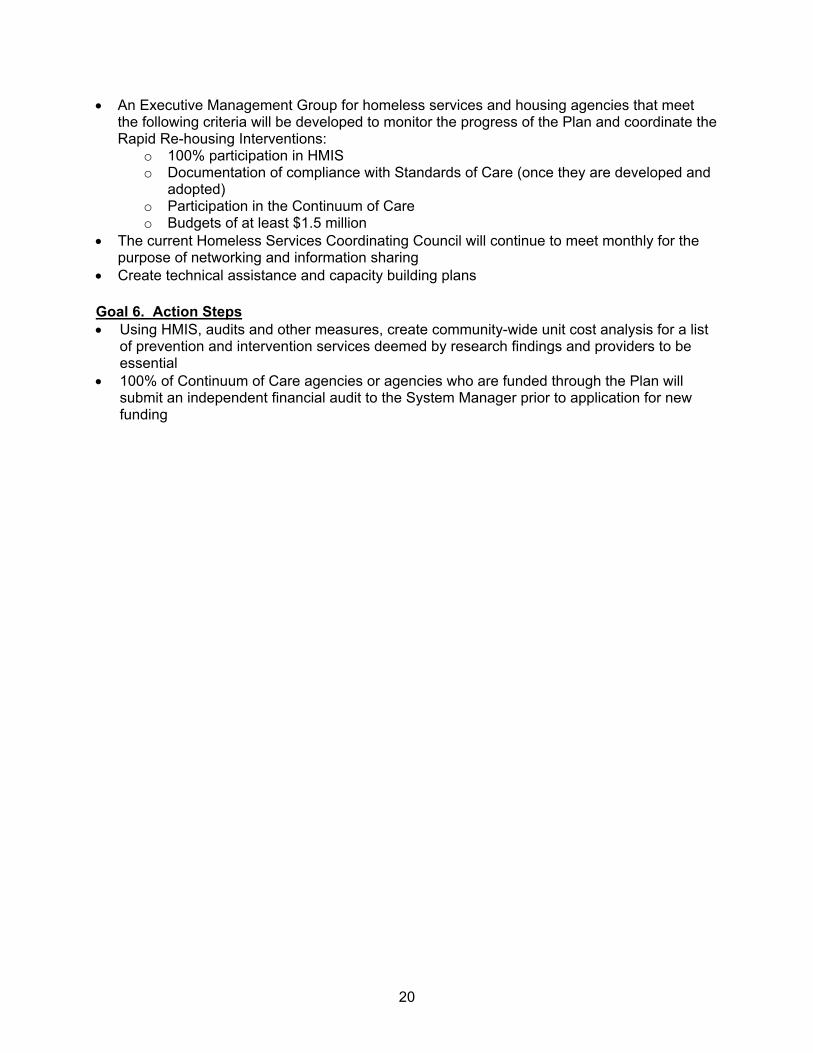
on the status of outcomes and revisions o Restructure the Coalition for the Homeless to serve as System Manager o An Executive Management Group for homeless services and housing agencies that
meet the following criteria will be developed to monitor the progress of the Plan and coordinate the Rapid Re-housing Interventions: 100% participation in HMIS Documentation of compliance with Standards of Care (once they are developed
and adopted)
18
Participation in the Continuum of Care Budgets of at least $1.5 million
o The current Homeless Services Coordinating Council will continue to meet monthly for the purpose of networking and information sharing
o Create technical assistance and capacity building plans 6. Assure sustainable funding for housing options and effective programs
• Premise: o The challenge of funding is multi-dimensional. As the number of homeless persons
increases, obviously so does the demand for additional services and housing options. The research findings suggest, however, that a proportion of current expenditures can be reallocated for more effective targeted interventions based on client acuity, i.e. level of intensity of service need.
Goal 6A
• Funding plan for the creation and maintenance of the Strategic Plan will combine multiple sources including public, philanthropic and private funds. Progress measures
Accurate accounting of the spending by private and public agencies on homelessness prevention and intervention services, shelter and housing
Development of the budget and methods of funding the components of this Plan Improved cost-benefits ratio of homelessness prevention and intervention
services, shelter and housing Documentation of the effectiveness of services marked by decreased demand for
services, shelter and housing Year 1 outcomes
100% of the Year 1 activities associated with the Plan will be supported by adequate funding for implementation
• Action Steps
o Using HMIS, audits and other measures, create community-wide unit cost analysis for a list of prevention and intervention services deemed by research findings and providers to be essential
o 100% of Continuum of Care agencies or agencies who are funded through the Plan will submit an independent financial audit to the System Manager prior to application for new funding
19
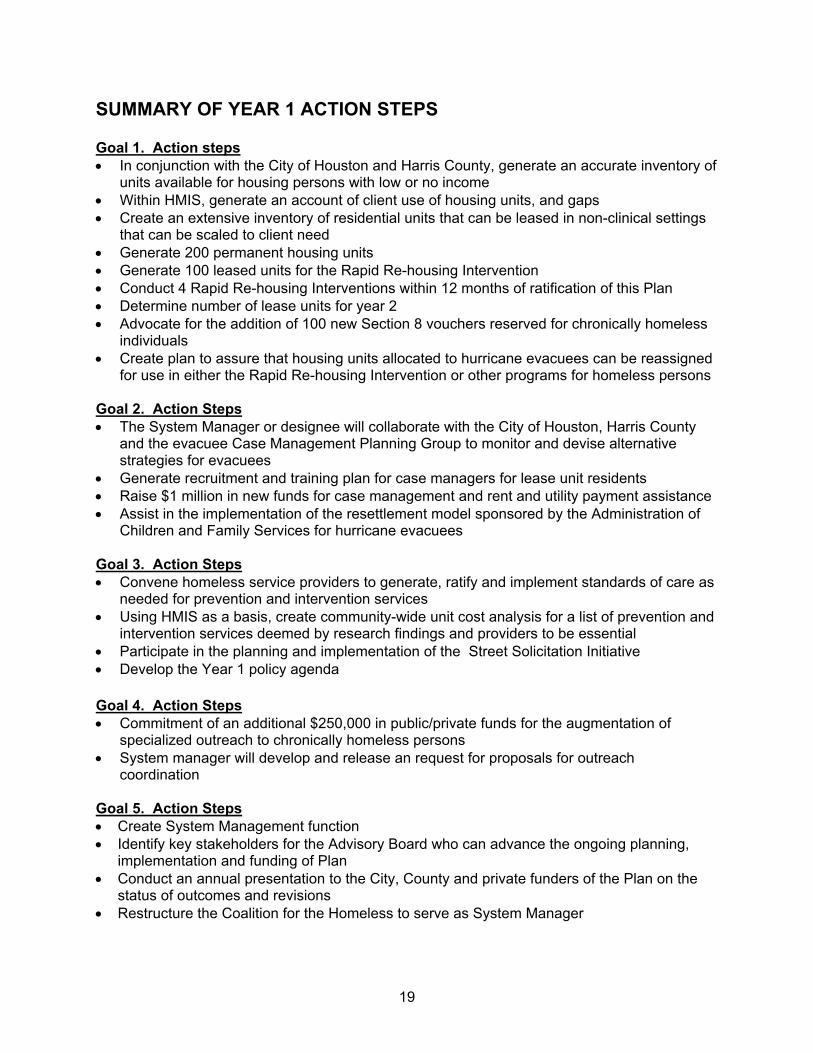
SUMMARY OF YEAR 1 ACTION STEPS Goal 1. Action steps • In conjunction with the City of Houston and Harris County, generate an accurate inventory of
units available for housing persons with low or no income • Within HMIS, generate an account of client use of housing units, and gaps • Create an extensive inventory of residential units that can be leased in non-clinical settings
that can be scaled to client need • Generate 200 permanent housing units • Generate 100 leased units for the Rapid Re-housing Intervention • Conduct 4 Rapid Re-housing Interventions within 12 months of ratification of this Plan • Determine number of lease units for year 2 • Advocate for the addition of 100 new Section 8 vouchers reserved for chronically homeless
individuals • Create plan to assure that housing units allocated to hurricane evacuees can be reassigned
for use in either the Rapid Re-housing Intervention or other programs for homeless persons Goal 2. Action Steps • The System Manager or designee will collaborate with the City of Houston, Harris County
and the evacuee Case Management Planning Group to monitor and devise alternative strategies for evacuees
• Generate recruitment and training plan for case managers for lease unit residents • Raise $1 million in new funds for case management and rent and utility payment assistance • Assist in the implementation of the resettlement model sponsored by the Administration of
Children and Family Services for hurricane evacuees Goal 3. Action Steps • Convene homeless service providers to generate, ratify and implement standards of care as
needed for prevention and intervention services • Using HMIS as a basis, create community-wide unit cost analysis for a list of prevention and
intervention services deemed by research findings and providers to be essential • Participate in the planning and implementation of the Street Solicitation Initiative • Develop the Year 1 policy agenda Goal 4. Action Steps • Commitment of an additional $250,000 in public/private funds for the augmentation of
specialized outreach to chronically homeless persons • System manager will develop and release an request for proposals for outreach
coordination Goal 5. Action Steps • Create System Management function • Identify key stakeholders for the Advisory Board who can advance the ongoing planning,
implementation and funding of Plan • Conduct an annual presentation to the City, County and private funders of the Plan on the
status of outcomes and revisions • Restructure the Coalition for the Homeless to serve as System Manager
20
• An Executive Management Group for homeless services and housing agencies that meet the following criteria will be developed to monitor the progress of the Plan and coordinate the Rapid Re-housing Interventions:
o 100% participation in HMIS o Documentation of compliance with Standards of Care (once they are developed and
adopted) o Participation in the Continuum of Care o Budgets of at least $1.5 million
• The current Homeless Services Coordinating Council will continue to meet monthly for the purpose of networking and information sharing
• Create technical assistance and capacity building plans Goal 6. Action Steps • Using HMIS, audits and other measures, create community-wide unit cost analysis for a list
of prevention and intervention services deemed by research findings and providers to be essential
• 100% of Continuum of Care agencies or agencies who are funded through the Plan will submit an independent financial audit to the System Manager prior to application for new funding
21
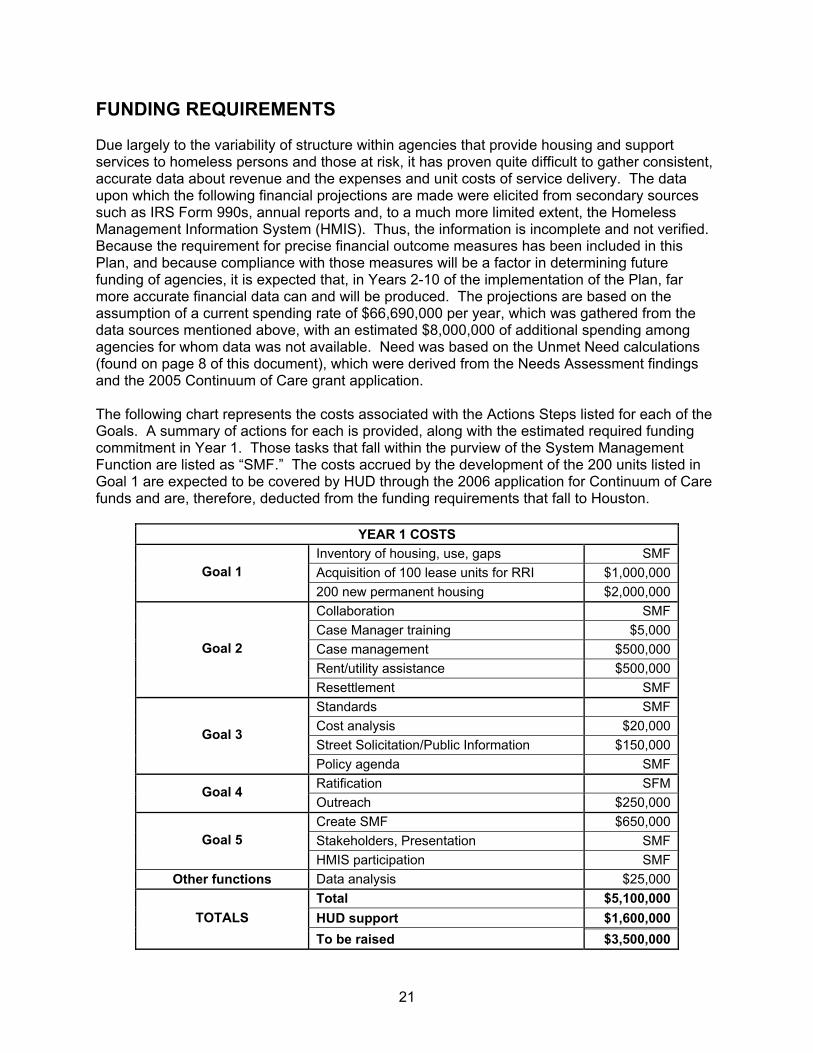
FUNDING REQUIREMENTS Due largely to the variability of structure within agencies that provide housing and support services to homeless persons and those at risk, it has proven quite difficult to gather consistent, accurate data about revenue and the expenses and unit costs of service delivery. The data upon which the following financial projections are made were elicited from secondary sources such as IRS Form 990s, annual reports and, to a much more limited extent, the Homeless Management Information System (HMIS). Thus, the information is incomplete and not verified. Because the requirement for precise financial outcome measures has been included in this Plan, and because compliance with those measures will be a factor in determining future funding of agencies, it is expected that, in Years 2-10 of the implementation of the Plan, far more accurate financial data can and will be produced. The projections are based on the assumption of a current spending rate of $66,690,000 per year, which was gathered from the data sources mentioned above, with an estimated $8,000,000 of additional spending among agencies for whom data was not available. Need was based on the Unmet Need calculations (found on page 8 of this document), which were derived from the Needs Assessment findings and the 2005 Continuum of Care grant application. The following chart represents the costs associated with the Actions Steps listed for each of the Goals. A summary of actions for each is provided, along with the estimated required funding commitment in Year 1. Those tasks that fall within the purview of the System Management Function are listed as “SMF.” The costs accrued by the development of the 200 units listed in Goal 1 are expected to be covered by HUD through the 2006 application for Continuum of Care funds and are, therefore, deducted from the funding requirements that fall to Houston.
YEAR 1 COSTS Inventory of housing, use, gaps SMFAcquisition of 100 lease units for RRI $1,000,000Goal 1 200 new permanent housing $2,000,000Collaboration SMFCase Manager training $5,000Case management $500,000Rent/utility assistance $500,000
Goal 2
Resettlement SMFStandards SMFCost analysis $20,000Street Solicitation/Public Information $150,000
Goal 3
Policy agenda SMFRatification SFMGoal 4 Outreach $250,000Create SMF $650,000Stakeholders, Presentation SMFGoal 5 HMIS participation SMF
Other functions Data analysis $25,000Total $5,100,000HUD support $1,600,000TOTALS To be raised $3,500,000

22
The charts that follow attempt to project revenues and funding needs, within the limitations discussed above. The projections for development of housing units/beds, as well as funding levels, are believed to be achievable. It is critical to note that revisions will occur as better data is acquired. It is also important to consider that the impact of the housing status of evacuees from the 2005 hurricanes who choose to reside in Houston for the long term cannot now be accurately assessed. Finally, at this point it is not recommended that funding be reallocated from other sources, however, with the clarification of additional data, this option may be considered.
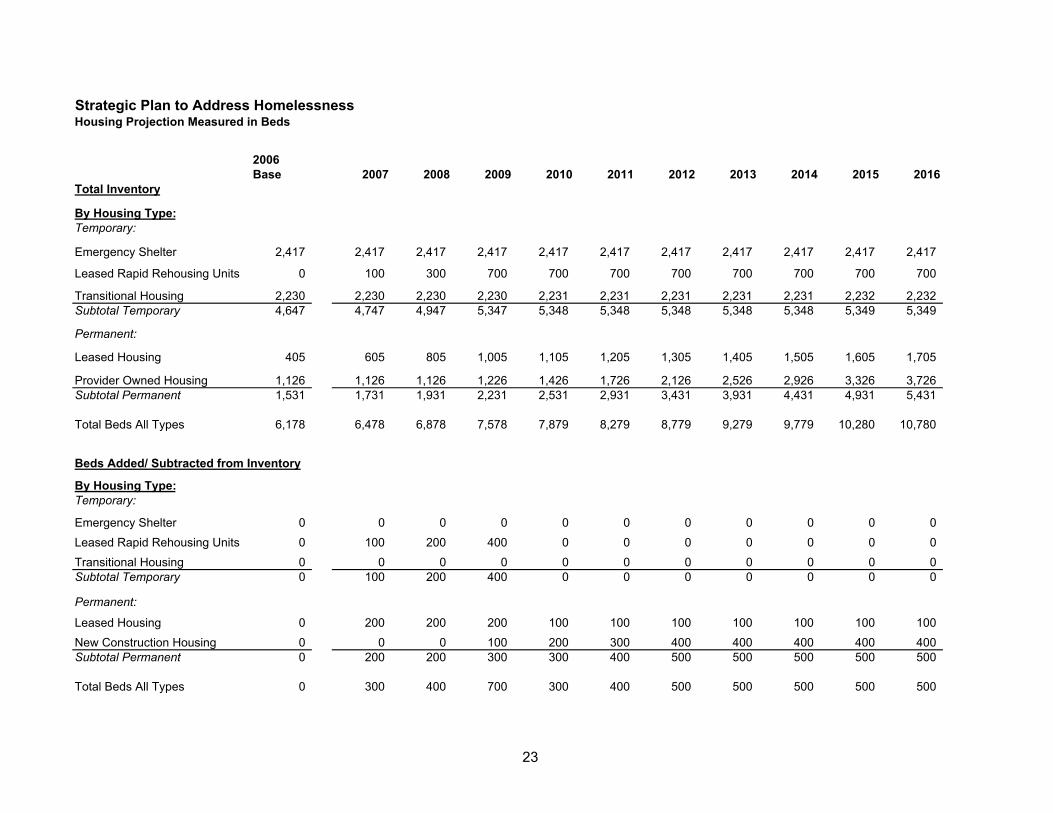
Strategic Plan to Address HomelessnessHousing Projection Measured in Beds
2006Base 2007 2008 2009 2010 2011 2012 2013 2014 2015 2016
Total Inventory
By Housing Type:Temporary:
Emergency Shelter 2,417 2,417 2,417 2,417 2,417 2,417 2,417 2,417 2,417 2,417 2,417
Leased Rapid Rehousing Units 0 100 300 700 700 700 700 700 700 700 700
Transitional Housing 2,230 2,230 2,230 2,230 2,231 2,231 2,231 2,231 2,231 2,232 2,232Subtotal Temporary 4,647 4,747 4,947 5,347 5,348 5,348 5,348 5,348 5,348 5,349 5,349
Permanent:
Leased Housing 405 605 805 1,005 1,105 1,205 1,305 1,405 1,505 1,605 1,705
Provider Owned Housing 1,126 1,126 1,126 1,226 1,426 1,726 2,126 2,526 2,926 3,326 3,726Subtotal Permanent 1,531 1,731 1,931 2,231 2,531 2,931 3,431 3,931 4,431 4,931 5,431
Total Beds All Types 6,178 6,478 6,878 7,578 7,879 8,279 8,779 9,279 9,779 10,280 10,780
Beds Added/ Subtracted from Inventory
By Housing Type:Temporary:
Emergency Shelter 0 0 0 0 0 0 0 0 0 0 0Leased Rapid Rehousing Units 0 100 200 400 0 0 0 0 0 0 0Transitional Housing 0 0 0 0 0 0 0 0 0 0 0Subtotal Temporary 0 100 200 400 0 0 0 0 0 0 0
Permanent:
Leased Housing 0 200 200 200 100 100 100 100 100 100 100New Construction Housing 0 0 0 100 200 300 400 400 400 400 400Subtotal Permanent 0 200 200 300 300 400 500 500 500 500 500
Total Beds All Types 0 300 400 700 300 400 500 500 500 500 500
23
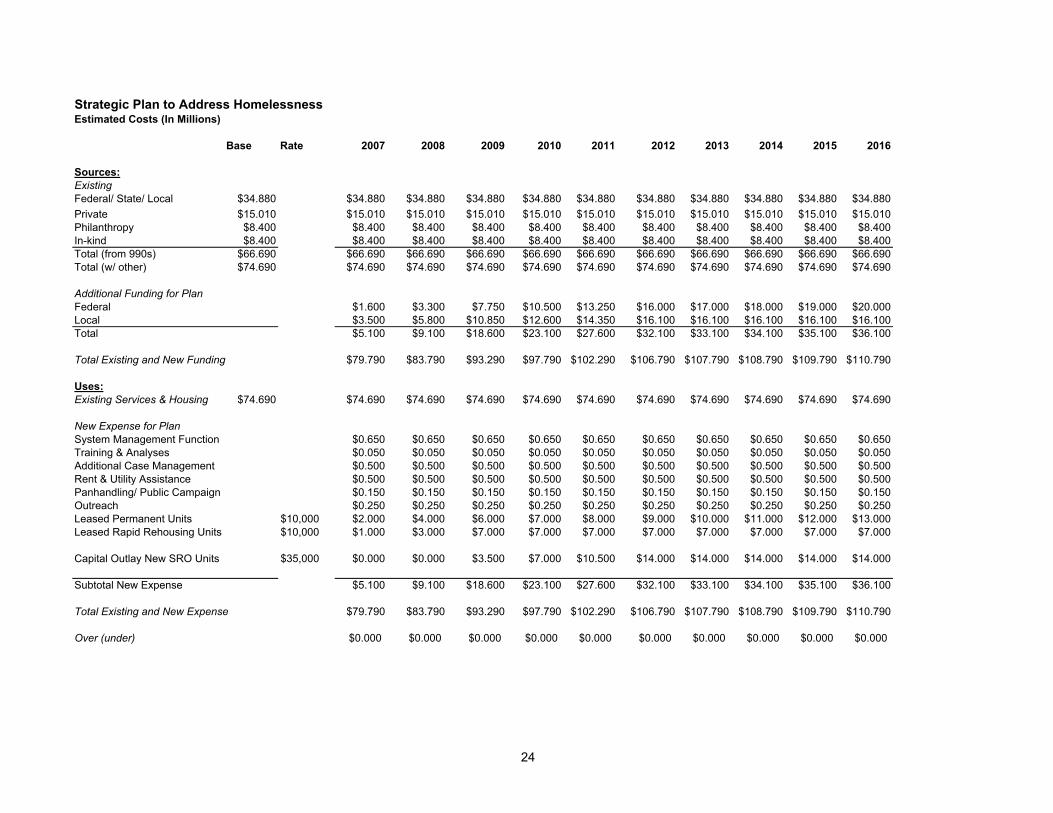
Strategic Plan to Address HomelessnessEstimated Costs (In Millions)
Base Rate 2007 2008 2009 2010 2011 2012 2013 2014 2015 2016
Sources:ExistingFederal/ State/ Local $34.880 $34.880 $34.880 $34.880 $34.880 $34.880 $34.880 $34.880 $34.880 $34.880 $34.880Private $15.010 $15.010 $15.010 $15.010 $15.010 $15.010 $15.010 $15.010 $15.010 $15.010 $15.010Philanthropy $8.400 $8.400 $8.400 $8.400 $8.400 $8.400 $8.400 $8.400 $8.400 $8.400 $8.400In-kind $8.400 $8.400 $8.400 $8.400 $8.400 $8.400 $8.400 $8.400 $8.400 $8.400 $8.400Total (from 990s) $66.690 $66.690 $66.690 $66.690 $66.690 $66.690 $66.690 $66.690 $66.690 $66.690 $66.690Total (w/ other) $74.690 $74.690 $74.690 $74.690 $74.690 $74.690 $74.690 $74.690 $74.690 $74.690 $74.690
Additional Funding for PlanFederal $1.600 $3.300 $7.750 $10.500 $13.250 $16.000 $17.000 $18.000 $19.000 $20.000Local $3.500 $5.800 $10.850 $12.600 $14.350 $16.100 $16.100 $16.100 $16.100 $16.100Total $5.100 $9.100 $18.600 $23.100 $27.600 $32.100 $33.100 $34.100 $35.100 $36.100
Total Existing and New Funding $79.790 $83.790 $93.290 $97.790 $102.290 $106.790 $107.790 $108.790 $109.790 $110.790
Uses:Existing Services & Housing $74.690 $74.690 $74.690 $74.690 $74.690 $74.690 $74.690 $74.690 $74.690 $74.690 $74.690
New Expense for PlanSystem Management Function $0.650 $0.650 $0.650 $0.650 $0.650 $0.650 $0.650 $0.650 $0.650 $0.650Training & Analyses $0.050 $0.050 $0.050 $0.050 $0.050 $0.050 $0.050 $0.050 $0.050 $0.050Additional Case Management $0.500 $0.500 $0.500 $0.500 $0.500 $0.500 $0.500 $0.500 $0.500 $0.500Rent & Utility Assistance $0.500 $0.500 $0.500 $0.500 $0.500 $0.500 $0.500 $0.500 $0.500 $0.500Panhandling/ Public Campaign $0.150 $0.150 $0.150 $0.150 $0.150 $0.150 $0.150 $0.150 $0.150 $0.150Outreach $0.250 $0.250 $0.250 $0.250 $0.250 $0.250 $0.250 $0.250 $0.250 $0.250Leased Permanent Units $10,000 $2.000 $4.000 $6.000 $7.000 $8.000 $9.000 $10.000 $11.000 $12.000 $13.000Leased Rapid Rehousing Units $10,000 $1.000 $3.000 $7.000 $7.000 $7.000 $7.000 $7.000 $7.000 $7.000 $7.000
Capital Outlay New SRO Units $35,000 $0.000 $0.000 $3.500 $7.000 $10.500 $14.000 $14.000 $14.000 $14.000 $14.000
Subtotal New Expense $5.100 $9.100 $18.600 $23.100 $27.600 $32.100 $33.100 $34.100 $35.100 $36.100
Total Existing and New Expense $79.790 $83.790 $93.290 $97.790 $102.290 $106.790 $107.790 $108.790 $109.790 $110.790
Over (under) $0.000 $0.000 $0.000 $0.000 $0.000 $0.000 $0.000 $0.000 $0.000 $0.000
24
25
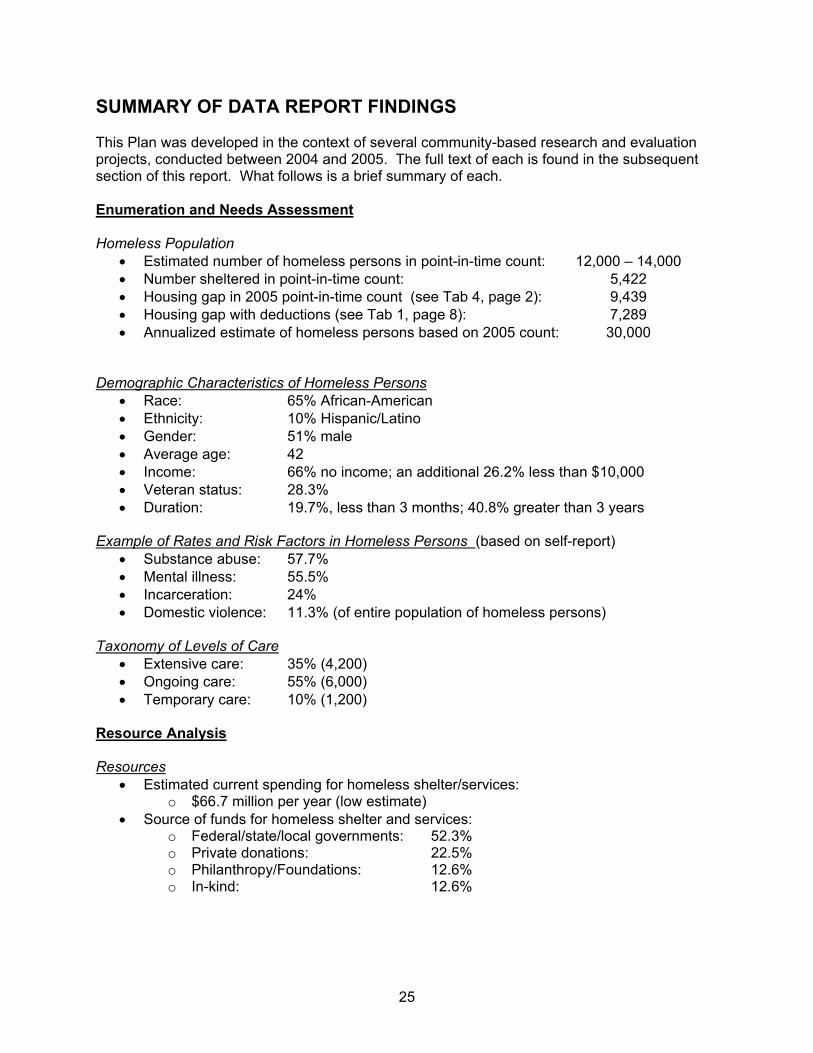
SUMMARY OF DATA REPORT FINDINGS This Plan was developed in the context of several community-based research and evaluation projects, conducted between 2004 and 2005. The full text of each is found in the subsequent section of this report. What follows is a brief summary of each. Enumeration and Needs Assessment Homeless Population
• Estimated number of homeless persons in point-in-time count: 12,000 – 14,000 • Number sheltered in point-in-time count: 5,422 • Housing gap in 2005 point-in-time count (see Tab 4, page 2): 9,439 • Housing gap with deductions (see Tab 1, page 8): 7,289 • Annualized estimate of homeless persons based on 2005 count: 30,000
Demographic Characteristics of Homeless Persons
• Race: 65% African-American • Ethnicity: 10% Hispanic/Latino • Gender: 51% male • Average age: 42 • Income: 66% no income; an additional 26.2% less than $10,000 • Veteran status: 28.3% • Duration: 19.7%, less than 3 months; 40.8% greater than 3 years
Example of Rates and Risk Factors in Homeless Persons (based on self-report)
• Substance abuse: 57.7% • Mental illness: 55.5% • Incarceration: 24% • Domestic violence: 11.3% (of entire population of homeless persons)
Taxonomy of Levels of Care
• Extensive care: 35% (4,200) • Ongoing care: 55% (6,000) • Temporary care: 10% (1,200)
Resource Analysis Resources
• Estimated current spending for homeless shelter/services: o $66.7 million per year (low estimate)
• Source of funds for homeless shelter and services: o Federal/state/local governments: 52.3% o Private donations: 22.5% o Philanthropy/Foundations: 12.6% o In-kind: 12.6%
26
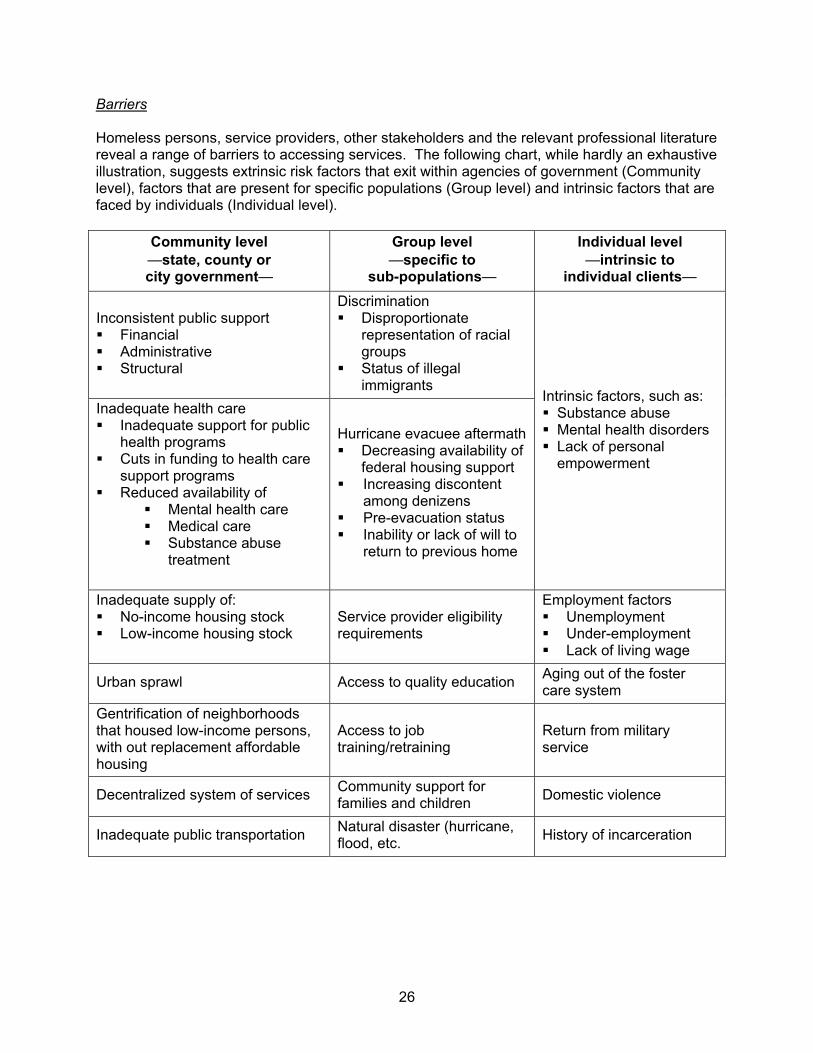
Barriers Homeless persons, service providers, other stakeholders and the relevant professional literature reveal a range of barriers to accessing services. The following chart, while hardly an exhaustive illustration, suggests extrinsic risk factors that exit within agencies of government (Community level), factors that are present for specific populations (Group level) and intrinsic factors that are faced by individuals (Individual level).
Community level —state, county or city government—
Group level —specific to
sub-populations—
Individual level —intrinsic to
individual clients—
Inconsistent public support Financial Administrative Structural
Discrimination Disproportionate
representation of racial groups
Status of illegal immigrants
Inadequate health care Inadequate support for public
health programs Cuts in funding to health care
support programs Reduced availability of
Mental health care Medical care Substance abuse
treatment
Hurricane evacuee aftermath Decreasing availability of
federal housing support Increasing discontent
among denizens Pre-evacuation status Inability or lack of will to
return to previous home
Intrinsic factors, such as: Substance abuse Mental health disorders Lack of personal empowerment
Inadequate supply of: No-income housing stock Low-income housing stock
Service provider eligibility requirements
Employment factors Unemployment Under-employment Lack of living wage
Urban sprawl Access to quality education Aging out of the foster care system
Gentrification of neighborhoods that housed low-income persons, with out replacement affordable housing
Access to job training/retraining
Return from military service
Decentralized system of services Community support for families and children Domestic violence
Inadequate public transportation Natural disaster (hurricane, flood, etc. History of incarceration

27
Taxonomy of Interventions • Community level (CLI)
o State, county or city government • Group level (GLI)
o Specific to sub-populations • Individual level (ILI)
o Intrinsic to individual clients Re-housing Intervention Data
• Number of persons re-housed: 172 • Number still housed after 30 days: 167
Hurricane Evacuee Data
• Number of publicly leased housing units for evacuees: 34,000 • Approximate number of persons housed in these units: 130,000 • Average pre-evacuation income of evacuees: $19,500 • Percent employed pre-evacuation: 70% • Percent requesting on-going housing assistance: 84%

28
Models used to develop the Plan The models from which this Plan was developed are based on best practices from local agencies, the most current findings of related studies of the Houston metropolitan area, federal guidelines and the reported experience of successful programs in other areas of the country. 1. Variable Systems of Services Providers of services to homeless persons have long reported that most of their resources are spent on people who are chronically homeless and that the outcomes expected for these clients—re-employment and consistent housing—are virtually impossible to achieve within the current system of care. Further, there are clients who are episodically homeless, vacillating between relative stability and crisis. Serving these groups leaves few resources for prevention or assessment of outcomes and for caring for those who are newly, temporarily homeless. The experience of providers and in the professional literature, it is apparent that the system of care could be more effective if it truly acknowledged and accommodated the variations in need and resources that clients present. It is important to note that in the proposed model, it is not expected that clients course through the categories. Rather, with effective assessment, it becomes clear which system of care can best benefit them. Regardless of the sub-population that clients represent, they can be grouped in to three main categories, based on the level of interface with systems of service that they require: 1) 35% of homeless persons will required lifelong, extensive care, 2) 55% will need episodic, varying levels of on-going assistance, and 3) 10% of the homeless will need temporary, one time assistance. Extensive care This group is composed of individuals who are seriously compromised by severe mental illness, intractable substance abuse or mental retardation. Most are chronically homeless and are those clients who, in the past, were typically institutionalized. Based on this study and the experience of providers, it is estimated that this group makes up about 35% (n=4,200) of the homeless population. Services to this group must be lifelong and highly structured, with clients closely monitored. The goal for these clients is that they are assisted in sustaining safe, secure housing within a system of care. Clients in this group are those served by Safe Haven programs, such as that administered by MHMRA.
On-going assistance For this group, contact with a system of care will be for variable length of time at different intervals, but it will likely be long-term, if not lifelong. These are persons with mental illness or substance abuse histories who are willing to participate, and capable of participating in treatment and who, if afforded supportive services related to employment and/or housing, can maintain both. They may be able to leave components of the system of care for a period of time, but will remain more stable if case management, at least, is maintained. It is estimated that this group represents about 55% (n=6,600) of the population. Clients of the DeGeorge program, administered by the VA, fall into this category.
29
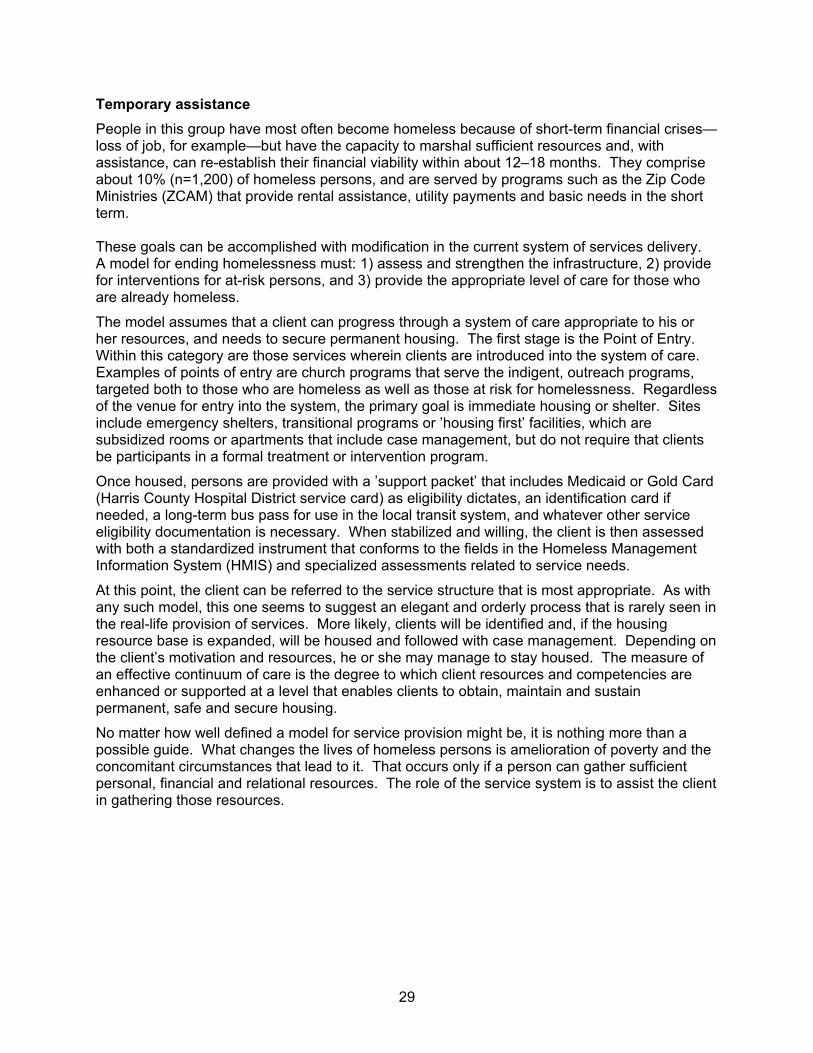
Temporary assistance People in this group have most often become homeless because of short-term financial crises—loss of job, for example—but have the capacity to marshal sufficient resources and, with assistance, can re-establish their financial viability within about 12–18 months. They comprise about 10% (n=1,200) of homeless persons, and are served by programs such as the Zip Code Ministries (ZCAM) that provide rental assistance, utility payments and basic needs in the short term. These goals can be accomplished with modification in the current system of services delivery. A model for ending homelessness must: 1) assess and strengthen the infrastructure, 2) provide for interventions for at-risk persons, and 3) provide the appropriate level of care for those who are already homeless.
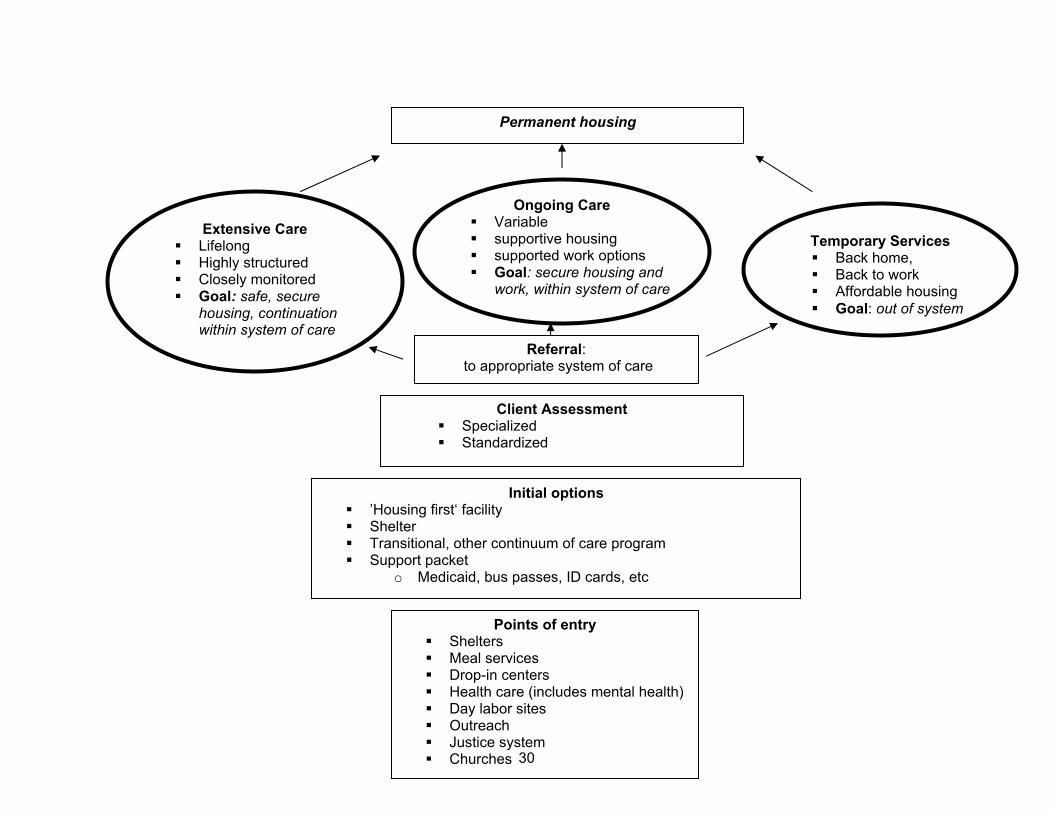
The model assumes that a client can progress through a system of care appropriate to his or her resources, and needs to secure permanent housing. The first stage is the Point of Entry. Within this category are those services wherein clients are introduced into the system of care. Examples of points of entry are church programs that serve the indigent, outreach programs, targeted both to those who are homeless as well as those at risk for homelessness. Regardless of the venue for entry into the system, the primary goal is immediate housing or shelter. Sites include emergency shelters, transitional programs or ’housing first’ facilities, which are subsidized rooms or apartments that include case management, but do not require that clients be participants in a formal treatment or intervention program.
Once housed, persons are provided with a ’support packet’ that includes Medicaid or Gold Card (Harris County Hospital District service card) as eligibility dictates, an identification card if needed, a long-term bus pass for use in the local transit system, and whatever other service eligibility documentation is necessary. When stabilized and willing, the client is then assessed with both a standardized instrument that conforms to the fields in the Homeless Management Information System (HMIS) and specialized assessments related to service needs.
At this point, the client can be referred to the service structure that is most appropriate. As with any such model, this one seems to suggest an elegant and orderly process that is rarely seen in the real-life provision of services. More likely, clients will be identified and, if the housing resource base is expanded, will be housed and followed with case management. Depending on the client’s motivation and resources, he or she may manage to stay housed. The measure of an effective continuum of care is the degree to which client resources and competencies are enhanced or supported at a level that enables clients to obtain, maintain and sustain permanent, safe and secure housing.
No matter how well defined a model for service provision might be, it is nothing more than a possible guide. What changes the lives of homeless persons is amelioration of poverty and the concomitant circumstances that lead to it. That occurs only if a person can gather sufficient personal, financial and relational resources. The role of the service system is to assist the client in gathering those resources.
30
Extensive Care Lifelong Highly structured Closely monitored Goal: safe, secure
housing, continuation within system of care
Ongoing Care Variable supportive housing supported work options Goal: secure housing and
work, within system of care
Temporary Services Back home, Back to work Affordable housing Goal: out of system
Points of entry Shelters Meal services Drop-in centers Health care (includes mental health) Day labor sites Outreach Justice system Churches
Permanent housing
Client Assessment Specialized Standardized
Referral: to appropriate system of care
Initial options ’Housing first‘ facility Shelter Transitional, other continuum of care program Support packet
o Medicaid, bus passes, ID cards, etc
31
Enhanced Service Delivery
Throughout the course of the various research projects that underpin this Plan, homeless persons and their service providers reiterated that the most critical element in their ability to gain access to and effectively use services was the quality of the relationship that they were able to form with providers. That is the art and humanity of service provision. The science of service provision involves strategic planning, resource monitoring and implementation of practices that have been documented as successful with a given population, and in a given context. Too often providers are forced to plan services based on what might get funded, which may or may not fit their core competencies or the needs of clients. A potentially more efficacious strategy involves:
1. Developing programs based on a. A theory of behavior or population change b. Agency experience c. Documented client need d. Client satisfaction e. Employee competence and satisfaction
2. Enhancing staff capacity to implement the programs 3. Defining and monitoring outcomes that identify success 4. Developing and adhering to a business plan that assures sustainability of the agency
To assure a level of care across agencies, a collaboration of service providers, under the direction of the Coalition for the Homeless, can create standards of care for all the major services, shelter and housing programs that serve homeless persons. The degree to which agencies within the Continuum of Care are invited or required to adhere to the standards will be the decision of providers and funders.
Once standards are accepted, the community of providers can undertake outcome assessment to document the effectiveness of their services and enhance program planning. Evaluation can be conducted with minimal burden to providers by working with the data in HMIS and collecting and analyzing data submitted in the context of the annual response to the HUD Continuum of Care grant. 2. Rapid Re-housing of Chronically Homeless Persons Over the past five years, Houston has embarked on three projects that sought to offer immediate shelter in clinical and non-clinical settings to persons living under an overpass in the downtown district of Houston. The most recent of these resulted in the successful housing of 172 chronically homeless individuals.
Findings from the evaluation of this program showed that its success was based on four components: 1) the availability of non-clinical housing options that were presented in tandem with a targeted outreach, 2) multi-disciplinary outreach teams that provided on-site triage and assessment, 3) service-rich, frequent follow-up for clients of the intervention, and 4) a term of support for at least 90 days. This project validated the ’Housing First‘ model of intervention with chronically homeless persons. 3. Scale-up of Housing Units in Non-traditional Settings In the span of less than four weeks, 300,000 persons traveled to Houston as evacuees from Hurricanes Katrina and Rita. Finding options for immediate and then long-term housing for more than 130,000 of them has consumed much of the effort of local government. What has
32
resulted from this is an inventory of hotel, motel, service provider and church-sponsored housing units that can be reallocated to Houston’s homeless or near-homeless populations.
The community has learned well the exigencies of managing such units, providing case management to the residents and systems for follow-up and referral. Not only has this validated “Housing First,” it has also served as the template for the System Management function proposed in this Plan.
4. Classification of Services Using a Public Health Prevention Model Given that addressing homelessness requires a complex set of prevention and intervention services, the developers of the Plan found a model of categorizing levels of services—a structure often used in public health planning. Within this context, services are grouped according to the agents of prevention and intervention: 1) community level interventions, 2) group level interventions, and 3) individual level interventions. As the names reveal, service delivery is seen as a matrix aimed at each of the levels.
Within this Plan, agencies and organizations are located within the matrix of intervention, as are the types of services they provide. In addition, an analysis of the gaps in services and barriers to access are also categorized in this manner.

Strategic Plan to Address HomelessnessHousing Projection Measured in Beds
2006Base 2007 2008 2009 2010 2011 2012 2013 2014 2015 2016
Total Inventory
By Housing Type:Temporary:
Emergency Shelter 2,417 2,417 2,417 2,417 2,417 2,417 2,417 2,417 2,417 2,417 2,417
Leased Rapid Rehousing Units 0 100 300 700 700 700 700 700 700 700 700
Transitional Housing 2,230 2,230 2,230 2,230 2,231 2,231 2,231 2,231 2,231 2,232 2,232Subtotal Temporary 4,647 4,747 4,947 5,347 5,348 5,348 5,348 5,348 5,348 5,349 5,349
Permanent:
Leased Housing 405 605 805 1,005 1,105 1,205 1,305 1,405 1,505 1,605 1,705
Provider Owned Housing 1,126 1,126 1,126 1,226 1,426 1,726 2,126 2,526 2,926 3,326 3,726Subtotal Permanent 1,531 1,731 1,931 2,231 2,531 2,931 3,431 3,931 4,431 4,931 5,431
Total Beds All Types 6,178 6,478 6,878 7,578 7,879 8,279 8,779 9,279 9,779 10,280 10,780
Beds Added/ Subtracted from Inventory
By Housing Type:Temporary:
Emergency Shelter 0 0 0 0 0 0 0 0 0 0 0Leased Rapid Rehousing Units 0 100 200 400 0 0 0 0 0 0 0Transitional Housing 0 0 0 0 0 0 0 0 0 0 0Subtotal Temporary 0 100 200 400 0 0 0 0 0 0 0
Permanent:
Leased Housing 0 200 200 200 100 100 100 100 100 100 100New Construction Housing 0 0 0 100 200 300 400 400 400 400 400Subtotal Permanent 0 200 200 300 300 400 500 500 500 500 500
Total Beds All Types 0 300 400 700 300 400 500 500 500 500 500
-1-
System Management Function: Homeless Housing & Services Premise The presence of an exemplary management and coordination of the system of housing/shelter supply, services, case management and funding will maximize the effectiveness of this Plan to ensure the opportunity that individuals will be able to obtain, maintain and sustain housing and care. Goal Effective system manager function (Manager) that is a collaboration of the City of Houston (City), Harris County (County), the Coalition for the Homeless (CFTH) and private sponsors to maintain decision making information, assess situation, make strategic decisions, allocate resources, and expand the resources available to prevent and intervene in homelessness. System Management Agency In order to successfully execute a “System Management Function” that is at the core of the 10 year Plan to End Chronic Homelessness, CFTH would need to expand its current structure and budget. The current structure supports the existing continuum of care function quite well, as CFTH is able to regularly organize and produce an application that generates over $14 million dollars annually. Also, this continuum’s homeless services provide between 29,000 and 34,000 people annually with housing, food, clothing, employment assistance and health care. Operated by CFTH, the Homeless Management Information System (HMIS) is currently used by 56 agencies and 435 licensed users. This web-based system allows the community to determine existing service gaps among HUD funded homeless service providers, and to better access what is needed from HUD to close those gaps. CFTH will serve as the primary operating and fiduciary entity and will participate in a memorandum of agreement with the City, Harris County, and private supporters to ensure accountability. CFTH currently operates with 8 professional staff and 2 interns. CFTH would have to almost double in size to effectively manage/operate this new system and merge it into the existing continuum of care system. Below are the activities of this Systems Management Function. Process The complexity of this Plan mandates the creation of a centralized management system that will monitor its implementation through the following functions:
1. Setting and leading intense strategic direction of services, housing and funding toward ending homelessness
The Manager will conduct Strategy Sessions weekly with representatives from the City, County, private supporters, service providers and clients for the purpose of reporting on the status of the entire homeless housing/service system status, including monitoring
-2-
outcomes, identifying and solving problems, revising action steps and establishing the rate of flow of homeless individuals from street to housing and recidivism into homelessness.
2. Information and data base management Through HUD and the CFTH, the community has access to the Homeless Management Information System (HMIS), a very powerful tool for data collection and reporting. It is an essential function of the Manager to assure that all service providers who participate in the Continuum of Care are consistently and accurately entering data about housing supply, service type and inventory of availability, number of duplicated and unduplicated clients, number who request housing or support services and are not served, service unit costs and available funding.
3. Housing locator function The Manager will be responsible for assuring the development of new permanent housing units, rapid rehousing sites, and transitional housing and emergency shelter beds and collaborate in the quality control and inspection of these and existing units. Given the outcomes of the Rapid Rehousing Intervention and Hurricane evacuees resettlement, it is important that an inventory of leased units, tied to fluctuations in client number be acquired and maintained. In collaboration with its Advisory Board, the Manager will devise methods to supplement the federally-supported housing voucher program that is administered by the County as well as those conducted by charitable organizations.
4. Cash flow tracking for federal/state/ local funding A critical function of the System Management process will be the close tracking of the sources of funds and expenditures for project and programs within its scope. This accounting has been sorely needed by the community in order to more effectively determine unit costs per services, project revenues and outlay of funds. Tracking will be applied to funding sources, recipients, amounts, launch and termination dates and cash flow. The Manager will also expedite and monitor sub-contracts.
5. Weekly reports/ monitoring meetings Through HMIS, weekly reports will be issued that illustrate the: 1) overall counts of housing units and shelter; 2) occupancy rates; 3) expense estimate; 4) revenue estimate; 5) cash flow; 6) number of new clients who entered the system of care through; 7) disruptions in re-housing; 8) progress on Plan outcomes. These reports will be shared with System Management staff, quarterly with the Advisory Committee and annually with the City, County and private funders and the community at large.
6. Problem identification and solving—special needs An innovative component of the System Management process will be the phasing in of levels of oversight for services provision—from administrative to fiscal to clinical. At the administrative level, the Manager will monitor contracts and grants that are awarded through the Continuum of Care of other entities for which is the fiduciary agent. It will also oversee and report on the level of achievement of the Plan outcomes and the
-3-
degree of compliance with relevant codes, regulations and the Standards of Care. Among its first functions will be to provide emergency operating assistance and as needed assist in the development of action plans that enhance the administrative capacity of agencies thus reducing the likelihood that emergency aid would be required. The Manager will also contract for the services such as mobile outreach teams that can be deployed with the Rapid Rehousing Interventions and the staffing and maintenance of the drop in centers. Over time, the Manager will employ in-house personnel who can offer organizational development services with agencies and clinical staff who can suggest measures to meet outcomes.
7. Resources/ funds development Extending its role in the development of resources in which the CFTH already serves as the liaison to HUD through the development of the Continuum of Care Grant, the Manager will participate in the generation of new funds by participating with local government in the budgeting process. In addition, the Manager will consult with foundations, the religious community and the private sector who are interested in funding initiatives related to the prevention of and intervention in ending homelessness. In this roles, the Manager will also create channels for the general public to more effectively intervene in services to the homeless or those at risk. CFTH will set up a community fund for homelessness and distribute proceeds to fill strategic cash needs in the system.
8. Standards of care In collaboration with provider of housing and services to homeless persons and those at-risk of homelessness, the Manager will assist in the development of Standards of Care for related services. These may be patterned after existing Standards and are not intended to supplant participation in programs such as those required by the Joint Commission of Accreditation of Hospital Organizations (JCAHO). It will be within the scope of the System Management function to monitor participating agencies’ compliance with the Standards and to assist those agencies that have difficulty in meeting their benchmarks.
9. Prevention As has been apparent in the months following the 2005 hurricanes, rapid and effective crisis intervention greatly facilitates prevention of homelessness. The Manager and Advisory Board will serve with other first responders to widespread housing related crises /, such as were seen in the 2005 hurricanes and in Tropical Storm Allison and will continue to monitor persons who displaced in those disasters. The Manager will participate with City in assessing long-term needs of the evacuees.
10. Increasing community will (& opening pockets) to end homelessness The Manager will be seen as the spokesperson for topics related to homelessness to the media, civic and community groups and the public at large and will be the source for accurate information on size of homeless population, the extent of service provided and the ongoing barriers to service access and unmet needs. They will also administer the website www.helpthehomelesshouston.com that will provide information for citizens giving of money, volunteer time, food and clothing.
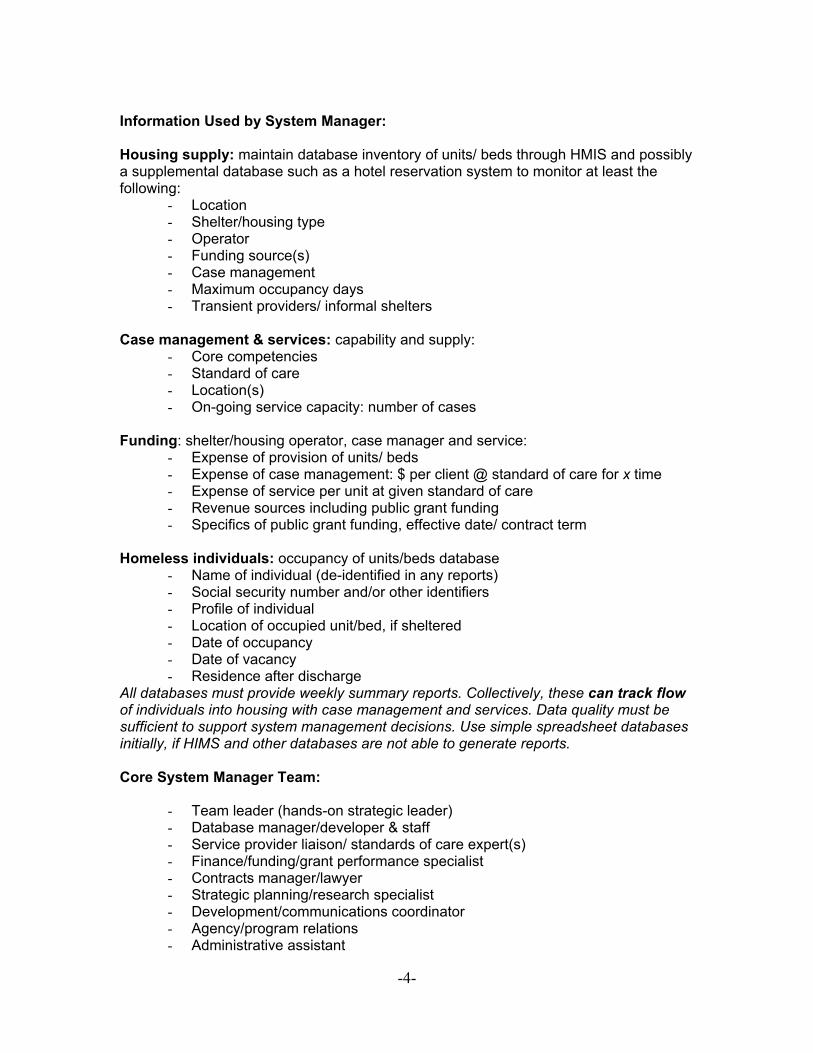
-4-
Information Used by System Manager: Housing supply: maintain database inventory of units/ beds through HMIS and possibly a supplemental database such as a hotel reservation system to monitor at least the following:
- Location - Shelter/housing type - Operator - Funding source(s) - Case management - Maximum occupancy days - Transient providers/ informal shelters
Case management & services: capability and supply:
- Core competencies - Standard of care - Location(s) - On-going service capacity: number of cases
Funding: shelter/housing operator, case manager and service:
- Expense of provision of units/ beds - Expense of case management: $ per client @ standard of care for x time - Expense of service per unit at given standard of care - Revenue sources including public grant funding - Specifics of public grant funding, effective date/ contract term
Homeless individuals: occupancy of units/beds database
- Name of individual (de-identified in any reports) - Social security number and/or other identifiers - Profile of individual - Location of occupied unit/bed, if sheltered - Date of occupancy - Date of vacancy - Residence after discharge
All databases must provide weekly summary reports. Collectively, these can track flow of individuals into housing with case management and services. Data quality must be sufficient to support system management decisions. Use simple spreadsheet databases initially, if HIMS and other databases are not able to generate reports. Core System Manager Team:
- Team leader (hands-on strategic leader) - Database manager/developer & staff - Service provider liaison/ standards of care expert(s) - Finance/funding/grant performance specialist - Contracts manager/lawyer - Strategic planning/research specialist - Development/communications coordinator - Agency/program relations - Administrative assistant
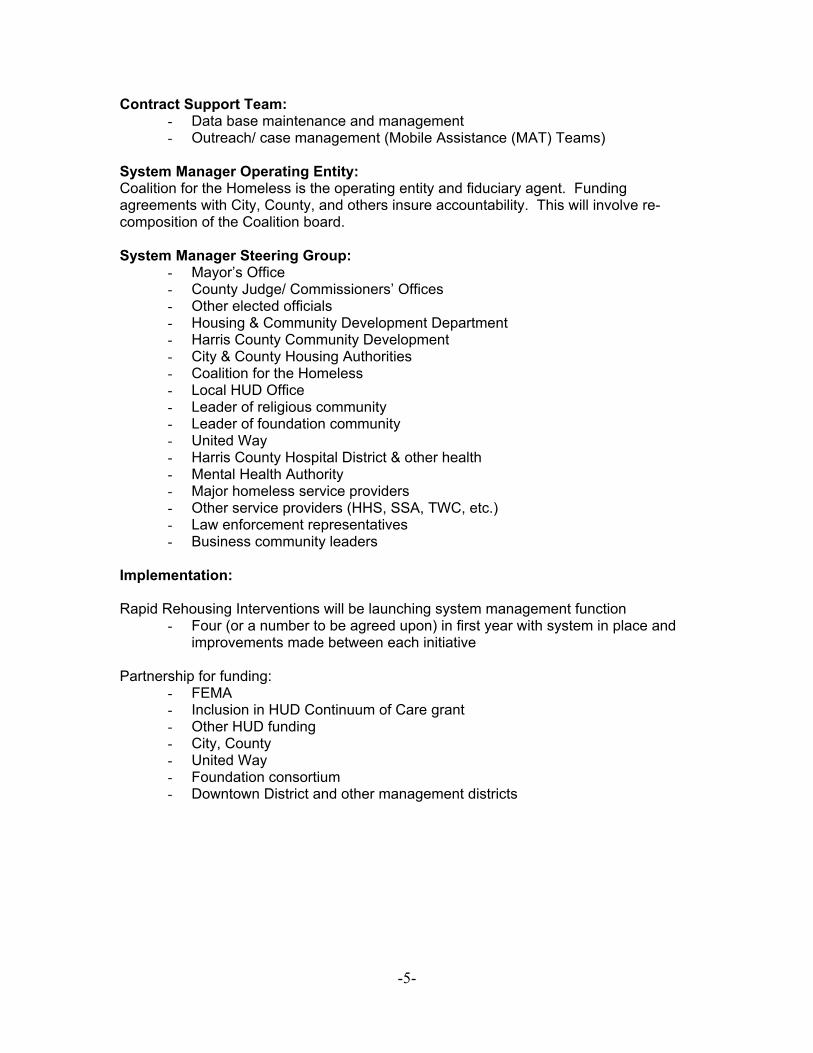
-5-
Contract Support Team: - Data base maintenance and management - Outreach/ case management (Mobile Assistance (MAT) Teams)
System Manager Operating Entity: Coalition for the Homeless is the operating entity and fiduciary agent. Funding agreements with City, County, and others insure accountability. This will involve re-composition of the Coalition board. System Manager Steering Group:
- Mayor’s Office - County Judge/ Commissioners’ Offices - Other elected officials - Housing & Community Development Department - Harris County Community Development - City & County Housing Authorities - Coalition for the Homeless - Local HUD Office - Leader of religious community - Leader of foundation community - United Way - Harris County Hospital District & other health - Mental Health Authority - Major homeless service providers - Other service providers (HHS, SSA, TWC, etc.) - Law enforcement representatives - Business community leaders
Implementation: Rapid Rehousing Interventions will be launching system management function
- Four (or a number to be agreed upon) in first year with system in place and improvements made between each initiative
Partnership for funding:
- FEMA - Inclusion in HUD Continuum of Care grant - Other HUD funding - City, County - United Way - Foundation consortium - Downtown District and other management districts
Houston/Harris County Community Profile
— An Enumeration and Needs Assessment of Homeless Persons in Houston/Harris County —
Blue Ribbon Commission to End Chronic Homelessness Coalition for the Homeless of Houston/Harris County
May 2005
Financial Support Provided By:
City of Houston Department of Housing and Community Development
United Way of the Texas Gulf Coast
Downtown Management District
Micheal E. DeBakey Veterans Affairs Medical Center
i
Blue Ribbon Commission David Benson Harris County Commissioners Court David S Buck, MD, MPH Department of Family & Community Medicine Baylor College of Medicine James Calaway Center for Houston’s Future Robert Eury Central Houston, Inc. The Most Reverend Bishop Fiorenza The Diocese of Galveston – Houston Skip Kasdorf Greater Houston Partnership Richard Lapin City of Houston Anna Leal Houston Endowment, Inc. The Honorable Pat Lykos Harris County
Anthony Love Coalition for the Homeless of Houston/Harris County Barry Mandel Houston Downtown Alliance Jacqueline Martin United Way of the Texas Gulf Coast Vickie L. McBride City of Houston Department of Housing & Community Development The Honorable Gordon Quan City Council Member At Large, Position 2 Sally Shipman The United States Interagency Council on Homelessness Region VI Coordinator – Southwestern States Richard Wilson Operations Specialist, U.S. Dept. HUD
ii
Participating Provider Organizations: Executive Directors Group
AIDS Foundation Houston John Huckaby
Catholic Charities of the Diocese of Galveston-Houston Anna Babin Joe Rubio
Children at Risk Barbara McCormick
City of Houston Vickie McBride
Coalition for the Homeless Anthony Love Anne Thomas
Healthcare for the Homeless-Houston Frances Isbell
The Houston Housing Corporation Earl Hatcher Caroline Zorn Pickens
Houston Veterans Administration Medical Center George Castillo Vincent Clancy David Sands
Mental Health and Mental Retardation Administration of Harris County Tom Mitchell
Ryan White Planning Council Tori Williams
SEARCH Sandy Kessler Tao Costa Cathy Crouch
Salvation Army Major Henry Gonzales Major John Jones
Star of Hope Mission Randy Tabor Gary Brown
The Women’s Home Paula Paust Debbie Drake
United Way of the Texas Gulf Coast Linda O’Black Jeff Stys
U.S. Veterans Todd Johnson
iii
Enumeration Team The following individuals served as the enumerators for this project. Those team members listed in bold type also participated in data entry and data validation. Lorena Abitante Luz Agah Sharon Alexander Janie Balderama Danny Bean Dennis Beck Layla Becker Juana Benite Mike Blockson Randy Bratsven Clarence Brown Lawrence Brown Jennifer Carr Sherica Celestine Tino Chapa Larry Cronin Melsimon Davis Thelma DeLeon Ramona Dixon Jonathan Ellis Sandra Elmquist Barbara Feliciano Erica Fleek-Mallet
James Fuller Charles George Valicia Gilyard Victor Gonalez Martin Graham Julissa Guerrero Don Hall Larry Hamilton Abraham Hamilton Patricia Harrington Carl Harris Victor Harvey Roland Harvey Sharon Hewitt Patricia Jackson-Watson Lana Lanik Tim Leighton Crystal Lovings Earl Martin Socorro Martinez Lynda Matthews Amalia Mayorga Ann McKown
Mary Helen Merzbacher Michelle Mitchell Scot More Angela Moreland Eugene Myers James Odom Virg Parks Cervando Pena Chuck Roe Eninka Saidi Lillian Salinas Chester Smith Iris Smith Maurice Stringfellow Robert Tagle Maria Tapia Eva Thibaudeau Lester Tone Darlene Whiting Charles Williams Lorenda Woodard Tameika Woodard
The following supervisors from the Michael E. DeBakey Veterans Affairs Medical Center recruited enumerator team members, provided funding and vans and participated in the design and conduct of each count.
George Castillo Vincent Clancy Clarence Mitchell David Sands
The Associated Catholic Charities of the Diocese of Galveston/Houston provided the training and meeting site and many of the vans used for the Enumeration. Catholic Charities staff comprised the majority of enumerators. Under the direction of Joe Rubio, organizational support was provided by:
Rhonda Sepulveda Mary Helen Merzbacher
SEARCH Mobile Outreach provided route information, outreach workers and enumeration design. Staff participated in each of the counts. These efforts were led by:
Don Hall

iv
Acknowledgements
v
Contents Blue Ribbon Commission ........................................................................................................... i Participating Provider Organizations: Executive Directors Group ........................................ ii Enumeration Team..................................................................................................................... iii Acknowledgements ................................................................................................................... iv Introduction .................................................................................................................................1 ENUMERATION ...........................................................................................................................2 COMMUNITY PROFILE ...............................................................................................................5
Housing Status..........................................................................................................................................6 Reasons for loss of housing..................................................................................................................7
Demographic Characteristics ....................................................................................................................8 Race/Ethnicity .......................................................................................................................................8 Age range..............................................................................................................................................9 Gender ................................................................................................................................................10 Income range ......................................................................................................................................10 Education level....................................................................................................................................11
Healthcare Characteristics ......................................................................................................................12 Need for medical care and sites where it was provided .....................................................................12 Health insurance status.......................................................................................................................12 Medical conditions...............................................................................................................................14 Disabilities ...........................................................................................................................................15
Service Needs.........................................................................................................................................16 Use of Services .......................................................................................................................................17 Access to Services..................................................................................................................................18
PROFILES OF SPECIFIC SUB-POPULATIONS.......................................................................19 Introduction..........................................................................................................................................19 Summary findings ...............................................................................................................................20 How to use the tables and charts........................................................................................................20
Chronically homeless ..............................................................................................................................21 Definition .............................................................................................................................................21 Challenges ..........................................................................................................................................21 Housing status ....................................................................................................................................21 Demographic data...............................................................................................................................22 Services: need, use and difficulty of access .......................................................................................24
People with Mental Health Disorders......................................................................................................25 Definitions............................................................................................................................................25 Challenges ..........................................................................................................................................25 Housing status ....................................................................................................................................25 Demographic data...............................................................................................................................26 Services: need, use, difficulty of access .............................................................................................28
People with a History of Substance Abuse .............................................................................................29 Definition .............................................................................................................................................29 Challenges ..........................................................................................................................................29 Housing status ....................................................................................................................................29 Demographic data...............................................................................................................................30 Services: need, use, difficulty of access .............................................................................................32
Veterans..................................................................................................................................................33 Definition .............................................................................................................................................33 Challenges ..........................................................................................................................................33 Housing status ....................................................................................................................................33 Demographic data...............................................................................................................................34 Services: need, use, difficulty of access .............................................................................................36
\
vi
HIV/AIDS.................................................................................................................................................37
Definition .............................................................................................................................................37 Challenges ..........................................................................................................................................37 Housing status ....................................................................................................................................37 Demographic data...............................................................................................................................38 Services: need, use, difficulty of access .............................................................................................40
Victims of Domestic Violence..................................................................................................................41 Definition .............................................................................................................................................41 Challenges ..........................................................................................................................................41 Housing status ....................................................................................................................................41 Demographic data...............................................................................................................................42 Services: need, use, difficulty of access .............................................................................................44
Persons Currently Incarcerated or Released from Incarceration............................................................45 Definition .............................................................................................................................................45 Housing status ....................................................................................................................................45 Challenges ..........................................................................................................................................45 Demographic data...............................................................................................................................46 Services: need, use, difficulty of access .............................................................................................48
Marginally housed ...................................................................................................................................50 Definition .............................................................................................................................................50 Challenges ..........................................................................................................................................50 Housing status ....................................................................................................................................50 Demographic data...............................................................................................................................50 Services: need, use, difficulty of access .............................................................................................52
Families with Minor Children ...................................................................................................................53 Definition .............................................................................................................................................53 Challenges ..........................................................................................................................................53 Housing status ....................................................................................................................................53 Demographic data...............................................................................................................................54 Families represented in special needs populations ............................................................................55 Services: need, use, difficulty of access .............................................................................................56
Youth .......................................................................................................................................................57 Definition .............................................................................................................................................57 Challenges ..........................................................................................................................................57 Housing status ....................................................................................................................................57 Demographic data...............................................................................................................................57
CONCLUSIONS .........................................................................................................................60 Factors That Can Lead to Homelessness...............................................................................................60 A Model to Serve Persons Who Are Homelessness ..............................................................................63
Defining the problem to be solved ......................................................................................................63 Realistic program planning for clients .................................................................................................63 Support for variable systems of care ..................................................................................................64 Implementing evidence-based practices.............................................................................................65 Developing standards of care .............................................................................................................66 On-going assessment .........................................................................................................................66
RECOMMENDATIONS ..............................................................................................................68 Public Policy and Planning......................................................................................................................68 Funding ...................................................................................................................................................68 Increasing Access to Housing.................................................................................................................68 Service Delivery ......................................................................................................................................68
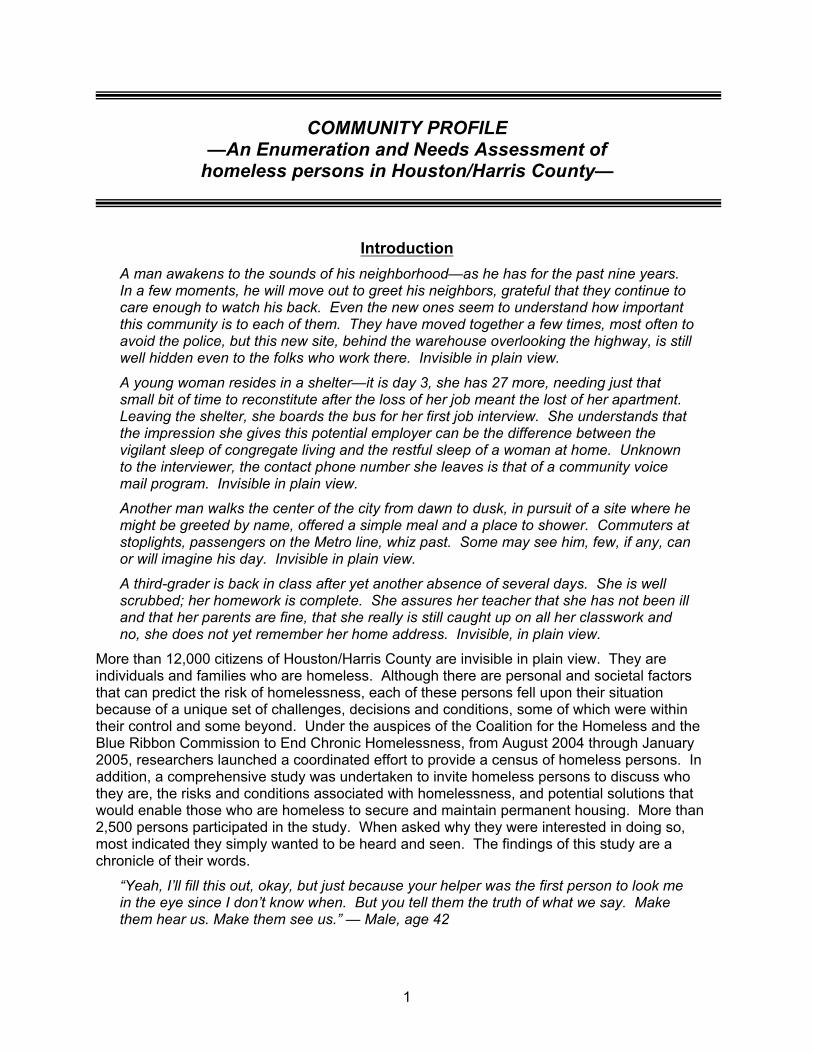
1
COMMUNITY PROFILE
—An Enumeration and Needs Assessment of homeless persons in Houston/Harris County—
Introduction A man awakens to the sounds of his neighborhood—as he has for the past nine years. In a few moments, he will move out to greet his neighbors, grateful that they continue to care enough to watch his back. Even the new ones seem to understand how important this community is to each of them. They have moved together a few times, most often to avoid the police, but this new site, behind the warehouse overlooking the highway, is still well hidden even to the folks who work there. Invisible in plain view.
A young woman resides in a shelter—it is day 3, she has 27 more, needing just that small bit of time to reconstitute after the loss of her job meant the lost of her apartment. Leaving the shelter, she boards the bus for her first job interview. She understands that the impression she gives this potential employer can be the difference between the vigilant sleep of congregate living and the restful sleep of a woman at home. Unknown to the interviewer, the contact phone number she leaves is that of a community voice mail program. Invisible in plain view.
Another man walks the center of the city from dawn to dusk, in pursuit of a site where he might be greeted by name, offered a simple meal and a place to shower. Commuters at stoplights, passengers on the Metro line, whiz past. Some may see him, few, if any, can or will imagine his day. Invisible in plain view.
A third-grader is back in class after yet another absence of several days. She is well scrubbed; her homework is complete. She assures her teacher that she has not been ill and that her parents are fine, that she really is still caught up on all her classwork and no, she does not yet remember her home address. Invisible, in plain view.
More than 12,000 citizens of Houston/Harris County are invisible in plain view. They are individuals and families who are homeless. Although there are personal and societal factors that can predict the risk of homelessness, each of these persons fell upon their situation because of a unique set of challenges, decisions and conditions, some of which were within their control and some beyond. Under the auspices of the Coalition for the Homeless and the Blue Ribbon Commission to End Chronic Homelessness, from August 2004 through January 2005, researchers launched a coordinated effort to provide a census of homeless persons. In addition, a comprehensive study was undertaken to invite homeless persons to discuss who they are, the risks and conditions associated with homelessness, and potential solutions that would enable those who are homeless to secure and maintain permanent housing. More than 2,500 persons participated in the study. When asked why they were interested in doing so, most indicated they simply wanted to be heard and seen. The findings of this study are a chronicle of their words.
“Yeah, I’ll fill this out, okay, but just because your helper was the first person to look me in the eye since I don’t know when. But you tell them the truth of what we say. Make them hear us. Make them see us.” — Male, age 42
2
ENUMERATION From September 2004 through January 2005, teams of outreach workers and other experts were deployed to provide a rigorous census of homeless in Houston/Harris County. This process was unique in four ways:
1. Composition of the teams 2. Number of counts 3. Between-count surveying and observation 4. Compensation of team members
Unlike most enumeration processes, this study recruited outreach workers and clients from agencies that serve the homeless. Each team of 3-4 members was composed of at least one outreach worker and one or two persons who were currently or formerly homeless. Several team members were also supervisors of homeless services agencies. The team members who had experienced homelessness were recruited from the Compensated Work Therapy (CWT) program, administered by the Department of Veterans Affairs (VA) through the Michael E. DeBakey Veterans Affairs Medical Center. CWT clients were labeled as ‘Experts’ on the teams, adopted the mantle with diligence and, in partnership with the outreach workers, were largely responsible for the effectiveness of the counts.
A training program was held at the launch of the project, which detailed the procedures that would be used including:
Mapping of territories Safety issues Signs of encampment Characteristics of homeless persons Emergency procedures Referral procedures Methods for respectful approaches to persons being counted Non-invasive approaches to encampments Use of the enumeration form Methods for reporting and collecting remuneration
In the months that followed, each count was preceded by a review of the previous counts, a report of locations of encampments and congregating sites, techniques in response to weather conditions, any relevant political changes (such as enforcement of civility ordinances, closing of a major encampment, news media coverage, etc.). CWT clients were invited to present information on topics that they believed relevant to the process, and did so at each meeting. They spoke about methods to engage homeless persons about sites where they were living, how to find congregating sites, and how not to be perceived as “a ‘narc’ or a cop.”
Between the formal counts, the research team conducted surveys on the streets and were able to acquaint homeless persons with the Enumeration as well as the Needs Assessment. Team members became increasingly familiar with encampments and sites where homeless persons tended to congregate during the day as the study progressed, and with each count were able to account for a greater number of homeless persons. Because homeless and formerly homeless men and women were included in the teams, the census gathered data from sites that were new to outreach workers. Further, persons in encampments and congregating sites became acquainted with the teams, and on census days were most cooperative in assisting teams in identifying sites where homeless persons could be found. As the months progressed, the
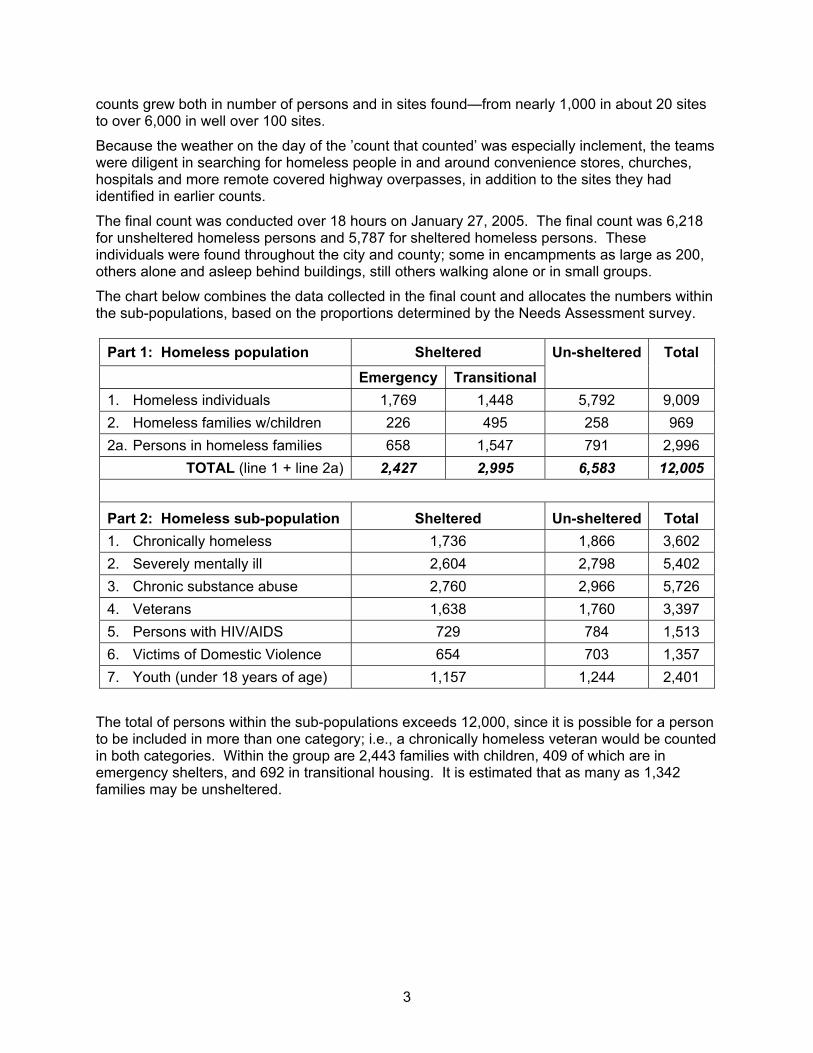
3
counts grew both in number of persons and in sites found—from nearly 1,000 in about 20 sites to over 6,000 in well over 100 sites.
Because the weather on the day of the ’count that counted’ was especially inclement, the teams were diligent in searching for homeless people in and around convenience stores, churches, hospitals and more remote covered highway overpasses, in addition to the sites they had identified in earlier counts.
The final count was conducted over 18 hours on January 27, 2005. The final count was 6,218 for unsheltered homeless persons and 5,787 for sheltered homeless persons. These individuals were found throughout the city and county; some in encampments as large as 200, others alone and asleep behind buildings, still others walking alone or in small groups.
The chart below combines the data collected in the final count and allocates the numbers within the sub-populations, based on the proportions determined by the Needs Assessment survey.
Part 1: Homeless population Sheltered Emergency Transitional
Un-sheltered
Total
1. Homeless individuals 1,769 1,448 5,792 9,009 2. Homeless families w/children 226 495 258 969 2a. Persons in homeless families 658 1,547 791 2,996
TOTAL (line 1 + line 2a) 2,427 2,995 6,583 12,005
Part 2: Homeless sub-population Sheltered Un-sheltered Total 1. Chronically homeless 1,736 1,866 3,602 2. Severely mentally ill 2,604 2,798 5,402 3. Chronic substance abuse 2,760 2,966 5,726 4. Veterans 1,638 1,760 3,397 5. Persons with HIV/AIDS 729 784 1,513 6. Victims of Domestic Violence 654 703 1,357 7. Youth (under 18 years of age) 1,157 1,244 2,401
The total of persons within the sub-populations exceeds 12,000, since it is possible for a person to be included in more than one category; i.e., a chronically homeless veteran would be counted in both categories. Within the group are 2,443 families with children, 409 of which are in emergency shelters, and 692 in transitional housing. It is estimated that as many as 1,342 families may be unsheltered.
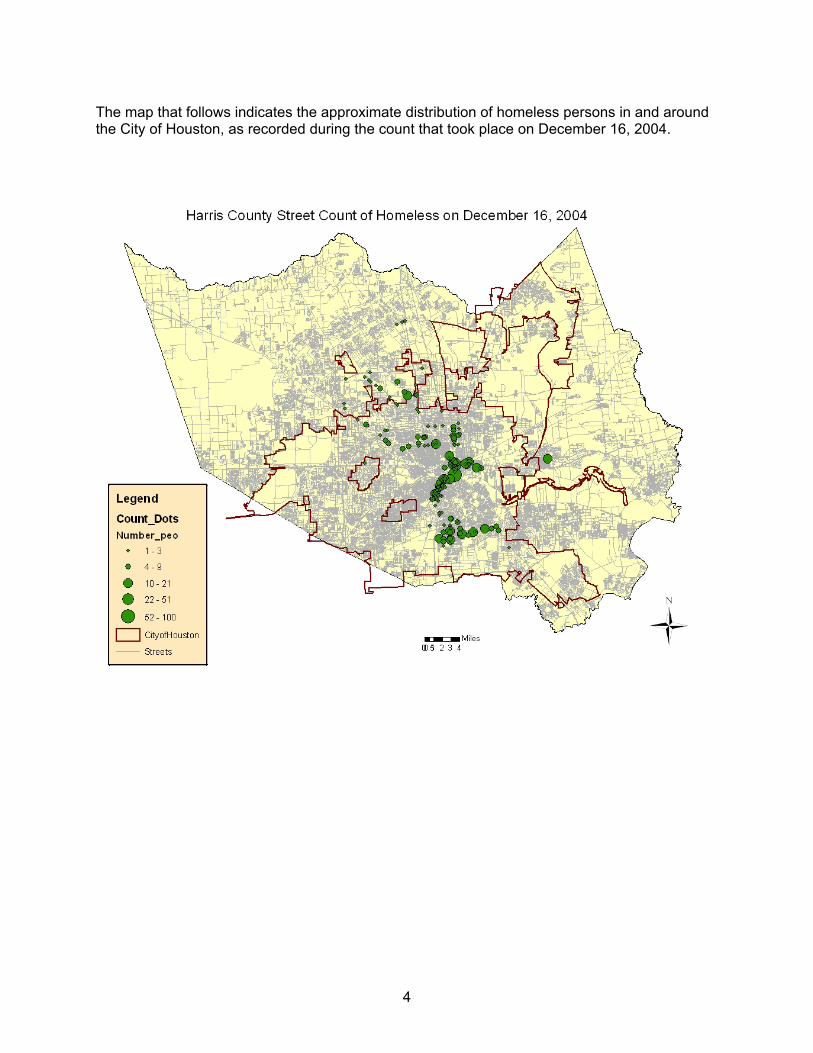
4
The map that follows indicates the approximate distribution of homeless persons in and around the City of Houston, as recorded during the count that took place on December 16, 2004.
5
COMMUNITY PROFILE Between August 2004 and January 2005, a comprehensive needs assessment of homeless persons living in Houston/Harris County was conducted. The study included a survey of 2,294 people, with low to moderate incomes, 1,540 of whom were homeless at the time of their participation and 20 focus groups with a total of 120 participants. Focus group participants included homeless persons, providers of services to the homeless, government officials and caregivers of persons with mental illness. In addition, at least four interviews were conducted by the lead investigator each time street surveys were undertaken, for a total of 96 interviews.
Two surveys were employed. Survey 1, used to elicit data relevant for the HCD Consolidated Plani, was administered to 954 persons. Survey 2, used to develop profiles of special needs populations as designated by HUD, was administered to 1,340 persons. Both surveys included identical demographic questions that were combined for purposes of providing this information, so the demographic data are based on the total of 1,540 homeless persons. Data related to profiles and health care are based on 1,090 homeless persons who completed Survey 2.
Survey 1 Survey 2 TOTAL Housed 504 250 754
Homeless 450 1,090 1,540 TOTAL 954 1,340 2,294
The Needs Assessment attempted to garner information about the following topics: 1. What are the demographic characteristics of homeless persons? 2. What conditions seem to be most highly associated with becoming homeless? 3. What factors ameliorate the risk of homelessness? 4. What is the demographic profile of each of the HUD-defined special-needs populations? 5. What risk factors are present among the marginally housed? 6. What might prevent homelessness? 7. What housing-related social services do homeless persons report that they need? 8. To what degree are social services used by homeless persons? 9. What barriers exist to accessing and using services? 10. What gaps in services exist?
Surveys were conducted by the lead investigators with assistance from a data-gathering team of graduate students, outreach workers, and social service providers not affiliated with any of the agencies that serve the homeless. Street surveys were conducted by the investigators who accompanied outreach workers on their routes and into other sites discovered by the enumerators. No surveying was conducted during the counts.
Survey data was also gathered in emergency shelters, transitional housing programs, drop-in centers, multi-service centers, single-room occupancy (SRO) sites, clinics, meal providers and other social service agencies. In addition, teams surveyed guests at the “Super Feast” on Thanksgiving Day and at a Christmas party for the needy, sponsored by a major faith-based organization.

6
Housing Status Of the 2,294 respondents to the survey, 1,590 are currently homeless. Of these, 980 were homeless one year ago and 626 were homeless five years ago. Thus, 40% of those currently homeless have been so for at least five years, and 64% for at least one year. Noteworthy is the finding that, among those who were homeless five years ago, 87% were still homeless one year ago and among that cohort 94% are now—a rise of 7% from one year ago.
According to the federal Department of Housing and Urban Development (HUD), persons residing in transitional housing facilities or emergency shelters are considered homeless. The respondents in this sample reported the following as residences:
Site Frequency Percent Shelter 693 30.4%
Abandoned building 19 0.8% Car 19 0.8%
Street 471 20.6% Transitional housing 338 14.8%
TOTAL HOMELESS 1,540 67.5% House/apartment 349 15.3% With friend/family 245 10.7%
Mental health facility/hospital 3 0.1% Jail 103 4.5%
Not reported 54 2.4% TOTAL in SAMPLE 2,294
Among those who are housed, 81 who share a residence with family or friend can be classified as “marginally housed;” i.e., people who would be homeless had they not been able to ’double up’—reside in another’s home. They live often in sub-standard housing and report consistent difficulty finding sufficient funds to pay rent and utility bills and buy food. Because these housing options are tenuous, such individuals are at high risk for becoming homeless. In fact, 7% report having been homeless one year ago and 5.4% were homeless five years ago.
The graph below shows the duration of homelessness among those who reported being currently homeless. More than 40% indicated that they have been homeless for more than three years. Within that group are 479 men and women (31.3% of the sample) who have been homeless for more than six years, and 88 who have been homeless for more than 10 years.

7
Reasons for loss of housing
Respondents were asked the reasons that they lost their last stable residence. As indicated in the chart that follows, the most frequently cited reason was job loss, followed by drug use. It is important to consider that these attributions are self-reported. Even though the surveys were anonymous, there may be under-reporting of factors such as drug and alcohol abuse or domestic violence, which might be considered socially stigmatizing.
Reason Sample Male Female Job loss 53% 59% 32% Family member job loss 6.0% 5.1% 8.3% Could not pay rent 4.8% 4.8% 4.7% Disability 11% 12.4% 7.2% HIV/AIDS 2.6% 2.3% 3.1% Domestic Violence 9.0% 5.8% 19.2% Kicked out 20.9% 21.7% 17.7% Drug/alcohol use 26.3% 26.8% 26.4% Flood 4.3% 4.9% 2.1% Fire 1.1% 1.4% 0.5%
The “Kicked out” category encompassed people who were evicted by landlords because of disruptive behaviors or failure to pay rent, as well as persons who became embroiled in domestic disputes that resulted in their being forced to leave the residence. While the survey did not specifically ask if those who lost their housing because of flooding were affected by Tropical Storm Allison, focus group information supports the assumption that many were.
Duration of homelessness
19.7
10.9 9.2
19.2
40.8
< 3 mo 4-6 mo 7-11 mo 1-3 yr > 3 yr
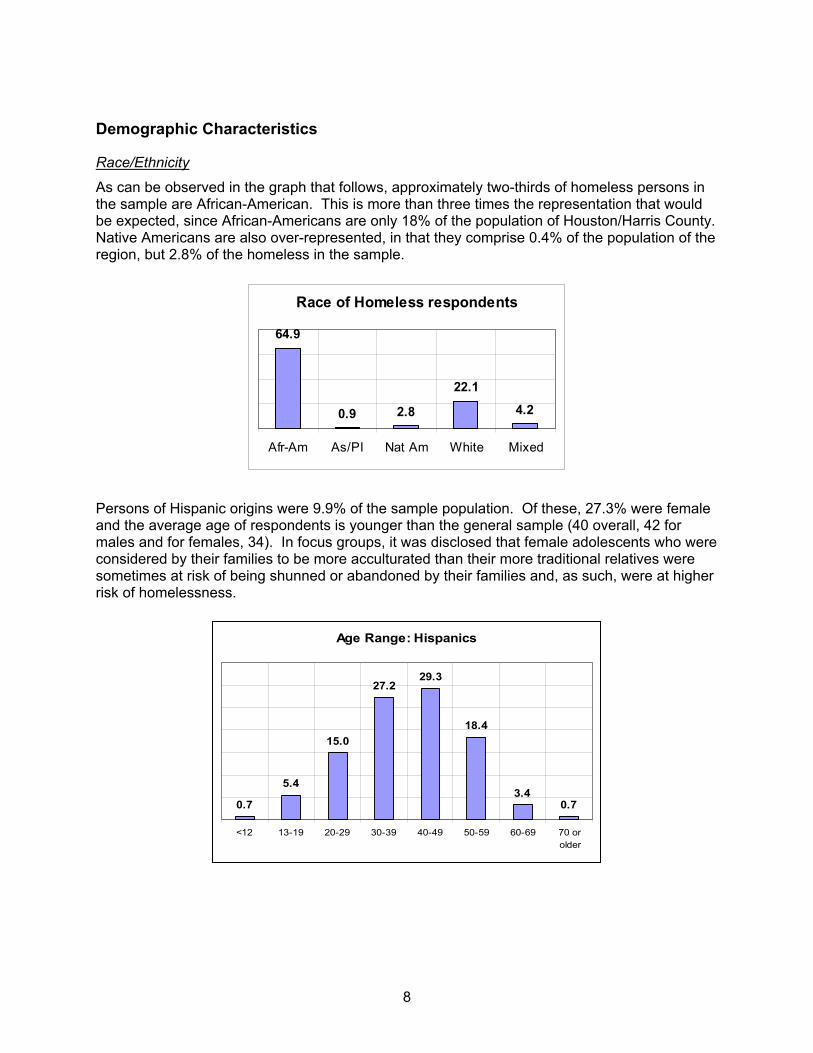
8
Demographic Characteristics
Race/Ethnicity
As can be observed in the graph that follows, approximately two-thirds of homeless persons in the sample are African-American. This is more than three times the representation that would be expected, since African-Americans are only 18% of the population of Houston/Harris County. Native Americans are also over-represented, in that they comprise 0.4% of the population of the region, but 2.8% of the homeless in the sample.
Race of Homeless respondents
64.9
0.9 2.8
22.1
4.2
Afr-Am As/PI Nat Am White Mixed
Persons of Hispanic origins were 9.9% of the sample population. Of these, 27.3% were female and the average age of respondents is younger than the general sample (40 overall, 42 for males and for females, 34). In focus groups, it was disclosed that female adolescents who were considered by their families to be more acculturated than their more traditional relatives were sometimes at risk of being shunned or abandoned by their families and, as such, were at higher risk of homelessness.
Age Range: Hispanics
0.7
5.4
15.0
27.229.3
18.4
3.40.7
<12 13-19 20-29 30-39 40-49 50-59 60-69 70 orolder
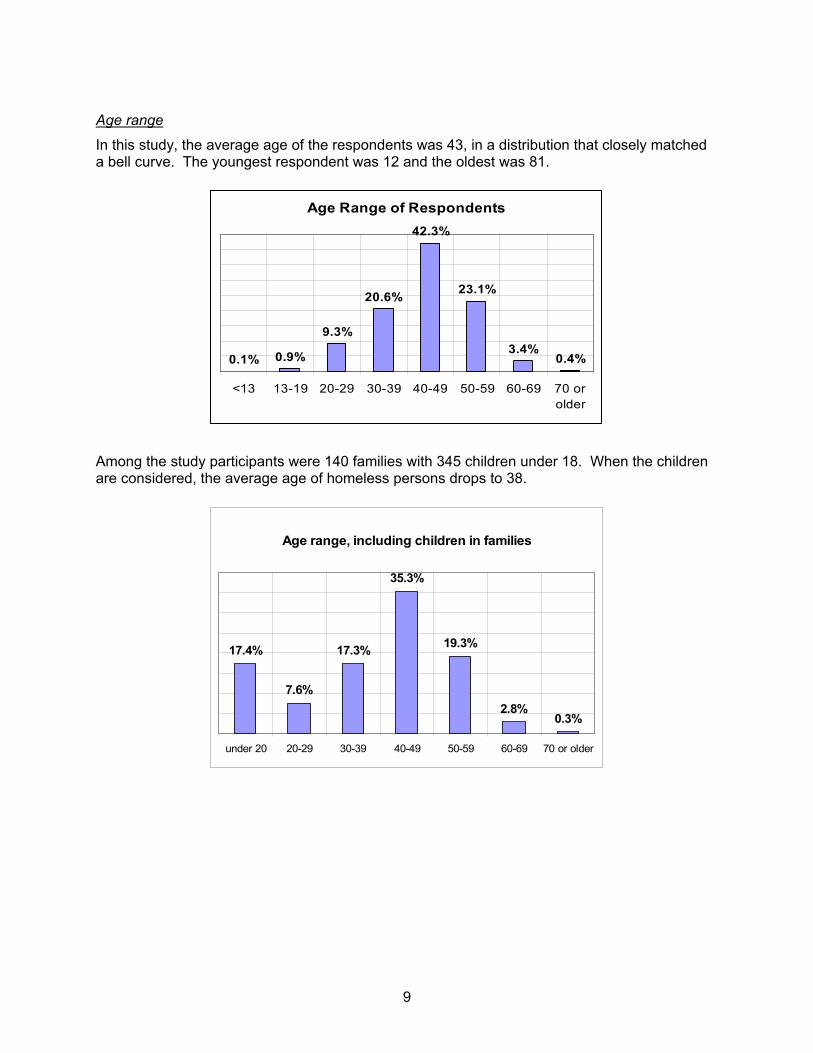
9
Age range
In this study, the average age of the respondents was 43, in a distribution that closely matched a bell curve. The youngest respondent was 12 and the oldest was 81.
Age Range of Respondents
0.1% 0.9%
9.3%
20.6%
42.3%
23.1%
3.4%0.4%
<13 13-19 20-29 30-39 40-49 50-59 60-69 70 orolder
Among the study participants were 140 families with 345 children under 18. When the children are considered, the average age of homeless persons drops to 38.
Age range, including children in families
17.4%
7.6%
17.3%
35.3%
19.3%
2.8%0.3%
under 20 20-29 30-39 40-49 50-59 60-69 70 or older
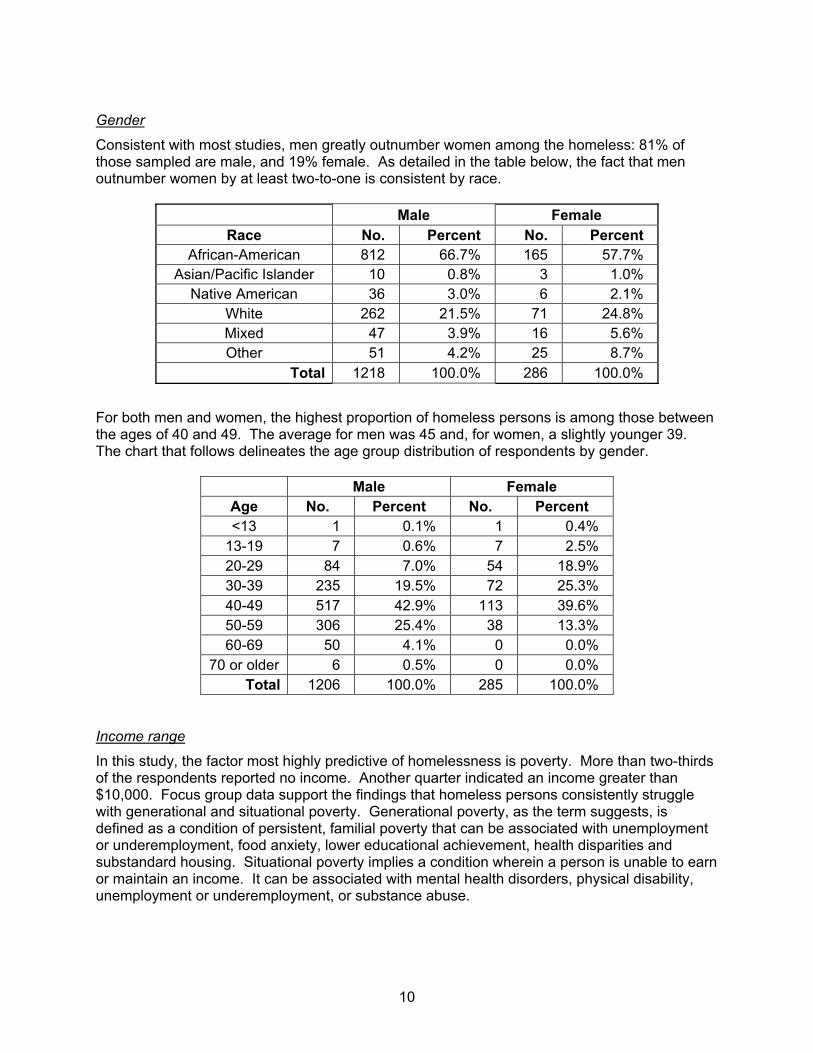
10
Gender
Consistent with most studies, men greatly outnumber women among the homeless: 81% of those sampled are male, and 19% female. As detailed in the table below, the fact that men outnumber women by at least two-to-one is consistent by race.
Male Female Race No. Percent No. Percent
African-American 812 66.7% 165 57.7% Asian/Pacific Islander 10 0.8% 3 1.0%
Native American 36 3.0% 6 2.1% White 262 21.5% 71 24.8% Mixed 47 3.9% 16 5.6% Other 51 4.2% 25 8.7%
Total 1218 100.0% 286 100.0%
For both men and women, the highest proportion of homeless persons is among those between the ages of 40 and 49. The average for men was 45 and, for women, a slightly younger 39. The chart that follows delineates the age group distribution of respondents by gender.
Male Female Age No. Percent No. Percent <13 1 0.1% 1 0.4%
13-19 7 0.6% 7 2.5% 20-29 84 7.0% 54 18.9% 30-39 235 19.5% 72 25.3% 40-49 517 42.9% 113 39.6% 50-59 306 25.4% 38 13.3% 60-69 50 4.1% 0 0.0%
70 or older 6 0.5% 0 0.0% Total 1206 100.0% 285 100.0%
Income range
In this study, the factor most highly predictive of homelessness is poverty. More than two-thirds of the respondents reported no income. Another quarter indicated an income greater than $10,000. Focus group data support the findings that homeless persons consistently struggle with generational and situational poverty. Generational poverty, as the term suggests, is defined as a condition of persistent, familial poverty that can be associated with unemployment or underemployment, food anxiety, lower educational achievement, health disparities and substandard housing. Situational poverty implies a condition wherein a person is unable to earn or maintain an income. It can be associated with mental health disorders, physical disability, unemployment or underemployment, or substance abuse.
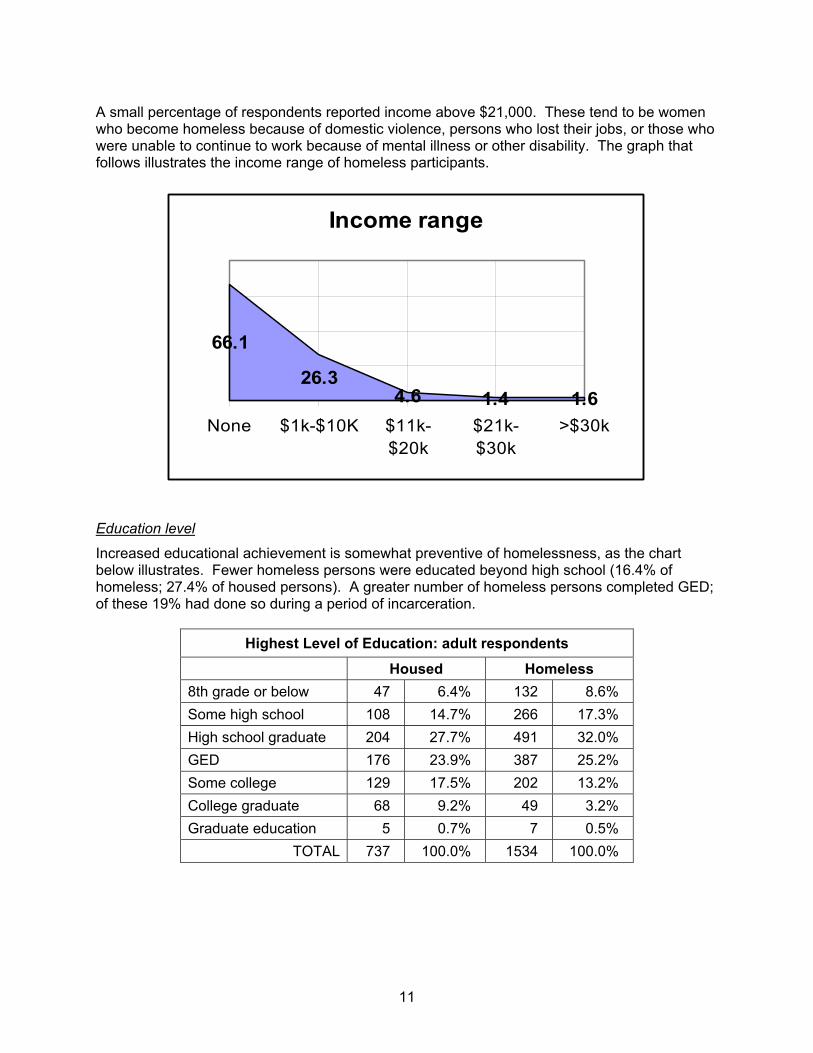
11
A small percentage of respondents reported income above $21,000. These tend to be women who become homeless because of domestic violence, persons who lost their jobs, or those who were unable to continue to work because of mental illness or other disability. The graph that follows illustrates the income range of homeless participants.
Income range
66.1
26.34.6 1.4 1.6
None $1k-$10K $11k-$20k
$21k-$30k
>$30k
Education level
Increased educational achievement is somewhat preventive of homelessness, as the chart below illustrates. Fewer homeless persons were educated beyond high school (16.4% of homeless; 27.4% of housed persons). A greater number of homeless persons completed GED; of these 19% had done so during a period of incarceration.
Highest Level of Education: adult respondents
Housed Homeless 8th grade or below 47 6.4% 132 8.6% Some high school 108 14.7% 266 17.3% High school graduate 204 27.7% 491 32.0% GED 176 23.9% 387 25.2% Some college 129 17.5% 202 13.2% College graduate 68 9.2% 49 3.2% Graduate education 5 0.7% 7 0.5%
TOTAL 737 100.0% 1534 100.0%
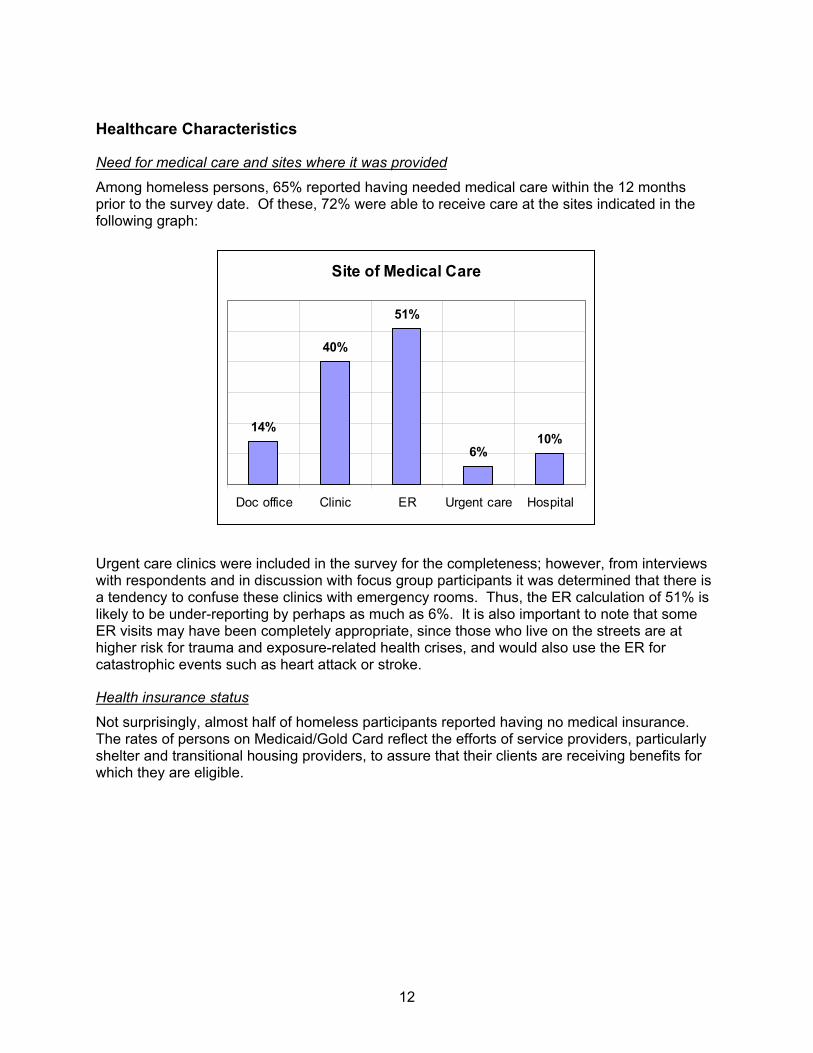
12
Healthcare Characteristics
Need for medical care and sites where it was provided
Among homeless persons, 65% reported having needed medical care within the 12 months prior to the survey date. Of these, 72% were able to receive care at the sites indicated in the following graph:
Site of Medical Care
14%
40%
51%
6%10%
Doc office Clinic ER Urgent care Hospital
Urgent care clinics were included in the survey for the completeness; however, from interviews with respondents and in discussion with focus group participants it was determined that there is a tendency to confuse these clinics with emergency rooms. Thus, the ER calculation of 51% is likely to be under-reporting by perhaps as much as 6%. It is also important to note that some ER visits may have been completely appropriate, since those who live on the streets are at higher risk for trauma and exposure-related health crises, and would also use the ER for catastrophic events such as heart attack or stroke.
Health insurance status
Not surprisingly, almost half of homeless participants reported having no medical insurance. The rates of persons on Medicaid/Gold Card reflect the efforts of service providers, particularly shelter and transitional housing providers, to assure that their clients are receiving benefits for which they are eligible.

13
Types of Medical Insurance47%
1%4%
37%
11%
1%
None Private Medicare MedicaidGC
VA Other
The chart below illustrates the gender differences in types of health insurance:
Type of Insurance Male Female None 48% 43%
Private insurance 1% 1% Medicare 3% 6%
Medicaid/Gold Card 34% 50% VA 14% 0.5%
The few persons who reported having private insurance were either women who were newly homeless because of domestic violence, or men or women who, at some point in the past year, had access to employer-provided insurance.
Respondents were also queried about their requirements for prescription medications. While 42% indicated that they needed medications daily or often, 73% reported that they skipped taking them because they were unable to afford them.
Data provided by Healthcare for the Homeless–Houston (HHH) show that 35.9% had no insurance, 36.5% had a Gold Card, 8.2% had Medicaid and 7.7% had access to VA insurance. In a compelling finding, HHH notes that of the 220 persons whom they surveyed, “40% had missed work and 45.9% a meal in order to get healthcare.”ii
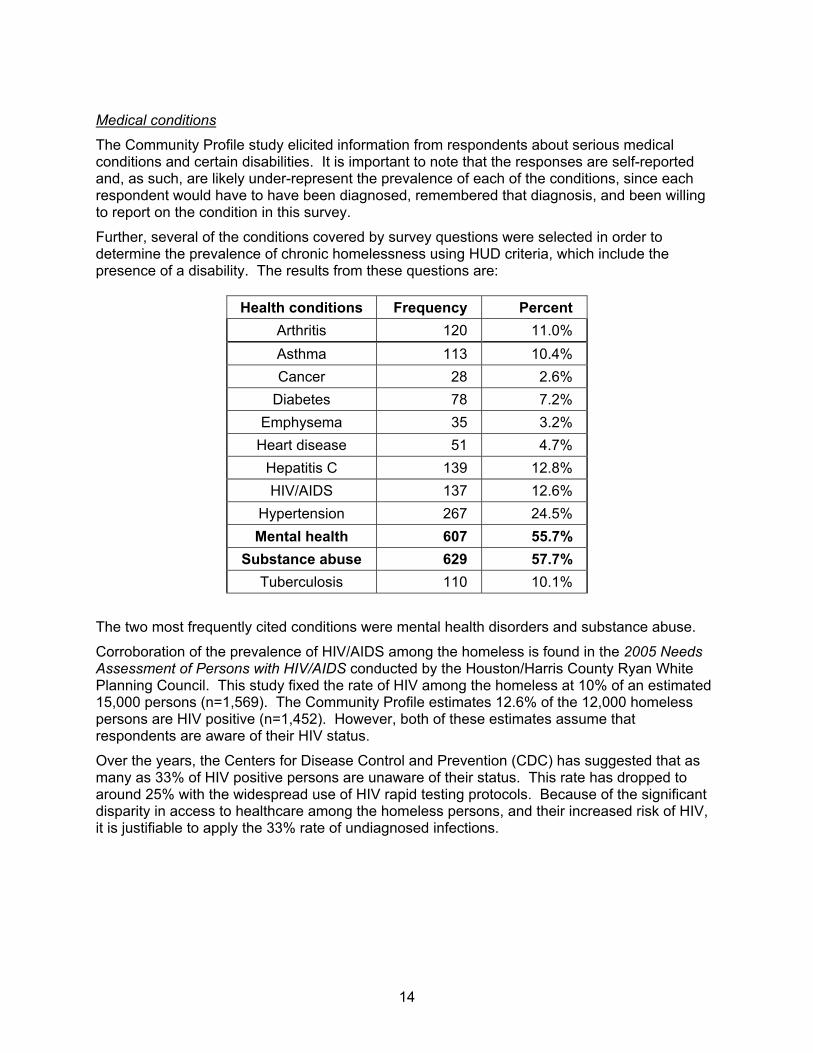
14
Medical conditions
The Community Profile study elicited information from respondents about serious medical conditions and certain disabilities. It is important to note that the responses are self-reported and, as such, are likely under-represent the prevalence of each of the conditions, since each respondent would have to have been diagnosed, remembered that diagnosis, and been willing to report on the condition in this survey.
Further, several of the conditions covered by survey questions were selected in order to determine the prevalence of chronic homelessness using HUD criteria, which include the presence of a disability. The results from these questions are:
Health conditions Frequency Percent Arthritis 120 11.0% Asthma 113 10.4% Cancer 28 2.6%
Diabetes 78 7.2% Emphysema 35 3.2%
Heart disease 51 4.7% Hepatitis C 139 12.8% HIV/AIDS 137 12.6%
Hypertension 267 24.5% Mental health 607 55.7%
Substance abuse 629 57.7% Tuberculosis 110 10.1%
The two most frequently cited conditions were mental health disorders and substance abuse.
Corroboration of the prevalence of HIV/AIDS among the homeless is found in the 2005 Needs Assessment of Persons with HIV/AIDS conducted by the Houston/Harris County Ryan White Planning Council. This study fixed the rate of HIV among the homeless at 10% of an estimated 15,000 persons (n=1,569). The Community Profile estimates 12.6% of the 12,000 homeless persons are HIV positive (n=1,452). However, both of these estimates assume that respondents are aware of their HIV status.
Over the years, the Centers for Disease Control and Prevention (CDC) has suggested that as many as 33% of HIV positive persons are unaware of their status. This rate has dropped to around 25% with the widespread use of HIV rapid testing protocols. Because of the significant disparity in access to healthcare among the homeless persons, and their increased risk of HIV, it is justifiable to apply the 33% rate of undiagnosed infections.
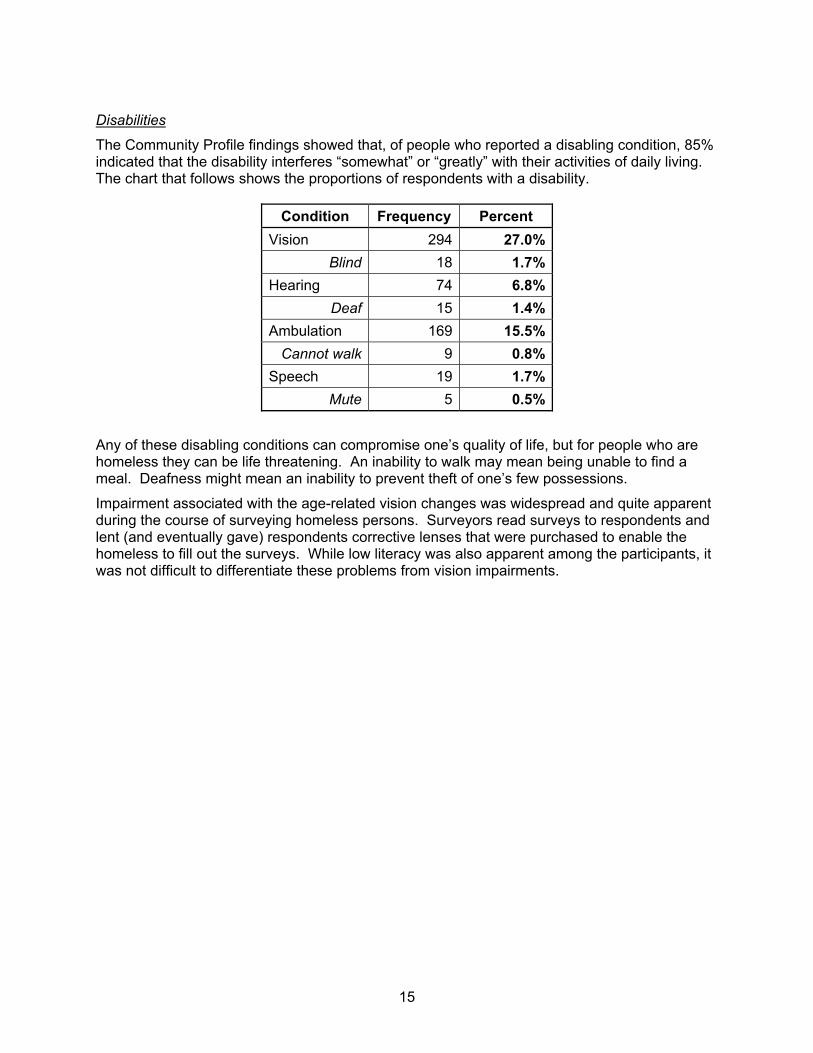
15
Disabilities
The Community Profile findings showed that, of people who reported a disabling condition, 85% indicated that the disability interferes “somewhat” or “greatly” with their activities of daily living. The chart that follows shows the proportions of respondents with a disability.
Condition Frequency Percent Vision 294 27.0%
Blind 18 1.7%Hearing 74 6.8%
Deaf 15 1.4%Ambulation 169 15.5%
Cannot walk 9 0.8%Speech 19 1.7%
Mute 5 0.5%
Any of these disabling conditions can compromise one’s quality of life, but for people who are homeless they can be life threatening. An inability to walk may mean being unable to find a meal. Deafness might mean an inability to prevent theft of one’s few possessions.
Impairment associated with the age-related vision changes was widespread and quite apparent during the course of surveying homeless persons. Surveyors read surveys to respondents and lent (and eventually gave) respondents corrective lenses that were purchased to enable the homeless to fill out the surveys. While low literacy was also apparent among the participants, it was not difficult to differentiate these problems from vision impairments.
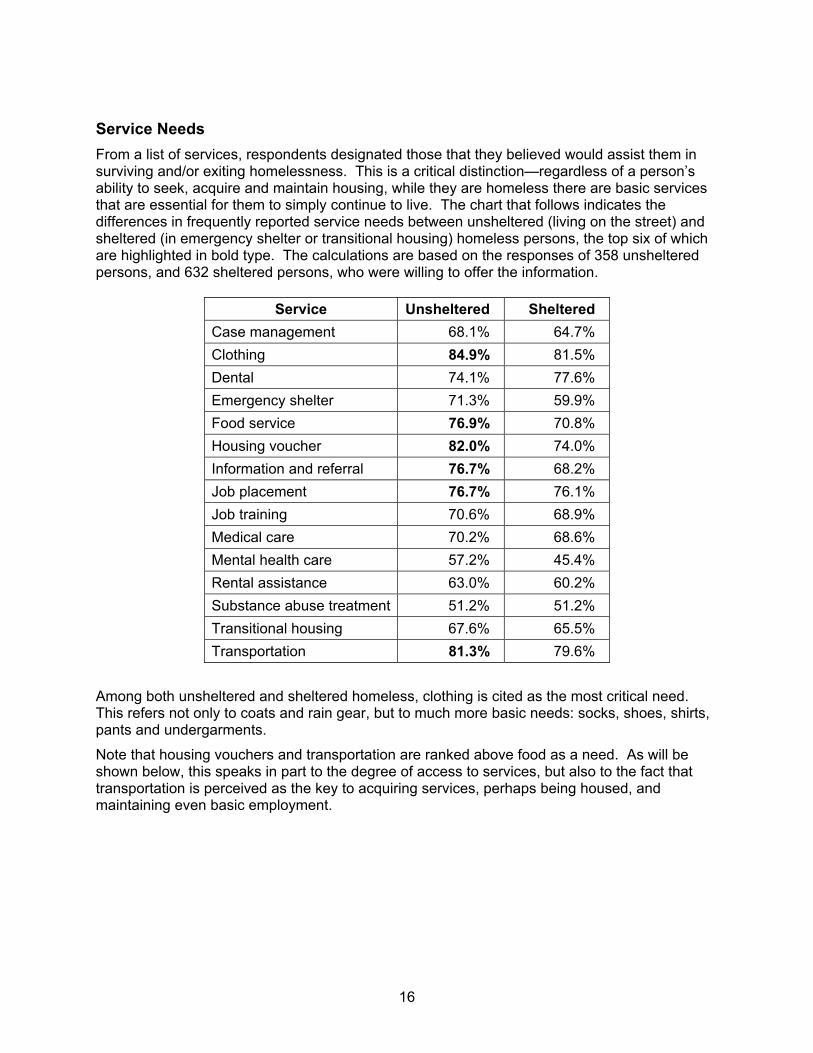
16
Service Needs From a list of services, respondents designated those that they believed would assist them in surviving and/or exiting homelessness. This is a critical distinction—regardless of a person’s ability to seek, acquire and maintain housing, while they are homeless there are basic services that are essential for them to simply continue to live. The chart that follows indicates the differences in frequently reported service needs between unsheltered (living on the street) and sheltered (in emergency shelter or transitional housing) homeless persons, the top six of which are highlighted in bold type. The calculations are based on the responses of 358 unsheltered persons, and 632 sheltered persons, who were willing to offer the information.
Service Unsheltered Sheltered Case management 68.1% 64.7% Clothing 84.9% 81.5% Dental 74.1% 77.6% Emergency shelter 71.3% 59.9% Food service 76.9% 70.8% Housing voucher 82.0% 74.0% Information and referral 76.7% 68.2% Job placement 76.7% 76.1% Job training 70.6% 68.9% Medical care 70.2% 68.6% Mental health care 57.2% 45.4% Rental assistance 63.0% 60.2% Substance abuse treatment 51.2% 51.2% Transitional housing 67.6% 65.5% Transportation 81.3% 79.6%
Among both unsheltered and sheltered homeless, clothing is cited as the most critical need. This refers not only to coats and rain gear, but to much more basic needs: socks, shoes, shirts, pants and undergarments.
Note that housing vouchers and transportation are ranked above food as a need. As will be shown below, this speaks in part to the degree of access to services, but also to the fact that transportation is perceived as the key to acquiring services, perhaps being housed, and maintaining even basic employment.
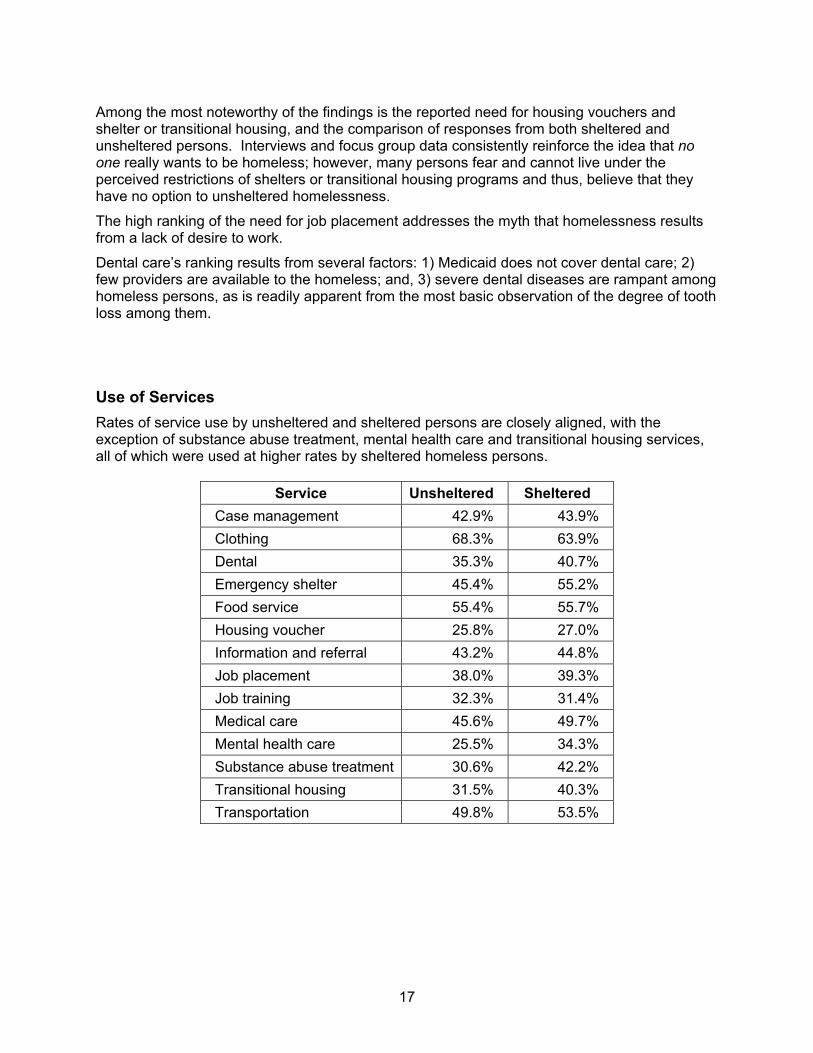
17
Among the most noteworthy of the findings is the reported need for housing vouchers and shelter or transitional housing, and the comparison of responses from both sheltered and unsheltered persons. Interviews and focus group data consistently reinforce the idea that no one really wants to be homeless; however, many persons fear and cannot live under the perceived restrictions of shelters or transitional housing programs and thus, believe that they have no option to unsheltered homelessness.
The high ranking of the need for job placement addresses the myth that homelessness results from a lack of desire to work.
Dental care’s ranking results from several factors: 1) Medicaid does not cover dental care; 2) few providers are available to the homeless; and, 3) severe dental diseases are rampant among homeless persons, as is readily apparent from the most basic observation of the degree of tooth loss among them.
Use of Services Rates of service use by unsheltered and sheltered persons are closely aligned, with the exception of substance abuse treatment, mental health care and transitional housing services, all of which were used at higher rates by sheltered homeless persons.
Service Unsheltered Sheltered Case management 42.9% 43.9% Clothing 68.3% 63.9% Dental 35.3% 40.7% Emergency shelter 45.4% 55.2% Food service 55.4% 55.7% Housing voucher 25.8% 27.0% Information and referral 43.2% 44.8% Job placement 38.0% 39.3% Job training 32.3% 31.4% Medical care 45.6% 49.7% Mental health care 25.5% 34.3% Substance abuse treatment 30.6% 42.2% Transitional housing 31.5% 40.3% Transportation 49.8% 53.5%
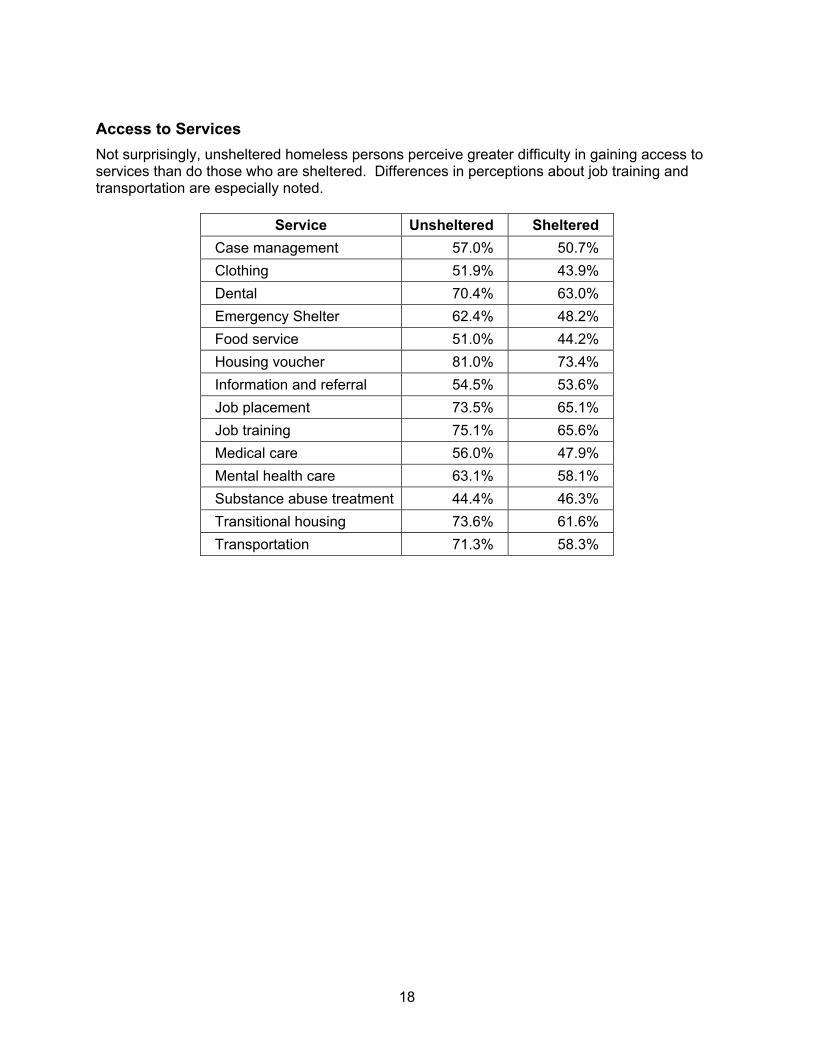
18
Access to Services Not surprisingly, unsheltered homeless persons perceive greater difficulty in gaining access to services than do those who are sheltered. Differences in perceptions about job training and transportation are especially noted.
Service Unsheltered Sheltered Case management 57.0% 50.7% Clothing 51.9% 43.9% Dental 70.4% 63.0% Emergency Shelter 62.4% 48.2% Food service 51.0% 44.2% Housing voucher 81.0% 73.4% Information and referral 54.5% 53.6% Job placement 73.5% 65.1% Job training 75.1% 65.6% Medical care 56.0% 47.9% Mental health care 63.1% 58.1% Substance abuse treatment 44.4% 46.3% Transitional housing 73.6% 61.6% Transportation 71.3% 58.3%
19
PROFILES OF SPECIFIC SUB-POPULATIONS
Introduction
There is no such entity as, ‘the homeless.’ Rather, there are individuals and families in particular situations that have resulted in the loss of secure housing. The difference between an assumption that homeless persons are an undifferentiated group, and one that considers individual circumstances, may well be the difference between a relatively quick rebuilding of a life and falling into chronic homelessness. Certainly there are similarities in the situations that cause a person to become homeless, but a major challenge faced by providers of services and homeless clients themselves is the stereotyping of those who live in poverty in general, and those who are homeless, specifically.
Homeless persons are assigned a wide variety of attributes—from laziness, criminality or sociopathy to victimization, helplessness or incompetence—that often have absolutely nothing to do with the reality of their lives. Rather, in listening to homeless persons tell their stories, it becomes clear that there is as much diversity of character and circumstance among those who are homeless as there is among those who are housed.
The realities of service planning and provision, however, require some aggregating of persons into categories based on an identifying characteristic. In that context, this section discusses specific sub-populations, mostly based on HUD categories that segment persons as:
1. Chronically homeless 2. Severely mental illness 3. Substance abusing 4. Veterans 5. Victims of domestic violence 6. Diagnosed with HIV/AIDS 7. Youth
This study also addresses the services needs of homeless persons who have been incarcerated and, marginally housed individuals who are at risk of becoming homeless. It is important to realize that the findings are an aggregation of information that individual respondents offered about their lives. While hopefully useful in planning, the relevance of these findings to an individual client, or even group of clients, depends on their personal realities.
Another unfortunate consequence of categorizing clients is that public funding of services can be threatened. With diminishing allocations comes increased competition. Client sub-populations are ranked and prioritized, generating the notion that one group of persons is more or less worthy of assistance than another. It is not the intent of this study to add credence to any such discussion, but rather to offer insight into what services may be most effective in addressing the factors that inhibit clients from achieving a quality of life that includes stable, secure permanent housing.
20
Summary findings
Several findings are consistent through each of the groups: Basic needs—shelter, food, clothing and transportation—are ranked highest in
importance Housing vouchers are ranked higher as a need than either emergency shelter or
transitional housing Dental care is an unmet need and access is perceived as difficult Perceptions about difficulty of access to medical care depend on the client group Job placement and job training are among the most highly ranked needs, with use and
perceptions about access varying among groups
How to use the tables and charts
Each of the sub-populations is defined using both the HUD definition and, when different, the specific definition used in this study. The number and proportion of the study represented by each sub-group is presented, as well as an estimate of the number within the population of 12,000 homeless persons.
For each sub-population, their housing status and demographic data, as well as service needs, rates of use and perception of degree of difficulty in obtaining a given service, are presented as tables. Each table includes both the number of persons who responded to an item and the corresponding percentage. In the tables that illustrate service status, the percentages correspond to the following:
1. Need: percentage of respondents who indicated that they needed a given service 2. Use: percentage of respondents who indicated that they used a service at least once 3. Difficult Access: percentage of respondents who indicated that a service was “difficult” or
“very difficult” to obtain
Quotes were taken from focus groups and street interviews.
Note: Additional data is available for these sub-populations, and topical reports can be developed. To request these reports, please contact the study authors.
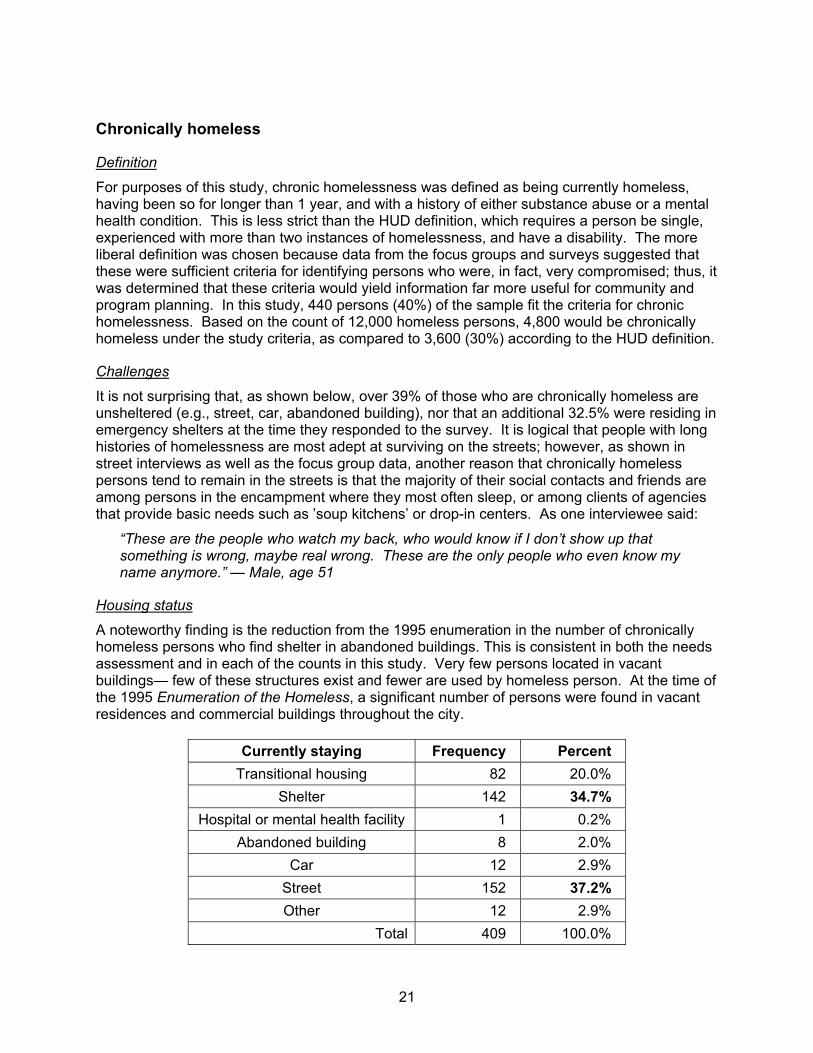
21
Chronically homeless
Definition
For purposes of this study, chronic homelessness was defined as being currently homeless, having been so for longer than 1 year, and with a history of either substance abuse or a mental health condition. This is less strict than the HUD definition, which requires a person be single, experienced with more than two instances of homelessness, and have a disability. The more liberal definition was chosen because data from the focus groups and surveys suggested that these were sufficient criteria for identifying persons who were, in fact, very compromised; thus, it was determined that these criteria would yield information far more useful for community and program planning. In this study, 440 persons (40%) of the sample fit the criteria for chronic homelessness. Based on the count of 12,000 homeless persons, 4,800 would be chronically homeless under the study criteria, as compared to 3,600 (30%) according to the HUD definition.
Challenges
It is not surprising that, as shown below, over 39% of those who are chronically homeless are unsheltered (e.g., street, car, abandoned building), nor that an additional 32.5% were residing in emergency shelters at the time they responded to the survey. It is logical that people with long histories of homelessness are most adept at surviving on the streets; however, as shown in street interviews as well as the focus group data, another reason that chronically homeless persons tend to remain in the streets is that the majority of their social contacts and friends are among persons in the encampment where they most often sleep, or among clients of agencies that provide basic needs such as ’soup kitchens’ or drop-in centers. As one interviewee said:
“These are the people who watch my back, who would know if I don’t show up that something is wrong, maybe real wrong. These are the only people who even know my name anymore.” — Male, age 51
Housing status
A noteworthy finding is the reduction from the 1995 enumeration in the number of chronically homeless persons who find shelter in abandoned buildings. This is consistent in both the needs assessment and in each of the counts in this study. Very few persons located in vacant buildings— few of these structures exist and fewer are used by homeless person. At the time of the 1995 Enumeration of the Homeless, a significant number of persons were found in vacant residences and commercial buildings throughout the city.
Currently staying Frequency Percent Transitional housing 82 20.0%
Shelter 142 34.7% Hospital or mental health facility 1 0.2%
Abandoned building 8 2.0% Car 12 2.9%
Street 152 37.2% Other 12 2.9%
Total 409 100.0%
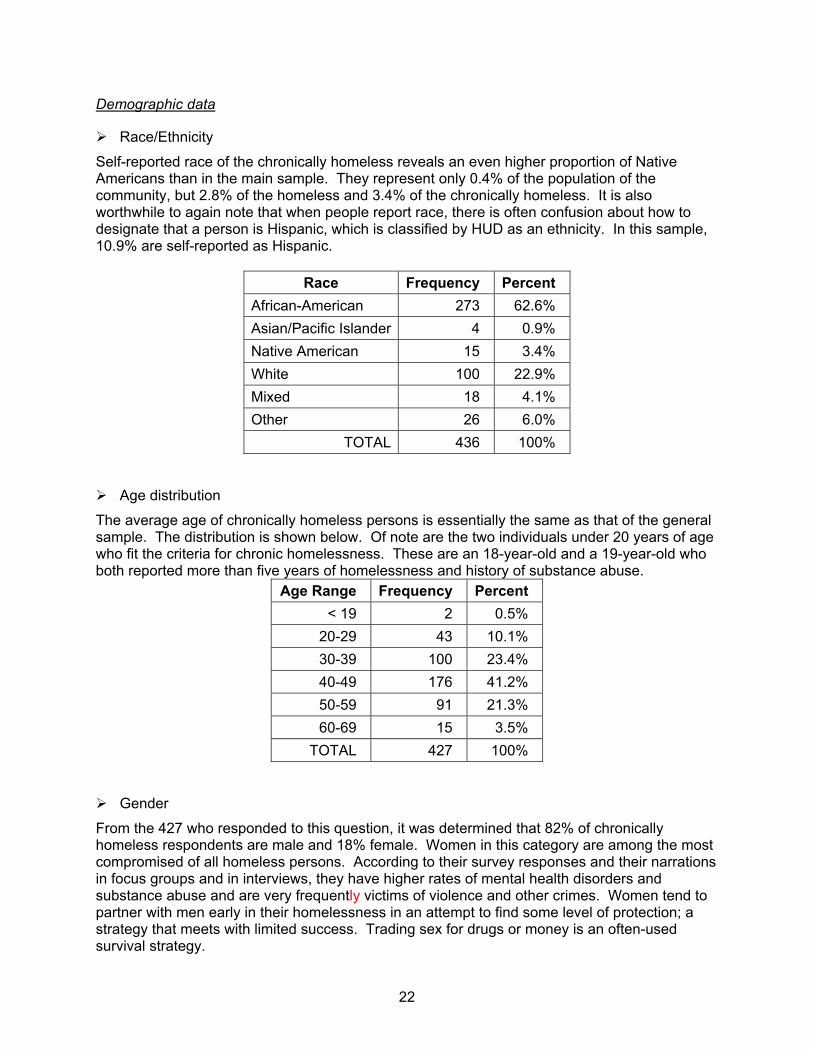
22
Demographic data
Race/Ethnicity
Self-reported race of the chronically homeless reveals an even higher proportion of Native Americans than in the main sample. They represent only 0.4% of the population of the community, but 2.8% of the homeless and 3.4% of the chronically homeless. It is also worthwhile to again note that when people report race, there is often confusion about how to designate that a person is Hispanic, which is classified by HUD as an ethnicity. In this sample, 10.9% are self-reported as Hispanic.
Race Frequency Percent African-American 273 62.6% Asian/Pacific Islander 4 0.9% Native American 15 3.4% White 100 22.9% Mixed 18 4.1% Other 26 6.0%
TOTAL 436 100%
Age distribution
The average age of chronically homeless persons is essentially the same as that of the general sample. The distribution is shown below. Of note are the two individuals under 20 years of age who fit the criteria for chronic homelessness. These are an 18-year-old and a 19-year-old who both reported more than five years of homelessness and history of substance abuse.
Age Range Frequency Percent < 19 2 0.5%
20-29 43 10.1% 30-39 100 23.4% 40-49 176 41.2% 50-59 91 21.3% 60-69 15 3.5%
TOTAL 427 100%
Gender
From the 427 who responded to this question, it was determined that 82% of chronically homeless respondents are male and 18% female. Women in this category are among the most compromised of all homeless persons. According to their survey responses and their narrations in focus groups and in interviews, they have higher rates of mental health disorders and substance abuse and are very frequently victims of violence and other crimes. Women tend to partner with men early in their homelessness in an attempt to find some level of protection; a strategy that meets with limited success. Trading sex for drugs or money is an often-used survival strategy.
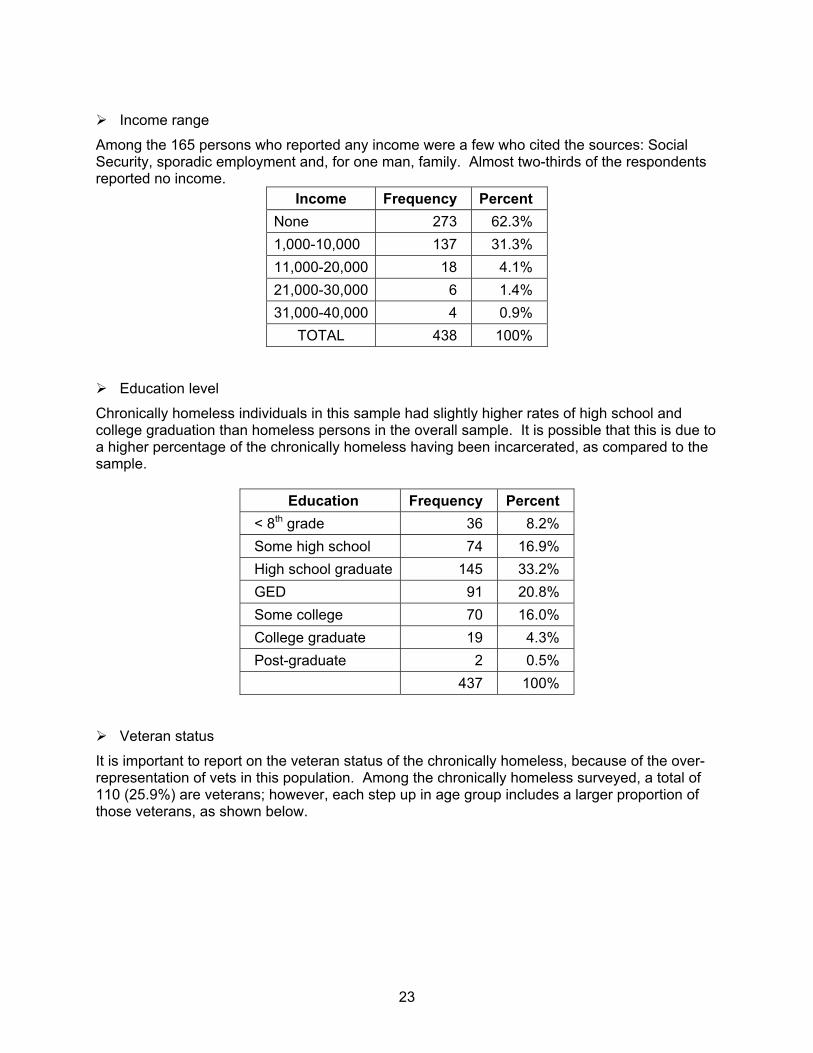
23
Income range
Among the 165 persons who reported any income were a few who cited the sources: Social Security, sporadic employment and, for one man, family. Almost two-thirds of the respondents reported no income.
Income Frequency Percent None 273 62.3% 1,000-10,000 137 31.3% 11,000-20,000 18 4.1% 21,000-30,000 6 1.4% 31,000-40,000 4 0.9%
TOTAL 438 100%
Education level
Chronically homeless individuals in this sample had slightly higher rates of high school and college graduation than homeless persons in the overall sample. It is possible that this is due to a higher percentage of the chronically homeless having been incarcerated, as compared to the sample.
Education Frequency Percent < 8th grade 36 8.2% Some high school 74 16.9% High school graduate 145 33.2% GED 91 20.8% Some college 70 16.0% College graduate 19 4.3% Post-graduate 2 0.5% 437 100%
Veteran status
It is important to report on the veteran status of the chronically homeless, because of the over-representation of vets in this population. Among the chronically homeless surveyed, a total of 110 (25.9%) are veterans; however, each step up in age group includes a larger proportion of those veterans, as shown below.
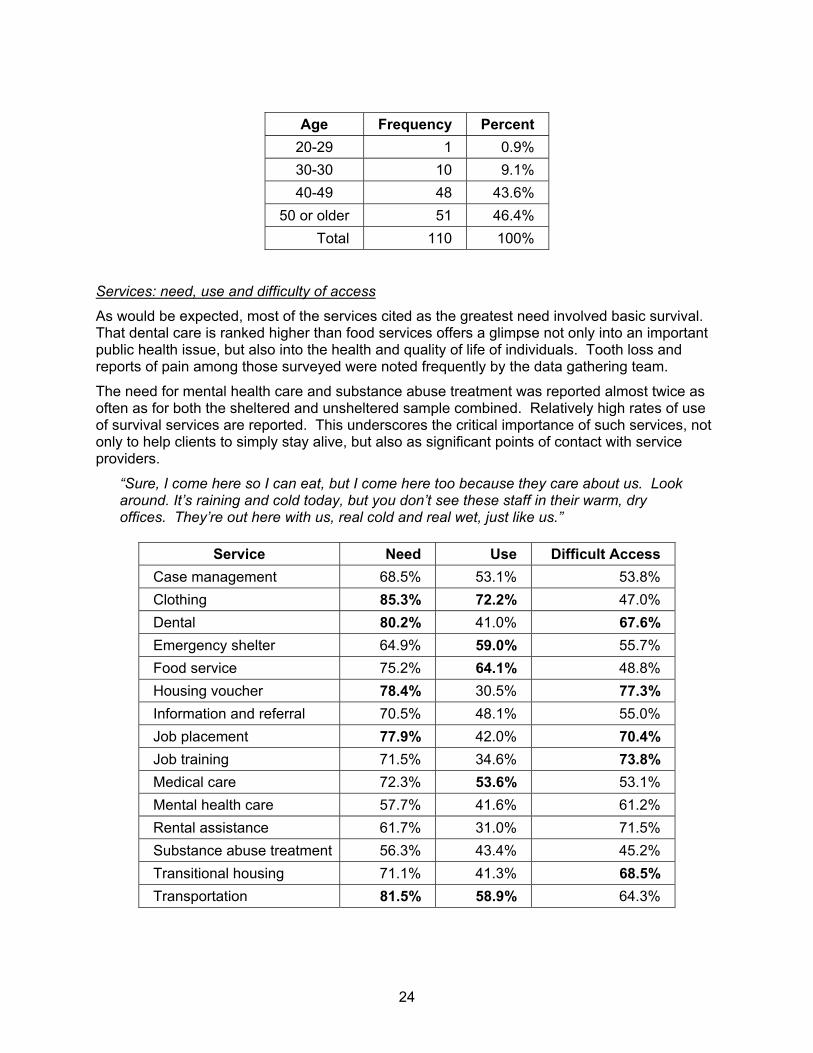
24
Age Frequency Percent
20-29 1 0.9% 30-30 10 9.1% 40-49 48 43.6%
50 or older 51 46.4% Total 110 100%
Services: need, use and difficulty of access
As would be expected, most of the services cited as the greatest need involved basic survival. That dental care is ranked higher than food services offers a glimpse not only into an important public health issue, but also into the health and quality of life of individuals. Tooth loss and reports of pain among those surveyed were noted frequently by the data gathering team.
The need for mental health care and substance abuse treatment was reported almost twice as often as for both the sheltered and unsheltered sample combined. Relatively high rates of use of survival services are reported. This underscores the critical importance of such services, not only to help clients to simply stay alive, but also as significant points of contact with service providers.
“Sure, I come here so I can eat, but I come here too because they care about us. Look around. It’s raining and cold today, but you don’t see these staff in their warm, dry offices. They’re out here with us, real cold and real wet, just like us.”
Service Need Use Difficult Access
Case management 68.5% 53.1% 53.8% Clothing 85.3% 72.2% 47.0% Dental 80.2% 41.0% 67.6% Emergency shelter 64.9% 59.0% 55.7% Food service 75.2% 64.1% 48.8% Housing voucher 78.4% 30.5% 77.3% Information and referral 70.5% 48.1% 55.0% Job placement 77.9% 42.0% 70.4% Job training 71.5% 34.6% 73.8% Medical care 72.3% 53.6% 53.1% Mental health care 57.7% 41.6% 61.2% Rental assistance 61.7% 31.0% 71.5% Substance abuse treatment 56.3% 43.4% 45.2% Transitional housing 71.1% 41.3% 68.5% Transportation 81.5% 58.9% 64.3%
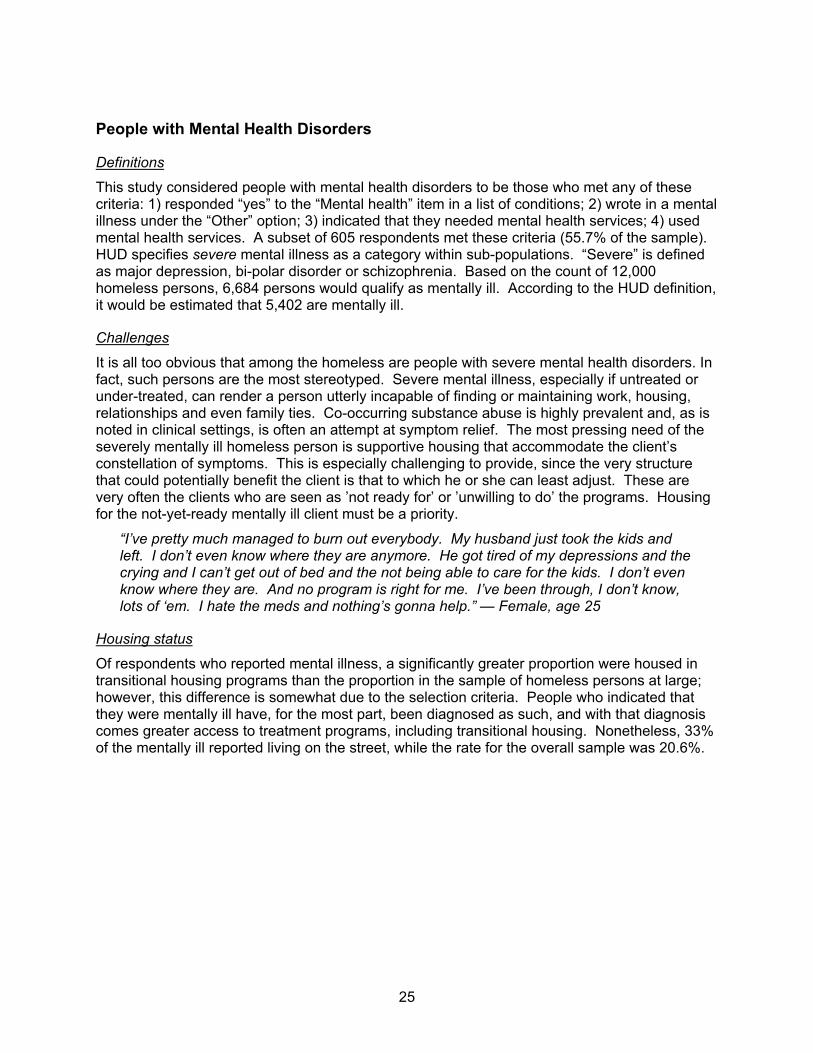
25
People with Mental Health Disorders
Definitions
This study considered people with mental health disorders to be those who met any of these criteria: 1) responded “yes” to the “Mental health” item in a list of conditions; 2) wrote in a mental illness under the “Other” option; 3) indicated that they needed mental health services; 4) used mental health services. A subset of 605 respondents met these criteria (55.7% of the sample). HUD specifies severe mental illness as a category within sub-populations. “Severe” is defined as major depression, bi-polar disorder or schizophrenia. Based on the count of 12,000 homeless persons, 6,684 persons would qualify as mentally ill. According to the HUD definition, it would be estimated that 5,402 are mentally ill.
Challenges
It is all too obvious that among the homeless are people with severe mental health disorders. In fact, such persons are the most stereotyped. Severe mental illness, especially if untreated or under-treated, can render a person utterly incapable of finding or maintaining work, housing, relationships and even family ties. Co-occurring substance abuse is highly prevalent and, as is noted in clinical settings, is often an attempt at symptom relief. The most pressing need of the severely mentally ill homeless person is supportive housing that accommodate the client’s constellation of symptoms. This is especially challenging to provide, since the very structure that could potentially benefit the client is that to which he or she can least adjust. These are very often the clients who are seen as ’not ready for’ or ’unwilling to do’ the programs. Housing for the not-yet-ready mentally ill client must be a priority.
“I’ve pretty much managed to burn out everybody. My husband just took the kids and left. I don’t even know where they are anymore. He got tired of my depressions and the crying and I can’t get out of bed and the not being able to care for the kids. I don’t even know where they are. And no program is right for me. I’ve been through, I don’t know, lots of ‘em. I hate the meds and nothing’s gonna help.” — Female, age 25
Housing status
Of respondents who reported mental illness, a significantly greater proportion were housed in transitional housing programs than the proportion in the sample of homeless persons at large; however, this difference is somewhat due to the selection criteria. People who indicated that they were mentally ill have, for the most part, been diagnosed as such, and with that diagnosis comes greater access to treatment programs, including transitional housing. Nonetheless, 33% of the mentally ill reported living on the street, while the rate for the overall sample was 20.6%.
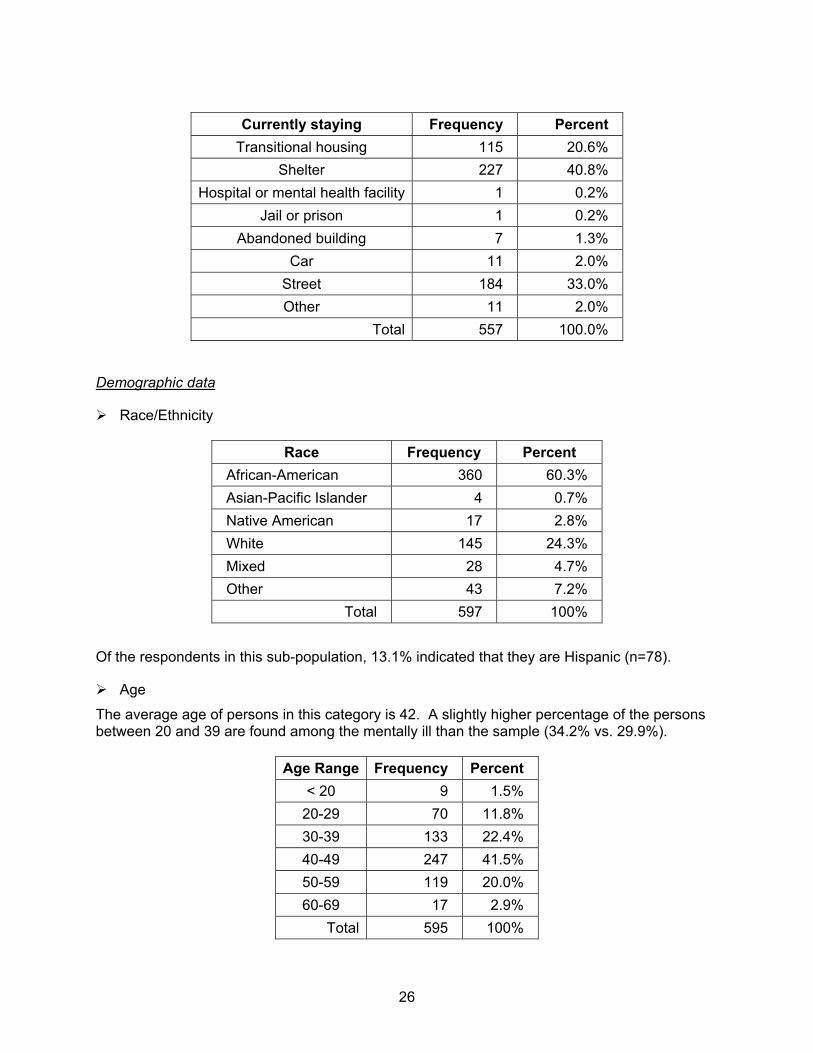
26
Currently staying Frequency Percent
Transitional housing 115 20.6% Shelter 227 40.8%
Hospital or mental health facility 1 0.2% Jail or prison 1 0.2%
Abandoned building 7 1.3% Car 11 2.0%
Street 184 33.0% Other 11 2.0%
Total 557 100.0%
Demographic data
Race/Ethnicity
Race Frequency Percent African-American 360 60.3% Asian-Pacific Islander 4 0.7% Native American 17 2.8% White 145 24.3% Mixed 28 4.7% Other 43 7.2%
Total 597 100%
Of the respondents in this sub-population, 13.1% indicated that they are Hispanic (n=78).
Age
The average age of persons in this category is 42. A slightly higher percentage of the persons between 20 and 39 are found among the mentally ill than the sample (34.2% vs. 29.9%).
Age Range Frequency Percent < 20 9 1.5%
20-29 70 11.8% 30-39 133 22.4% 40-49 247 41.5% 50-59 119 20.0% 60-69 17 2.9%
Total 595 100%
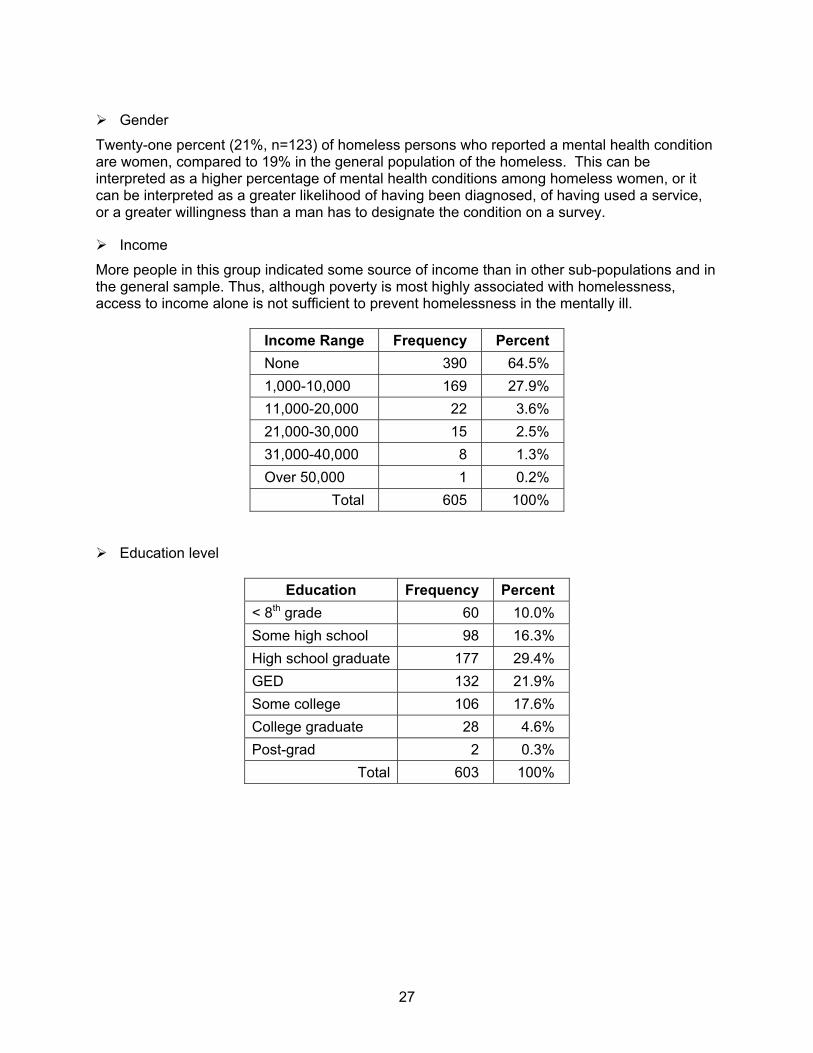
27
Gender
Twenty-one percent (21%, n=123) of homeless persons who reported a mental health condition are women, compared to 19% in the general population of the homeless. This can be interpreted as a higher percentage of mental health conditions among homeless women, or it can be interpreted as a greater likelihood of having been diagnosed, of having used a service, or a greater willingness than a man has to designate the condition on a survey.
Income
More people in this group indicated some source of income than in other sub-populations and in the general sample. Thus, although poverty is most highly associated with homelessness, access to income alone is not sufficient to prevent homelessness in the mentally ill.
Income Range Frequency Percent None 390 64.5% 1,000-10,000 169 27.9% 11,000-20,000 22 3.6% 21,000-30,000 15 2.5% 31,000-40,000 8 1.3% Over 50,000 1 0.2%
Total 605 100%
Education level
Education Frequency Percent < 8th grade 60 10.0% Some high school 98 16.3% High school graduate 177 29.4% GED 132 21.9% Some college 106 17.6% College graduate 28 4.6% Post-grad 2 0.3%
Total 603 100%
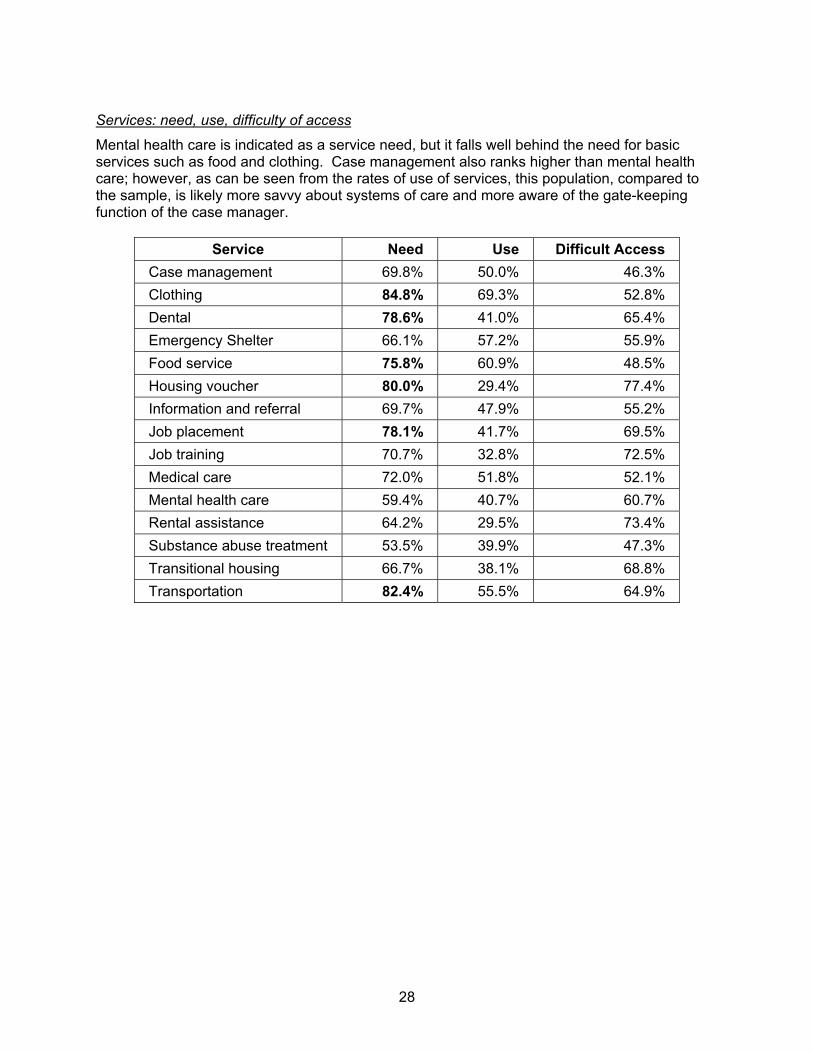
28
Services: need, use, difficulty of access
Mental health care is indicated as a service need, but it falls well behind the need for basic services such as food and clothing. Case management also ranks higher than mental health care; however, as can be seen from the rates of use of services, this population, compared to the sample, is likely more savvy about systems of care and more aware of the gate-keeping function of the case manager.
Service Need Use Difficult Access Case management 69.8% 50.0% 46.3% Clothing 84.8% 69.3% 52.8% Dental 78.6% 41.0% 65.4% Emergency Shelter 66.1% 57.2% 55.9% Food service 75.8% 60.9% 48.5% Housing voucher 80.0% 29.4% 77.4% Information and referral 69.7% 47.9% 55.2% Job placement 78.1% 41.7% 69.5% Job training 70.7% 32.8% 72.5% Medical care 72.0% 51.8% 52.1% Mental health care 59.4% 40.7% 60.7% Rental assistance 64.2% 29.5% 73.4% Substance abuse treatment 53.5% 39.9% 47.3% Transitional housing 66.7% 38.1% 68.8% Transportation 82.4% 55.5% 64.9%
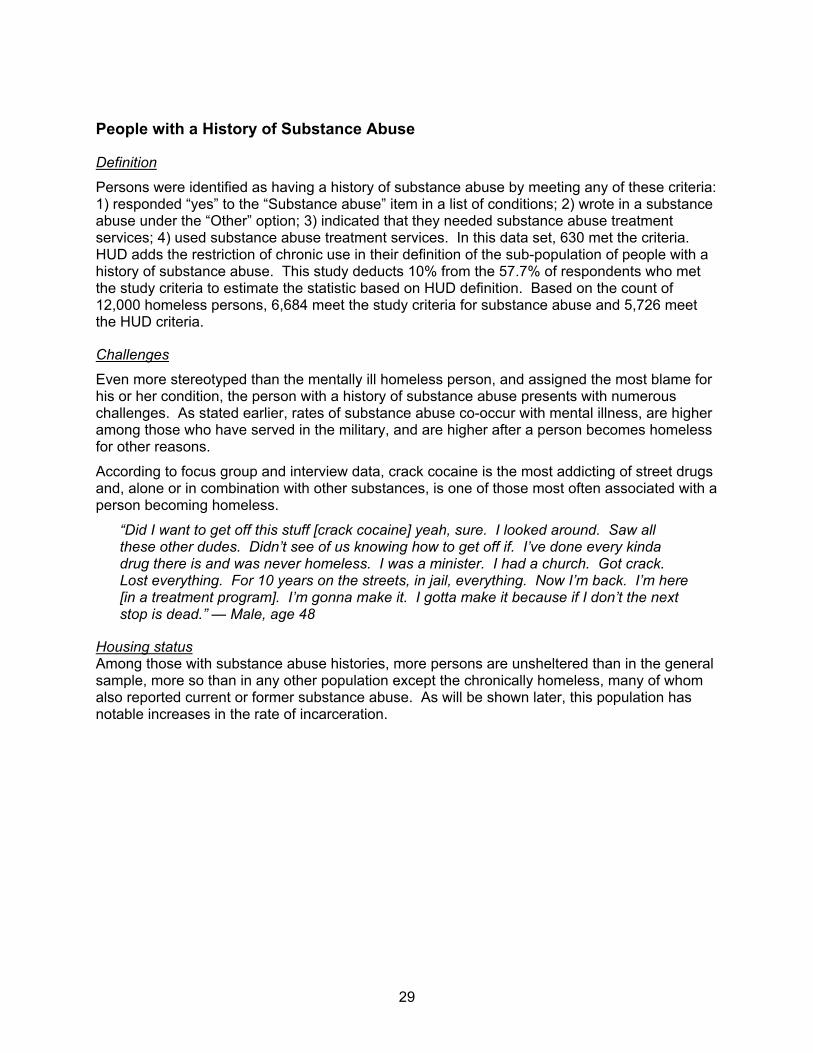
29
People with a History of Substance Abuse
Definition
Persons were identified as having a history of substance abuse by meeting any of these criteria: 1) responded “yes” to the “Substance abuse” item in a list of conditions; 2) wrote in a substance abuse under the “Other” option; 3) indicated that they needed substance abuse treatment services; 4) used substance abuse treatment services. In this data set, 630 met the criteria. HUD adds the restriction of chronic use in their definition of the sub-population of people with a history of substance abuse. This study deducts 10% from the 57.7% of respondents who met the study criteria to estimate the statistic based on HUD definition. Based on the count of 12,000 homeless persons, 6,684 meet the study criteria for substance abuse and 5,726 meet the HUD criteria.
Challenges
Even more stereotyped than the mentally ill homeless person, and assigned the most blame for his or her condition, the person with a history of substance abuse presents with numerous challenges. As stated earlier, rates of substance abuse co-occur with mental illness, are higher among those who have served in the military, and are higher after a person becomes homeless for other reasons.
According to focus group and interview data, crack cocaine is the most addicting of street drugs and, alone or in combination with other substances, is one of those most often associated with a person becoming homeless.
“Did I want to get off this stuff [crack cocaine] yeah, sure. I looked around. Saw all these other dudes. Didn’t see of us knowing how to get off if. I’ve done every kinda drug there is and was never homeless. I was a minister. I had a church. Got crack. Lost everything. For 10 years on the streets, in jail, everything. Now I’m back. I’m here [in a treatment program]. I’m gonna make it. I gotta make it because if I don’t the next stop is dead.” — Male, age 48
Housing status Among those with substance abuse histories, more persons are unsheltered than in the general sample, more so than in any other population except the chronically homeless, many of whom also reported current or former substance abuse. As will be shown later, this population has notable increases in the rate of incarceration.
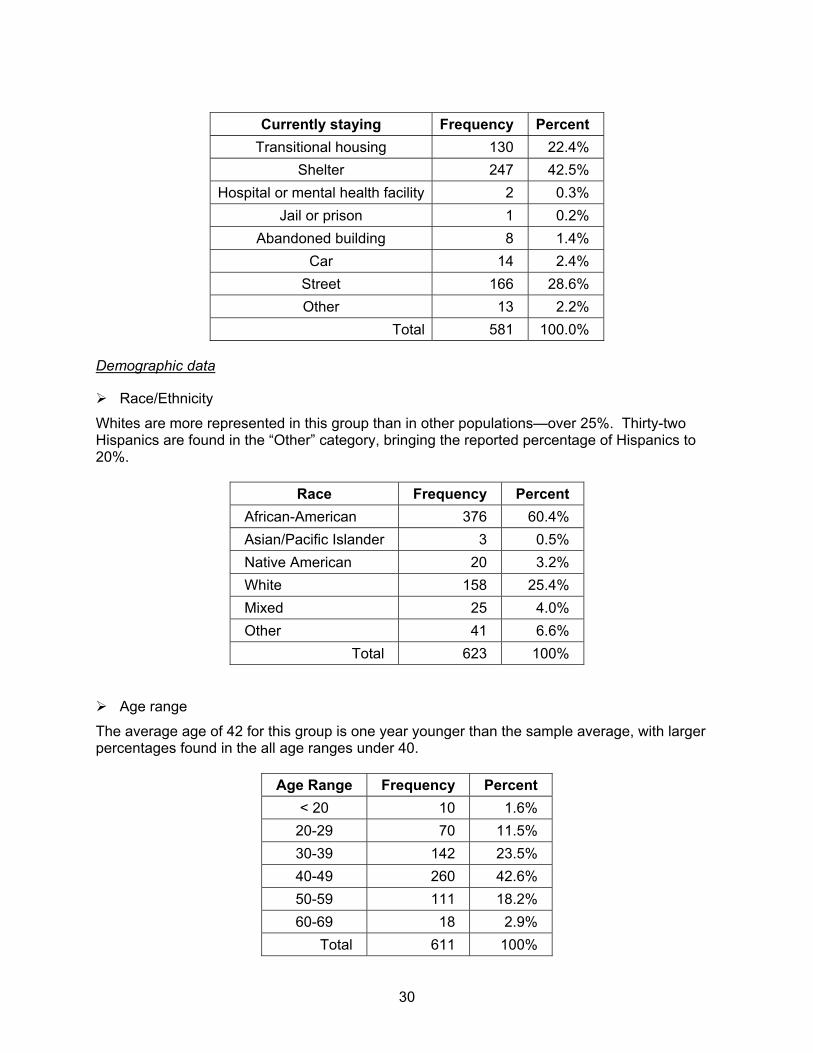
30
Currently staying Frequency Percent
Transitional housing 130 22.4% Shelter 247 42.5%
Hospital or mental health facility 2 0.3% Jail or prison 1 0.2%
Abandoned building 8 1.4% Car 14 2.4%
Street 166 28.6% Other 13 2.2%
Total 581 100.0%
Demographic data
Race/Ethnicity
Whites are more represented in this group than in other populations—over 25%. Thirty-two Hispanics are found in the “Other” category, bringing the reported percentage of Hispanics to 20%.
Race Frequency Percent African-American 376 60.4% Asian/Pacific Islander 3 0.5% Native American 20 3.2% White 158 25.4% Mixed 25 4.0% Other 41 6.6%
Total 623 100%
Age range
The average age of 42 for this group is one year younger than the sample average, with larger percentages found in the all age ranges under 40.
Age Range Frequency Percent < 20 10 1.6%
20-29 70 11.5% 30-39 142 23.5% 40-49 260 42.6% 50-59 111 18.2% 60-69 18 2.9%
Total 611 100%
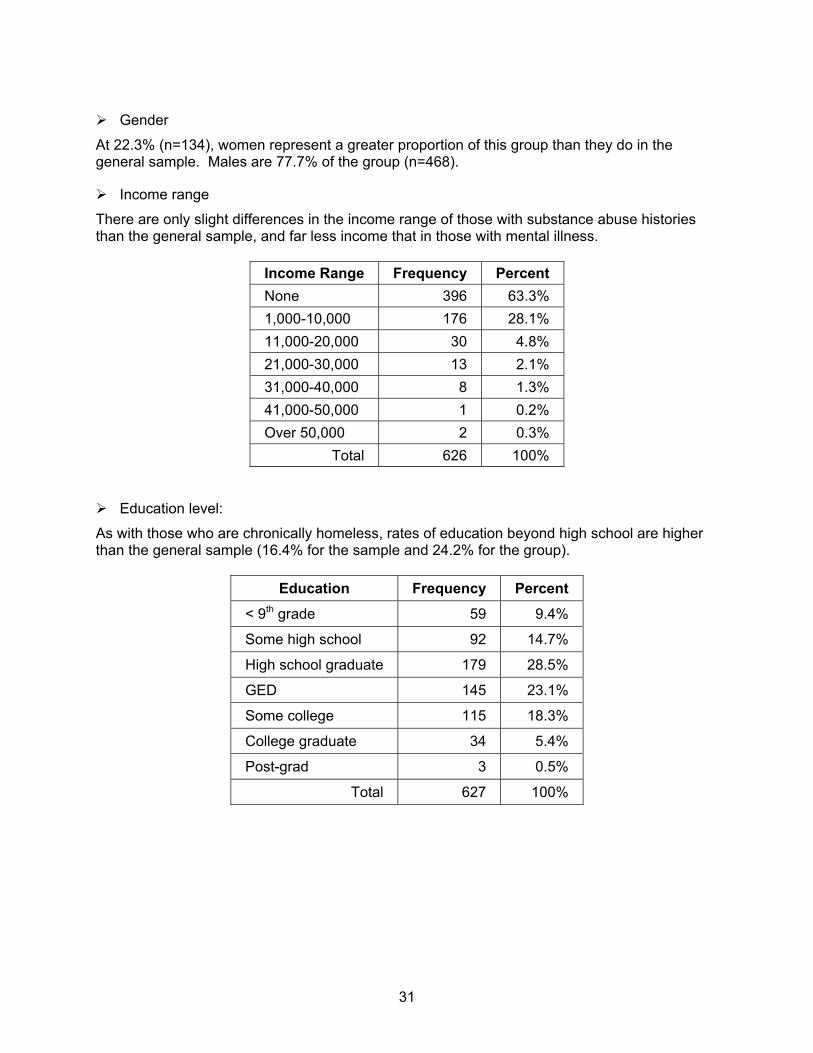
31
Gender
At 22.3% (n=134), women represent a greater proportion of this group than they do in the general sample. Males are 77.7% of the group (n=468).
Income range
There are only slight differences in the income range of those with substance abuse histories than the general sample, and far less income that in those with mental illness.
Income Range Frequency Percent None 396 63.3% 1,000-10,000 176 28.1% 11,000-20,000 30 4.8% 21,000-30,000 13 2.1% 31,000-40,000 8 1.3% 41,000-50,000 1 0.2% Over 50,000 2 0.3%
Total 626 100%
Education level:
As with those who are chronically homeless, rates of education beyond high school are higher than the general sample (16.4% for the sample and 24.2% for the group).
Education Frequency Percent
< 9th grade 59 9.4%
Some high school 92 14.7%
High school graduate 179 28.5%
GED 145 23.1%
Some college 115 18.3%
College graduate 34 5.4%
Post-grad 3 0.5%
Total 627 100%
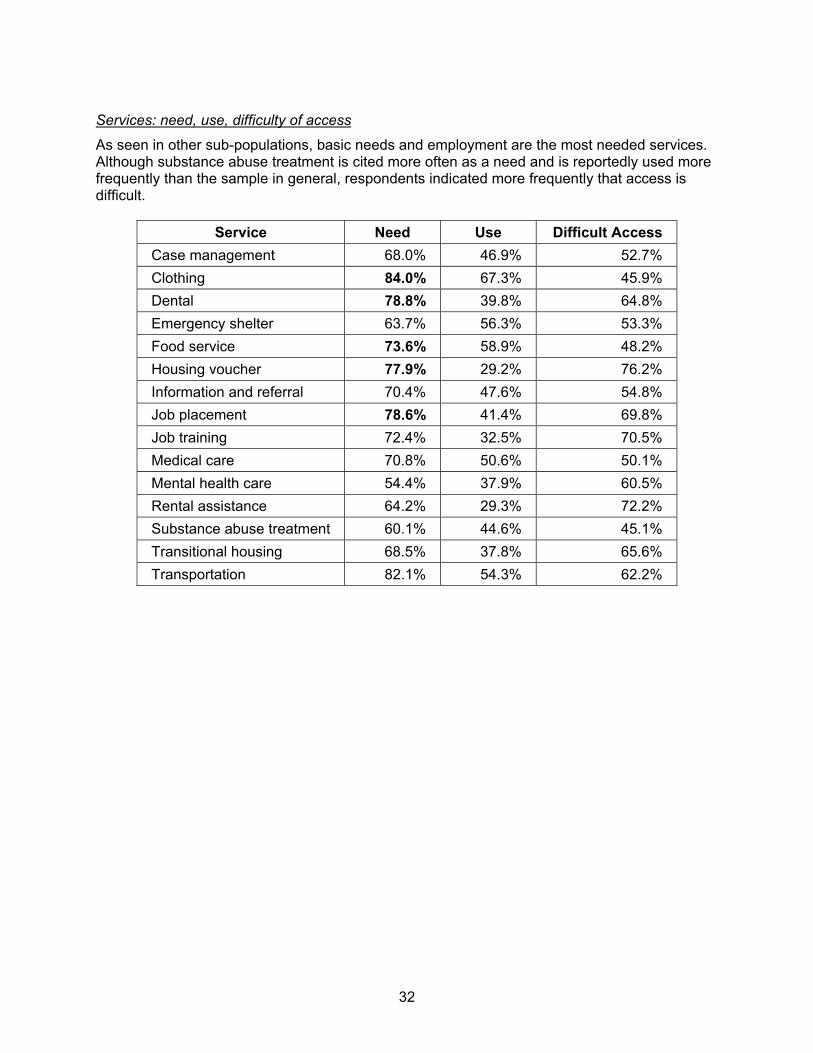
32
Services: need, use, difficulty of access
As seen in other sub-populations, basic needs and employment are the most needed services. Although substance abuse treatment is cited more often as a need and is reportedly used more frequently than the sample in general, respondents indicated more frequently that access is difficult.
Service Need Use Difficult Access Case management 68.0% 46.9% 52.7% Clothing 84.0% 67.3% 45.9% Dental 78.8% 39.8% 64.8% Emergency shelter 63.7% 56.3% 53.3% Food service 73.6% 58.9% 48.2% Housing voucher 77.9% 29.2% 76.2% Information and referral 70.4% 47.6% 54.8% Job placement 78.6% 41.4% 69.8% Job training 72.4% 32.5% 70.5% Medical care 70.8% 50.6% 50.1% Mental health care 54.4% 37.9% 60.5% Rental assistance 64.2% 29.3% 72.2% Substance abuse treatment 60.1% 44.6% 45.1% Transitional housing 68.5% 37.8% 65.6% Transportation 82.1% 54.3% 62.2%
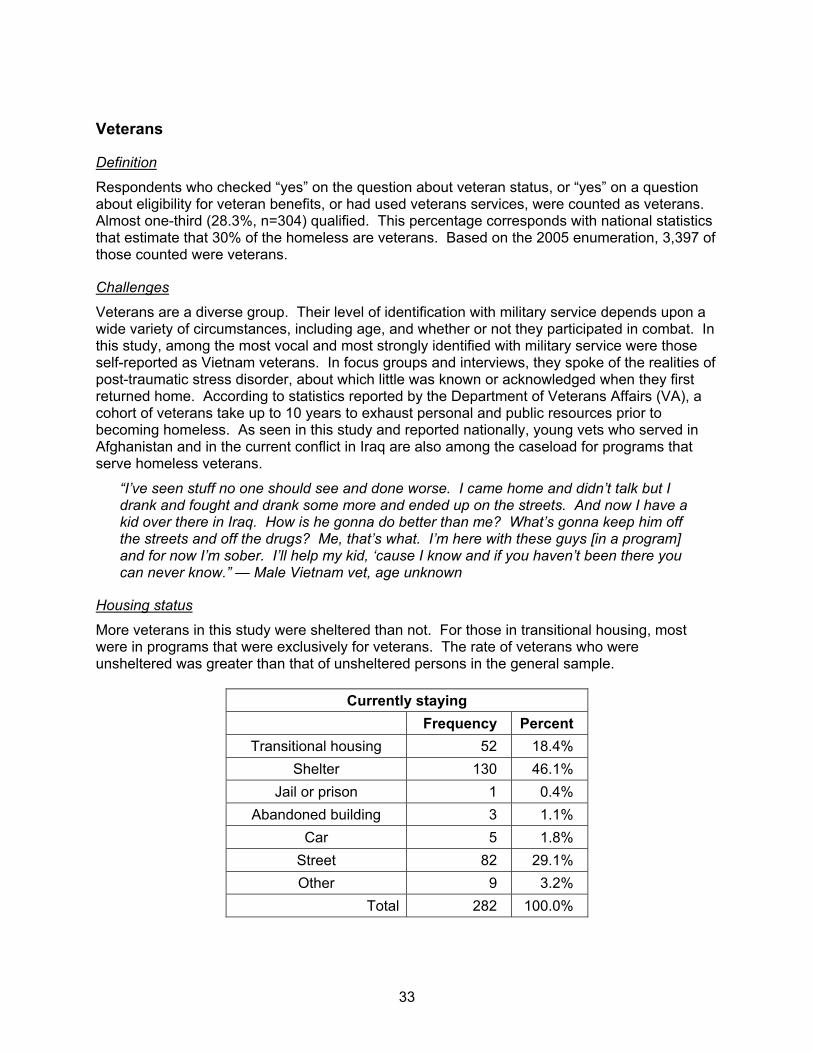
33
Veterans
Definition
Respondents who checked “yes” on the question about veteran status, or “yes” on a question about eligibility for veteran benefits, or had used veterans services, were counted as veterans. Almost one-third (28.3%, n=304) qualified. This percentage corresponds with national statistics that estimate that 30% of the homeless are veterans. Based on the 2005 enumeration, 3,397 of those counted were veterans.
Challenges
Veterans are a diverse group. Their level of identification with military service depends upon a wide variety of circumstances, including age, and whether or not they participated in combat. In this study, among the most vocal and most strongly identified with military service were those self-reported as Vietnam veterans. In focus groups and interviews, they spoke of the realities of post-traumatic stress disorder, about which little was known or acknowledged when they first returned home. According to statistics reported by the Department of Veterans Affairs (VA), a cohort of veterans take up to 10 years to exhaust personal and public resources prior to becoming homeless. As seen in this study and reported nationally, young vets who served in Afghanistan and in the current conflict in Iraq are also among the caseload for programs that serve homeless veterans.
“I’ve seen stuff no one should see and done worse. I came home and didn’t talk but I drank and fought and drank some more and ended up on the streets. And now I have a kid over there in Iraq. How is he gonna do better than me? What’s gonna keep him off the streets and off the drugs? Me, that’s what. I’m here with these guys [in a program] and for now I’m sober. I’ll help my kid, ‘cause I know and if you haven’t been there you can never know.” — Male Vietnam vet, age unknown
Housing status
More veterans in this study were sheltered than not. For those in transitional housing, most were in programs that were exclusively for veterans. The rate of veterans who were unsheltered was greater than that of unsheltered persons in the general sample.
Currently staying Frequency Percent
Transitional housing 52 18.4% Shelter 130 46.1%
Jail or prison 1 0.4% Abandoned building 3 1.1%
Car 5 1.8% Street 82 29.1% Other 9 3.2%
Total 282 100.0%
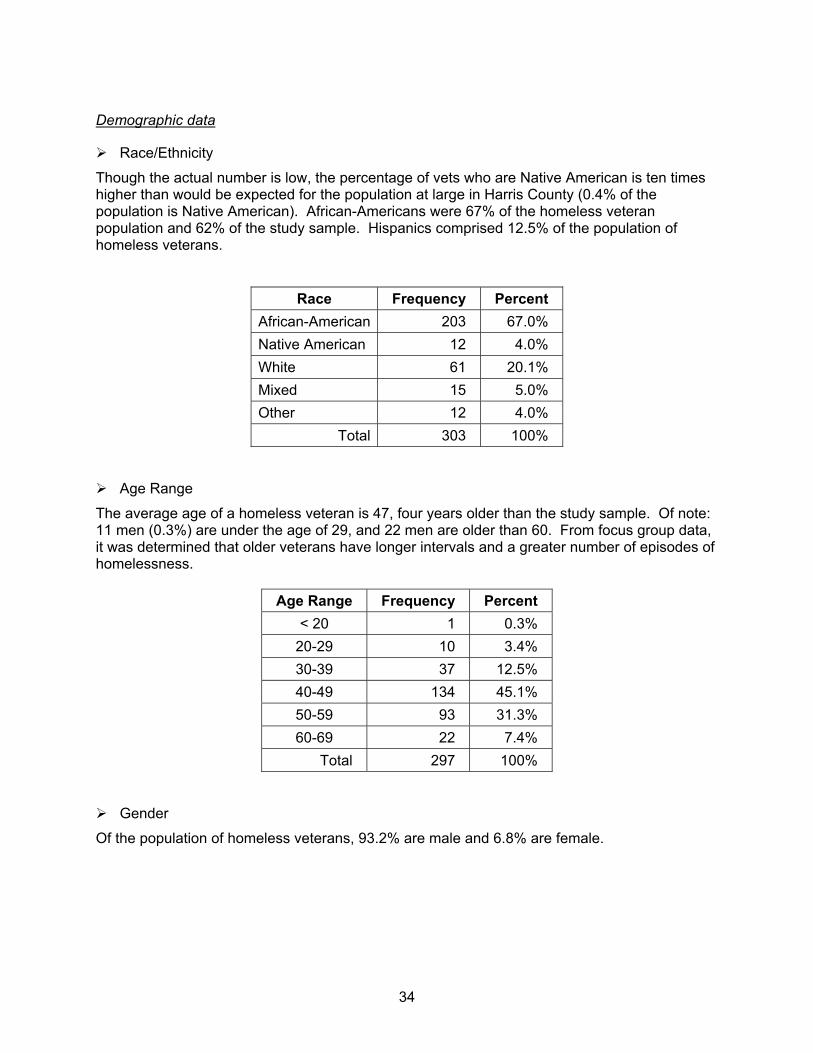
34
Demographic data
Race/Ethnicity
Though the actual number is low, the percentage of vets who are Native American is ten times higher than would be expected for the population at large in Harris County (0.4% of the population is Native American). African-Americans were 67% of the homeless veteran population and 62% of the study sample. Hispanics comprised 12.5% of the population of homeless veterans.
Race Frequency Percent African-American 203 67.0% Native American 12 4.0% White 61 20.1% Mixed 15 5.0% Other 12 4.0%
Total 303 100%
Age Range
The average age of a homeless veteran is 47, four years older than the study sample. Of note: 11 men (0.3%) are under the age of 29, and 22 men are older than 60. From focus group data, it was determined that older veterans have longer intervals and a greater number of episodes of homelessness.
Age Range Frequency Percent < 20 1 0.3%
20-29 10 3.4% 30-39 37 12.5% 40-49 134 45.1% 50-59 93 31.3% 60-69 22 7.4%
Total 297 100%
Gender
Of the population of homeless veterans, 93.2% are male and 6.8% are female.
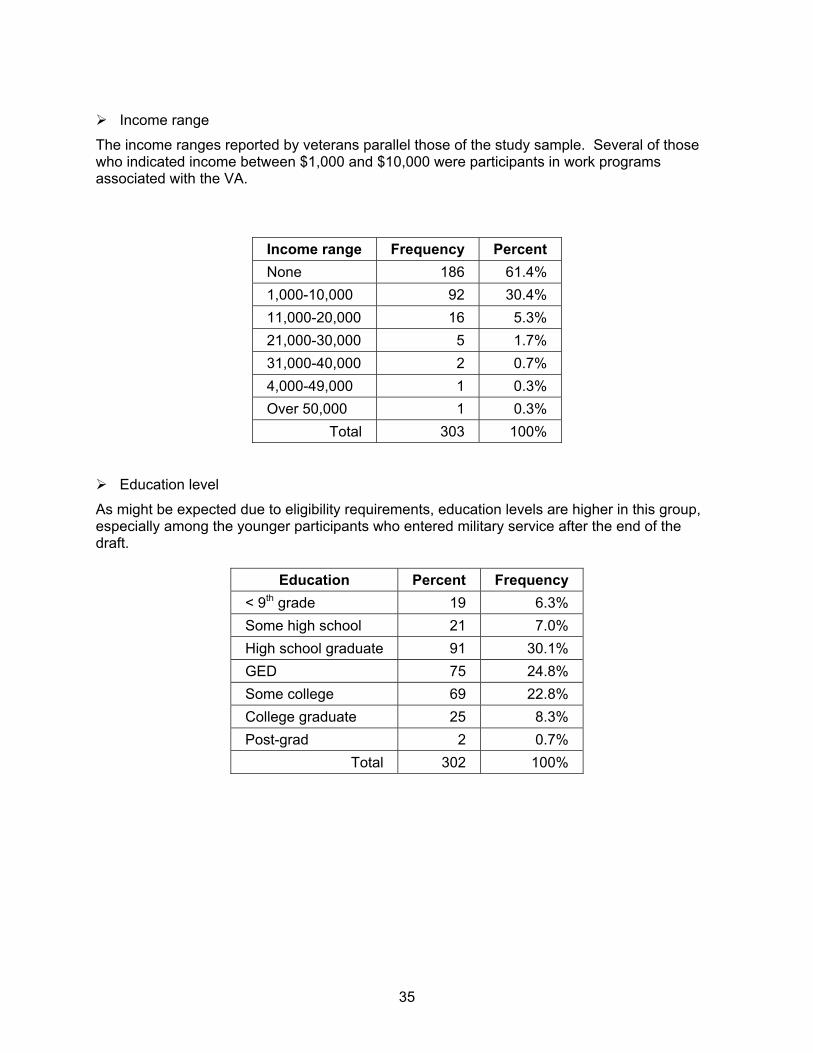
35
Income range
The income ranges reported by veterans parallel those of the study sample. Several of those who indicated income between $1,000 and $10,000 were participants in work programs associated with the VA.
Income range Frequency Percent None 186 61.4% 1,000-10,000 92 30.4% 11,000-20,000 16 5.3% 21,000-30,000 5 1.7% 31,000-40,000 2 0.7% 4,000-49,000 1 0.3% Over 50,000 1 0.3%
Total 303 100%
Education level
As might be expected due to eligibility requirements, education levels are higher in this group, especially among the younger participants who entered military service after the end of the draft.
Education Percent Frequency < 9th grade 19 6.3% Some high school 21 7.0% High school graduate 91 30.1% GED 75 24.8% Some college 69 22.8% College graduate 25 8.3% Post-grad 2 0.7%
Total 302 100%

36
Services: need, use, difficulty of access
As with most other sub-populations, homeless veterans cite basic needs, dental care and job placement services as their top priorities. They rank medical care, mental health care and substance abuse treatment needs higher than other populations, and indicate greater use of these services.
Service Need Use Difficult Access Case management 65.3% 50.0% 51.1% Clothing 83.3% 73.4% 46.6% Dental 74.9% 39.1% 63.6% Emergency shelter 65.7% 62.0% 50.0% Food service 76.0% 63.0% 48.9% Housing voucher 76.9% 32.1% 75.4% Information and referral 71.2% 51.2% 52.8% Job placement 75.9% 46.0% 66.8% Job training 67.1% 35.1% 66.9% Medical care 68.4% 53.6% 46.6% Mental health care 53.3% 41.4% 58.3% Rental assistance 62.5% 33.8% 71.2% Substance abuse treatment 53.4% 46.9% 42.5% Transitional housing 70.6% 43.3% 67.4% Transportation 77.9% 59.8% 61.1%
37
HIV/AIDS
Definition
Through the program, Housing Opportunities for Persons with HIV/AIDS (HOPWA), and through the Continuum of Care, HUD has allocated funds for a variety of housing-related services to those who are living with HIV/AIDS, or Persons Living With HIV/AIDS (PLWH/A). The requirements for access to these services are documented diagnosis and income. As stated earlier, approximately 12.6% (n=137) of the study sample reported that they were HIV positive. The criteria for inclusion were having checked the item, “HIV” from a list of medical conditions. Based on the count of 12,000, 1,513 homeless persons are HIV positive.
Challenges
In addition to the challenges associated with homelessness, PLWH/A must attempt to slow the progression and impact of an incurable disease that with treatment can be managed, and without treatment can lead to life-threatening opportunistic infections and death. Even if they are fortunate enough to gain access to treatment, adherence to the medication regimens requires adequate nutrition with consistent timing of meals, regular medical and dental care and, as much as possible, limited exposure to infectious agents that may weaken an already compromised immune system. This assumes that the PLWH/A is aware of his or her condition.
As stated earlier, as many as 33% of those infected with HIV do not know that they are infected. This makes exposure to the virus a bigger risk, especially among persons who exchange sex for money or drugs, or who are injecting drug users.
“He gave it to me and I’m the one gets thrown out. Can you beat that? He found out first, so it’s me that gave it to him in his mind. But I know. I’m lucky so far, I haven’t been too sick yet. Yet, right? I didn’t know all about his drugs, well not that [crack use] anyway. Maybe I’d have left anyway, but I got no place to go and now this. And you can’t tell, because you don’t know they’d tell. [cries] My family don’t even know, never will if I can help it.” — Female, age 33
Housing status Of PLWH/A, an equal number were housed in transitional programs and in shelters. Though HOPWA funds housing services exclusively for people with HIV/AIDS, the need outweighs the current options, as with every other sub-population. When questioned specifically about access to medical care, only 2 of the 28 persons who responded replied that they had been seen by a physician within the past 12 months—the criterion set by HRSA1 for designation as “in care.”
1 HRSA: Health Resources and Services Administration—a division of the U.S. Department of Health and Human Services, the agency that administers Ryan White CARE Act funding.
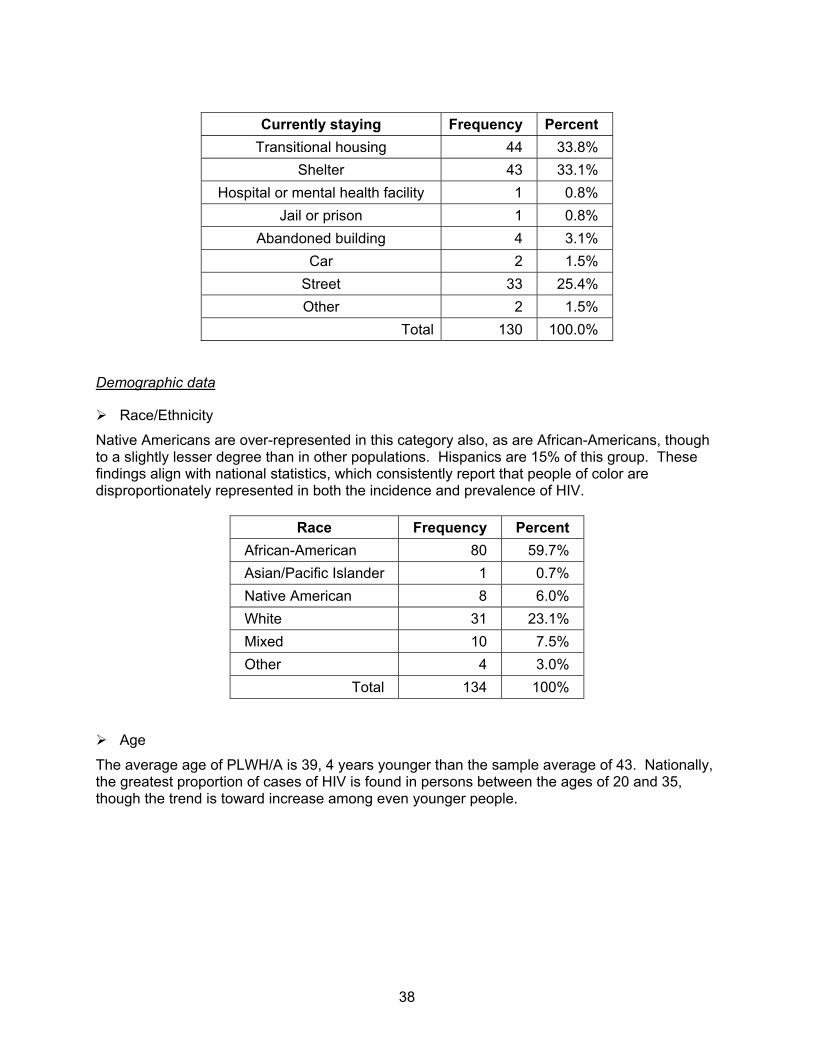
38
Currently staying Frequency Percent
Transitional housing 44 33.8% Shelter 43 33.1%
Hospital or mental health facility 1 0.8% Jail or prison 1 0.8%
Abandoned building 4 3.1% Car 2 1.5%
Street 33 25.4% Other 2 1.5%
Total 130 100.0%
Demographic data
Race/Ethnicity
Native Americans are over-represented in this category also, as are African-Americans, though to a slightly lesser degree than in other populations. Hispanics are 15% of this group. These findings align with national statistics, which consistently report that people of color are disproportionately represented in both the incidence and prevalence of HIV.
Race Frequency Percent African-American 80 59.7% Asian/Pacific Islander 1 0.7% Native American 8 6.0% White 31 23.1% Mixed 10 7.5% Other 4 3.0%
Total 134 100%
Age
The average age of PLWH/A is 39, 4 years younger than the sample average of 43. Nationally, the greatest proportion of cases of HIV is found in persons between the ages of 20 and 35, though the trend is toward increase among even younger people.
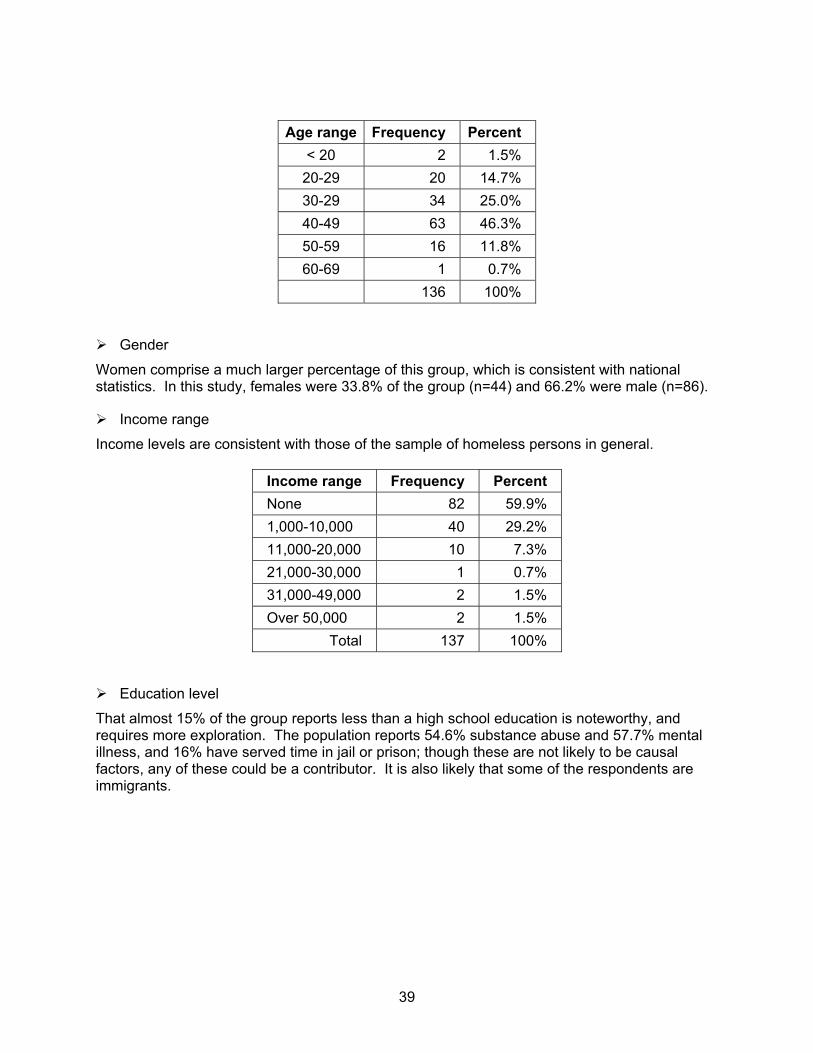
39
Age range Frequency Percent
< 20 2 1.5% 20-29 20 14.7% 30-29 34 25.0% 40-49 63 46.3% 50-59 16 11.8% 60-69 1 0.7%
136 100%
Gender
Women comprise a much larger percentage of this group, which is consistent with national statistics. In this study, females were 33.8% of the group (n=44) and 66.2% were male (n=86).
Income range
Income levels are consistent with those of the sample of homeless persons in general.
Income range Frequency Percent None 82 59.9% 1,000-10,000 40 29.2% 11,000-20,000 10 7.3% 21,000-30,000 1 0.7% 31,000-49,000 2 1.5% Over 50,000 2 1.5%
Total 137 100%
Education level
That almost 15% of the group reports less than a high school education is noteworthy, and requires more exploration. The population reports 54.6% substance abuse and 57.7% mental illness, and 16% have served time in jail or prison; though these are not likely to be causal factors, any of these could be a contributor. It is also likely that some of the respondents are immigrants.

40
Education Frequency Percent
< 9th grade 20 14.6% Some high school 19 13.9% High school graduate 41 29.9% GED 25 18.2% Some college 25 18.2% College graduate 6 4.4% Post grad 1 0.7%
Total 137 100%
Services: need, use, difficulty of access
The existence of a targeted, alternative system of care (the Ryan White CARE Act) is readily apparent in a review of use of medical services among homeless PLWH/A who are sheltered. This group reports need for medical care more frequently than any other group, but also the highest rate of use and least perception of barriers to access. The exception to this is found among unsheltered homeless persons, as discussed previously. However, Ryan White funding is also threatened, and basic and supportive services other than ambulatory medical care have already been affected. The result of these funding decisions is reflected in the table that follows.
Service Need Use Difficult Access Case management 72.3% 70.1% 39.3% Clothing 89.3% 80.8% 47.4% Dental 77.8% 60.1% 52.4% Emergency shelter 55.5% 61.1% 52.9% Food service 84.2% 71.5% 36.1% Housing voucher 78.9% 38.1% 65.4% Information and referral 70.5% 65.1% 46.2% Job placement 78.6% 58.4% 58.8% Job training 74.8% 55.7% 53.5% Medical care 73.3% 71.7% 37.3% Mental health care 59.8% 48.1% 49.1% Rental assistance 67.5% 48.5% 60.7% Substance abuse treatment 50.8% 50.8% 42.1% Transitional housing 73.4% 55.3% 55.2% Transportation 77.7% 74.2% 43.7%
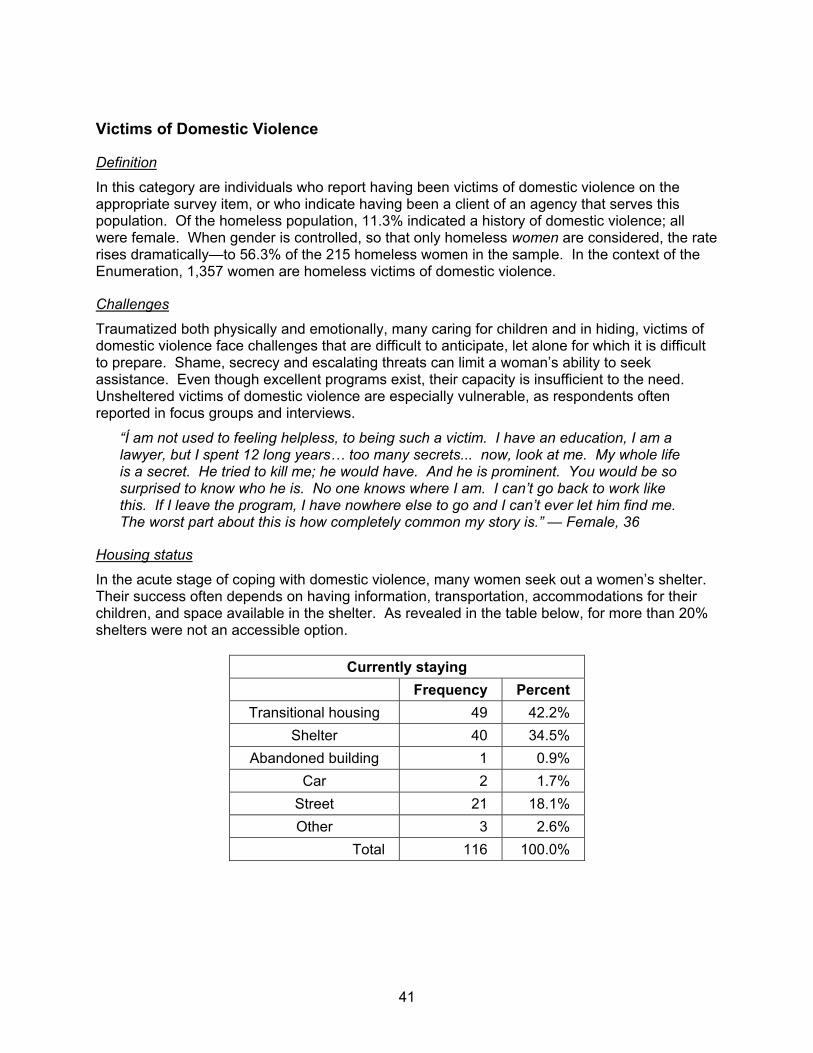
41
Victims of Domestic Violence
Definition
In this category are individuals who report having been victims of domestic violence on the appropriate survey item, or who indicate having been a client of an agency that serves this population. Of the homeless population, 11.3% indicated a history of domestic violence; all were female. When gender is controlled, so that only homeless women are considered, the rate rises dramatically—to 56.3% of the 215 homeless women in the sample. In the context of the Enumeration, 1,357 women are homeless victims of domestic violence.
Challenges
Traumatized both physically and emotionally, many caring for children and in hiding, victims of domestic violence face challenges that are difficult to anticipate, let alone for which it is difficult to prepare. Shame, secrecy and escalating threats can limit a woman’s ability to seek assistance. Even though excellent programs exist, their capacity is insufficient to the need. Unsheltered victims of domestic violence are especially vulnerable, as respondents often reported in focus groups and interviews.
“Í am not used to feeling helpless, to being such a victim. I have an education, I am a lawyer, but I spent 12 long years… too many secrets... now, look at me. My whole life is a secret. He tried to kill me; he would have. And he is prominent. You would be so surprised to know who he is. No one knows where I am. I can’t go back to work like this. If I leave the program, I have nowhere else to go and I can’t ever let him find me. The worst part about this is how completely common my story is.” — Female, 36
Housing status
In the acute stage of coping with domestic violence, many women seek out a women’s shelter. Their success often depends on having information, transportation, accommodations for their children, and space available in the shelter. As revealed in the table below, for more than 20% shelters were not an accessible option.
Currently staying Frequency Percent Transitional housing 49 42.2%
Shelter 40 34.5% Abandoned building 1 0.9%
Car 2 1.7% Street 21 18.1% Other 3 2.6%
Total 116 100.0%

42
Demographic data
Race/Ethnicity
The proportion of White women in this group is greater than in any other sub-population, and the proportion of African-Americans is lower. Studies show that this does not represent an inconsistency, since domestic violence crosses all categories and strata of society. Further, because disparities may exist among racial groups with respect to access to shelters and transitional programs, and because some cultures consider violence to be inevitable in familial relationships, domestic violence is often under-reported.
Race Frequency Percent African-American 57 47.5% Asian/Pacific Islander 3 2.5% Native American 7 5.8% White 32 26.7% Mixed 8 6.7% Other 13 10.8%
Total 120 100%
With respect to ethnicity, 15% (n=18) of the 120 respondents indicated that they were Hispanic in origin.
Age
The average age for this group was 38, slightly younger than for women in the general sample of homeless women (age=39). The distribution mirrors that of the sample.
Age range Frequency Percent< 20 4 3.4%
20-29 23 19.5%30-39 29 24.6%40-49 45 38.1%50-59 17 14.4%
Total 118 100%
Gender
All respondents in this category were female. Thirty-six women (36.4%) indicated that they had children living with them. The chart that follows shows the number of children per woman, the number of female-headed household and the total number of children.
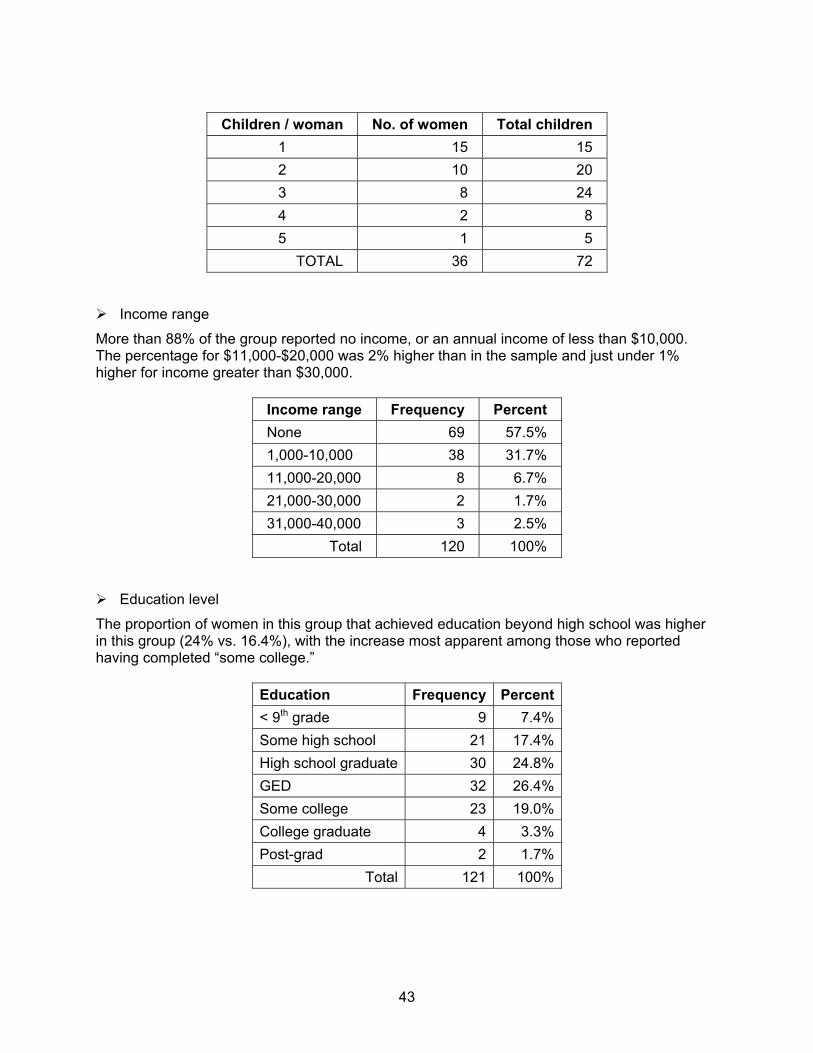
43
Children / woman No. of women Total children
1 15 15 2 10 20 3 8 24 4 2 8 5 1 5
TOTAL 36 72
Income range
More than 88% of the group reported no income, or an annual income of less than $10,000. The percentage for $11,000-$20,000 was 2% higher than in the sample and just under 1% higher for income greater than $30,000.
Income range Frequency Percent None 69 57.5% 1,000-10,000 38 31.7% 11,000-20,000 8 6.7% 21,000-30,000 2 1.7% 31,000-40,000 3 2.5%
Total 120 100%
Education level
The proportion of women in this group that achieved education beyond high school was higher in this group (24% vs. 16.4%), with the increase most apparent among those who reported having completed “some college.”
Education Frequency Percent< 9th grade 9 7.4%Some high school 21 17.4%High school graduate 30 24.8%GED 32 26.4%Some college 23 19.0%College graduate 4 3.3%Post-grad 2 1.7%
Total 121 100%
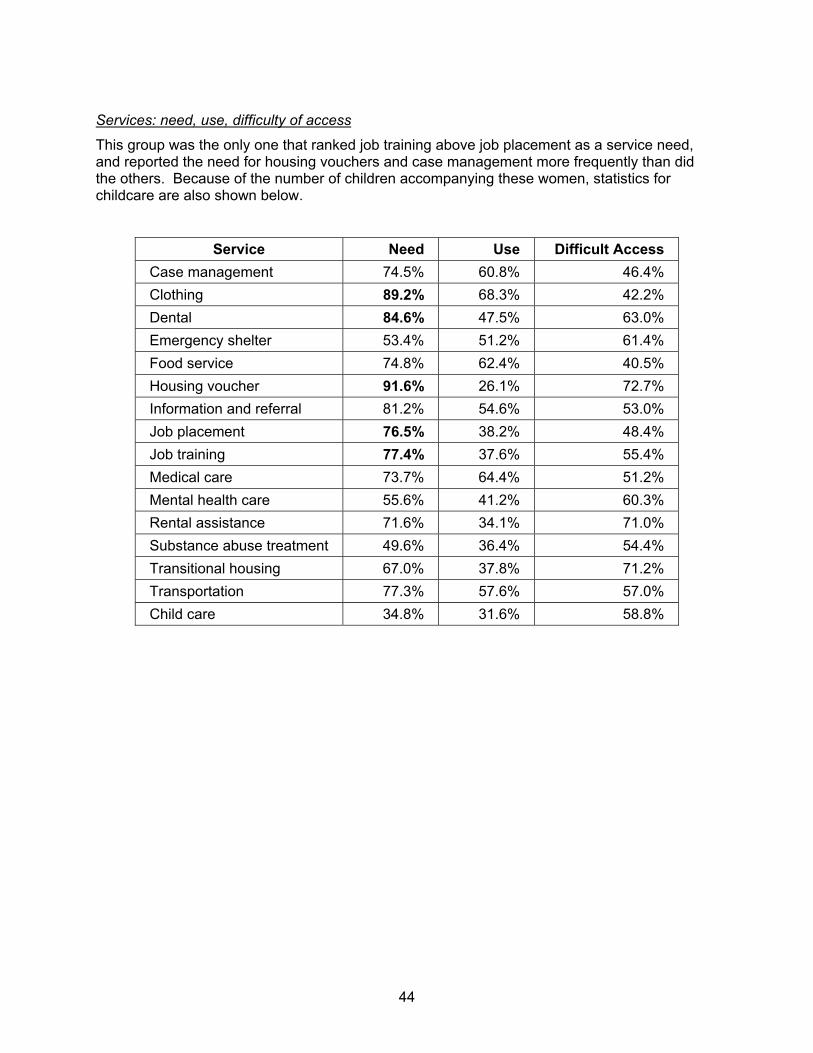
44
Services: need, use, difficulty of access
This group was the only one that ranked job training above job placement as a service need, and reported the need for housing vouchers and case management more frequently than did the others. Because of the number of children accompanying these women, statistics for childcare are also shown below.
Service Need Use Difficult Access Case management 74.5% 60.8% 46.4% Clothing 89.2% 68.3% 42.2% Dental 84.6% 47.5% 63.0% Emergency shelter 53.4% 51.2% 61.4% Food service 74.8% 62.4% 40.5% Housing voucher 91.6% 26.1% 72.7% Information and referral 81.2% 54.6% 53.0% Job placement 76.5% 38.2% 48.4% Job training 77.4% 37.6% 55.4% Medical care 73.7% 64.4% 51.2% Mental health care 55.6% 41.2% 60.3% Rental assistance 71.6% 34.1% 71.0% Substance abuse treatment 49.6% 36.4% 54.4% Transitional housing 67.0% 37.8% 71.2% Transportation 77.3% 57.6% 57.0% Child care 34.8% 31.6% 58.8%
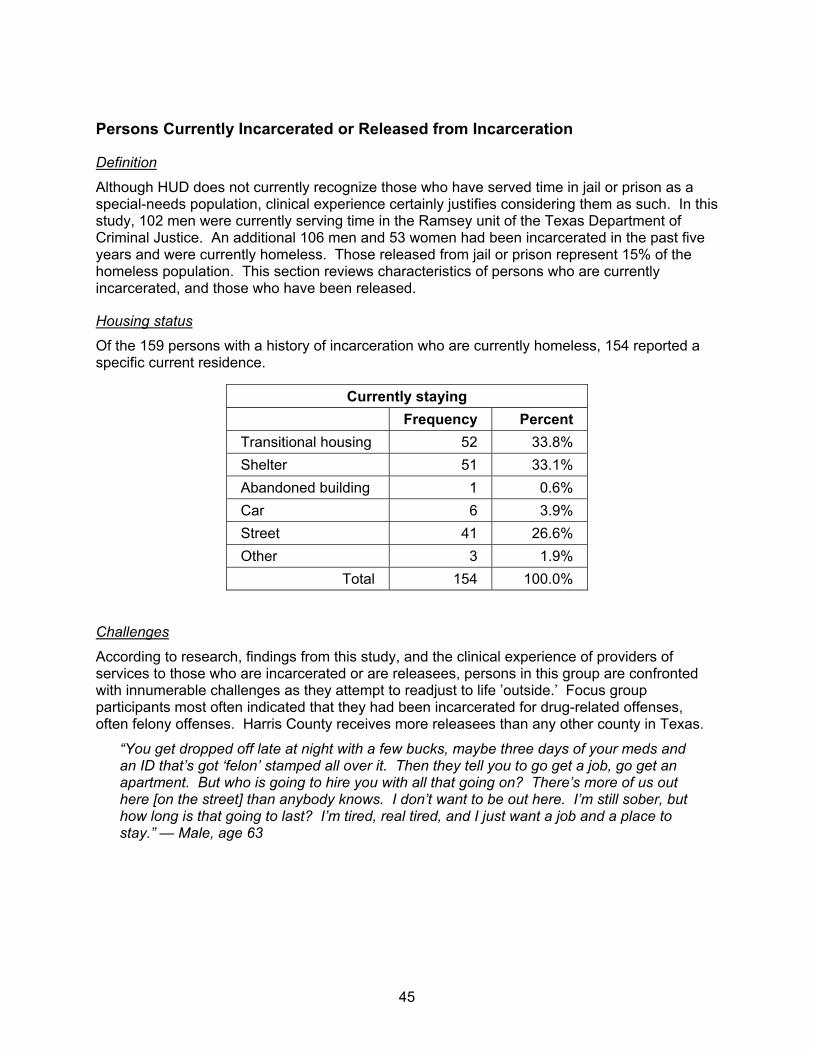
45
Persons Currently Incarcerated or Released from Incarceration
Definition
Although HUD does not currently recognize those who have served time in jail or prison as a special-needs population, clinical experience certainly justifies considering them as such. In this study, 102 men were currently serving time in the Ramsey unit of the Texas Department of Criminal Justice. An additional 106 men and 53 women had been incarcerated in the past five years and were currently homeless. Those released from jail or prison represent 15% of the homeless population. This section reviews characteristics of persons who are currently incarcerated, and those who have been released.
Housing status
Of the 159 persons with a history of incarceration who are currently homeless, 154 reported a specific current residence.
Currently staying Frequency Percent Transitional housing 52 33.8% Shelter 51 33.1% Abandoned building 1 0.6% Car 6 3.9% Street 41 26.6% Other 3 1.9%
Total 154 100.0%
Challenges
According to research, findings from this study, and the clinical experience of providers of services to those who are incarcerated or are releasees, persons in this group are confronted with innumerable challenges as they attempt to readjust to life ’outside.’ Focus group participants most often indicated that they had been incarcerated for drug-related offenses, often felony offenses. Harris County receives more releasees than any other county in Texas.
“You get dropped off late at night with a few bucks, maybe three days of your meds and an ID that’s got ‘felon’ stamped all over it. Then they tell you to go get a job, go get an apartment. But who is going to hire you with all that going on? There’s more of us out here [on the street] than anybody knows. I don’t want to be out here. I’m still sober, but how long is that going to last? I’m tired, real tired, and I just want a job and a place to stay.” — Male, age 63

46
Demographic data
Race/Ethnicity
Whites represent the largest proportion of the incarcerated than any other group, and African-Americans the largest proportion of those who have been released. All of those who are incarcerated had been so for longer than five years.
Race Incarcerated Released
Frequency Percent Frequency Percent
African-American 38 38% 113 68.5% Asian/Pacific Islander 0 0 2 1.2% Native American 5 5% 2 1.2% White 43 43% 30 18.2% Mixed 5 5% 8 4.8% Other 9 9% 10 6.1%
Total 100 100% 165 100%
Age range
The average age of releasees was 42—not significantly different from the sample—and for currently incarcerated persons the average age was a much older 50. The distribution was skewed toward older individuals, as shown below.
Age Range Incarcerated Released
Frequency Percent Frequency Percent
<20 0 0 4 2.4% 20-29 0 0 13 7.9% 30-39 10 9.9% 34 20.7% 40-49 40 39.6% 83 50.6% 50-59 37 36.6% 27 16.5% 60-69 14 13.9% 3 1.8%
Total 101 100% 164 100%
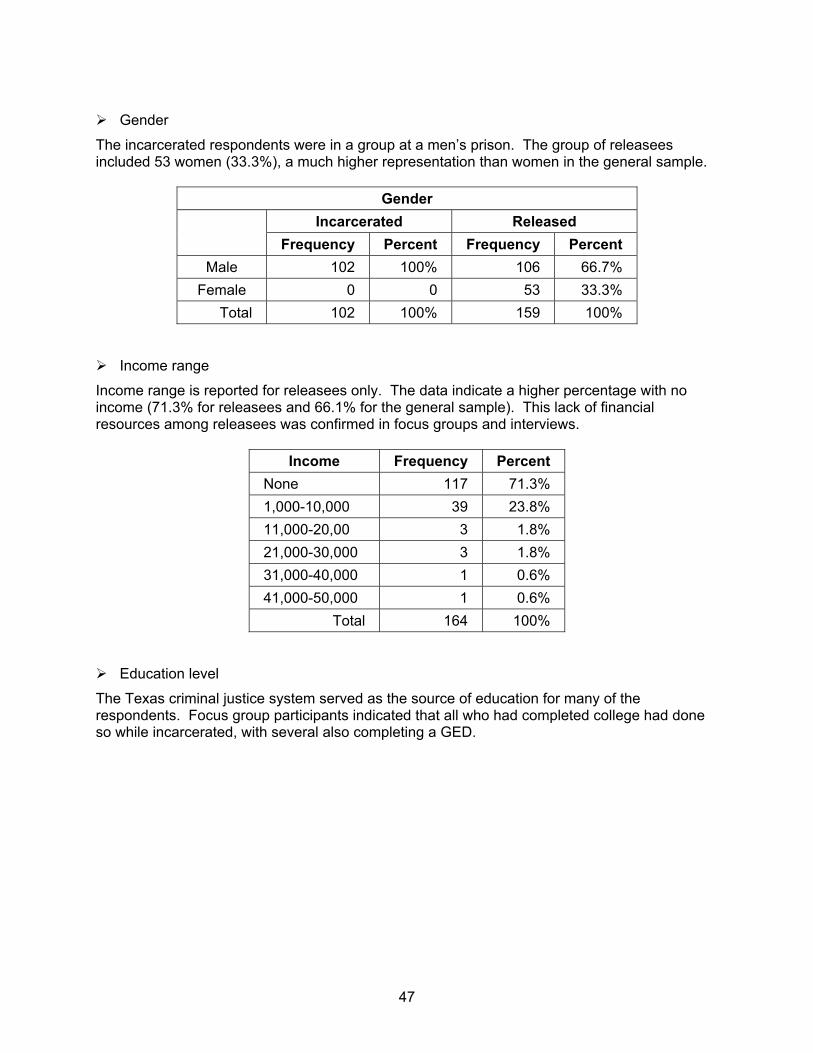
47
Gender
The incarcerated respondents were in a group at a men’s prison. The group of releasees included 53 women (33.3%), a much higher representation than women in the general sample.
Gender Incarcerated Released
Frequency Percent Frequency Percent
Male 102 100% 106 66.7% Female 0 0 53 33.3%
Total 102 100% 159 100%
Income range
Income range is reported for releasees only. The data indicate a higher percentage with no income (71.3% for releasees and 66.1% for the general sample). This lack of financial resources among releasees was confirmed in focus groups and interviews.
Income Frequency Percent None 117 71.3% 1,000-10,000 39 23.8% 11,000-20,00 3 1.8% 21,000-30,000 3 1.8% 31,000-40,000 1 0.6% 41,000-50,000 1 0.6%
Total 164 100%
Education level
The Texas criminal justice system served as the source of education for many of the respondents. Focus group participants indicated that all who had completed college had done so while incarcerated, with several also completing a GED.
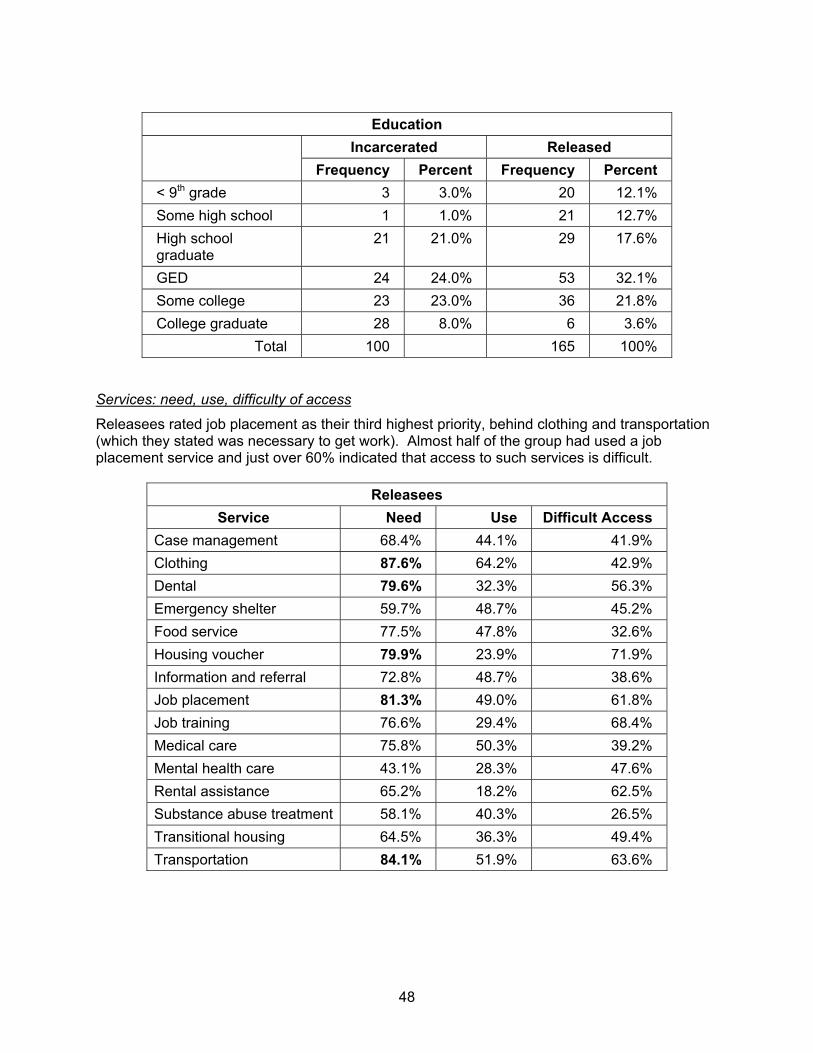
48
Education
Incarcerated Released
Frequency Percent Frequency Percent < 9th grade 3 3.0% 20 12.1% Some high school 1 1.0% 21 12.7% High school graduate
21 21.0% 29 17.6%
GED 24 24.0% 53 32.1% Some college 23 23.0% 36 21.8% College graduate 28 8.0% 6 3.6%
Total 100 165 100%
Services: need, use, difficulty of access
Releasees rated job placement as their third highest priority, behind clothing and transportation (which they stated was necessary to get work). Almost half of the group had used a job placement service and just over 60% indicated that access to such services is difficult.
Releasees Service Need Use Difficult Access
Case management 68.4% 44.1% 41.9% Clothing 87.6% 64.2% 42.9% Dental 79.6% 32.3% 56.3% Emergency shelter 59.7% 48.7% 45.2% Food service 77.5% 47.8% 32.6% Housing voucher 79.9% 23.9% 71.9% Information and referral 72.8% 48.7% 38.6% Job placement 81.3% 49.0% 61.8% Job training 76.6% 29.4% 68.4% Medical care 75.8% 50.3% 39.2% Mental health care 43.1% 28.3% 47.6% Rental assistance 65.2% 18.2% 62.5% Substance abuse treatment 58.1% 40.3% 26.5% Transitional housing 64.5% 36.3% 49.4% Transportation 84.1% 51.9% 63.6%
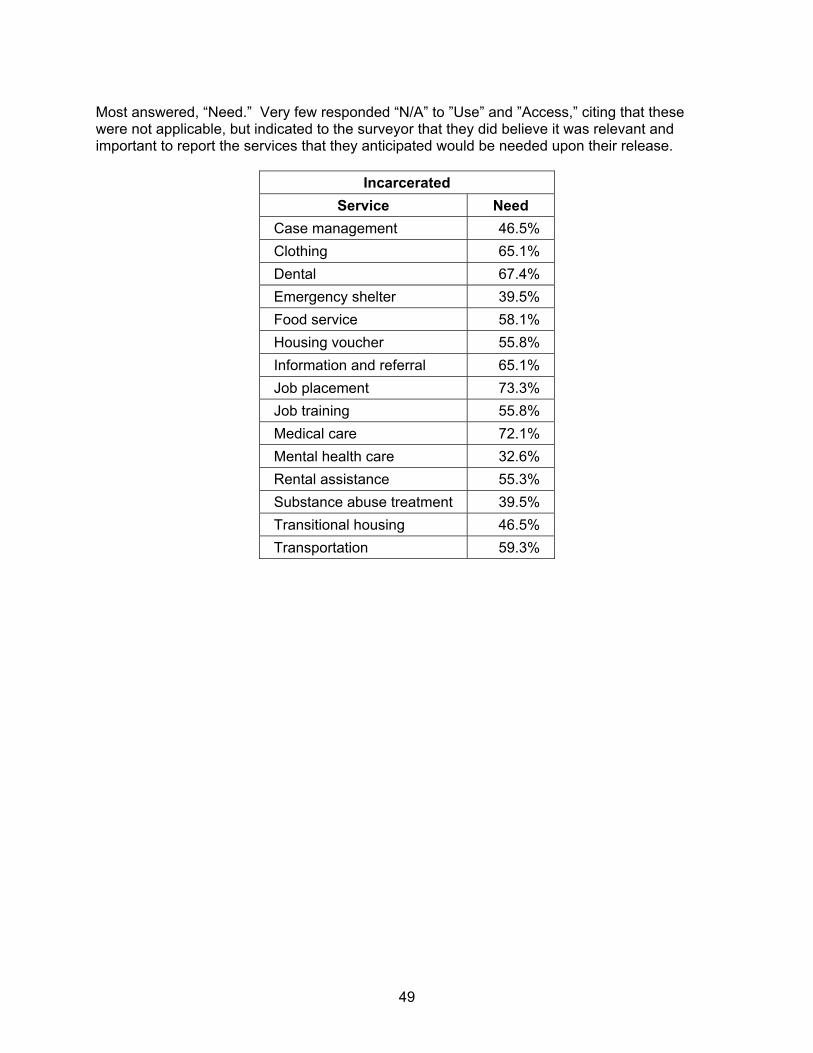
49
Most answered, “Need.” Very few responded “N/A” to ”Use” and ”Access,” citing that these were not applicable, but indicated to the surveyor that they did believe it was relevant and important to report the services that they anticipated would be needed upon their release.
Incarcerated Service Need
Case management 46.5% Clothing 65.1% Dental 67.4% Emergency shelter 39.5% Food service 58.1% Housing voucher 55.8% Information and referral 65.1% Job placement 73.3% Job training 55.8% Medical care 72.1% Mental health care 32.6% Rental assistance 55.3% Substance abuse treatment 39.5% Transitional housing 46.5% Transportation 59.3%

50
Marginally housed
Definition
This group also falls outside of the classification as a special-needs population, but was included in the study to elucidate some of the parameters associated with being at risk of homelessness in order to assist in prevention planning. Persons were included in this category if they indicated that they were homeless but living in the home of a family member or friend. They were not included in computations of homeless persons. Because the number of respondents is low (n=81), it is suggested that the data be used as the basis for future studies or in comparison to service provider information, but not as a basis for broad generalizations.
Challenges
These are the persons who are living on the edge of homelessness, and who consider themselves to be homeless. They are individuals who seek basic services as prevention against living on the streets, and who are the target clients of agencies providing rental assistance, utility payments, etc.
“I’m staying with friends when I can, so I’m not really homeless. I’m not one of them on the street like you see at the Pierce. Yeah, I’ve stayed a night or so in my car and at the… [rooming house]. I work when I can. I got friends, I’m not homeless, not really, not like that.”
Housing status
These respondents were ’doubled up’ with friends or family—a practice that, according to focus group participants, is a common method of preventing homelessness. Unfortunately, it is too often ineffective as a longer-term strategy because of a host of psychosocial, as well as financial, reasons.
Demographic data
Race/Ethnicity
Twenty-five respondents reported being Hispanic (30.9%). When Hispanics who indicated “Other” race are also counted, the rate rises to 48%. This is very consistent with interview and focus group data, wherein respondents told numerous stories of ’doubling up,’ especially with family if an older person, or with friends as an adolescent or young adult.
Race Frequency Percent African-American 47 58.0% Native American 5 6.2% White 11 13.6% Mixed 4 4.9% Other 14 17.3%
Total 81 100%

51
Age range
Age Frequency Percent < 20 6 7.4%
20-29 13 16.0% 30-39 14 17.3% 40-49 24 29.6% 50-59 23 28.4% 60-69 1 1.2%
Total 81 100%
Gender
Consistent with the general homeless population, 80.6% of the marginally housed are male and 19.4% are female.
Income range
Almost 93% of the respondents report income less than $10,000. While more than half of this group reports no income, among homeless respondents that rate is 66%
Income Frequency Percent None 43 53.1% 1,000-10,000 32 39.5% 11,000-20,000 6 7.4%
Total 81 100%
Education level
The education level of these respondents is comparable to that of homeless respondents but, again, because of the small sample size and number of categories, generalizations about this information are not prudent.
Education Frequency Percent < 9th grade 14 17.3% Some high school 20 24.7% High school graduate 23 28.4% GED 11 13.6% Some college 12 14.8% College graduate 1 1.2%
Total 81 100%
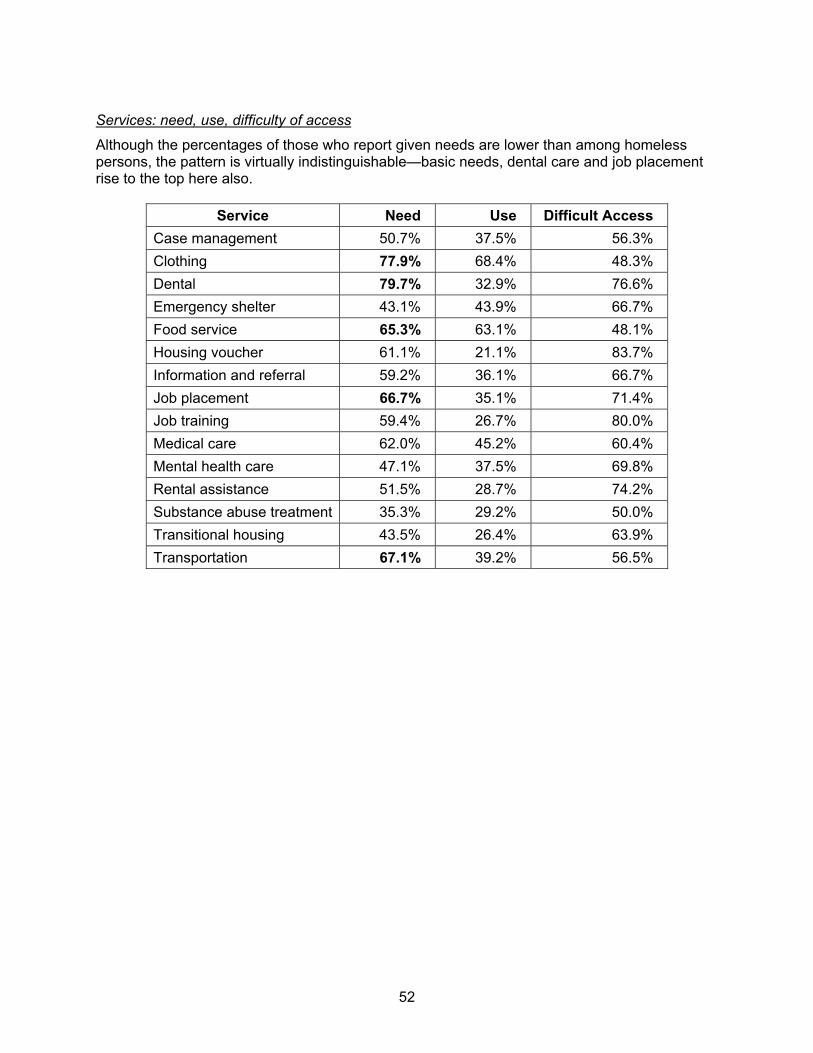
52
Services: need, use, difficulty of access
Although the percentages of those who report given needs are lower than among homeless persons, the pattern is virtually indistinguishable—basic needs, dental care and job placement rise to the top here also.
Service Need Use Difficult Access Case management 50.7% 37.5% 56.3% Clothing 77.9% 68.4% 48.3% Dental 79.7% 32.9% 76.6% Emergency shelter 43.1% 43.9% 66.7% Food service 65.3% 63.1% 48.1% Housing voucher 61.1% 21.1% 83.7% Information and referral 59.2% 36.1% 66.7% Job placement 66.7% 35.1% 71.4% Job training 59.4% 26.7% 80.0% Medical care 62.0% 45.2% 60.4% Mental health care 47.1% 37.5% 69.8% Rental assistance 51.5% 28.7% 74.2% Substance abuse treatment 35.3% 29.2% 50.0% Transitional housing 43.5% 26.4% 63.9% Transportation 67.1% 39.2% 56.5%
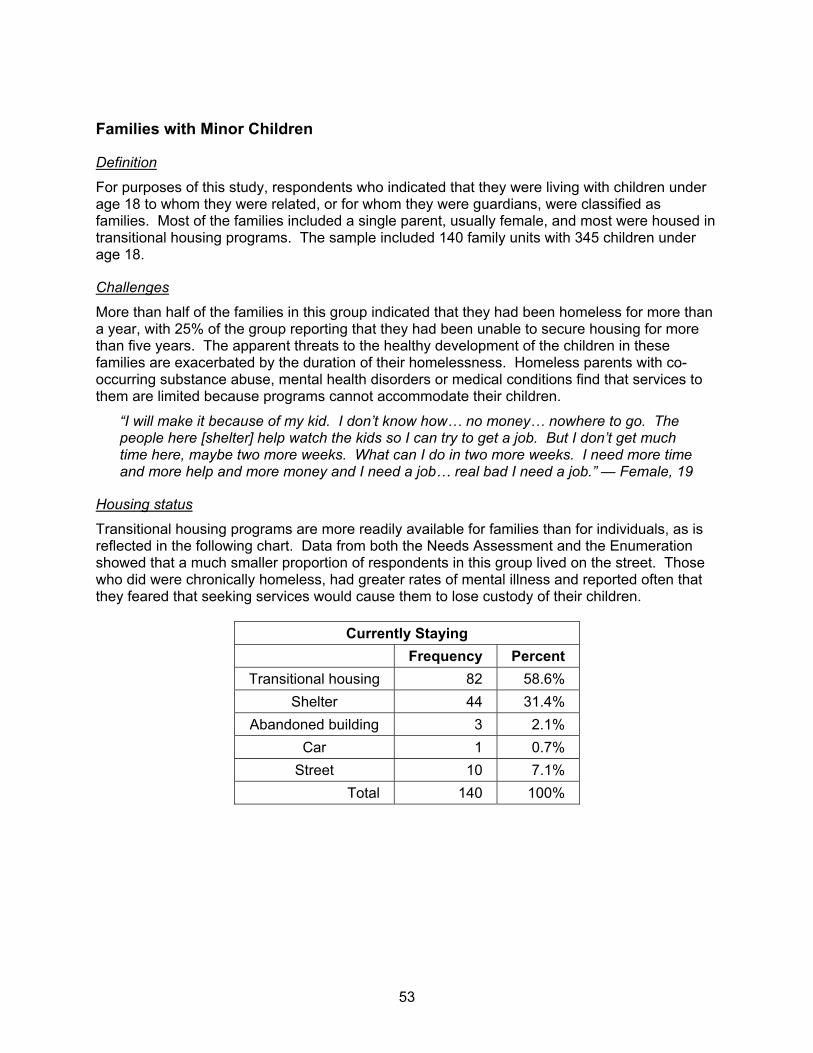
53
Families with Minor Children
Definition
For purposes of this study, respondents who indicated that they were living with children under age 18 to whom they were related, or for whom they were guardians, were classified as families. Most of the families included a single parent, usually female, and most were housed in transitional housing programs. The sample included 140 family units with 345 children under age 18.
Challenges
More than half of the families in this group indicated that they had been homeless for more than a year, with 25% of the group reporting that they had been unable to secure housing for more than five years. The apparent threats to the healthy development of the children in these families are exacerbated by the duration of their homelessness. Homeless parents with co-occurring substance abuse, mental health disorders or medical conditions find that services to them are limited because programs cannot accommodate their children.
“I will make it because of my kid. I don’t know how… no money… nowhere to go. The people here [shelter] help watch the kids so I can try to get a job. But I don’t get much time here, maybe two more weeks. What can I do in two more weeks. I need more time and more help and more money and I need a job… real bad I need a job.” — Female, 19
Housing status
Transitional housing programs are more readily available for families than for individuals, as is reflected in the following chart. Data from both the Needs Assessment and the Enumeration showed that a much smaller proportion of respondents in this group lived on the street. Those who did were chronically homeless, had greater rates of mental illness and reported often that they feared that seeking services would cause them to lose custody of their children.
Currently Staying Frequency Percent
Transitional housing 82 58.6% Shelter 44 31.4%
Abandoned building 3 2.1% Car 1 0.7%
Street 10 7.1% Total 140 100%
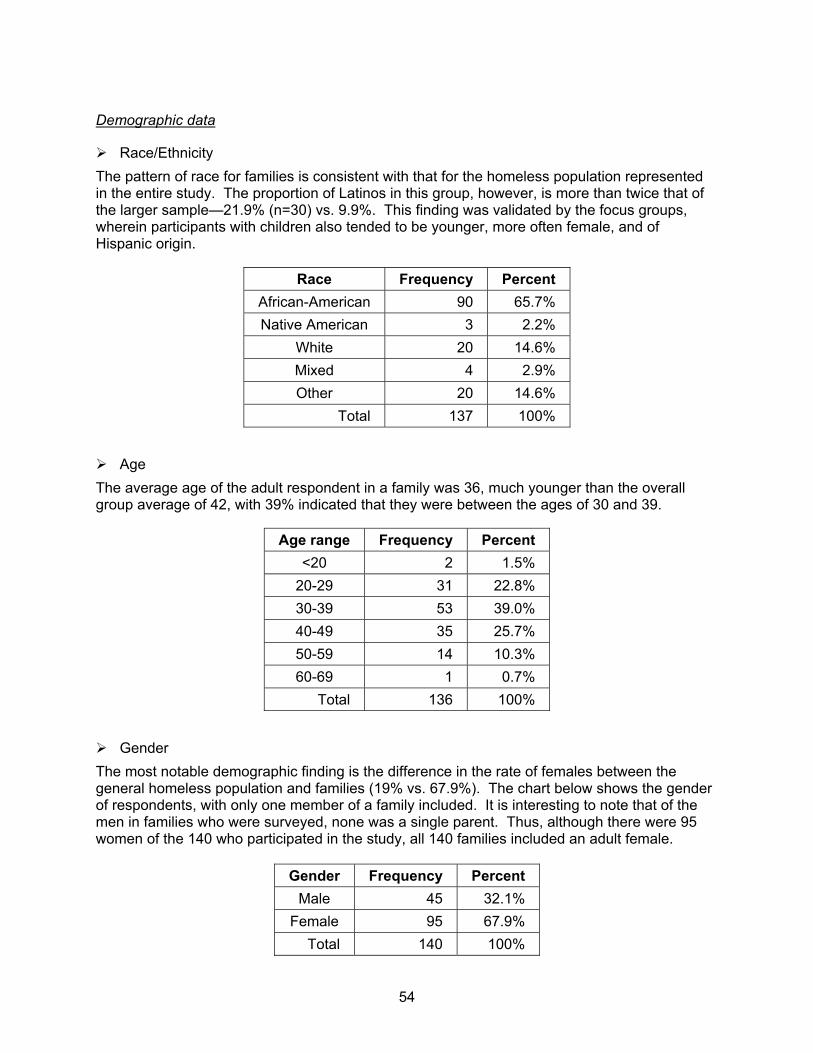
54
Demographic data
Race/Ethnicity The pattern of race for families is consistent with that for the homeless population represented in the entire study. The proportion of Latinos in this group, however, is more than twice that of the larger sample—21.9% (n=30) vs. 9.9%. This finding was validated by the focus groups, wherein participants with children also tended to be younger, more often female, and of Hispanic origin.
Race Frequency Percent African-American 90 65.7% Native American 3 2.2%
White 20 14.6% Mixed 4 2.9% Other 20 14.6%
Total 137 100%
Age The average age of the adult respondent in a family was 36, much younger than the overall group average of 42, with 39% indicated that they were between the ages of 30 and 39.
Age range Frequency Percent <20 2 1.5%
20-29 31 22.8% 30-39 53 39.0% 40-49 35 25.7% 50-59 14 10.3% 60-69 1 0.7%
Total 136 100%
Gender The most notable demographic finding is the difference in the rate of females between the general homeless population and families (19% vs. 67.9%). The chart below shows the gender of respondents, with only one member of a family included. It is interesting to note that of the men in families who were surveyed, none was a single parent. Thus, although there were 95 women of the 140 who participated in the study, all 140 families included an adult female.
Gender Frequency Percent Male 45 32.1%
Female 95 67.9% Total 140 100%
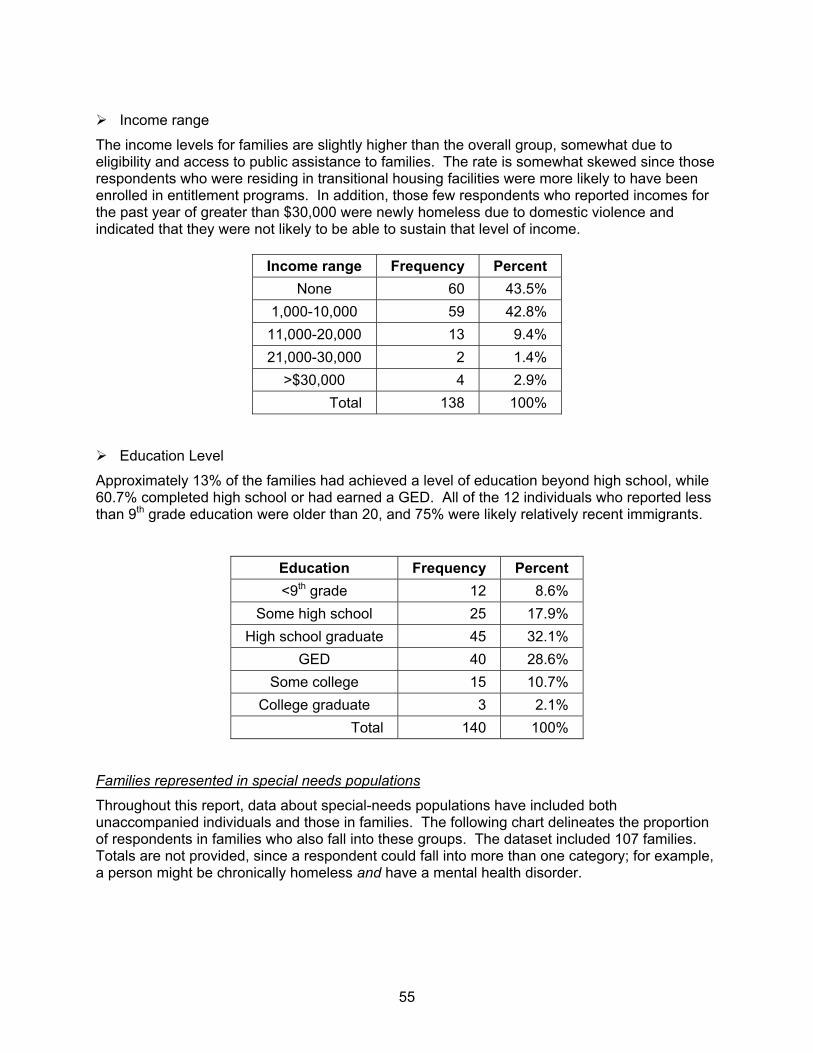
55
Income range
The income levels for families are slightly higher than the overall group, somewhat due to eligibility and access to public assistance to families. The rate is somewhat skewed since those respondents who were residing in transitional housing facilities were more likely to have been enrolled in entitlement programs. In addition, those few respondents who reported incomes for the past year of greater than $30,000 were newly homeless due to domestic violence and indicated that they were not likely to be able to sustain that level of income.
Income range Frequency Percent None 60 43.5%
1,000-10,000 59 42.8% 11,000-20,000 13 9.4% 21,000-30,000 2 1.4%
>$30,000 4 2.9% Total 138 100%
Education Level
Approximately 13% of the families had achieved a level of education beyond high school, while 60.7% completed high school or had earned a GED. All of the 12 individuals who reported less than 9th grade education were older than 20, and 75% were likely relatively recent immigrants.
Education Frequency Percent <9th grade 12 8.6%
Some high school 25 17.9% High school graduate 45 32.1%
GED 40 28.6% Some college 15 10.7%
College graduate 3 2.1% Total 140 100%
Families represented in special needs populations
Throughout this report, data about special-needs populations have included both unaccompanied individuals and those in families. The following chart delineates the proportion of respondents in families who also fall into these groups. The dataset included 107 families. Totals are not provided, since a respondent could fall into more than one category; for example, a person might be chronically homeless and have a mental health disorder.
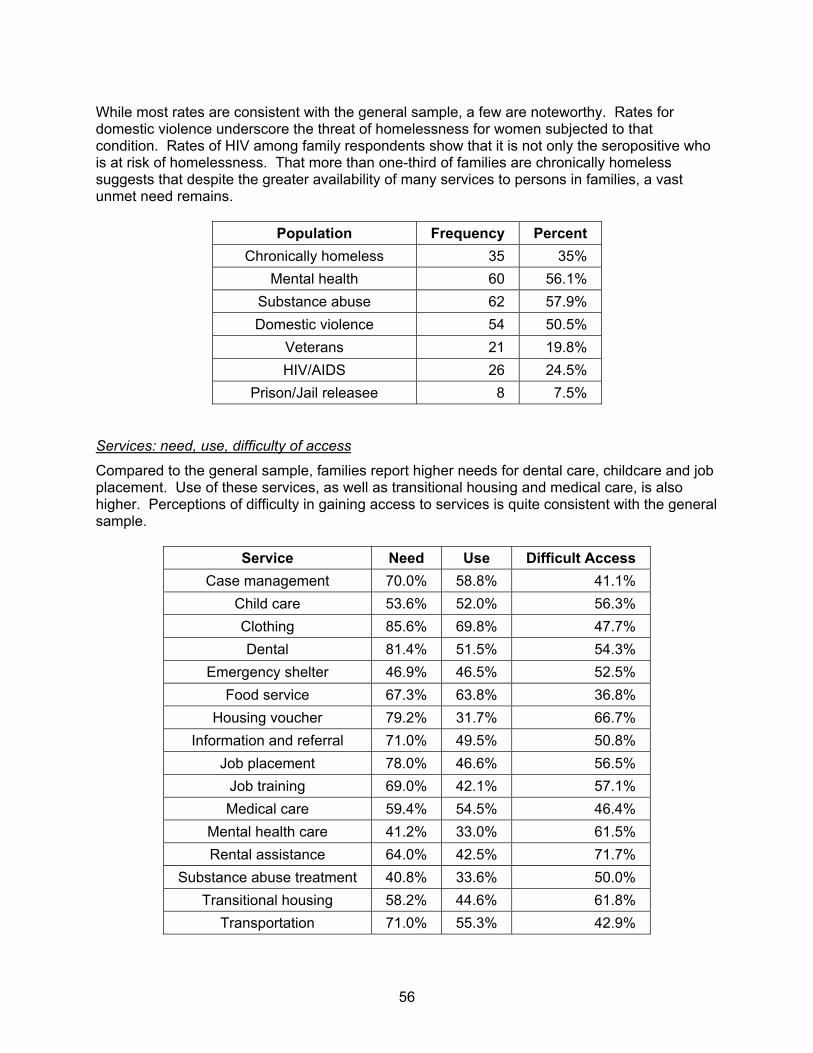
56
While most rates are consistent with the general sample, a few are noteworthy. Rates for domestic violence underscore the threat of homelessness for women subjected to that condition. Rates of HIV among family respondents show that it is not only the seropositive who is at risk of homelessness. That more than one-third of families are chronically homeless suggests that despite the greater availability of many services to persons in families, a vast unmet need remains.
Population Frequency Percent Chronically homeless 35 35%
Mental health 60 56.1% Substance abuse 62 57.9% Domestic violence 54 50.5%
Veterans 21 19.8% HIV/AIDS 26 24.5%
Prison/Jail releasee 8 7.5%
Services: need, use, difficulty of access
Compared to the general sample, families report higher needs for dental care, childcare and job placement. Use of these services, as well as transitional housing and medical care, is also higher. Perceptions of difficulty in gaining access to services is quite consistent with the general sample.
Service Need Use Difficult Access Case management 70.0% 58.8% 41.1%
Child care 53.6% 52.0% 56.3% Clothing 85.6% 69.8% 47.7% Dental 81.4% 51.5% 54.3%
Emergency shelter 46.9% 46.5% 52.5% Food service 67.3% 63.8% 36.8%
Housing voucher 79.2% 31.7% 66.7% Information and referral 71.0% 49.5% 50.8%
Job placement 78.0% 46.6% 56.5% Job training 69.0% 42.1% 57.1% Medical care 59.4% 54.5% 46.4%
Mental health care 41.2% 33.0% 61.5% Rental assistance 64.0% 42.5% 71.7%
Substance abuse treatment 40.8% 33.6% 50.0% Transitional housing 58.2% 44.6% 61.8%
Transportation 71.0% 55.3% 42.9%
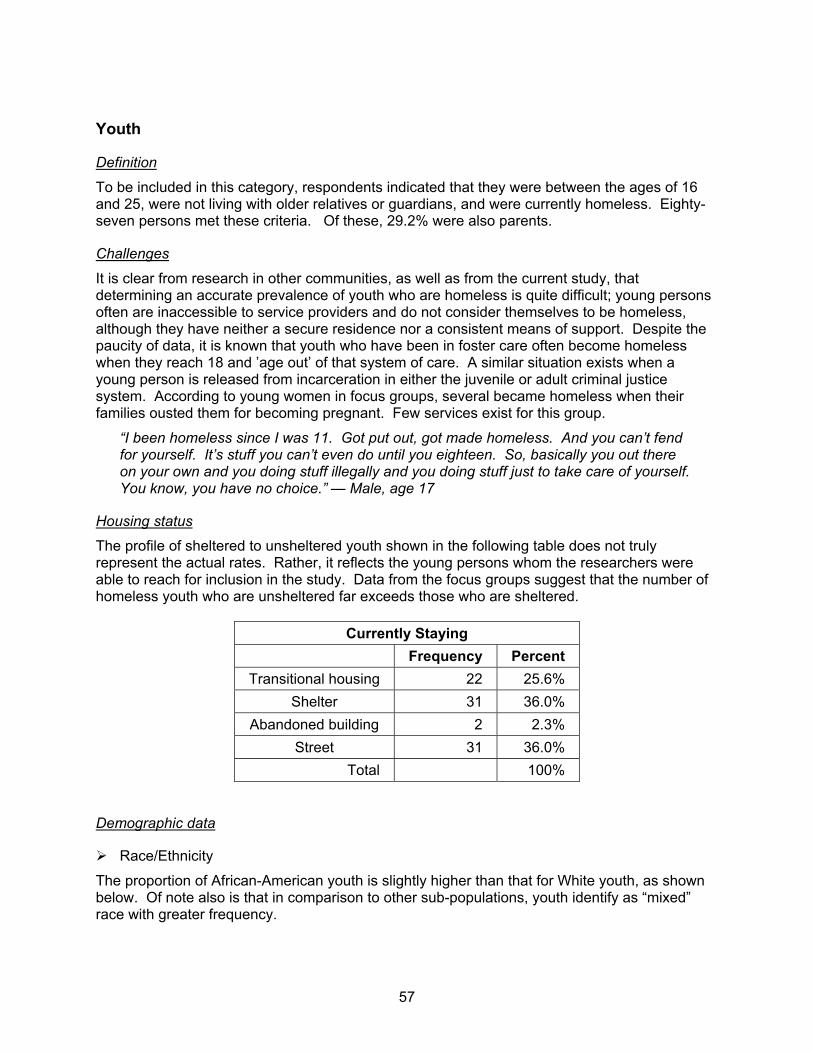
57
Youth
Definition
To be included in this category, respondents indicated that they were between the ages of 16 and 25, were not living with older relatives or guardians, and were currently homeless. Eighty-seven persons met these criteria. Of these, 29.2% were also parents.
Challenges
It is clear from research in other communities, as well as from the current study, that determining an accurate prevalence of youth who are homeless is quite difficult; young persons often are inaccessible to service providers and do not consider themselves to be homeless, although they have neither a secure residence nor a consistent means of support. Despite the paucity of data, it is known that youth who have been in foster care often become homeless when they reach 18 and ’age out’ of that system of care. A similar situation exists when a young person is released from incarceration in either the juvenile or adult criminal justice system. According to young women in focus groups, several became homeless when their families ousted them for becoming pregnant. Few services exist for this group.
“I been homeless since I was 11. Got put out, got made homeless. And you can’t fend for yourself. It’s stuff you can’t even do until you eighteen. So, basically you out there on your own and you doing stuff illegally and you doing stuff just to take care of yourself. You know, you have no choice.” — Male, age 17
Housing status
The profile of sheltered to unsheltered youth shown in the following table does not truly represent the actual rates. Rather, it reflects the young persons whom the researchers were able to reach for inclusion in the study. Data from the focus groups suggest that the number of homeless youth who are unsheltered far exceeds those who are sheltered.
Currently Staying Frequency Percent
Transitional housing 22 25.6% Shelter 31 36.0%
Abandoned building 2 2.3% Street 31 36.0%
Total 100%
Demographic data
Race/Ethnicity
The proportion of African-American youth is slightly higher than that for White youth, as shown below. Of note also is that in comparison to other sub-populations, youth identify as “mixed” race with greater frequency.
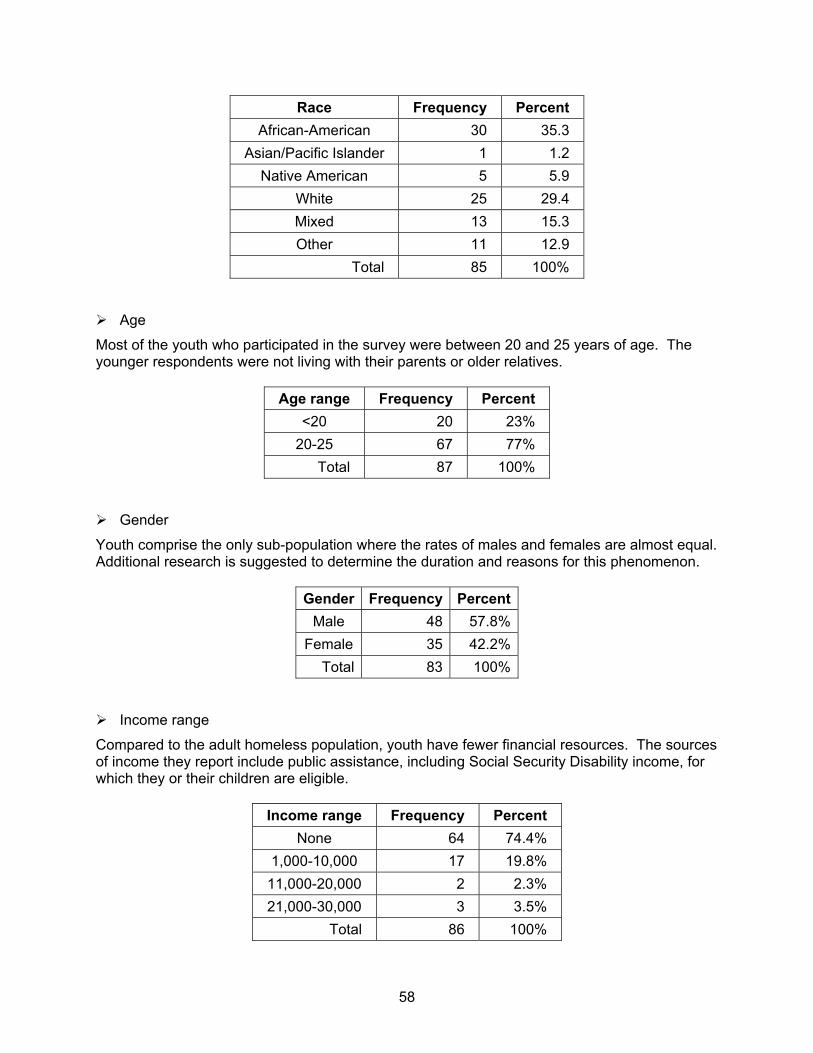
58
Race Frequency Percent African-American 30 35.3
Asian/Pacific Islander 1 1.2 Native American 5 5.9
White 25 29.4 Mixed 13 15.3 Other 11 12.9
Total 85 100%
Age
Most of the youth who participated in the survey were between 20 and 25 years of age. The younger respondents were not living with their parents or older relatives.
Age range Frequency Percent <20 20 23%
20-25 67 77% Total 87 100%
Gender
Youth comprise the only sub-population where the rates of males and females are almost equal. Additional research is suggested to determine the duration and reasons for this phenomenon.
Gender Frequency PercentMale 48 57.8%
Female 35 42.2%Total 83 100%
Income range
Compared to the adult homeless population, youth have fewer financial resources. The sources of income they report include public assistance, including Social Security Disability income, for which they or their children are eligible.
Income range Frequency Percent None 64 74.4%
1,000-10,000 17 19.8% 11,000-20,000 2 2.3% 21,000-30,000 3 3.5%
Total 86 100%
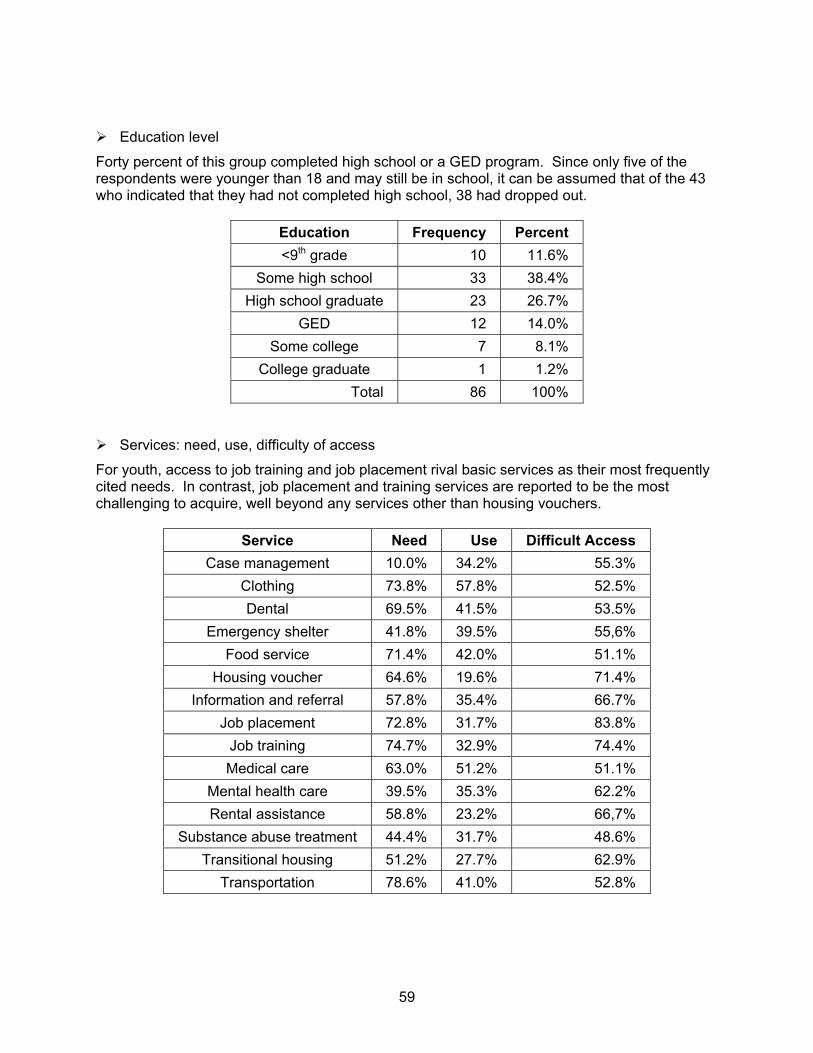
59
Education level
Forty percent of this group completed high school or a GED program. Since only five of the respondents were younger than 18 and may still be in school, it can be assumed that of the 43 who indicated that they had not completed high school, 38 had dropped out.
Education Frequency Percent <9th grade 10 11.6%
Some high school 33 38.4% High school graduate 23 26.7%
GED 12 14.0% Some college 7 8.1%
College graduate 1 1.2% Total 86 100%
Services: need, use, difficulty of access
For youth, access to job training and job placement rival basic services as their most frequently cited needs. In contrast, job placement and training services are reported to be the most challenging to acquire, well beyond any services other than housing vouchers.
Service Need Use Difficult Access Case management 10.0% 34.2% 55.3%
Clothing 73.8% 57.8% 52.5% Dental 69.5% 41.5% 53.5%
Emergency shelter 41.8% 39.5% 55,6% Food service 71.4% 42.0% 51.1%
Housing voucher 64.6% 19.6% 71.4% Information and referral 57.8% 35.4% 66.7%
Job placement 72.8% 31.7% 83.8% Job training 74.7% 32.9% 74.4% Medical care 63.0% 51.2% 51.1%
Mental health care 39.5% 35.3% 62.2% Rental assistance 58.8% 23.2% 66,7%
Substance abuse treatment 44.4% 31.7% 48.6% Transitional housing 51.2% 27.7% 62.9%
Transportation 78.6% 41.0% 52.8%
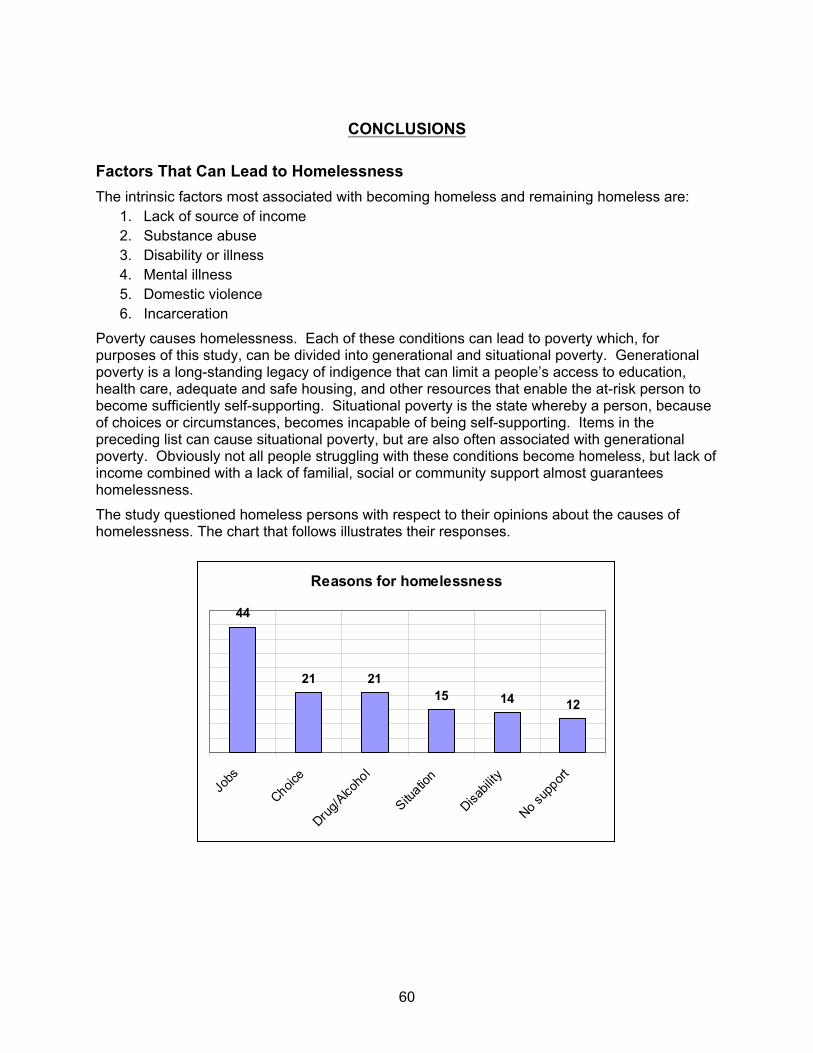
60
CONCLUSIONS
Factors That Can Lead to Homelessness The intrinsic factors most associated with becoming homeless and remaining homeless are:
1. Lack of source of income 2. Substance abuse 3. Disability or illness 4. Mental illness 5. Domestic violence 6. Incarceration
Poverty causes homelessness. Each of these conditions can lead to poverty which, for purposes of this study, can be divided into generational and situational poverty. Generational poverty is a long-standing legacy of indigence that can limit a people’s access to education, health care, adequate and safe housing, and other resources that enable the at-risk person to become sufficiently self-supporting. Situational poverty is the state whereby a person, because of choices or circumstances, becomes incapable of being self-supporting. Items in the preceding list can cause situational poverty, but are also often associated with generational poverty. Obviously not all people struggling with these conditions become homeless, but lack of income combined with a lack of familial, social or community support almost guarantees homelessness.
The study questioned homeless persons with respect to their opinions about the causes of homelessness. The chart that follows illustrates their responses.
Reasons for homelessness
44
21 2115 14 12
Jobs
Choice
Drug/A
lcoho
l
Situatio
n
Disabil
ity
No supp
ort
61
The respondents ranked the lack of a job as the most common reason for persons becoming homeless. The concept of “Choice” is a bit more complex. Within this category, respondents offered several explanations that put the responsibility for their situation on themselves. Typical comments:
“Nobody made me start taking drugs and now I can’t get off. So I am here.”
“I don’t want to be on the streets, but there is no way I’m going into one of those shelters. You aren’t even feel human there. I can’t do that again.”
“It’s real bad out here and I’m sick. But these people around here [in the encampment], I know them and they got my back. You don’t know what can happen in them shelters.”
“When I got divorced, I just walked out and left her everything. My choice. I was too much for her and I knew it. So here I am 12 years later, no house, no job and still drinking.”
That substance abuse can lead to loss of resources, and thus homelessness, is hardly a revelation—the image of the man on ’skid row’ is a cultural archetype. Repeatedly, however, during focus groups and in street interviews, respondents spoke poignantly about the particular devastation caused by addiction to crack cocaine. There was a 75% overlap between people with mental health disorders and substance abuse in this survey, begging the question about the role of self-medication in substance abuse. Further, volumes of data from studies questioning the role of physical and sexual abuse in women’s mental health consistently cite the correlations between abuse and addictions in women.
“You don’t know how depressed I was. I didn’t care and I wanted to die and I started getting high. It was great and I wanted to keep that and I did. What did I have to lose?”
“I’ve been on the streets since I was 12 and I’m 40 now. I would’ve run away to get away from the abuse, but I didn’t have to. I came home one day and they were gone. My mother and that [expletive] who was with her, both gone. Never saw them again. For most of the time since, ‘til now, ‘til I came here, I was high. And it’s real sad. I mean I was a kid then and got abandoned by my own mom. My own mom and I was a real baby once.”
Severe, untreated mental health disorders, with or without co-occurring substance abuse, can leave a person utterly incapable of managing the exigencies of a job, running a household or simply managing the activities of daily living. For respondents to this study, mental illness was considered a major disabling condition, even more common among them than physical disability.
Nonetheless, there is a myth among the general public that mental health disorders are all treatable and containable and that people struggling with mental illness, especially if homeless, are recalcitrant or malingering. In a focus group for families who are direct or indirect caretakers of mentally ill family, these myths were dispelled.
“First, you gotta figure out that something is really wrong with your son, not just that he’s a delinquent or something. Then you gotta find someone to help him and you gotta be able to pay for whatever treatment they come up with.”
“Every day I live in terror of what will happen to her when we die. I wonder how she will be safe. Have you tried to find housing for someone like her [schizophrenic]? It’s impossible. Please tell people in your report not to forget our children. They don’t want the lives they have—they did nothing to become like this. But I wonder so often what I could have done. Could I have prevented this?”
62
Complicating the ability to cope with and treat mental illness or physical disability is the cost associated with care. As reported here, 11% of the sample lost their last stable residence because of disability. The study also shows that self-reported medical conditions among people who are homeless are truly under-reported, mainly because disparities in access to medical care lead to a lack of diagnosis and treatment.
Further, local studies have shown that more than 800,000 persons in Harris County are uninsured. This, in the county that houses the largest medical center in the world.
“You hear people say that we don’t want to work. Not true. I was injured at my last job and lost my job because of that. Now I have pain all the time and I can’t work. I should have another operation. Yeah, right”
“I’ll tell you what happens when your wife gets sick and you lose everything trying to get her help. She dies and you end up on the street with nothing.”
The “Situation” category encompassed domestic violence, incarceration and more vague notions, such as “life is just hard” or “it’s just the way it is.” The quotes included in the profiles elucidated the barriers encountered by women who are victims of domestic violence. Though a well-developed system of care is in place for women who have experienced domestic violence, that system remains overburdened.
“I am in this program and this is the only place I feel safe in. I’ll make it for my kids and because I deserve better. You see over there? She’s my daughter and that baby is my grandbaby. My little girl is only 16 and the baby is two. All here. She got me to come here after she had to get away from the baby’s father and told me to get away, too. We are safe, now.”
“I have been a provider for more than 10 years and the women who come here now are younger and the problems they have are more severe than ever. Some have addictions, there are language barriers, and they are so young. And it’s getting harder to get funding for our programs. The need is not going away, just the resources.”
For persons who have been incarcerated, reintegration can be a path that cannot be walked. Services within prisons have been cut with funding reductions and a system of aftercare to releasees is still in development and in many ways untested.
“I’ve been in and out of prison from the time I was a kid, but this is the first time I have been in a program. Maybe this will help. They care about us here and they don’t let us get away with nothing. But that’s good. I need a job more than anything.”
“You can understand with employers that they don’t want to hire any of us. Hey, I did my time and I’m not going back—not ever going back. But I gotta work and I can work. How many other employees got a parole officer looking over their shoulder at everything they do?”
Whether considering a sub-population or homeless persons as a group, the system of care is over-burdened, under-staffed and under-funded. Options for shelter are limited, and for permanent housing egregiously so. Service provision is often required to be based on exigencies of available funding rather than best practices and, most important, providers are asked to measure success in outcomes that are irrelevant to the realities of their clients lives.
63
A Model to Serve Persons Who Are Homelessness To truly reduce or end homelessness requires a multi-stage approach with refinements within the current continuum of care. The steps involve:
1. Defining the problem to be solved 2. Realistic program planning for clients 3. Support for variable systems of care 4. Implementing evidence-based practice 5. Developing standards of care 6. On-going assessment of the system
Defining the problem to be solved
Creating awareness in the community-at-large about the realities of homelessness is a critical first step in addressing the problem. Public information campaigns rising above the stereotypes that exploit or vilify homeless persons can be developed out of the data from this study and the experience of service providers. It is equally important that the community realize that a goal of permanent housing for all persons, regardless of their drug use, mental status or history of incarceration, is the core assumption if homelessness is to be eliminated. Further, advocates and providers must assist program funders in understanding that there are homeless persons for whom a return to work is an impossibility, and that for some clients lifelong involvement with the system of care is a success.
Realistic program planning for clients
Providers of services to homeless persons have long reported that most of their resources are spent on people who are chronically homeless and that the outcomes expected for these clients—re-employment and consistent housing—are virtually impossible to achieve within the current system of care. Further, there are clients who are episodically homeless, vacillating between relative stability and crisis. Serving these groups leaves few resources for prevention or assessment of outcomes, and for caring for those who are newly, temporarily homeless.
Based on the findings of this study, on the experience of providers and on the professional literature, it is apparent that the system of care could be more effective if it truly acknowledged and accommodated the variations in need and resources that clients present. It is important to note that in the proposed model it is not expected that clients course through the categories. Rather, with effective assessment, it becomes clear which system of care can best benefit them. Regardless of the sub-population that clients represent, they can be grouped into three main categories based on the level of interface with systems of service that they require:
Extensive care Ongoing assistance Temporary assistance
64
Extensive care
This group is composed of individuals who are seriously compromised by severe mental illness, intractable substance abuse or mental retardation. Most are chronically homeless and are those clients who, in the past, were typically institutionalized. Based on this study and the experience of providers, it is estimated that this group makes up about 35% (n=4,200) of the homeless population. Services to this group must be lifelong and highly structured, with clients closely monitored. The goal for these clients is that they are assisted in sustaining safe, secure housing within a system of care. Clients in this group are those served by ‘Safe Haven’ programs, such as that administered by MHMRA.
On-going assistance
For this group, contact with a system of care will be for variable lengths of time at different intervals, but it will likely be long-term, if not lifelong. These are persons with mental illness or substance abuse histories who are willing to participate, and capable of participating in treatment and who, if afforded supportive services related to employment and/or housing, can maintain both. They may be able to leave the components of the system of care for a period of time, but will remain more stable if at least case management is maintained. It is estimated that this group represents about 55% (n=6,600) of the population. Clients of the DeGeorge program administered by the VA, fall into this category.
Temporary assistance
People in this group have most often become homeless because of short-term financial crises—loss of job, for example—but have the capacity to marshal sufficient resources and, with assistance, can re-establish their financial viability within about 12-18 months. They comprise about 10% (n=1,200) of homeless persons, and are served by programs such as the Zip Code Ministries (ZCAM) that provide rental assistance, utility payments and basic needs in the short term.
Support for variable systems of care
A model for ending homelessness must: 1) assess and strengthen the infrastructure; 2) provide for interventions for at-risk persons; and 3) provide the appropriate level of care for those who are already homeless. The graphic below illustrates the model and includes an explanation of each component (see page 67).
The model assumes that a client can progress, through a system of care appropriate to his or her resources and needs, to permanent housing. The first stage is the Point of Entry. Within this category are those services wherein clients are introduced into the system of care. Examples of points of entry are church programs that serve the indigent outreach programs, targeted both to those who are homeless as well as those at risk for homelessness. Regardless of the venue for entry into the system, the primary goal is immediate housing or shelter. Sites include emergency shelters, transitional programs or ’housing first’ facilities, which are subsidized rooms or apartments that include case management, but do not require that clients be participants in a formal treatment or intervention program.
65
Once housed, persons are provided with a ’support packet’ that includes Medicaid or Gold Card (Harris County Hospital District service card) as eligibility dictates, an identification card if needed, a long-term bus pass for use in the local transit system, and whatever other service eligibility documentation is necessary. When stabilized and willing, the client is then assessed with both a standardized instrument that conforms to the fields in the HMIS (Homeless Management Information System) and specialized assessments related to service needs.
At this point, the client can be referred to the service structure that is most appropriate. As with any such model, this one seems to suggest an elegant and orderly process; however, that is rarely seen in the real-life provision of services. More likely, clients will be identified and, if the housing resource base is expanded, will be housed and followed with case management. Depending on the client’s motivation and resources, he or she may manage to stay housed. The measure of an effective continuum of care is the degree to which client resources and competencies are enhanced or supported at a level that enables clients to obtain, maintain and sustain permanent, safe and secure housing.
Implementing evidence-based practices
No matter how well defined a model for service provision might be, it is nothing more than a possible guide. What changes the lives of homeless persons is amelioration of poverty and the concomitant circumstances that lead to it. That occurs only if a person can gather sufficient personal, financial and relational resources. The role of the service system is to assist the client in gathering those resources.
Throughout the study, homeless persons reiterated that the most critical element in their ability to gain access to and effectively use services was the quality of the relationship that they were able to form with providers. That is the art and humanity of service provision. The science of service provision involves strategic planning, resource monitoring and implementation of practices that have been documented as successful with a given population, and in a given context. Too often, providers are forced to plan services based on what might get funded, which may or may not fit their core competencies or the needs of clients. A potentially more efficacious strategy involves:
1. Developing programs based on a. A theory of behavior or population change b. Agency experience c. Documented client need d. Client satisfaction e. Employee competence and satisfaction
2. Enhancing staff capacity to implement the programs 3. Defining and monitoring outcomes that identify success 4. Developing and adhering to a business plan that assures sustainability of the agency
66
Developing standards of care
To assure a level of care across agencies, a collaboration of service providers under the direction of the Coalition for the Homeless can create standards of care for all the major services, shelter and housing programs that serve homeless persons. The degree to which agencies within the Continuum of Care are invited or required to adhere to the standards will be the decision of providers and funders.
On-going assessment
Once standards are accepted, the community of providers can undertake outcome assessment to document the effectiveness of their services and enhance program planning. Evaluation can be conducted with minimal burden to providers by working with the data in HMIS and collecting and analyzing data submitted in the context of the annual response to the HUD Continuum of Care grant.
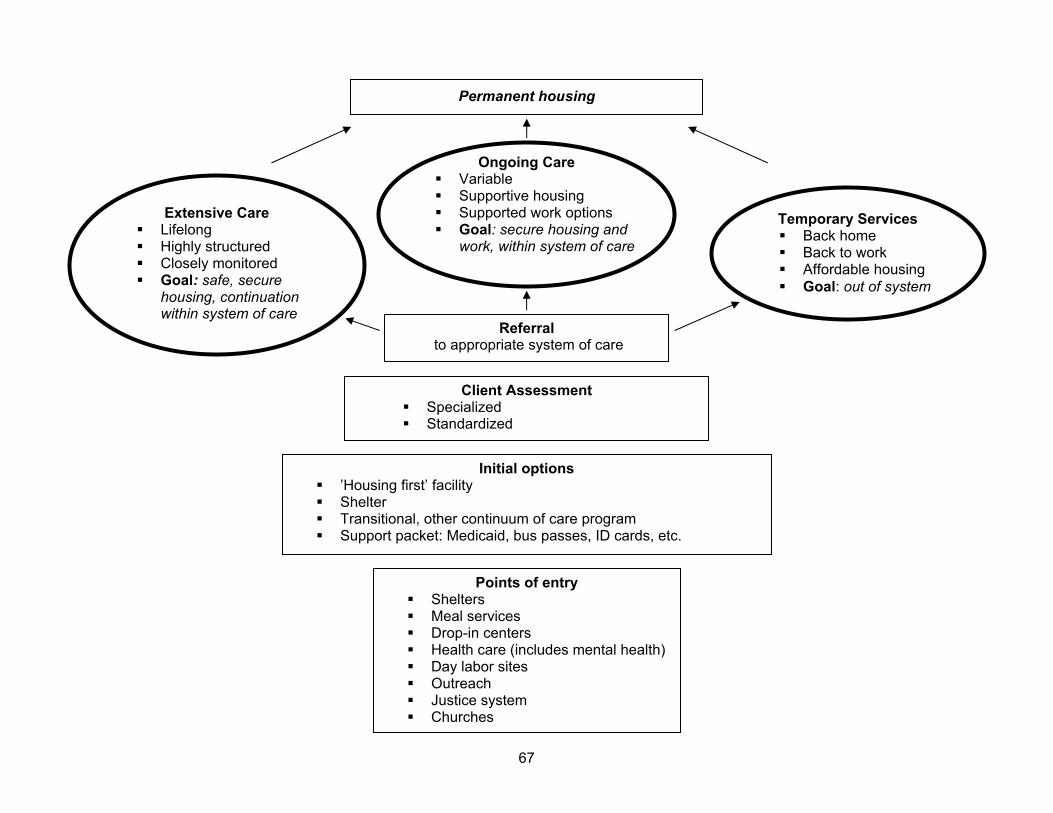
67
Extensive Care Lifelong Highly structured Closely monitored Goal: safe, secure
housing, continuation within system of care
Ongoing Care Variable Supportive housing Supported work options Goal: secure housing and
work, within system of care
Temporary Services Back home Back to work Affordable housing Goal: out of system
Points of entry Shelters Meal services Drop-in centers Health care (includes mental health) Day labor sites Outreach Justice system Churches
Permanent housing
Client Assessment Specialized Standardized
Referral to appropriate system of care
Initial options ’Housing first’ facility Shelter Transitional, other continuum of care program Support packet: Medicaid, bus passes, ID cards, etc.
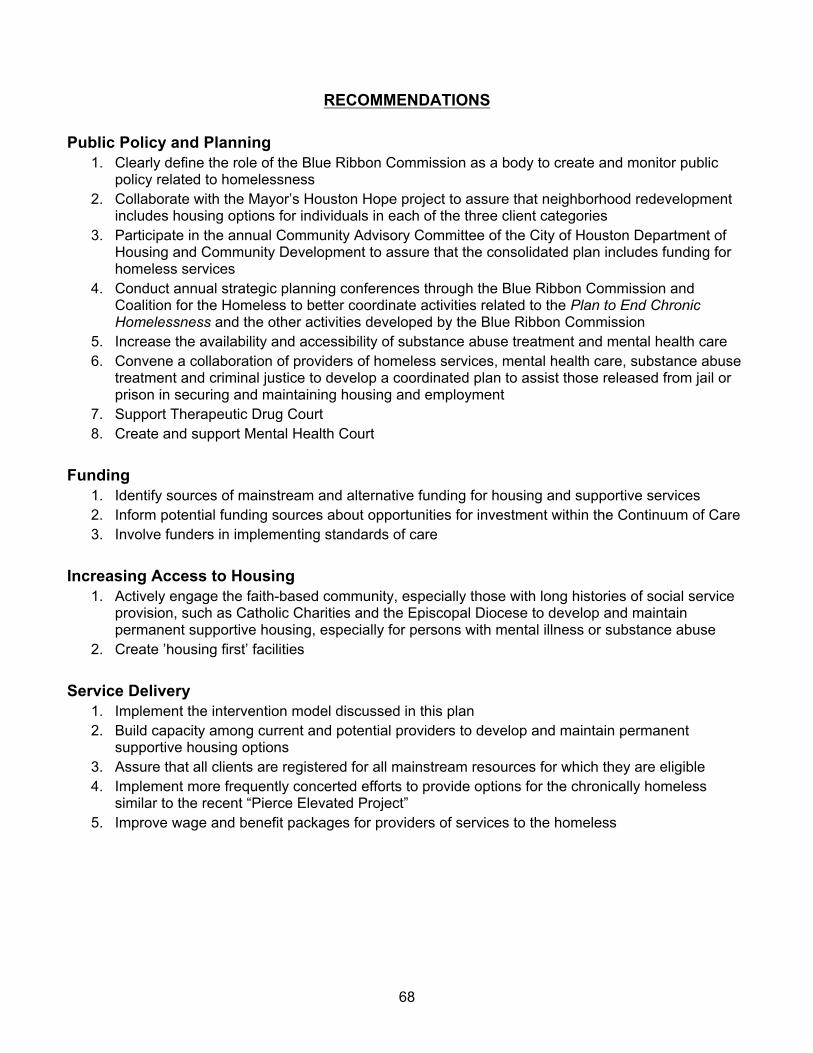
68
RECOMMENDATIONS
Public Policy and Planning 1. Clearly define the role of the Blue Ribbon Commission as a body to create and monitor public
policy related to homelessness 2. Collaborate with the Mayor’s Houston Hope project to assure that neighborhood redevelopment
includes housing options for individuals in each of the three client categories 3. Participate in the annual Community Advisory Committee of the City of Houston Department of
Housing and Community Development to assure that the consolidated plan includes funding for homeless services
4. Conduct annual strategic planning conferences through the Blue Ribbon Commission and Coalition for the Homeless to better coordinate activities related to the Plan to End Chronic Homelessness and the other activities developed by the Blue Ribbon Commission
5. Increase the availability and accessibility of substance abuse treatment and mental health care 6. Convene a collaboration of providers of homeless services, mental health care, substance abuse
treatment and criminal justice to develop a coordinated plan to assist those released from jail or prison in securing and maintaining housing and employment
7. Support Therapeutic Drug Court 8. Create and support Mental Health Court
Funding 1. Identify sources of mainstream and alternative funding for housing and supportive services 2. Inform potential funding sources about opportunities for investment within the Continuum of Care 3. Involve funders in implementing standards of care
Increasing Access to Housing 1. Actively engage the faith-based community, especially those with long histories of social service
provision, such as Catholic Charities and the Episcopal Diocese to develop and maintain permanent supportive housing, especially for persons with mental illness or substance abuse
2. Create ’housing first’ facilities
Service Delivery 1. Implement the intervention model discussed in this plan 2. Build capacity among current and potential providers to develop and maintain permanent
supportive housing options 3. Assure that all clients are registered for all mainstream resources for which they are eligible 4. Implement more frequently concerted efforts to provide options for the chronically homeless
similar to the recent “Pierce Elevated Project” 5. Improve wage and benefit packages for providers of services to the homeless

69
References i Consolidated Plan and Fair Housing data from Survey 1 are available through the City of Houston Department of Housing and Community Development and through the University of Houston, Graduate School of Social Work, Office of Community Projects. ii Healthcare for the Homeless–Houston, 2004 Needs Assessment
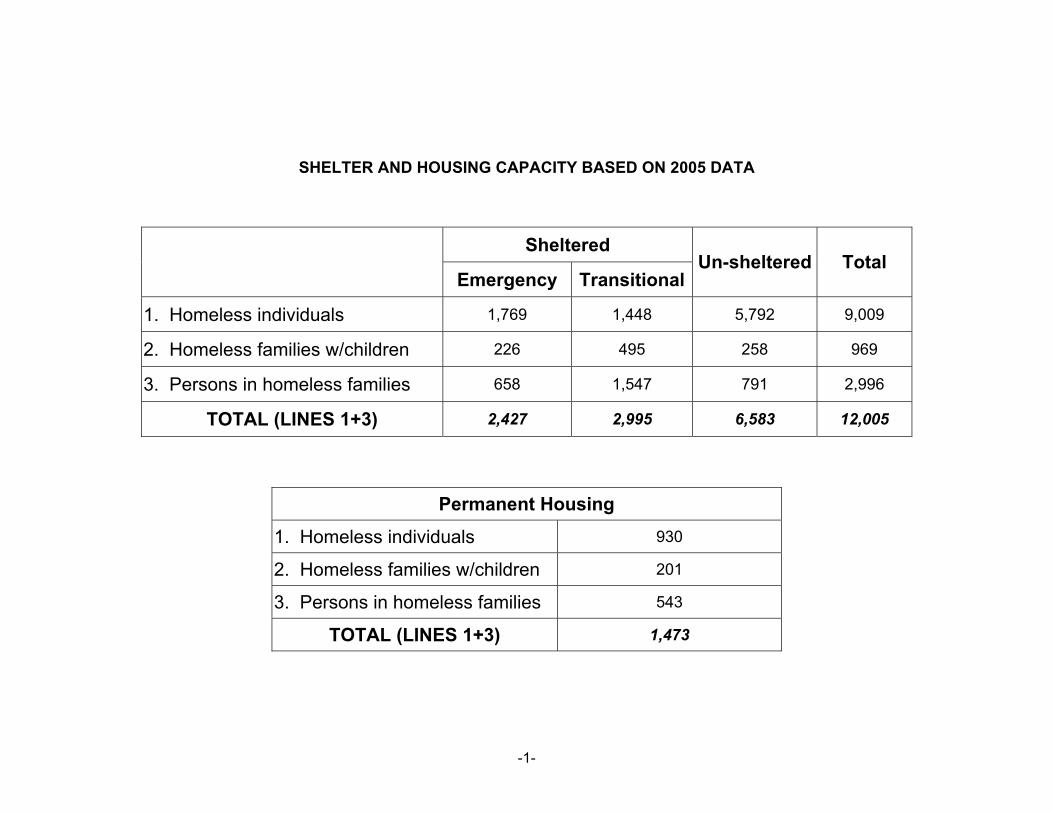
-1-
SHELTER AND HOUSING CAPACITY BASED ON 2005 DATA
Sheltered
Emergency TransitionalUn-sheltered Total
1. Homeless individuals 1,769 1,448 5,792 9,009
2. Homeless families w/children 226 495 258 969
3. Persons in homeless families 658 1,547 791 2,996
TOTAL (LINES 1+3) 2,427 2,995 6,583 12,005
Permanent Housing
1. Homeless individuals 930
2. Homeless families w/children 201
3. Persons in homeless families 543
TOTAL (LINES 1+3) 1,473

-2-
GAP ANALYSIS BASED ON 2005 DATA
Family Units
Family Beds
Individual Beds Total %
Emergency shelter 78 236 3,185 3,421 36.2%
Transitional Housing 185 555 2,607 3,161 33.5%
Permanent Housing 276 830 2,027 2,857 30.3%
TOTAL 539 1,621 7,819 9,439 100.0%
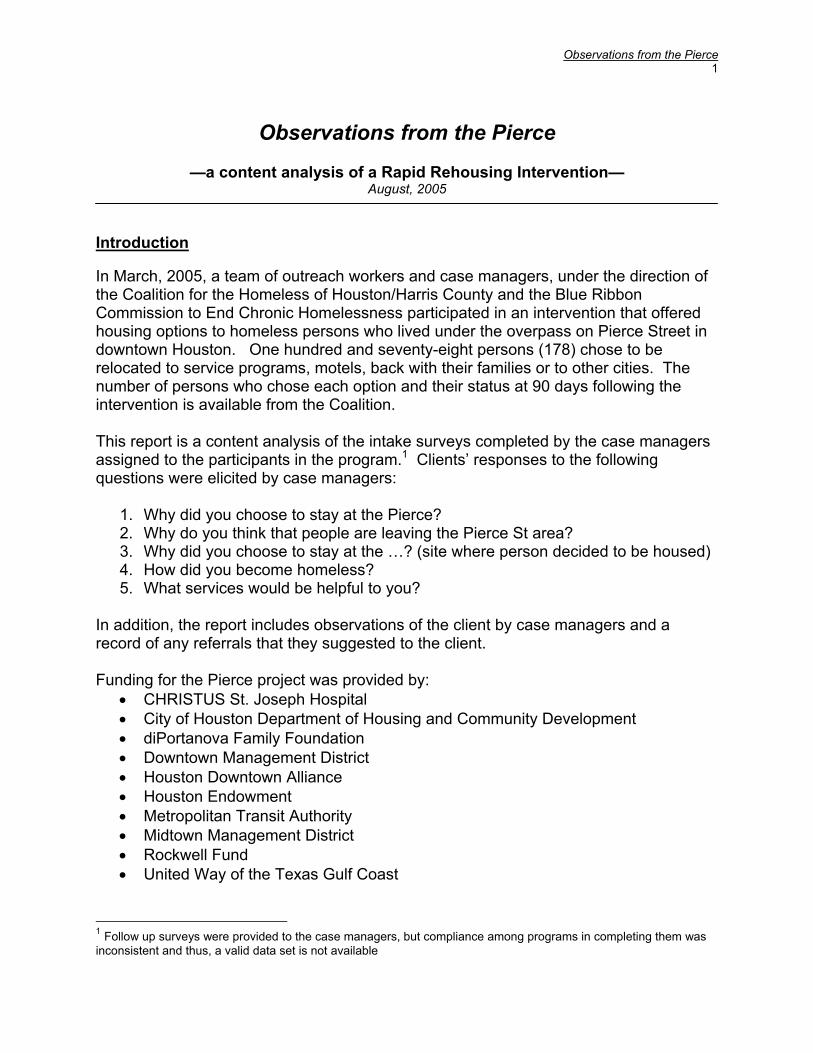
Observations from the Pierce 1
Observations from the Pierce
—a content analysis of a Rapid Rehousing Intervention—
August, 2005 Introduction In March, 2005, a team of outreach workers and case managers, under the direction of the Coalition for the Homeless of Houston/Harris County and the Blue Ribbon Commission to End Chronic Homelessness participated in an intervention that offered housing options to homeless persons who lived under the overpass on Pierce Street in downtown Houston. One hundred and seventy-eight persons (178) chose to be relocated to service programs, motels, back with their families or to other cities. The number of persons who chose each option and their status at 90 days following the intervention is available from the Coalition. This report is a content analysis of the intake surveys completed by the case managers assigned to the participants in the program.1 Clients’ responses to the following questions were elicited by case managers:
1. Why did you choose to stay at the Pierce? 2. Why do you think that people are leaving the Pierce St area? 3. Why did you choose to stay at the …? (site where person decided to be housed) 4. How did you become homeless? 5. What services would be helpful to you?
In addition, the report includes observations of the client by case managers and a record of any referrals that they suggested to the client. Funding for the Pierce project was provided by:
• CHRISTUS St. Joseph Hospital • City of Houston Department of Housing and Community Development • diPortanova Family Foundation • Downtown Management District • Houston Downtown Alliance • Houston Endowment • Metropolitan Transit Authority • Midtown Management District • Rockwell Fund • United Way of the Texas Gulf Coast
1 Follow up surveys were provided to the case managers, but compliance among programs in completing them was inconsistent and thus, a valid data set is not available
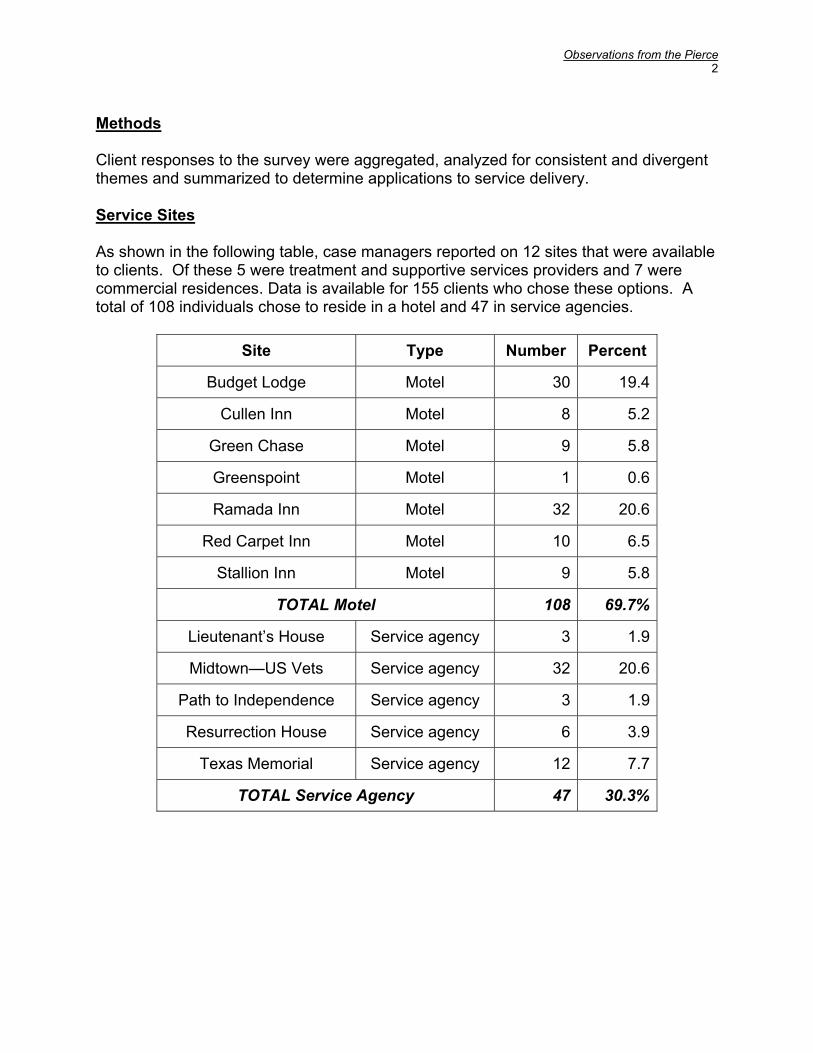
Observations from the Pierce 2
Methods Client responses to the survey were aggregated, analyzed for consistent and divergent themes and summarized to determine applications to service delivery. Service Sites As shown in the following table, case managers reported on 12 sites that were available to clients. Of these 5 were treatment and supportive services providers and 7 were commercial residences. Data is available for 155 clients who chose these options. A total of 108 individuals chose to reside in a hotel and 47 in service agencies.
Site Type Number Percent
Budget Lodge Motel 30 19.4
Cullen Inn Motel 8 5.2
Green Chase Motel 9 5.8
Greenspoint Motel 1 0.6
Ramada Inn Motel 32 20.6
Red Carpet Inn Motel 10 6.5
Stallion Inn Motel 9 5.8
TOTAL Motel 108 69.7%
Lieutenant’s House Service agency 3 1.9
Midtown—US Vets Service agency 32 20.6
Path to Independence Service agency 3 1.9
Resurrection House Service agency 6 3.9
Texas Memorial Service agency 12 7.7
TOTAL Service Agency 47 30.3%
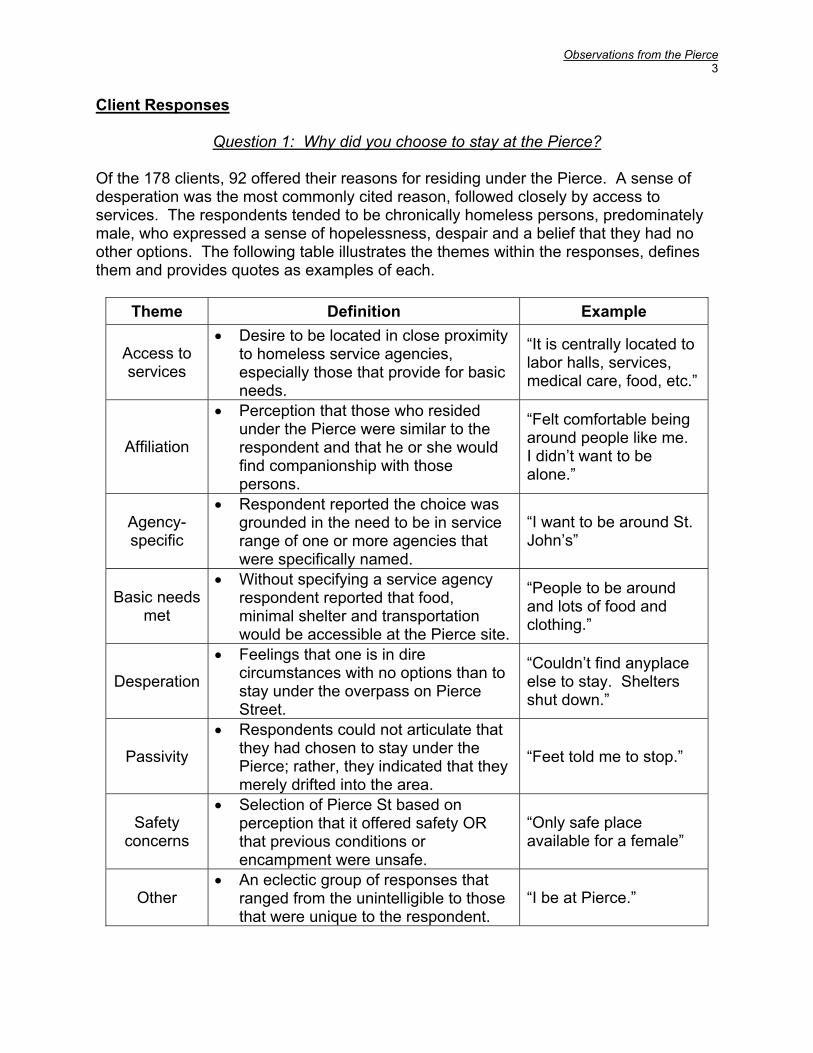
Observations from the Pierce 3
Client Responses
Question 1: Why did you choose to stay at the Pierce?
Of the 178 clients, 92 offered their reasons for residing under the Pierce. A sense of desperation was the most commonly cited reason, followed closely by access to services. The respondents tended to be chronically homeless persons, predominately male, who expressed a sense of hopelessness, despair and a belief that they had no other options. The following table illustrates the themes within the responses, defines them and provides quotes as examples of each.
Theme Definition Example
Access to services
• Desire to be located in close proximity to homeless service agencies, especially those that provide for basic needs.
“It is centrally located to labor halls, services, medical care, food, etc.”
Affiliation
• Perception that those who resided under the Pierce were similar to the respondent and that he or she would find companionship with those persons.
“Felt comfortable being around people like me. I didn’t want to be alone.”
Agency-specific
• Respondent reported the choice was grounded in the need to be in service range of one or more agencies that were specifically named.
“I want to be around St. John’s”
Basic needs met
• Without specifying a service agency respondent reported that food, minimal shelter and transportation would be accessible at the Pierce site.
“People to be around and lots of food and clothing.”
Desperation
• Feelings that one is in dire circumstances with no options than to stay under the overpass on Pierce Street.
“Couldn’t find anyplace else to stay. Shelters shut down.”
Passivity
• Respondents could not articulate that they had chosen to stay under the Pierce; rather, they indicated that they merely drifted into the area.
“Feet told me to stop.”
Safety concerns
• Selection of Pierce St based on perception that it offered safety OR that previous conditions or encampment were unsafe.
“Only safe place available for a female”
Other • An eclectic group of responses that
ranged from the unintelligible to those that were unique to the respondent.
“I be at Pierce.”
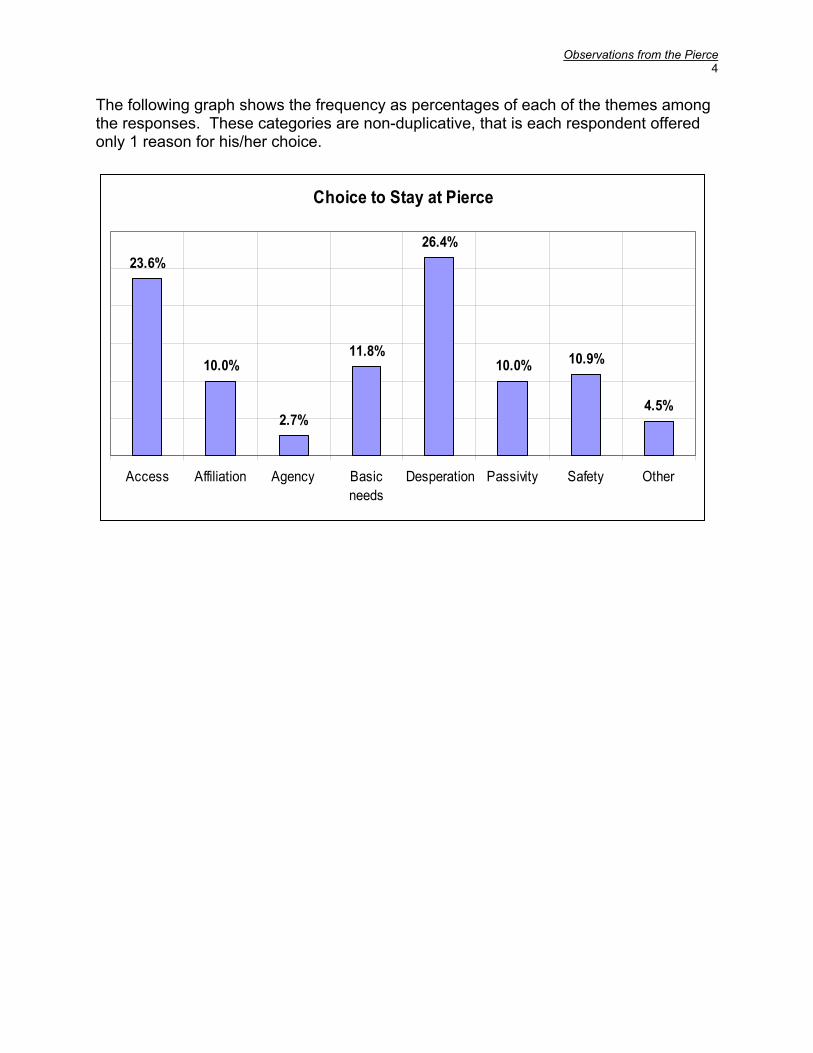
Observations from the Pierce 4
The following graph shows the frequency as percentages of each of the themes among the responses. These categories are non-duplicative, that is each respondent offered only 1 reason for his/her choice.
Choice to Stay at Pierce
23.6%
10.0%
2.7%
11.8%
26.4%
10.0% 10.9%
4.5%
Access Affiliation Agency Basicneeds
Desperation Passivity Safety Other
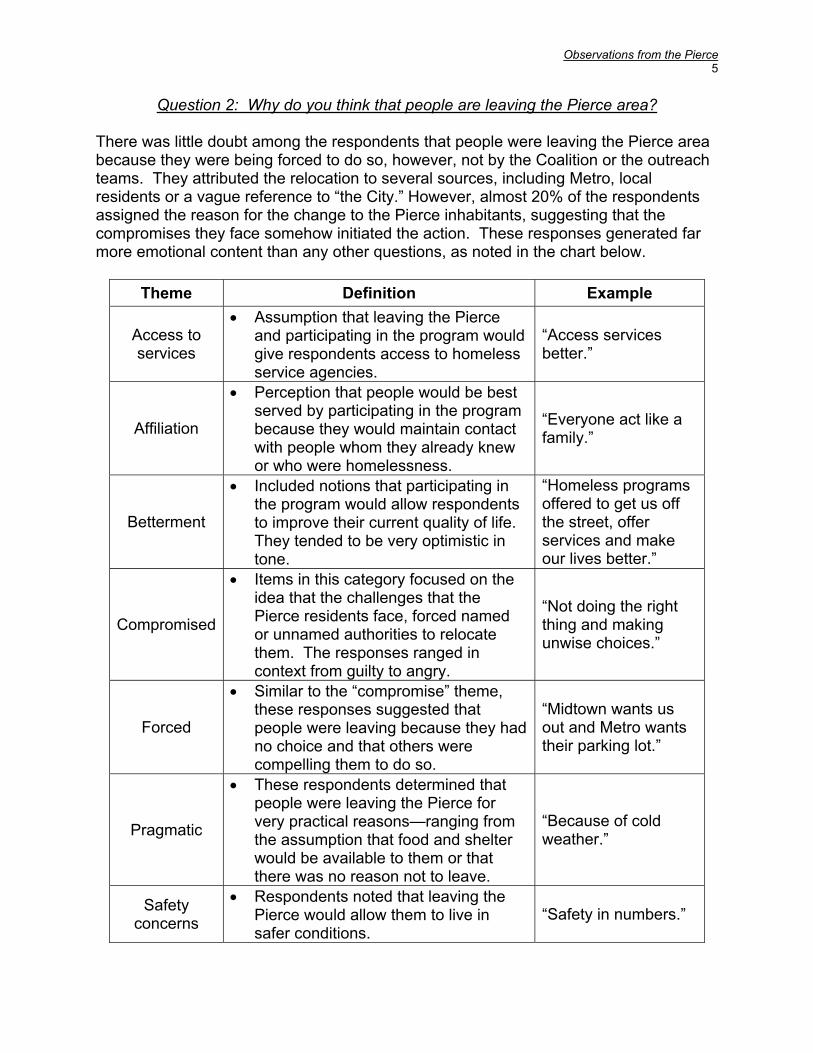
Observations from the Pierce 5
Question 2: Why do you think that people are leaving the Pierce area? There was little doubt among the respondents that people were leaving the Pierce area because they were being forced to do so, however, not by the Coalition or the outreach teams. They attributed the relocation to several sources, including Metro, local residents or a vague reference to “the City.” However, almost 20% of the respondents assigned the reason for the change to the Pierce inhabitants, suggesting that the compromises they face somehow initiated the action. These responses generated far more emotional content than any other questions, as noted in the chart below.
Theme Definition Example
Access to services
• Assumption that leaving the Pierce and participating in the program would give respondents access to homeless service agencies.
“Access services better.”
Affiliation
• Perception that people would be best served by participating in the program because they would maintain contact with people whom they already knew or who were homelessness.
“Everyone act like a family.”
Betterment
• Included notions that participating in the program would allow respondents to improve their current quality of life. They tended to be very optimistic in tone.
“Homeless programs offered to get us off the street, offer services and make our lives better.”
Compromised
• Items in this category focused on the idea that the challenges that the Pierce residents face, forced named or unnamed authorities to relocate them. The responses ranged in context from guilty to angry.
“Not doing the right thing and making unwise choices.”
Forced
• Similar to the “compromise” theme, these responses suggested that people were leaving because they had no choice and that others were compelling them to do so.
“Midtown wants us out and Metro wants their parking lot.”
Pragmatic
• These respondents determined that people were leaving the Pierce for very practical reasons—ranging from the assumption that food and shelter would be available to them or that there was no reason not to leave.
“Because of cold weather.”
Safety concerns
• Respondents noted that leaving the Pierce would allow them to live in safer conditions.
“Safety in numbers.”
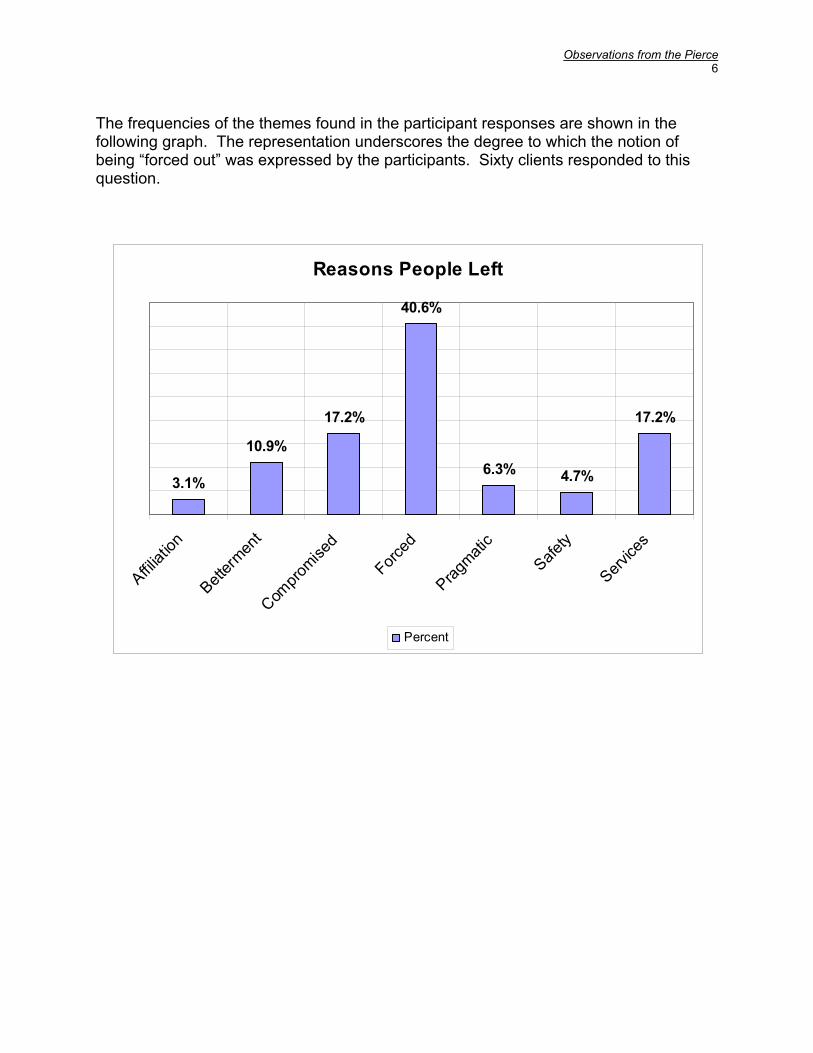
Observations from the Pierce 6
The frequencies of the themes found in the participant responses are shown in the following graph. The representation underscores the degree to which the notion of being “forced out” was expressed by the participants. Sixty clients responded to this question.
Reasons People Left
3.1%
10.9%
17.2%
40.6%
6.3% 4.7%
17.2%
Affiliat
ion
Betterm
ent
Compro
mised
Forced
Pragmati
cSafe
ty
Service
s
Percent
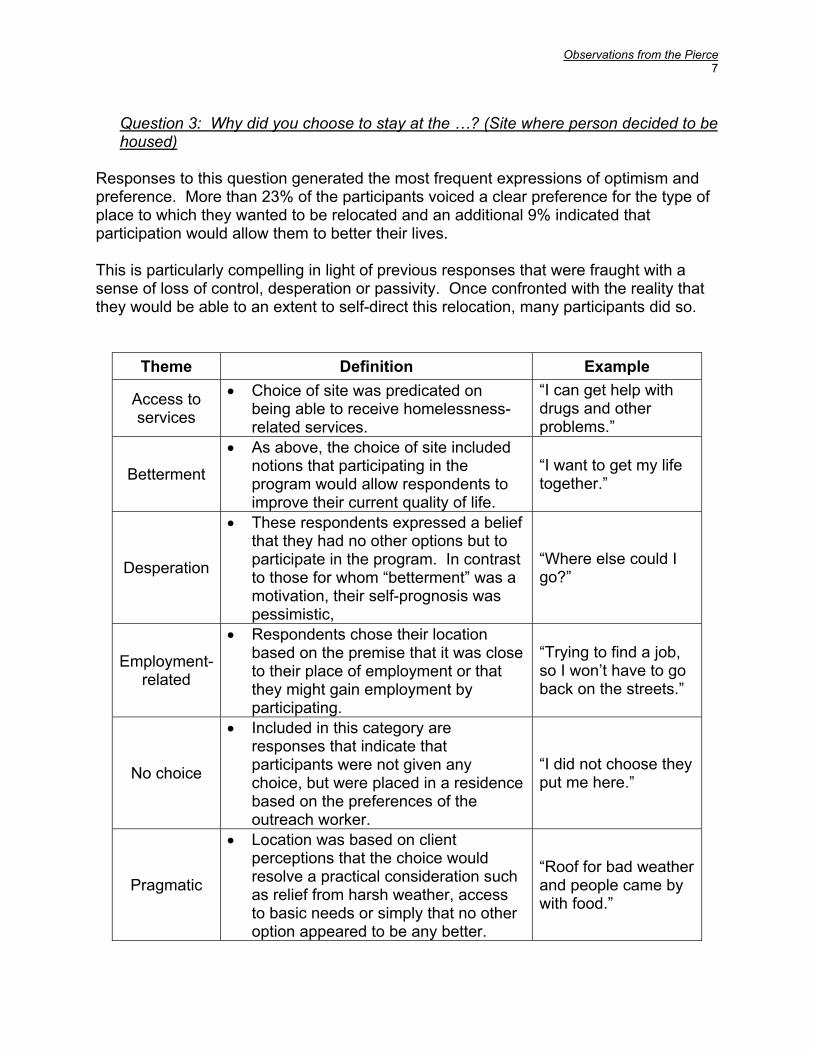
Observations from the Pierce 7
Question 3: Why did you choose to stay at the …? (Site where person decided to be housed)
Responses to this question generated the most frequent expressions of optimism and preference. More than 23% of the participants voiced a clear preference for the type of place to which they wanted to be relocated and an additional 9% indicated that participation would allow them to better their lives. This is particularly compelling in light of previous responses that were fraught with a sense of loss of control, desperation or passivity. Once confronted with the reality that they would be able to an extent to self-direct this relocation, many participants did so.
Theme Definition Example
Access to services
• Choice of site was predicated on being able to receive homelessness-related services.
“I can get help with drugs and other problems.”
Betterment
• As above, the choice of site included notions that participating in the program would allow respondents to improve their current quality of life.
“I want to get my life together.”
Desperation
• These respondents expressed a belief that they had no other options but to participate in the program. In contrast to those for whom “betterment” was a motivation, their self-prognosis was pessimistic,
“Where else could I go?”
Employment-
related
• Respondents chose their location based on the premise that it was close to their place of employment or that they might gain employment by participating.
“Trying to find a job, so I won’t have to go back on the streets.”
No choice
• Included in this category are responses that indicate that participants were not given any choice, but were placed in a residence based on the preferences of the outreach worker.
“I did not choose they put me here.”
Pragmatic
• Location was based on client perceptions that the choice would resolve a practical consideration such as relief from harsh weather, access to basic needs or simply that no other option appeared to be any better.
“Roof for bad weather and people came by with food.”
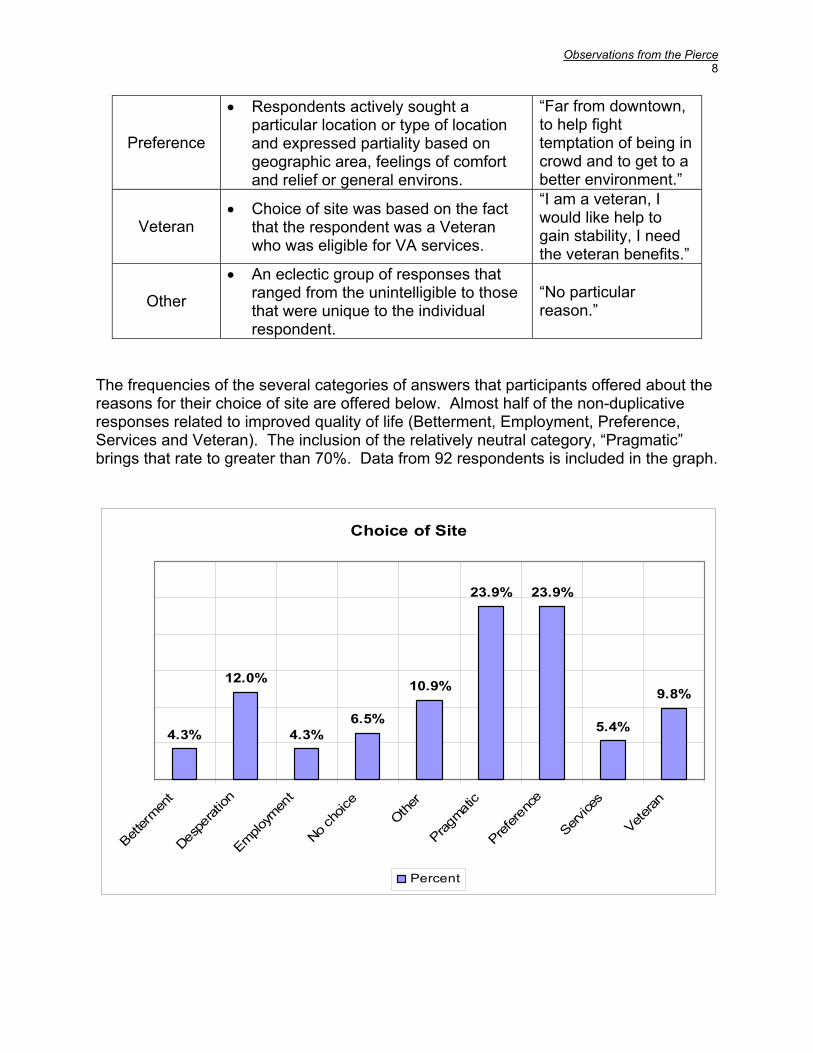
Observations from the Pierce 8
Preference
• Respondents actively sought a particular location or type of location and expressed partiality based on geographic area, feelings of comfort and relief or general environs.
“Far from downtown, to help fight temptation of being in crowd and to get to a better environment.”
Veteran • Choice of site was based on the fact
that the respondent was a Veteran who was eligible for VA services.
“I am a veteran, I would like help to gain stability, I need the veteran benefits.”
Other
• An eclectic group of responses that ranged from the unintelligible to those that were unique to the individual respondent.
“No particular reason.”
The frequencies of the several categories of answers that participants offered about the reasons for their choice of site are offered below. Almost half of the non-duplicative responses related to improved quality of life (Betterment, Employment, Preference, Services and Veteran). The inclusion of the relatively neutral category, “Pragmatic” brings that rate to greater than 70%. Data from 92 respondents is included in the graph.
Choice of Site
4.3%
12.0%
4.3%6.5%
10.9%
23.9% 23.9%
5.4%
9.8%
Better
ment
Despe
ration
Employm
ent
No cho
iceOthe
r
Pragmati
c
Prefere
nce
Service
s
Veteran
Percent
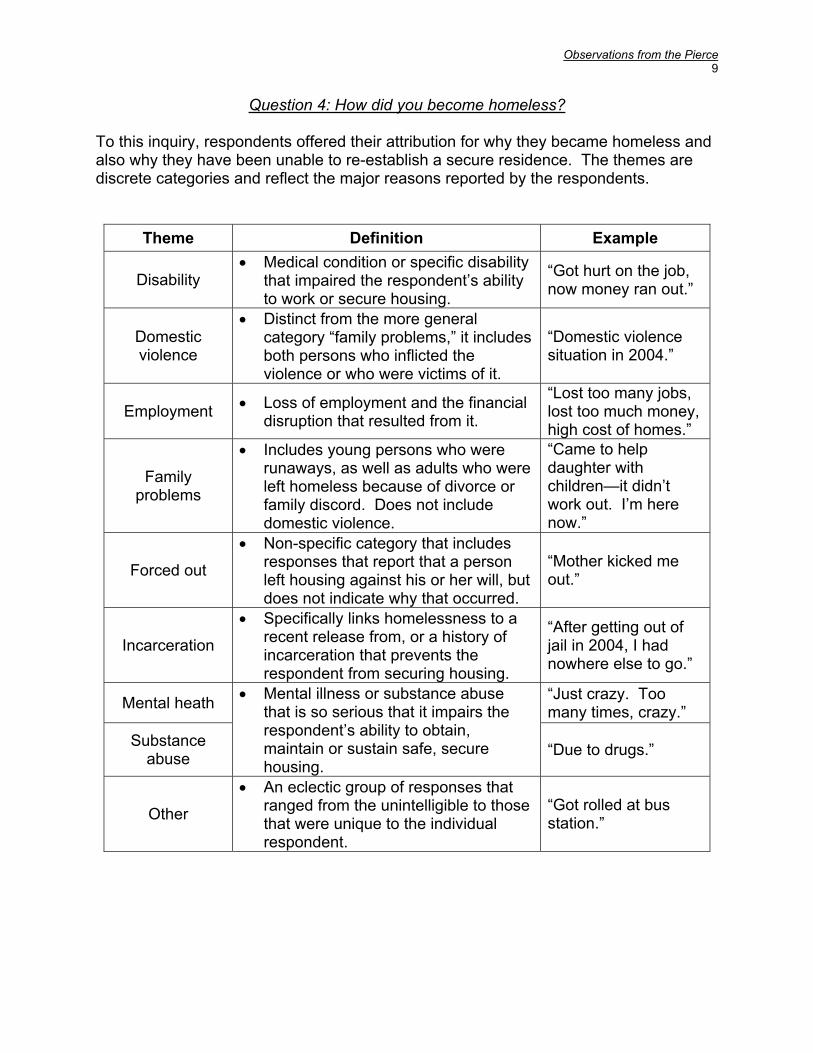
Observations from the Pierce 9
Question 4: How did you become homeless? To this inquiry, respondents offered their attribution for why they became homeless and also why they have been unable to re-establish a secure residence. The themes are discrete categories and reflect the major reasons reported by the respondents.
Theme Definition Example
Disability • Medical condition or specific disability
that impaired the respondent’s ability to work or secure housing.
“Got hurt on the job, now money ran out.”
Domestic violence
• Distinct from the more general category “family problems,” it includes both persons who inflicted the violence or who were victims of it.
“Domestic violence situation in 2004.”
Employment • Loss of employment and the financial disruption that resulted from it.
“Lost too many jobs, lost too much money, high cost of homes.”
Family problems
• Includes young persons who were runaways, as well as adults who were left homeless because of divorce or family discord. Does not include domestic violence.
“Came to help daughter with children—it didn’t work out. I’m here now.”
Forced out
• Non-specific category that includes responses that report that a person left housing against his or her will, but does not indicate why that occurred.
“Mother kicked me out.”
Incarceration
• Specifically links homelessness to a recent release from, or a history of incarceration that prevents the respondent from securing housing.
“After getting out of jail in 2004, I had nowhere else to go.”
Mental heath “Just crazy. Too many times, crazy.”
Substance abuse
• Mental illness or substance abuse that is so serious that it impairs the respondent’s ability to obtain, maintain or sustain safe, secure housing.
“Due to drugs.”
Other
• An eclectic group of responses that ranged from the unintelligible to those that were unique to the individual respondent.
“Got rolled at bus station.”
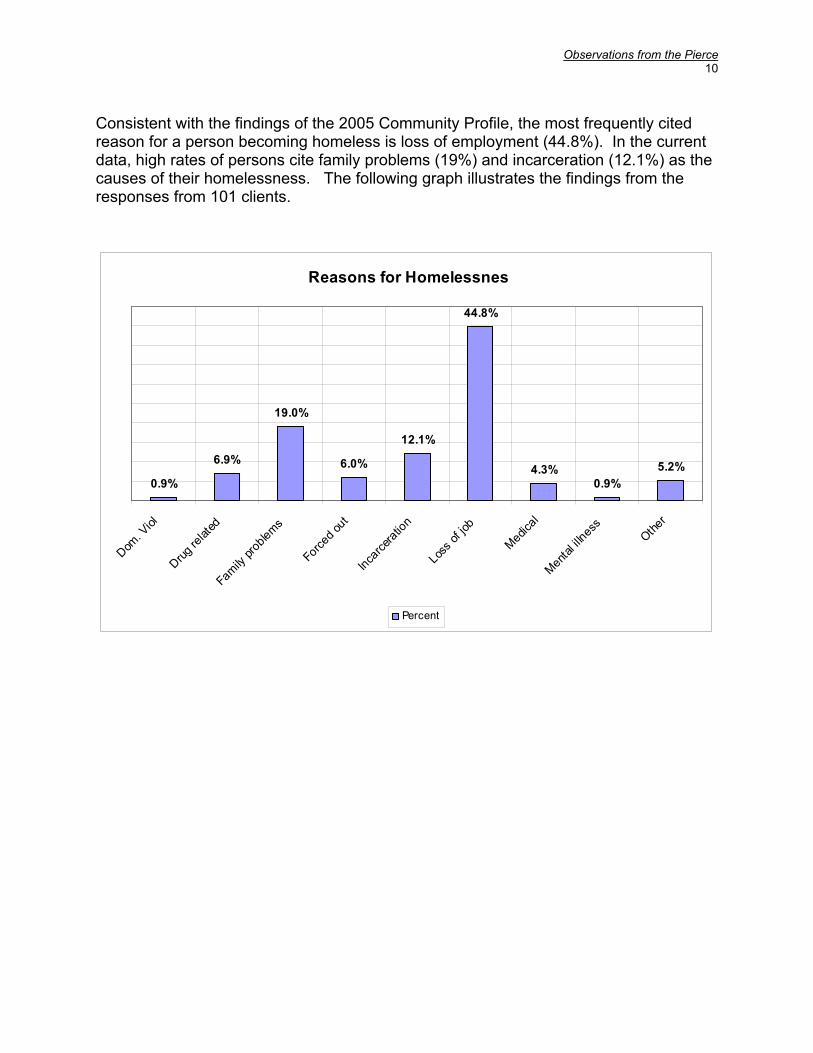
Observations from the Pierce 10
Consistent with the findings of the 2005 Community Profile, the most frequently cited reason for a person becoming homeless is loss of employment (44.8%). In the current data, high rates of persons cite family problems (19%) and incarceration (12.1%) as the causes of their homelessness. The following graph illustrates the findings from the responses from 101 clients.
Reasons for Homelessnes
0.9%
6.9%
19.0%
6.0%
12.1%
44.8%
4.3%0.9%
5.2%
Dom. V
iol
Drug re
lated
Family pro
blems
Forced o
ut
Incarce
ration
Loss o
f job
Medical
Mental il
lnessOthe
r
Percent

Observations from the Pierce 11
Question 5: What services would be helpful to you?
Among the participants only 94 identified services that might be helpful to them. That they are chronically homeless is evident in their request for the most basic services, finding which are consistent with the 2005 Community Profile. Housing is listed far above transitional housing, while emergency shelter is not found among the responses. Needs assessments or surveys conducted among low income and homeless persons in Houston consistently find that bus tokens or transportation are listed in the top five services. This is attributable to the fact that gaining access to the most basic survival services is dependent upon being able to travel to providers. The need for medical care, while a lower percentage than in the Community Profile is ranked higher in this group of respondents, which further identifies the group as chronically homeless and suggests the dire circumstances under which they live.
Service Percent
Bus tokens 59.3%
Housing 39.6%
Medical 38.5%
Clothing 29.7%
Food 27.5%
Job placement 26.4%
Dental care 23.1%
All services 6.6%
GED 6.6%
Mental health treatment 6.6%
Drug/Alcohol treatment 5.5%
Transitional housing 4.4%
Veterans benefits 2.2%
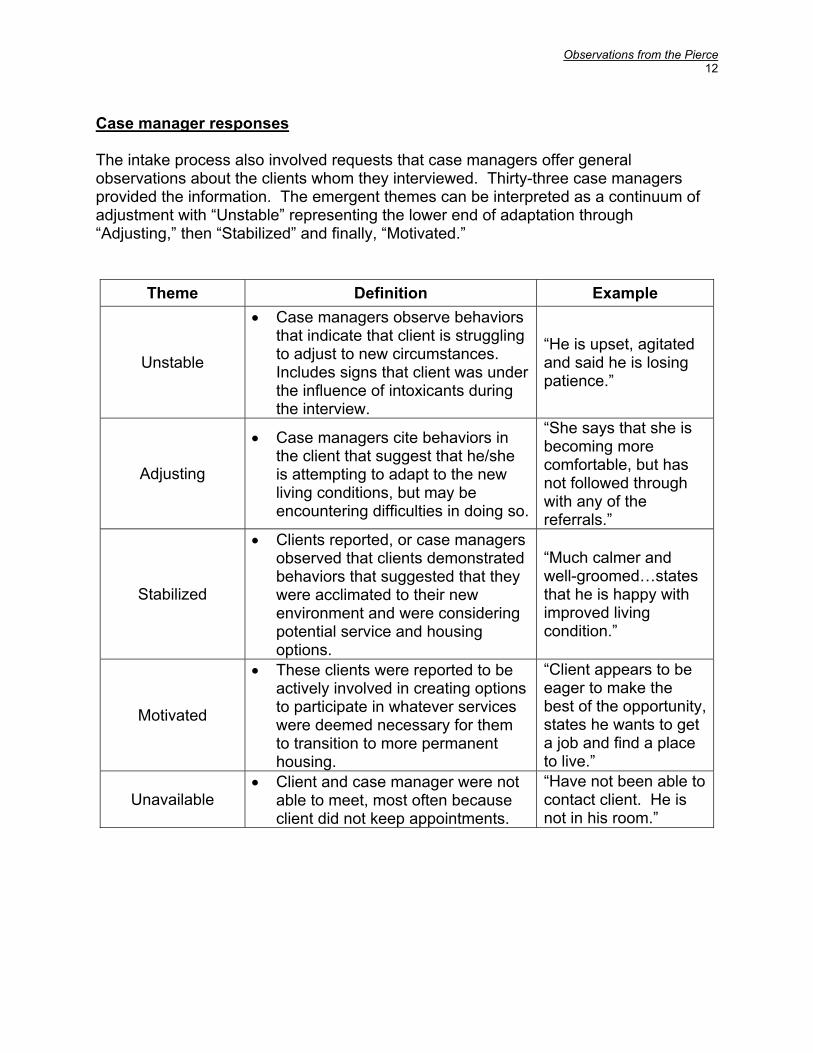
Observations from the Pierce 12
Case manager responses The intake process also involved requests that case managers offer general observations about the clients whom they interviewed. Thirty-three case managers provided the information. The emergent themes can be interpreted as a continuum of adjustment with “Unstable” representing the lower end of adaptation through “Adjusting,” then “Stabilized” and finally, “Motivated.”
Theme Definition Example
Unstable
• Case managers observe behaviors that indicate that client is struggling to adjust to new circumstances. Includes signs that client was under the influence of intoxicants during the interview.
“He is upset, agitated and said he is losing patience.”
Adjusting
• Case managers cite behaviors in the client that suggest that he/she is attempting to adapt to the new living conditions, but may be encountering difficulties in doing so.
“She says that she is becoming more comfortable, but has not followed through with any of the referrals.”
Stabilized
• Clients reported, or case managers observed that clients demonstrated behaviors that suggested that they were acclimated to their new environment and were considering potential service and housing options.
“Much calmer and well-groomed…states that he is happy with improved living condition.”
Motivated
• These clients were reported to be actively involved in creating options to participate in whatever services were deemed necessary for them to transition to more permanent housing.
“Client appears to be eager to make the best of the opportunity, states he wants to get a job and find a place to live.”
Unavailable • Client and case manager were not
able to meet, most often because client did not keep appointments.
“Have not been able to contact client. He is not in his room.”
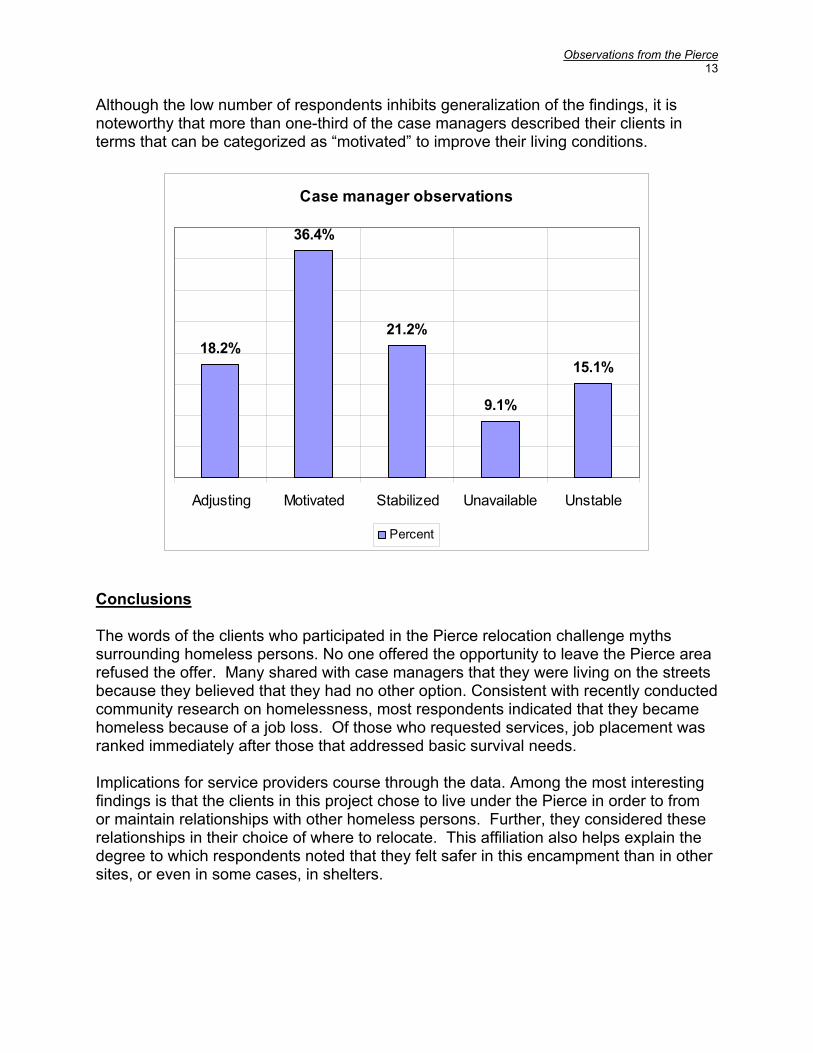
Observations from the Pierce 13
Although the low number of respondents inhibits generalization of the findings, it is noteworthy that more than one-third of the case managers described their clients in terms that can be categorized as “motivated” to improve their living conditions.
Case manager observations
18.2%
36.4%
21.2%
9.1%
15.1%
Adjusting Motivated Stabilized Unavailable Unstable
Percent
Conclusions The words of the clients who participated in the Pierce relocation challenge myths surrounding homeless persons. No one offered the opportunity to leave the Pierce area refused the offer. Many shared with case managers that they were living on the streets because they believed that they had no other option. Consistent with recently conducted community research on homelessness, most respondents indicated that they became homeless because of a job loss. Of those who requested services, job placement was ranked immediately after those that addressed basic survival needs. Implications for service providers course through the data. Among the most interesting findings is that the clients in this project chose to live under the Pierce in order to from or maintain relationships with other homeless persons. Further, they considered these relationships in their choice of where to relocate. This affiliation also helps explain the degree to which respondents noted that they felt safer in this encampment than in other sites, or even in some cases, in shelters.

Observations from the Pierce 14
Of note also, is the degree to which clients reported desperation and passivity so consistent with depression. The presence of depression can greatly hinder the homeless person’s ability to participate in the activities necessary to survival let alone to exit homelessness. This assertion is obviously also true when the client is faced with other mental illnesses, substance abuse or medical disability. Yes despite this, respondents frequently indicated optimism and motivation for self-care. For example, both in their choice of living at the Pierce and in the site for their relocation, many wanted to be located near service agencies, in order to receive assistance not only for basic needs but for treatment for the range of challenges they face. This pilot project offered hope to 178 persons who were chronically homeless. Though most understood that forces beyond their control initiated the need for their relocation, they characterized the intervention by the Coalition as an opportunity to improve their lives. Over time, the repetition of the intervention with the collaboration of service providers and an on-going assessment of the factors critical to engaging and supporting participants in leaving the streets will validate that hope.
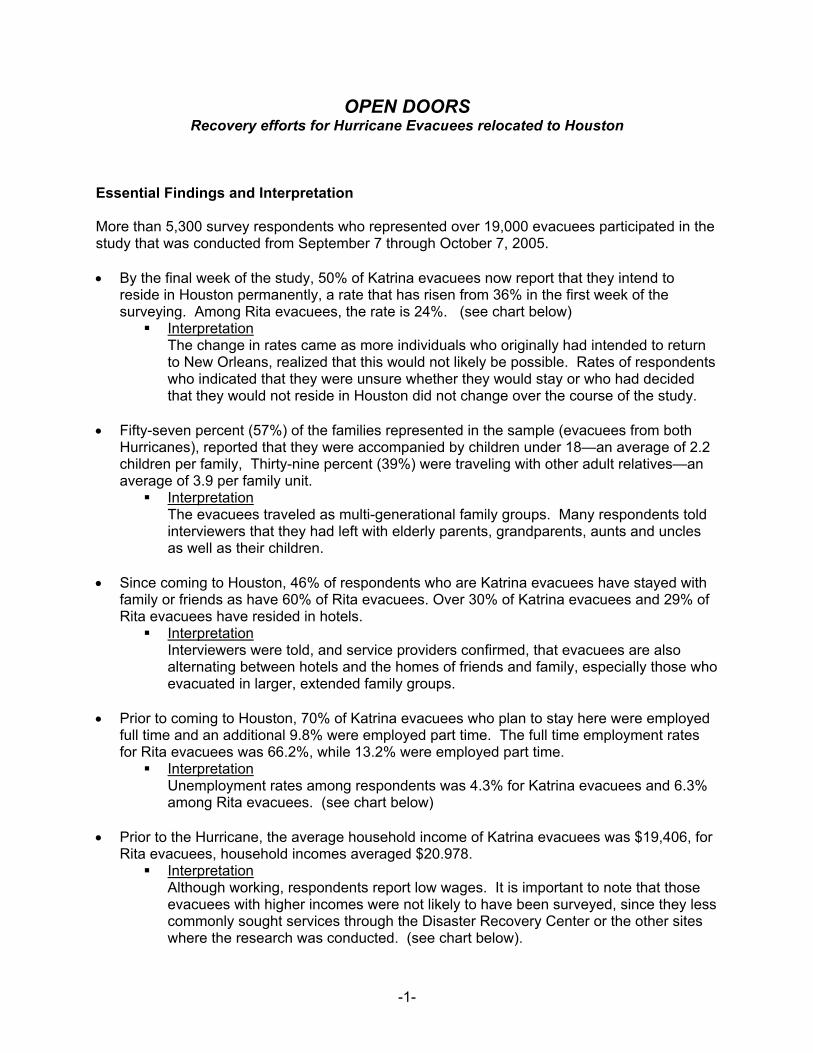
-1-
OPEN DOORS Recovery efforts for Hurricane Evacuees relocated to Houston
Essential Findings and Interpretation More than 5,300 survey respondents who represented over 19,000 evacuees participated in the study that was conducted from September 7 through October 7, 2005. • By the final week of the study, 50% of Katrina evacuees now report that they intend to
reside in Houston permanently, a rate that has risen from 36% in the first week of the surveying. Among Rita evacuees, the rate is 24%. (see chart below)
Interpretation The change in rates came as more individuals who originally had intended to return to New Orleans, realized that this would not likely be possible. Rates of respondents who indicated that they were unsure whether they would stay or who had decided that they would not reside in Houston did not change over the course of the study.
• Fifty-seven percent (57%) of the families represented in the sample (evacuees from both
Hurricanes), reported that they were accompanied by children under 18—an average of 2.2 children per family, Thirty-nine percent (39%) were traveling with other adult relatives—an average of 3.9 per family unit.
Interpretation The evacuees traveled as multi-generational family groups. Many respondents told interviewers that they had left with elderly parents, grandparents, aunts and uncles as well as their children.
• Since coming to Houston, 46% of respondents who are Katrina evacuees have stayed with
family or friends as have 60% of Rita evacuees. Over 30% of Katrina evacuees and 29% of Rita evacuees have resided in hotels.
Interpretation Interviewers were told, and service providers confirmed, that evacuees are also alternating between hotels and the homes of friends and family, especially those who evacuated in larger, extended family groups.
• Prior to coming to Houston, 70% of Katrina evacuees who plan to stay here were employed
full time and an additional 9.8% were employed part time. The full time employment rates for Rita evacuees was 66.2%, while 13.2% were employed part time.
Interpretation Unemployment rates among respondents was 4.3% for Katrina evacuees and 6.3% among Rita evacuees. (see chart below)
• Prior to the Hurricane, the average household income of Katrina evacuees was $19,406, for
Rita evacuees, household incomes averaged $20.978. Interpretation
Although working, respondents report low wages. It is important to note that those evacuees with higher incomes were not likely to have been surveyed, since they less commonly sought services through the Disaster Recovery Center or the other sites where the research was conducted. (see chart below).

-2-
• At least 68% of Katrina evacuees who plan to reside in Houston will be seeking full time
employment, as will 51% of the Rita evacuees who are staying. Approximately 4% of both groups will attempt to secure part time work. At the they were surveyed, 4.2% of the Katrina evacuees and 4.6% of the Rita evacuees were already re-employed. (see chart below)
Interpretation A proportion of those who are re-employed worked in New Orleans for companies that provided new jobs for evacuees here. It is also important to note, as shown in the chart below, that the rates of unemployment are relatively low and that among those who are not employed full time or part time are homemakers, students, retirees and disabled persons.
• The poverty rate in New Orleans prior to Hurricane Katrina was approximately 30%. Katrina
evacuees reported that prior to coming to Houston 28.4 were receiving food stamps. Hurricane Rita evacuees cited a 22.5% rate.
Interpretation The rates at which people apply for and receive food stamp assistance can be an effective marker of poverty rates and is a form of assistance used by the working poor.
• The 5 most needed services designated by Katrina evacuees were: (see chart below)
Housing voucher 84.6% Financial assistance 75.5% Food assistance 70.3% Rental assistance 67.8% Clothing 60.0%
• The 5 most needed services designated by Rita evacuees were: (see chart below)
Financial assistance 80.4% Food assistance 80.3% Clothing 59.2% Rental assistance 57.8% Transportation 40.0%
• A separate survey of social service providers ranked the 5 most essential needs of their
clients. These included: Housing Employment resources Behavioral health care Emergency basic services (food, clothing, shelter) Support services
Transportation Child care Medical care
Summary finding
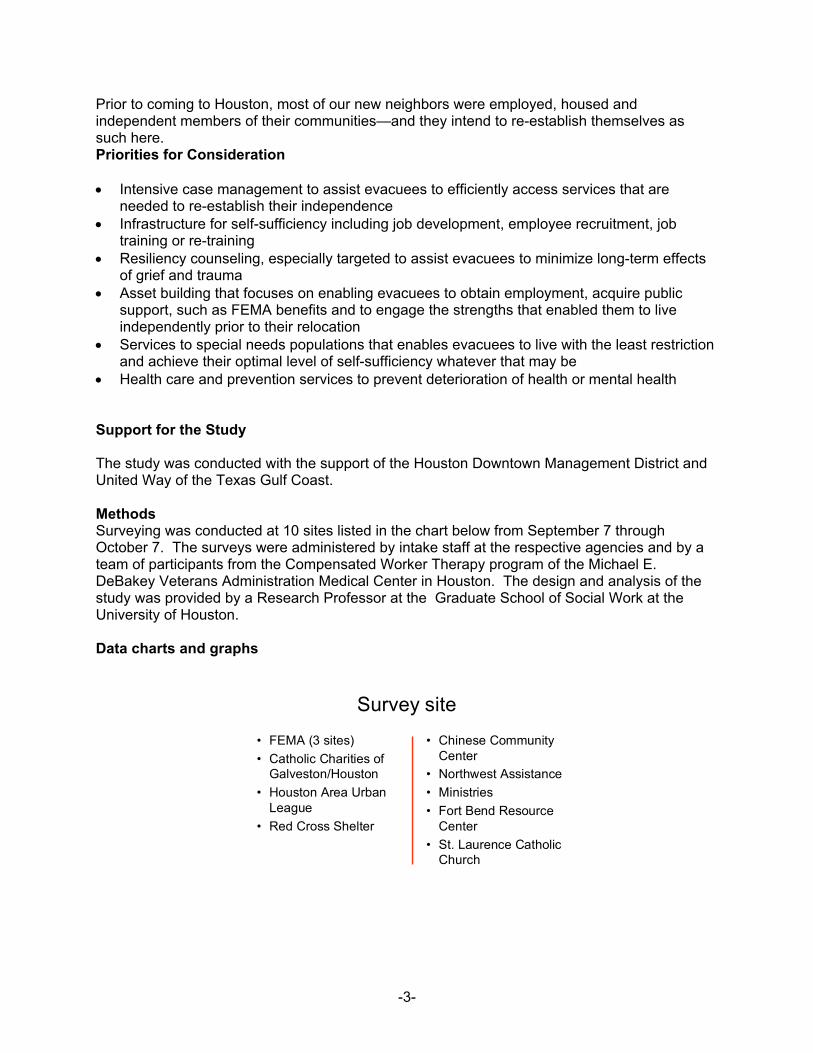
-3-
Prior to coming to Houston, most of our new neighbors were employed, housed and independent members of their communities—and they intend to re-establish themselves as such here. Priorities for Consideration • Intensive case management to assist evacuees to efficiently access services that are
needed to re-establish their independence • Infrastructure for self-sufficiency including job development, employee recruitment, job
training or re-training • Resiliency counseling, especially targeted to assist evacuees to minimize long-term effects
of grief and trauma • Asset building that focuses on enabling evacuees to obtain employment, acquire public
support, such as FEMA benefits and to engage the strengths that enabled them to live independently prior to their relocation
• Services to special needs populations that enables evacuees to live with the least restriction and achieve their optimal level of self-sufficiency whatever that may be
• Health care and prevention services to prevent deterioration of health or mental health Support for the Study The study was conducted with the support of the Houston Downtown Management District and United Way of the Texas Gulf Coast. Methods Surveying was conducted at 10 sites listed in the chart below from September 7 through October 7. The surveys were administered by intake staff at the respective agencies and by a team of participants from the Compensated Worker Therapy program of the Michael E. DeBakey Veterans Administration Medical Center in Houston. The design and analysis of the study was provided by a Research Professor at the Graduate School of Social Work at the University of Houston. Data charts and graphs
Survey site
• FEMA (3 sites)• Catholic Charities of
Galveston/Houston• Houston Area Urban
League• Red Cross Shelter
• Chinese CommunityCenter
• Northwest Assistance• Ministries• Fort Bend Resource
Center• St. Laurence Catholic
Church
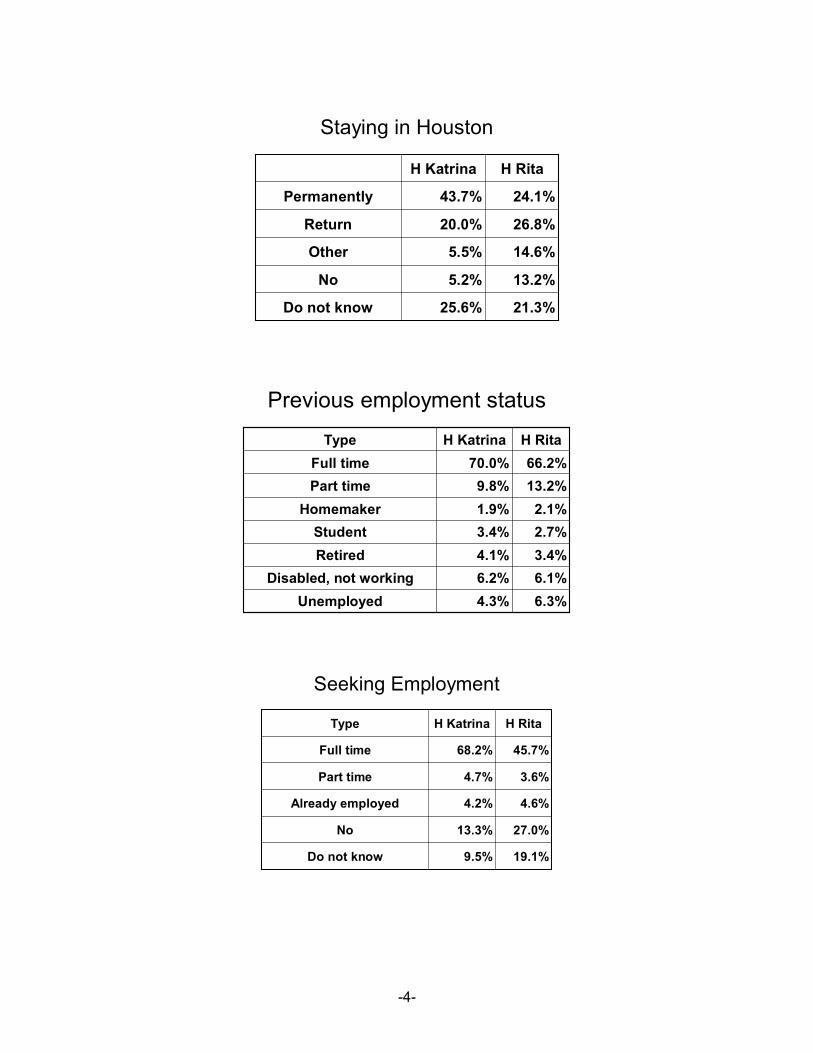
-4-
Staying in Houston
21.3%25.6%Do not know
13.2%5.2%No
14.6%5.5%Other
26.8%20.0%Return
24.1%43.7%Permanently
H RitaH Katrina
Previous employment status
6.3%4.3%Unemployed6.1%6.2%Disabled, not working3.4%4.1%Retired2.7%3.4%Student2.1%1.9%Homemaker
13.2%9.8%Part time66.2%70.0%Full time
H RitaH KatrinaType
Seeking Employment
19.1%9.5%Do not know
27.0%13.3%No
4.6%4.2%Already employed
3.6%4.7%Part time
45.7%68.2%Full time
H RitaH KatrinaType
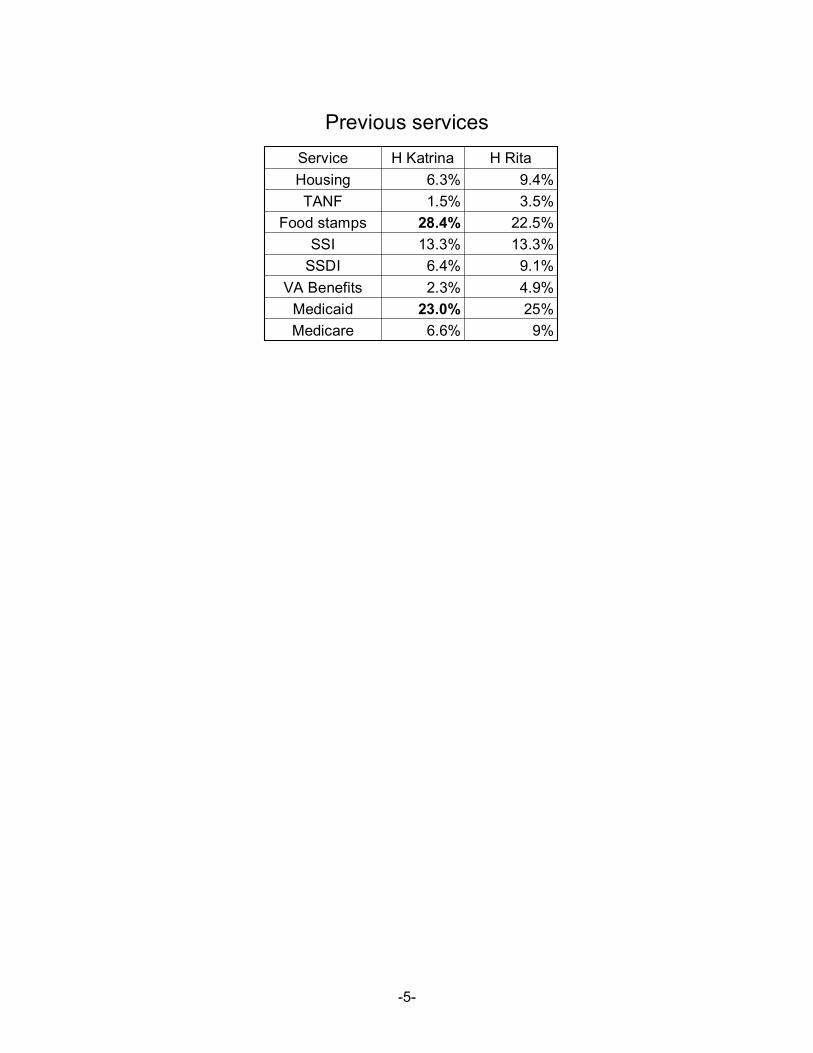
-5-
Previous servicesH RitaH KatrinaService
6.6%23.0%
2.3%6.4%
13.3%28.4%
1.5%6.3%
9%25%4.9%9.1%
13.3%22.5%
3.5%9.4%
MedicareMedicaid
VA BenefitsSSDISSI
Food stampsTANF
Housing