Strategic Management - University of Novi Sad · Strategic Management International Journal of...
84
Transcript of Strategic Management - University of Novi Sad · Strategic Management International Journal of...

Strategic Management International Journal of Strategic Management and
Decision Support Systems in Strategic Management
www.ef.uns.ac.rs/sm Publisher University of Novi Sad, Faculty of Economics in Subotica Segedinski put 9-11, 24000 Subotica, Serbia Tel: +381 24 628 000 Fax: +381 546 486 http://www.ef.uns.ac.rs For Publisher Nenad Vunjak, University of Novi Sad, Faculty of Economics in Subotica, Serbia Editor-in-Chief Jelica Trninić, University of Novi Sad, Faculty of Economics in Subotica, Serbia National Editorial Board Esad Ahmetagić, University of Novi Sad, Faculty of Economics in Subotica, Serbia Jelena Birovljev, University of Novi Sad, Faculty of Economics in Subotica, Serbia Jovica Đurković, University of Novi Sad, Faculty of Economics in Subotica, Serbia Nebojša Janićijević, University of Belgrade, Faculty of Economics Belgrade, Serbia Tibor Kiš, University of Novi Sad, Faculty of Economics in Subotica, Serbia Božidar Leković, University of Novi Sad, Faculty of Economics in Subotica, Serbia Vesna Milićević, University of Belgrade, Faculty of Organizational Sciences, Serbia Aleksandar Živković, University of Belgrade, Faculty of Economics, Serbia International Editorial Board Ilona Bažantova, Charles University in Prague, Faculty of Law, Czech Republic André Boyer, University of Nice Sophia-Antipolis, France Ivan Brezina, University of Economics in Bratislava, Faculty of Economic Informatics, Bratislava, Slovakia Ferenc Farkas, University of Pécs, Faculty of Business and Economy, Hungary Agnes Hofmeister, Corvinus University of Budapest, Faculty of Business Administration, Hungary Pedro Isaias, Open University Lisbon, Portugal Novak Kondić, University of Banja Luka, Faculty of Economics, Banja Luka, Bosnia and Herzegovina Mensura Kudumović, University of Sarajevo, Faculty of Medicine, Bosnia and Herzegovina Vujica Lazović, University of Montenegro, Faculty of Economics, Podgorica, Montenegro Martin Lipičnik, University of Maribor, Faculty of Logistics Celje-Krško, Slovenia Pawel Lula, Cracow University of Economics, Poland Emilija Novak, West University of Timisoara, Timisoara, Romania Elias Pimenidis, University of East London, England Vladimir Polovinko, Omsk State University, Russia Ludovic Ragni, University of Nice Sophia-Antipolis, France Kosta Sotiroski, University „ST Kliment Ohridski“ Bitol, Faculty of Economics Prilep, Macedonia Ioan Talpos, West University of Timisoara, Faculty of Economics, Romania Assistant Editors Marton Sakal, University of Novi Sad, Faculty of Economics in Subotica, Serbia Vuk Vuković, University of Novi Sad, Faculty of Economics in Subotica, Serbia Lazar Raković, University of Novi Sad, Faculty of Economics in Subotica, Serbia English translation Željko Buljovčić Zora Trninić Prepress
Print BIROGRAFIKA MB doo, Subotica, Serbia Circulation 200 The Journal is published quarterly.
Strategic Management International Journal of Strategic Management and
Decision Support Systems in Strategic Management ISSN 1821-3448, UDC 005.21 Strategic Management is a quarterly journal addressing issues concerned with all aspects of strategic man-agement. It is devoted to the improvement and further development of the theory and practice of strategic management and it is designed to appeal to both practicing managers and academics. Specially, Journal pub-lishes original refereed material in decision support systems in strategic management.
Thematic Fields Mission and Philosophy of the Organization
Culture and Climate of the Organization
Effectiveness and Efficiency of the Organization
Structure and Form of the Organization
Strategic Analysis
Aims and Strategies
Process of Strategic Management
Characteristics of Strategic Management in the New Economy
Contemporary Ontological, Epistemological and Axiological Suppositions on the Organization and its Environment
Analysis of the Organization and its Interaction with the Environment
Structure and Dynamics of the Organizational Environment
Uncertainty and Indistinctiveness of the Organizational Environment
Synchronic and Diachronic Analysis of the Organizational Environment
Analysis Techniques of the Organization
Business Processes, Learning and Development within the Context of Strategic Management
Evaluation and Measuring of the Potential and Realization of the Organization within the Context of Strategic Management
Strategic Control in Contemporary Management
Information Technologies in Strategic Management
Business Intelligence and Strategic Management
Decision Support Systems and Artificial Intelligence in Strategic Management
All scientific articles submitted for publication in Journal are double-blind reviewed by at least two academics appointed by the Editor's Board: one from the Editorial Board and one independent scientist of the language of origin - English. Reviewers stay anonymous. Authors will timely receive written notification of acceptance, re-marks, comments and evaluation of their articles.
Strategic Management International Journal of Strategic Management and
Decision Support Systems in Strategic Management www.ef.uns.ac.rs/sm ISSN 1821-3448 UDC 005.21 2015, Vol. 20, No. 1
Contents András Horváth Modern Growth Lifecycle Management Models for Micro, Small and Medium-Sized Businesses 3-10 Marjan Sternad, Bojan Rosi, Borut Jereb Risk Identification in International Business 11-16 Vitomir Starčević, Slobodan Subotić Competitve Advantages of the Economy of Bosnia and Herzegovina as Precondition for Atracting Foreign Direct Investments 17-25 Јеlena Tadić, Agneš BoljevićIntegration of Critical Success Factors in Order to Improve Performance of the Company 26-33 Miroslav Džupinka Audit and Its Credibility in Financial Reporting 34-37 Hasan Farazmand, Mahvash Moradi Determinants of FDI: Does Democracy Matter? 38-46 Vesna Kočić Vugdelija Integration Potential of Organic Agriculture in Serbia – Financial and Cooperative Aspects 47-55 Márta Dévényi The Role of Cross-cultural Competence in International Business in the Twenty-first Century 56-60 Miladin Jovičić, Mirna Vukadin, Ognjen Zupur Establishing Public-Private Partnerships in the Regions of Bosnia and Herzegovina and Serbia 61-69
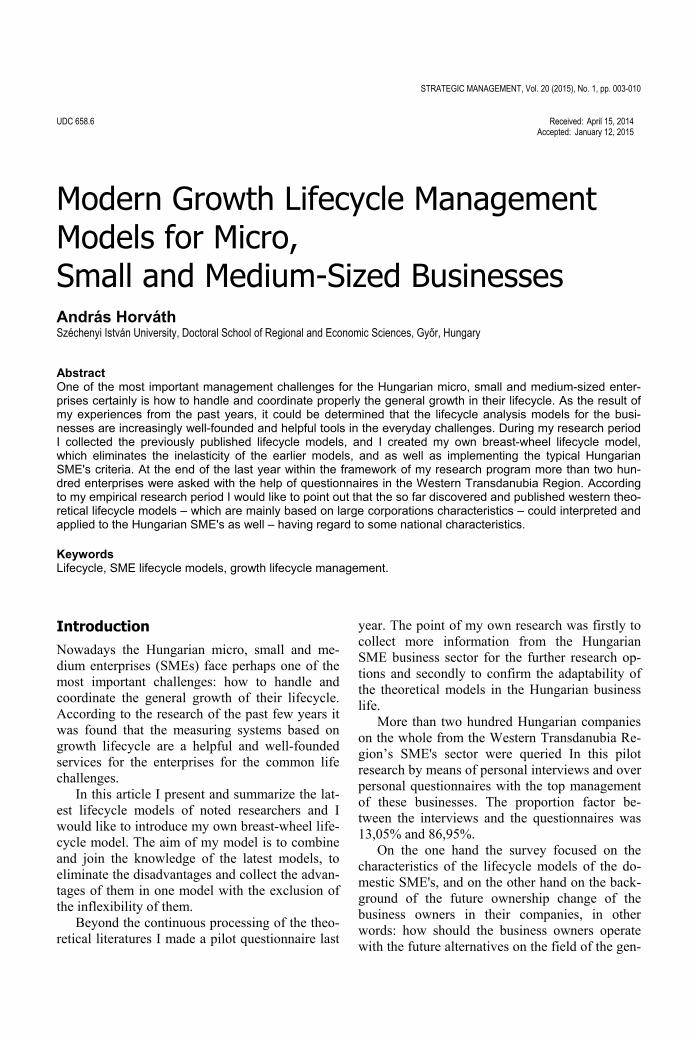
STRATEGIC MANAGEMENT, Vol. 20 (2015), No. 1, pp. 003-010 UDC 658.6
Received: April 15, 2014
Accepted: January 12, 2015
Modern Growth Lifecycle Management Models for Micro, Small and Medium-Sized Businesses
András Horváth Széchenyi István University, Doctoral School of Regional and Economic Sciences, Győr, Hungary
Abstract One of the most important management challenges for the Hungarian micro, small and medium-sized enter-prises certainly is how to handle and coordinate properly the general growth in their lifecycle. As the result ofmy experiences from the past years, it could be determined that the lifecycle analysis models for the busi-nesses are increasingly well-founded and helpful tools in the everyday challenges. During my research periodI collected the previously published lifecycle models, and I created my own breast-wheel lifecycle model, which eliminates the inelasticity of the earlier models, and as well as implementing the typical Hungarian SME's criteria. At the end of the last year within the framework of my research program more than two hun-dred enterprises were asked with the help of questionnaires in the Western Transdanubia Region. Accordingto my empirical research period I would like to point out that the so far discovered and published western theo-retical lifecycle models – which are mainly based on large corporations characteristics – could interpreted and applied to the Hungarian SME's as well – having regard to some national characteristics. Keywords Lifecycle, SME lifecycle models, growth lifecycle management.
Introduction Nowadays the Hungarian micro, small and me-dium enterprises (SMEs) face perhaps one of the most important challenges: how to handle and coordinate the general growth of their lifecycle. According to the research of the past few years it was found that the measuring systems based on growth lifecycle are a helpful and well-founded services for the enterprises for the common life challenges.
In this article I present and summarize the lat-est lifecycle models of noted researchers and I would like to introduce my own breast-wheel life-cycle model. The aim of my model is to combine and join the knowledge of the latest models, to eliminate the disadvantages and collect the advan-tages of them in one model with the exclusion of the inflexibility of them.
Beyond the continuous processing of the theo-retical literatures I made a pilot questionnaire last
year. The point of my own research was firstly to collect more information from the Hungarian SME business sector for the further research op-tions and secondly to confirm the adaptability of the theoretical models in the Hungarian business life.
More than two hundred Hungarian companies on the whole from the Western Transdanubia Re-gion’s SME's sector were queried In this pilot research by means of personal interviews and over personal questionnaires with the top management of these businesses. The proportion factor be-tween the interviews and the questionnaires was 13,05% and 86,95%.
On the one hand the survey focused on the characteristics of the lifecycle models of the do-mestic SME's, and on the other hand on the back-ground of the future ownership change of the business owners in their companies, in other words: how should the business owners operate with the future alternatives on the field of the gen-
4 András Horváth Modern Growth Lifecycle Management Models for Micro, Small and Medium-Sized Businesses
STRATEGIC MANAGEMENT, Vol. 20 (2015), No. 1, pp. 003-010
eration changes (inheritance and succession) of their businesses.
In connection with the precursive results of my primer surveys await me proof of many interest-ing correlation. I would like to publicize the final results in the near future only than if the whole processing of the final surveys is already com-pleted.
1. About the lifecycle models in general As George Santayana, an American philosopher and poet said, “Those who do not remember the past are condemned to repeat it”.
Most of the lifecycle models represent the life-cycle of the businesses as the human lifecycles: it begins with the birth (or the idea of birth) of the company, than come many life stages as the com-pany become ripe, and in the end, closes with the death of the company.
“As the product lifecycle, lifecycle exists in the business world as well, and makes expressive by the conformation of the lifecycle gear to the time: so it could be plotted a curve which presents the lifecycle of a company” (Zsupanekné, 2008). This curve represents the lifecycle of a company, whose curve could be separated into two major parts according to almost all of the lifecycle theo-ries: the growth period and the decline periods.
These two great branches have been studied in theoretical and as well practical mapping research for a long time and, in the consideration of the results, these two categories are defined almost as two different disciplines within the field of the lifecycle management science. The management of the growth periods observes the positive slope sections of the company lifecycles, which are in-cidental to growth, development and evolution, while the declining branch with the negative slope sections are dealing with the decline periods of the company’s life more closely.
My research mainly focuses on the growth pe-riods, because the main questions arising in con-nection with the development dilemmas could be answered by deeper exploration of these lifecycle stages. And in an always changing market to find the solutions as soon as possible are necessary to ensure a constant profit-oriented operation for the SME's (Papp, 2006).
In the most studies the declining stages belong to another broader topic of the lifecycle manage-ment science sector: to the crisis management. In this case, by stepping on a descending period the management of the company should search for the
right scenario from the array of crisis situations in order to analyze and intervene as early as possible to secure the operational sustainability and possi-bly to restore the growth again.
The investigations into the Hungarian SMEs show all lines, that the most of businesses, which are successfully operating in Hungary today, were founded in the late eighties and early nineties. This fact reinforces the reliability of the lifecycle based analysis system because the tested busi-nesses already have enough history to be able to get useful results due the theoretical lifecycle models.
If we are ready to follow the stages of a com-pany thanks to the lifecycle models, we can assign some criteria to the same – and on this way ho-mogenized – lifecycle periods, which could be common by many SMEs. Hereby the SMEs, which are per se individual but standing in the same lifecycle period, after all could be compara-ble with each other. Accordingly the growth life-cycle models give us a not only a theoretical pat-tern how the businesses are working in the diverse ages but as well give us a measurement instru-mental, which are able to locate the exact place of a business in his lifecycle and could give some alternative options, how the company should han-dle its future opportunities.
1.1. The most popular Hungarian and foreign lifecycle models The lifecycles of some enterprises develop differ-ently according to the internal and external char-acteristic features of the businesses. Much of the research proves that different lifecycle periods are observed and separated in the case of most of the enterprises. There is problem with the monitoring of this research and the monitoring of the enter-prises also, because the experts have various standpoints from the borders of the lifecycle peri-ods. An acceptable standard model system, which could help to make conclusions for the lifecycle periods of the most of the enterprises with the same filtering criteria, presently does not exist.
While different models are widely used, ac-cording to my experience, in the case of examina-tions it is practical to use and evaluate more mod-els at the same time for one enterprise. The appli-cation of the various models and the final results could give a complete picture of the obtained company and make a basis for the further exami-nations and suggestions for the future develop-ment options. The “multi-model-testing” leads more and more to precision, thanks to the similar
András Horváth Modern Growth Lifecycle Management Models for Micro, Small and Medium-Sized Businesses 5
STRATEGIC MANAGEMENT, Vol. 20 (2015), No. 1, pp. 003-010
methodical approaches of the variety of the mod-els, because the structures of the models are not independent from each other and in some cases the characteristic features of the different sections of different models are the same.
With the help of Zsupanekné (2008) I would like to present now the previous well-known life-cycle models.
The foundations of the lifecycle of enterprises with the theory leaning on three keystones were laid down by Professor Jeffrey Timmons (1990). In his model system the lifecycle curve is divided into five main sections, which were assigned to concrete life-spans by the Professor. However the steps of declining section were not specified by the excellent corporate expert, who died at the age of sixty in April 2008.
Subsequently, Robert D. Hirsch and Michael P. Peters (1994) in their book Enterprise took up Timonns’ (1990) basic model. The first two sec-tions of the previous model were divided by them into four parts each.
However the real breakthrough was brought about by the book of Adizes (1992) called Corpo-rate Lifecycles: How Organizations Grow and Die and What to Do About It? in 1988. Compared to the previous models, the author formed a com-plete lifecycle, which involves the growing and the declining cycles as well. Nowadays this model perhaps can help during the analysis of the enter-prises because the model compares the human life milestones to the progress of the enterprises and it makes this model significant, popular and mostly used. The growing stages of Adizes’ (1992) life-cycle are made up of six parts, which lead to four aging phase before the corporate death.
Larry G. Greiner’s (1998) model is also wide-spread. In this model the phases of revolution and evolution are changed. According to the theory of Greiner (1998), lifecycle of the enterprises is characterised by five growing stages, where the evolution stages are the developmental periods. In this model the revolution phases mean the prob-lem, where an enterprise stands between the bor-der of two stages and have to decide between them.
Among the Hungarian researchers, István Jávor (1993) and László Szerb (2000) deal with the legitimacy of the integration of lifecycle curve before the foundation of an enterprise in their theories. The twelve stages of growing lifecycle of Jávor’s (1993) model are probably the most diverse and the most differentiated among the well-known Hungarian models. With this theory,
Jávor (1993) perhaps made a well-constructed model of the steps of corporate development. The model of Szerb (2000) is based on the theory of Timmons (1990) with the addition of the two es-sential periods before foundation and just two stages at the end of the lifecycle, which is the sixth lifecycle phase.
In addition to Jávor’s (1993) and Szerb’s (2000) model there is another significant model by Péter Szirmai (2002). The focused model of Szirmai (2002) puts the lifecycle stages based on Adizes to three different levels – micro, macro and mezo.
Anna Salamonné Huszty’s (2006) lifecycle model gives the essential part of my research. In my opinion this model is significant, because it combines the advantages of the models of Adizes (1992) and Greiner (1998) adds the characteristics of small and medium enterprises and is based on the knowledge of the Hungarian and foreign life-cycle models. In this blend there are the real as-sets of the other models in five different stages of the lifecycle. Beyond the creation of this theoreti-cal model Salamonné (2006) is the first among the Hungarian researchers who have published results of empirical research related to the Hungarian SME's sector.
1.2. About the Adizes (1992) lifecycle model On the basis of the lifecycle management litera-ture, one of the most mature and most widely used models was set out by Ichak Adizes. Most lifecy-cle model deal only with the developmental stages of the periods, but in his model the corporate can be traced from the pre-foundation step until the company’s death. Perhaps this model has become so popular, because a very detailed description was made for each period, and in the practical application the subjects could be classified with almost one hundred percent certainty in each category (Göblös & Gömöri, 2004).
The following figure shows the Adizes’ model of lifecycle stages:
6 András Horváth Modern Growth Lifecycle Management Models for Micro, Small and Medium-Sized Businesses
STRATEGIC MANAGEMENT, Vol. 20 (2015), No. 1, pp. 003-010
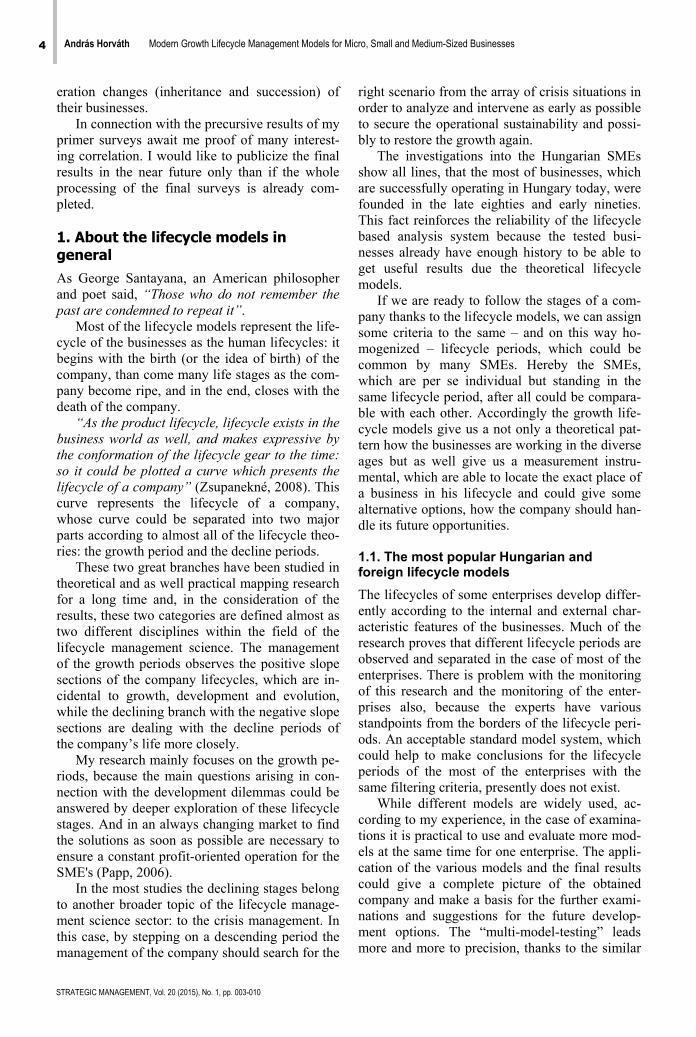
Figure 1 The Adizes (1992) Lifecycle Model Source: Adizes Institute Online, 2013
In the courtship period the company is still
nascent and starts looking for the most appropriate strategy for the particular environment. Above all, the “product-oriented and value added focus” (Göblös & Gömöri, 2004) are the main features. This period should be treated with more caution, because if the company’s management builds up an inadequate strategy after the establishment of the company, it could easily lead to the early ter-mination of the company, while at the beginning all of the resources and all the decision-making opportunities are usually limited.
Then follows the infancy, which is the most dynamic period in the Adizes-model (1992) for SMEs. This period is about the development, as well as a baby discovers the world around him and gains more experience thanks to the impulses. The company learns the coordination processes, and could have even more damage, but at the end of this era has its own consciousness and will.
The next stage, the go-go period, is connected again to the era of human development, as a step when the baby becomes a child. Team spirit within the SMEs plays an increasingly dominant role in the development and the individual suc-cesses encouraged the company to continue its growth.
In adolescence the rate of development will slow down, and the focus of the management con-centers more on how to change and how the qual-ity could be transferred. The decision-making dif-ficulties increasingly comes to the fore, which could lead to dangerous conflicts. Characteristic features in this stage are that the human resources, capital and reserves of the companies are set to reorganize and renew.
Prime (or manhood) is the "era of the best per-forming path of growth" (Göblös & Gömöri, 2004). By this time, the ERP systems operate, and
the company has an enviable flexibility. Each process is organized and easy to handle, so the company can focus on one main purpose: to in-crease profitability.
The stable stage is the pitch of the lifecycle. The company is ready to meet the daily chal-lenges, but the creativity is decreasing and less able to create and introduce new things. The com-pany trying to find solutions to the increasingly complex management changes with the existing systems and patterns.
As formerly mentioned, the descending peri-ods are dealt with by the crisis management sci-ences, so I will not specify this periods in this publication.
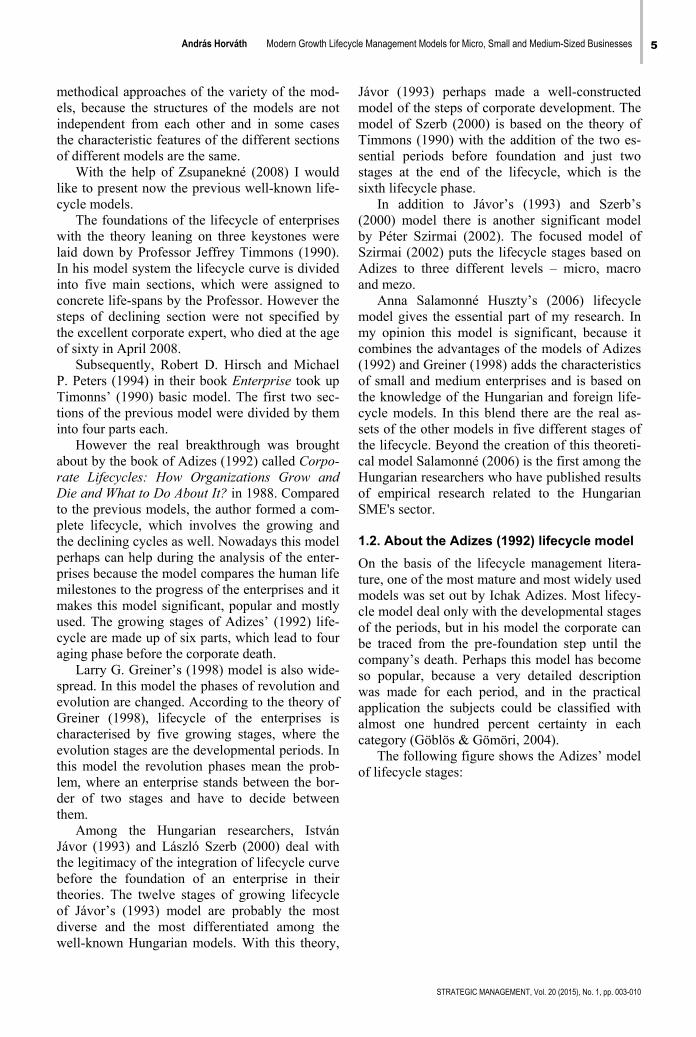
1.3. About the Greiner (1998) lifecycle model Larry Greiner (1998) published his lifecycle model in 1972, which became well-known all over the world. The model describes five distinct phases in the lifecycle stages and shows in each alternate period with evolutionary and revolution-ary breaks, which are illustrated with straight and broken lines. The evolutionary periods show a calm and balanced phase, while revolutionary phases are characterized by crises.
In my opinion, the Greiner (1998) model be-comes alive by this two alternating stages, as a natural way to approach the changes of each stage by the crisis (revolutionary) periods. In particular, associate with the critical stages of the human life periods: the problems also arise spontaneously, but usually the solution is still pending (Farkas, 2005):
Figure 2 The Greiner (1995) Lifecycle Model Source: Greiner, 1998
In the first phase creativity plays the main role.
The company starts its life, and is focused on overcoming the initial problems. The exponen-tially small successes will motivate the company
András Horváth Modern Growth Lifecycle Management Models for Micro, Small and Medium-Sized Businesses 7
STRATEGIC MANAGEMENT, Vol. 20 (2015), No. 1, pp. 003-010
to move forward, so at this stage of development is extremely robust.
This is followed by the direction phase, in which the company must affix the management activities to the fore, because to ensure the con-tinuous operation it is not enough anymore to rely only on the self-solving protocols. There are in-troduced the corporate governance policies and systems to help speed up the processes of coordi-nation. This will give a fresh impetus to continue.
The third (middle) period is the delegation (transferring) phase. At this stage, the company usually awakens to become a too bureaucratic organization, so it is time to re-allocate the roles and decentralize the operation. This can best be accomplished by assigning the responsible person for each task, and by removal of the “classic man-agement” from the single control.
In the fourth, coordination stage the units, which are dissolved in the previous period, will unite again, and the group as a team takes over the planning of the future with the full responsibility by the sensitive areas. The employees could even have a stake in the business successes of the com-pany.
The model will complete with the period of collaboration, which aims to improve the quality of team processes in the further cooperation. In order to move on to the misty future the business is ready for all – even for extreme, completely new, creative – ideas to try out, although it is not yet calculable, and could lead moreover uncertain fields.
1.4. About the Salamonné Huszty Anna (2006) model This model is such an alloy of the Timmons (1990), the Adizes (1992) and the Greiner (1998) models, which has many similarities, but it cap-tures the sting of the well-known enterprise life-cycle models through a combination of a number of differences. The model of Salamonné (2006) could be mentioned as a method with the first pioneer results of analysis in Hungary, which is very broad and incorporates previous studies on the process of research, especially targeted at Hungarian SMEs. She not only collects the earlier theories but through her own research tests as well the Hungarian SMEs.
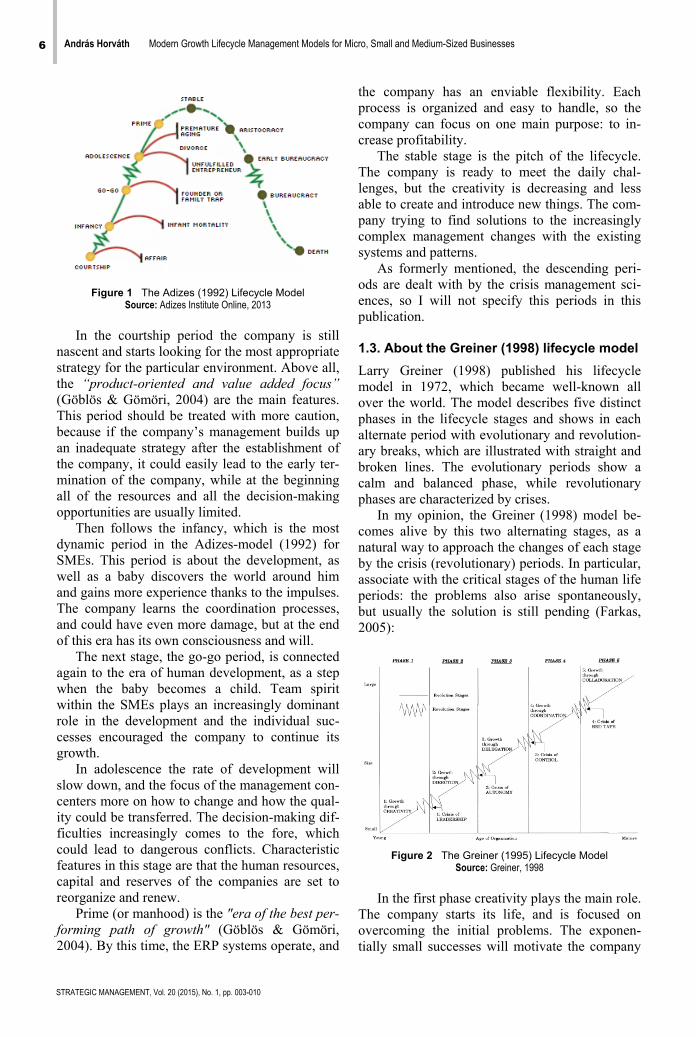
The way to reach the best view of the lifecycle models is to display them side by side in a chart, because the Salamonné (2006) model has not been illustrated in a figure yet:
Table 1 The most popular lifecycle models
Phases Timmons (1990)
Adizes (1992)
Greiner (1995)
Salamonné Huszty Anna (2006)
1. R&D Courtship - -
2. Starting Phase
Infancy Creativity
Starting Phase
Go-Go! Creativity
3. Early
growth Adolescence Direction Direction
4. Mature Prime Delegation
Delegation Coordination
5. Stabilize Stable Collaboration Stable
Source: authors, based on the author, Timmons (1990), Farkas (2005), and Salamonné (2006).
It could be seen that the researchers are in
agreement that the procedure can be divided into five major lines of the development. We can see that in the model of Salamonné (2006) the periods of Greiner (1998) and Adizes (1992) are chang-ing.
By the domestic research the phase prior to the starting (establishment) is not significant, so the first stage the role played is the starting phase. Business owners will be launching their busi-nesses on the basis of an initial impulsive idea based on her surveys. This period lasts a relatively short period of time, and immediately proceeds to the next cycle.
The creativity is the most important way of life when it comes to starting a successful company based on the idea to build the organizational, technological and human resources systems, and improves the company's key products. The com-pany is developing dynamically in this time, and could improve performance in all areas.
After the period of creativity the model of Salamonné (2006) differs from the previously known models, and two routes are assumed into the future: the direction and the delegation.
The direction phase is aimed at quality im-provement, whereas the primary purpose of the delegation period is the reconstruction of an effi-cient management leadership, which could release additional resources for the cost efficiencies by prioritizing.
At the last stage – as in the Adizes (1992) model – is the stable phase in the case of the model of Salamonné (2006). By this time the company acquires those experiences which are given a free hand for the decisions in the opera-tion in an automated atmosphere.
8 András Horváth Modern Growth Lifecycle Management Models for Micro, Small and Medium-Sized Businesses
STRATEGIC MANAGEMENT, Vol. 20 (2015), No. 1, pp. 003-010
The model of Anna Salamonné Huszty (2006) is currently perhaps the most accurate domestic model for the Hungarian SMEs, because her work is based on multi-annual research activity, with personal examinations of company leaders.
1.5. Common experiences based on the described models After the examination of the models there are sev-eral common and opposite criteria which were proved based on the ideas of the researchers. From these ideas, the two most prominent criteria are the method of transition between life stages, and group of questions of the temporal continuity of lifecycles. Some researchers are at the point of view that the lifecycle phases must only follow each other consecutively, so the business cannot skip one cycle to jump to another. However others said that certain steps are disregarded because it helps to increase the elasticity of the models.
In the case of the primary period, the devel-oper of the models generally shares the viewpoint that the progression of the enterprise is the proc-ess of maturation, in conclusion the enterprise has to go on straight on the timeline. One question arises with the passage of time: what would hap-pen after the last stage in the lifecycle of enter-prises?
Because of this the concept and idea of rejuve-nation was born, which means, that the develop-ment could happen not only forward, but also backward. The enterprise is rejuvenated along the principle: if there is no way to forward, than to turn to backward. The enterprise could be younger with this strategy, and wander a route many times (Pataki, 2004). Except for some unclear areas we can say generally, that each model can be suitable to test the enterprises independently and help to improve the management in the critical periods.
It is possible to plan the short term and alterna-tive future of the enterprises because of the theo-retical ideas which are supported by general prac-tical experiences and surveys. This means that the duration of critical periods and the expected proc-esses could be calculated. It helps to proceed, when the enterprise reach the border of a cycle between the stages of the lifecycle, alternative strategies are able to created and there is also enough time to simulate these strategies. If the solution is still not right, the parameters could be changed again and after it with the next tests the appropriate allocation could be formed and find.
The compatibility of the models is also an ad-vantage. This means, that it is practical to use sev-
eral methods and test with more lifecycle models. In a case of a problematic status after the multi-dimensional testing is easier to choose the right going-on-strategy. We get information from dif-ferent sides, there are various aspects to analyze and solve the problems.
2. Vertical approach vs. on-going process-centric model: MY OWN BREAST-WHEEL MODEL “Remember that just the moment you say: I give up, someone else seeing the same situation is say-ing: My, what a great opportunity”, said H. Jack-son Brown, an American bestseller author.
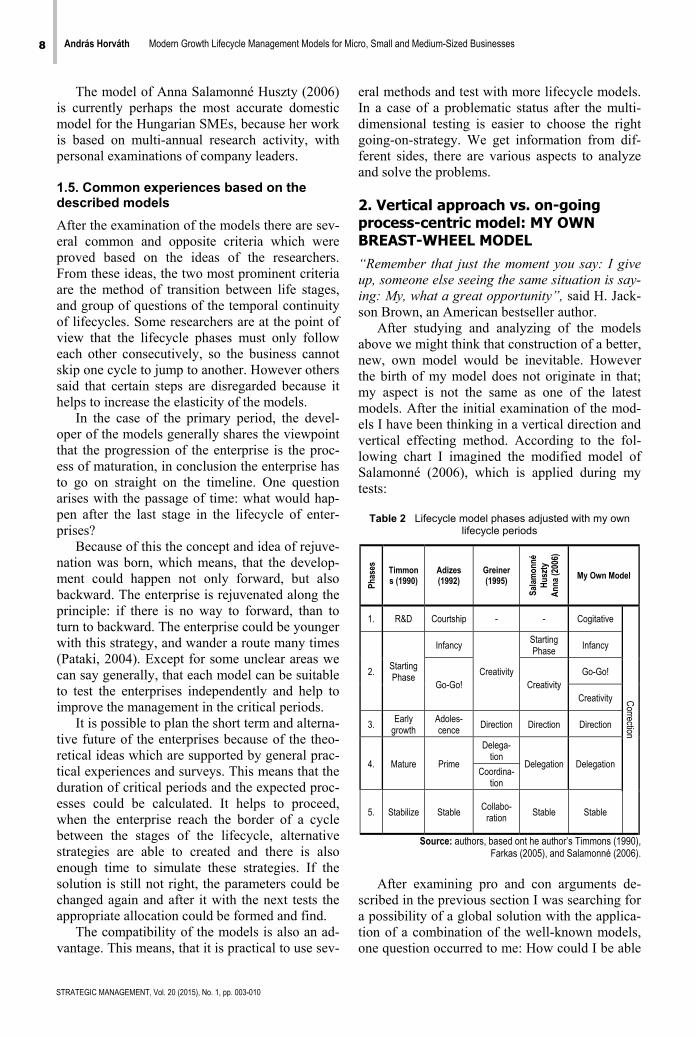
After studying and analyzing of the models above we might think that construction of a better, new, own model would be inevitable. However the birth of my model does not originate in that; my aspect is not the same as one of the latest models. After the initial examination of the mod-els I have been thinking in a vertical direction and vertical effecting method. According to the fol-lowing chart I imagined the modified model of Salamonné (2006), which is applied during my tests:
Table 2 Lifecycle model phases adjusted with my own
lifecycle periods
Phas
es
Timmons (1990)
Adizes (1992)
Greiner (1995)
Salam
onné
Hu
szty
An
na (2
006)
My Own Model
1. R&D Courtship - - Cogitative
Correction
2. Starting Phase
Infancy
Creativity
Starting Phase
Infancy
Go-Go! Creativity Go-Go!
Creativity
3. Early
growth Adoles-cence Direction Direction Direction
4. Mature Prime
Delega-tion
Delegation Delegation Coordina-
tion
5. Stabilize Stable Collabo-
ration Stable Stable
Source: authors, based ont he author’s Timmons (1990), Farkas (2005), and Salamonné (2006).
After examining pro and con arguments de-
scribed in the previous section I was searching for a possibility of a global solution with the applica-tion of a combination of the well-known models, one question occurred to me: How could I be able
András Horváth Modern Growth Lifecycle Management Models for Micro, Small and Medium-Sized Businesses 9
STRATEGIC MANAGEMENT, Vol. 20 (2015), No. 1, pp. 003-010
to unify the critical parameters (as the continuity and temporality) of the earlier researchers in one single model?
Aside from all the positions previously known I draw the conclusion that it is worth thinking not in a vertical, but a process-centric model, because the vertical models are inflexible and the models can be applied in practice only with a very narrow cross-section incorporating filters. I would rather like to find such a solution, where not the enter-prise should adapt a lifecycle model to his life – so I would not like to find an appropriate enter-prise for the theoretical models – but my model should to respond to the lifecycle of the enter-prises.
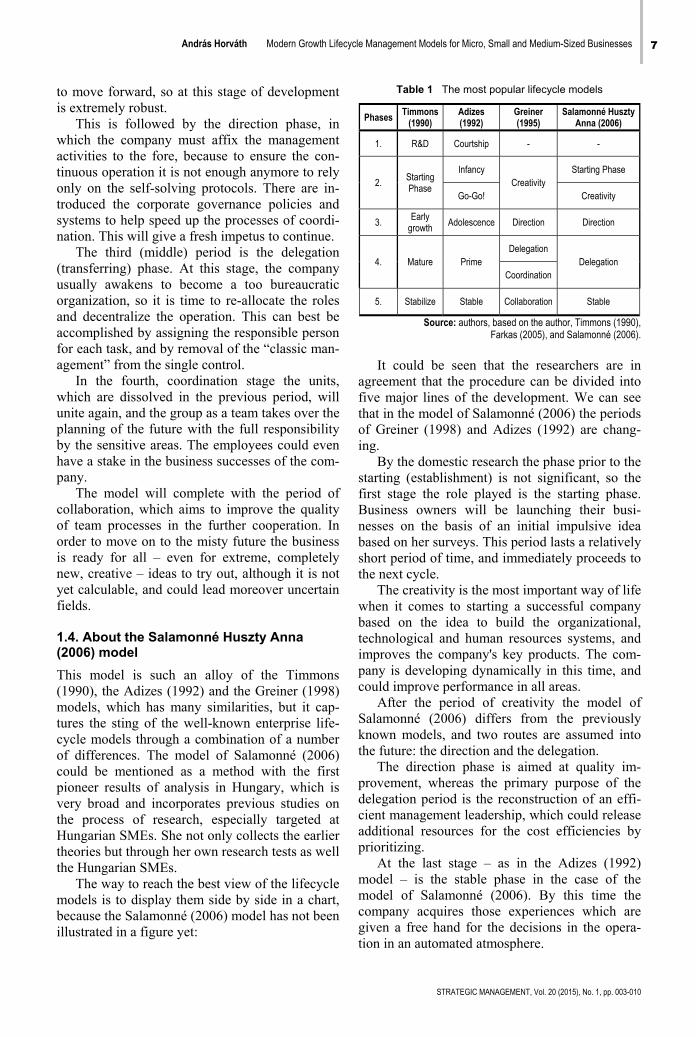
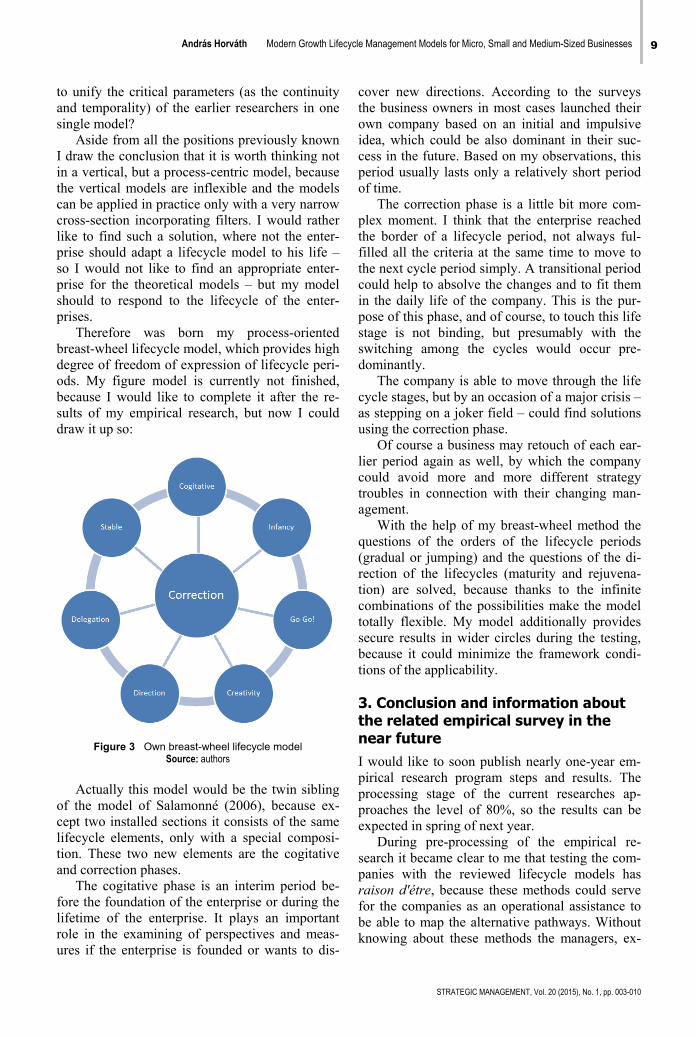
Therefore was born my process-oriented breast-wheel lifecycle model, which provides high degree of freedom of expression of lifecycle peri-ods. My figure model is currently not finished, because I would like to complete it after the re-sults of my empirical research, but now I could draw it up so:
Figure 3 Own breast-wheel lifecycle model Source: authors
Actually this model would be the twin sibling
of the model of Salamonné (2006), because ex-cept two installed sections it consists of the same lifecycle elements, only with a special composi-tion. These two new elements are the cogitative and correction phases.
The cogitative phase is an interim period be-fore the foundation of the enterprise or during the lifetime of the enterprise. It plays an important role in the examining of perspectives and meas-ures if the enterprise is founded or wants to dis-
cover new directions. According to the surveys the business owners in most cases launched their own company based on an initial and impulsive idea, which could be also dominant in their suc-cess in the future. Based on my observations, this period usually lasts only a relatively short period of time.
The correction phase is a little bit more com-plex moment. I think that the enterprise reached the border of a lifecycle period, not always ful-filled all the criteria at the same time to move to the next cycle period simply. A transitional period could help to absolve the changes and to fit them in the daily life of the company. This is the pur-pose of this phase, and of course, to touch this life stage is not binding, but presumably with the switching among the cycles would occur pre-dominantly.
The company is able to move through the life cycle stages, but by an occasion of a major crisis – as stepping on a joker field – could find solutions using the correction phase.
Of course a business may retouch of each ear-lier period again as well, by which the company could avoid more and more different strategy troubles in connection with their changing man-agement.
With the help of my breast-wheel method the questions of the orders of the lifecycle periods (gradual or jumping) and the questions of the di-rection of the lifecycles (maturity and rejuvena-tion) are solved, because thanks to the infinite combinations of the possibilities make the model totally flexible. My model additionally provides secure results in wider circles during the testing, because it could minimize the framework condi-tions of the applicability.
3. Conclusion and information about the related empirical survey in the near future I would like to soon publish nearly one-year em-pirical research program steps and results. The processing stage of the current researches ap-proaches the level of 80%, so the results can be expected in spring of next year.
During pre-processing of the empirical re-search it became clear to me that testing the com-panies with the reviewed lifecycle models has raison d'étre, because these methods could serve for the companies as an operational assistance to be able to map the alternative pathways. Without knowing about these methods the managers, ex-
10 András Horváth Modern Growth Lifecycle Management Models for Micro, Small and Medium-Sized Businesses
STRATEGIC MANAGEMENT, Vol. 20 (2015), No. 1, pp. 003-010
ecutives and independent owners might not even recognize the backgrounds of the causes in the company’s management strategies.
In the first step I collected primer empirical data from Hungarian SMEs through personal questionnaires. The data collection included nearly two hundred and fifty Hungarian SME's and medium and senior leaders were questioned, mostly from the West Transdanubian Region. Par-ticipants in the questionnaires mastered the theo-ries and practical application of the lifecycle mod-els before performing the query.
The questionnaire consisted of four main parts. The general data of the observed companies was collected in the first part. The second phase was used to determine the own lifecycle paths of the businesses, with the help of classification of the characteristics of the well-known lifecycle models (e.g. Adizes (1992) model with online tests; Greiner (1998) model). In the third module I would try to justify the raison d'étre of the well-known theoretical models and confirm the legiti-macy of my own breast-wheel development growth lifecycle model, which is based on the theoretical background of my further thesis. The fourth topic was about the future ownership change of the business owners in their companies, and the possible visions of the heritage of his companies (according to Bálint, 2004 and Rab & Szabó, 2002).
I am confident that still unexplored relation-ships and characteristics in connection with the theoretical lifecycle management models will soon be demonstrated through my empirical re-search. SM
References Adizes Institute Online. (2013). Adizes Online Test.
Retrieved November 2013, 30, from Adizes Institute Online: http://adizes.com/corporate_lifecycle.html
Adizes, I. (1992). Vállalatok életciklusai. Budapest: HVG RT.
Bálint, A. (2004). Hogyan tovább kis- és középvállalkozások? – Stratégiai lehetőségek az utódlás folyamatában. Vezetéstudomány, 35, 67-72.
Farkas, F. (2005). Változásmenedzsment. Budapest: Akadémiai kiadó.
Göblös, Á., & Gömöri, K. (2004). A vállalati életciklus modellről. Vezetéstudomány, 35 (10), 41-50.
Greiner, L. (1998). Evolution and Revolution as Organizations Grow. Harvard Business Review (May-June), 55-68.
Hirsch, R. D., & Peters, M. P. (1994). Vállalkozás Új vállalkozások indítása, fejlesztése és működtetése. Vezetéstudomány, 25 (6), 50-51.
Jávor, I. (1993). A vállalkozások növekedése szervezetszociológiai megközelítésben. MVA Vállalkozáskutatási füzetek, 4, 77.
Papp, I. (2006). Tanulás és Stratégiaalkotás kis- és középvállalatoknál. Thesis. Budapest: Budapesti Műszaki és Gazdaságtudományi Egyetem, Gazdálkodás- és Szervezéstudományi Doktori Iskola.
Pataki, B. (2004). Változásmenedzsment. Budapesti Műszaki és Gazdaságtudományi Egyetem (educational manual). Budapest: Budapesti Műszaki és Gazdaságtudományi Egyetem, Gazdaság- és Társadalomtudományi Kar.
Rab, K., & Szabó, J. (2002). Kihívás – Siker. Beszámoló egy vállalkozáskutatásról. Vezetéstudomány, 12, 40-46.
Salamonné, H. A. (2006). Magyarországi kis- és középvállalkozások életútjának modellezése. Competiti, 5 (1), 51-68.
Szerb, L. (2000). Kisvállalati gazdaságtan és vállalkozástan. Pécs: Pécsi Tudományegyetem.
Szirmai, P. (2002). Kisvállalkozások fejlődési szakaszai, a szakaszváltások konfliktusai. Budapest: BKÁE.
Timmons, J. (1990). New Venture Creation: Entrepreneurship in the 1990s. Boston: Irwin.
Zsupanekné, P. I. (2008). A vállalati növekedés a vállalati életciklus-modellek tükrében. In A. Mustafa, K. É. Sándorné, & M. Anwar, Tudományos Évkönyv. Reformok Útján (pp. 45-56). Budapest: Budapesti Gazdasági Főiskola.
Correspondence
András Horváth
Doctoral School of Regional and Economic Sciences Egyetem tér 1. ÚT 210, HU-9026, Győr, Hungary
E-mail: [email protected]
STRATEGIC MANAGEMENT, Vol. 20 (2015), No. 1, pp. 011-016 UDC 339.9:658.78(497.4)
Received: April 1, 2014
Accepted: February 2, 2015
Risk Identification in International Business
Marjan Sternad Univerza v Mariboru, Fakulteta za logistiko, Celje, Slovenija Bojan Rosi Univerza v Mariboru, Fakulteta za logistiko, Celje, Slovenija
Borut Jereb Univerza v Mariboru, Fakulteta za logistiko, Celje, Slovenija
Abstract Internationalization still represents an obstacle for many companies with several years of experience, espe-cially in the field of logistics. Similar problems may be observed in other partner states, given that Slovenianlogistics sector bears the consequences of the economic crisis. The following paper analyses logistical obsta-cles when operating in international markets. More specifically, the analysis will investigate directions in thefield of logistics that may lead companies out of crisis as well as directions for long-term international opera-tions. In particular, obstacles will be analyzed in the field of purchase logistics, transport, warehousing anddistribution logistics in connection with the risk identification. Keywords Internationalization, logistics, logistics obstacles, risk identification.
Introduction In a globalizing economy, regions and firms are competing on an international level. Internation-alization contributes to the economic development of nations, in developing national industries, im-proving productivity and creating employment. Small firms play an important role in this process. Export oriented entrepreneurship contributes more strongly to macro-economic growth than entre-preneurial activity in general (Justinek & Sternad, 2010).
Although internationalization may be neces-sary for companies to grow and survive in the long run, it does not guarantee company’s sur-vival. Risks are an integral part of our lives and it appears that people have never devoted as much attention to the challenges of risks as we do today, and the risks and costs involved in the process are substantial (Jereb, Cvahte, & Rosi, 2013; Jereb, 2013). Smaller companies find it hard to over-come these challenges, and often suffer from their limited size and resources. Small companies not
only have more difficulties in financing their in-ternational activities; they often have limited in-ternational experience in their management teams. Nevertheless, advances in telecommunication and other technologies have considerably reduced the costs and risks involved in internationalization.
Carter, Pearson and Peng (1997) indicate that logistics obstacles are present in all segments of business operations, especially in purchasing, transport, order cycles, warehousing and interna-tional trade services. Supply chain risks should be a main concern in today's operations in any com-pany. Considering trends of globalization and global sourcing, no company today can operate in a completely secure environment without risk, deriving from supply chains. Therefore we can say that the process of risk management is crucial for continuous operations of companies in all fields of business (Jereb, Cvahte, & Rosi, 2011).
We believe that the process of risk assessment, especially risk identification and analysis, are the most crucial in the whole risk management proc-ess. We have to be aware that risks that are not
12 Marjan Sternad et al. Risk Identification in International Business
STRATEGIC MANAGEMENT, Vol. 20 (2015), No. 1, pp. 011-016
identified and defined in the first stages of risk assessment are not later treated and therefore go unseen and unmanaged (Jereb, Ivanuša, & Rosi, 2013).
We believe that the implementation of logis-tics is based on the following sources of logistics (Jereb et al, 2011):
▪ the flow of goods and services, ▪ information, ▪ logistics infrastructure and superstructure,
and ▪ people. Any consequence of risk, occurring in a supply
chain, can influence one or more of these sources. If we wish to effectively manage risks, we need to be aware of logistics sources that a specific risk and its consequences possibly affect. A supply chain is a complex system of several organiza-tions that work together in a specific environment. Based on the extent of risk consequences regard-ing the supply chain, we can define risks accord-ing to the fourth dimension in our model. A risk can come from three different origins (Jereb et al, 2011):
▪ in a company that is included in the supply chain,
▪ in the whole supply chain, ▪ outside of the supply chain, in its environ-
ment. The article shows the results of surveys of lo-
gistical problems among Slovenian companies in operating on foreign markets, in conjunction with the identification of logistical problems.
1. Methodology The research was designed for companies that operate in foreign markets, which means pro-curement of goods and services or selling goods and services abroad.
Foreign markets are European Union, other European countries, Russia, China, other Asian countries, USA, Canada, Central America, South America, Africa, Australia and New Zealand.
The questionnaire was sent to 250 randomly chosen Slovenian companies. The questionnaire consists of 11 questions that were structured in three parts:
▪ demography (activities of companies, headquarters, company size),
▪ international business (foreign market, ex-perience aboard),
▪ logistics and logistics problems (logistic outsourcing, area of logistics barriers, use of logistics infrastructure).
The questionnaire was filled out by company
leaders (in the case of micro or small companies) or the head of logistics (in the case of medium-sized and large companies).
155 questionnaires were returned and statisti-cally processed. Among the companies that par-ticipated in the survey were:
▪ 40 micro companies, ▪ 33 small companies, ▪ 47 medium-sized companies, and ▪ 35 large companies.
2. Results Among the companies included in research were 21% small, 23% large, 26% micro and 30% me-dium-sized companies.
On the basis on Decree on the Standard Classi-fication territory of Slovenia, Slovenia is divided into 12 statistical regions: Pomursko, Podravsko, Koroško, Savinjsko, Zasavsko, Spodnjeposavsko, Jugovzhodno Slovenijo, Osrednjeslovensko, Gorenjsko, Notranjsko-kraško, Goriško and Obalno-kraško.
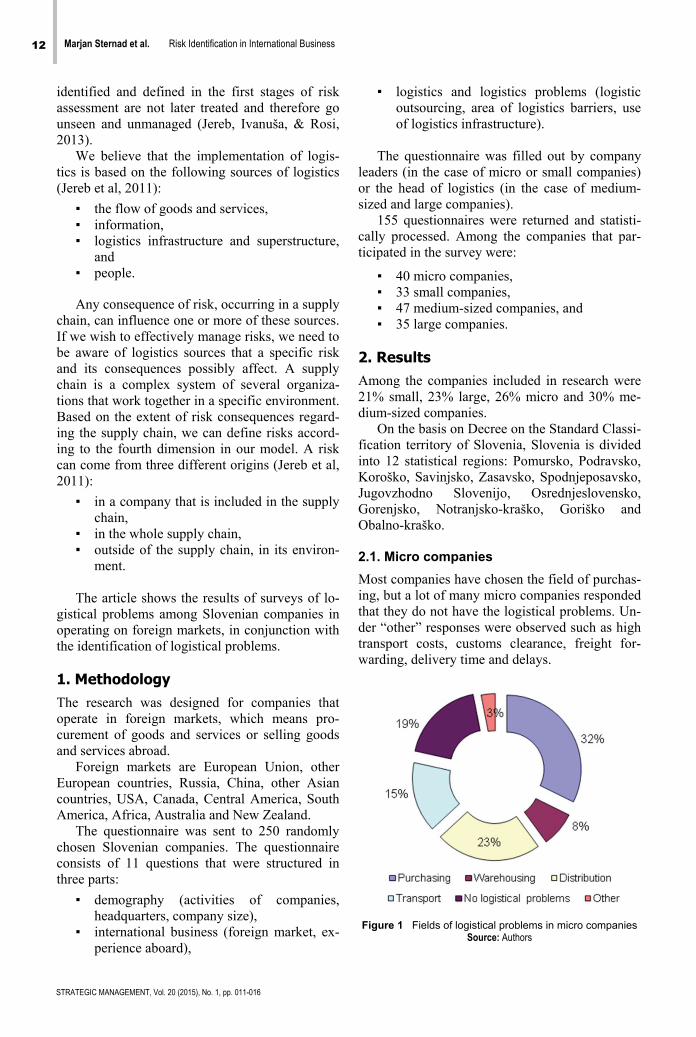
2.1. Micro companies Most companies have chosen the field of purchas-ing, but a lot of many micro companies responded that they do not have the logistical problems. Un-der “other” responses were observed such as high transport costs, customs clearance, freight for-warding, delivery time and delays.
Figure 1 Fields of logistical problems in micro companies Source: Authors
Marjan Sternad et al. Risk Identification in International Business 13
STRATEGIC MANAGEMENT, Vol. 20 (2015), No. 1, pp. 011-016
When purchasing goods in foreign markets, companies face the following problems: from 30% in our research what appears as the most common problem is the supplier reliability. With 11% followed by the problem a supplier selection is below 10%, it is seen problems in poor ordering system, poor location and elsewhere. With 40%, the companies claim that they have problems in the area of procurement, which is certainly an interesting and positive figure because it indicates that the Slovenian micro companies that operate in foreign markets, relatively successfully con-fronted with the purchase abroad.
Figure 2 Logistical problems of micro companies in purchasing
Source: Authors
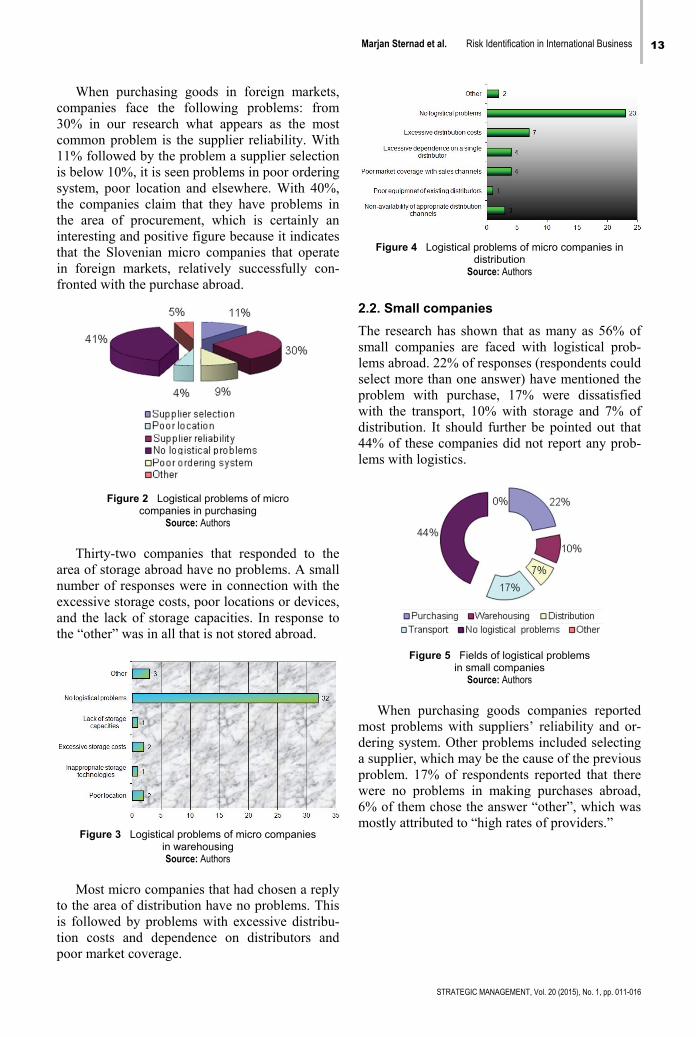
Thirty-two companies that responded to the
area of storage abroad have no problems. A small number of responses were in connection with the excessive storage costs, poor locations or devices, and the lack of storage capacities. In response to the “other” was in all that is not stored abroad.
Figure 3 Logistical problems of micro companies in warehousing Source: Authors
Most micro companies that had chosen a reply
to the area of distribution have no problems. This is followed by problems with excessive distribu-tion costs and dependence on distributors and poor market coverage.
Figure 4 Logistical problems of micro companies in distribution
Source: Authors
2.2. Small companies
The research has shown that as many as 56% of small companies are faced with logistical prob-lems abroad. 22% of responses (respondents could select more than one answer) have mentioned the problem with purchase, 17% were dissatisfied with the transport, 10% with storage and 7% of distribution. It should further be pointed out that 44% of these companies did not report any prob-lems with logistics.
Figure 5 Fields of logistical problems in small companies
Source: Authors
When purchasing goods companies reported
most problems with suppliers’ reliability and or-dering system. Other problems included selecting a supplier, which may be the cause of the previous problem. 17% of respondents reported that there were no problems in making purchases abroad, 6% of them chose the answer “other”, which was mostly attributed to “high rates of providers.”
14 Marjan Sternad et al. Risk Identification in International Business
STRATEGIC MANAGEMENT, Vol. 20 (2015), No. 1, pp. 011-016
Figure 6 Logistical problems of small companies in the field of purchasing
Source: Authors
13 small companies did not report any prob-
lems in the field of warehousing. Three compa-nies replied that they are faced with extremely high storage costs abroad, while seventeen com-panies did not respond to this question.
Figure 7 Logistical problems of small companies in warehousing Source: Authors
Fewer than ten respondents stated that in the
distribution there are logistical problems. Other companies did not report on any distribution prob-lems in foreign markets.
Figure 8 Logistical problems of small companies in distribution Source: Authors
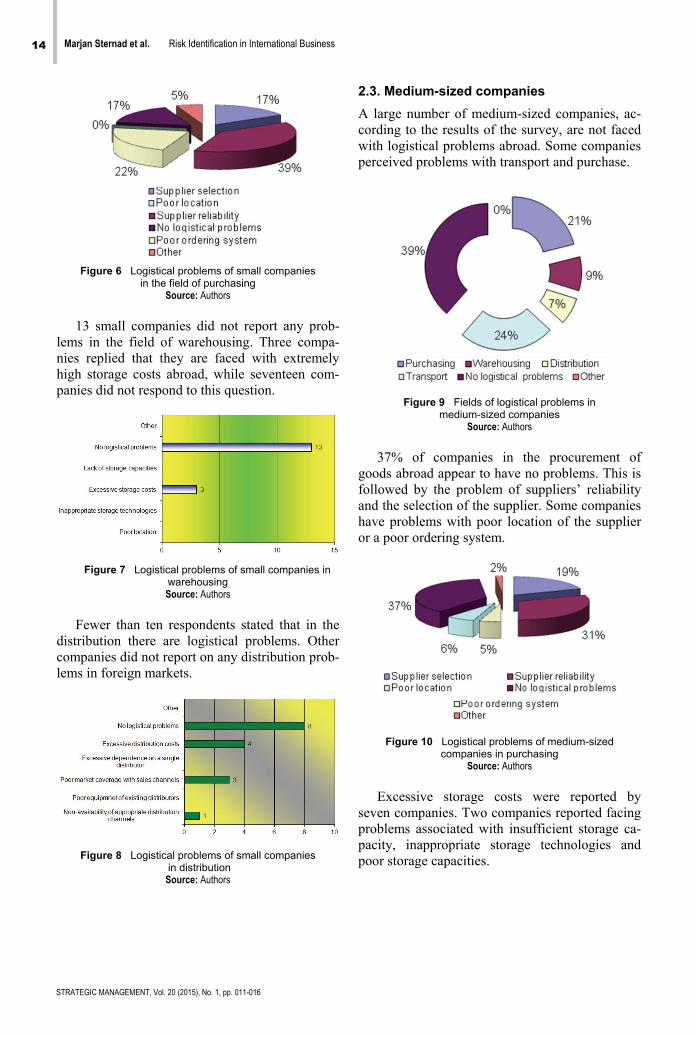
2.3. Medium-sized companies A large number of medium-sized companies, ac-cording to the results of the survey, are not faced with logistical problems abroad. Some companies perceived problems with transport and purchase.
Figure 9 Fields of logistical problems in medium-sized companies
Source: Authors
37% of companies in the procurement of
goods abroad appear to have no problems. This is followed by the problem of suppliers’ reliability and the selection of the supplier. Some companies have problems with poor location of the supplier or a poor ordering system.
Figure 10 Logistical problems of medium-sized companies in purchasing
Source: Authors
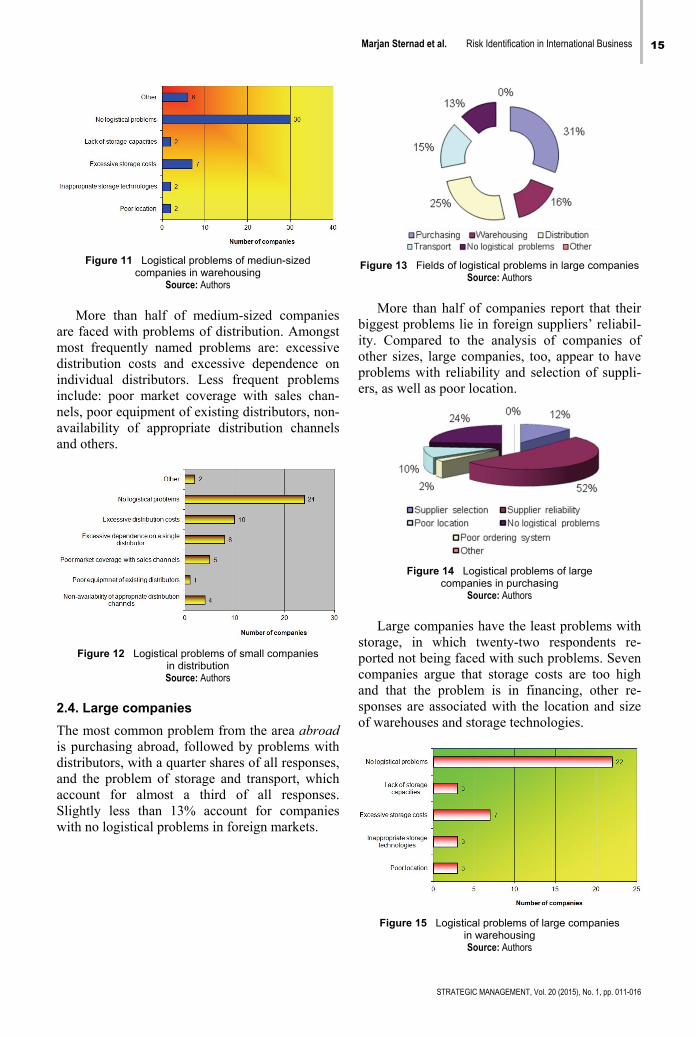
Excessive storage costs were reported by
seven companies. Two companies reported facing problems associated with insufficient storage ca-pacity, inappropriate storage technologies and poor storage capacities.
Marjan Sternad et al. Risk Identification in International Business 15
STRATEGIC MANAGEMENT, Vol. 20 (2015), No. 1, pp. 011-016
Figure 11 Logistical problems of mediun-sized companies in warehousing
Source: Authors
More than half of medium-sized companies
are faced with problems of distribution. Amongst most frequently named problems are: excessive distribution costs and excessive dependence on individual distributors. Less frequent problems include: poor market coverage with sales chan-nels, poor equipment of existing distributors, non-availability of appropriate distribution channels and others.
Figure 12 Logistical problems of small companies in distribution Source: Authors
2.4. Large companies The most common problem from the area abroad is purchasing abroad, followed by problems with distributors, with a quarter shares of all responses, and the problem of storage and transport, which account for almost a third of all responses. Slightly less than 13% account for companies with no logistical problems in foreign markets.
Figure 13 Fields of logistical problems in large companies Source: Authors
More than half of companies report that their
biggest problems lie in foreign suppliers’ reliabil-ity. Compared to the analysis of companies of other sizes, large companies, too, appear to have problems with reliability and selection of suppli-ers, as well as poor location.
Figure 14 Logistical problems of large companies in purchasing
Source: Authors
Large companies have the least problems with
storage, in which twenty-two respondents re-ported not being faced with such problems. Seven companies argue that storage costs are too high and that the problem is in financing, other re-sponses are associated with the location and size of warehouses and storage technologies.
Figure 15 Logistical problems of large companies in warehousing Source: Authors
16 Marjan Sternad et al. Risk Identification in International Business
STRATEGIC MANAGEMENT, Vol. 20 (2015), No. 1, pp. 011-016
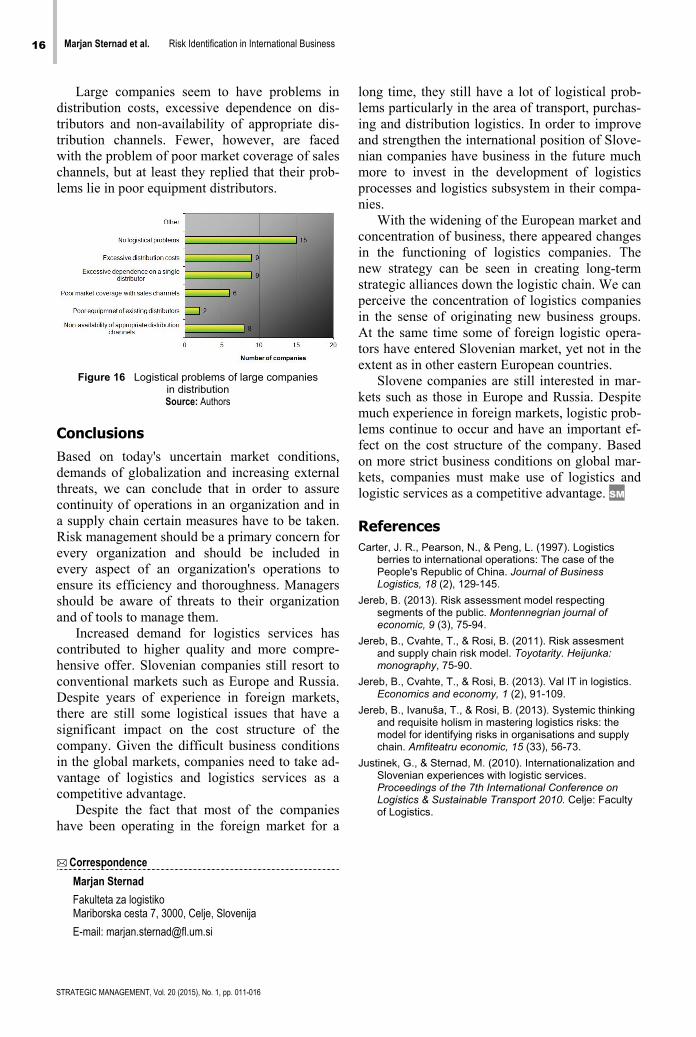
Large companies seem to have problems in distribution costs, excessive dependence on dis-tributors and non-availability of appropriate dis-tribution channels. Fewer, however, are faced with the problem of poor market coverage of sales channels, but at least they replied that their prob-lems lie in poor equipment distributors.
Figure 16 Logistical problems of large companies in distribution Source: Authors
Conclusions Based on today's uncertain market conditions, demands of globalization and increasing external threats, we can conclude that in order to assure continuity of operations in an organization and in a supply chain certain measures have to be taken. Risk management should be a primary concern for every organization and should be included in every aspect of an organization's operations to ensure its efficiency and thoroughness. Managers should be aware of threats to their organization and of tools to manage them.
Increased demand for logistics services has contributed to higher quality and more compre-hensive offer. Slovenian companies still resort to conventional markets such as Europe and Russia. Despite years of experience in foreign markets, there are still some logistical issues that have a significant impact on the cost structure of the company. Given the difficult business conditions in the global markets, companies need to take ad-vantage of logistics and logistics services as a competitive advantage.
Despite the fact that most of the companies have been operating in the foreign market for a
long time, they still have a lot of logistical prob-lems particularly in the area of transport, purchas-ing and distribution logistics. In order to improve and strengthen the international position of Slove-nian companies have business in the future much more to invest in the development of logistics processes and logistics subsystem in their compa-nies.
With the widening of the European market and concentration of business, there appeared changes in the functioning of logistics companies. The new strategy can be seen in creating long-term strategic alliances down the logistic chain. We can perceive the concentration of logistics companies in the sense of originating new business groups. At the same time some of foreign logistic opera-tors have entered Slovenian market, yet not in the extent as in other eastern European countries.
Slovene companies are still interested in mar-kets such as those in Europe and Russia. Despite much experience in foreign markets, logistic prob-lems continue to occur and have an important ef-fect on the cost structure of the company. Based on more strict business conditions on global mar-kets, companies must make use of logistics and logistic services as a competitive advantage. SM
References Carter, J. R., Pearson, N., & Peng, L. (1997). Logistics
berries to international operations: The case of the People's Republic of China. Journal of Business Logistics, 18 (2), 129-145.
Jereb, B. (2013). Risk assessment model respecting segments of the public. Montennegrian journal of economic, 9 (3), 75-94.
Jereb, B., Cvahte, T., & Rosi, B. (2011). Risk assesment and supply chain risk model. Toyotarity. Heijunka: monography, 75-90.
Jereb, B., Cvahte, T., & Rosi, B. (2013). Val IT in logistics. Economics and economy, 1 (2), 91-109.
Jereb, B., Ivanuša, T., & Rosi, B. (2013). Systemic thinking and requisite holism in mastering logistics risks: the model for identifying risks in organisations and supply chain. Amfiteatru economic, 15 (33), 56-73.
Justinek, G., & Sternad, M. (2010). Internationalization and Slovenian experiences with logistic services. Proceedings of the 7th International Conference on Logistics & Sustainable Transport 2010. Celje: Faculty of Logistics.
Correspondence
Marjan Sternad
Fakulteta za logistiko Mariborska cesta 7, 3000, Celje, Slovenija
E-mail: [email protected]
STRATEGIC MANAGEMENT, Vol. 20 (2015), No. 1, pp. 017-025 UDC 338(497.6) 339.727.22(497.6)
Received: March 5, 2014
Accepted: December 16, 2014
Competitve Advantages of the Economy of Bosnia and Herzegovina as Precondition for Atracting Foreign Direct Investments
Vitomir Starčević University of East Sarajevo, Faculty of Business and Economics, Bijeljina, Republic of Srpska
Slobodan Subotić University of East Sarajevo, Faculty of Traffic and Transport, Doboj, Republic of Srpska
Abstract Implementation of economic activities in the world market is one of the key elements of every country’s devel-opment. In order to be present in the world market it is necessary to develop competitive abilities of particulareconomic subjects, branches of economy and national economy in general. The globalization process gener-ated the period of global economic competition which requires the difference between micro and macro com-petitiveness to be made. Competitiveness has become a dominant economic topic of every country, particu-larly of those in transition. It is the main factor in attracting FDI, growing export and GDP. Foreign direct in-vestments depend on the quality of macroeconomic, business and legal environment, whereas export andGDP growth can be achieved by increasing demand for domestic products. The level of BiH competitivenessis determined by the comparative analysis of the global competitive position of the Western Balkan countries. Comparing the economic competitive position of Bosnia and Herzegovina and that of the Western Balkans, wetend to determine to what extent such competitiveness is applicable for attracting FDI, while simultaneouslytaking macroeconomic, business and legal environment into account with the analysis, as highly significantfactors. Keywords Competitiveness, global competitiveness, economy of Bosnia and Herzegovina, gross domestic product, for-eign direct investments.
Introduction Competition acts as the main regulator of the market. It represents a contest or rivalry for the purpose of achieving the best results. It contrib-utes to innovation, better business performance and overall economic growth. However, in case the competitiveness in the labour market is scarce, it directly affects the national economy in an ad-verse manner. This usually leads to protectionism, non-transparent government subsidies and barriers to entering the world market. Therefore, boosting productivity and overall competitiveness must be the leading principle in implementing economic policies of any country.
Competitiveness is the ability of a country to ensure a sustainable growth of productivity, em-ployment and quality of life in the conditions of globalization. Education, business environment, quality of business sector, infrastructure, and en-vironment represent integral parts of foundations of competitiveness. These elements enable sus-tainable growth through productivity growth, ex-port, investment efficiency and cost effectiveness (Vuković, 2007, p. 6). Macro competitiveness refers to a nation state's ability to produce, dis-tribute and service goods or services in the inter-national economy in competition with goods and services produced in other countries, and to do so
18 Vitomir Starčević et al. Competitve Advantages of the Economy of Bosnia and Herzegovina as Precondition for Atracting .....
STRATEGIC MANAGEMENT, Vol. 20 (2015), No. 1, pp. 017-025
in a way that earns a rising standard of living. The foundations of competitiveness are formed in such a way that a country benefits from an increased export which compensates for the import of goods and services while simultaneously maintaining and expanding domestic real income, which en-ables the country to meet the test of competition (Porter, 1990, p. 23). Microeconomic competi-tiveness or market success of a company is of cru-cial importance for achieving national competi-tiveness. Therefore, the central question of the competitiveness of an enterprise is its position in relation to the profitability of an industry. This means that the favourable position of the company allows above-average industrial profits in the long run.
Competitiveness of a country is influenced by many direct and indirect factors. (Kitson, Martin & Tyler, 2004) However, the most important as-pect with respect to the competitiveness of a country is the competitiveness of its enterprises as the bearers of economic development. Therefore, the enterprises are commonly placed in the fore-ground compared to many other indicators that characterize macroeconomics. Certainly, the macro-economic, business and legal environment should be neglected by no means, considering their effect onto the competitiveness of any eco-nomic sector. 1. Competitive position of Bosnia and Herzegovina (economy) compared to other countries in the region Exploiting Bosnia and Herzegovina's own re-sources was not sufficient for successful introduc-tion and competitiveness in the international mar-ket at the very beginning and during the transition process, which was largely the case with the re-maining countries of the Western Balkans as well. The economies of the Western Balkans were struck by an internal economic crisis stemming from several factors, such as economic transfor-mations implemented in the above countries, mac-roeconomic instability, poor economic manage-ment by their governments, but also due to politi-cal reasons, such as wars, sanctions and the like. Numerous sectors of the economy failed to sur-vive due to altered conditions in the world market. Some successful sectors have been privatized, but not in a way that would increase their efficiency. This caused major changes in the structure of for-eign trade flows of the Western Balkan Countries.
One of the indicators of non-competitiveness
of the Western Balkan Countries is unfavourable quantitative ratio of exports of goods and services to GDP. This ratio was significantly increased in all the Western Balkan Countries from the period of mid-last decade of the XX century to 2008. Based on the fact that the Western Balkans re-ceived a vast amount of foreign capital through privatization, new loans, current transfers and foreign direct investment (greenfield, brownfield and portfolio), it was expected that these countries would achieve high GDP growth rates. That is, that the economic growth of the Western Balkan Countries would export-oriented and would there-fore generate a very dynamic growth of export coefficients in each of them, particularly in the smallest countries (Montenegro, Albania and Ma-cedonia).
The real sector of the Western Balkan coun-tries' economy is characterised by very low ex-ports, either in absolute terms or in relation to the population, with the numbers lower than other countries undergoing transition. In fact, unlike many smaller countries in transition that have ac-complished very high growth in export coeffi-cients (from 60 to 70 percent), this is not the case in the Western Balkans. To support such state-ment regarding the low coefficients of the West-ern Balkan countries, the following data indicate that, for example, Slovakia increased its export ratio from 5% in 1995 to 83% in 2012, Hungary from 45% to 81%, the Czech Republic from 51% to 77%, and Slovenia from 50% to 70% in the same time period. (Olsen, 2013)
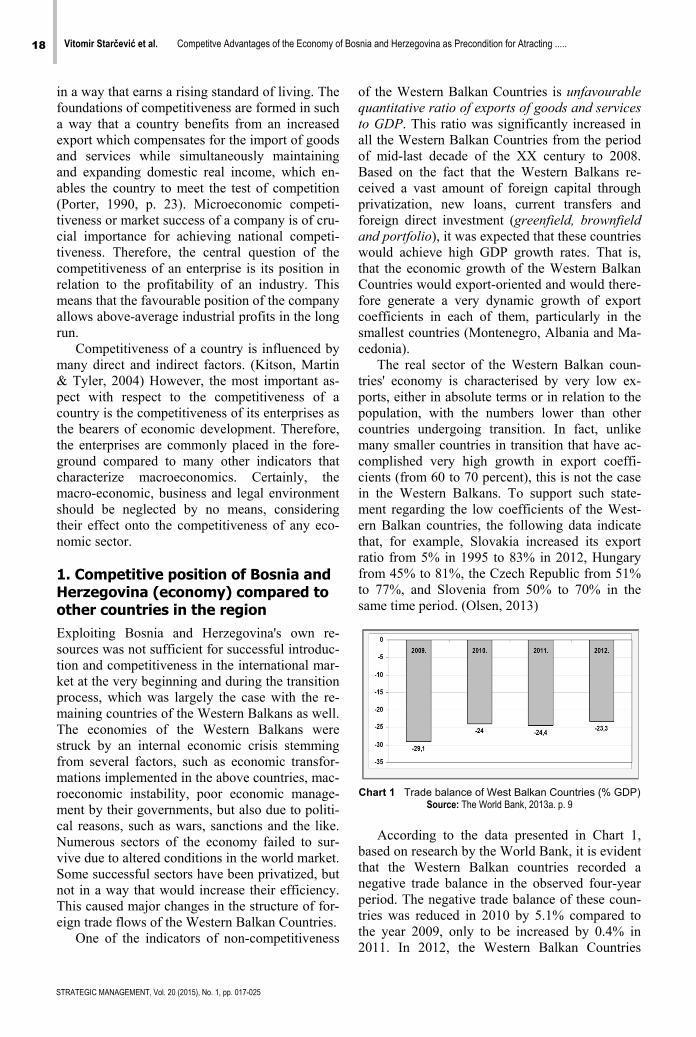
Chart 1 Trade balance of West Balkan Countries (% GDP) Source: The World Bank, 2013a. p. 9
According to the data presented in Chart 1,
based on research by the World Bank, it is evident that the Western Balkan countries recorded a negative trade balance in the observed four-year period. The negative trade balance of these coun-tries was reduced in 2010 by 5.1% compared to the year 2009, only to be increased by 0.4% in 2011. In 2012, the Western Balkan Countries
Vitomir Starčević et al. Competitve Advantages of the Economy of Bosnia and Herzegovina as Precondition for Atracting ..... 19
STRATEGIC MANAGEMENT, Vol. 20 (2015), No. 1, pp. 017-025
managed to reduce the negative trade balance by 0.9%. The reason for such trends should be sought in a reduced demand in the European Union for goods from the Western Balkans, especially in 2009, which was then continued in 2010 and 2011. According to the research made by the World Bank, a sharp decline in export was regis-tered in Serbia, Bosnia and Herzegovina and Montenegro, while their import continued to in-crease moderately.
Foreign trade deficit is one of the major prob-lems of Bosnia and Herzegovina's economy, with the exception of high unemployment rate and low level of GDP per capita. Such high foreign trade deficit is a result of the weak competitive-ness in the international market and high import-export dependence. The cause of such scarce ex-port from Bosnia and Herzegovina can be seen in the lack of conformity of products and standards with applicable international standards, lack of export support funds and aggravated export pro-cedures. The export problem lies not only with its low level, but is equally caused due to its poor structure. In other words, export includes raw ma-terials and semi-products whose prices keep drop-ping at the world market, thus taking an increas-ingly smaller share of total world exports. There-fore, it is necessary to instigate change in the ex-port structure, primarily by investing in technol-ogy and education, consequently enabling prereq-uisites for attracting foreign direct investment.
Table 1 Foreign trade indicators of BiH in the
period 2008-2012. (in billion BAM)
Source: Bosna i Hercegovina, Vijeće Ministara, Direkcija za ekonomsko planiranje, 2013. p. 41.
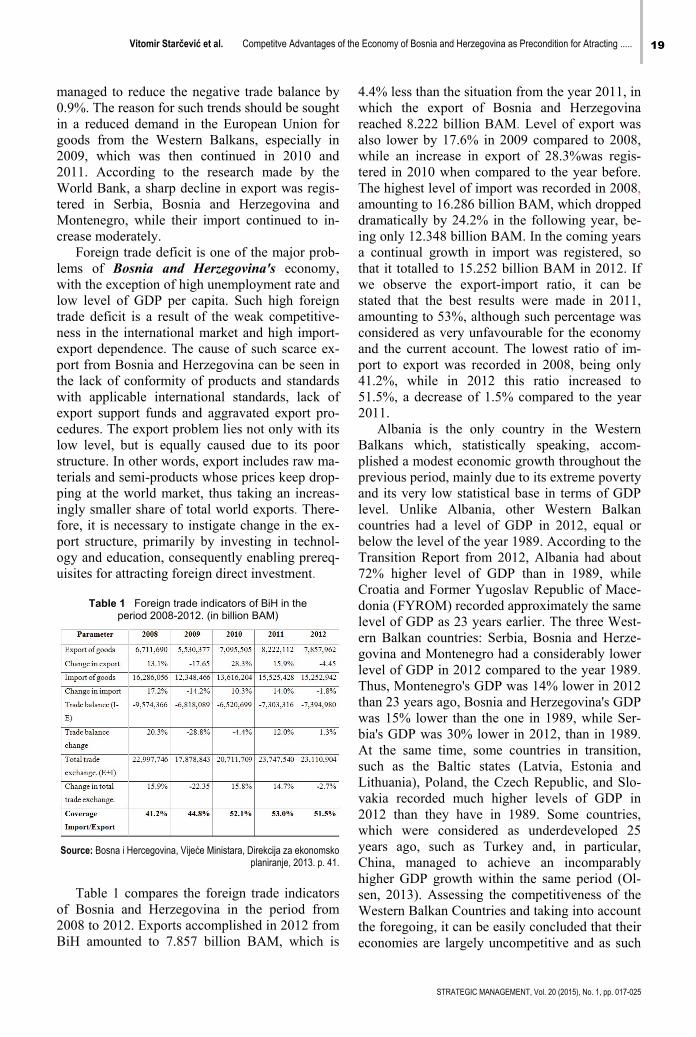
Table 1 compares the foreign trade indicators
of Bosnia and Herzegovina in the period from 2008 to 2012. Exports accomplished in 2012 from BiH amounted to 7.857 billion BAM, which is
4.4% less than the situation from the year 2011, in which the export of Bosnia and Herzegovina reached 8.222 billion BAM. Level of export was also lower by 17.6% in 2009 compared to 2008, while an increase in export of 28.3%was regis-tered in 2010 when compared to the year before. The highest level of import was recorded in 2008, amounting to 16.286 billion BAM, which dropped dramatically by 24.2% in the following year, be-ing only 12.348 billion BAM. In the coming years a continual growth in import was registered, so that it totalled to 15.252 billion BAM in 2012. If we observe the export-import ratio, it can be stated that the best results were made in 2011, amounting to 53%, although such percentage was considered as very unfavourable for the economy and the current account. The lowest ratio of im-port to export was recorded in 2008, being only 41.2%, while in 2012 this ratio increased to 51.5%, a decrease of 1.5% compared to the year 2011.
Albania is the only country in the Western Balkans which, statistically speaking, accom-plished a modest economic growth throughout the previous period, mainly due to its extreme poverty and its very low statistical base in terms of GDP level. Unlike Albania, other Western Balkan countries had a level of GDP in 2012, equal or below the level of the year 1989. According to the Transition Report from 2012, Albania had about 72% higher level of GDP than in 1989, while Croatia and Former Yugoslav Republic of Mace-donia (FYROM) recorded approximately the same level of GDP as 23 years earlier. The three West-ern Balkan countries: Serbia, Bosnia and Herze-govina and Montenegro had a considerably lower level of GDP in 2012 compared to the year 1989. Thus, Montenegro's GDP was 14% lower in 2012 than 23 years ago, Bosnia and Herzegovina's GDP was 15% lower than the one in 1989, while Ser-bia's GDP was 30% lower in 2012, than in 1989. At the same time, some countries in transition, such as the Baltic states (Latvia, Estonia and Lithuania), Poland, the Czech Republic, and Slo-vakia recorded much higher levels of GDP in 2012 than they have in 1989. Some countries, which were considered as underdeveloped 25 years ago, such as Turkey and, in particular, China, managed to achieve an incomparably higher GDP growth within the same period (Ol-sen, 2013). Assessing the competitiveness of the Western Balkan Countries and taking into account the foregoing, it can be easily concluded that their economies are largely uncompetitive and as such
20 Vitomir Starčević et al. Competitve Advantages of the Economy of Bosnia and Herzegovina as Precondition for Atracting .....
STRATEGIC MANAGEMENT, Vol. 20 (2015), No. 1, pp. 017-025
can hardly compete with other countries in transi-tion.
The World Economic Forum (WEF) defines Competitiveness as the set of institutions, policies and factors that determine the level of productiv-ity of a country. Indicator of the competitiveness level is called Global Competitiveness Index (GCI) and refers to averaging of multiple macro-economic and microeconomic components. Statis-tical factors of competitiveness, which are in-cluded in the ranking are grouped into twelve pil-lars, reflecting various aspects of complex eco-nomic reality. The twelve pillars of competitive-ness are grouped into three subindexes, which are the key to different methods of economic man-agement, namely: (1) basic factor of a driven economy, (2) efficiency of a driven economy, and (3) innovation of a driven economy. Rating the global competitiveness of the Western Balkan Countries is presented in the following table:
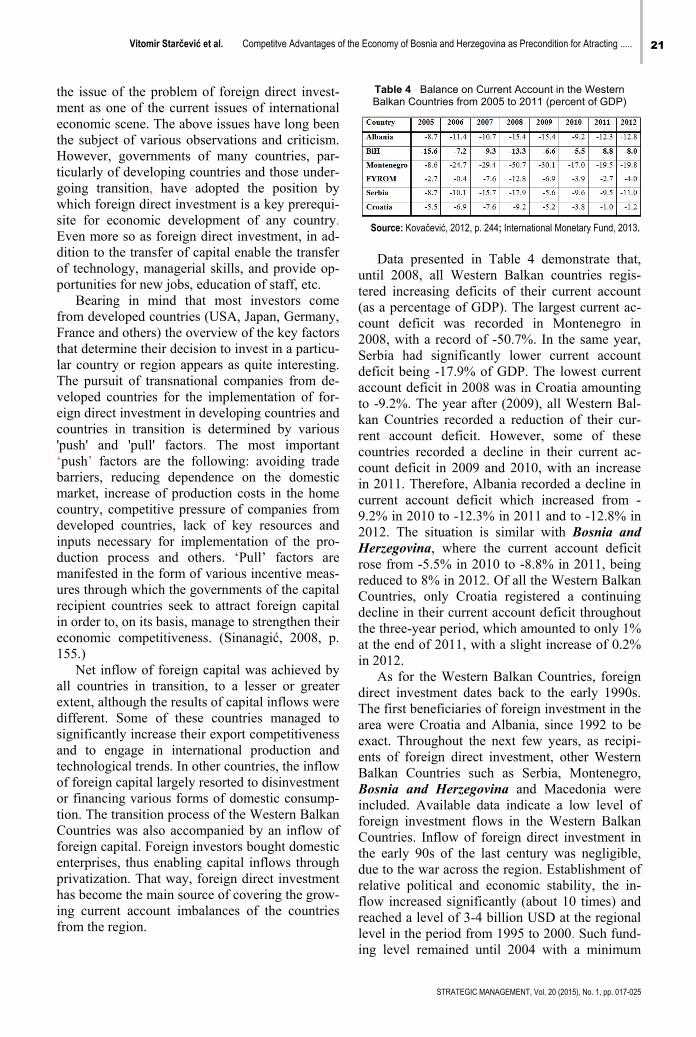
Table 2 Overview of the Global Competitiveness
Index (GCI) of Western Balkan Countries for the period 2010-2013
Source: World Economic Forum, 2009, 2010, 2011, 2012 Based on the values of Competitiveness Index
presented in Table 2, it can be noted that some of the Western Balkan Countries have managed to record growth, while others recorded a drop in its value throughout the observed three-year period. Therefore, Bosnia and Herzegovina recorded permanent growth of Competitiveness Index from 2010 to 2013, through which it reached the value of (4.0), with the country being ranked as 87 out of 148 countries on the research list. Serbia re-corded a decline in the Competitiveness Index in 2013 compared to 2012, dropping from 3.9 to (3.7) as well as recording the drop in ranking from 95 to 101 position. Albania registered a drop of Competitiveness Index in 2013, as well as a de-crease in position on the table by 6 places. Croa-tia, Macedonia and Montenegro registered the growth of their Competitiveness Indexes in 2013, implying a better ranking out of 148 countries.
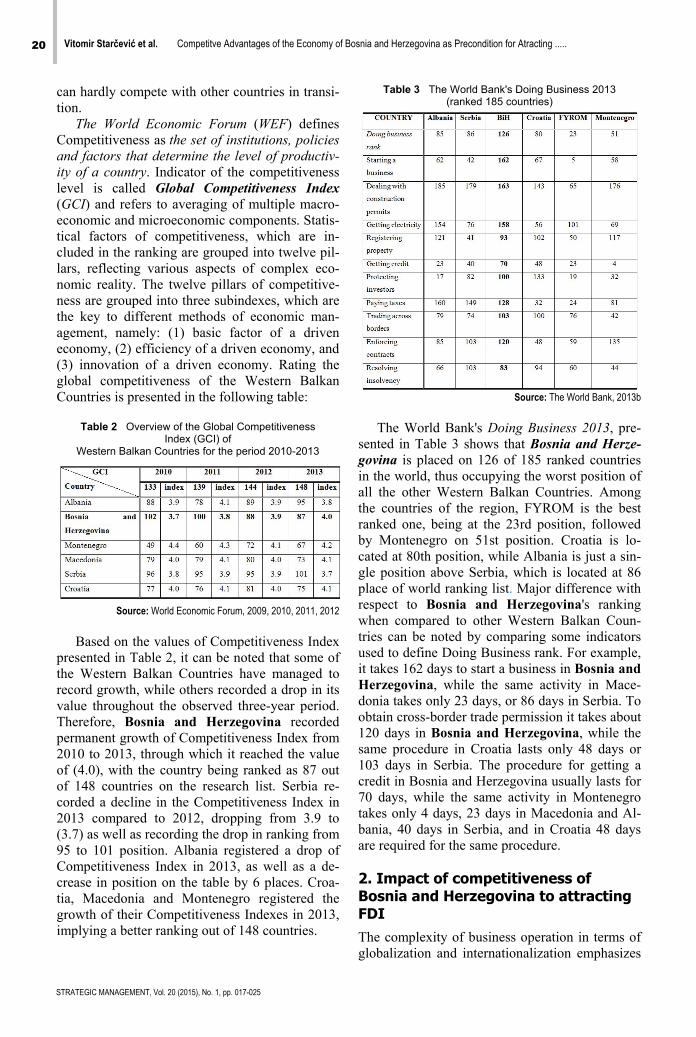
Table 3 The World Bank's Doing Business 2013 (ranked 185 countries)
Source: The World Bank, 2013b
The World Bank's Doing Business 2013, pre-
sented in Table 3 shows that Bosnia and Herze-govina is placed on 126 of 185 ranked countries in the world, thus occupying the worst position of all the other Western Balkan Countries. Among the countries of the region, FYROM is the best ranked one, being at the 23rd position, followed by Montenegro on 51st position. Croatia is lo-cated at 80th position, while Albania is just a sin-gle position above Serbia, which is located at 86 place of world ranking list. Major difference with respect to Bosnia and Herzegovina's ranking when compared to other Western Balkan Coun-tries can be noted by comparing some indicators used to define Doing Business rank. For example, it takes 162 days to start a business in Bosnia and Herzegovina, while the same activity in Mace-donia takes only 23 days, or 86 days in Serbia. To obtain cross-border trade permission it takes about 120 days in Bosnia and Herzegovina, while the same procedure in Croatia lasts only 48 days or 103 days in Serbia. The procedure for getting a credit in Bosnia and Herzegovina usually lasts for 70 days, while the same activity in Montenegro takes only 4 days, 23 days in Macedonia and Al-bania, 40 days in Serbia, and in Croatia 48 days are required for the same procedure.
2. Impact of competitiveness of Bosnia and Herzegovina to attracting FDI The complexity of business operation in terms of globalization and internationalization emphasizes
Vitomir Starčević et al. Competitve Advantages of the Economy of Bosnia and Herzegovina as Precondition for Atracting ..... 21
STRATEGIC MANAGEMENT, Vol. 20 (2015), No. 1, pp. 017-025
the issue of the problem of foreign direct invest-ment as one of the current issues of international economic scene. The above issues have long been the subject of various observations and criticism. However, governments of many countries, par-ticularly of developing countries and those under-going transition, have adopted the position by which foreign direct investment is a key prerequi-site for economic development of any country. Even more so as foreign direct investment, in ad-dition to the transfer of capital enable the transfer of technology, managerial skills, and provide op-portunities for new jobs, education of staff, etc.
Bearing in mind that most investors come from developed countries (USA, Japan, Germany, France and others) the overview of the key factors that determine their decision to invest in a particu-lar country or region appears as quite interesting. The pursuit of transnational companies from de-veloped countries for the implementation of for-eign direct investment in developing countries and countries in transition is determined by various 'push' and 'pull' factors. The most important ‘push’ factors are the following: avoiding trade barriers, reducing dependence on the domestic market, increase of production costs in the home country, competitive pressure of companies from developed countries, lack of key resources and inputs necessary for implementation of the pro-duction process and others. ‘Pull’ factors are manifested in the form of various incentive meas-ures through which the governments of the capital recipient countries seek to attract foreign capital in order to, on its basis, manage to strengthen their economic competitiveness. (Sinanagić, 2008, p. 155.)
Net inflow of foreign capital was achieved by all countries in transition, to a lesser or greater extent, although the results of capital inflows were different. Some of these countries managed to significantly increase their export competitiveness and to engage in international production and technological trends. In other countries, the inflow of foreign capital largely resorted to disinvestment or financing various forms of domestic consump-tion. The transition process of the Western Balkan Countries was also accompanied by an inflow of foreign capital. Foreign investors bought domestic enterprises, thus enabling capital inflows through privatization. That way, foreign direct investment has become the main source of covering the grow-ing current account imbalances of the countries from the region.
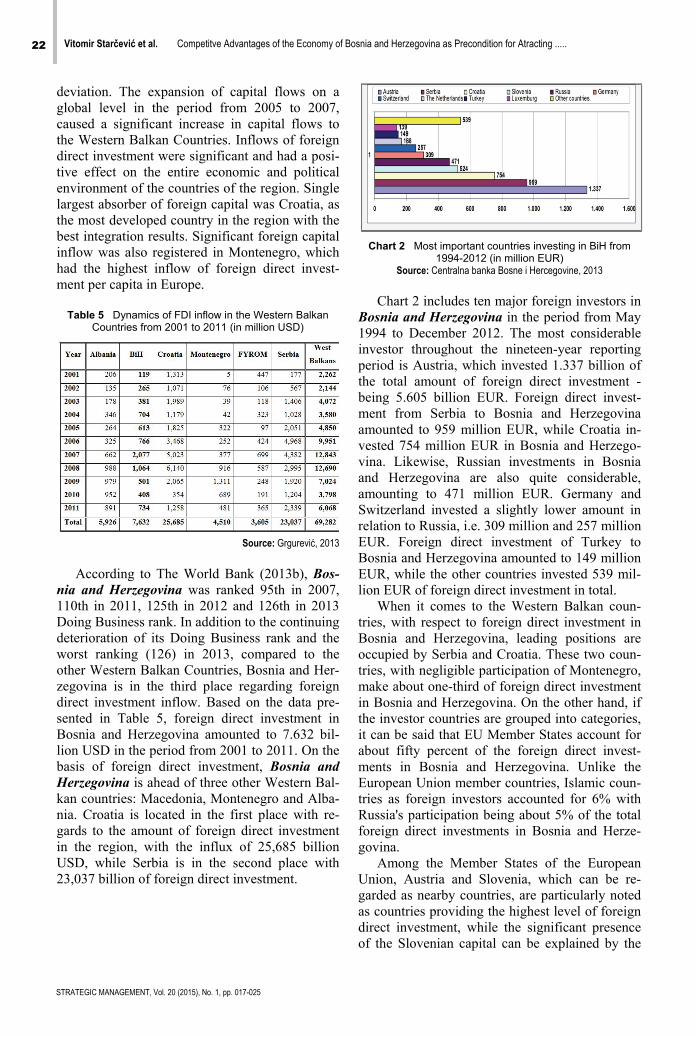
Table 4 Balance on Current Account in the Western Balkan Countries from 2005 to 2011 (percent of GDP)
Source: Kovačević, 2012, p. 244; International Monetary Fund, 2013. Data presented in Table 4 demonstrate that,
until 2008, all Western Balkan countries regis-tered increasing deficits of their current account (as a percentage of GDP). The largest current ac-count deficit was recorded in Montenegro in 2008, with a record of -50.7%. In the same year, Serbia had significantly lower current account deficit being -17.9% of GDP. The lowest current account deficit in 2008 was in Croatia amounting to -9.2%. The year after (2009), all Western Bal-kan Countries recorded a reduction of their cur-rent account deficit. However, some of these countries recorded a decline in their current ac-count deficit in 2009 and 2010, with an increase in 2011. Therefore, Albania recorded a decline in current account deficit which increased from -9.2% in 2010 to -12.3% in 2011 and to -12.8% in 2012. The situation is similar with Bosnia and Herzegovina, where the current account deficit rose from -5.5% in 2010 to -8.8% in 2011, being reduced to 8% in 2012. Of all the Western Balkan Countries, only Croatia registered a continuing decline in their current account deficit throughout the three-year period, which amounted to only 1% at the end of 2011, with a slight increase of 0.2% in 2012.
As for the Western Balkan Countries, foreign direct investment dates back to the early 1990s. The first beneficiaries of foreign investment in the area were Croatia and Albania, since 1992 to be exact. Throughout the next few years, as recipi-ents of foreign direct investment, other Western Balkan Countries such as Serbia, Montenegro, Bosnia and Herzegovina and Macedonia were included. Available data indicate a low level of foreign investment flows in the Western Balkan Countries. Inflow of foreign direct investment in the early 90s of the last century was negligible, due to the war across the region. Establishment of relative political and economic stability, the in-flow increased significantly (about 10 times) and reached a level of 3-4 billion USD at the regional level in the period from 1995 to 2000. Such fund-ing level remained until 2004 with a minimum
22 Vitomir Starčević et al. Competitve Advantages of the Economy of Bosnia and Herzegovina as Precondition for Atracting .....
STRATEGIC MANAGEMENT, Vol. 20 (2015), No. 1, pp. 017-025
deviation. The expansion of capital flows on a global level in the period from 2005 to 2007, caused a significant increase in capital flows to the Western Balkan Countries. Inflows of foreign direct investment were significant and had a posi-tive effect on the entire economic and political environment of the countries of the region. Single largest absorber of foreign capital was Croatia, as the most developed country in the region with the best integration results. Significant foreign capital inflow was also registered in Montenegro, which had the highest inflow of foreign direct invest-ment per capita in Europe.
Table 5 Dynamics of FDI inflow in the Western Balkan
Countries from 2001 to 2011 (in million USD)
Source: Grgurević, 2013 According to The World Bank (2013b), Bos-
nia and Herzegovina was ranked 95th in 2007, 110th in 2011, 125th in 2012 and 126th in 2013 Doing Business rank. In addition to the continuing deterioration of its Doing Business rank and the worst ranking (126) in 2013, compared to the other Western Balkan Countries, Bosnia and Her-zegovina is in the third place regarding foreign direct investment inflow. Based on the data pre-sented in Table 5, foreign direct investment in Bosnia and Herzegovina amounted to 7.632 bil-lion USD in the period from 2001 to 2011. On the basis of foreign direct investment, Bosnia and Herzegovina is ahead of three other Western Bal-kan countries: Macedonia, Montenegro and Alba-nia. Croatia is located in the first place with re-gards to the amount of foreign direct investment in the region, with the influx of 25,685 billion USD, while Serbia is in the second place with 23,037 billion of foreign direct investment.
Chart 2 Most important countries investing in BiH from 1994-2012 (in million EUR)
Source: Centralna banka Bosne i Hercegovine, 2013 Chart 2 includes ten major foreign investors in
Bosnia and Herzegovina in the period from May 1994 to December 2012. The most considerable investor throughout the nineteen-year reporting period is Austria, which invested 1.337 billion of the total amount of foreign direct investment - being 5.605 billion EUR. Foreign direct invest-ment from Serbia to Bosnia and Herzegovina amounted to 959 million EUR, while Croatia in-vested 754 million EUR in Bosnia and Herzego-vina. Likewise, Russian investments in Bosnia and Herzegovina are also quite considerable, amounting to 471 million EUR. Germany and Switzerland invested a slightly lower amount in relation to Russia, i.e. 309 million and 257 million EUR. Foreign direct investment of Turkey to Bosnia and Herzegovina amounted to 149 million EUR, while the other countries invested 539 mil-lion EUR of foreign direct investment in total.
When it comes to the Western Balkan coun-tries, with respect to foreign direct investment in Bosnia and Herzegovina, leading positions are occupied by Serbia and Croatia. These two coun-tries, with negligible participation of Montenegro, make about one-third of foreign direct investment in Bosnia and Herzegovina. On the other hand, if the investor countries are grouped into categories, it can be said that EU Member States account for about fifty percent of the foreign direct invest-ments in Bosnia and Herzegovina. Unlike the European Union member countries, Islamic coun-tries as foreign investors accounted for 6% with Russia's participation being about 5% of the total foreign direct investments in Bosnia and Herze-govina.
Among the Member States of the European Union, Austria and Slovenia, which can be re-garded as nearby countries, are particularly noted as countries providing the highest level of foreign direct investment, while the significant presence of the Slovenian capital can be explained by the
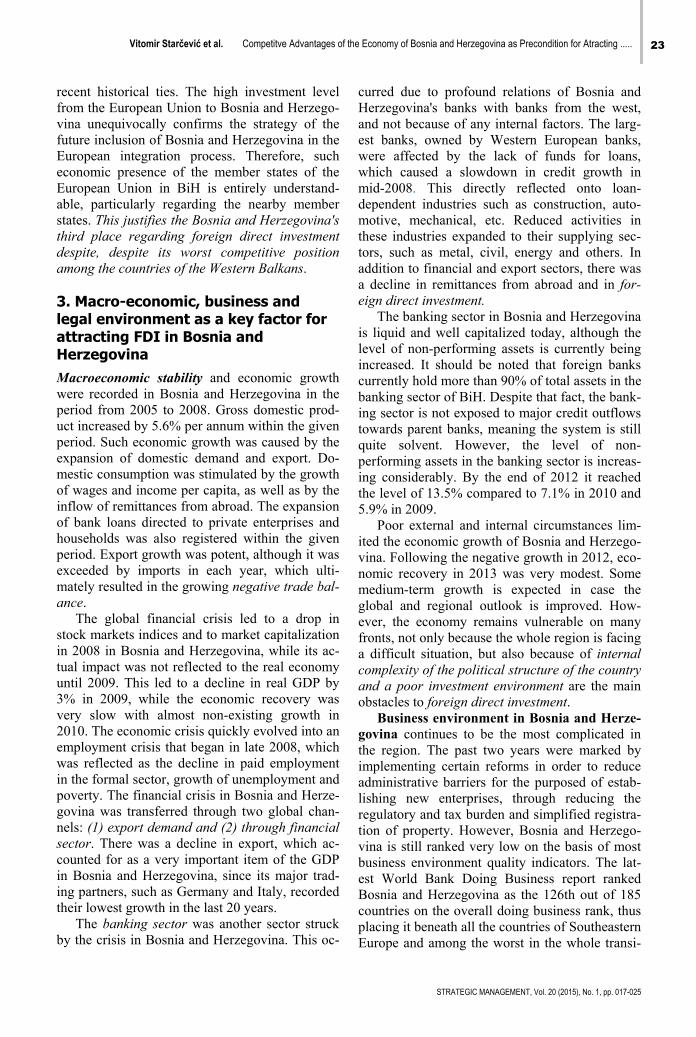
Vitomir Starčević et al. Competitve Advantages of the Economy of Bosnia and Herzegovina as Precondition for Atracting ..... 23
STRATEGIC MANAGEMENT, Vol. 20 (2015), No. 1, pp. 017-025
recent historical ties. The high investment level from the European Union to Bosnia and Herzego-vina unequivocally confirms the strategy of the future inclusion of Bosnia and Herzegovina in the European integration process. Therefore, such economic presence of the member states of the European Union in BiH is entirely understand-able, particularly regarding the nearby member states. This justifies the Bosnia and Herzegovina's third place regarding foreign direct investment despite, despite its worst competitive position among the countries of the Western Balkans.
3. Macro-economic, business and legal environment as a key factor for attracting FDI in Bosnia and Herzegovina Macroeconomic stability and economic growth were recorded in Bosnia and Herzegovina in the period from 2005 to 2008. Gross domestic prod-uct increased by 5.6% per annum within the given period. Such economic growth was caused by the expansion of domestic demand and export. Do-mestic consumption was stimulated by the growth of wages and income per capita, as well as by the inflow of remittances from abroad. The expansion of bank loans directed to private enterprises and households was also registered within the given period. Export growth was potent, although it was exceeded by imports in each year, which ulti-mately resulted in the growing negative trade bal-ance.
The global financial crisis led to a drop in stock markets indices and to market capitalization in 2008 in Bosnia and Herzegovina, while its ac-tual impact was not reflected to the real economy until 2009. This led to a decline in real GDP by 3% in 2009, while the economic recovery was very slow with almost non-existing growth in 2010. The economic crisis quickly evolved into an employment crisis that began in late 2008, which was reflected as the decline in paid employment in the formal sector, growth of unemployment and poverty. The financial crisis in Bosnia and Herze-govina was transferred through two global chan-nels: (1) export demand and (2) through financial sector. There was a decline in export, which ac-counted for as a very important item of the GDP in Bosnia and Herzegovina, since its major trad-ing partners, such as Germany and Italy, recorded their lowest growth in the last 20 years.
The banking sector was another sector struck by the crisis in Bosnia and Herzegovina. This oc-
curred due to profound relations of Bosnia and Herzegovina's banks with banks from the west, and not because of any internal factors. The larg-est banks, owned by Western European banks, were affected by the lack of funds for loans, which caused a slowdown in credit growth in mid-2008. This directly reflected onto loan-dependent industries such as construction, auto-motive, mechanical, etc. Reduced activities in these industries expanded to their supplying sec-tors, such as metal, civil, energy and others. In addition to financial and export sectors, there was a decline in remittances from abroad and in for-eign direct investment.
The banking sector in Bosnia and Herzegovina is liquid and well capitalized today, although the level of non-performing assets is currently being increased. It should be noted that foreign banks currently hold more than 90% of total assets in the banking sector of BiH. Despite that fact, the bank-ing sector is not exposed to major credit outflows towards parent banks, meaning the system is still quite solvent. However, the level of non-performing assets in the banking sector is increas-ing considerably. By the end of 2012 it reached the level of 13.5% compared to 7.1% in 2010 and 5.9% in 2009.
Poor external and internal circumstances lim-ited the economic growth of Bosnia and Herzego-vina. Following the negative growth in 2012, eco-nomic recovery in 2013 was very modest. Some medium-term growth is expected in case the global and regional outlook is improved. How-ever, the economy remains vulnerable on many fronts, not only because the whole region is facing a difficult situation, but also because of internal complexity of the political structure of the country and a poor investment environment are the main obstacles to foreign direct investment.
Business environment in Bosnia and Herze-govina continues to be the most complicated in the region. The past two years were marked by implementing certain reforms in order to reduce administrative barriers for the purposed of estab-lishing new enterprises, through reducing the regulatory and tax burden and simplified registra-tion of property. However, Bosnia and Herzego-vina is still ranked very low on the basis of most business environment quality indicators. The lat-est World Bank Doing Business report ranked Bosnia and Herzegovina as the 126th out of 185 countries on the overall doing business rank, thus placing it beneath all the countries of Southeastern Europe and among the worst in the whole transi-
24 Vitomir Starčević et al. Competitve Advantages of the Economy of Bosnia and Herzegovina as Precondition for Atracting .....
STRATEGIC MANAGEMENT, Vol. 20 (2015), No. 1, pp. 017-025
tion region. Bosnia and Herzegovina is particu-larly low ranked in indicators for obtaining a con-struction permit (163rd place), starting a busi-nesses (162nd) and getting electricity (158th).
Bosnia and Herzegovina is somewhat better positioned according to the World Economic Fo-rum (WEF) Global Competitiveness Index, being ranked as 87th out of 148 ranked countries. Ac-cording to the WEF Global Competitiveness In-dex, quality of public institutions in Bosnia and Herzegovina is high compared to other countries in the region (Bosnia and Herzegovina is ranked as 79th with reference to this indicator, positioned worse than only two countries in South East Europe), despite its complex political environ-ment. According to the indicators of the quality of macroeconomic environment, Bosnia and Herze-govina is ranked as 97th which is slightly below the average for the region of Southeast Europe. However, according to the quality of infrastruc-ture indicators, i.e. transport infrastructure, Bosnia and Herzegovina is extremely poorly positioned, being ranked as 143rd, or the second last from a total of 144 countries covered.
According to the results of the European Bank for Reconstruction and Development and the World Bank from 2010, related to researching the business environment and to the successful opera-tion of companies, entrepreneurs and managers specified the following as the main obstructions in business: (1) political instability, (2) High tax rates, (3) vast informal sector, and (4) difficult access to financing. Reports on the credit rating of well-known international rating agencies such as Standard & Poor's and Moody's provide stable outlook for Bosnia and Herzegovina. When it comes to economic freedom, National Heritage monitors economic trends of 179 countries, where Bosnia and Herzegovina is ranked as 104th, right below Nicaragua, Cambodia and Kenya. Accord-ing to the Corruption Perceptions Index (CPI) of Transparency International Agency for the year 2012, Bosnia and Herzegovina is ranked as 72nd of 176 countries surveyed, although such ranking is quite favourable when compared to many re-gional neighbours.
Legal environment in Bosnia and Herzego-vina is still a complex and problematic issue. Some significant reforms were made in the previ-ous period, but it is necessary to do even more. Multilayered constitutional and political structure of the country still has a negative impact on legal reform. Problems of multilayered legal structure are visible in numerous areas of law. Corporate
governance is regulated at the entity level, thus causing emergence of two different systems of corporate governance, with each entity having its own primary and secondary legislation. In the judiciary sector, there are two separate legal sys-tems and limited coordination at the state level. Legal framework for the securities market is regu-lated at the entity level, with each entity having its own Securities and Exchange Commission.
In theory, with reference to certain areas, Bos-nia and Herzegovina's legislation is characterised by the laws which, in principle, comply or even exceed the standards in comparison to other coun-tries. However, the implementation of such laws in practice is often poor due to incompetency of key institutions. For example, the law on bank-ruptcy and insolvency has been rated as a law of “high compliance” with international standards. However, in practice the insolvency regime is marked by weaknesses in implementing appropri-ate regulation of insolvency office holders. Like-wise, the legal and regulatory framework for se-cured transactions is modern, but its enforcement is sluggish and susceptible to obstruction. Effi-ciency of the courts in Bosnia and Herzegovina is still marked as the weakest link of the system, enabling the debtors to obstruct the enforcement proceedings. The laws on concessions are com-plex and fragmented. Similar issued are regulated by a combined set of legislative acts that coexist at various levels. Thus, Bosnia and Herzegovina's prospects largely rely on the practical implemen-tation of legal reforms and internal and regional integration.
Conclusion In the recent decade of the current century, com-petitiveness has become a dominant economic topic. The fact has been accentuated by the global financial crisis that has affected and still affects, the development of numerous countries in transi-tion, particularly the Western Balkan countries. Recent research results have shown that all West-ern Balkan countries have very low export coeffi-cients, thus having a negative trade balance ex-pressed as a GDP percentage. Bosnia and Herze-govina is by no means different from other coun-tries of the region. Namely, the trade deficit is one of the major problems of this country's economy, and is the result of weak competitiveness in the international market and high import-export de-pendence. Ranked as 87th, Bosnia and Herzego-vina positioned as the third country in the region, placed above Albania and Serbia. However, when
Vitomir Starčević et al. Competitve Advantages of the Economy of Bosnia and Herzegovina as Precondition for Atracting ..... 25
STRATEGIC MANAGEMENT, Vol. 20 (2015), No. 1, pp. 017-025
it comes to doing business and starting business rank of 126th position, Bosnia and Herzegovina is by far the lowest ranked country in the Western Balkans. The subject of this survey is the competi-tiveness of the economy of Bosnia and Herzego-vina in comparison to other Western Balkan coun-tries and the impact of economic competitiveness to foreign direct investment in the country. De-spite such poor competitiveness indicators, studies have shown that Bosnia and Herzegovina is still the third ranked country in the region in terms of inflow of foreign direct investment, right after Croatia and Serbia. Surely, such ranking is surely caused by the geopolitical and strategic position of BiH which investors such as EU countries, Is-lamic countries and Russia forward their invest-ments in. Since macroeconomic, business and legal environment are essential factors for attract-ing foreign direct investment, Bosnia and Herze-govina still requires a fair amount of time to over-come the problems of transition and to improve elements of all three factors. By doing so, it would manage to compete with neighbouring countries when it comes to attracting foreign direct invest-ment, thus bringing better competitiveness to its economy, reduction of its trade deficit and would increase the growth rate of its GDP and employ-ment rate. SM
References Bosna i Hercegovina, Vijeće Ministara, Direkcija za
ekonomsko planiranje. (2013, April). Bosna i Hercegovina, Ekonomski trendovi, Godišnji izvjštaj 2012. Retrieved January 28, 2014 from Direkcija za ekonomsko planiranje BiH: www.dep.gov.ba/dep_publikacije/ekonomski_trendovi/?id=1574
Centralna banka Bosne i Hercegovine. (2013). Godišnji izvještaj 2012. Retrieved 2 February, 2014 from Centralna banka Bosne i Hercegovine: http://cbbh.ba/files/godisnji_izvjestaji/2012/GI_2012_bs.pdf
Grgurević, N. (2013). Uticaj stranih direktnih investicija na zemlje u tranziciji. Retrieved February 2, 2014 from Univerzitet za poslovni inženjering i menadžment: http://univerzitetpim.com /wp-content/uploads/2013/10/Grgurevi%C4%87-N
Grgurević, N. (2013). Uticaj stranih direktnih investicija na zemlje u tranziciji. Retrieved February 2, 2014 from Univerzitet za poslovni inženjering i menadžment: http://univerzitetpim.com/wp-content/uploads/2013/
International Monetary Fund. (2013, October). World Economic and Financial Surveys, World Economic Outlook, Transitions and Tensions. Retrieved February 2, 2014 from http://www.imf.org/external/pubs/ft/weo/2013/02/pdf/text.pdf
Kitson, M., Martin, R., Tyler, P. (2004). Regional Competitiveness: An Elusive yet Key Concept? Regional Studies 38 (9), 991-999.
Kovačević, R. (2012). Međunarodno tržište kapitala. Beograd: Ekonomski fakultet.
Olsen, K. B. (2013). Užas balkanske tranzicije. Retrieved February 3, 2014 from Aurora: http://www.aurora.hr/2386/uzasi-balkanske-tranzicije/
Porter, M. E. (1990). The Competitive Advantage of Nations. New York: Palgrave.
Sinanagić, M. (2008). Strategijske varijante ulaska na inostrano tržište. Brčko: Gamma-X.
The World Bank. (2013). Southeast Europe - Periodic Economic Review No. 4. Washington: The World Bank.
The World Bank. (2013). Doing bussines. Retrieved February 3, 2014 from Open Knowledge Respository: https://openknowledge.worldbank.org/
Vuković, D. (2007). Quality and Competitiveness, Governance & Management, Consulting services. Zagreb: incus Ltd.
World Economic Forum. (2009). The Global Competitiveness Report 2009-2010. Retrieved February 2, 2014 from World Economic Forum: http://www3.weforum.org/docs/WEF_GlobalCompetitivenessReport_2009-10.pdf
World Economic Forum. (2010). The Global Competitiveness Report 2010-2011. Retrieved February 2, 2014 from World Economic Forum: http://www3.weforum.org/docs/WEF_GlobalCompetitivenessReport_2010-11.pdf
World Economic Forum. (2011). The Global Competitiveness Report 2011-2012. Retrieved February 2, 2014 from World Economic Forum: http://www3.weforum.org/docs/WEF_GCR_Report_2011-12.pdf
World Economic Forum. (2012). The Global Competitiveness Report 2012-2013. Retrieved February 2, 2014 from World Economic Forum: http://www3.weforum.org/docs/WEF_GlobalCompetitivenessReport_2012-13.pdf
Correspondence
Vitomir Starčević
Faculty of Business and Economics Semberskih ratara bb, 76300, Bijeljina, Republic of Srpska
E-mail: [email protected]
STRATEGIC MANAGEMENT, Vol. 20 (2015), No. 1, pp. 026-033 UDC 658.011.4 005.5
Received: October 15, 2014 Accepted: January 9, 2015
Integration of Critical Success Factors in Order to Improve Performance of the Company
Јеlena Tadić University of Novi Sad, Faculty of Economics in Subotica, Serbia
Agneš Boljević University of Novi Sad, Faculty of Economics in Subotica, Serbia
Abstract The paper is motivated by the practical and always current problem of achieving planned and improving exist-ing enterprise performance. Research suggests that management rarely understands what is it that contrib-utes to the creation and strengthening of the value of the company, its competitiveness and, consequently, achieving success. In a turbulent and unstable business environment, managers cannot afford the luxury ofnot understanding, and, ultimately, not knowing the competence of enterprise. Key activities that contribute tothe success of enterprise are critical success factors (CSFs). Components of the strategy that the companymust stand out in order to surpass the competition are these activities. These activities ensure the realizationof high company performance. The focus of this paper is to identify an integrated set of critical success fac-tors, with adequate quantification, using key performance indicators, which contributes to the improvement oforganizational performance. With the intention of determining the factors that will stand the company in rela-tion to the competition, it is necessary to consider the influence of internal and external environment. The pa-per will also display impacts that management must pay attention to during the definition of an integrated setof critical success factors. Contribution of the paper lies in the analysis of the issues that are crucial to thesuccess of companies, and in establishing a set of critical success factors that determinable affect to theachievement of company performance. Keywords Critical success factors, key performance indicators, performance of the company.
Introduction Critical success factors (CSF’s) are the result of focusing on the important things in order to achieve business success. Although the company can be successful in fulfilling a multitude of activ-ities, not all activities are critical to the success of business. Therefore, some are critical, and repre-sent critical success factors. According to its orig-inators, the critical success factors are the “limited number of aspects (areas) in which results, if they are satisfactory, will enable successful competi-tive performance” (Rockart & Hofman, 1992). Johnson and Scholes define the key success fac-tors as “those components of strategy where the company must excel to outperform competition”
(Johnson, & Scholes, 1997). These are competen-cies that ensure the achievement of economic suc-cess of the company. CIMA defines critical suc-cess factors as “an element of the organizational activity which is central to its future success” (Botten, 2009, p. 19). Most of the literature on critical success factors describes their informa-tional perspective. In his article on possibilities to improve the reporting top management about key information, John Rockart first used the term "critical success factor". He defines the critical success factors as several key areas within which actions must perform well. As a result, the critical success factors are areas that special attention must be paid to (Rockart, 1979, p. 81). Simon also emphasizes the need to separate important infor-
Јеlena Tadić et al. Integration of Critical Success Factors in Order to Improve Performance of the Company 27
STRATEGIC MANAGEMENT, Vol. 20 (2015), No. 1, pp. 026-033
mation from a multitude of other-generated in-formation on company business. The basic re-quirement in the design of a company's communi-cational system is not to decrease the scarcity of information, but to prevent their accumulation. In this way, greater attention is devoted to that in-formation which is relevant to the fulfilment of business tasks (Simon, 1997). Bulen also associ-ates critical success factors with the reporting sys-tem. She points out that “critical success factors, in conjunction with relevant, computer-based in-formation help managers in making better deci-sions” (Bullen, 1995, p. 14). Dickinson, Ferguson and Sircar provide a broader explanation of the critical success factors. According to them, the concept of critical success factors is. “... a formal process of establishing and maintaining corporate priorities. CSFs are internal or external events or possible events that can affect the firm positively or negatively and thus require special attention. CSFs provide an early warning system for man-agement and a way to avoid surprises or missed opportunities.” (Crandall & Crandall, 2008, p. 22).
In order to maintain the functioning of busi-ness at the desired level, CSFs help the manage-ment to focus on the priority decisions and activi-ties. Based on statements by Simon about the need for filtering important and unimportant infor-mation, other renowned thinkers of management, such as Drucker and Senge also emphasize the need for identifying important areas for manage-ment. Drucker points out that the manager's task is to optimize the available resources: staff, equipment, facilities and capital. He differentiates between effectiveness and efficiency. One of his most famous quotations is “Effectiveness is the foundation of success – efficiency is a minimum condition for survival, after success has been achieved. Efficiency is concerned with doing things right. Effectiveness is doing the right things.” (Drucker, 1974, p. 44). Therefore, effi-ciency is a process characteristics and effective-ness is the manifestation of effective practice and is often referred to as the variable of result or out-come. Senge describes how systems thinking can lead to complexity in today's business environ-ment. The goal of management is to identify the causes of organizational problems and finding effective and sustainable solutions. One of the main problems faced by managers in their organi-zations is a multitude of information, which is mostly internally generated. The challenge for managers is to choose the right information out of
a multitude of inadequate information. According to Senge, “what is most needed is the ability to distinguish what is important against what is not important, on which variables to pay more or less attention” (Senge, 1990).
1. Identification of CSFs Optimal number of critical success factors is the question when we start to research this topic. Based on the results of best practice, it was con-cluded that a company should have from 5 to 8 critical success factors, regardless of company size. Belonging to a particular industry is what highly affects the number of critical factors.
Key activities for the identification of critical success factors are:
▪ consulting strategic documents, which rep-resent the initial source for the identifica-tion of critical success factors in order to ensure consistency of performance measures with strategic directions,
▪ developing a hierarchy of critical success factors by the project team,
▪ reviewing the critical factors through work-shops,
▪ making a final version of the critical suc-cess factors after consultation with stake-holders and employees,
▪ establishing communication between all levels of management and employees about the critical success factors.
Critical success factors may change over time,
consistent with the changes in the company and the environment. Relevant literature identifies a wide range of key success factors: product quali-ty, costs, customer satisfaction, manufacturing flexibility, innovation, employee satisfaction and brand awareness (Eaton, 2005, p. 47). Research suggests that management often does not under-stand what is it that contributes to the creation and strengthening of enterprise value. As guidance for identifying key success factors, management can use the following questions (Malinić & Savić, 2011, p. 19):
1. Which factors initiate the formation of the costs?
2. What factors affect the revenue generation? 3. What is it that contributes to the undertak-
ing of an investment? 4. What factors expose the company to the
risk?
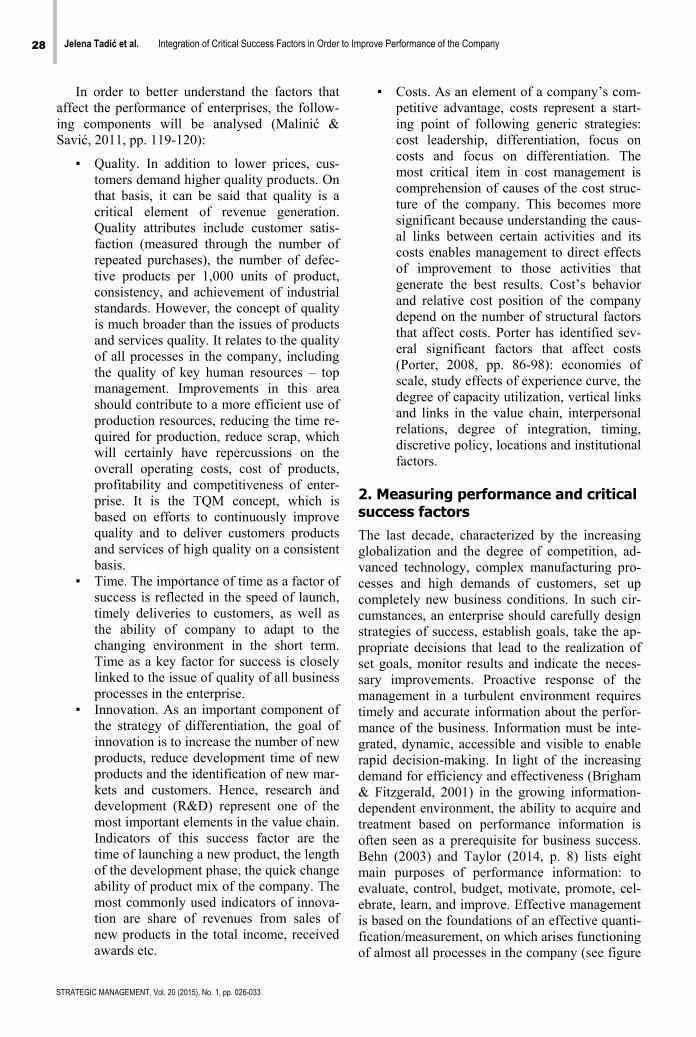
28 Јеlena Tadić et al. Integration of Critical Success Factors in Order to Improve Performance of the Company
STRATEGIC MANAGEMENT, Vol. 20 (2015), No. 1, pp. 026-033
In order to better understand the factors that affect the performance of enterprises, the follow-ing components will be analysed (Malinić & Savić, 2011, pp. 119-120):
▪ Quality. In addition to lower prices, cus-tomers demand higher quality products. On that basis, it can be said that quality is a critical element of revenue generation. Quality attributes include customer satis-faction (measured through the number of repeated purchases), the number of defec-tive products per 1,000 units of product, consistency, and achievement of industrial standards. However, the concept of quality is much broader than the issues of products and services quality. It relates to the quality of all processes in the company, including the quality of key human resources – top management. Improvements in this area should contribute to a more efficient use of production resources, reducing the time re-quired for production, reduce scrap, which will certainly have repercussions on the overall operating costs, cost of products, profitability and competitiveness of enter-prise. It is the TQM concept, which is based on efforts to continuously improve quality and to deliver customers products and services of high quality on a consistent basis.
▪ Time. The importance of time as a factor of success is reflected in the speed of launch, timely deliveries to customers, as well as the ability of company to adapt to the changing environment in the short term. Time as a key factor for success is closely linked to the issue of quality of all business processes in the enterprise.
▪ Innovation. As an important component of the strategy of differentiation, the goal of innovation is to increase the number of new products, reduce development time of new products and the identification of new mar-kets and customers. Hence, research and development (R&D) represent one of the most important elements in the value chain. Indicators of this success factor are the time of launching a new product, the length of the development phase, the quick change ability of product mix of the company. The most commonly used indicators of innova-tion are share of revenues from sales of new products in the total income, received awards etc.
▪ Costs. As an element of a company’s com-petitive advantage, costs represent a start-ing point of following generic strategies: cost leadership, differentiation, focus on costs and focus on differentiation. The most critical item in cost management is comprehension of causes of the cost struc-ture of the company. This becomes more significant because understanding the caus-al links between certain activities and its costs enables management to direct effects of improvement to those activities that generate the best results. Cost’s behavior and relative cost position of the company depend on the number of structural factors that affect costs. Porter has identified sev-eral significant factors that affect costs (Porter, 2008, pp. 86-98): economies of scale, study effects of experience curve, the degree of capacity utilization, vertical links and links in the value chain, interpersonal relations, degree of integration, timing, discretive policy, locations and institutional factors.
2. Measuring performance and critical success factors The last decade, characterized by the increasing globalization and the degree of competition, ad-vanced technology, complex manufacturing pro-cesses and high demands of customers, set up completely new business conditions. In such cir-cumstances, an enterprise should carefully design strategies of success, establish goals, take the ap-propriate decisions that lead to the realization of set goals, monitor results and indicate the neces-sary improvements. Proactive response of the management in a turbulent environment requires timely and accurate information about the perfor-mance of the business. Information must be inte-grated, dynamic, accessible and visible to enable rapid decision-making. In light of the increasing demand for efficiency and effectiveness (Brigham & Fitzgerald, 2001) in the growing information-dependent environment, the ability to acquire and treatment based on performance information is often seen as a prerequisite for business success. Behn (2003) and Taylor (2014, p. 8) lists eight main purposes of performance information: to evaluate, control, budget, motivate, promote, cel-ebrate, learn, and improve. Effective management is based on the foundations of an effective quanti-fication/measurement, on which arises functioning of almost all processes in the company (see figure

Јеlena Tadić et al. Integration of Critical Success Factors in Order to Improve Performance of the Company 29
STRATEGIC MANAGEMENT, Vol. 20 (2015), No. 1, pp. 026-033
1). Performance measurement is a topic that is often discussed but rarely defined. Literally, it is a process of quantifying action, whose action leads to results.
Performance measures that want to be created result from the critical success factors. The proba-bility of creating a successful performance meas-urement is greater, if critical success factors are better defined. Key performance indicators (KPIs) show the way for the realization of dramatic per-formance improvements. KPIs represent a set of measures focused on those aspects of organiza-tional performance that are critical to current and future success of the company. It is believed that there should not be more than 10 KPIs at the en-terprise level. Parmenter defines seven following characteristics of KPIs. KPIs (Parmenter, 2010, p. 6):
▪ are non-financial indicators (not expressed in monetary units),
▪ are measured frequently (daily or weekly), ▪ are acted on by the CEO and senior man-
agement team, ▪ clearly indicate what action is required
from the staff (e.g., staff must understand the indicators and know how to correct them),
▪ require responsibility of a team or individ-ual,
▪ have a significant impact (e.g., affect one or more of the critical success factors and more than one BSC perspective),
▪ they encourage appropriate action (they have a positive impact on other perfor-mance while poorly designed KPI can lead to dysfunctional behaviour).
Figure 1 Quantification (measuring) – the most important system of management Source: Spitzer, 2007, p. 14
The relationship between competitive strategy,
critical success factors and key performance indi-
cators is of a vital importance for the company, because if critical success factors are classified, it is easier to achieve key performance indicators. The relationship between the critical success fac-tors and key performance indicators is shown in Figure 2.
Figure 2 Critical success factors and key performance indicators
Source: Botten, 2008, p. 20
3. Integrated set of critical success factors and key performance indicators In order to develop an integrated set of critical success factors and performance indicators, it is necessary to develop taxonomy of the key success factors of the company. In the case of complex issues that need to be addressed, simplification and help upon the process of categorization is the purpose of taxonomy development. The structure of the taxonomy follows the configuration that facilitates the process of problem solving, which lead to a simpler way of identifying CSFs and key performance indicators that affect the economic success of the company.
On the basis of reviewing literature and re-specting some specific of local economic practic-es, a number of critical success factors, factor components and key performance indicators is selected that will be used for the purpose of creat-ing an integrated model of performance manage-ment. Critical success factors are grouped into five basic categories (see Figure 3): quality, flexi-bility, employees, efficiency and innovation.
Figure 3 Taxonomy of company success. Source: Authors
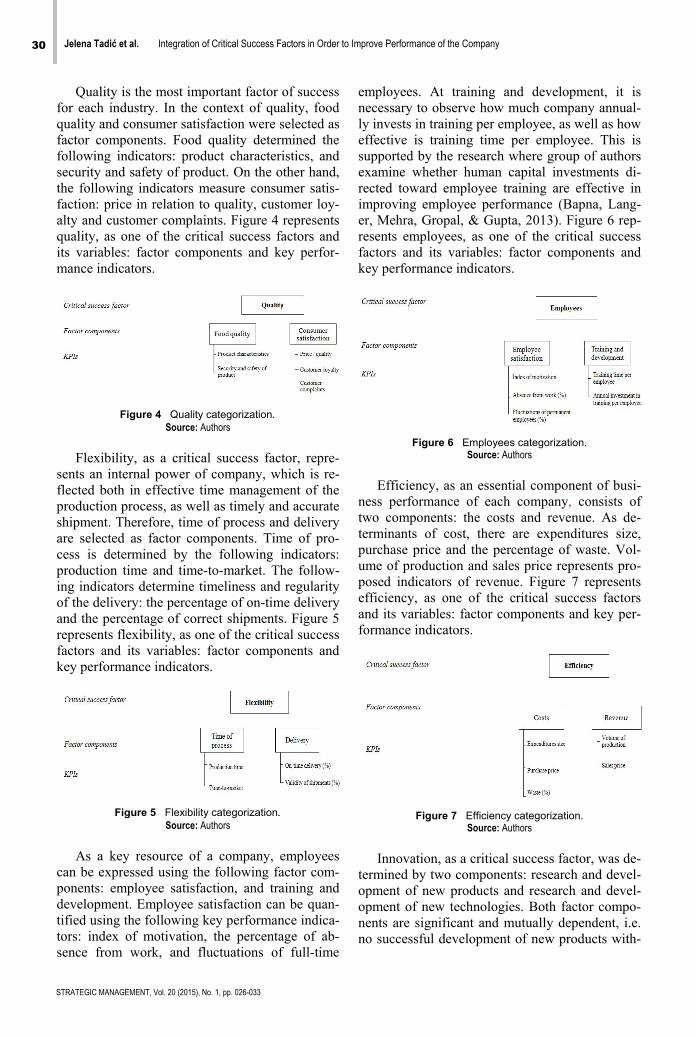
30 Јеlena Tadić et al. Integration of Critical Success Factors in Order to Improve Performance of the Company
STRATEGIC MANAGEMENT, Vol. 20 (2015), No. 1, pp. 026-033
Quality is the most important factor of success for each industry. In the context of quality, food quality and consumer satisfaction were selected as factor components. Food quality determined the following indicators: product characteristics, and security and safety of product. On the other hand, the following indicators measure consumer satis-faction: price in relation to quality, customer loy-alty and customer complaints. Figure 4 represents quality, as one of the critical success factors and its variables: factor components and key perfor-mance indicators.
Figure 4 Quality categorization. Source: Authors
Flexibility, as a critical success factor, repre-
sents an internal power of company, which is re-flected both in effective time management of the production process, as well as timely and accurate shipment. Therefore, time of process and delivery are selected as factor components. Time of pro-cess is determined by the following indicators: production time and time-to-market. The follow-ing indicators determine timeliness and regularity of the delivery: the percentage of on-time delivery and the percentage of correct shipments. Figure 5 represents flexibility, as one of the critical success factors and its variables: factor components and key performance indicators.
Figure 5 Flexibility categorization. Source: Authors
As a key resource of a company, employees
can be expressed using the following factor com-ponents: employee satisfaction, and training and development. Employee satisfaction can be quan-tified using the following key performance indica-tors: index of motivation, the percentage of ab-sence from work, and fluctuations of full-time
employees. At training and development, it is necessary to observe how much company annual-ly invests in training per employee, as well as how effective is training time per employee. This is supported by the research where group of authors examine whether human capital investments di-rected toward employee training are effective in improving employee performance (Bapna, Lang-er, Mehra, Gropal, & Gupta, 2013). Figure 6 rep-resents employees, as one of the critical success factors and its variables: factor components and key performance indicators.
Figure 6 Employees categorization. Source: Authors
Efficiency, as an essential component of busi-
ness performance of each company, consists of two components: the costs and revenue. As de-terminants of cost, there are expenditures size, purchase price and the percentage of waste. Vol-ume of production and sales price represents pro-posed indicators of revenue. Figure 7 represents efficiency, as one of the critical success factors and its variables: factor components and key per-formance indicators.
Figure 7 Efficiency categorization. Source: Authors
Innovation, as a critical success factor, was de-
termined by two components: research and devel-opment of new products and research and devel-opment of new technologies. Both factor compo-nents are significant and mutually dependent, i.e. no successful development of new products with-
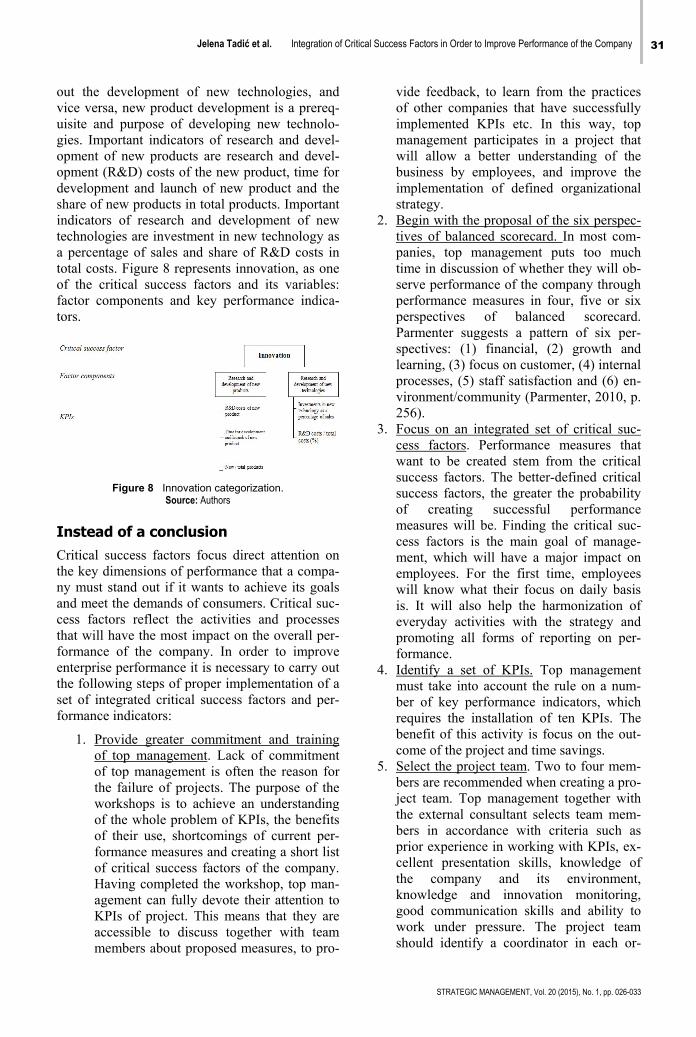
Јеlena Tadić et al. Integration of Critical Success Factors in Order to Improve Performance of the Company 31
STRATEGIC MANAGEMENT, Vol. 20 (2015), No. 1, pp. 026-033
out the development of new technologies, and vice versa, new product development is a prereq-uisite and purpose of developing new technolo-gies. Important indicators of research and devel-opment of new products are research and devel-opment (R&D) costs of the new product, time for development and launch of new product and the share of new products in total products. Important indicators of research and development of new technologies are investment in new technology as a percentage of sales and share of R&D costs in total costs. Figure 8 represents innovation, as one of the critical success factors and its variables: factor components and key performance indica-tors.
Figure 8 Innovation categorization. Source: Authors
Instead of a conclusion Critical success factors focus direct attention on the key dimensions of performance that a compa-ny must stand out if it wants to achieve its goals and meet the demands of consumers. Critical suc-cess factors reflect the activities and processes that will have the most impact on the overall per-formance of the company. In order to improve enterprise performance it is necessary to carry out the following steps of proper implementation of a set of integrated critical success factors and per-formance indicators:
1. Provide greater commitment and training of top management. Lack of commitment of top management is often the reason for the failure of projects. The purpose of the workshops is to achieve an understanding of the whole problem of KPIs, the benefits of their use, shortcomings of current per-formance measures and creating a short list of critical success factors of the company. Having completed the workshop, top man-agement can fully devote their attention to KPIs of project. This means that they are accessible to discuss together with team members about proposed measures, to pro-
vide feedback, to learn from the practices of other companies that have successfully implemented KPIs etc. In this way, top management participates in a project that will allow a better understanding of the business by employees, and improve the implementation of defined organizational strategy.
2. Begin with the proposal of the six perspec-tives of balanced scorecard. In most com-panies, top management puts too much time in discussion of whether they will ob-serve performance of the company through performance measures in four, five or six perspectives of balanced scorecard. Parmenter suggests a pattern of six per-spectives: (1) financial, (2) growth and learning, (3) focus on customer, (4) internal processes, (5) staff satisfaction and (6) en-vironment/community (Parmenter, 2010, p. 256).
3. Focus on an integrated set of critical suc-cess factors. Performance measures that want to be created stem from the critical success factors. The better-defined critical success factors, the greater the probability of creating successful performance measures will be. Finding the critical suc-cess factors is the main goal of manage-ment, which will have a major impact on employees. For the first time, employees will know what their focus on daily basis is. It will also help the harmonization of everyday activities with the strategy and promoting all forms of reporting on per-formance.
4. Identify a set of KPIs. Top management must take into account the rule on a num-ber of key performance indicators, which requires the installation of ten KPIs. The benefit of this activity is focus on the out-come of the project and time savings.
5. Select the project team. Two to four mem-bers are recommended when creating a pro-ject team. Top management together with the external consultant selects team mem-bers in accordance with criteria such as prior experience in working with KPIs, ex-cellent presentation skills, knowledge of the company and its environment, knowledge and innovation monitoring, good communication skills and ability to work under pressure. The project team should identify a coordinator in each or-
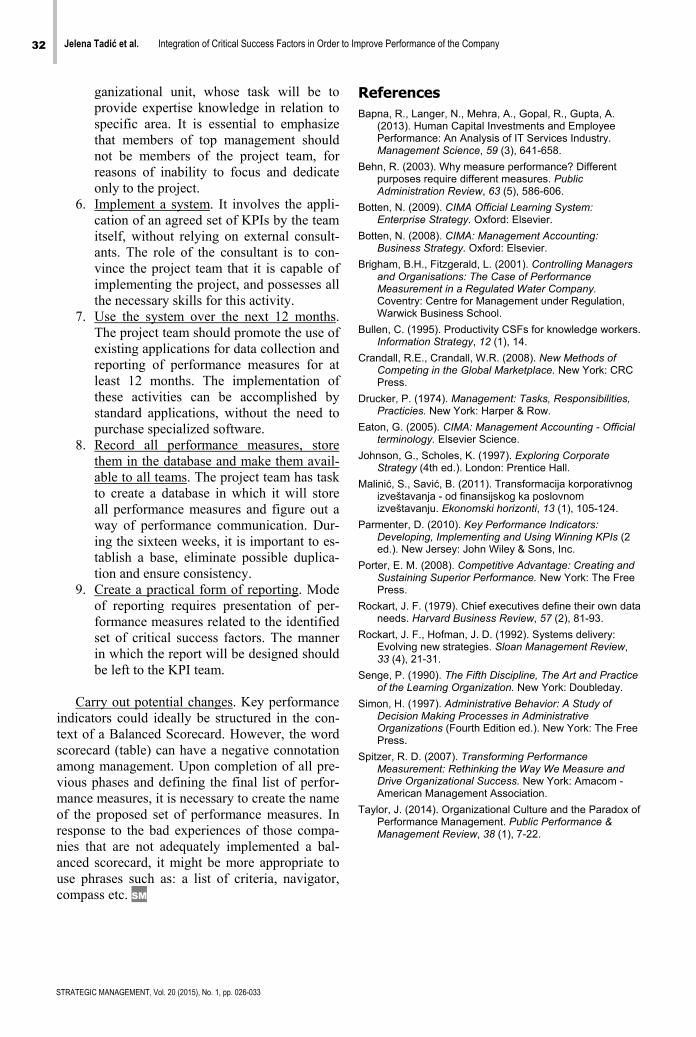
32 Јеlena Tadić et al. Integration of Critical Success Factors in Order to Improve Performance of the Company
STRATEGIC MANAGEMENT, Vol. 20 (2015), No. 1, pp. 026-033
ganizational unit, whose task will be to provide expertise knowledge in relation to specific area. It is essential to emphasize that members of top management should not be members of the project team, for reasons of inability to focus and dedicate only to the project.
6. Implement a system. It involves the appli-cation of an agreed set of KPIs by the team itself, without relying on external consult-ants. The role of the consultant is to con-vince the project team that it is capable of implementing the project, and possesses all the necessary skills for this activity.
7. Use the system over the next 12 months. The project team should promote the use of existing applications for data collection and reporting of performance measures for at least 12 months. The implementation of these activities can be accomplished by standard applications, without the need to purchase specialized software.
8. Record all performance measures, store them in the database and make them avail-able to all teams. The project team has task to create a database in which it will store all performance measures and figure out a way of performance communication. Dur-ing the sixteen weeks, it is important to es-tablish a base, eliminate possible duplica-tion and ensure consistency.
9. Create a practical form of reporting. Mode of reporting requires presentation of per-formance measures related to the identified set of critical success factors. The manner in which the report will be designed should be left to the KPI team.
Carry out potential changes. Key performance
indicators could ideally be structured in the con-text of a Balanced Scorecard. However, the word scorecard (table) can have a negative connotation among management. Upon completion of all pre-vious phases and defining the final list of perfor-mance measures, it is necessary to create the name of the proposed set of performance measures. In response to the bad experiences of those compa-nies that are not adequately implemented a bal-anced scorecard, it might be more appropriate to use phrases such as: a list of criteria, navigator, compass etc. SM
References Bapna, R., Langer, N., Mehra, A., Gopal, R., Gupta, A.
(2013). Human Capital Investments and Employee Performance: An Analysis of IT Services Industry. Management Science, 59 (3), 641-658.
Behn, R. (2003). Why measure performance? Different purposes require different measures. Public Administration Review, 63 (5), 586-606.
Botten, N. (2009). CIMA Official Learning System: Enterprise Strategy. Oxford: Elsevier.
Botten, N. (2008). CIMA: Management Accounting: Business Strategy. Oxford: Elsevier.
Brigham, B.H., Fitzgerald, L. (2001). Controlling Managers and Organisations: The Case of Performance Measurement in a Regulated Water Company. Coventry: Centre for Management under Regulation, Warwick Business School.
Bullen, C. (1995). Productivity CSFs for knowledge workers. Information Strategy, 12 (1), 14.
Crandall, R.E., Crandall, W.R. (2008). New Methods of Competing in the Global Marketplace. New York: CRC Press.
Drucker, P. (1974). Management: Tasks, Responsibilities, Practicies. New York: Harper & Row.
Eaton, G. (2005). CIMA: Management Accounting - Official terminology. Elsevier Science.
Johnson, G., Scholes, K. (1997). Exploring Corporate Strategy (4th ed.). London: Prentice Hall.
Malinić, S., Savić, B. (2011). Transformacija korporativnog izveštavanja - od finansijskog ka poslovnom izveštavanju. Ekonomski horizonti, 13 (1), 105-124.
Parmenter, D. (2010). Key Performance Indicators: Developing, Implementing and Using Winning KPIs (2 ed.). New Jersey: John Wiley & Sons, Inc.
Porter, E. M. (2008). Competitive Advantage: Creating and Sustaining Superior Performance. New York: The Free Press.
Rockart, J. F. (1979). Chief executives define their own data needs. Harvard Business Review, 57 (2), 81-93.
Rockart, J. F., Hofman, J. D. (1992). Systems delivery: Evolving new strategies. Sloan Management Review, 33 (4), 21-31.
Senge, P. (1990). The Fifth Discipline, The Art and Practice of the Learning Organization. New York: Doubleday.
Simon, H. (1997). Administrative Behavior: A Study of Decision Making Processes in Administrative Organizations (Fourth Edition ed.). New York: The Free Press.
Spitzer, R. D. (2007). Transforming Performance Measurement: Rethinking the Way We Measure and Drive Organizational Success. New York: Amacom - American Management Association.
Taylor, J. (2014). Organizational Culture and the Paradox of Performance Management. Public Performance & Management Review, 38 (1), 7-22.

Јеlena Tadić et al. Integration of Critical Success Factors in Order to Improve Performance of the Company 33
STRATEGIC MANAGEMENT, Vol. 20 (2015), No. 1, pp. 026-033
Correspondence
Јеlena Tadić
Faculty of Economics in Subotica Segedinski put 9-11, 24000, Subotica, Serbia
E-mail: [email protected]
STRATEGIC MANAGEMENT, Vol. 20 (2015), No. 1, pp. 034-037 UDC 657.375
Received: March 29, 2014
Accepted: December 23, 2014
Audit and Its Credibility in Financial Reporting
Miroslav Džupinka Alexander Dubček University in Trencin, Trencin, Slovakia
Abstract The transformation processes in the economic management, its structure and in the hierarchy of informationneeds of the economic management and the change of the information dissemination make an impact on ana-lytical processes and decision making in businesses and industry. The key issue in effective management inindustry has become communication based on objective and credible and reliable information. The paper dis-cusses current changes in information dissemination in economic management, especially the changes indeveloping and utilizing the financial reports. The key characteristics of the financial reports are their credibil-ity. Auditing plays a key role in an independent process of objective proving and cannot be replaced. Keywords Communication, information, financial reporting, credibility, risk.
Introduction Transformation processes in the structure and hi-erarchy of information requirements in company management have led to changes that make an impact on analytical processes and decision mak-ing in businesses and industry. The difficulties lie in managing information, in selecting the proper information and utilizing it in economic manage-ment communication. The increased volume of information (data) has resulted in:
▪ requirements for qualitative features such as: being correct, relevant, on time,
▪ the amount of misleading, incorrect infor-mation has been increasing,
▪ the author of the information loses his/her responsibility for the correctness of the in-formation,
▪ the information strategy, the information organization and company management have been transformed (cyberspace, inter-net shopping, integrated and consolidated units, etc),
▪ the access to the internet imposes an im-pression of information accessibility for each user, at the same time the economic data are increasingly vulnerable.
1. The change in the structure and hierarchy of the information requirements in the management The transformation i.e. the changes are condi-tioned by the changing situation in the field of doing business, in the entrepreneurship and taking the risk in this field. The change in the hierarchy of the information management means that:
a) the key role is played by the financial di-rector; his performance is not completed by “managing” the figures, it lasts longer until the results are not healthier,
b) the prevailing emotional intelligence and innovations in management are over-whelmed by the “economic added value” in decisions,
c) the unconventional approaches towards problem resolving are replaced by taking responsibility in problem solving,
d) the recession, credit crisis and a compli-cated nature of the global companies need strict monetary management,
e) the trust in the selection procedure is im-posed onto a “guy” who , in difficult times, saved the good name of the company and
Miroslav Džupinka Audit and Its Credibility in Financial Reporting 35
STRATEGIC MANAGEMENT, Vol. 20 (2015), No. 1, pp. 034-037
won the faith of the market instead of “the expensive star”,
f) the style of leadership is changing, great individuals are in decline,
g) egalitarianism and sharing responsibility are in decline, order-based management is preferred and “a firm hand” is felt,
h) being dismissed does not seem to be a manager’s exceptional decision; it is a part of the everyday life,
i) the visions without proving the values with short-term verification are not popular,
j) coming back to the “employee”, decline in preferring talented people,
k) the marketing manager is losing the impor-tance due to the decline in advertisements and the change of the methodology (e.g. the Internet) and the decrease in the budget amount,
l) the importance and the performance of dif-ferent managers and persons responsible for the social benefits in the company (cor-poration) is limited,
m) a strict financial management helping com-panies survive is preferred, and
n) the amount of covering the costs affiliated with the business trips, workshops, and representation has decreased.
2. The credibility of the environment in the process of creating and presenting economic information The development of the national information sys-tem and the process of globalization have made an impact on creation and utilizing the economic information involved in the financial reports.
2.1. The characteristics of a new environment in the process of creating and presenting the information on accounting
a) It is possible to identify some basic factors affecting the change of the environment of creating and utilizing the information in-volved in the financial reports (Slovenská komora audítorov, 2010):
▪ the need to harmonize the content of the economic information in the process of the economic integration,
▪ competitiveness as a frequent hazard, ▪ the development and globalization of
the capital markets and new financial tools (e.g. international merge of stock-exchange),
▪ development of e-business and virtual activities,
▪ changes in the way how the role of companies in the society is perceived (the impact of companies on the envi-ronment or the impact of monopoles on the citizens welfare),
▪ enlarging the scope and forms of the in-ternational exchange of goods and ser-vices,
▪ the development of global corporations, ▪ privatization of companies in the coun-
tries with a system transformation, ▪ capital trading at foreign markets, ▪ the increasing role of intangible assets
in the economy. b) There is a challenge to design a new sys-
tem of describing the company economic activities and economic results that can be comparable at different markets:
▪ the form and items of financial reports should be identical in global companies,
▪ to meet the requirements of interna-tional financial markets, e.g. in the field of derivates,
▪ to eliminate the basic differences in fi-nancial reports through political, organ-izational and professional activities aimed at developing standards and stan-dardized reports.
c) The companies in the “new economy” are
established. The intangible assets are util-ized in the company but they are not given in the accounts and are not presented in the financial reports in a real evaluation. Due to this fact there is a situation inducing non-objective financial reporting in com-panies:
▪ differences between the book value and the market value of the company,
▪ the effectiveness of the investment costs in companies cannot be evaluated in the companies selling intangible assets (in-tellectual property),
▪ the profit cannot be shared equally among the owners,
▪ unequal access to the information, ▪ ineffective spatial allocation of intangi-
ble assets.
36 Miroslav Džupinka Audit and Its Credibility in Financial Reporting
STRATEGIC MANAGEMENT, Vol. 20 (2015), No. 1, pp. 034-037
2.2. Credibility and difficulties in financial reporting in companies The system of company accounting is based on true presentation of financial information about the economy of companies. Difficulties with a reliable and objective reflection of the financial situation in companies are to be tackled by ana-lysts and managers. They are responsible for processing the data provided in the financial statement carefully although the data are audited.
The following can be ranked among the major difficulties with the credibility of financial report-ing (Kovanicová & Kovanic, 1999, pp. 264-267):
▪ Quantification of economic facts offers a summary, the aggregation of financial data; on the other hand, it does not offer the us-ers the information of non-financial charac-ter (the fact that cannot be quantified), e.g. the level of management, the information about employees, business counterparts, in-tangible assets.
▪ The techniques to determine the value are selected by the company. There is a poten-tial threat of not creating a true reflection of the financial situation. Benchmarking the results referring to time and space cannot be done, such as valuation of stocks of work in progress and completed products, various techniques of real valuation of items of the assets and liabilities.
▪ Accounting based on international stan-dards enables to select a real application of general principles, rules and processes for the entire company. The application of pos-sible alternatives can represent the resource of difference in financial statements, such as: the policy in depreciation, the policy of creating the provisions, the policy of creat-ing the provisioning.
▪ The processes and methods of consolida-tion. In case the parent company or con-solidated group of companies is evaluated, one may ask which unit of such a company represents the true reflection of the finan-cial situation in the company (individual or consolidated).
▪ Frequent restructuring of company groups (e.g. through merging and acquisi-tion), diversification of activities, specified structure of a group.
3. Suggestions for the staff creating, proving and utilizing the information on the economy of the company In the process of raising the credibility of the fi-nancial management of companies there is the staff creating the financial statements, utilizing the financial information, and proving the financial statement. They all share the same goal that is following ethical principles of creating, presenting and utilizing the information on the economy of companies.
3.1. Key rules observed in creating and utilizing financial reports:
a) being affiliated with the structure of finan-cial statements of a real company: the bal-ance sheet, profit and loss account, account of changes in own assets, account of cash flow, policy of accounting, explanations (explaining appendix),
b) accepting the requirements given by the In-ternational Financial Reporting Standards, especially IAS 1 – Presentation of the fi-nancial statement of: the basic company re-sponsible for making the financial state-ment, keeping on the company activities, accordance with the IAS/IFRS, the impor-tance and aggregation,
c) being acquainted with the accounting pol-icy in: the core of the presentation, the cur-rency calculations, lands, buildings, equipment, investment in real estate, intan-gible assets, long-term, fixed financial in-vestment, leasing, stocks, receivables, fi-nancial derivative tools, money and money equivalent, basic assets, credits, taxation and deferred tax, government funds and subsidy to purchase the fixed assets, re-serves, employees salaries and remunera-tion, contingent liabilities and assets, reve-nue recognition,
d) knowing and applying the information given in the appendix of explanations while making corrections: The explanations rep-resent a key information resource that helps the analyst prove and correct the data given in the financial statement,
e) non-quantified and the information of non-economic nature are to be utilized in the analyst’s and manager’s activity:
Miroslav Džupinka Audit and Its Credibility in Financial Reporting 37
STRATEGIC MANAGEMENT, Vol. 20 (2015), No. 1, pp. 034-037
▪ auditor’s report, ▪ reports worked out by the heads of the
departments and the information of the management accounting, and
▪ independent assessment and prognosis, analysts´ estimation in various institu-tions and others. (Sovińská, 2007; In-ternational Accounting Standards Committee Foundation, 2009)
3.2. Auditing the information provided in the financial reports Auditors are obliged to provide their service cor-rectly and to follow the ethic norms and rules that are the principles on which the confidence rating, the clients and the professionals trust is based. The auditors’ role and the role of their profes-sional association is to create the environment that will raise the rate of credibility of public about the quality of auditors’ service.
The above mentioned environment comprises a system of providing the quality control in the auditors’ services, e.g.
▪ knowing and following the ethical princi-ples of the auditor’s profession (independ-ence, credibility, the quality of the audi-tor’s performance,
▪ utilizing completely the technical standards on documenting the audit and standards on documenting specialized procedures,
▪ applying the audit as a tool of raising the credibility of the financial statement pub-lished by the company management,
▪ perceiving the audit as a key element pro-tecting the owners property and assets management.
Conclusion In the environment of changing conditions, the auditors in their performance are obliged to offer their services correctly, to follow ethical norms and rules that are the principles on which the cli-ents and professionals´ faith towards the auditors is based. The auditors fulfil their tasks correctly and professionally. In addition, the dilemma of economic managers about utilizing the informa-tion can be resolved due to knowing and relying on the credibility of the economic information given in the financial reports. SM
References International Accounting Standards Committee Foundation.
(2009). Medzinárodné účtovné štandardy IAS/IFRS. London: International Accounting Standards Committee Foundation.
Kovanicová, D., & Kovanic, P. (1999). Poklady skryté v účetníctví, díl II. Finanční analýza účetních výkazů. Praha: POLYGON.
Slovenská komora audítorov. (2010). Etický kódex audítora SKAU. Bratislava: Slovenská komora audítorov.
Sovińská, A. K. (2007). Rachunkowość na zakreçie. Rachunkowość wczoraj, dziś, jutro, (pp. 134-135). Warszawa.
Correspondence
Miroslav Džupinka
Alexander Dubček University in Trencin Študentská 2, 911 50, Trencin, Slovakia
E-mail: [email protected]
STRATEGIC MANAGEMENT, Vol. 20 (2015), No. 1, pp. 038-046 UDC 316.334.3:321.7]:339.727.22(100-772)
Received: October 14, 2014
Accepted: December 22, 2014
Determinants of FDI: Does Democracy Matter?
Hasan Farazmand Department of Economics, Chamran University, Ahvaz, Iran Mahvash Moradi Department of Economics, Chamran University, Ahvaz, Iran
Abstract Having access to foreign investments allows a country to acquire opportunities that otherwise could not be got. Many factors interfere in absorbing investments in developing countries, but there have been a limitedconsensus on which factors play an unambiguous role. Using different econometric techniques for a datasample of 5 developing countries and the period 1990 to 2012, we identify those factors that matter most forexplaining determinants of foreign direct investment. Based on results, democracy can positively affect inves-tors’ decision about where to locate capital. Also, we find foreign direct investment as a share of GDP, is sig-nificantly associated with low corruption and inflation and high openness, literacy rate and infrastructure. Keywords Foreign direct investment, democracy, panel data.
Introduction The past decades have witnessed a substantial increase in the stock of Foreign Direct Investment (FDI) around the world. In developing countries alone, the stock of FDI increased from about $10 billion in 1986 to over $99 billion in 1995 (UNCTAD, 1997). However some parts go to developing democratic countries and some to de-veloping autocratic ones. This phenomenon raises a question among scholars and policymakers “Does democracy facilitate foreign direct invest-ment?” To answer this question two perspectives exist about how democracy affects FDI. On the one hand, democratic institutions may have a positive effect on FDI because democracy pro-vides checks and balances on elected officials, and this in turn reduces arbitrary government in-tervention, lowers the risk of policy reversal and strengthens property right protection (North & Weingast, 1989; Li, 2009). Olson (1993) stated that established democracies, through executive constraint and judicial independence, guarantee property rights, which create a safe, stable and attractive environment for foreign investors to
invest. According to Olson, democracy is more attractive to FDI than autocracy.
On the other hand, multinational corporations may prefer to invest in autocratic countries be-cause of three reasons. First, democratic con-straints over elected politicians tend to weaken the oligopolistic or monopolistic positions. Second, these constraints further prevent host governments from offering generous financial and fiscal incen-tives to foreign investors. Third, broad access to elected officials and wide political participation offer institutionalized avenues through which in-digenous businesses can seek protection. In each case, the increased pluralism ensured by democ-ratic institutions generates policy outcomes that reduce the multinational enterprises degree of freedom in the host developing country (Li & Resnick, 2003). O’Donnell (1978) specified that investors share better with autocrats than with democratic leaders. Whilst both autocrats and de-mocratic leaders may receive economic benefits from FDI, autocrats face lower constraints than democratic leaders if they choose to protect for-eign investors and investments from pressures such as higher wages, labour protection and un-
Hasan Farazmand et al. Determinants of FDI: Does Democracy Matter? 39
STRATEGIC MANAGEMENT, Vol. 20 (2015), No. 1, pp. 038-046
friendly taxation schemes. According to O’Donnell, autocracy is more attractive to FDI than democracy.
While the economic determinants of FDI flow to developing countries have been analyzed to a considerable degree, it is rather astonishing that the importance of changes in democratic system in host countries has received relatively little at-tention. Papers like Wheeler & Mody (1992), Hines (1995) and Wei (2000) have studied the correlation between corruption and FDI. Brunetti & Weder (1998) found a negative link between institutional uncertainty and investment. Jun & Singh (1996) inspected the effect of an indicator for political risk on the value of foreign direct investment inflows. But there is far less literature on FDI-democracy nexus and what is clear in these papers is that no consensus has been ob-tained about the effect of democracy on FDI. For all means, there appear to be three groups in the literature; those that claim a negative effect, those that claim a positive effect, and those that find no effect.
Asiedu & Lien (2011) argued there are only twelve published articles which include democ-racy as a determinant of FDI. For instance, Res-nick (2001) and Li & Resnick (2003) found that the level of democracy has a negative impact on foreign capital flows. However, property rights encourage FDI flows. In contrast, Li & Reuveny (2000) detected FDI has a positive effect on de-mocracy. Also, Rodrik (1996), Harms & Ursprung (2001), Jensen (2003), Busse (2004), Jakobsen (2006), Jakobsen & de Soysa (2006), Adam & Filippaios (2007) and Busse & Hefeker (2007) found that multinational corporations are more likely to be attracted by countries in which de-mocracy is respected. Oneal (1994), Alesina & Dollar (2000) and Büthe & Milner (2008) did not find a significant relationship between democracy and FDI.
As can be seen, there are very few theoretical or empirical papers studying the effect of democ-ratic systems on FDI. So, the overall effect of de-mocracy on FDI has to be determined empirically. This paper tries to investigate the determinants of FDI for 5 developing countries during the 1990-2012. The remainder of this paper is organized as follows. Section 2 introduces the literature. Sec-tion 3 constructs the model, variables and date. Section 4 supplies empirical procedure and re-sults. Finally, Section 5 concludes and suggests policy recommendation.
1. Literature review From the foregoing, investigating the underlying spatial factors that operate in affecting FDI had been focal point of interests in literature, but there have been remarkably few attempts to empirically investigate the role of democratic systems in ab-sorbing FDI. As a pioneer Oneal (1994) studied how regime characteristics affect FDI. He exam-ined whether foreign firms invest more and collect more profit in authoritarian countries than in de-mocracies. He found that the relationship between regime type and FDI flows is not statistically sig-nificant, and that returns on investment are best in developed democracies but greater in authoritar-ian countries. There is an enormous empirical literature on the determinants of FDI, however, only a few of the studies embody democracy as an explanatory variable. Our literature review uncov-ers that the empirical research on FDI and democ-racy is scant and also recent. We have a tendency to review a number of them in details.
Busse (2003) tried to examine empirically the complex relationship between democracy and FDI in a systematic way, using cross-sectional and panel data analysis. The results indicated that, on average, investments by multinationals are sig-nificantly higher in democratic countries, thereby refuting the hypothesis that political repression fosters FDI. However, this positive link did not hold for the 1970s. In that period, multinational enterprises were much more likely to invest in countries with repressive regimes, and signifi-cantly lower political rights of and civil liberties for the population.
Using both cross-sectional and time-series cross-sectional tests of the determinants of FDI for more than 100 countries Jensen (2003) con-cluded that democratic political systems attract higher levels of FDI inflows both across countries and within countries over time. Democratic coun-tries are more appealing to attract as much as 70 percent more FDI than their authoritarian coun-terparts.
Busse & Hefeker (2007) explored the linkages among political risk, institutions and foreign di-rect investment inflows. For a data sample of 83 developing countries covering 1984 to 2003, they identified indicators that matter most for the ac-tivities of multinational corporations. The results showed that government stability, internal and external conflict, corruption and ethnic tensions, law and order, democratic accountability of gov-ernment, and quality of bureaucracy are highly significant determinants of foreign investment inflows.
40 Hasan Farazmand et al. Determinants of FDI: Does Democracy Matter?
STRATEGIC MANAGEMENT, Vol. 20 (2015), No. 1, pp. 038-046
Asiedu & Lien (2011) examined whether natu-ral resources in host countries alter the relation-ship between democracy and foreign direct in-vestment. They estimated a linear dynamic panel-data model using data from 112 developing coun-tries over the period 1982–2007. Results showed that the effect of democracy on FDI depends on the importance of natural resources in the host country's exports. Democracy facilitates FDI in countries where the share of natural resources in total exports is low, but has a negative effect on FDI in countries where exports are dominated by natural resources.
Nieman & Thies (2012) attempted to sort out the roles that democracy and property rights play in attracting FDI from 1970 to 2008 through care-ful theorizing and the use of a non-nested hierar-chical modelling strategy. Their theoretical and empirical analyses demonstrated that the effect of property rights on attracting FDI is contingent on democratic institutions. That is, in the absence of democratic institutions, property rights protections actually exert a negative impact on FDI. However, as the level of democratic institutionalization im-proves, the effect of property rights on FDI be-comes increasingly positive.
Mathur & Singh (2013) studied the relation-ship between foreign direct investment, corruption and democracy. They found foreign investors care about economic freedoms, rather than political freedoms, in making decisions about where to locate capital. Also, more democratic countries receive less foreign direct investment flows if economic freedoms are not guaranteed. One rea-son could be that democratizing developing economies are often unable to push through the kind of economic reforms that investors desire due to the presence of competing political inter-ests.
2. Model, variables and data FDI is a popular subject in international business literature. Numerous statistical and econometric analyses addressed factors which play role in ex-plaining FDI. Modelling FDI is a complicated task because so many variables intervene. Among explanatory variables, economic phenomena are quantifiable and available. In this paper we try to give a complete picture on how some important factors can affect FDI. The selection of the ex-planatory variables was done on the basis of the existing literature and data availability, and then the following equation was chosen:
FDIi,t= αi+ t+ 1Liti,t+ 2InfRi,t+ 3Opni,t+ 4Cori,t+ 5Demi,t+ 6InfSi,t+ εi,t
Variables are expressed across a series of countries (i=1, …, N) and time periods (t=1, …,T). The first two terms on the right hand side are the intercept parameters, which change among the various countries i and years t. They allow for specific effects across countries (αi) and through time (γt). εit shows random disturbance. For the dependent variable in the regression, FDI net in-flows in current US dollars have been employed. Explanatory variables are as follow: Lit for liter-acy rate, InfR for inflation rate, Opn for openness, Cor for corruption, Dem for democracy and InfS for infrastructure.
Literacy rate: The first determinant is literacy. We include the literacy rate in order to account for the notion that a higher level of education raises the productivity of capital and thus increases a country’s attractiveness for foreign investors. Since the literacy rate as a measure of a country’s human capital stock exhibits a strong positive cor-relation with per capita income, this variable also accounts for the fact that richer economies are better locations for market-seeking FDI (Harms & Ursprung, 2001). In a recent paper in 2013, Mathur & Singh used literacy rate and concluded that it has positive and significant effect on FDI inflows. We expect the larger the literacy rate, the more absorption of FDI. Based on data scanty we use secondary education as a proxy for literacy rate.
Inflation rate: It is expected that inflation rate deters foreign investors, since it affects the coun-try’s overall financial performance and it relates to macroeconomic mismanagement which inhibits inward FDI. Asiedu & Lien (2011) inferred less inflation promote FDI.
Openness: It is measured as the sum of exports and imports divided by gross domestic products and is expected that the greater the trade size the higher the level of FDI inflows. Since, it is likely that economic conditions for a better investment environment may overlap with conditions for a better international trade environment, or simply that trade flows correlate with investment flows (Ng, 2010).
Corruption: High levels of corruption have been associated with low exposure to international trade, high tariff levels and dependence on natural resources, while corruption itself tends to slow economic growth and discourage investment (Lar-rain & Tavares, 2004). There is an abundant lit-erature on the effects of corruption on openness,
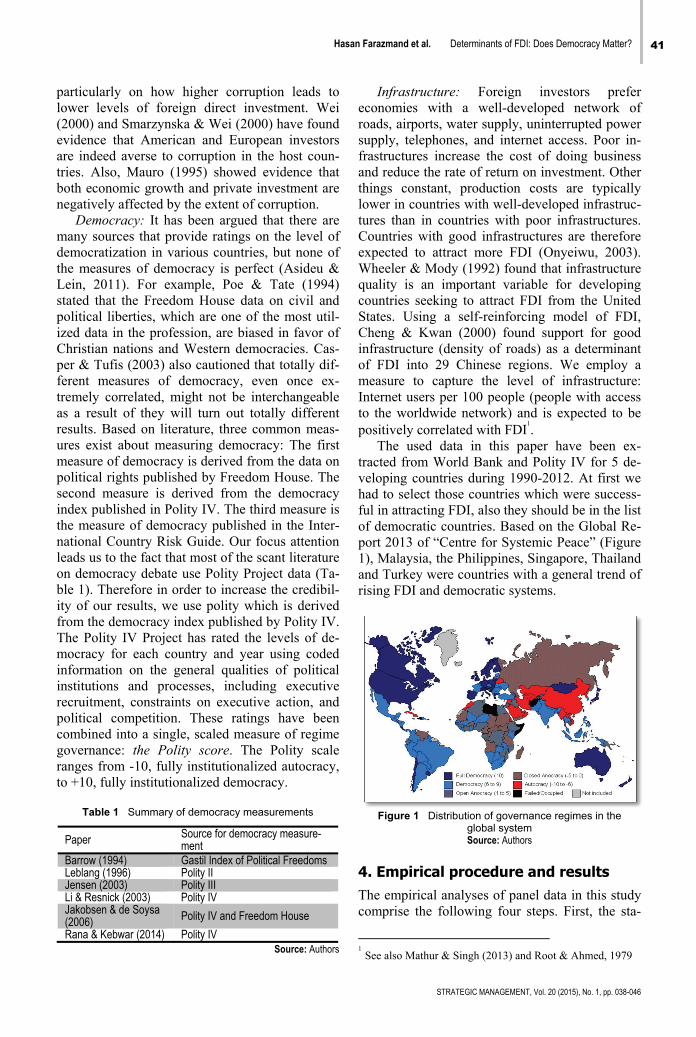
Hasan Farazmand et al. Determinants of FDI: Does Democracy Matter? 41
STRATEGIC MANAGEMENT, Vol. 20 (2015), No. 1, pp. 038-046
particularly on how higher corruption leads to lower levels of foreign direct investment. Wei (2000) and Smarzynska & Wei (2000) have found evidence that American and European investors are indeed averse to corruption in the host coun-tries. Also, Mauro (1995) showed evidence that both economic growth and private investment are negatively affected by the extent of corruption.
Democracy: It has been argued that there are many sources that provide ratings on the level of democratization in various countries, but none of the measures of democracy is perfect (Asideu & Lein, 2011). For example, Poe & Tate (1994) stated that the Freedom House data on civil and political liberties, which are one of the most util-ized data in the profession, are biased in favor of Christian nations and Western democracies. Cas-per & Tufis (2003) also cautioned that totally dif-ferent measures of democracy, even once ex-tremely correlated, might not be interchangeable as a result of they will turn out totally different results. Based on literature, three common meas-ures exist about measuring democracy: The first measure of democracy is derived from the data on political rights published by Freedom House. The second measure is derived from the democracy index published in Polity IV. The third measure is the measure of democracy published in the Inter-national Country Risk Guide. Our focus attention leads us to the fact that most of the scant literature on democracy debate use Polity Project data (Ta-ble 1). Therefore in order to increase the credibil-ity of our results, we use polity which is derived from the democracy index published by Polity IV. The Polity IV Project has rated the levels of de-mocracy for each country and year using coded information on the general qualities of political institutions and processes, including executive recruitment, constraints on executive action, and political competition. These ratings have been combined into a single, scaled measure of regime governance: the Polity score. The Polity scale ranges from -10, fully institutionalized autocracy, to +10, fully institutionalized democracy.
Table 1 Summary of democracy measurements
Paper Source for democracy measure-ment
Barrow (1994) Gastil Index of Political FreedomsLeblang (1996) Polity IIJensen (2003) Polity IIILi & Resnick (2003) Polity IVJakobsen & de Soysa (2006) Polity IV and Freedom House
Rana & Kebwar (2014) Polity IVSource: Authors
Infrastructure: Foreign investors prefer economies with a well-developed network of roads, airports, water supply, uninterrupted power supply, telephones, and internet access. Poor in-frastructures increase the cost of doing business and reduce the rate of return on investment. Other things constant, production costs are typically lower in countries with well-developed infrastruc-tures than in countries with poor infrastructures. Countries with good infrastructures are therefore expected to attract more FDI (Onyeiwu, 2003). Wheeler & Mody (1992) found that infrastructure quality is an important variable for developing countries seeking to attract FDI from the United States. Using a self-reinforcing model of FDI, Cheng & Kwan (2000) found support for good infrastructure (density of roads) as a determinant of FDI into 29 Chinese regions. We employ a measure to capture the level of infrastructure: Internet users per 100 people (people with access to the worldwide network) and is expected to be positively correlated with FDI
1.
The used data in this paper have been ex-tracted from World Bank and Polity IV for 5 de-veloping countries during 1990-2012. At first we had to select those countries which were success-ful in attracting FDI, also they should be in the list of democratic countries. Based on the Global Re-port 2013 of “Centre for Systemic Peace” (Figure 1), Malaysia, the Philippines, Singapore, Thailand and Turkey were countries with a general trend of rising FDI and democratic systems.
Figure 1 Distribution of governance regimes in the
global system Source: Authors
4. Empirical procedure and results The empirical analyses of panel data in this study comprise the following four steps. First, the sta-
1 See also Mathur & Singh (2013) and Root & Ahmed, 1979
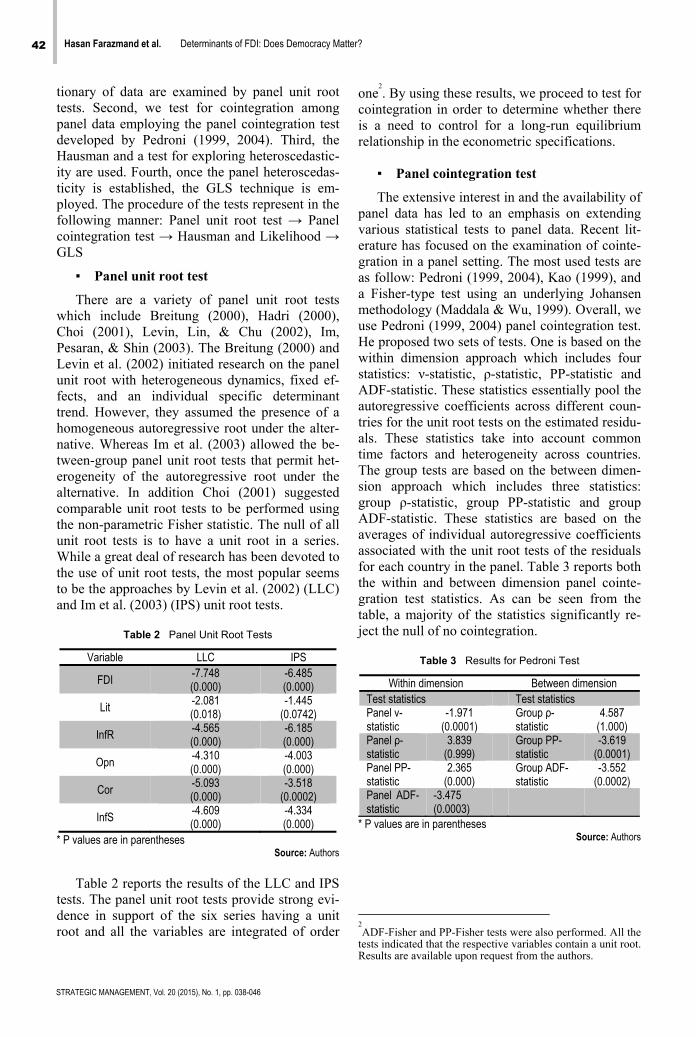
42 Hasan Farazmand et al. Determinants of FDI: Does Democracy Matter?
STRATEGIC MANAGEMENT, Vol. 20 (2015), No. 1, pp. 038-046
tionary of data are examined by panel unit root tests. Second, we test for cointegration among panel data employing the panel cointegration test developed by Pedroni (1999, 2004). Third, the Hausman and a test for exploring heteroscedastic-ity are used. Fourth, once the panel heteroscedas-ticity is established, the GLS technique is em-ployed. The procedure of the tests represent in the following manner: Panel unit root test → Panel cointegration test → Hausman and Likelihood → GLS
▪ Panel unit root test
There are a variety of panel unit root tests which include Breitung (2000), Hadri (2000), Choi (2001), Levin, Lin, & Chu (2002), Im, Pesaran, & Shin (2003). The Breitung (2000) and Levin et al. (2002) initiated research on the panel unit root with heterogeneous dynamics, fixed ef-fects, and an individual specific determinant trend. However, they assumed the presence of a homogeneous autoregressive root under the alter-native. Whereas Im et al. (2003) allowed the be-tween-group panel unit root tests that permit het-erogeneity of the autoregressive root under the alternative. In addition Choi (2001) suggested comparable unit root tests to be performed using the non-parametric Fisher statistic. The null of all unit root tests is to have a unit root in a series. While a great deal of research has been devoted to the use of unit root tests, the most popular seems to be the approaches by Levin et al. (2002) (LLC) and Im et al. (2003) (IPS) unit root tests.
Table 2 Panel Unit Root Tests
Variable LLC IPS
FDI -7.748(0.000)
-6.485 (0.000)
Lit -2.081(0.018)
-1.445 (0.0742)
InfR -4.565(0.000)
-6.185 (0.000)
Opn -4.310(0.000)
-4.003 (0.000)
Cor -5.093(0.000)
-3.518 (0.0002)
InfS -4.609(0.000)
-4.334 (0.000)
* P values are in parentheses Source: Authors
Table 2 reports the results of the LLC and IPS
tests. The panel unit root tests provide strong evi-dence in support of the six series having a unit root and all the variables are integrated of order
one2. By using these results, we proceed to test for
cointegration in order to determine whether there is a need to control for a long-run equilibrium relationship in the econometric specifications.
▪ Panel cointegration test
The extensive interest in and the availability of panel data has led to an emphasis on extending various statistical tests to panel data. Recent lit-erature has focused on the examination of cointe-gration in a panel setting. The most used tests are as follow: Pedroni (1999, 2004), Kao (1999), and a Fisher-type test using an underlying Johansen methodology (Maddala & Wu, 1999). Overall, we use Pedroni (1999, 2004) panel cointegration test. He proposed two sets of tests. One is based on the within dimension approach which includes four statistics: ν-statistic, ρ-statistic, PP-statistic and ADF-statistic. These statistics essentially pool the autoregressive coefficients across different coun-tries for the unit root tests on the estimated residu-als. These statistics take into account common time factors and heterogeneity across countries. The group tests are based on the between dimen-sion approach which includes three statistics: group ρ-statistic, group PP-statistic and group ADF-statistic. These statistics are based on the averages of individual autoregressive coefficients associated with the unit root tests of the residuals for each country in the panel. Table 3 reports both the within and between dimension panel cointe-gration test statistics. As can be seen from the table, a majority of the statistics significantly re-ject the null of no cointegration.
Table 3 Results for Pedroni Test
Within dimension Between dimension Test statistics Test statistics Panel ν-statistic
-1.971(0.0001)
Group ρ-statistic
4.587 (1.000)
Panel ρ-statistic
3.839(0.999)
Group PP-statistic
-3.619 (0.0001)
Panel PP-statistic
2.365(0.000)
Group ADF-statistic
-3.552 (0.0002)
Panel ADF-statistic
-3.475(0.0003)
* P values are in parentheses Source: Authors
2ADF-Fisher and PP-Fisher tests were also performed. All the
tests indicated that the respective variables contain a unit root. Results are available upon request from the authors.
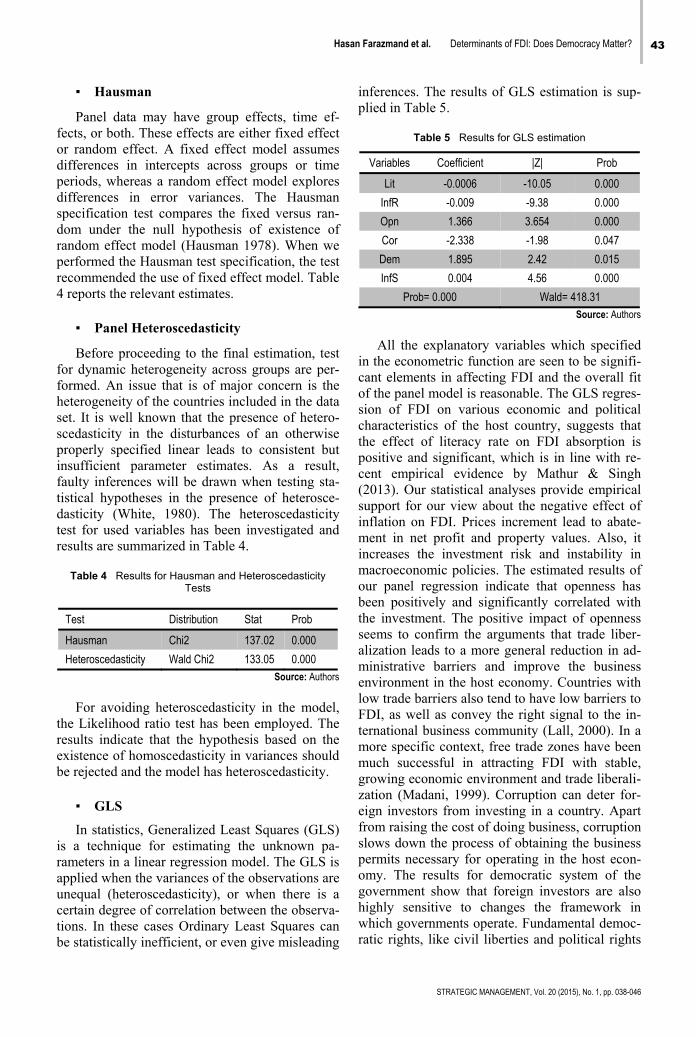
Hasan Farazmand et al. Determinants of FDI: Does Democracy Matter? 43
STRATEGIC MANAGEMENT, Vol. 20 (2015), No. 1, pp. 038-046
▪ Hausman
Panel data may have group effects, time ef-fects, or both. These effects are either fixed effect or random effect. A fixed effect model assumes differences in intercepts across groups or time periods, whereas a random effect model explores differences in error variances. The Hausman specification test compares the fixed versus ran-dom under the null hypothesis of existence of random effect model (Hausman 1978). When we performed the Hausman test specification, the test recommended the use of fixed effect model. Table 4 reports the relevant estimates.
▪ Panel Heteroscedasticity
Before proceeding to the final estimation, test for dynamic heterogeneity across groups are per-formed. An issue that is of major concern is the heterogeneity of the countries included in the data set. It is well known that the presence of hetero-scedasticity in the disturbances of an otherwise properly specified linear leads to consistent but insufficient parameter estimates. As a result, faulty inferences will be drawn when testing sta-tistical hypotheses in the presence of heterosce-dasticity (White, 1980). The heteroscedasticity test for used variables has been investigated and results are summarized in Table 4.
Table 4 Results for Hausman and Heteroscedasticity
Tests
Test Distribution Stat Prob
Hausman Chi2 137.02 0.000
Heteroscedasticity Wald Chi2 133.05 0.000 Source: Authors
For avoiding heteroscedasticity in the model,
the Likelihood ratio test has been employed. The results indicate that the hypothesis based on the existence of homoscedasticity in variances should be rejected and the model has heteroscedasticity.
▪ GLS
In statistics, Generalized Least Squares (GLS) is a technique for estimating the unknown pa-rameters in a linear regression model. The GLS is applied when the variances of the observations are unequal (heteroscedasticity), or when there is a certain degree of correlation between the observa-tions. In these cases Ordinary Least Squares can be statistically inefficient, or even give misleading
inferences. The results of GLS estimation is sup-plied in Table 5.
Table 5 Results for GLS estimation
Variables Coefficient |Z| Prob
Lit -0.0006 -10.05 0.000
InfR -0.009 -9.38 0.000
Opn 1.366 3.654 0.000
Cor -2.338 -1.98 0.047
Dem 1.895 2.42 0.015
InfS 0.004 4.56 0.000
Prob= 0.000 Wald= 418.31 Source: Authors
All the explanatory variables which specified
in the econometric function are seen to be signifi-cant elements in affecting FDI and the overall fit of the panel model is reasonable. The GLS regres-sion of FDI on various economic and political characteristics of the host country, suggests that the effect of literacy rate on FDI absorption is positive and significant, which is in line with re-cent empirical evidence by Mathur & Singh (2013). Our statistical analyses provide empirical support for our view about the negative effect of inflation on FDI. Prices increment lead to abate-ment in net profit and property values. Also, it increases the investment risk and instability in macroeconomic policies. The estimated results of our panel regression indicate that openness has been positively and significantly correlated with the investment. The positive impact of openness seems to confirm the arguments that trade liber-alization leads to a more general reduction in ad-ministrative barriers and improve the business environment in the host economy. Countries with low trade barriers also tend to have low barriers to FDI, as well as convey the right signal to the in-ternational business community (Lall, 2000). In a more specific context, free trade zones have been much successful in attracting FDI with stable, growing economic environment and trade liberali-zation (Madani, 1999). Corruption can deter for-eign investors from investing in a country. Apart from raising the cost of doing business, corruption slows down the process of obtaining the business permits necessary for operating in the host econ-omy. The results for democratic system of the government show that foreign investors are also highly sensitive to changes the framework in which governments operate. Fundamental democ-ratic rights, like civil liberties and political rights
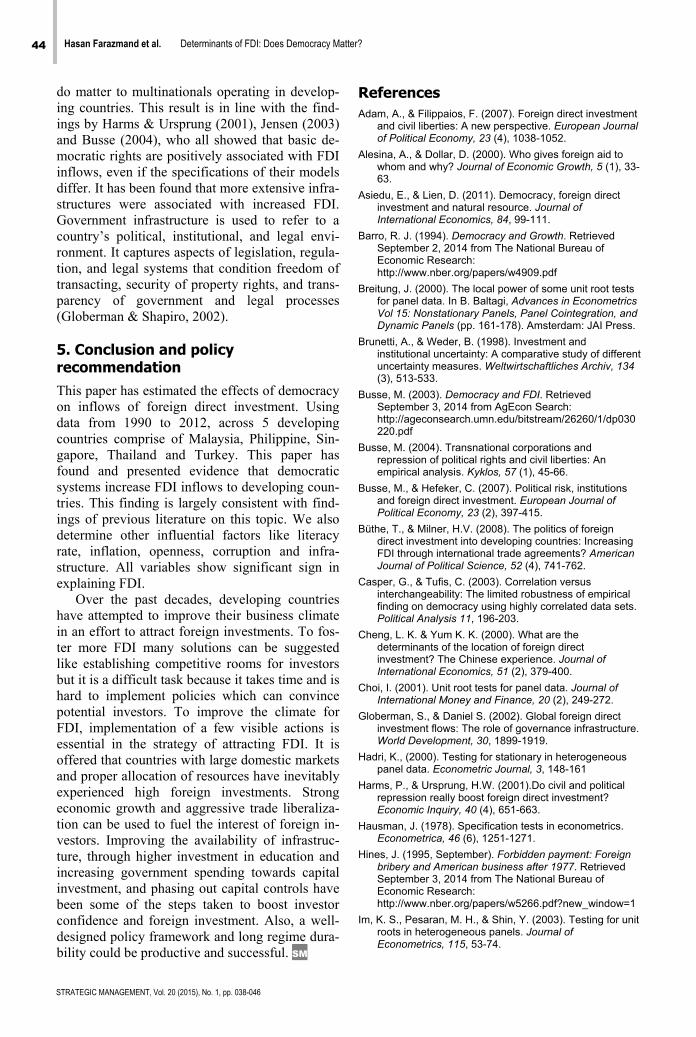
44 Hasan Farazmand et al. Determinants of FDI: Does Democracy Matter?
STRATEGIC MANAGEMENT, Vol. 20 (2015), No. 1, pp. 038-046
do matter to multinationals operating in develop-ing countries. This result is in line with the find-ings by Harms & Ursprung (2001), Jensen (2003) and Busse (2004), who all showed that basic de-mocratic rights are positively associated with FDI inflows, even if the specifications of their models differ. It has been found that more extensive infra-structures were associated with increased FDI. Government infrastructure is used to refer to a country’s political, institutional, and legal envi-ronment. It captures aspects of legislation, regula-tion, and legal systems that condition freedom of transacting, security of property rights, and trans-parency of government and legal processes (Globerman & Shapiro, 2002).
5. Conclusion and policy recommendation This paper has estimated the effects of democracy on inflows of foreign direct investment. Using data from 1990 to 2012, across 5 developing countries comprise of Malaysia, Philippine, Sin-gapore, Thailand and Turkey. This paper has found and presented evidence that democratic systems increase FDI inflows to developing coun-tries. This finding is largely consistent with find-ings of previous literature on this topic. We also determine other influential factors like literacy rate, inflation, openness, corruption and infra-structure. All variables show significant sign in explaining FDI.
Over the past decades, developing countries have attempted to improve their business climate in an effort to attract foreign investments. To fos-ter more FDI many solutions can be suggested like establishing competitive rooms for investors but it is a difficult task because it takes time and is hard to implement policies which can convince potential investors. To improve the climate for FDI, implementation of a few visible actions is essential in the strategy of attracting FDI. It is offered that countries with large domestic markets and proper allocation of resources have inevitably experienced high foreign investments. Strong economic growth and aggressive trade liberaliza-tion can be used to fuel the interest of foreign in-vestors. Improving the availability of infrastruc-ture, through higher investment in education and increasing government spending towards capital investment, and phasing out capital controls have been some of the steps taken to boost investor confidence and foreign investment. Also, a well-designed policy framework and long regime dura-bility could be productive and successful. SM
References Adam, A., & Filippaios, F. (2007). Foreign direct investment
and civil liberties: A new perspective. European Journal of Political Economy, 23 (4), 1038-1052.
Alesina, A., & Dollar, D. (2000). Who gives foreign aid to whom and why? Journal of Economic Growth, 5 (1), 33-63.
Asiedu, E., & Lien, D. (2011). Democracy, foreign direct investment and natural resource. Journal of International Economics, 84, 99-111.
Barro, R. J. (1994). Democracy and Growth. Retrieved September 2, 2014 from The National Bureau of Economic Research: http://www.nber.org/papers/w4909.pdf
Breitung, J. (2000). The local power of some unit root tests for panel data. In B. Baltagi, Advances in Econometrics Vol 15: Nonstationary Panels, Panel Cointegration, and Dynamic Panels (pp. 161-178). Amsterdam: JAI Press.
Brunetti, A., & Weder, B. (1998). Investment and institutional uncertainty: A comparative study of different uncertainty measures. Weltwirtschaftliches Archiv, 134 (3), 513-533.
Busse, M. (2003). Democracy and FDI. Retrieved September 3, 2014 from AgEcon Search: http://ageconsearch.umn.edu/bitstream/26260/1/dp030220.pdf
Busse, M. (2004). Transnational corporations and repression of political rights and civil liberties: An empirical analysis. Kyklos, 57 (1), 45-66.
Busse, M., & Hefeker, C. (2007). Political risk, institutions and foreign direct investment. European Journal of Political Economy, 23 (2), 397-415.
Büthe, T., & Milner, H.V. (2008). The politics of foreign direct investment into developing countries: Increasing FDI through international trade agreements? American Journal of Political Science, 52 (4), 741-762.
Casper, G., & Tufis, C. (2003). Correlation versus interchangeability: The limited robustness of empirical finding on democracy using highly correlated data sets. Political Analysis 11, 196-203.
Cheng, L. K. & Yum K. K. (2000). What are the determinants of the location of foreign direct investment? The Chinese experience. Journal of International Economics, 51 (2), 379-400.
Choi, I. (2001). Unit root tests for panel data. Journal of International Money and Finance, 20 (2), 249-272.
Globerman, S., & Daniel S. (2002). Global foreign direct investment flows: The role of governance infrastructure. World Development, 30, 1899-1919.
Hadri, K., (2000). Testing for stationary in heterogeneous panel data. Econometric Journal, 3, 148-161
Harms, P., & Ursprung, H.W. (2001).Do civil and political repression really boost foreign direct investment? Economic Inquiry, 40 (4), 651-663.
Hausman, J. (1978). Specification tests in econometrics. Econometrica, 46 (6), 1251-1271.
Hines, J. (1995, September). Forbidden payment: Foreign bribery and American business after 1977. Retrieved September 3, 2014 from The National Bureau of Economic Research: http://www.nber.org/papers/w5266.pdf?new_window=1
Im, K. S., Pesaran, M. H., & Shin, Y. (2003). Testing for unit roots in heterogeneous panels. Journal of Econometrics, 115, 53-74.
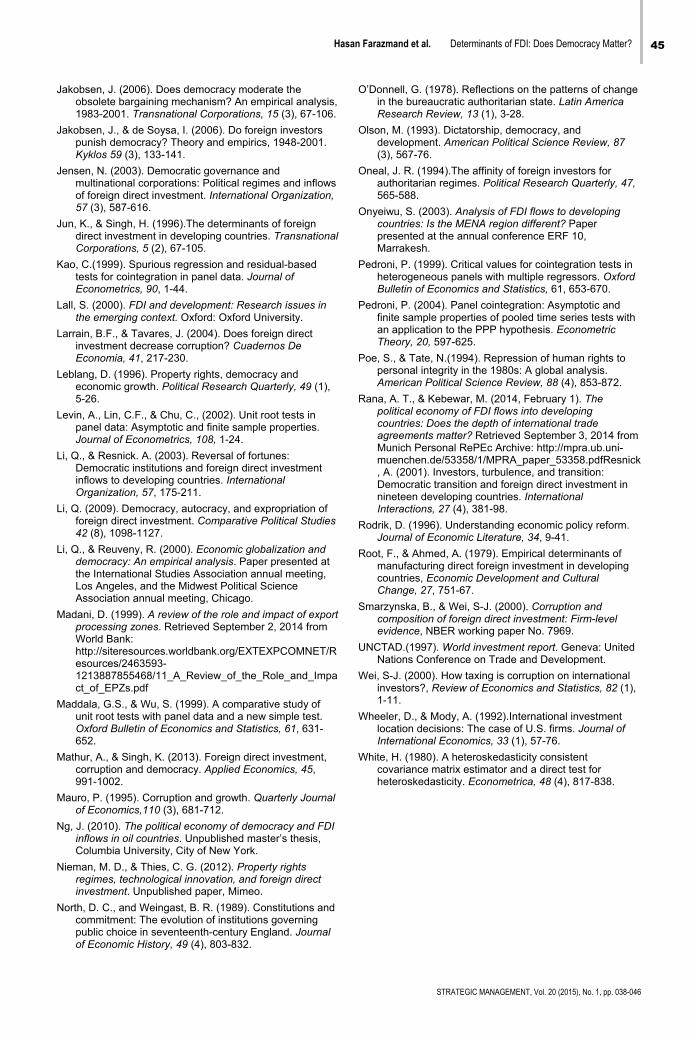
Hasan Farazmand et al. Determinants of FDI: Does Democracy Matter? 45
STRATEGIC MANAGEMENT, Vol. 20 (2015), No. 1, pp. 038-046
Jakobsen, J. (2006). Does democracy moderate the obsolete bargaining mechanism? An empirical analysis, 1983-2001. Transnational Corporations, 15 (3), 67-106.
Jakobsen, J., & de Soysa, I. (2006). Do foreign investors punish democracy? Theory and empirics, 1948-2001. Kyklos 59 (3), 133-141.
Jensen, N. (2003). Democratic governance and multinational corporations: Political regimes and inflows of foreign direct investment. International Organization, 57 (3), 587-616.
Jun, K., & Singh, H. (1996).The determinants of foreign direct investment in developing countries. Transnational Corporations, 5 (2), 67-105.
Kao, C.(1999). Spurious regression and residual-based tests for cointegration in panel data. Journal of Econometrics, 90, 1-44.
Lall, S. (2000). FDI and development: Research issues in the emerging context. Oxford: Oxford University.
Larrain, B.F., & Tavares, J. (2004). Does foreign direct investment decrease corruption? Cuadernos De Economia, 41, 217-230.
Leblang, D. (1996). Property rights, democracy and economic growth. Political Research Quarterly, 49 (1), 5-26.
Levin, A., Lin, C.F., & Chu, C., (2002). Unit root tests in panel data: Asymptotic and finite sample properties. Journal of Econometrics, 108, 1-24.
Li, Q., & Resnick. A. (2003). Reversal of fortunes: Democratic institutions and foreign direct investment inflows to developing countries. International Organization, 57, 175-211.
Li, Q. (2009). Democracy, autocracy, and expropriation of foreign direct investment. Comparative Political Studies 42 (8), 1098-1127.
Li, Q., & Reuveny, R. (2000). Economic globalization and democracy: An empirical analysis. Paper presented at the International Studies Association annual meeting, Los Angeles, and the Midwest Political Science Association annual meeting, Chicago.
Madani, D. (1999). A review of the role and impact of export processing zones. Retrieved September 2, 2014 from World Bank: http://siteresources.worldbank.org/EXTEXPCOMNET/Resources/2463593-1213887855468/11_A_Review_of_the_Role_and_Impact_of_EPZs.pdf
Maddala, G.S., & Wu, S. (1999). A comparative study of unit root tests with panel data and a new simple test. Oxford Bulletin of Economics and Statistics, 61, 631-652.
Mathur, A., & Singh, K. (2013). Foreign direct investment, corruption and democracy. Applied Economics, 45, 991-1002.
Mauro, P. (1995). Corruption and growth. Quarterly Journal of Economics,110 (3), 681-712.
Ng, J. (2010). The political economy of democracy and FDI inflows in oil countries. Unpublished master’s thesis, Columbia University, City of New York.
Nieman, M. D., & Thies, C. G. (2012). Property rights regimes, technological innovation, and foreign direct investment. Unpublished paper, Mimeo.
North, D. C., and Weingast, B. R. (1989). Constitutions and commitment: The evolution of institutions governing public choice in seventeenth-century England. Journal of Economic History, 49 (4), 803-832.
O’Donnell, G. (1978). Reflections on the patterns of change in the bureaucratic authoritarian state. Latin America Research Review, 13 (1), 3-28.
Olson, M. (1993). Dictatorship, democracy, and development. American Political Science Review, 87 (3), 567-76.
Oneal, J. R. (1994).The affinity of foreign investors for authoritarian regimes. Political Research Quarterly, 47, 565-588.
Onyeiwu, S. (2003). Analysis of FDI flows to developing countries: Is the MENA region different? Paper presented at the annual conference ERF 10, Marrakesh.
Pedroni, P. (1999). Critical values for cointegration tests in heterogeneous panels with multiple regressors. Oxford Bulletin of Economics and Statistics, 61, 653-670.
Pedroni, P. (2004). Panel cointegration: Asymptotic and finite sample properties of pooled time series tests with an application to the PPP hypothesis. Econometric Theory, 20, 597-625.
Poe, S., & Tate, N.(1994). Repression of human rights to personal integrity in the 1980s: A global analysis. American Political Science Review, 88 (4), 853-872.
Rana, A. T., & Kebewar, M. (2014, February 1). The political economy of FDI flows into developing countries: Does the depth of international trade agreements matter? Retrieved September 3, 2014 from Munich Personal RePEc Archive: http://mpra.ub.uni-muenchen.de/53358/1/MPRA_paper_53358.pdfResnick, A. (2001). Investors, turbulence, and transition: Democratic transition and foreign direct investment in nineteen developing countries. International Interactions, 27 (4), 381-98.
Rodrik, D. (1996). Understanding economic policy reform. Journal of Economic Literature, 34, 9-41.
Root, F., & Ahmed, A. (1979). Empirical determinants of manufacturing direct foreign investment in developing countries, Economic Development and Cultural Change, 27, 751-67.
Smarzynska, B., & Wei, S-J. (2000). Corruption and composition of foreign direct investment: Firm-level evidence, NBER working paper No. 7969.
UNCTAD.(1997). World investment report. Geneva: United Nations Conference on Trade and Development.
Wei, S-J. (2000). How taxing is corruption on international investors?, Review of Economics and Statistics, 82 (1), 1-11.
Wheeler, D., & Mody, A. (1992).International investment location decisions: The case of U.S. firms. Journal of International Economics, 33 (1), 57-76.
White, H. (1980). A heteroskedasticity consistent covariance matrix estimator and a direct test for heteroskedasticity. Econometrica, 48 (4), 817-838.

46 Hasan Farazmand et al. Determinants of FDI: Does Democracy Matter?
STRATEGIC MANAGEMENT, Vol. 20 (2015), No. 1, pp. 038-046
Correspondence
Hasan Farazmand
Department of Economics, Chamran University Golestan Boulevard, 61357 Khuzestan, Ahvaz, Iran
E-mail: [email protected]
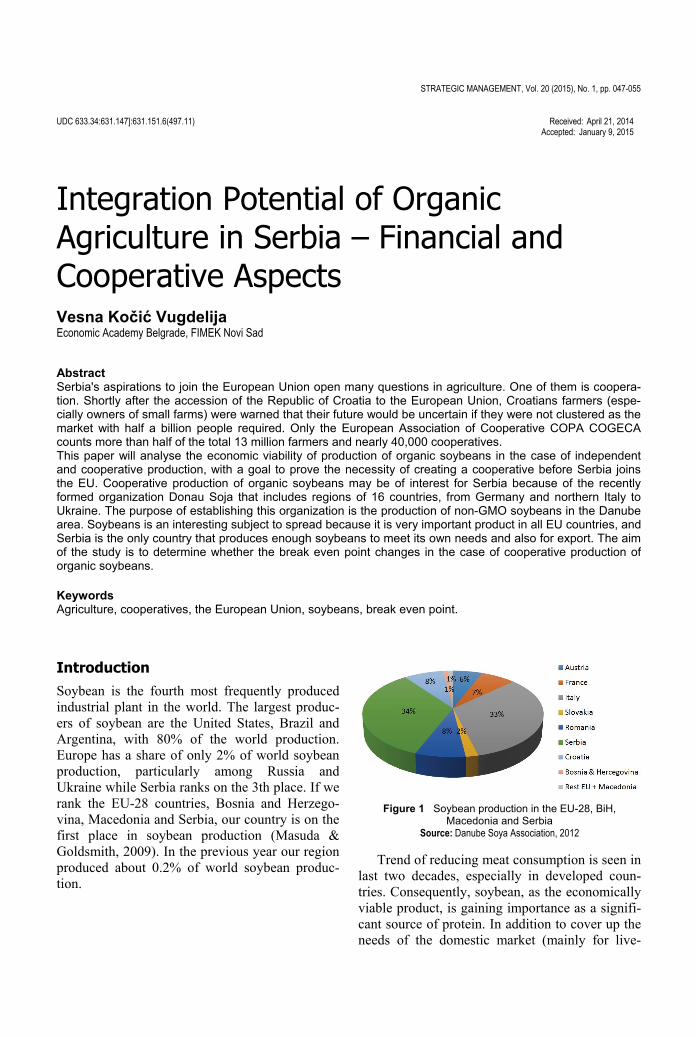
STRATEGIC MANAGEMENT, Vol. 20 (2015), No. 1, pp. 047-055 UDC 633.34:631.147]:631.151.6(497.11)
Received: April 21, 2014
Accepted: January 9, 2015
Integration Potential of Organic Agriculture in Serbia – Financial and Cooperative Aspects
Vesna Kočić Vugdelija Economic Academy Belgrade, FIMEK Novi Sad
Abstract Serbia's aspirations to join the European Union open many questions in agriculture. One of them is coopera-tion. Shortly after the accession of the Republic of Croatia to the European Union, Croatians farmers (espe-cially owners of small farms) were warned that their future would be uncertain if they were not clustered as themarket with half a billion people required. Only the European Association of Cooperative COPA COGECAcounts more than half of the total 13 million farmers and nearly 40,000 cooperatives. This paper will analyse the economic viability of production of organic soybeans in the case of independent and cooperative production, with a goal to prove the necessity of creating a cooperative before Serbia joinsthe EU. Cooperative production of organic soybeans may be of interest for Serbia because of the recentlyformed organization Donau Soja that includes regions of 16 countries, from Germany and northern Italy toUkraine. The purpose of establishing this organization is the production of non-GMO soybeans in the Danube area. Soybeans is an interesting subject to spread because it is very important product in all EU countries, and Serbia is the only country that produces enough soybeans to meet its own needs and also for export. The aimof the study is to determine whether the break even point changes in the case of cooperative production of organic soybeans. Keywords Agriculture, cooperatives, the European Union, soybeans, break even point.
Introduction Soybean is the fourth most frequently produced industrial plant in the world. The largest produc-ers of soybean are the United States, Brazil and Argentina, with 80% of the world production. Europe has a share of only 2% of world soybean production, particularly among Russia and Ukraine while Serbia ranks on the 3th place. If we rank the EU-28 countries, Bosnia and Herzego-vina, Macedonia and Serbia, our country is on the first place in soybean production (Masuda & Goldsmith, 2009). In the previous year our region produced about 0.2% of world soybean produc-tion.
Figure 1 Soybean production in the EU-28, BiH, Macedonia and Serbia
Source: Danube Soya Association, 2012
Trend of reducing meat consumption is seen in last two decades, especially in developed coun-tries. Consequently, soybean, as the economically viable product, is gaining importance as a signifi-cant source of protein. In addition to cover up the needs of the domestic market (mainly for live-
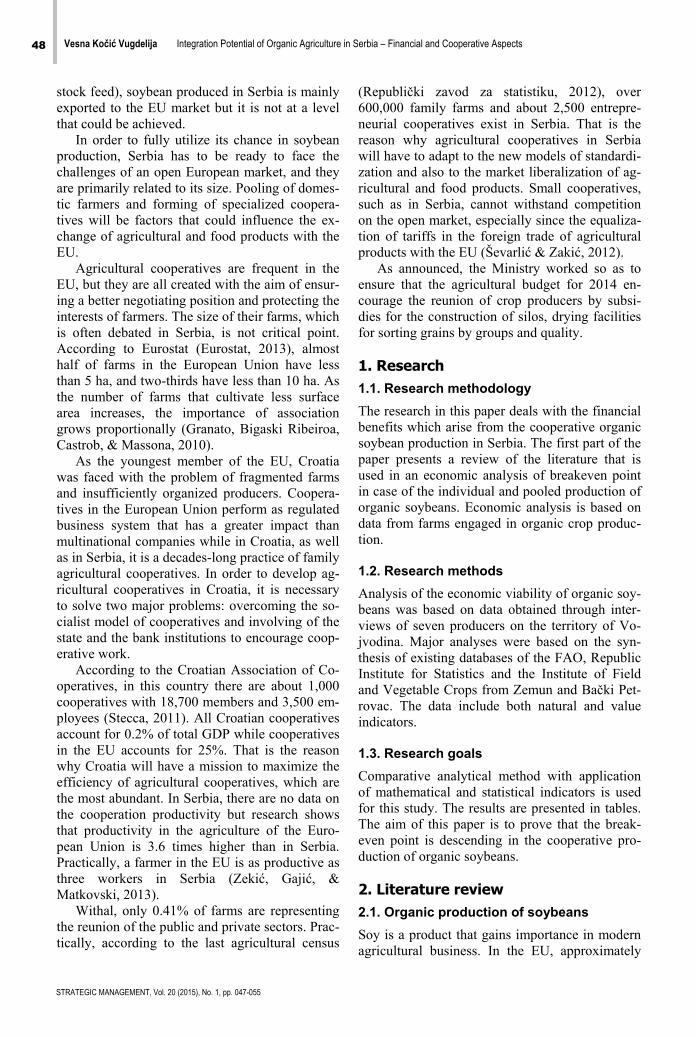
48 Vesna Kočić Vugdelija Integration Potential of Organic Agriculture in Serbia – Financial and Cooperative Aspects
STRATEGIC MANAGEMENT, Vol. 20 (2015), No. 1, pp. 047-055
stock feed), soybean produced in Serbia is mainly exported to the EU market but it is not at a level that could be achieved.
In order to fully utilize its chance in soybean production, Serbia has to be ready to face the challenges of an open European market, and they are primarily related to its size. Pooling of domes-tic farmers and forming of specialized coopera-tives will be factors that could influence the ex-change of agricultural and food products with the EU.
Agricultural cooperatives are frequent in the EU, but they are all created with the aim of ensur-ing a better negotiating position and protecting the interests of farmers. The size of their farms, which is often debated in Serbia, is not critical point. According to Eurostat (Eurostat, 2013), almost half of farms in the European Union have less than 5 ha, and two-thirds have less than 10 ha. As the number of farms that cultivate less surface area increases, the importance of association grows proportionally (Granato, Bigaski Ribeiroa, Castrob, & Massona, 2010).
As the youngest member of the EU, Croatia was faced with the problem of fragmented farms and insufficiently organized producers. Coopera-tives in the European Union perform as regulated business system that has a greater impact than multinational companies while in Croatia, as well as in Serbia, it is a decades-long practice of family agricultural cooperatives. In order to develop ag-ricultural cooperatives in Croatia, it is necessary to solve two major problems: overcoming the so-cialist model of cooperatives and involving of the state and the bank institutions to encourage coop-erative work.
According to the Croatian Association of Co-operatives, in this country there are about 1,000 cooperatives with 18,700 members and 3,500 em-ployees (Stecca, 2011). All Croatian cooperatives account for 0.2% of total GDP while cooperatives in the EU accounts for 25%. That is the reason why Croatia will have a mission to maximize the efficiency of agricultural cooperatives, which are the most abundant. In Serbia, there are no data on the cooperation productivity but research shows that productivity in the agriculture of the Euro-pean Union is 3.6 times higher than in Serbia. Practically, a farmer in the EU is as productive as three workers in Serbia (Zekić, Gajić, & Matkovski, 2013).
Withal, only 0.41% of farms are representing the reunion of the public and private sectors. Prac-tically, according to the last agricultural census
(Republički zavod za statistiku, 2012), over 600,000 family farms and about 2,500 entrepre-neurial cooperatives exist in Serbia. That is the reason why agricultural cooperatives in Serbia will have to adapt to the new models of standardi-zation and also to the market liberalization of ag-ricultural and food products. Small cooperatives, such as in Serbia, cannot withstand competition on the open market, especially since the equaliza-tion of tariffs in the foreign trade of agricultural products with the EU (Ševarlić & Zakić, 2012).
As announced, the Ministry worked so as to ensure that the agricultural budget for 2014 en-courage the reunion of crop producers by subsi-dies for the construction of silos, drying facilities for sorting grains by groups and quality.
1. Research 1.1. Research methodology The research in this paper deals with the financial benefits which arise from the cooperative organic soybean production in Serbia. The first part of the paper presents a review of the literature that is used in an economic analysis of breakeven point in case of the individual and pooled production of organic soybeans. Economic analysis is based on data from farms engaged in organic crop produc-tion.
1.2. Research methods Analysis of the economic viability of organic soy-beans was based on data obtained through inter-views of seven producers on the territory of Vo-jvodina. Major analyses were based on the syn-thesis of existing databases of the FAO, Republic Institute for Statistics and the Institute of Field and Vegetable Crops from Zemun and Bački Pet-rovac. The data include both natural and value indicators.
1.3. Research goals Comparative analytical method with application of mathematical and statistical indicators is used for this study. The results are presented in tables. The aim of this paper is to prove that the break-even point is descending in the cooperative pro-duction of organic soybeans.
2. Literature review 2.1. Organic production of soybeans Soy is a product that gains importance in modern agricultural business. In the EU, approximately
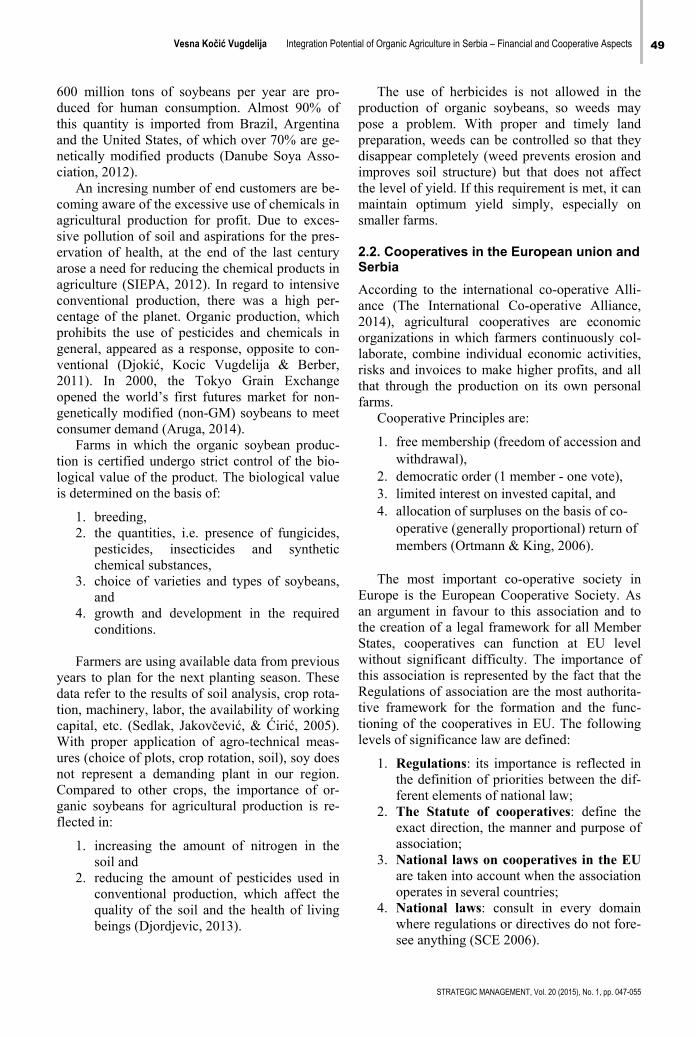
Vesna Kočić Vugdelija Integration Potential of Organic Agriculture in Serbia – Financial and Cooperative Aspects 49
STRATEGIC MANAGEMENT, Vol. 20 (2015), No. 1, pp. 047-055
600 million tons of soybeans per year are pro-duced for human consumption. Almost 90% of this quantity is imported from Brazil, Argentina and the United States, of which over 70% are ge-netically modified products (Danube Soya Asso-ciation, 2012).
An incresing number of end customers are be-coming aware of the excessive use of chemicals in agricultural production for profit. Due to exces-sive pollution of soil and aspirations for the pres-ervation of health, at the end of the last century arose a need for reducing the chemical products in agriculture (SIEPA, 2012). In regard to intensive conventional production, there was a high per-centage of the planet. Organic production, which prohibits the use of pesticides and chemicals in general, appeared as a response, opposite to con-ventional (Djokić, Kocic Vugdelija & Berber, 2011). In 2000, the Tokyo Grain Exchange opened the world’s first futures market for non-genetically modified (non-GM) soybeans to meet consumer demand (Aruga, 2014).
Farms in which the organic soybean produc-tion is certified undergo strict control of the bio-logical value of the product. The biological value is determined on the basis of:
1. breeding, 2. the quantities, i.e. presence of fungicides,
pesticides, insecticides and synthetic chemical substances,
3. choice of varieties and types of soybeans, and
4. growth and development in the required conditions.
Farmers are using available data from previous
years to plan for the next planting season. These data refer to the results of soil analysis, crop rota-tion, machinery, labor, the availability of working capital, etc. (Sedlak, Jakovčević, & Ćirić, 2005). With proper application of agro-technical meas-ures (choice of plots, crop rotation, soil), soy does not represent a demanding plant in our region. Compared to other crops, the importance of or-ganic soybeans for agricultural production is re-flected in:
1. increasing the amount of nitrogen in the soil and
2. reducing the amount of pesticides used in conventional production, which affect the quality of the soil and the health of living beings (Djordjevic, 2013).
The use of herbicides is not allowed in the production of organic soybeans, so weeds may pose a problem. With proper and timely land preparation, weeds can be controlled so that they disappear completely (weed prevents erosion and improves soil structure) but that does not affect the level of yield. If this requirement is met, it can maintain optimum yield simply, especially on smaller farms.
2.2. Cooperatives in the European union and Serbia According to the international co-operative Alli-ance (The International Co-operative Alliance, 2014), agricultural cooperatives are economic organizations in which farmers continuously col-laborate, combine individual economic activities, risks and invoices to make higher profits, and all that through the production on its own personal farms.
Cooperative Principles are:
1. free membership (freedom of accession and withdrawal),
2. democratic order (1 member - one vote), 3. limited interest on invested capital, and 4. allocation of surpluses on the basis of co-
operative (generally proportional) return of members (Ortmann & King, 2006).
The most important co-operative society in
Europe is the European Cooperative Society. As an argument in favour to this association and to the creation of a legal framework for all Member States, cooperatives can function at EU level without significant difficulty. The importance of this association is represented by the fact that the Regulations of association are the most authorita-tive framework for the formation and the func-tioning of the cooperatives in EU. The following levels of significance law are defined:
1. Regulations: its importance is reflected in the definition of priorities between the dif-ferent elements of national law;
2. The Statute of cooperatives: define the exact direction, the manner and purpose of association;
3. National laws on cooperatives in the EU are taken into account when the association operates in several countries;
4. National laws: consult in every domain where regulations or directives do not fore-see anything (SCE 2006).
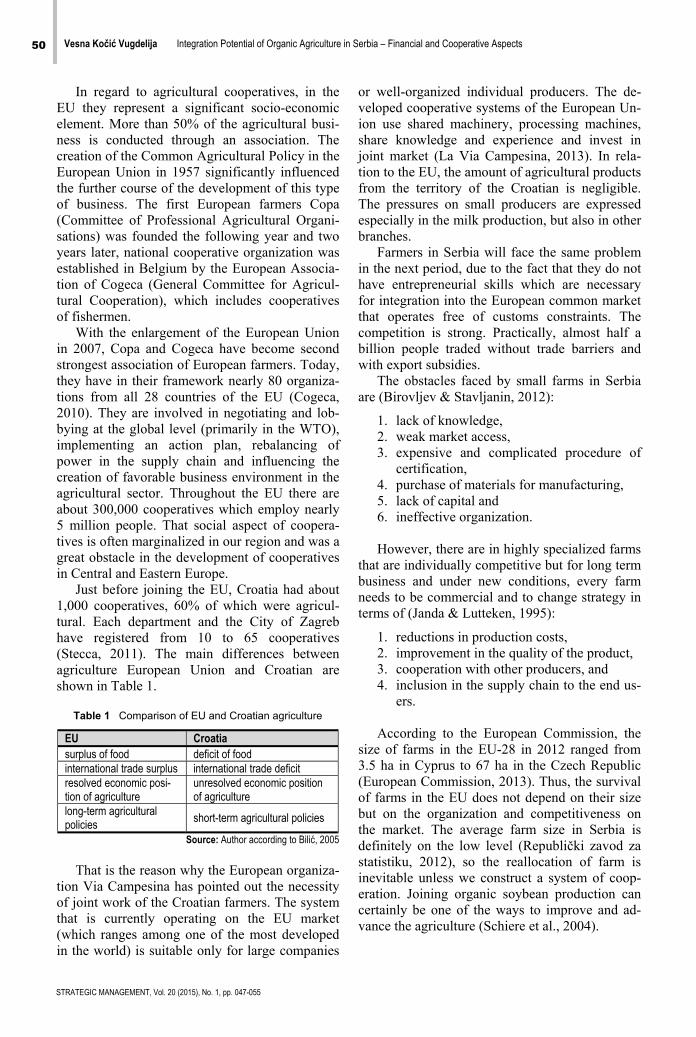
50 Vesna Kočić Vugdelija Integration Potential of Organic Agriculture in Serbia – Financial and Cooperative Aspects
STRATEGIC MANAGEMENT, Vol. 20 (2015), No. 1, pp. 047-055
In regard to agricultural cooperatives, in the EU they represent a significant socio-economic element. More than 50% of the agricultural busi-ness is conducted through an association. The creation of the Common Agricultural Policy in the European Union in 1957 significantly influenced the further course of the development of this type of business. The first European farmers Copa (Committee of Professional Agricultural Organi-sations) was founded the following year and two years later, national cooperative organization was established in Belgium by the European Associa-tion of Cogeca (General Committee for Agricul-tural Cooperation), which includes cooperatives of fishermen.
With the enlargement of the European Union in 2007, Copa and Cogeca have become second strongest association of European farmers. Today, they have in their framework nearly 80 organiza-tions from all 28 countries of the EU (Cogeca, 2010). They are involved in negotiating and lob-bying at the global level (primarily in the WTO), implementing an action plan, rebalancing of power in the supply chain and influencing the creation of favorable business environment in the agricultural sector. Throughout the EU there are about 300,000 cooperatives which employ nearly 5 million people. That social aspect of coopera-tives is often marginalized in our region and was a great obstacle in the development of cooperatives in Central and Eastern Europe.
Just before joining the EU, Croatia had about 1,000 cooperatives, 60% of which were agricul-tural. Each department and the City of Zagreb have registered from 10 to 65 cooperatives (Stecca, 2011). The main differences between agriculture European Union and Croatian are shown in Table 1.
Table 1 Comparison of EU and Croatian agriculture
EU Croatiasurplus of food deficit of food international trade surplus international trade deficit resolved economic posi-tion of agriculture
unresolved economic position of agriculture
long-term agricultural policies
short-term agricultural policies
Source: Author according to Bilić, 2005
That is the reason why the European organiza-
tion Via Campesina has pointed out the necessity of joint work of the Croatian farmers. The system that is currently operating on the EU market (which ranges among one of the most developed in the world) is suitable only for large companies
or well-organized individual producers. The de-veloped cooperative systems of the European Un-ion use shared machinery, processing machines, share knowledge and experience and invest in joint market (La Via Campesina, 2013). In rela-tion to the EU, the amount of agricultural products from the territory of the Croatian is negligible. The pressures on small producers are expressed especially in the milk production, but also in other branches.
Farmers in Serbia will face the same problem in the next period, due to the fact that they do not have entrepreneurial skills which are necessary for integration into the European common market that operates free of customs constraints. The competition is strong. Practically, almost half a billion people traded without trade barriers and with export subsidies.
The obstacles faced by small farms in Serbia are (Birovljev & Stavljanin, 2012):
1. lack of knowledge, 2. weak market access, 3. expensive and complicated procedure of
certification, 4. purchase of materials for manufacturing, 5. lack of capital and 6. ineffective organization. However, there are in highly specialized farms
that are individually competitive but for long term business and under new conditions, every farm needs to be commercial and to change strategy in terms of (Janda & Lutteken, 1995):
1. reductions in production costs, 2. improvement in the quality of the product, 3. cooperation with other producers, and 4. inclusion in the supply chain to the end us-
ers. According to the European Commission, the
size of farms in the EU-28 in 2012 ranged from 3.5 ha in Cyprus to 67 ha in the Czech Republic (European Commission, 2013). Thus, the survival of farms in the EU does not depend on their size but on the organization and competitiveness on the market. The average farm size in Serbia is definitely on the low level (Republički zavod za statistiku, 2012), so the reallocation of farm is inevitable unless we construct a system of coop-eration. Joining organic soybean production can certainly be one of the ways to improve and ad-vance the agriculture (Schiere et al., 2004).
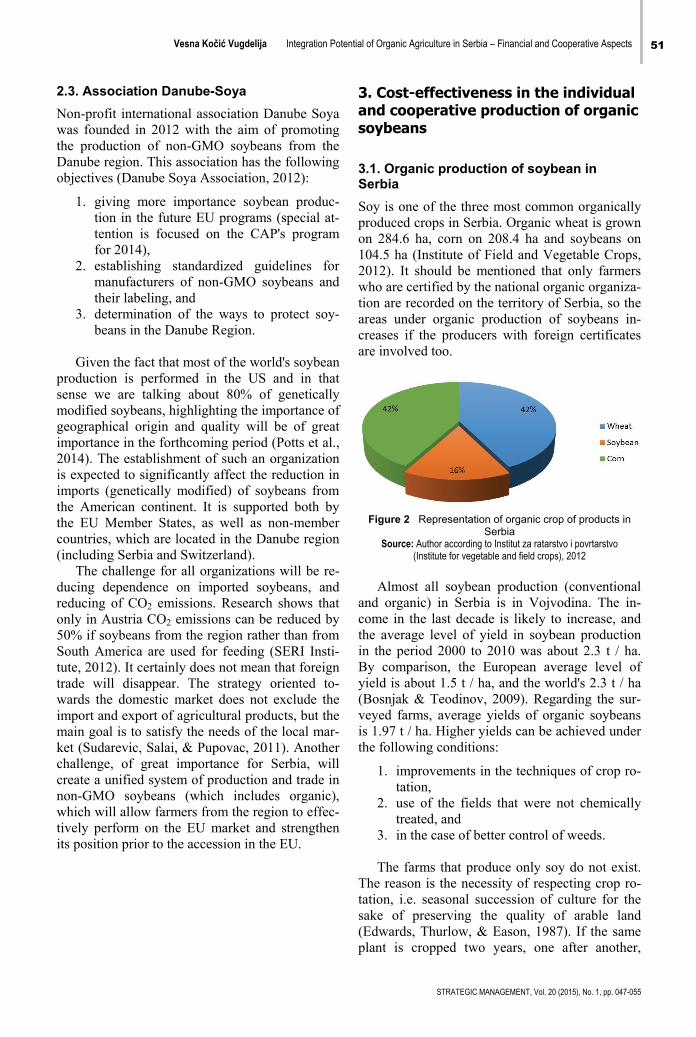
Vesna Kočić Vugdelija Integration Potential of Organic Agriculture in Serbia – Financial and Cooperative Aspects 51
STRATEGIC MANAGEMENT, Vol. 20 (2015), No. 1, pp. 047-055
2.3. Association Danube-Soya Non-profit international association Danube Soya was founded in 2012 with the aim of promoting the production of non-GMO soybeans from the Danube region. This association has the following objectives (Danube Soya Association, 2012):
1. giving more importance soybean produc-tion in the future EU programs (special at-tention is focused on the CAP's program for 2014),
2. establishing standardized guidelines for manufacturers of non-GMO soybeans and their labeling, and
3. determination of the ways to protect soy-beans in the Danube Region.
Given the fact that most of the world's soybean
production is performed in the US and in that sense we are talking about 80% of genetically modified soybeans, highlighting the importance of geographical origin and quality will be of great importance in the forthcoming period (Potts et al., 2014). The establishment of such an organization is expected to significantly affect the reduction in imports (genetically modified) of soybeans from the American continent. It is supported both by the EU Member States, as well as non-member countries, which are located in the Danube region (including Serbia and Switzerland).
The challenge for all organizations will be re-ducing dependence on imported soybeans, and reducing of CO2 emissions. Research shows that only in Austria CO2 emissions can be reduced by 50% if soybeans from the region rather than from South America are used for feeding (SERI Insti-tute, 2012). It certainly does not mean that foreign trade will disappear. The strategy oriented to-wards the domestic market does not exclude the import and export of agricultural products, but the main goal is to satisfy the needs of the local mar-ket (Sudarevic, Salai, & Pupovac, 2011). Another challenge, of great importance for Serbia, will create a unified system of production and trade in non-GMO soybeans (which includes organic), which will allow farmers from the region to effec-tively perform on the EU market and strengthen its position prior to the accession in the EU.
3. Cost-effectiveness in the individual and cooperative production of organic soybeans
3.1. Organic production of soybean in Serbia Soy is one of the three most common organically produced crops in Serbia. Organic wheat is grown on 284.6 ha, corn on 208.4 ha and soybeans on 104.5 ha (Institute of Field and Vegetable Crops, 2012). It should be mentioned that only farmers who are certified by the national organic organiza-tion are recorded on the territory of Serbia, so the areas under organic production of soybeans in-creases if the producers with foreign certificates are involved too.
Figure 2 Representation of organic crop of products in Serbia
Source: Author according to Institut za ratarstvo i povrtarstvo (Institute for vegetable and field crops), 2012
Almost all soybean production (conventional
and organic) in Serbia is in Vojvodina. The in-come in the last decade is likely to increase, and the average level of yield in soybean production in the period 2000 to 2010 was about 2.3 t / ha. By comparison, the European average level of yield is about 1.5 t / ha, and the world's 2.3 t / ha (Bosnjak & Teodinov, 2009). Regarding the sur-veyed farms, average yields of organic soybeans is 1.97 t / ha. Higher yields can be achieved under the following conditions:
1. improvements in the techniques of crop ro-tation,
2. use of the fields that were not chemically treated, and
3. in the case of better control of weeds. The farms that produce only soy do not exist.
The reason is the necessity of respecting crop ro-tation, i.e. seasonal succession of culture for the sake of preserving the quality of arable land (Edwards, Thurlow, & Eason, 1987). If the same plant is cropped two years, one after another,
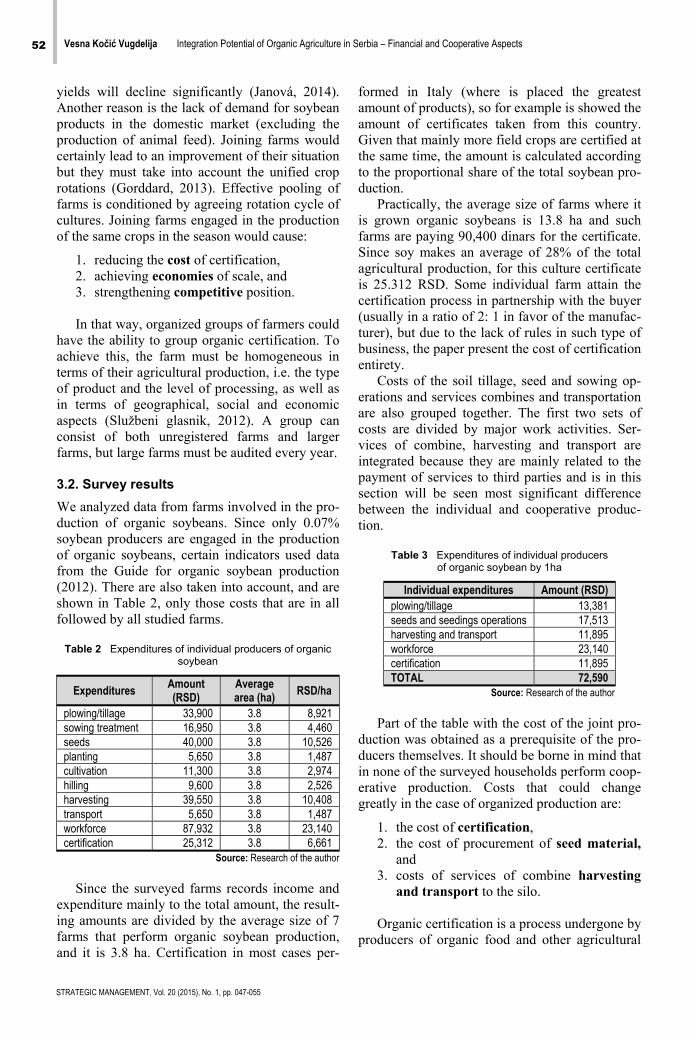
52 Vesna Kočić Vugdelija Integration Potential of Organic Agriculture in Serbia – Financial and Cooperative Aspects
STRATEGIC MANAGEMENT, Vol. 20 (2015), No. 1, pp. 047-055
yields will decline significantly (Janová, 2014). Another reason is the lack of demand for soybean products in the domestic market (excluding the production of animal feed). Joining farms would certainly lead to an improvement of their situation but they must take into account the unified crop rotations (Gorddard, 2013). Effective pooling of farms is conditioned by agreeing rotation cycle of cultures. Joining farms engaged in the production of the same crops in the season would cause:
1. reducing the cost of certification, 2. achieving economies of scale, and 3. strengthening competitive position. In that way, organized groups of farmers could
have the ability to group organic certification. To achieve this, the farm must be homogeneous in terms of their agricultural production, i.e. the type of product and the level of processing, as well as in terms of geographical, social and economic aspects (Službeni glasnik, 2012). A group can consist of both unregistered farms and larger farms, but large farms must be audited every year.
3.2. Survey results We analyzed data from farms involved in the pro-duction of organic soybeans. Since only 0.07% soybean producers are engaged in the production of organic soybeans, certain indicators used data from the Guide for organic soybean production (2012). There are also taken into account, and are shown in Table 2, only those costs that are in all followed by all studied farms.
Table 2 Expenditures of individual producers of organic
soybean
Expenditures Amount (RSD)
Averagearea (ha) RSD/ha
plowing/tillage 33,900 3.8 8,921sowing treatment 16,950 3.8 4,460seeds 40,000 3.8 10,526planting 5,650 3.8 1,487cultivation 11,300 3.8 2,974hilling 9,600 3.8 2,526harvesting 39,550 3.8 10,408transport 5,650 3.8 1,487workforce 87,932 3.8 23,140certification 25,312 3.8 6,661
Source: Research of the author
Since the surveyed farms records income and
expenditure mainly to the total amount, the result-ing amounts are divided by the average size of 7 farms that perform organic soybean production, and it is 3.8 ha. Certification in most cases per-
formed in Italy (where is placed the greatest amount of products), so for example is showed the amount of certificates taken from this country. Given that mainly more field crops are certified at the same time, the amount is calculated according to the proportional share of the total soybean pro-duction.
Practically, the average size of farms where it is grown organic soybeans is 13.8 ha and such farms are paying 90,400 dinars for the certificate. Since soy makes an average of 28% of the total agricultural production, for this culture certificate is 25.312 RSD. Some individual farm attain the certification process in partnership with the buyer (usually in a ratio of 2: 1 in favor of the manufac-turer), but due to the lack of rules in such type of business, the paper present the cost of certification entirety.
Costs of the soil tillage, seed and sowing op-erations and services combines and transportation are also grouped together. The first two sets of costs are divided by major work activities. Ser-vices of combine, harvesting and transport are integrated because they are mainly related to the payment of services to third parties and is in this section will be seen most significant difference between the individual and cooperative produc-tion.
Table 3 Expenditures of individual producers
of organic soybean by 1ha
Individual expenditures Amount (RSD) plowing/tillage 13,381 seeds and seedings operations 17,513 harvesting and transport 11,895 workforce 23,140 certification 11,895 TOTAL 72,590
Source: Research of the author
Part of the table with the cost of the joint pro-
duction was obtained as a prerequisite of the pro-ducers themselves. It should be borne in mind that in none of the surveyed households perform coop-erative production. Costs that could change greatly in the case of organized production are:
1. the cost of certification, 2. the cost of procurement of seed material,
and 3. costs of services of combine harvesting
and transport to the silo. Organic certification is a process undergone by
producers of organic food and other agricultural
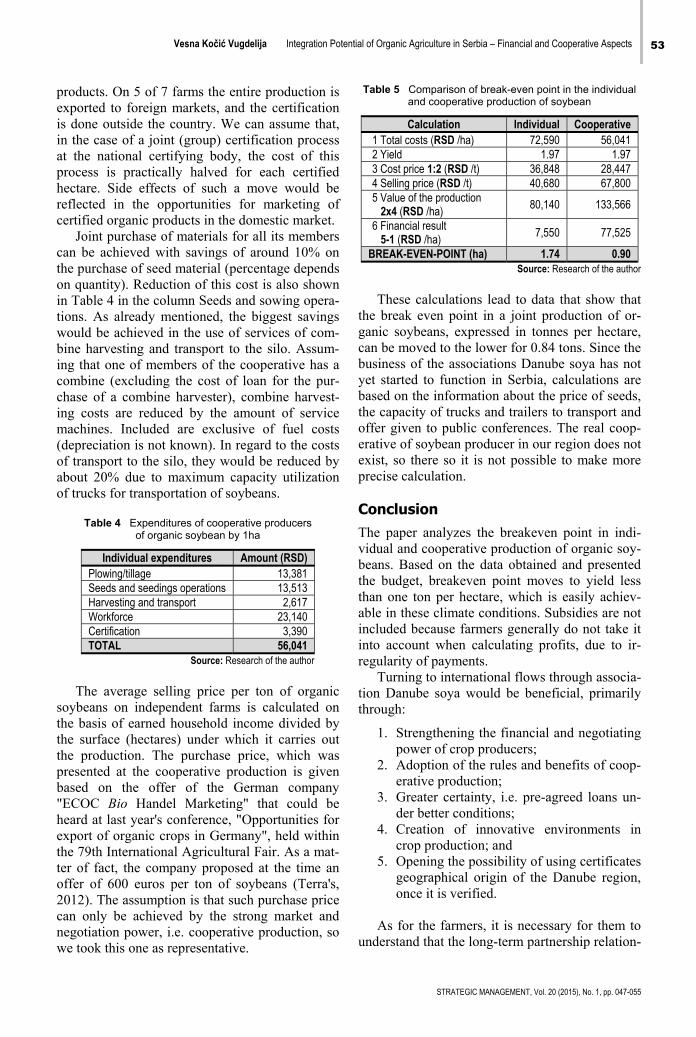
Vesna Kočić Vugdelija Integration Potential of Organic Agriculture in Serbia – Financial and Cooperative Aspects 53
STRATEGIC MANAGEMENT, Vol. 20 (2015), No. 1, pp. 047-055
products. On 5 of 7 farms the entire production is exported to foreign markets, and the certification is done outside the country. We can assume that, in the case of a joint (group) certification process at the national certifying body, the cost of this process is practically halved for each certified hectare. Side effects of such a move would be reflected in the opportunities for marketing of certified organic products in the domestic market.
Joint purchase of materials for all its members can be achieved with savings of around 10% on the purchase of seed material (percentage depends on quantity). Reduction of this cost is also shown in Table 4 in the column Seeds and sowing opera-tions. As already mentioned, the biggest savings would be achieved in the use of services of com-bine harvesting and transport to the silo. Assum-ing that one of members of the cooperative has a combine (excluding the cost of loan for the pur-chase of a combine harvester), combine harvest-ing costs are reduced by the amount of service machines. Included are exclusive of fuel costs (depreciation is not known). In regard to the costs of transport to the silo, they would be reduced by about 20% due to maximum capacity utilization of trucks for transportation of soybeans.
Table 4 Expenditures of cooperative producers
of organic soybean by 1ha
Individual expenditures Amount (RSD) Plowing/tillage 13,381 Seeds and seedings operations 13,513 Harvesting and transport 2,617 Workforce 23,140 Certification 3,390 TOTAL 56,041
Source: Research of the author
The average selling price per ton of organic
soybeans on independent farms is calculated on the basis of earned household income divided by the surface (hectares) under which it carries out the production. The purchase price, which was presented at the cooperative production is given based on the offer of the German company "ECOC Bio Handel Marketing" that could be heard at last year's conference, "Opportunities for export of organic crops in Germany", held within the 79th International Agricultural Fair. As a mat-ter of fact, the company proposed at the time an offer of 600 euros per ton of soybeans (Terra's, 2012). The assumption is that such purchase price can only be achieved by the strong market and negotiation power, i.e. cooperative production, so we took this one as representative.
Table 5 Comparison of break-even point in the individual and cooperative production of soybean
Calculation Individual Cooperative 1 Total costs (RSD /ha) 72,590 56,041 2 Yield 1.97 1.97 3 Cost price 1:2 (RSD /t) 36,848 28,447 4 Selling price (RSD /t) 40,680 67,800 5 Value of the production
2x4 (RSD /ha) 80,140 133,566
6 Financial result 5-1 (RSD /ha)
7,550 77,525
BREAK-EVEN-POINT (ha) 1.74 0.90 Source: Research of the author
These calculations lead to data that show that
the break even point in a joint production of or-ganic soybeans, expressed in tonnes per hectare, can be moved to the lower for 0.84 tons. Since the business of the associations Danube soya has not yet started to function in Serbia, calculations are based on the information about the price of seeds, the capacity of trucks and trailers to transport and offer given to public conferences. The real coop-erative of soybean producer in our region does not exist, so there so it is not possible to make more precise calculation.
Conclusion The paper analyzes the breakeven point in indi-vidual and cooperative production of organic soy-beans. Based on the data obtained and presented the budget, breakeven point moves to yield less than one ton per hectare, which is easily achiev-able in these climate conditions. Subsidies are not included because farmers generally do not take it into account when calculating profits, due to ir-regularity of payments.
Turning to international flows through associa-tion Danube soya would be beneficial, primarily through:
1. Strengthening the financial and negotiating power of crop producers;
2. Adoption of the rules and benefits of coop-erative production;
3. Greater certainty, i.e. pre-agreed loans un-der better conditions;
4. Creation of innovative environments in crop production; and
5. Opening the possibility of using certificates geographical origin of the Danube region, once it is verified.
As for the farmers, it is necessary for them to
understand that the long-term partnership relation-
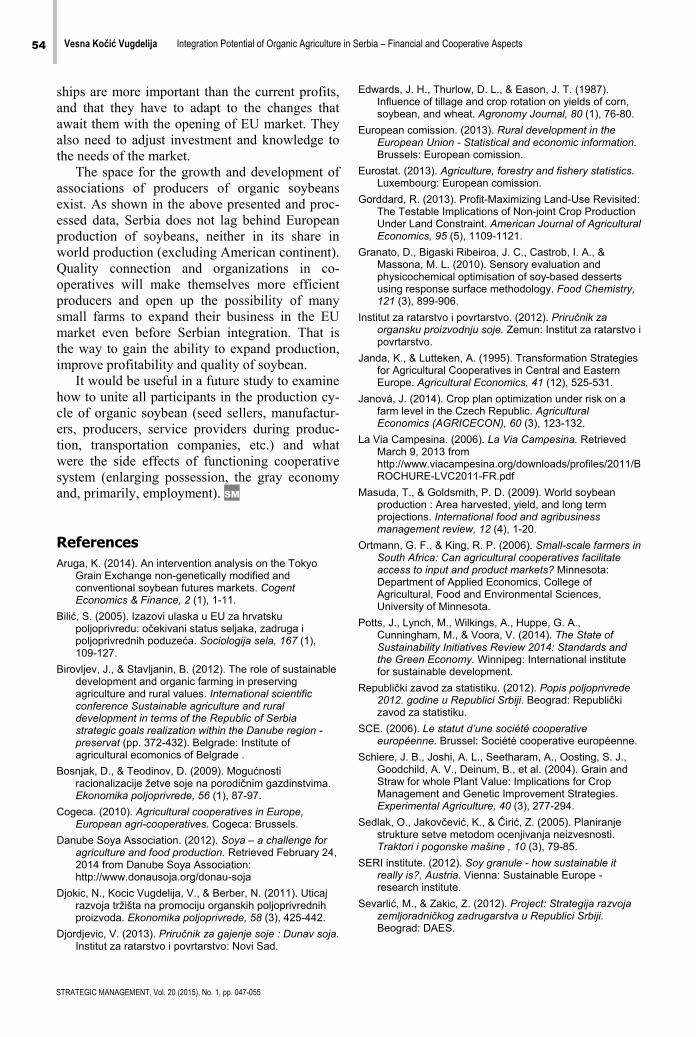
54 Vesna Kočić Vugdelija Integration Potential of Organic Agriculture in Serbia – Financial and Cooperative Aspects
STRATEGIC MANAGEMENT, Vol. 20 (2015), No. 1, pp. 047-055
ships are more important than the current profits, and that they have to adapt to the changes that await them with the opening of EU market. They also need to adjust investment and knowledge to the needs of the market.
The space for the growth and development of associations of producers of organic soybeans exist. As shown in the above presented and proc-essed data, Serbia does not lag behind European production of soybeans, neither in its share in world production (excluding American continent). Quality connection and organizations in co-operatives will make themselves more efficient producers and open up the possibility of many small farms to expand their business in the EU market even before Serbian integration. That is the way to gain the ability to expand production, improve profitability and quality of soybean.
It would be useful in a future study to examine how to unite all participants in the production cy-cle of organic soybean (seed sellers, manufactur-ers, producers, service providers during produc-tion, transportation companies, etc.) and what were the side effects of functioning cooperative system (enlarging possession, the gray economy and, primarily, employment). SM
References Aruga, K. (2014). An intervention analysis on the Tokyo
Grain Exchange non-genetically modified and conventional soybean futures markets. Cogent Economics & Finance, 2 (1), 1-11.
Bilić, S. (2005). Izazovi ulaska u EU za hrvatsku poljoprivredu: očekivani status seljaka, zadruga i poljoprivrednih poduzeća. Sociologija sela, 167 (1), 109-127.
Birovljev, Ј., & Stavljanin, B. (2012). The role of sustainable development and organic farming in preserving agriculture and rural values. International scientific conference Sustainable agriculture and rural development in terms of the Republic of Serbia strategic goals realization within the Danube region - preservat (pp. 372-432). Belgrade: Institute of agricultural ecomonics of Belgrade .
Bosnjak, D., & Teodinov, D. (2009). Mogućnosti racionalizacije žetve soje na porodičnim gazdinstvima. Ekonomika poljoprivrede, 56 (1), 87-97.
Cogeca. (2010). Agricultural cooperatives in Europe, European agri-cooperatives. Cogeca: Brussels.
Danube Soya Association. (2012). Soya – a challenge for agriculture and food production. Retrieved February 24, 2014 from Danube Soya Association: http://www.donausoja.org/donau-soja
Djokic, N., Kocic Vugdelija, V., & Berber, N. (2011). Uticaj razvoja tržišta na promociju organskih poljoprivrednih proizvoda. Ekonomika poljoprivrede, 58 (3), 425-442.
Djordjevic, V. (2013). Priručnik za gajenje soje : Dunav soja. Institut za ratarstvo i povrtarstvo: Novi Sad.
Edwards, J. H., Thurlow, D. L., & Eason, J. T. (1987). Influence of tillage and crop rotation on yields of corn, soybean, and wheat. Agronomy Journal, 80 (1), 76-80.
European comission. (2013). Rural development in the European Union - Statistical and economic information. Brussels: European comission.
Eurostat. (2013). Agriculture, forestry and fishery statistics. Luxembourg: European comission.
Gorddard, R. (2013). Profit-Maximizing Land-Use Revisited: The Testable Implications of Non-joint Crop Production Under Land Constraint. American Journal of Agricultural Economics, 95 (5), 1109-1121.
Granato, D., Bigaski Ribeiroa, J. C., Castrob, I. A., & Massona, M. L. (2010). Sensory evaluation and physicochemical optimisation of soy-based desserts using response surface methodology. Food Chemistry, 121 (3), 899-906.
Institut za ratarstvo i povrtarstvo. (2012). Priručnik za organsku proizvodnju soje. Zemun: Institut za ratarstvo i povrtarstvo.
Janda, K., & Lutteken, A. (1995). Transformation Strategies for Agricultural Cooperatives in Central and Eastern Europe. Agricultural Economics, 41 (12), 525-531.
Janová, J. (2014). Crop plan optimization under risk on a farm level in the Czech Republic. Agricultural Economics (AGRICECON), 60 (3), 123-132.
La Via Campesina. (2006). La Via Campesina. Retrieved March 9, 2013 from http://www.viacampesina.org/downloads/profiles/2011/BROCHURE-LVC2011-FR.pdf
Masuda, T., & Goldsmith, P. D. (2009). World soybean production : Area harvested, yield, and long term projections. International food and agribusiness management review, 12 (4), 1-20.
Ortmann, G. F., & King, R. P. (2006). Small-scale farmers in South Africa: Can agricultural cooperatives facilitate access to input and product markets? Minnesota: Department of Applied Economics, College of Agricultural, Food and Environmental Sciences, University of Minnesota.
Potts, J., Lynch, M., Wilkings, A., Huppe, G. A., Cunningham, M., & Voora, V. (2014). The State of Sustainability Initiatives Review 2014: Standards and the Green Economy. Winnipeg: International institute for sustainable development.
Republički zavod za statistiku. (2012). Popis poljoprivrede 2012. godine u Republici Srbiji. Beograd: Republički zavod za statistiku.
SCE. (2006). Le statut d’une société cooperative européenne. Brussel: Société cooperative européenne.
Schiere, J. B., Joshi, A. L., Seetharam, A., Oosting, S. J., Goodchild, A. V., Deinum, B., et al. (2004). Grain and Straw for whole Plant Value: Implications for Crop Management and Genetic Improvement Strategies. Experimental Agriculture, 40 (3), 277-294.
Sedlak, O., Jakovčević, K., & Ćirić, Z. (2005). Planiranje strukture setve metodom ocenjivanja neizvesnosti. Traktori i pogonske mašine , 10 (3), 79-85.
SERI institute. (2012). Soy granule - how sustainable it really is?, Austria. Vienna: Sustainable Europe - research institute.
Sevarlić, M., & Zakic, Z. (2012). Project: Strategija razvoja zemljoradničkog zadrugarstva u Republici Srbiji. Beograd: DAES.
Vesna Kočić Vugdelija Integration Potential of Organic Agriculture in Serbia – Financial and Cooperative Aspects 55
STRATEGIC MANAGEMENT, Vol. 20 (2015), No. 1, pp. 047-055
SIEPA. (2012). Organic sertifikat (BIO). Retrieved March 22, 2014 from SIEPA: http://siepa.gov.rs/sr/index/standardi/organic-sertifikat.html
Službeni glasnik. (2012). Pravilnik o kontrolisanju i sertifikaciji u organskoj proizvodnji u Srbiji, 2012 Sl. glasnik RS", br. 48/2011 i 40/2012. Beograd: Službeni glasnik.
Stecca, V. (2011). Zadrugarstvo i socijalna ekonomija u Hrvatskoj. Zagreb: Croatian Association of Cooperatives.
Sudarevic, T., Salai, S., & Pupovac, L. (2011). Marketing aspekti ponude organskih poljoprivrednih proizvoda u Srbiji i okruženju. Anali, 47 (26), 33-48.
TERRA'S. (2012, May 15). Mogućnosti izvoza organskih kultura u Nemačku. Retrieved February 13, 2014 from TERRA'S: http://www.terras.org.rs/index.php?sadrzaj=terras/projekti/organicanet/konfnasajmu2012
The International Co-operative Alliance. (2014). Vision & Mission. Retrieved February 2, 2014 from The International Co-operative Alliance: http://ica.coop/en/basics/vision-mission
Zekić, S., Gajić, M., & Matkovski, B. (2013). Serbian agriculture in the regional and European integrations. Challenges for the global agricultural trade regime after Doha (pp. 369-376). Belgrade: DAES.
Correspondence
Vesna Kočić Vugdelija
Economic Academy Belgrade, FIMEK Novi Sad Cvećarska 2, 21000, Novi Sad, Serbia
E-mail: [email protected]
STRATEGIC MANAGEMENT, Vol. 20 (2015), No. 1, pp. 056-060 UDC 327:341.232.7"20"
Received: April 30, 2014
Accepted: January 15, 2015
The Role of Cross-cultural Competence in International Business in the Twenty-first Century
Márta Dévényi University of Pécs, Faculty of Business and Economics, Pécs, Hungary
Abstract The aim of the paper is to discuss the requirements of cross-cultural competence for managers in international business in the 21st century. Cross-cultural competencies are indispensable for managers involved in cross-border interactions as cultural awareness affects the success of managing human resources in business op-erations, the integration processes, competitiveness and social responsibility. The components and methodsof cross-cultural training programs are also discussed. This paper examines the attributes of cross-cultural competence and cross-cultural training on the basis of theoretical research. Keywords Culture, communication, intercultural communication, cultural identity, cultural competence, cultural intelli-gence, cross-cultural competence, cross-cultural training.
Introduction Dowling, Festing and Engle Sr (2008, p. 9) state that the complexities involved in international operations are underestimated by many firms; however, “there has been consistent evidence to suggest that business failures in the international arena are often linked to poor management of human resources”. The poor management of hu-man resources is often caused by not being aware of the different cultural environments of the head-quarters and the host location. Expatriate failure and the premature return of an expatriate can cause long-term negative consequences not only in subsidiary performance but also in the relation-ship with host government officials and key cli-ents resulting in a loss of market share. On the other hand expatriate failure also affects the ex-patriate’s career as it is often accompanied by the loss of self-esteem, self-confidence and the loss of prestige among peers (Dowling et al., 2008, pp. 112-113).
1. The significance of cross-cultural competence Dowling et al. (2008) state on the basis of Caligiury’s (2000, as cited in Dowling et al. 2008) study that the attributes of cross-culturally compe-tent expatriates “should include cultural empathy, adaptability, diplomacy, language ability, positive attitude, emotional stability and maturity” (Dowling et al., 2008, p. 120). We must add that possessing cross-cultural abilities is significant not only for expatriates but for host country man-agers as well to be able to interact in multinational and global enterprises.
However, when defining the required compe-tences there is no consensus on their meaning and components (for example Early & Ang, 2003, p. 265, Dowling et al., 2008 p. 120). Cross-cultural competence, intercultural competence and cultural intelligence are terms that are used by researchers and practitioners interchangeably.
Intercultural competence is described as com-prising the aspects of the individual’s personality, attitude to foreigners and ability to relate to peo-ple from another cultural group (Dowling et al.
Márta Dévényi The Role of Cross-cultural Competence in International Business in the Twenty-first Century 57
STRATEGIC MANAGEMENT, Vol. 20 (2015), No. 1, pp. 056-060
2008, p. 120). Early & Ang (2003, p. 170) defines intercultural communication as “interpersonal interaction between people of different cultures or shared bodies of knowledge”. Intercultural com-munication as a study focuses on analysing verbal and nonverbal behaviours in cross-cultural en-counters.
An inventory of cross-cultural competences, defined by researchers, practitioners and consult-ing firms specializing in cross-cultural training, comprises (1) knowledge (cultural knowledge), (2) skills (communication skills), (3) abilities (ability to succeed in multiple and diverse envi-ronments, to adopt a dual focus: focus on both task and relationship)and (4) dispositional traits (tolerance for ambiguity, empathy, open-mindedness, flexibility, positive attitude to learn-ing, tolerance for different styles and cultures) (Tan & Chua, 2003, p. 264).
The concept of cultural intelligence refers to “a person’s ability to adapt effectively to new cul-tural contexts” (Early & Ang, 2003, p. 59). Early & Ang (2003) argue that the most critical features of it are “the ability to construct innovative ways of conceptualizing, data gathering, and operating in a new culture” (Early & Ang, 2003, p. 93). Skills and capabilities, which help a person dis-play cultural intelligence, have cognitive, motiva-tional and behavioural components. Cognitive components comprise analogical elements, pattern recognition, self awareness and tacit cultural knowledge; motivational components refer to val-ue questioning and integration and a person’s de-sire to adjust to new cultural circumstances, while behavioural components are practices, rituals, habits and variations of social behaviours across cultures (Early & Ang, 2003, p. 67).
2. Cross-cultural training programs As multinational and global enterprises integrate managers from diverse cultural background it is indispensable to prepare them for cross-cultural interactions in a multicultural working environ-ment to avoid potential pitfalls, which may have negative effect on the performance of the enter-prises. Considering the above reasons, Tan & Chua (2003, p. 261) argue that cross-cultural training has become a strategic component in in-ternational business and management.
Cross-cultural training programs, which are al-so called intercultural management training and consulting, “aim at the delivery of skills that ena-ble people to quickly become professionally pro-ductive and interpersonally effective when work-
ing on assignment abroad, or when working any-where with others from an unfamiliar culture” (Tan &Chua, 2003, p. 265). Based on the aim and content, cross-cultural training programs can be designed as global management training, cross-cultural project management training, virtual team facilitation and executive coaching (Tan & Chua, 2003, p. 265).
Cultural awareness training is the most com-mon form of pre-departure training programs, which are provided to expatriates before starting their assignment abroad “to assist individuals to adjust more rapidly to the new culture”. (Dowling et al., p. 139). Its components vary according to the country of assignment and the degree of the distance between the home culture of the expatri-ate and the host culture. Dowling et al. (2008, p. 141) emphasise based on Tung’s research (1981) that the larger the dissimilarity between the cul-tures and the higher the level of the expected in-teraction with host nationals is the more emphasis should be made on developing cross cultural skills. They support Tung’s recommendation that communication competence should be focused on and “Training should be more oriented to life-long learning than ‘one-shot’ programs with an area specific focus” (Dowling et al., 2008, p. 141.).
Based on Brislin & Hovarth’s (1997, as cited in Tan & Chua, 2003) comprehensive review of cross-cultural training methods, Tan & Chua (2003) described five approaches in cross-cultural training: (1) cognitive (transfer of cultural knowledge), (2) attributional (culture assimilators: critical incidents), (3) experiential (“hands-on” training), (4) self-awareness (awareness of their own culture) and (5) behavioural (practising and displaying appropriate behaviours in various cul-tural settings and scenarios) (Tan & Chua, 2003, pp. 268-269)
3. Guidelines to culture and communication Cultural typologies serve as important guidelines to understand cultural diversities. The cultural knowledge of business professionals can be sup-ported by using cultural dimensions and patterns in analyzing diversities and similarities in cultures so the cognitive components of cultural intelli-gence namely pattern recognition and self aware-ness can be acquired by cultural typologies. In this chapter we discuss how cultural dimensions of Hofstede, the types of communication and culture identified by Hall and cultural patterns described by Gesteland could serve as guidelines for man-
58 Márta Dévényi The Role of Cross-cultural Competence in International Business in the Twenty-first Century
STRATEGIC MANAGEMENT, Vol. 20 (2015), No. 1, pp. 056-060
agers in the development of their cross-cultural intelligence. 3.1. Hofstede’s cultural dimensions Hofstede defines culture as “collective program-ming of the mind which distinguishes the mem-bers of one category of people from another” (Hofstede & Usunier, 1996, p. 5). National culture is a significant component of our mental pro-gramming which defines patterns of thinking, feeling and acting. Hofstede’s research in the cul-tural values of employees conducted in the IBM multinational company in 72 countries between 1967 and 1973 revealed that values differed main-ly along four dimensions: Power Distance, Indi-vidualism versus Collectivism, Masculinity versus Femininity, Uncertainty Avoidance versus Uncer-tainty Acceptance (Hofstede, 1991). The cogni-tion, behaviour and communication of managers in international business are influenced by their national, professional and organisational culture.
Hofstede & Usunier (1996, pp. 121-126) draw attention to some presupposed consequences of related cultural dimensions in intercultural busi-ness negotiations. Large Power Distance indicates centralised control and decision-making during the negotiation process. Negotiators from collec-tivist cultures need stable relationships with their negotiating parties, and so the replacement of ne-gotiators should be avoided. Sympathy for the strong and ego-boosting behaviour is indicated by Masculine cultures, while Femininity leads to ego-effacing behaviour and sympathy for the weak. A low tolerance of ambiguity and a distrust of opponents are the consequences of high Uncer-tainty Avoidance.
To be able to decode the other party/parties’ communication and interpret their behaviour, ne-gotiators should acquire “an insight into their own cultural values and the extent to which these devi-ate from those of the other side(s)” (Hofstede, 1996, p. 126). If negotiators are aware of the ap-proximate position of their (and the other par-ty/parties’) national culture’s value system in terms of cultural dimensions, they can predict significant aspects of their forthcoming negotia-tions in an intercultural environment.
3.2. Hall’s types of culture and communica-tion: high and low context communication As words and sentences have different meanings, depending on their context, this determines the basic characteristics of interpersonal communica-tion, consequently those of business communica-
tion as well. Hall considers the level of context as the basis determining communication and behav-iour. He underlines that “The level of context de-termines everything about the nature of the com-munication and is the foundation on which all subsequent behaviour rests (including symbolic behaviour)” (Hall, 1989a, p. 91)
He argues that two entirely different but highly interrelated processes make contexting possible: “The first takes place in the brain and is a function of either past experience (programmed, internal-ized contexting) or the structure of the nervous system (innate contexting), or both. External contexting comprises the situation and/or setting in which an event occurs (situational and/or envi-ronmental contexting) (Hall, 1989a, p. 95). So, past experience (internal context) and the envi-ronment and situation of the communication (ex-ternal context) can be used as communicational devices – but different nations use them at differ-ent rates.
Hall (1989a, p. 91) states that “A high-context (HC) communication or message is one in which most of the information is either in the physical context or internalized in the person, while very little is in the coded, explicit, transmitted part of the message. A low context (LC) communication is just the opposite; i.e. the mass of the infor-mation is vested in the explicit code”. Therefore, the level of context determines communication, since low-context cultures express themselves verbally, whilst high-context cultures transmit much information non-verbally. The former type of communication is also termed direct communi-cation, as its message is verbally coded and ex-plicit, whilst the latter type is termed indirect communication, since only a small part of the message is verbally coded and explicit, the rest being implicitly in the context.
Hall’s research suggests that there are cultures where communication is significantly high-context and that there are others where it is low-context. He asserts that Western and Central Eu-rope feature toward the lower end of the scale, whilst Southern Europe is at the higher end. Hall considers German and Swiss-German to be the lowest-context communication not only of Eu-rope, but of the whole world and Japanese the highest context of all (Hall, 1989a, p. 91).
In the twenty-first century there is an increas-ing number of issues which require intercultural negotiations with the participation of people from high and low context cultures. Hall (1989a, p. 61) declares that “…all cultures arrange their mem-
Márta Dévényi The Role of Cross-cultural Competence in International Business in the Twenty-first Century 59
STRATEGIC MANAGEMENT, Vol. 20 (2015), No. 1, pp. 056-060
bers and relationships along the context scale and one of the great communication strategies, wheth-er addressing a single person or an entire group, is to ascertain the correct level of contexting of one’s communication˝ (p.61). It might happen unconsciously within one culture, but the appro-priate amount of context to use between cultures can be determined only consciously.
3.3. Hall’s types of culture and communica-tion: orientation to time People belonging to different cultures handle time in different ways as it is rooted in their cultural tradition and social setting. After years of expo-sure to cultures Hall (1989b, p. 45-46) stated that” complex societies organize time in at least two different ways: events scheduled as different items – one thing at a time – as in North Europe, or following the Mediterranean model of in-volvement in several things at once. The two sys-tems are logically and empirically quite distinct. Like oil and water, they don’t mix”.
Hall (1998b, p. 48) termed doing many things at a time as Polychronic (P-time) and doing one thing at a time as Monochronic (M-time). He states M-time as being tangible, and draws atten-tion to metaphors, which are often used by M-time people: it is ”being saved, spent, wasted, lost, made up, crawling, killed and running out”. M-time is learnt as the logical way of organizing life. By contrast, P-time people such as Arabs and Turks interact with several people at a time, their world is dominated by human relationship and so tight scheduling is impossible (Hall, 1998b, pp. 46-50). The two different ways of organising time in different cultures means difficulties for busi-ness professionals doing business in an intercul-tural context.
3.4. Gesteland’s cultural patterns Gesteland (1999, p. 9) characterizes his book ”as a practical guide for the men and women in the front lines of world trade, those, who face every day the frustrating differences in global business customs and practices”. He intended to make business customs and practices in intercultural relations some more predictable by classifying them into logical patterns.
Gesteland (1999, pp. 19-32) identifies Deal-Focused vs. Relationship-Focused cultures as op-posing ones. DF people are task-oriented while RF people are people–oriented in business rela-tions. DF people use direct, frank, straightforward language, while RF people use indirect language
in a subtle, roundabout style when negotiating. This pattern of diversities in communication has its roots in Hall’s low-context vs. high-context aspect of communication.
Informal vs. Formal Cultures are represented by their informal vs. formal behaviour in interna-tional business. These alternatives are dependent on different rates of equality in societies: small differences in status and power vs. steep hierar-chies, major differences in status and power. This pattern has its roots in Hofstede’s high vs. low Power Distance dimension (pp.43-54).
Rigid-time vs. Fluid-time Cultures refer to the same type of cultures as Hall’s monochronic vs. polychronic systems of life: punctuality, sched-ules, fixed agendas and deadlines vs. flexible agendas, loose scheduling, doing more than one thing simultaneously (Hofstede, 1991, pp. 55-62).
Gesteland (1999, pp. 63-78) identifies Expres-sive vs. Reserved Cultures based on the behaviour and verbal, paraverbal and nonverbal communica-tion of the members of related cultures. For ex-ample, members of Expressive Cultures use con-versational overlaps and intense or firm eye con-tact when they are communicating, while mem-bers of Reserved Cultures use conversational turntaking and moderate or indirect eye contact in their communicational interactions.
Gesteland’s patterns of culture categorise cul-tural variables in a simple way, which is why they are easy to use by business professionals in busi-ness interactions.
Conclusion Cultural knowledge means being conscious of the characteristics of one’s own culture and those of other cultures. It is cultural dimensions and pat-terns, which provide the relevant means to com-pare and analyse diversities and similarities in the case of distinct cultures. If someone has acquired the knowledge and skills needed to use cultural dimensions and patterns, he has the ability to se-lect the relevant information concerning the cul-ture which he encounters in international business. Thus this is why it is important to involve cultural dimensions and patterns in cross-cultural training programs. The cultural dimensions of Hofstede, the patterns of culture and communication identi-fied by Hall and the cultural patterns described by Gesteland are focused on because in the author’s teaching practice these were found the most ade-quate means for developing students’ cross-cultural competence. Using them consciously and trying to find the interrelated aspects of cultural
60 Márta Dévényi The Role of Cross-cultural Competence in International Business in the Twenty-first Century
STRATEGIC MANAGEMENT, Vol. 20 (2015), No. 1, pp. 056-060
dimensions and patterns in respect of distinct cul-tures will help managers understand cultural cues.
Early & Ang (2003, p. 209) argue referring to Barlett & Ghoshal (1989) and Pfeffer (1994) that there is a consensus of researchers, that global managers and workers should be capable of coor-dinating global strategic efforts of the firm and integrating host-country strategies of its subsidiar-ies at the same time. So designing more efficient cross-cultural training programs is getting to be focused on by companies, however, much remains to be done, all the three components of cultural intelligence, the cognitive, motivational and be-havioural ones, should be taken into consideration by the designers of cross-cultural training pro-grams. SM
References Dowling, P. J., Festing, M., & Engle Sr, A. D. (2008).
International Human Resource Management. London: Thomson Learning.
Earley, P. C., & Ang, S. (2003). Cultural Intelligence. Individual Interactions Across Cultures. Stanford: Stanford University Press.
Gesteland, R. R. (1999). Cross-Cultural Business Behavior. Copenhagen: Copenhagen Business School Press.
Hall, E. T. (1989a). Beyond Culture. New York: Doubleday. Hall, E. T. (1989b). The Dance of Life. New York:
Doubleday. Hofstede, G. (1991). Cultures and Organizations. London:
Harper Collins Publishers. Hofstede, G., & Usunier, J. C. (1996). Hofstede’s
Dimensions of Culture and their Influence on International Business Negotiations. In P. N. Ghauri, & J. C. Usunier (Eds.), International Business Negotiations. Eds. (pp. 119-130). Oxford: Elsevier Science Ltd.
Tan, J. S., & Chua, R. Y. (2003). Training and Developing Cultural Intelligence. In P. C. Earley, & S. Ang (Eds.), Cultural Intelligence. Individual Interactions Across Cultures (pp. 258-303). Stanford: Stanford University Press.
Correspondence
Márta Dévényi
Faculty of Business and Economics Vasvári Pál Street 4, H-7622, Pécs, Hungary
E-mail: [email protected]
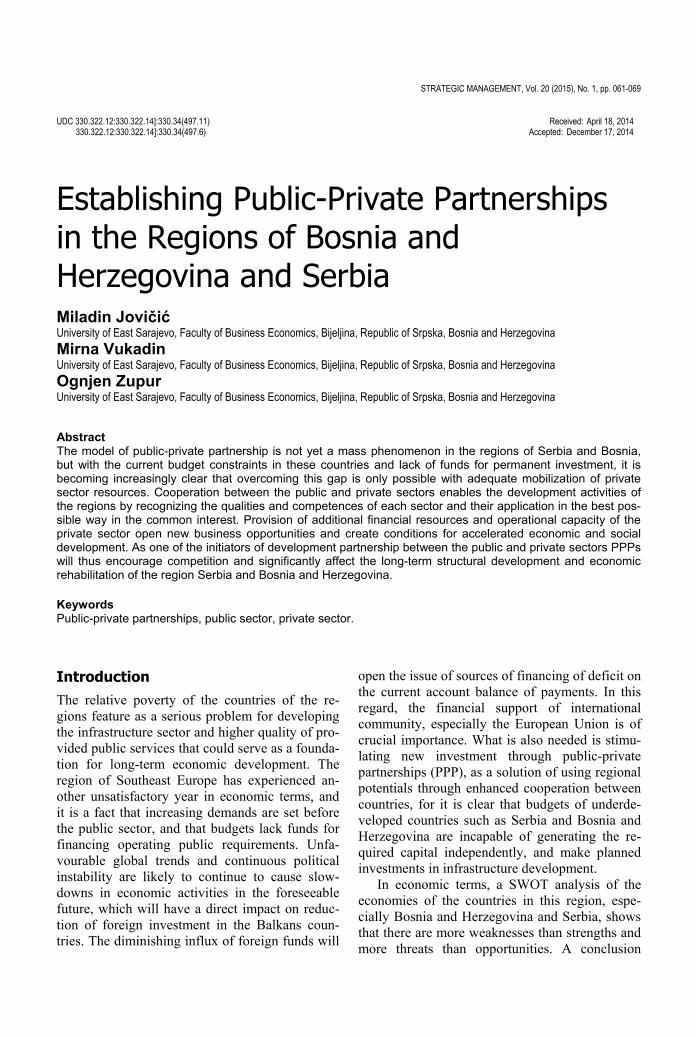
STRATEGIC MANAGEMENT, Vol. 20 (2015), No. 1, pp. 061-069 UDC 330.322.12:330.322.14]:330.34(497.11) 330.322.12:330.322.14]:330.34(497.6)
Received: April 18, 2014
Accepted: December 17, 2014
Establishing Public-Private Partnerships in the Regions of Bosnia and Herzegovina and Serbia
Miladin Jovičić University of East Sarajevo, Faculty of Business Economics, Bijeljina, Republic of Srpska, Bosnia and Herzegovina Mirna Vukadin University of East Sarajevo, Faculty of Business Economics, Bijeljina, Republic of Srpska, Bosnia and Herzegovina
Ognjen Zupur University of East Sarajevo, Faculty of Business Economics, Bijeljina, Republic of Srpska, Bosnia and Herzegovina
Abstract The model of public-private partnership is not yet a mass phenomenon in the regions of Serbia and Bosnia,but with the current budget constraints in these countries and lack of funds for permanent investment, it isbecoming increasingly clear that overcoming this gap is only possible with adequate mobilization of privatesector resources. Cooperation between the public and private sectors enables the development activities ofthe regions by recognizing the qualities and competences of each sector and their application in the best pos-sible way in the common interest. Provision of additional financial resources and operational capacity of theprivate sector open new business opportunities and create conditions for accelerated economic and socialdevelopment. As one of the initiators of development partnership between the public and private sectors PPPswill thus encourage competition and significantly affect the long-term structural development and economic rehabilitation of the region Serbia and Bosnia and Herzegovina. Keywords Public-private partnerships, public sector, private sector.
Introduction The relative poverty of the countries of the re-gions feature as a serious problem for developing the infrastructure sector and higher quality of pro-vided public services that could serve as a founda-tion for long-term economic development. The region of Southeast Europe has experienced an-other unsatisfactory year in economic terms, and it is a fact that increasing demands are set before the public sector, and that budgets lack funds for financing operating public requirements. Unfa-vourable global trends and continuous political instability are likely to continue to cause slow-downs in economic activities in the foreseeable future, which will have a direct impact on reduc-tion of foreign investment in the Balkans coun-tries. The diminishing influx of foreign funds will
open the issue of sources of financing of deficit on the current account balance of payments. In this regard, the financial support of international community, especially the European Union is of crucial importance. What is also needed is stimu-lating new investment through public-private partnerships (PPP), as a solution of using regional potentials through enhanced cooperation between countries, for it is clear that budgets of underde-veloped countries such as Serbia and Bosnia and Herzegovina are incapable of generating the re-quired capital independently, and make planned investments in infrastructure development.
In economic terms, a SWOT analysis of the economies of the countries in this region, espe-cially Bosnia and Herzegovina and Serbia, shows that there are more weaknesses than strengths and more threats than opportunities. A conclusion
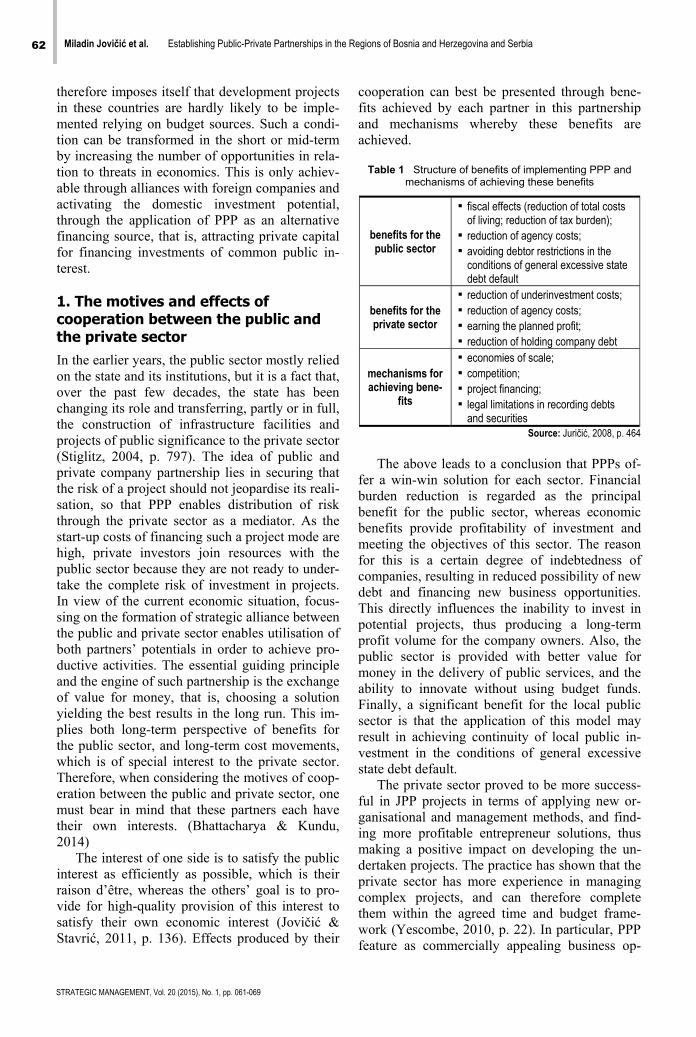
62 Miladin Jovičić et al. Establishing Public-Private Partnerships in the Regions of Bosnia and Herzegovina and Serbia
STRATEGIC MANAGEMENT, Vol. 20 (2015), No. 1, pp. 061-069
therefore imposes itself that development projects in these countries are hardly likely to be imple-mented relying on budget sources. Such a condi-tion can be transformed in the short or mid-term by increasing the number of opportunities in rela-tion to threats in economics. This is only achiev-able through alliances with foreign companies and activating the domestic investment potential, through the application of PPP as an alternative financing source, that is, attracting private capital for financing investments of common public in-terest.
1. The motives and effects of cooperation between the public and the private sector In the earlier years, the public sector mostly relied on the state and its institutions, but it is a fact that, over the past few decades, the state has been changing its role and transferring, partly or in full, the construction of infrastructure facilities and projects of public significance to the private sector (Stiglitz, 2004, p. 797). The idea of public and private company partnership lies in securing that the risk of a project should not jeopardise its reali-sation, so that PPP enables distribution of risk through the private sector as a mediator. As the start-up costs of financing such a project mode are high, private investors join resources with the public sector because they are not ready to under-take the complete risk of investment in projects. In view of the current economic situation, focus-sing on the formation of strategic alliance between the public and private sector enables utilisation of both partners’ potentials in order to achieve pro-ductive activities. The essential guiding principle and the engine of such partnership is the exchange of value for money, that is, choosing a solution yielding the best results in the long run. This im-plies both long-term perspective of benefits for the public sector, and long-term cost movements, which is of special interest to the private sector. Therefore, when considering the motives of coop-eration between the public and private sector, one must bear in mind that these partners each have their own interests. (Bhattacharya & Kundu, 2014)
The interest of one side is to satisfy the public interest as efficiently as possible, which is their raison d’être, whereas the others’ goal is to pro-vide for high-quality provision of this interest to satisfy their own economic interest (Jovičić & Stavrić, 2011, p. 136). Effects produced by their
cooperation can best be presented through bene-fits achieved by each partner in this partnership and mechanisms whereby these benefits are achieved.
Table 1 Structure of benefits of implementing PPP and
mechanisms of achieving these benefits
benefits for the public sector
▪ fiscal effects (reduction of total costs of living; reduction of tax burden);
▪ reduction of agency costs; ▪ avoiding debtor restrictions in the
conditions of general excessive state debt default
benefits for the private sector
▪ reduction of underinvestment costs; ▪ reduction of agency costs; ▪ earning the planned profit; ▪ reduction of holding company debt
mechanisms for achieving bene-
fits
▪ economies of scale; ▪ competition; ▪ project financing; ▪ legal limitations in recording debts
and securities Source: Juričić, 2008, p. 464
The above leads to a conclusion that PPPs of-
fer a win-win solution for each sector. Financial burden reduction is regarded as the principal benefit for the public sector, whereas economic benefits provide profitability of investment and meeting the objectives of this sector. The reason for this is a certain degree of indebtedness of companies, resulting in reduced possibility of new debt and financing new business opportunities. This directly influences the inability to invest in potential projects, thus producing a long-term profit volume for the company owners. Also, the public sector is provided with better value for money in the delivery of public services, and the ability to innovate without using budget funds. Finally, a significant benefit for the local public sector is that the application of this model may result in achieving continuity of local public in-vestment in the conditions of general excessive state debt default.
The private sector proved to be more success-ful in JPP projects in terms of applying new or-ganisational and management methods, and find-ing more profitable entrepreneur solutions, thus making a positive impact on developing the un-dertaken projects. The practice has shown that the private sector has more experience in managing complex projects, and can therefore complete them within the agreed time and budget frame-work (Yescombe, 2010, p. 22). In particular, PPP feature as commercially appealing business op-
Miladin Jovičić et al. Establishing Public-Private Partnerships in the Regions of Bosnia and Herzegovina and Serbia 63
STRATEGIC MANAGEMENT, Vol. 20 (2015), No. 1, pp. 061-069
portunities for the private sector, as these are mostly large projects and huge amounts of money, where the private sector is hired to deliver the complete service package (e.g. design, construc-tion, operation and maintenance). In this case, the desired outcome in a PPP project must be clearly stated, so that the private sector has a clear under-standing of policies and aims of the public sector and thus, through innovative solutions, provides expertise required for the procedural development of the project, characteristic of private entrepre-neurship. Also, the volume of JPP projects should provide the private sector with sufficient flexibil-ity to introduce new ideas, for instance new tech-nologies, thus directly providing quality of public services, that is, the best value for money. It is only through cooperation and partnership within PPP that the above mentioned interests can be attained, because an additional interest of both the public and the private partner is to preserve the formed partnership. There must be cooperation and partnership between the public and the private sector, which are achieved by creating such a situation in which achieving the interests or aims of one partner must also mean achieving the inter-ests or goals of the other partner. Therefore, in addition to meeting the public needs, the product of joint initiative of the public and the private sec-tor also include contribution to social and techno-logical development of any community. Develop-ing countries have a lower creditworthiness and cannot mobilise funds on the international capital market all by themselves, so that the PPP is one of the ways to provide sources of finance for appeal-ing projects. (Giuliani & Macchi, 2014)
2. The practice of establishing PPPs in Serbia. Serbia did not pass the Law on Public-Private Partnerships and Concessions until November 2011, which represented a significant step in ad-vancing the Serbian legislation, aimed at encour-aging PPPs and attracting domestic and foreign investors and banks to participate in financing projects of general public interest. Stimulating the emergence of new economic entities on the mar-ket and development of market competition are only some of the effects expected as the outcome of implementation of this Law. Partnership of public and private sector should result in the reali-sation of infrastructural projects that have been waiting for years, such as modernisation of road and communal infrastructure, and provision of services of public interest, which requires attract-
ing private investments. The new Law, introduc-ing the possibility of PPPs, will enable local gov-ernments to carry out projects on their territory without participation of the national Government, and the aim of the Law is to establish long-term partnerships between the public and the private sector. There are, however, different opinions among experts as to the application of the adopted Law on PPPs. According to the current informa-tion, it cannot be assessed clearly what is the achieved level of investment and what expected level of investment in the forthcoming period is possible through the application of the new law, but it has been established that a large number of interested investors have been contacting Minis-tries and local governments in order to realise some projects. In addition, the Law does not pro-vide the public sector to realise the project in practice once an interested private partner ap-pears. This initial offer may be a catalyst for initi-ating a procedure for obtaining a private partner, where the project initiator or interested party can-not have any kind of advantage. In cases where this competitive advantage cannot be removed, the initiator is excluded from the procedure of awarding the public contract. The fact that some-one is interested is only a signal for the national authorities to initiate certain projects.
Some experts are reserved as to the provisions of the Law, noting that they can lead to a conclu-sion that the private capital can hardly wait to pour cash into the public sector, and that the Law is based on the assumption that the state will re-tain a majority of stock and controlling stake in public utilities, and the private investors will pro-vide money for their development. Such and simi-lar opinions resulted from unsuccessful past pro-ject, due to which the PPPs are not regarded fa-vourably in the Serbian public. Regardless of the possible negative connotations of the PPP models, Serbia is in no position to decline any develop-ment potential. At least, as international practice shows it, PPPs have a potential for successful construction of infrastructure and efficient man-agement of public facilities. The primary interest of the users of public services is to have them low-cost and high quality; the interest and obliga-tion of the public sector is to provide this, of course, along with other essential condition, and the private sector invests its capital in order to enlarge it, but adhering to its commitment to so-cial responsibility. Despite their divergence at first sight, all of these interests can be met with a well set up model of PPP (Vukadin, 2013, p. 115).
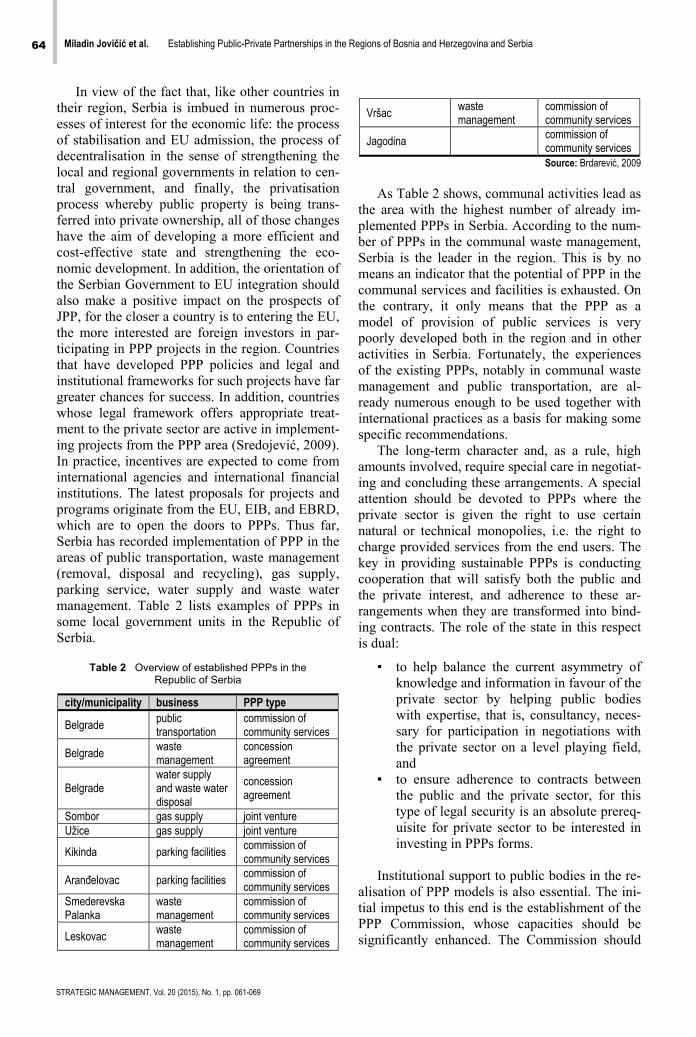
64 Miladin Jovičić et al. Establishing Public-Private Partnerships in the Regions of Bosnia and Herzegovina and Serbia
STRATEGIC MANAGEMENT, Vol. 20 (2015), No. 1, pp. 061-069
In view of the fact that, like other countries in their region, Serbia is imbued in numerous proc-esses of interest for the economic life: the process of stabilisation and EU admission, the process of decentralisation in the sense of strengthening the local and regional governments in relation to cen-tral government, and finally, the privatisation process whereby public property is being trans-ferred into private ownership, all of those changes have the aim of developing a more efficient and cost-effective state and strengthening the eco-nomic development. In addition, the orientation of the Serbian Government to EU integration should also make a positive impact on the prospects of JPP, for the closer a country is to entering the EU, the more interested are foreign investors in par-ticipating in PPP projects in the region. Countries that have developed PPP policies and legal and institutional frameworks for such projects have far greater chances for success. In addition, countries whose legal framework offers appropriate treat-ment to the private sector are active in implement-ing projects from the PPP area (Sredojević, 2009). In practice, incentives are expected to come from international agencies and international financial institutions. The latest proposals for projects and programs originate from the EU, EIB, and EBRD, which are to open the doors to PPPs. Thus far, Serbia has recorded implementation of PPP in the areas of public transportation, waste management (removal, disposal and recycling), gas supply, parking service, water supply and waste water management. Table 2 lists examples of PPPs in some local government units in the Republic of Serbia.
Table 2 Overview of established PPPs in the
Republic of Serbia
city/municipality business PPP type
Belgrade public transportation
commission of community services
Belgrade waste management
concession agreement
Belgrade water supply and waste water disposal
concession agreement
Sombor gas supply joint venture Užice gas supply joint venture
Kikinda parking facilities commission of community services
Aranđelovac parking facilities commission of community services
Smederevska Palanka
waste management
commission of community services
Leskovac waste management
commission of community services
Vršac waste management
commission of community services
Jagodina commission of community services Source: Brdarević, 2009
As Table 2 shows, communal activities lead as
the area with the highest number of already im-plemented PPPs in Serbia. According to the num-ber of PPPs in the communal waste management, Serbia is the leader in the region. This is by no means an indicator that the potential of PPP in the communal services and facilities is exhausted. On the contrary, it only means that the PPP as a model of provision of public services is very poorly developed both in the region and in other activities in Serbia. Fortunately, the experiences of the existing PPPs, notably in communal waste management and public transportation, are al-ready numerous enough to be used together with international practices as a basis for making some specific recommendations.
The long-term character and, as a rule, high amounts involved, require special care in negotiat-ing and concluding these arrangements. A special attention should be devoted to PPPs where the private sector is given the right to use certain natural or technical monopolies, i.e. the right to charge provided services from the end users. The key in providing sustainable PPPs is conducting cooperation that will satisfy both the public and the private interest, and adherence to these ar-rangements when they are transformed into bind-ing contracts. The role of the state in this respect is dual:
▪ to help balance the current asymmetry of knowledge and information in favour of the private sector by helping public bodies with expertise, that is, consultancy, neces-sary for participation in negotiations with the private sector on a level playing field, and
▪ to ensure adherence to contracts between the public and the private sector, for this type of legal security is an absolute prereq-uisite for private sector to be interested in investing in PPPs forms.
Institutional support to public bodies in the re-
alisation of PPP models is also essential. The ini-tial impetus to this end is the establishment of the PPP Commission, whose capacities should be significantly enhanced. The Commission should
Miladin Jovičić et al. Establishing Public-Private Partnerships in the Regions of Bosnia and Herzegovina and Serbia 65
STRATEGIC MANAGEMENT, Vol. 20 (2015), No. 1, pp. 061-069
act merely as a regulatory and administrative body in PPP procedures, but must highlight its counsel-ling role, and position itself as an active promoter of the PPP concept. Strengthening the capacity of the PPP commission to provide counselling sup-port to public bodies, insisting on transparency of contracting and implementation of PPPs are im-portant factors, which should prevent the PPP concept from being discredited by inappropriately established partnerships, detrimental to the public interest.
Actually, the experience of the neighbouring countries has shown that the exceptionally com-plex character of the matters regulated by these laws require a very high level of expert support to public partners, which must be provided by the regulatory bodies, but also financial and other counsellors, lawyers and expert teams to be in-volved in project operationalisation. It is also es-sential for countries that are only at the beginning of PPP development, such as Serbia, to initially select projects not characterised by high complex-ity level in terms of technical feasibility, and in-teresting for the market in terms of duration and earnable income. Setting overambitious project goals, without previously acquired experience in their realisation, may result in the collapse of the whole project concept and, consequently, losses exceeding benefits, both for the private partner and the public sector.
3. Preconditions for the implementation of PPP models in Bosnia and Herzegovina The turbulent trends on the financial market have made a strong impact on economies worldwide. The new wave of crisis is threatening to shake even more the economies of smaller and underde-veloped regions, including Bosnia and Herzego-vina. In such conditions, the economically weak Bosnia and Herzegovina is exposed to all the det-rimental impacts of the financial and economic crisis in Europe. In view of the negative connota-tion of macroeconomic indicators in previous years, the economic policy of Bosnia and Herze-govina for the forthcoming period included un-popular restrictive measures aimed at positive economic growth, job preservation, fiscal stabil-ity, social sustainability and general improvement of the business setting aimed at increasing the competitiveness of the national economy.
Bearing in mind the instability of the global economy, Bosnia and Herzegovina is planning to
strengthen investment activities in the future, so as to influence the positive economic trends. Rec-ommendations by credible international financial institutions include creating investment ambience that should result in increased material volume of production in Bosnia and Herzegovina, regional cooperation and faster European integrations, which will secure a long term improvement of the quality of life in Bosnia and Herzegovina and im-prove the population’s living standards. One of the ways to enhance investment and development activities is common cooperation of the public and the private sector through PPP projects. Exploit-ing the comparative advantages of Bosnia and Herzegovina, together with financial assets of private partners, will enable the stabilization of the region, which will impact the positive eco-nomic trends and higher economic growth rates.
As a country in transition, Bosnia and Herze-govina is faced with the burdensome war legacy in the post-war period, burdening the processes of transition and economic development. It consists of two entities (the Federation of Bosnia and Her-zegovina and the Republic of Srpska), and the District of Brčko, a federal administrative unit which constitutes a part of both entities. As a small economy, it cannot do much to become a prosperous country overnight, although integra-tion into the European and global economy im-poses the directions of urgent investment so as to reach the international quality standards. Also, one of the conditions for approaching European standards is building infrastructure in all segments of social and public institutions, enhancement of public services and reaching the standards of the EU. This will lay the foundations for necessary economic, political and social reforms that must be conducted in the integration process.
Developed and efficient infrastructure is es-sential for securing efficient economic function-ing, as it reduces the distances between the re-gions, resulting in integration of national markets and low-cost linkage with markets in other coun-tries and regions. Through the PPP model, the devised common cooperation of private and pub-lic sector will facilitate the realization of these development priorities, strengthening its own economy and thus entry into the EU (The Devel-opment Strategy of Bosnia and Herzegovina, 2009).
In terms of regulation and management of PPPs, the administrative setup of Bosnia and Her-zegovina looks extremely complex. At least par-tially, this problem results from the constitutional
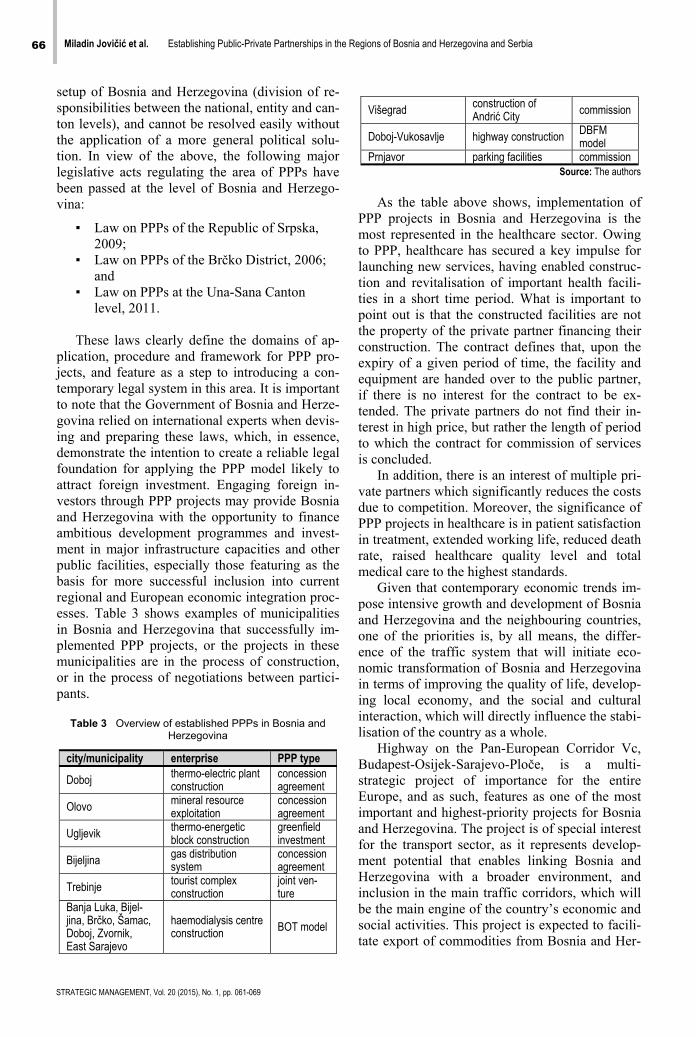
66 Miladin Jovičić et al. Establishing Public-Private Partnerships in the Regions of Bosnia and Herzegovina and Serbia
STRATEGIC MANAGEMENT, Vol. 20 (2015), No. 1, pp. 061-069
setup of Bosnia and Herzegovina (division of re-sponsibilities between the national, entity and can-ton levels), and cannot be resolved easily without the application of a more general political solu-tion. In view of the above, the following major legislative acts regulating the area of PPPs have been passed at the level of Bosnia and Herzego-vina:
▪ Law on PPPs of the Republic of Srpska, 2009;
▪ Law on PPPs of the Brčko District, 2006; and
▪ Law on PPPs at the Una-Sana Canton level, 2011.
These laws clearly define the domains of ap-
plication, procedure and framework for PPP pro-jects, and feature as a step to introducing a con-temporary legal system in this area. It is important to note that the Government of Bosnia and Herze-govina relied on international experts when devis-ing and preparing these laws, which, in essence, demonstrate the intention to create a reliable legal foundation for applying the PPP model likely to attract foreign investment. Engaging foreign in-vestors through PPP projects may provide Bosnia and Herzegovina with the opportunity to finance ambitious development programmes and invest-ment in major infrastructure capacities and other public facilities, especially those featuring as the basis for more successful inclusion into current regional and European economic integration proc-esses. Table 3 shows examples of municipalities in Bosnia and Herzegovina that successfully im-plemented PPP projects, or the projects in these municipalities are in the process of construction, or in the process of negotiations between partici-pants.
Table 3 Overview of established PPPs in Bosnia and
Herzegovina
city/municipality enterprise PPP type
Doboj thermo-electric plant construction
concession agreement
Olovo mineral resource exploitation
concession agreement
Ugljevik thermo-energetic block construction
greenfield investment
Bijeljina gas distribution system
concession agreement
Trebinje tourist complex construction
joint ven-ture
Banja Luka, Bijel-jina, Brčko, Šamac, Doboj, Zvornik, East Sarajevo
haemodialysis centre construction BOT model
Višegrad construction of Andrić City commission
Doboj-Vukosavlje highway construction DBFM model
Prnjavor parking facilities commission Source: The authors
As the table above shows, implementation of
PPP projects in Bosnia and Herzegovina is the most represented in the healthcare sector. Owing to PPP, healthcare has secured a key impulse for launching new services, having enabled construc-tion and revitalisation of important health facili-ties in a short time period. What is important to point out is that the constructed facilities are not the property of the private partner financing their construction. The contract defines that, upon the expiry of a given period of time, the facility and equipment are handed over to the public partner, if there is no interest for the contract to be ex-tended. The private partners do not find their in-terest in high price, but rather the length of period to which the contract for commission of services is concluded.
In addition, there is an interest of multiple pri-vate partners which significantly reduces the costs due to competition. Moreover, the significance of PPP projects in healthcare is in patient satisfaction in treatment, extended working life, reduced death rate, raised healthcare quality level and total medical care to the highest standards.
Given that contemporary economic trends im-pose intensive growth and development of Bosnia and Herzegovina and the neighbouring countries, one of the priorities is, by all means, the differ-ence of the traffic system that will initiate eco-nomic transformation of Bosnia and Herzegovina in terms of improving the quality of life, develop-ing local economy, and the social and cultural interaction, which will directly influence the stabi-lisation of the country as a whole.
Highway on the Pan-European Corridor Vc, Budapest-Osijek-Sarajevo-Ploče, is a multi-strategic project of importance for the entire Europe, and as such, features as one of the most important and highest-priority projects for Bosnia and Herzegovina. The project is of special interest for the transport sector, as it represents develop-ment potential that enables linking Bosnia and Herzegovina with a broader environment, and inclusion in the main traffic corridors, which will be the main engine of the country’s economic and social activities. This project is expected to facili-tate export of commodities from Bosnia and Her-
Miladin Jovičić et al. Establishing Public-Private Partnerships in the Regions of Bosnia and Herzegovina and Serbia 67
STRATEGIC MANAGEMENT, Vol. 20 (2015), No. 1, pp. 061-069
zegovina to other parts of the world, influence the initiation of projects and possibilities for invest-ment in regional economy, especially in the areas of tourism, agriculture and industry.
Almost all the stretches currently under con-struction are financed by EBRD and EIB loans. The complete design of project documentation for transport infrastructure is financed by the Euro-pean Commission, which once again confirms the extreme importance of international financial in-stitutions for financing and development of infra-structural projects. As the Corridor Vc branches into several directions and connects the road net-works of several countries, it is more than obvious that the EU has sufficient reasons in the construc-tion of the highway and railway network on this Corridor, as this is the interest of not only Bosnia and Herzegovina but also the whole Europe.
The initiator of the construction of such a complex project by applying the PPP model is, primarily, the importance of the traffic system in the development of the entire economic system of every social community. The justifiability of intel-lectual and material investment will be confirmed by the integration of Bosnia and Herzegovina with the EU countries and improved links with neighbouring countries, which will increase the potential for its development. The economic as-pect of this project implies contribution to the development of economy of not only Bosnia and Herzegovina, but also entire European economy.
Conclusion The quality of a country’s economic development is highly dependent on capital investment pro-jects. It is a fact that economic growth and devel-opment are virtually impossible without modern and efficient infrastructure. Obtaining foreign funds as sources of financing investment projects is one of the most prominent problems faced by developing countries. Construction of such pro-jects used to be mainly the responsibility of the public sector, whereas the private sector was en-gaged to a negligible extent. PPPs are nowadays used for numerous capital investment projects such as roads, railroads, ports, power plants, water supply and waste water management, as well as numerous other projects with reliable cash flow. Developing countries are seeking alternative ways of financing capital investments, which has con-tributed to the current popularity of PPPs.
Projects implemented through PPPs have en-abled the public sector to transfer a part of the investment cost to the private sector. Applied
properly, this approach results in lower total monetary expenditure and better and cheaper ser-vices for consumers. Also, using innovative ca-pacities of the private sector, the public sector sees the creation of preconditions for transparent and efficient implementation of the economic de-velopment strategy. At the same time, it also pro-vides a better value for money in the delivery of public services, and the possibility to innovate without employing budget assets, and all of that with optimum distribution of responsibility.
For private investors, PPP projects open the possibility of geographic expansion and diversifi-cation of investment on new markets, but also secure contribution to the project which is attrac-tive from the commercial point of view. At the same time, along with the expansion of the mar-ket, it also enables the return on invested re-sources with increased income and profitability, improvement of own creditworthiness, and, even-tually, raising the efficiency of business opera-tions. At the same time, the private sector pro-vides market-related and financial discipline, modern management methods and new sources of financing of complex projects necessary for the long-term economic development of the country. The crisis of public finance throughout Europe may represent a chance for PPPs because the fo-cus of countries nowadays is on cost cutting, and this is what new, innovative PPP models can con-tribute to, through increased mobilisation of pri-vate capital.
Although the concept of public-private part-nership was included in the academic and profes-sional vocabulary relatively recently, legislation in the Republic of Serbia has been regulating the establishment of different forms of long-term co-operation of public and private sector for about ten years. Bearing in mind the global trends and local needs, the Law on PPPs and concessions is a welcome move in Serbia, which will open new possibilities for investors and financiers, stimulate the development of infrastructure and enable the realisation of PPP projects in Serbia the way it is done worldwide, the manner of financing of this form of partnership is the solution to problems faced by local governments and one of the ways of overcoming the crisis in financing and invest-ment, and providing the impetus to the national industry. It must be pointed out that now, when the institutional framework has already been formed, its strengthening and building must be continued, as well as capacity raising. The experi-ences of the most advanced markets point that
68 Miladin Jovičić et al. Establishing Public-Private Partnerships in the Regions of Bosnia and Herzegovina and Serbia
STRATEGIC MANAGEMENT, Vol. 20 (2015), No. 1, pp. 061-069
establishing institutional infrastructure, i.e. organ-isational units specialising in PPPs at all public sector levels is a good way for enhancing the PPP practices and optimum utilisation of this model.
A large number of potential PPP projects al-ready exist in Serbia, but their implementation has been delayed due to unfavourable regulatory envi-ronment. With laws that are extremely favourable to finance providers, there is a rational basis to expect that PPP projects will develop, first of all, in the sectors of public transportation, construc-tion of traffic, sports and communal infrastruc-ture, energy supply and mining, and some move-ments in these directions are already at sight.
The impact of several years of unfavourable economic and political circumstances, and the unstable conditions of operation caused by the global economic crisis and many other negative factors, have resulted in decline of industrial pro-duction, high unemployment rates and foreign trades, as some of the main obstacles to growth and development in Bosnia and Herzegovina.
Analysing the essential macroeconomic indi-cators in comparison with economies of the coun-tries in the region, the economic reality of Bosnia and Herzegovina is still in an inferior position. Despite obvious improvement, the economic re-covery is progressing slowly and is influenced by the many years of unfavourable economic and political tendencies, partly transferred from the previous years, plus the problems and difficulties characterising the reconstruction and development of most surrounding countries that have launched the reform process. For this reason, Bosnia and Herzegovina’s orientation for investment in public sector, primarily in health care, road infrastruc-ture, energy sector and agriculture, where Bosnia and Herzegovina has significant natural resources and comparative advantages, can provide the ex-ploitation of its own potential for the purpose of stabilisation and positive trends that will influence the creation of conditions for higher economic growth rates.
According to OECD ratings Bosnia and Her-zegovina ranges among countries that have, in comparison with previous period, enhanced their business climate with considerable reforms, adop-tion of strategic documents, laws and regulations, thus significantly improving the business envi-ronment and creating better conditions for foreign and domestic investment.
Given that Bosnia and Herzegovina is a com-plex community consisting of entities: the Repub-lic of Srpska, the Federation of Bosnia and Herze-
govina, and the District of Brčko, although the legal regulations regarding the use of PPP models have not been adopted at the level of Bosnia and Herzegovina, this does not present an obstacle for its application, as the responsibilities are distrib-uted between various levels of government. The existing Laws on PPP at the entity and canton level can be regarded as significant progress to-wards the introduction of a modern legal system and creating a solid legal basis for this type of agreements, which may attract foreign investors, as the countries with developed PPP policy and institutional frameworks for such projects have far higher chances of success. In addition, countries whose legal framework provides appropriate treatment to the private sector are active in the implementation of projects in the area of PPP. Moreover, it has been confirmed that well pre-pared PPP arrangements increase efficiency and effectiveness of economic processes, which is one of the reasons for establishing a unified Law on PPP at the level of Bosnia and Herzegovina, which will contribute to the harmonisation and political stability in defining priorities and pro-grammes for implementing projects in the PPP form. Unification of the legal framework in the PPP area and efficient coordination of all stake-holders in the system will serve as a basis for de-veloping a more functional market which will enable the implementation of all activities ain a diligent and transparent manner. Such cooperation may secure uniform and coherent practice of managing PPP projects throughout the country. In addition, formation of separate PPP units could be a positive move in disseminating the expertise and experience of successful PPP projects from the whole world, based on a network of research or-ganisations and partners throughout Bosnia and Herzegovina, thus enabling economic, technical, legal and technical analysis of various models and variants for realising potential projects. Most of these processes would be conducted with the aim of creating an attractive business environment for potential investors, with the aim of progress and prosperity of Bosnia and Herzegovina. Such busi-ness units would enable realistic presentations of real benefits of such a type of partnership, which can contribute to the modernisation of economy and state, aimed at enhancing the economic area and creating better living standards of all the citi-zens of Bosnia and Herzegovina.
Bearing in mind the global trends and local needs, it can be concluded that the PPP model opens new opportunities of Serbia and Bosnia and
Miladin Jovičić et al. Establishing Public-Private Partnerships in the Regions of Bosnia and Herzegovina and Serbia 69
STRATEGIC MANAGEMENT, Vol. 20 (2015), No. 1, pp. 061-069
Herzegovina, which can improve their respective economic policies through financing new public projects using the benefits of this type of integra-tion. As a tool of long-term structural develop-ment, PPPs will strengthen the possibility of in-novation, and the joint efforts of stakeholders and their interdependences will enable a variety of potential responses to the existing problems through replication of successful experiences, which will also influence the stability of economic and social developments of regions such as Serbia and Bosnia and Herzegovina. SM
References Bhattacharya, S., & Kundu, T. (2014). Resistance,
redistribution and investor-friendliness. Journal of Development Economics , 109, 124–142.
Brdarević, L. (2009). Dopunski načini finansiranja razvoja lokalnih samouprava, Vodič za planiranje lokalnog razvoja. Novi Sad: Centre for Strategic Economic Research - VOJVODINA CESS.
Giuliani, E., & Macchi, C. (2014). Multinational corporations’ economic and human rights impacts on developing countries: a review and research agenda. Cambridge Journal of Economics , 38 (2), 479–517.
Jovičić, M., & Stavrić, B. (2011). Osnovi menadžmenta. Bijeljina: Fakultet poslovne ekonomije.
Juričić, D. (2008). Ekonomija javno-privatnog partnerstva. Ekonomski pregled , 59 (7-8), 452-468.
Sredojević, S. (2009). Javno-privatno partnerstvo u finansiranju infrastrukture u zemljama Balkana. Un-published doctoral dissertation, Ekonomski fakultet, Be-ograd.
Stiglitz, E. J. (2004). Ekonomija javnog sektora. Beograd: Ekonomski fakultet.
Vukadin, M. (2013). Javno-privatno partnerstvo: razvojna šansa BiH. Unpublished master’s thesis. Fakultet poslovne ekonomije, Bijeljina.
Yescombe, E. R. (2010). Javno-privatno partnerstvo: Načela politike i financiranja. Zagreb: Mate d.o.o.
Correspondence
Miladin Jovičić
Faculty of Business Economics Semberskih ratara bb, 76300, Bijeljina, Republic of Srpska, Bosnia and Herzegovina
E-mail: [email protected]

54 Jovo T. Tauzović Preliminaries of Modern Systems Management Concepts
STRATEGIC MANAGEMENT, Vol. 19 (2014), No. 1, pp. 042-053

Manuscript Requirements A paper must be written in text processor Microsoft Word. Paper size: A4. Margins: 3.0 cm on top and bot-tom, and 2.5 cm on left and right sides. As a guide, articles should be no more than 5.000 words in length. In case the paper exceeds the normal length, the Editors' consent for its publication is needed. Articles submitted for publication in Journal should include the research aim and tasks, with detailed methodology, presenting literature overview on the research object, substantiation of the achieved results and findings, conclusions and a list of references. Manuscripts should be arranged in the following order of presentation. First page: Title (no more that 10 words), subtitle (if any), autobiographical note (the author's full name, academic affiliation, telephone, fax and e-mail address and full international contact). Respective affiliations and addresses of co-authors should be clearly indicated. Please also include approximately 50 words of bio-graphical information on each author of the submitted paper. Second page: A self-contained abstract/summary/resume of up to 150 words, describing the research objective and
its conclusions Up to ten keywords, which encapsulate the principal subjects covered by the article; and A self-contained summary of up to 200 words, describing the article and its conclusions.
Subsequent pages: Main body of the text with headings, footnotes, a list of references, appendices, tables and illustrations. The paragraph parameters are: Font: Times New Roman, 10 pt, regular Spacing: Before: 0, After: 0 Line Spacing: Single Alignment: Justified Indentation: Left: 0, Right: 0, Special: 0. Style: Normal (not Title, Heading1, Heading2,...,Body Text, etc!) Leave an empty line between paragraphs. Headings: Headings must be short, clearly defined and numbered, except for Introduction and Conclu-sions. Apply at most three levels of headings. Please, leave two empty lines before headings and one empty line after. Font: Times New Roman, bold, 16 pt, centered. Section headings should be in bold with Leading Capitals on Main Words, Times New Roman, 14pt, bold, centered. Sub-section headings should be in italics, with Leading Capitals on Main Words, Times New Roman, 12 pt, bold. All tables, graphs and diagrams are expected to back your research findings. They should be clearly referred to and numbered consecutively in Arabic numerals. They should be placed in the text at the appropriate paragraph (just after its reference). Tables should be centered. All tables must have captions. The title of your table should follow the table number. Tables should not be wider than the margins of the paper. Skip two lines before and after each table. Figures should be centered. All figures must have captions. The title of figures should appear immediately below the figure. The title of the figure should follow the figure number. Figures should not be wider than the margins of the paper. Skip two lines before and after each figure. Figures will not be redrawn by the publisher. Figures should be high-quality grayscale graphics (please, do not use colors): vector drawings (with text converted to curves) or 300 dpi bitmaps. Please do not supply any graphics copied from a web-site, as the resolution will be too low. In all figures taken or adapted from other sources, a brief note to that effect is obligatory, below the figure. One sentence at least referring to the illustration is obligatory. Mathematical expressions should be numbered on the right side, while all variables and parameters must be defined.
Copyright Articles submitted to the Journal should be authentic and original contributions and should have never been published before in full text, nor be under consideration for any other publication at the same time. Authors submitting articles for publication warrant that the work is not an infringement of any existing copyright and will indemnify the publisher against any breach of such warranty. For use of dissemination and to en-sure proper policing of use, papers and contributions become the legal copyright of the publisher unless otherwise agreed.
Proof Authors are responsible for ensuring that all manuscripts (whether original or revised) are accurately typed before final submission. One set of proof will be sent to authors, if requested, before the final publication, which must be returned promptly. Referencing Guide The references should specify the source (such as book, journal article or a web page) in sufficient de-tail to enable the readers to identify and consult it. The references are placed at the end of the work, with sources listed alphabetically (a) by authors’ surnames or (b) by the titles of the sources (if the au-thor is unknown). Multiple entries by the same author(s) must be sequenced chronologically, starting from the earliest, e.g.:
Ljubojević, T.K. (1998). Ljubojević, T.K. (2000a). Ljubojević, T.K. (2000b). Ljubojević, T.K., & Dimitrijević, N.N. (1994).
Here is a list of the most common reference types: A. PERIODICALS Authors must be listed by their last names, followed by initials. Publication year must be written in pa-rentheses, followed by a full stop. Title of the article must be in sentences case: only the first word and proper nouns in the title are capitalized. The periodical title must be in title case, followed by the vol-ume number, which is also italicized:
Author, A. A., Author, B. B., & Author, C. C. (Year). Title of article. Title of Periodical, volume number(issue number), pages.
Journal article, one author, paginated by issue Journals paginated by issue begin with page 1 in every issue, so that the issue number is indicated in parentheses after the volume. The parentheses and issue numbers are not italicized, e.g.
Tanasijević, V. (2007). A PHP project test-driven end to end. Management Information Systems, 5 (1), 26-35.
Journal article, one author, paginated by volume Journals paginated by volume begin with page 1 in issue 1, and continue page numbering in issue 2 where issue 1 ended, e.g.
Perić, O. (2006). Bridging the gap: Complex adaptive knowledge management. Strategic Management, 14, 654-668.
Journal article, two authors, paginated by issue
Strakić, F., & Mirković, D. (2006). The role of the user in the software development life cycle. Management Information Systems, 4 (2), 60-72.
Journal article, two authors, paginated by volume
Ljubojević, K., & Dimitrijević, M. (2007). Choosing your CRM strategy. Strategic Management, 15, 333-349.
Journal article, three to six authors, paginated by issue
Jovanov, N., Boškov, T., & Strakić, F. (2007). Data warehouse architecture. Management Information Systems, 5 (2), 41-49.
Journal article, three to six authors, paginated by volume
Boškov, T., Ljubojević, K., & Tanasijević, V. (2005). A new approach to CRM. Strategic Management, 13, 300-310.
Journal article, more than six authors, paginated by issue
Ljubojević, K., Dimitrijević, M., Mirković, D., Tanasijević, V., Perić, O., Jovanov, N., et al. (2005). Putting the user at the center of software testing activity. Management Information Systems, 3 (1), 99-106.
Journal article, more than six authors, paginated by volume
Strakić, F., Mirković, D., Boškov, T., Ljubojević, K., Tanasijević, V., Dimitrijević, M., et al. (2003). Metadata in data warehouse. Strategic Management, 11, 122-132.
Magazine article
Strakić, F. (2005, October 15). Remembering users with cookies. IT Review, 130, 20-21. Newsletter article with author
Dimitrijević, M. (2009, September). MySql server, writing library files. Computing News, 57, 10-12. Newsletter article without author
VBScript with active server pages. (2009, September). Computing News,57, 21-22. B. BOOKS, BROCHURES, BOOK CHAPTERS, ENCYCLOPEDIA ENTRIES, AND BOOK REVIEWS Basic format for books
Author, A. A. (Year of publication). Title of work: Capital letter also for subtitle. Location: Publisher. Note: “Location" always refers to the town/city, but you should also include the state/country if the town/city could be mistaken for one in another country. Book, one author
Ljubojević, K. (2005). Prototyping the interface design. Subotica: Faculty of Economics.
Book, one author, new edition
Dimitrijević, M. (2007). Customer relationship management (6th ed.). Subotica: Faculty of Economics. Book, two authors
Ljubojević, K., Dimitrijević, M. (2007). The enterprise knowledge portal and its architecture. Subotica: Faculty of Economics.
Book, three to six authors
Ljubojević, K., Dimitrijević, M., Mirković, D., Tanasijević, V., & Perić, O. (2006). Importance of software testing. Subotica: Faculty of Economics.
Book, more than six authors
Mirković, D., Tanasijević, V., Perić, O., Jovanov, N., Boškov, T., Strakić, F., et al. (2007). Supply chain management. Subotica: Faculty of Economics.
Book, no author or editor
Web user interface (10th ed.). (2003). Subotica: Faculty of Economics. Group, corporate, or government author
Statistical office of the Republic of Serbia. (1978). Statistical abstract of the Republic of Serbia. Bel-grade: Ministry of community and social services.
Edited book
Dimitrijević, M., & Tanasijević, V. (Eds.). (2004). Data warehouse architecture. Subotica: Faculty of Economics.
Chapter in an edited book
Boškov, T., & Strakić. F. (2008). Bridging the gap: Complex adaptive knowledge management. In T. Boškov & V. Tanasijević (Eds.), The enterprise knowledge portal and its architecture (pp. 55-89). Subotica: Faculty of Economics.
Encyclopedia entry
Mirković, D. (2006). History and the world of mathematicians. In The new mathematics encyclopedia (Vol. 56, pp. 23-45). Subotica: Faculty of Economics.
C. UNPUBLISHED WORKS Paper presented at a meeting or a conference
Ljubojević, K., Tanasijević, V., Dimitrijević, M. (2003). Designing a web form without tables. Paper presented at the annual meeting of the Serbian computer alliance, Beograd.
Paper or manuscript
Boškov, T., Strakić, F., Ljubojević, K., Dimitrijević, M., & Perić, O. (2007. May). First steps in vis-ual basic for applications. Unpublished paper, Faculty of Economics Subotica, Subotica.
Doctoral dissertation
Strakić, F. (2000). Managing network services: Managing DNS servers. Unpublished doctoral disserta-tion, Faculty of Economics Subotica, Subotica.
Master’s thesis
Dimitrijević, M. (2003). Structural modeling: Class and object diagrams. Unpublished master’s thesis, Faculty of Economics Subotica, Subotica.
D. ELECTRONIC MEDIA The same guidelines apply for online articles as for printed articles. All the information that the online host makes available must be listed, including an issue number in parentheses:
Author, A. A., & Author, B. B. (Publication date). Title of article. Title of Online Periodical, volume number(issue number if available). Retrieved from http://www.anyaddress.com/full/url/
Article in an internet-only journal
Tanasijević, V. (2003, March). Putting the user at the center of software testing activity. Strategic Management, 8 (4). Retrieved October 7, 2004, from www.ef.uns.ac.rs/sm2003
Document from an organization
Faculty of Economics. (2008, March 5). A new approach to CRM. Retrieved July 25, 2008, from http://www.ef.uns.ac.rs/papers/acrm.html
Article from an online periodical with DOI assigned
Jovanov, N., & Boškov, T. A PHP project test-driven end to end. Management Information Systems, 2 (2), 45-54. doi: 10.1108/06070565717821898.
Article from an online periodical without DOI assigned
Online journal articles without a DOI require a URL.
Author, A. A., & Author, B. B. (Publication date). Title of article. Title of Journal, volume number. Retrieved from http://www.anyaddress.com/full/url/
Jovanov, N., & Boškov, T. A PHP project test-driven end to end. Management Information Systems,
2 (2), 45-54. Retrieved from http://www.ef.uns.ac.rs/mis/TestDriven.html. REFERENCE QUOTATIONS IN THE TEXT Quotations If a work is directly quoted from, then the author, year of publication and the page reference (preceded by “p.”) must be included. The quotation is introduced with an introductory phrase including the au-thor’s last name followed by publication date in parentheses.
According to Mirković (2001), “The use of data warehouses may be limited, especially if they contain confidential data” (p. 201).
Mirković (2001), found that “the use of data warehouses may be limited” (p. 201). What unex-pected impact does this have on the range of availability?
If the author is not named in the introductory phrase, the author's last name, publication year, and the page number in parentheses must be placed at the end of the quotation, e.g.
He stated, “The use of data warehouses may be limited,” but he did not fully explain the possi-ble impact (Mirković, 2001, p. 201).
Summary or paraphrase
According to Mirković (1991), limitations on the use of databases can be external and software-based, or temporary and even discretion-based. (p.201)
Limitations on the use of databases can be external and software-based, or temporary and even discretion-based (Mirković, 1991, p. 201).
One author
Boškov (2005) compared the access range…
In an early study of access range (Boškov, 2005), it was found... When there are two authors, both names are always cited:
Another study (Mirković & Boškov, 2006) concluded that… If there are three to five authors, all authors must be cited the first time. For subsequent refer-ences, the first author’s name will cited, followed by “et al.”.
(Jovanov, Boškov, Perić, Boškov, & Strakić, 2004).
In subsequent citations, only the first author’s name is used, followed by “et al.” in the introductory phrase or in parentheses:
According to Jovanov et al. (2004), further occurences of the phenomenon tend to receive a much wider media coverage.
Further occurences of the phenomenon tend to receive a much wider media coverage (Jovanov et al., 2004).
In “et al.", “et” is not followed by a full stop. Six or more authors
The first author’s last name followed by "et al." is used in the introductory phrase or in parentheses:
Yossarian et al. (2004) argued that… … not relevant (Yossarian et al., 2001).
Unknown author
If the work does not have an author, the source is cited by its title in the introductory phrase, or the first 1-2 words are placed in the parentheses. Book and report titles must be italicized or underlined, while titles of articles and chapters are placed in quotation marks:
A similar survey was conducted on a number of organizations employing database managers ("Limiting database access", 2005).
If work (such as a newspaper editorial) has no author, the first few words of the title are cited, fol-lowed by the year:
(“The Objectives of Access Delegation,” 2007)
Note: In the rare cases when the word "Anonymous" is used for the author, it is treated as the au-thor's name (Anonymous, 2008). The name Anonymous must then be used as the author in the refer-ence list.
Organization as an Author
If the author is an organization or a government agency, the organization must be mentioned in the introductory phrase or in the parenthetical citation the first time the source is cited:
According to the Statistical Office of the Republic of Serbia (1978), …
Also, the full name of corporate authors must be listed in the first reference, with an abbreviation in brackets. The abbreviated name will then be used for subsequent references:
The overview is limited to towns with 10,000 inhabitants and up (Statistical Office of the Re-public of Serbia [SORS], 1978). The list does not include schools that were listed as closed down in the previous statistical over-view (SORS, 1978).
When citing more than one reference from the same author:
(Bezjak, 1999, 2002) When several used works by the same author were published in the same year, they must be cited adding a, b, c, and so on, to the publication date:
(Griffith, 2002a, 2002b, 2004) Two or more works in the same parentheses
When two or more works are cited parenthetically, they must be cited in the same order as they appear in the reference list, separated by a semicolon.
(Bezjak, 1999; Griffith, 2004) Two or more works by the same author in the same year
If two or more sources used in the submission were published by the same author in the same year, the entries in the reference list must be ordered using lower-case letters (a, b, c…) with the year. Lower-case letters will also be used with the year in the in-text citation as well:
Survey results published in Theissen (2004a) show that…
To credit an author for discovering a work, when you have not read the original:
Bergson’s research (as cited in Mirković & Boškov, 2006)… Here, Mirković & Boškov (2006) will appear in the reference list, while Bergson will not. When citing more than one author, the authors must be listed alphabetically:
(Britten, 2001; Sturlasson, 2002; Wasserwandt, 1997) When there is no publication date:
(Hessenberg, n.d.) Page numbers must always be given for quotations:
(Mirković & Boškov, 2006, p.12)
Mirković & Boškov (2006, p. 12) propose the approach by which “the initial viewpoint…
Referring to a specific part of a work: (Theissen, 2004a, chap. 3)
(Keaton, 1997, pp. 85-94)
Personal communications, including interviews, letters, memos, e-mails, and telephone conversations, are cited as below. (These are not included in the reference list.)
(K. Ljubojević, personal communication, May 5, 2008).
FOOTNOTES AND ENDNOTES A few footnotes may be necessary when elaborating on an issue raised in the text, adding something that is in indirect connection, or providing supplementary technical information. Footnotes and end-notes are numbered with superscript Arabic numerals at the end of the sentence, like this.1 Endnotes begin on a separate page, after the end of the text. However, Strategic Management journal does not recommend the use of footnotes or endnotes. COPYRIGHT AND USE AGREEMENT Articles submitted to the Journal should be authentic and original contributions and should have never been published before in full text, nor be under consideration for any other publication at the same time. Authors submitting articles for publication warrant that the work is not an infringement of any existing copyright and will indemnify the publisher against any breach of such warranty. For use of dissemination and to ensure proper policing of use, papers and contributions become the legal copy-right of the publisher unless otherwise agreed. All contributors are required to sign the Transfer of Copyright Agreement before the article may be published. The transfer of copyright encompasses the exclusive right to reproduce and circulate the article, including photographic reproductions, reprints or any other similar reproductions and transla-tion. If the copyright exists either for the entire article or any part of it, it is the contributor's responsi-bility to obtain permission to reproduce it from the copyright holder.

54 Jovo T. Tauzović Preliminaries of Modern Systems Management Concepts
STRATEGIC MANAGEMENT, Vol. 19 (2014), No. 1, pp. 042-053

54 Jovo T. Tauzović Preliminaries of Modern Systems Management Concepts
STRATEGIC MANAGEMENT, Vol. 19 (2014), No. 1, pp. 042-053
CIP - Каталогизација у публикацији Библиотека Матице српске, Нови Сад 005.21 STRATEGIC managament : international journal of strategic managament and decision support systems in strategic managament / editor-in-chief Jelica Trninić. - Vol. 14, no. 1 (2009) - . - Subotica: University of Novi Sad, Faculty of Economics, 2009-. - 30 cm Tromesečno. - Nastavak publikacije: Strategijski menadžment = ISSN 0354-8414 ISSN 1821-3448 COBISS.SR-ID 244849927 Rešenjem Ministarstva za informisanje Republike Srbije, časopis "Strategijski menadžment" upisan je u regis-tar javnog informisanja pod brojem 2213, od 7. avgusta 1996. Rešenjem Ministarstva za nauku i tehnologiju Republike Srbije br. 413-00-435/1/96-01 časopis je oslobođen opšteg poreza na promet proizvoda kao publi-kacija od posebnog interesa za nauku.