Strategic Environmental Assessment Environmental Report · Strategic Environmental Assessment...
85
Ex-ante Evaluation of the Cooperation Programme INTERREG VB North-West Europe 2014 - 2020 Strategic Environmental Assessment Environmental Report for GEIE GECOTTI INTERREG IVB „Les Arcuriales“, 6 th floor 45d, rue de Tournai F-59000 LILLE
-
Upload
dinhnguyet -
Category
Documents
-
view
235 -
download
0
Transcript of Strategic Environmental Assessment Environmental Report · Strategic Environmental Assessment...

Ex-ante Evaluation of the
Cooperation Programme INTERREG VB North-West Europe 2014 - 2020
Strategic Environmental Assessment
Environmental Report
for
GEIE GECOTTI
INTERREG IVB
„Les Arcuriales“, 6th floor
45d, rue de Tournai
F-59000 LILLE

Ex-ante Evaluation of the
Cooperation Programme INTERREG VB North-West Europe 2014 - 2020
Strategic Environmental Assessment
Environmental Report
Prepared by:
Dr. Dräger & Thielmann PartG Marburger Straße 7
D-60487 Frankfurt am Main Tel: 069 – 70792026
Mail: [email protected]
June 2014

TABLE OF CONTENTS
NON-TECHNICAL SUMMARY .................................................................................................................... I
1 INTRODUCTION .................................................................................................................................. 1
1.1 SEA obligation ............................................................................................................................. 1
1.2 The SEA process .......................................................................................................................... 1
1.3 Assessment frame ...................................................................................................................... 2
1.4 Methodology .............................................................................................................................. 3
2 STRUCTURE OF THE NWE-PROGRAMME ........................................................................................... 5
2.1 Intervention Logic ....................................................................................................................... 5
2.2 Relations to other relevant programmes and strategies ........................................................... 7
3 RELEVANT ENVIRONMENTAL OBJECTIVES AND INDICATORS ............................................................ 9
4 EXISTING ENVIRONMENTAL PROBLEMS AND TRENDS OF THE ENVIRONMENTAL DEVELOPMENT ................................................................................................................................. 18
5 ENVIRONMENTAL EFFECTS OF THE PROGRAMME .......................................................................... 39
5.1 Discussion of alternatives ......................................................................................................... 39
5.2 Assessment of the strategic approach - consideration of environmental objectives
in the development of the NWE-Programme .......................................................................... 40
5.3 Assessment of the individual Specific Objectives ..................................................................... 48
5.3.1 Priority 1: Innovation ........................................................................................................ 49
5.3.2 Priority 2: Low Carbon ...................................................................................................... 50
5.3.3 Priority 3: Resource and materials efficiency ................................................................... 54
5.3.4 Characteristics of potential effects ................................................................................... 55
5.4 Effects caused by the NWE-Programme on the individual environmental issues ................... 58
5.5 Cumulative und synergistic effects ........................................................................................... 64
5.6 Mitigation of potential negative environmental effects .......................................................... 65
5.7 Overall environmental effect of the NWE-Programme ............................................................ 66
6 RECOMMENDATIONS ....................................................................................................................... 68
7 NOTES ON PROBLEMS IN THE COMPILATION OF REQUIRED DATA AND INFORMATION................ 69
8 PROPOSED MONITORING MEASURES .............................................................................................. 69
9 REFERENCES ..................................................................................................................................... 71

List of tables
Table 1: Intervention system of the NWE-Programme .................................................................... 6
Table 2: Relevant environmental issues, EU environmental objectives and targets, and
related indicators .............................................................................................................. 11
Table 3: Indicators of the EEA concerning estimated effects of climate change in Europe ........... 34
Table 4: Distribution of ERDF-funds per Specific Objectives .......................................................... 43
Table 5: Compliance of the NWE Programme with the general EU environmental policy -
relations to priorities stated in key documents ................................................................ 46
Table 6: Summary of potential effects - Specific Objective 1 ......................................................... 49
Table 7: Summary of potential effects - Specific Objective 2 ......................................................... 50
Table 8: Summary of potential effects - Specific Objective 3 ......................................................... 52
Table 9: Summary of potential effects - Specific Objective 4 ......................................................... 53
Table 10: Summary of potential effects - Specific Objective 5 ......................................................... 54
Table 11: Overview on general reversibility and principle possibilities for tiering of
potential effects ................................................................................................................ 57
List of graphics
Graphic 1: Area of INTERREG North-West Europe ............................................................................... 3
Graphic 2: Categories and associated symbols for the evaluation of the indicators ......................... 18
Graphic 3: Evaluation of changes in the public health theme (EU-27, from 2000) ............................ 19
Graphic 4: Indicative map of combined environmental challenges related to land use ................... 21
Graphic 5: Farmland bird index by EU Member States ...................................................................... 23
Graphic 6: Water Exploitation Index (WEI) for the NWE Partner States ........................................... 24
Graphic 7. Estimated years of life lost (YOLL) in reference year 2005 attributable to
long-term PM2.5 exposure ................................................................................................. 26
Graphic 8: Annual changes in concentrations of PM10, O3 and NO2 in the period 2001–2010 .......... 26
Graphic 9: Atmospheric emissions, EU-27 ......................................................................................... 27
Graphic 10: Evaluation of changes in the climate change and energy theme (EU-27, from 2000) ..... 28
Graphic 11: Greenhouse gas emissions by NWE Countries: Absolute change 2010-2011 .................. 29
Graphic 12: Share of renewable energy in final energy consumption (FEC) (%) ................................. 31
Graphic 13: Share of renewable energy consumed in transport ......................................................... 33
Graphic 14: Evaluation of changes in the sustainable transport theme (EU-27, from 2000) .............. 33
Graphic 15: Aggregate potential impact of climate change, 2009 ....................................................... 36
Graphic 16: The Ecological footprint of NWE Partner States ............................................................... 37
Graphic 17: Evaluation of changes in the sustainable consumption and production theme
(EU-27, from 2000) ........................................................................................................... 38
Graphic 18: Contribution of the Priorities to ‘Green Economy’ as an overarching target of the
European Union ................................................................................................................ 42

List of abbreviations:
CBD Convention on Biological Diversity
CLIM EEA Climate Indicators
CO2 Carbon dioxide
COSME Programme for competitiveness of Enterprises and SMEs 2014-2020
CPR Common Provisions Regulation
CSI Core Set of Indicators (of EEA)
EC European Communities
EEA European Environment Agency
ENER EEA Energy Indicators
ERDF European Regional Development Fund
ESI European Structural and Investment Funds (ESI Funds)
ESPON European Spatial Observation Network
ETC European Territorial Cooperation
ETC/BD European Territorial Cooperation Biodiversity
EU European Union
GDP Gross Domestic Product
GHG Greenhouse Gas
G&J Growth and Jobs
ICUN International Union for Conservation of Nature
IP Investment Priority
IPTS Institute for Prospective Technological Studies
MS Member States
NECD National Emission Ceiling Directive
NH3 Ammonia
NOx Nitrogen Oxides
R&I Research and Innovation
PM Particulate Matter
SCI Site of Community Importance
SEA Strategic Environmental Assessment
SEBI Streamlining European Biodiversity Indicators
SME Small and Medium-Sized Enterprise
SO Specific Objective
SOER “State and Outlook of the European Environment” report
ToA Type of Actions
TO Thematic Objective

| I
NON-TECHNICAL SUMMARY
INTRODUCTION
Strategic Environmental Assessment (hereinafter: SEA) is a key policy instrument to mainstream en-
vironmental considerations into plans, programmes and strategies. The main objective of SEA is to
ensure that the significant environmental implications of decisions are taken into account before the
decisions are made.
The SEA comprises the development of the environmental report on the likely significant effects on
the environment as well as consultations of relevant authorities and the public. The findings and
recommendations of the environmental report and of the consultations will be considered in the
finalisation and approval of the programme.
According to the Directive 2001/42/EC (hereinafter: SEA-Directive) an assessment of the effects on
the environment of the Cooperation Programme INTERREG VB North-West Europe 2014 - 2020
(hereinafter: NWE-Programme) is obligatory.
The assessment covers the general strategic approach, defined Specific Objectives (SOs) and related
Types of Actions (ToA) to be supported as well as the defined indicators as stated in the NWE-
Programme. The territorial area of the assessment covers the Member States of Interreg NWE (see
graphic). The formal time frame for the Programme covers the years 2014 till 2020. Adding 3 more
years for the finalisation of funded projects, the period considered in the assessment is 2014 till
2023.
The environmental report is based on the draft NWE-Programme, version dated 4 March 2014.
Area of INTERREG North-West Europe

| II
METHODOLOGY OF THE ASSESSMENT
The assessment follows the methodology prescribed in the SEA-Directive: Referring to the determi-
nations of the NWE-Programme, relevant environmental objectives and related indicators were iden-
tified which serve as a base for the description of the present status of the environment and its de-
velopment trends in the programme’s area as well as for the assessment of likely significant effects
of the programme on the environment.
Relevant environmental objectives are presented in numerous European directives, strategies,
roadmaps and conventions. Indicators are defined to measure the achievement of the set objectives
and to describe the status of the European environment. The indicators are also used to formulate
‘assessment questions’, which serve to appraise the likely significant effects on the environmental
issues of the NWE-Programme and its contributions to the relevant EU environmental objectives.
According to the SEA Directive, the assessed environmental issues cover population/human health,
landscape, water, soil, air and material assets/cultural heritage (including architectural and archaeo-
logical heritage). Additionally, the aspect ‘Global Climate’ as a separate environmental issue is con-
sidered. ‘Resource Efficiency’ as an important field of interventions with manifold direct and indirect
effects on the environmental issues is also included.
It has to be emphasised that the complex interdependencies between the environmental issues are
known although the description of the present state of the environment in the NWE area and the
assessment of the effects focuses on the individual environmental issues first of all. A detailed de-
scription of complex effect-chains is seriously not possible at this high strategic programming level.
Statements to existing interdependencies are provided where necessary and possible.
STRUCTURE OF THE NWE-PROGRAMME
The ambition of the NWE-Programme defined by the Partner States says
“To be a key economic player in the world and create an attractive place to work and live,
with high levels of innovation, sustainability and cohesion”.
The NWE-Programme bases on six identified key challenges in the NWE area which can each be allo-
cated to one of the priorities of the “Europe 2020”-Strategy:
Challenge 1: Boosting knowledge flows
Challenge 2: SMEs innovative capabilities
Challenge 3: Resource and materials efficiency
Challenge 4: Energy security and supply
Challenge 5: Vulnerability to climate change events
Challenge 6: Inclusion
To respond to the challenges, the Member States identified three Priorities which are based on four
Thematic Objectives as prescribed by Article 9 of the Common Provisions Regulation (CPR)1. Within
the Priorities a total of five Investment Priorities, as prescribed by Article 5 of ERDF Regulation2, are
covered which were further focussed in five Specific Objectives, i.e. one Specific Objective per each
1 Regulation (EU) No 1303/2013 of the European Parliament and of the Council of 17 December 2013 laying down com-
mon provisions on the European Regional Development Fund, the European Social Fund, the Cohesion Fund, the Euro-pean Agricultural Fund for Rural Development and the European Maritime and Fisheries Fund and laying down general provisions on the European Regional Development Fund, the European Social Fund, the Cohesion Fund and the Euro-pean Maritime and Fisheries Fund and repealing Council Regulation (EC) No 1083/2006
2 Regulation (EU) No 1301/2013 of the European Parliament and of the Council of 17 December 2013 on the European
Regional Development Fund and on specific provisions concerning the Investment for growth and jobs goal and repeal-ing Regulation (EC) No 1080/2006

| III
Investment Priority. The individual Specific Objectives form the framework for concrete interventions
to be supported. The latter are described in nine Types of Actions.
Distribution of ERDF-funds per Specific Objective
Priorities Specific Objectives assigned
ERDF-funds [in Mio. €]*
assigned ERDF-
funds [%]*
P1: Innovation SO1: To enhance innovation performance in NWE through international cooperation
130.7 35.1
P2: Low Carbon
SO2: To reduce GHG emissions in NWE through interna-tional cooperation on the implementation of low car-bon, energy or climate protection strategies
47.5 12.8
SO3: To reduce GHG emissions in NWE through interna-tional cooperation on the uptake of low carbon tech-nologies, products, processes and services
51.5 13.8
SO4: To reduce GHG emissions in NWE through interna-tional cooperation on transnational low carbon solu-tions in transport systems
47.5 12.8
P3: Resource and materials effi-ciency
SO5: To optimise (re)use of material and natural re-sources in NWE through international cooperation
95.0 25.5
TOTAL 372.2 100.0
* without funds for Technical Assistance
The NWE-Programme is embedded in a framework of numerous European policies, programmes and
strategies. Additionally, country specific recommendations for ETC-programmes complement the
complex context of this Programme.
EXISTING ENVIRONMENTAL PROBLEMS AND TRENDS OF ENVIRONMENTAL DEVELOPMENT
Despite improvements over the last years numerous challenges concerning the environment exist
which need to be solved. Due to the intensive economic activities and high population density in the
NWE area, all environmental issues are still under pressure.
This holds particular to:
Biodiversity: The loss of biodiversity continued; the target to halt the loss of biodiversity by
2010 is missed.
Air quality: Urban air pollution concentrations are still too high causing problems on human
health.
Global Climate. Although the greenhouse gas (GHG) emissions in Europe have fallen evidently
in NWE, global warming however presents a considerable challenge; climate change effects
are starting to become evident, adaptation is needed to protect people, buildings, infrastruc-
ture, businesses and ecosystems.
ENVIRONMENTAL EFFECTS OF THE PROGRAMME
The (financial) extent of the Programme and the proposed Types of Actions do not allow, considering
the spatial coverage of the programme, for widespread, significant direct effects on the environment

| IV
in the short-run. Instead, ERDF-programmes like the NWE-Programme have an important function
for strengthening the framework conditions for the transition towards a resource efficient, low car-
bon economy (‘green economy’) and for the establishment of a circular economy. The NWE-
Programme serves this function by its general strategic approach and by the proposed individual
Types of Actions as well.
The assessment follows three steps:
At first the strategic approach of the NWE-Programme is analysed concerning the general ori-
entation of the defined Priorities and Specific Objectives, the interrelations between the Priori-
ties, the consideration of the horizontal principle ‘sustainable development’ and the defined
indicators.
Secondly the effects of individual Specific Objectives and Types of Actions are assessed. Due to
the fact that detailed conditions of the individual funded projects (location, volume, aim, ac-
tivities, etc.) are not known, the assessment has to focus on qualitative statements and the
presentation of general cause-effect-relations.
In a third step the overall potential effects of the NWE-Programme on the individual environ-
mental issues and contributions to EU environmental objectives are assessed. For this, assess-
ment questions per environmental issue were formulated based on the environmental objec-
tives and related indicators.
At the strategic level two elements are decisive to support positive contributions of the NWE-
Programme to the EU environmental objectives:
Two out of the three priorities (Priority 2: ‘low carbon’ and Priority 3: ‘Resource and material
efficiency’) aim directly at the improvement of development, testing and uptake of new tech-
nologies in the fields of reduction of GHG-emission and resource efficiency. The term ‘new
technologies’ includes products, services, and processes but also management systems, gov-
ernance arrangements and networks. A comprehensive set of necessary conditions for further
improvement of climate protection and resource efficiency can therefore directly be ad-
dressed. Under Priority 1 (‘Innovation’) capacities will be developed to improve the innovation
performance in regions and of enterprises. These capacities could serve as important interme-
diate structures and ‘transmission belts’ for promoting the transition towards green economy.
The criterion “project proposals are only eligible if the project objectives and activities do not conflict with the principles of sustainable development, as defined by the programme” asks for an early consideration of the principles of sustainable development in the preparation
of projects, even though the criterion is formulated quite soft.
At the level of Type of Actions (ToA), the actual effects and their characteristics depend on the de-
sign, execution conditions and results of the projects supported by the NWE-Programme which in
turn depend on the effective application of selection criteria related to environmental, climate and
resource protection.
According to the orientation of the Priorities 2 and 3 with the Specific Objectives 2 - 5, all supported
projects need to contribute to the mitigation of GHG-emissions or to resource efficiency. Additionally
under Specific Objective 2 (ToA5) projects will contribute to adaptation to risks of climate change.
For the supported projects under Priority 1, respectively Specific Objective 1, the link to topics re-
lated to environmental, climate or resource protection is not required in the NWE-Programme con-
sistently. However, the consideration of principles of sustainable development is required.
The risk of significant negative effects and conflicting contributions to sustainable development is
limited, nevertheless existent. Potential negative effects have to be considered connected to the
promotion of energy generation out of renewable energy sources, e.g. wind power plants, hydro

| V
power plants, biomass power plants, large solar power plants on green fields or distribution net-
works, but also connected to construction work linked to adaptation measures.
The assessment of the cumulative and synergistic effects can be done in an abstract manner only.
Important criteria of a detailed assessment as the particular spatial conditions and the extent, dura-
tion, frequency and the range of the effects are not known. Fields of positive cumulative effects can
be seen in reducing GHG-emissions and improvement of resource efficiency; cumulative effects on
particular territories cannot be assessed due to lack of details regarding territorial aspects and con-
tents of the projects. By promotion of low-carbon economy as well as resource efficiency the NWE-
Programme tackles two areas which could generate a number of potential synergistic effects: (a) the
mitigation of GHG-emissions and (b) the reduction of the consumption of resources for (industrial)
production and energy generation support also the protection of other environmental media as air,
water, soil, biodiversity and landscape. Human health and human well-being is positively influenced
by less polluted air, particularly in urban areas, but also by better quality of waters, landscape and
soil.
Summarising it can be stated that the NWE-Programme shows a strong potential to generate positive
effects on the environment and to contribute to the EU environmental objectives. This holds for ef-
fects delivered by the projects as well as for developing framework conditions to strengthen the
transition towards a green economy and to respect sustainable development. Decisive tools to ex-
ploit the potential of the programme are: A thorough assessment of applications, ensuring the selec-
tion of projects with the best possible contribution to environmental, climate and resource protec-
tion and an effective monitoring of the implementation of projects.
The assessment of the alternative to change the funding of the individual priorities revealed that
shifting of the funds in favour of Priorities 2 and 3 would generate limited additional positive effects
concerning climate and resource protection. At the same time this change of funding would reduce
the enhancement of innovation performance capabilities.
For mitigating the potential negative effects only general procedural recommendations can be made:
The potential for tiering, i.e. assessing effects on the level of projects being funded by the
NWE-Programme, must be strictly used.
Beside the application of formal procedures, environmental competences must be integrated
with the approval of applications showing the risk of potential negative effects on environ-
mental issues.
Prior to the approval phase, an important instrument for the mitigation of potential negative
effects (and strengthening potential positive effects too of course) is building capacities to
provide advice to the applicants.
RECOMMENDATIONS
Although the NWE-Programme contributes to the set EU environmental objectives recommendations
can be given in order to exploit the potential to an optimum. The recommendations aim mainly on
arrangements concerning the implementation of the programme.
1. In chapter 8.1 it is stated that “innovation in the NWE programme strategy also includes eco-
innovation”3. However, the consideration of eco-innovations as a privilege for the selection of
projects should be added for Priority 1, respectively Specific Objective 1. Projects under prior-
ity 1 should also, as far as possible, respond on the environmental challenges in the NWE area
and contribute to the transition towards green economy.
3 NWE-Programme; p. 81

| VI
The compliance of Priority 1 with important EU environmental priorities could be strength-
ened; the positive contribution to these priorities would not “depend on the actual projects”.
2. Additionally to recommendation 1, selection criteria should be included in chapter 8.1 clearly
asking for the contribution of the proposed projects on the environmental challenges in the
NWE are as there are resource and materials efficiency, GHG-emission and vulnerability to cli-
mate change events.
The current formulation “do not conflict with the principles of sustainable development” as
stated in chapter 8.1 opens a wide room for interpretations and different perceptions.
It should also be stated explicitly that EU and national environmental legislations must be ap-
plied and EU and national environmental standards must be met by all supported projects.
3. In the selection process for projects aiming on the promotion of energy generation by renew-
ables and distribution networks (ToA4 and ToA5 of SO2, ToA6 of SO3), the possible effects on
biodiversity, landscape, soil and water have to be taken into account seriously. The use of new
generation biomass (e.g. agricultural waste, organic waste, sludge) should be promoted.
4. By designing appropriate implementation guidance or application manuals, the consideration
and incorporation of criteria concerning environmental, climate and resource protection in
project applications must be ensured. The criteria must not be too strict but should guarantee
a sufficient environmental quality standard of the projects.
5. Each project application should be complemented by a concise description of the environ-
ment-related aspects to be addressed and of expected environmental effects. Depending
whether the project has a clear territorial focus, a short description of the existing environ-
mental conditions could be added.
6. At the level of the Member States, arrangements should be established to enable applicants to
receive information and advice for the consideration of environmental aspects in the design
and execution of projects.
7. Relevant national or regional authorities responsible for environmental and nature protection
should be involved in the assessment and selection of relevant project applications.
8. To exploit the potential to an optimum, the Joint Secretariat should support the exchange of
information and knowledge between beneficiaries on the projects’ outputs and lessons
learned of the different Types of Actions. This should be done for projects within one priority
or across the different priorities. The functions of the Joint Secretariat could be complemented
with: “Promotion of information exchange and cooperation between the beneficiaries of the
different supported projects.” It could be linked to the listed function “to assist and organise
activities to support project generation and development” (function h) 4.
NOTES ON PROBLEMS IN THE COMPILATION OF REQUIRED DATA AND INFORMATION
In the course of the assessment, no problems occurred to find and use accurate data and informa-
tion.
4 NWE-Programme; p. 64

| VII
PROPOSED MONITORING MEASURES
The SEA Directive requires that “Member States shall monitor the significant environmental effects
of the implementation of the plans and programmes, in order, inter alia, to identify at an early stage
unforeseen adverse effects, and to be able to undertake appropriate remedial action.”5
The lack of details of supported projects does not allow the identification of measures to monitor
concrete possible effects on the environment. The monitoring must aim to ensure that no adverse
effects to the EU environmental objectives and the EU environmental policy are supported by the
Programme, even if the effects will only occur in the long run.
Monitoring measures should include:
1. Environmental criteria have to be safeguarded by including them in the project implementa-
tion guidance or application manuals of the NWE-Programme.
2. The consideration of potential environmental effects has to be proven in the application for a
project. Projects which potentially show effects not compliant with EU environmental objec-
tives and with the principles of sustainable development as described in the application man-
ual can be screened out or amendments can be demanded by the Monitoring Committee. The
selection process must be used to avoid contradictions to the effective EU environmental ob-
jectives and the general EU environmental policy.
3. In the progress and final reports of the projects the initiated indirect effects should be de-
scribed and assessed towards the expected effects stated in the applications.
4. As part of the function “to monitor progress made by projects through collecting and checking
project monitoring reports, monitoring outputs, results and financial implementation”6 of the
Joint Secretariat, the expected effects and contributions and the actually initiated ones as
stated in the projects progress and final reports have to be compiled and assessed on regular
base in order to avoid incompatibility of the overall implementation orientation of the NWE-
Programme towards the effective EU environmental objectives and general environmental pol-
icy.
5. As part of the monitoring systems to be established and in course of defining indicators, com-
plementary to the result and output indicators, to ensure an effective progress and implemen-
tation monitoring7, adequate indicators should be defined to measure the contribution of the
NWE-Programme to the effective EU environmental objectives in particular and sustainable
development in general. Areas of monitoring could be:
- Energy consumption
- (Raw-) material consumption
- Land take for construction
- Direct and indirect impacts on biodiversity
- Pollution of water and air.
6. Depending on the nature of the individual projects, relevant existing national, regional and/or
local environmental monitoring systems should be used (for example to measure air pollution,
noise, water pollution). Relevance and mode of utilisation could be clarified by involvement of
the authorities responsible for the monitoring (linked to recommendations 6 and 7).
5 Directive 2001/42/EC, Art. 10
6 NWE-Programme; p. 64
7 NWE-Programme; p. 69

| 1
1 INTRODUCTION
1.1 SEA OBLIGATION
Strategic Environmental Assessment (hereinafter: SEA) is a key policy instrument to mainstream en-
vironmental considerations into plans, programmes and strategies. The main objective of SEA is to
ensure that the significant environmental implications of decisions are taken into account before the
decisions are made.
Pursuant to the Directive 2001/42/EC (hereinafter: SEA-Directive) adopted by the European Parlia-
ment and European Council, a Strategic Environmental Assessment (SEA) is required for the devel-
opment and amendment of certain plans and programmes including those programmes which influ-
ence other plans and programmes (Art. 3 and Annex II SEA-Directive). Accordingly the assessment of
the impacts on the environment of the Cooperation Programme INTERREG VB North-West Europe
2014 - 2020 (hereinafter: NWE-Programme) is obligatory. Annex II of the SEA Directive stipulates the
criteria for the assessment of potential environmental impacts.
The overall European strategy “Europe 2020 - a strategy for smart, sustainable and inclusive growth
(COM(2010) 2020)” requires that all instruments at EU-level contribute to this overarching strategy.
By this, the strengthening of a sustainable and ecological-sound economic development is imposed
as a commitment to all actors. The assessment has to verify how far the NWE-Programme supports
the environmental objectives of the European Union and does not counteract environmental targets
and objectives as stated in relevant strategies as the Roadmap to resource efficient Europe (resource
efficiency roadmap) (COM(2011) 571), the Roadmap for moving to a competitive to low carbon econ-
omy (low carbon roadmap) (COM(2011) 112), the Water Framework Directive (WFD) (Directive
2000/60/EC), EU Adaptation Strategy (COM(2013) 216) or the EU Biodiversity Strategy to 2020
(COM(2011) 24). The present SEA is being carried out alongside the development of NWE-
Programme in order to identify and assess likely significant environmental effects of the Programme,
and of any reasonable alternatives, during the preparation stage and before it is adopted.
The Environmental Report is based on the draft Cooperation Programme INTERREG VB North-West
Europe 2014 - 2020, version dated 4 March 2014.
1.2 THE SEA PROCESS
Directive 2001/42/EC on the assessment of the effects of certain plans and programmes on the environment (SEA
Directive)
Article 1
Objectives
The objective of this Directive is to provide for a high level of protection of the environment and to contribute to
the integration of environmental considerations into the preparation and adoption of plans and programs with a
view to promoting sustainable development, by ensuring that, in accordance with this Directive, an environmental
assessment is carried out of certain plans and programs which are likely to have significant effects on the environ-
ment.

| 2
The SEA process comprises the development of the environmental report on the likely significant
effects on the environment as well as consultations of relevant authorities and the general public as
an integral part of the SEA procedure. The findings and recommendations of the environmental re-
port and of the consultations will be considered in the finalisation and approval of the programme.
The SEA process follows definite steps:
The scoping stage is mandatory under the SEA. In this stage the content and the scope of the
environmental report will be defined. The scoping procedure includes the consultation of rele-
vant authorities.
Next stage is the preparation of the environmental report. The environmental report is detail-
ing the likely significant environmental effects and reasonable alternatives. Issues that should
be considered are listed in Annex I of the SEA Directive.
The environmental report must be accessible for the public as base for the consultations with
the public and the authorities with environmental responsibilities.
The report on environmental effects and the results of consultations shall be considered be-
fore the programme is adopted.
Once the programme and the environmental report are adopted, the authorities with envi-
ronmental responsibilities and the public shall be informed and the relevant information made
available to them.
In order to determine any unforeseen adverse effects as early as possible, it is necessary to en-
sure that the significant environmental effects of the programme are monitored.8
For the SEA of the NWE- Programme, a scoping note presenting a proposal on the extent and level of
detailing of the assessment was sent to authorities with environmental responsibilities in the mem-
ber states of INTERREG NWE asking for comments and suggestions. The scoping consultation period
formally lasted from 22 November 2013 till 9 December 2013. However, comments were received
(and accepted) later than the official deadline. The received comments and suggestions were taken
into account while developing the environmental report.
Together with the draft NWE-Programme, the Environmental Report is subject of the authorities and
public consultation being conducted in April and May 2014. After the public consultation, a consulta-
tion report will be drafted presenting the received comments and their consideration.
1.3 ASSESSMENT FRAME
The assessment of potential significant impacts on the environment refers to the Cooperation Pro-
gramme INTERREG VB North-West Europe 2014 - 2020. Technical areas of the assessment are the
general strategic approach, defined Specific Objectives (SOs) and related Types of Actions (ToA) to be
supported as well as the defined indicators.
The territorial area of the assessment covers the Member States of NWE (see graphic 1). Significant
effects beyond the borders of this territory cannot be expected for effects on most of the environ-
mental issues. Exceptions are ‘global climate’ and partly effects linked to the important intervention
field ‘resource efficiency’ (see EU (2011) EU Resource Efficiency Perspectives in a Global Context; pp.
26). However, the presentation of “Relevant environmental objectives and indicators” (chapter 3)
and “Existing environmental problems and trends of environmental development” (chapter 4) refer
to the area of the European Union with focus on NWE Member States.
8 http://ec.europa.eu/environment/eia/sea-legalcontext.htm (21.11.2013)

| 3
The formal time frame for the Programme covers the years 2014 till 2020. Adding 3 more years for
the finalisation of funded projects, the period considered in the assessment is 2014 till 2023.
Graphic 1: Area of INTERREG North-West Europe
1.4 METHODOLOGY
The assessment follows the methodology prescribed in the SEA-Directive: Referring to the determi-
nations of the NWE-Programme, relevant environmental objectives and related indicators were iden-
tified which serve as a base for the description of the present status of the environment and its de-
velopment trends in the programme’s area as well as for the assessment of likely significant effects
of the programme on the environment.
Relevant environmental objectives are presented in numerous European directives, strategies,
roadmaps and conventions. Indicators are defined to measure the achievement of the set objectives
and to describe the status of the European environment. The selected indicators focus on the “Core
Set of Indicators (CSI)” of the European Environment Agency (EEA). Due to the general character of
the Programme it is not possible to measure possible impacts directly with indicators. The indicators
are also used to formulate ‘assessment questions’, which serve to appraise the likely significant ef-
fects on the environmental issues of the NWE-Programme and its contributions to the relevant EU
environmental objectives.
According to the SEA Directive- Annex I, the assessed environmental issues cover population/human
health, landscape, water, soil, air, climate conditions and material assets/cultural heritage (including
architectural and archaeological heritage) as well as the interrelationship between these factors.

| 4
Additionally in this assessment, the explicit consideration of ‘Global Climate’ as a separate environ-
mental issue is included. The outstanding importance of the protection of the global climate and the
position in the EU environmental policy ask for a particular assessment of the programme’s effects
on this issue and contribution to the relevant EU objectives.
Beside global climate also ‘Resource Efficiency’ is included in the assessment as an important field of
interventions with manifold direct and indirect relations to the environmental issues. The consump-
tion of resources, for economic processes as well as societal needs, presents a key factor in the com-
plex interrelations between ecology and economy. In the last years, the awareness is increasing that
decoupling of (economic) growth from resource consumption is required in order to maintain biodi-
versity and the natural base of human living. The understanding of resource efficiency in the context
of this assessment is defined in chapter 3.
For the assessment of NWE-Programme and the preparation of the environmental report, the follow-
ing documents have been used as technical references:
Protocol on strategic environmental assessment to the convention on environmental impact assessment in a transboundary context (2003)
Implementation of Directive 2001/42 on the assessment of the effects of certain plans and programmes on the environment (2004)
Leitfaden zur Strategischen Umweltprüfung (German Federal Environmental Agency) (2009)
Guidance document on ex-ante evaluation (January 2013) - Annex 1: Ex-ante evaluation and the Strategic Environmental Assessment
The assessment follows three steps:
After a short discussion of possible alternatives, in a first step the strategic approach of the
NW-Programme is analysed concerning the general orientation of the defined priorities and
Specific Objectives, the interrelations between the Priorities, the consideration of the horizon-
tal principle ‘sustainable development’ and the defined indicators.
In a second step, the effects of individual Specific Objectives and Types of Actions are assessed.
Due to the fact that detailed conditions of the individual funded projects (location, volume,
aim, activities, etc.) are not known, the assessment has to focus on qualitative statements and
the presentation of general cause-effect-relations.
In a third step, the overall potential effects of the NWE-Programme on the individual environ-
mental issues and its contributions to the EU objectives regarding each environmental issue
are assessed. For this, assessment question per environmental issue were formulated based on
the environmental objectives and related indicators (see table 2).
For the presentation of the findings textual explanations are applied. It allows discussing potential
effects and possible impact-chains. This is particular important if only qualitative and principle state-
ments can be made. Summary tables provide an easy access to the assessment’s results per Specific
Objective.
It has to be emphasised that the complex interdependencies between the environmental issues are
known although the description of the present state of the environment in the NWE area and the
assessment of the effects focuses on the individual environmental issues first of all. A detailed de-
scription of complex effect-chains is seriously not possible at this high strategic programming level.
Statements to existing interdependencies are provided where necessary and possible.

| 5
2 STRUCTURE OF THE NWE-PROGRAMME
2.1 INTERVENTION LOGIC
The ambition of the NWE-Programme defined by the Partner States says
“To be a key economic player in the world and create an attractive place to work and live,
with high levels of innovation, sustainability and cohesion”.9
The intended contribution of the NWE-Programme to realise this ambition is based on six identified
key challenges in the NWE area which can each be allocated to one of the Priorities of the “Europe
2020”-Strategy:10
Challenge 1: Boosting knowledge flows
Challenge 2: SMEs innovative capabilities
Challenge 3: Resource and materials efficiency
Challenge 4: Energy security and supply
Challenge 5: Vulnerability to climate change events
Challenge 6: Inclusion
To respond to the challenges, the Member States identified three Priorities which are based on four
Thematic Objectives as prescribed by Article 9 of the Common Provisions Regulation (CPR)11. Within
the Priorities a total of five Investment Priorities, as prescribed by Article 5 of ERDF Regulation12, are
covered which were further focussed in five Specific Objectives, i.e. one Specific Objective per each
Investment Priority. The individual Specific Objectives form the framework for concrete interventions
to be supported. The latter are described in nine Types of Actions.
The following table presents the elements of the intervention system of the NWE-Programme:
9 NWE-Programme; p. 7
10 NWE-Programme; p. 7ff
11 Regulation (EU) No 1303/2013 of the European Parliament and of the Council of 17 December 2013 laying down com-
mon provisions on the European Regional Development Fund, the European Social Fund, the Cohesion Fund, the Euro-pean Agricultural Fund for Rural Development and the European Maritime and Fisheries Fund and laying down general provisions on the European Regional Development Fund, the European Social Fund, the Cohesion Fund and the Euro-pean Maritime and Fisheries Fund and repealing Council Regulation (EC) No 1083/2006
12 Regulation (EU) No 1301/2013 of the European Parliament and of the Council of 17 December 2013 on the European
Regional Development Fund and on specific provisions concerning the Investment for growth and jobs goal and repeal-ing Regulation (EC) No 1080/2006

| 6
Table 1: Intervention system of the NWE-Programme
Priorities Thematic Objectives (TO) Investment Priorities (IP) Specific Objectives (SO) Type of Actions (ToA)
Priority 1: Innovation
TO1: Strengthening research, technological development and innovation.
IP 1b: Promoting business […] investment in innovation and research, and develop-ing links and synergies between enter-prises, R&D centres and higher education […]
SO1: To enhance innovation per-formance in NWE through interna-tional cooperation
ToA1: Building the capacity of regions and territories to improve their innovation performance.
ToA2: Improving the competitiveness of enterprises, through cooperative actions that take forward the devel-opment of specific products, services or processes to a stage of market-readiness.
ToA3: Delivering societal benefits through innovation.
Priority 2: Low Carbon
TO4: Supporting the shift towards a low-carbon econ-omy in all sectors.
IP 4e: Supporting the shift towards a low carbon economy in all sectors through (4e) promoting low carbon strategies for all types of territories, in particular urban areas, including the promotion of sus-tainable urban mobility and mitigation relevant adaptation measures.
SO2: To reduce GHG emissions in NWE through international coop-eration on the implementation of low carbon, energy or climate protection strategies
ToA4: Promoting carbon reduction in cities and regions through the implementation of emerging or existing low carbon, energy or climate protection strategies
ToA5: Implementing combined mitigation and adaptation solutions, to demonstrate feasibility and refine design and development plans for the future.
IP 4f: Promoting research, innovation and adoption of low carbon technologies.
SO3: To reduce GHG emissions in NWE through international coop-eration on the uptake of low car-bon technologies, products, proc-esses and services
ToA6: Implementing low carbon technologies and other solutions through demonstrations and rollout of existing low carbon products, technologies, or solutions.
TO7: Promoting sustainable transport and removing bottlenecks in key network infrastructures.
IP 7c: Developing environmental friendly and low carbon transport systems includ-ing river and sea transport, ports and multimodal links […]
SO4: To reduce GHG emissions in NWE through international coop-eration on transnational low car-bon solutions in transport systems
ToA7: Implementing transnational solutions for low car-bon transport systems to reduce GHG emissions.
ToA8: Implementing solutions for optimised traffic man-agement to enhance capacity and to show tangible trans-fer to lower-carbon forms of transport, in order to reduce GHG emissions.
Priority 3: Resource and materials efficiency
TO6: Preserving and protect-ing the environment and promoting resource effi-ciency.
IP 6f: Promoting innovative technologies to improve environmental protection and resource efficiency in the waste sector, water sector, soil protection or to reduce air pollution.
SO5: To optimise (re)use of mate-rial and natural resources in NWE through international cooperation
ToA9: Implementing new technologies, services, products and processes to improve resource efficiency.

| 7
2.2 RELATIONS TO OTHER RELEVANT PROGRAMMES AND STRATEGIES
The NWE-Programme is embedded in a frame of numerous European policies, programmes and
strategies. Additionally, country specific recommendations for ETC-programmes complement the
complex context of this Programme.13
As an instrument for the implementation of the EU cohesion policy, the NWE-Programme contrib-
utes to the overall aim of the cohesion policy namely to reduce existing disparities between EU
member states and regions in terms of their social and economic development and environmental
protection in consideration of their specific territorial and societal conditions and potentials.
The cohesion policy supports the priorities of the Europe 2020 strategy (COM(2010) 2020):
Smart growth: developing an economy based on knowledge and innovation,
Sustainable growth: promoting a more resource efficient, greener and more competitive
economy,
Inclusive growth: fostering a high-employment economy delivering social and territorial cohe-
sion.
“Europe 2020”-strategy thus presents the overall ‘strategic anchor’ for the NWE-Programme.
The Programme is directly linked to a number of EU policy documents which are developed in order
to support the priorities of Europe 2020. This includes
the Territorial Agenda of the European Union 2020 - Towards an Inclusive, Smart and Sustain-
able Europe of Diverse Regions (May 2011)
Horizon 2020 - Framework Programme for Research and Innovation 2014-2020 (COM(2011)
809)
Programme for the Competitiveness of Enterprises and SMEs 2014 – 2020 (COSME) (COM
(2011) 834)
the Roadmap for Moving to a Competitive Low Carbon Economy in 2050 (COM(2011)112)
the Roadmap to a Resource Efficient Europe (COM(2011) 572)
EU Strategy on Adaptation to Climate Change (COM(2013) 216)
Programme for the Environment and Climate Action (LIFE Programme) for the period 2014-
2020 (PE-COS 70/13, 16103/13 ADD1)
the Eco-innovation Action Plan (Eco-AP) (COM(2011) 899)
Green Infrastructure (GI) - Enhancing Europe’s Natural Capital (COM(2013) 249)
Furthermore, the Programme shows linkages to several EU Directives and Strategies such as the Wa-
ter Framework Directive (WFD), the Urban Waste Water Treatment Directive, or the EU Waste
Framework Directive.
Country specific recommendations describe particular needs of Member States which should be
dealt with by transnational cooperation. For the NWE Partner States, the following recommendations
are given showing importance for the Programme:
“Strengthening research and innovation (NL, BE, UK and LU) with a focus on eco-innovation,
such as production and distribution of renewable energy (IE, UK, FR), the environment (IE, LU,
FR, NL) and energy and resource use (NL, LU).
13
In chapter 1.1, sub-chapter ‘Context of the NWE strategy for smart, sustainable and inclusive growth’ of NWE-Programme, the relations to most important policies, strategies and programmes are presented. See: NWE-Programme; p. 3ff

| 8
Integrated networking ideas (DE), cluster nodes (NL, BE, UK) and open innovation through
smart specialisation (IE) by sharing best practices or mobilising co-investments (NL, UK).
Stimulating the cross-border SME environment (LU, FR) by increased co-operation, sharing of
best practices and economies of scale between SMEs from different Member States (IE).
Themes preferably include market integration and participation (NL) and labour mobility (BE).
Organising transnational cooperation initiatives in the context of national policies and other
Community-funded programmes, based on a strong sense of partnership, such as European
Grouping of Territorial Cooperation (EGTC) as a legal framework (NL, DE), while recognising the
various needs and priorities across borders (DE).”14
The NWE-Programme considered these recommendations in the elaboration of the strategic ap-
proach of the programme and the defined interventions (Types of Actions).
Furthermore, the area of NWE-Programme is also partly included into sea-basin and macro-regional
strategies:
The Atlantic Sea-basin Strategy includes France, Ireland and the United Kingdom. The priorities
set in the strategy show partially similarities with the NWE-Programme concerning the strate-
gic orientation:
- Promote entrepreneurship and innovation;
- Protect, secure and develop the potential of the Atlantic marine and coastal environment;
- Improve accessibility and connectivity;
- Create a socially inclusive and sustainable model of regional development.
The NWE-Programme will contribute to some of the specific objectives of the Atlantic Sea-
basin Action Plan:
- Sharing knowledge between higher education organisations, companies and research
centres (complementary to SO1 of the NWE programme);
- Fostering adaptation and diversification of economic activities by promoting the potential
of the Atlantic area (complementary to SO1 of the NWE programme);
- Exploitation of the renewable energy potential of the Atlantic area's marine and coastal
environment (complementary to SO3 of the NWE programme);
- Promoting cooperation between ports (complementary to SO4 of the NWE programme). 15
The Danube Macro-Region Strategy includes parts of Germany (Baden-Württemberg and parts
of Bavaria). The strategy focuses on four priorities:
- Connecting the region (mobility and multimodality, sustainable energy, culture and tour-
ism, people to people);
- Protecting the Environment (Water quality, environmental risks, biodiversity, landscapes
and the quality of air and soils);
- Building Prosperity (Knowledge Society, competitiveness, people and skills);
- Strengthening the Region (institutional capacity and cooperation, security).
Coordinated actions between NWE-Programme and the Danube Macro-Region Strategy are
only possible in the limited area of Southern and South-Western Germany. Topics of contribu-
tions can be seen in innovation, renewable energy development and mobility and multimodal-
ity.16
14
NWE-Programme; p. 6 15
NWE-Programme; p. 61 16
NWE-Programme; p. 61

| 9
Links to national and regional programmes and strategies exist towards smart specialisation strate-
gies, low-carbon strategies, energy strategies, climate strategies as well as the regional ERDF pro-
grammes.
For the implementation of projects supported by the NWE-Programme national legislation and per-
mit procedures must be considered.
3 RELEVANT ENVIRONMENTAL OBJECTIVES AND INDICATORS
In the following table, the most relevant current objectives with related indicators are listed. An
overview of the environmental policy targets and objectives 2010-2050 can be found in the EEA re-
port “Towards a green economy in Europe”, published in 2013.
As mentioned above the selected indicators focus on the “Core Set of Indicators (CSI)” of the Euro-
pean Environment Agency (EEA). The purpose of the indicators is to describe the status of the Euro-
pean environment. Due to the general character of the NWE-Programme it is not possible to meas-
ure possible impacts with these indicators directly. The indicators guide to formulate the “assess-
ment questions”. On base of these questions the possible effects on the environmental issues and
contributions to the EU environmental objectives will be assessed.
The assessed environmental issues follow the SEA Directive (Annex I) and cover population/human
health, landscape, water, soil, air, climatic conditions and material assets/cultural heritage (including
architectural and archaeological heritage). Beside the additional explicit consideration of ‘Global Cli-
mate’, also ‘Resource Efficiency’ is included in the assessment as an important field of interventions
with manifold direct and indirect effects on the environmental issues.
The consumption of resources, for economic processes as well as societal needs, presents a key fac-
tor in the complex interrelations between ecology and economy. In the last years, the awareness is
increasing that a decoupling of (economic) growth from resource consumption is required in order to
maintain biodiversity and the natural base of human living.
Up to date, there is no generally accepted definition of ‘resource efficiency’. Among the EU Member
States “there is neither a clear definition nor a common understanding of key terminology.(...) Gen-
erally, most countries seem to interpret resource efficiency quite broadly, including raw materials,
energy sources, biomass, waste, land and soil, water and biodiversity. This is largely in line with the
European Commission's interpretation in documents published to date.”17 Furthermore the EEA
states an uncertainty about the definition of 'resource efficiency' and its relationship to other con-
cepts such as 'sustainable consumption and production' and 'the green economy'. The Roadmap to a
Resource Efficient Europe describes its vision to 2050 as follows: “By 2050 the EU's economy has
grown in a way that respects resource constraints and planetary boundaries, thus contributing to
global economic transformation. Our economy is competitive, inclusive and provides a high standard
of living with much lower environmental impacts. All resources are sustainably managed, from raw
materials to energy, water, air, land and soil. Climate change milestones have been reached, while
biodiversity and the ecosystem services it underpins have been protected, valued and substantially
restored.”18
It is not intended to dissolve uncertainties concerning the definition of ‘resource efficiency’ in this
environmental report. Instead as a pragmatic approach a more limited definition for the aspect ‘re-
17
European Environmental Agency (2011): Resource Efficiency in Europe; p. 8 (underline by D&T) 18
European Commission (2011): Roadmap to a Resource Efficient Europe; p. 3 (underline by D&T)

| 10
source efficiency’ is chosen: As the environmental issues will be described separately, the sub-
chapter ‘resource efficiency’ focuses on aspects related to the consumption of raw materials and
energy. As there are many relationships between the assessed issues, some aspects of energy will be
discussed in the sub-chapter ‘global climate’ already. Aspects of a ‘green economy’ like consumption
and production patterns, waste and circular economy will be addressed in the sub-chapter ‘resource
efficiency’.
The presentation of the environmental objectives and indicators follows the individual environ-
mental issues. However, the complex interdependencies of the environmental issues are known and
respected. Mutual reactions influence the final effects on the individual issue and on complex eco-
systems as well. In chapter 4 (Existing environmental problems and trends of environmental devel-
opment), these interdependencies are mentioned if required for better understanding.

| 11
Table 2: Relevant environmental issues, EU environmental objectives and targets, and related indicators
Environmental Is-sues
Environmental Objectives and Targets
Indicators Source: European Environment Agency - Indicators and fact sheets about Europe's environment - Website 10.3.2014
Assessment Question
Population, Human Health
Thematic Strategy on Air Pollution (COM(2005) 446): Compared with the situation in 2000, the Strategy sets specific long term objectives (for 2020):
47 % reduction in loss of life expectancy as a result of exposure to particulate matter;
10 % reduction in acute mortalities from exposure to ozone.
Exceedance of air quality limit values in urban areas (CSI 004) - Assessment published Oct 2013
Does the NWE-Programme positively / negatively contribute to human health?
Does the programme positively / nega-tively contribute to reduce concentrations of air pollutants in urban areas?
Landscape
Roadmap to a Resource Efficient Europe (COM(2011) 571): By 2020, EU policies take into account their direct and indirect impact on land use in the EU and globally, and the rate of land take is on track with an aim to achieve no net land take by 2050; soil erosion is re-duced and the soil organic matter increased, with remedial work on contaminated sites well underway.
European Landscape Convention (2000) (European Treaty Series - No. 176) Article 3 – Aims The aims of this Convention are to promote landscape protection, management and planning, and to organise European co-operation on landscape issues.
Land take (CSI 014/LSI 001) - Assessment published Feb 2011
Does the NWE-Programme positively / negatively contribute to land take?
Biodiversity, Fauna, Flora
Our life insurance, our natural capital: An EU biodiversity strategy to 2020 (COM(2011) 24): 2050 vision
By 2050, European Union biodiversity and the ecosystem services it provides — its natural capital — are protected, valued and appro-priately restored for biodiversity's intrinsic value and for their essen-tial contribution to human wellbeing and economic prosperity, and so that catastrophic changes caused by the loss of biodiversity are avoided.
2020 headline target Halting the loss of biodiversity and the degradation of ecosystem
Species diversity (CSI 009) - As-sessment published Nov 2005
Designated areas (CSI 008) - Assessment published Mar 2009
Exposure of ecosystems to acidi-fication, eutrophication and ozone (CSI 005) - Assessment published Nov 2012
Land take (CSI 014/LSI 001) - Assessment published Jun 2013
Does the NWE-Programme positively / negatively contribute to halt the loss of biodiversity and the degradation of eco-system services?
Does the NWE-Programme positively / negatively contribute to the progress with the national designation of protected areas as a tool for biodiversity conserva-tion?
Does the NWE-Programme positively / negatively contribute to reach the targets

| 12
Environmental Is-sues
Environmental Objectives and Targets
Indicators Source: European Environment Agency - Indicators and fact sheets about Europe's environment - Website 10.3.2014
Assessment Question
services in the EU by 2020, and restoring them in so far as feasible, while stepping up the EU contribution to averting global biodiversity loss.
Target 1: Fully implement the Birds and Habitats Directive Target 2: Maintain and restore ecosystems and their services Target 3: Increase the contribution of agriculture and forestry to
maintain and enhancing biodiversity Target 4: Ensure the sustainable use of fisheries resources Target 5: Combat invasive alien species Target 6: Help avert global biodiversity loss
Roadmap to a Resource Efficient Europe (COM(2011) 571): By 2020 natural capital and ecosystem services will be properly valued and accounted for by public authorities and businesses. By 2020 the loss of biodiversity in the EU and the degradation of eco-system services will be halted and, as far as feasible, biodiversity will be restored.
for reducing the exposure of ecosystems to acidification, eutrophication and ozone?
Does the NWE-Programme positively / negatively contribute to land take?
Water
Roadmap to a Resource Efficient Europe (COM(2011) 571): By 2020, all WFD River Basin Management Plans (RBMPs) have long been implemented. Good status – quality, quantity and use - of waters was attained in all EU river basins in 2015. The impacts of droughts and floods are minimised, with adapted crops, increased water reten-tion in soils and efficient irrigation. Alternative water supply options are only relied upon when all cheaper savings opportunities are taken. Water abstraction should stay below 20% of available renewable wa-ter resources. By 2020, good environmental status of all EU marine waters is achieved, and by 2015 fishing is within maximum sustainable yields.
The EU Water Framework Directive - integrated river basin manage-ment for Europe (Directive 2000/60/EC): All surface and groundwater bodies in river basins achieve 'good status' by 2015.
Emission intensity of manufac-turing industries in Europe (WREI 003) - Assessment pub-lished Feb 2014
Emission intensity of domestic sector in Europe (WREI 002) - Assessment published Feb 2014
Use of freshwater resources (CSI 018) - Assessment published Dec 2010
Urban waste water treatment (CSI 024) - Assessment published Jan 2013
Does the NWE-Programme positively / negatively contribute to decoupling emis-sion to water of nutrients and heavy met-als by manufacturing from economic growth?
Does the NWE-Programme positively / negatively contribute to decoupling emis-sion to water of nutrients and heavy met-als by the domestic sector from urban and population growth?
Does the NWE-Programme positively / negatively contribute to sustainable water use?
Does the NWE-Programme positively /

| 13
Environmental Is-sues
Environmental Objectives and Targets
Indicators Source: European Environment Agency - Indicators and fact sheets about Europe's environment - Website 10.3.2014
Assessment Question
negatively contribute to the target of the EU Water Framework Directive “All sur-face and groundwater bodies in river basins achieve 'good status' by 2015”?
Soil
Roadmap to a Resource Efficient Europe (COM(2011) 571): By 2020, EU policies take into account their direct and indirect impact on land use in the EU and globally, and the rate of land take is on track with an aim to achieve no net land take by 2050; soil erosion is re-duced and the soil organic matter increased, with remedial work on contaminated sites well underway.
Thematic Strategy for Soil Protection (COM(2006) 231) The overall objective is protection and sustainable use of soil, based on the following guiding principles: (1) Preventing further soil degradation and preserving its functions:
– when soil is used and its functions are exploited, action has to be taken on soil use and management patterns, and
– when soil acts as a sink/receptor of the effects of human activi-ties or environmental phenomena, action has to be taken at source.
(2) Restoring degraded soils to a level of functionality consistent at least with current and intended use, thus also considering the cost implications of the restoration of soil.
Land take (CSI 014/LSI 001) - Assessment published Jun 2013
Soil erosion (CLIM 028) - As-sessment published Nov 2012
Exposure of ecosystems to acidi-fication, eutrophication and ozone (CSI 005) - Assessment published Nov 2012
Does the NWE-Programme positively / negatively contribute to land take?
Does the NWE-Programme positively / negatively contribute to reduce soil ero-sion?
Does the NWE-Programme positively / negatively contribute to reach the targets for reducing the exposure of ecosystems to acidification, eutrophication and ozone?
Air
Roadmap to a Resource Efficient Europe (COM(2011) 571): By 2020, the EU's interim air quality standards will have been met, including in urban hot spots, and those standards will have been up-dated and additional measures defined to further close the gap to the ultimate goal of achieving levels of air quality that do not cause signifi-cant impacts on health and the environment.
Thematic Strategy on Air Pollution (2005) (COM(2011) 571): Compared with the situation in 2000, the Strategy sets specific long
Exposure of ecosystems to acidification, eutrophication and ozone (CSI 005) - Assess-ment published Nov 2012
Exceedance of air quality limit values in urban areas (CSI 004) - Assessment published Oct 2013
Does the NWE-Programme positively / negatively contribute to reduce concen-trations of air pollutants in urban areas?
Does the NWE-Programme positively / negatively contribute to reduce emis-sions of acidifying substances, particu-lates and ozone precursors from trans-port?

| 14
Environmental Is-sues
Environmental Objectives and Targets
Indicators Source: European Environment Agency - Indicators and fact sheets about Europe's environment - Website 10.3.2014
Assessment Question
term objectives (for 2020):
47 % reduction in loss of life expectancy as a result of exposure to particulate matter;
10 % reduction in acute mortalities from exposure to ozone.
43 % reduction in areas or ecosystems exposed to eutrophica-tion.
reduction in excess acid deposition of 74 % and 39 % in forest areas and surface freshwater areas respectively.
Transport emissions of air pol-lutants (TERM 003) - Assess-ment published Feb 2013
Emissions of primary particu-late matter and secondary par-ticulate matter precursors (CSI 003/APE 009) - Assessment published Dec 2012
Emissions of ozone precursors (CSI 002/APE 008) - Assess-ment published Dec 2012
Does the NWE-Programme positively / negatively contribute to reduce the ex-posure of ecosystems to acidification, eutrophication and ozone?
Global Climate
Greenhouse Gas Emission “20-20-20 targets” Europe 2020 strategy (COM(2010) 2020) Reduce emissions to 20 % below 1990 levels by 2020
A Roadmap for moving to a competitive low carbon economy in 2050 (COM(2011) 571): Milestones: 40 % by 2030, 60 % by 2040 and to 80 % by 2050 below 1990
Atmospheric greenhouse gas concentrations (CSI 013/CLIM 052) - Assessment published Feb 2014
Greenhouse gas emission trends (CSI 010/CLIM 050) - Assessment published May 2013
Does the NWE-Programme contribute to reduce greenhouse gas emission?
Renewable Energy Directive 2009/28/EC Increase renewable energy to at least 20 % of final energy consump-tion by 2020
Share of renewable energy in final energy consumption (ENER 028) - Assessment published Mar 2013
Does the NWE-Programme positively / negatively contribute to raise the share of renewable energy in final energy con-sumption?
Energy Efficiency Energy efficiency action plan (COM(2006)545), '20-20-20' targets Europe 2020 strategy (COM(2010) 2020), Energy Efficiency Directive (Directive 2012/27/EU): Reduce consumption of primary energy by 20 % compared to energy consumption projections for 2020
Directive on the Energy Performance of Buildings (Directive
Progress on energy efficiency in Europe (ENER 037) - Assessment published Mar 2013
Does the NWE-Programme positively / negatively contribute to progress on en-ergy efficiency?
| 15
Environmental Is-sues
Environmental Objectives and Targets
Indicators Source: European Environment Agency - Indicators and fact sheets about Europe's environment - Website 10.3.2014
Assessment Question
2010/31/EU): All new buildings occupied and owned by public authorities are 'nearly zero-energy' buildings by 2019 All new buildings are 'nearly zero-energy' buildings by 2020
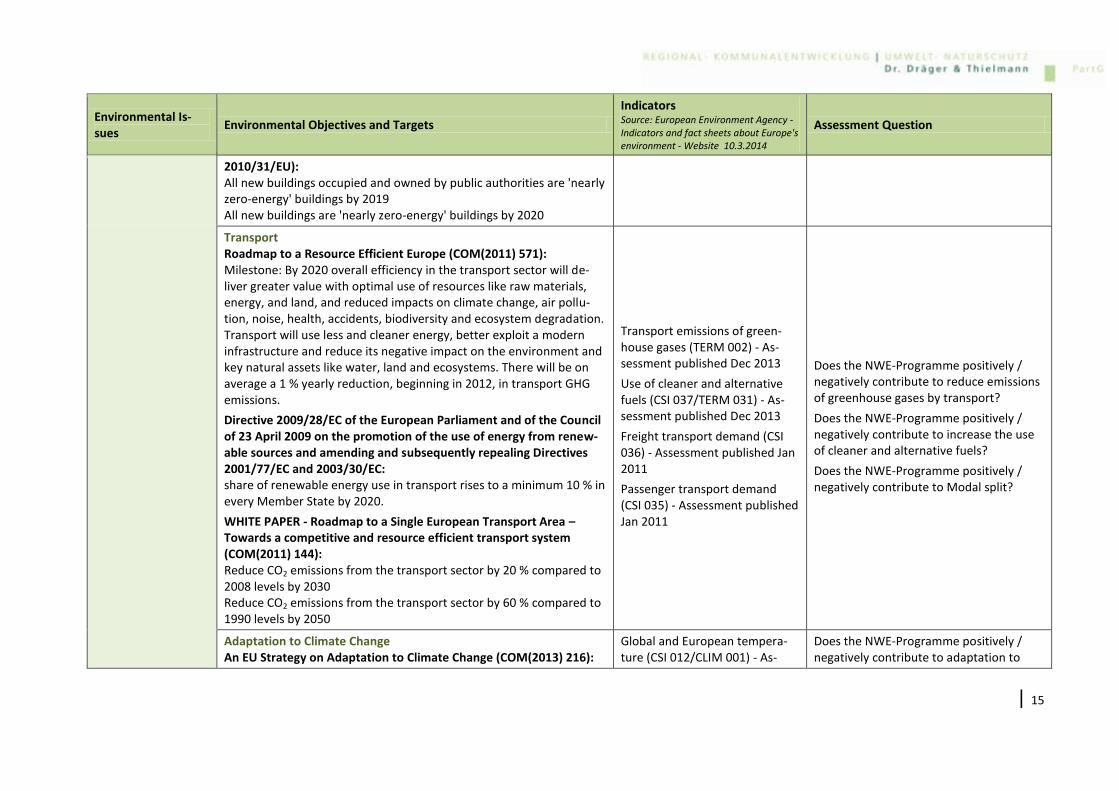
Transport Roadmap to a Resource Efficient Europe (COM(2011) 571): Milestone: By 2020 overall efficiency in the transport sector will de-liver greater value with optimal use of resources like raw materials, energy, and land, and reduced impacts on climate change, air pollu-tion, noise, health, accidents, biodiversity and ecosystem degradation. Transport will use less and cleaner energy, better exploit a modern infrastructure and reduce its negative impact on the environment and key natural assets like water, land and ecosystems. There will be on average a 1 % yearly reduction, beginning in 2012, in transport GHG emissions.
Directive 2009/28/EC of the European Parliament and of the Council of 23 April 2009 on the promotion of the use of energy from renew-able sources and amending and subsequently repealing Directives 2001/77/EC and 2003/30/EC: share of renewable energy use in transport rises to a minimum 10 % in every Member State by 2020.
WHITE PAPER - Roadmap to a Single European Transport Area – Towards a competitive and resource efficient transport system (COM(2011) 144): Reduce CO2 emissions from the transport sector by 20 % compared to 2008 levels by 2030 Reduce CO2 emissions from the transport sector by 60 % compared to 1990 levels by 2050
Transport emissions of green-house gases (TERM 002) - As-sessment published Dec 2013
Use of cleaner and alternative fuels (CSI 037/TERM 031) - As-sessment published Dec 2013
Freight transport demand (CSI 036) - Assessment published Jan 2011
Passenger transport demand (CSI 035) - Assessment published Jan 2011
Does the NWE-Programme positively / negatively contribute to reduce emissions of greenhouse gases by transport?
Does the NWE-Programme positively / negatively contribute to increase the use of cleaner and alternative fuels?
Does the NWE-Programme positively / negatively contribute to Modal split?
Adaptation to Climate Change An EU Strategy on Adaptation to Climate Change (COM(2013) 216):
Global and European tempera-ture (CSI 012/CLIM 001) - As-
Does the NWE-Programme positively / negatively contribute to adaptation to

| 16
Environmental Is-sues
Environmental Objectives and Targets
Indicators Source: European Environment Agency - Indicators and fact sheets about Europe's environment - Website 10.3.2014
Assessment Question
The overall aim of the EU Adaptation Strategy is to contribute to a more climate-resilient Europe. This means enhancing the prepared-ness and capacity to respond to the impacts of climate change at local, regional, national and EU levels, developing a coherent approach and improving coordination.
sessment published Aug 2013
Floods and health (CLIM 046) - Assessment published Nov 2012
River flow drought (CLIM 018) - Assessment published Nov 2012
Damages from weather and climate-related events (CLIM 039) - Assessment published Nov 2012
Storm surges (CLIM 045) - As-sessment published Dec 2013
Storms (CLIM 005) - Assessment published Nov 2013
Climate Change concerning (concerning human health, biodiversity, soil erosion, floods, droughts, damages from extreme weather)
Material Assets, Cultural Heritage
including Architec-tural and Archaeo-
logical Heritage
Treaty of Lisbon (2007): Article 3.3. “(…) The Union shall respect its rich cultural and linguistic diversity, and shall ensure that Europe’s cultural heritage is safe-guarded and enhanced”.
European Convention on the Protection of the Archaeological Heri-tage (Revised), Valetta, 16.I.1992 Article 1: The aim of this (revised) Convention is to protect the ar-chaeological heritage as a source of the European collective memory and as an instrument for historical and scientific study. To this end shall be considered to be elements of the archaeological heritage all remains and objects and any other traces of mankind from past epochs: the preservation and study of which help to retrace the history of
mankind and its relation with the natural environment; for which excavations or discoveries and other methods of re-
search into mankind and the related environment are the main sources of information; and
--
Does the NWE-Programme positively / negatively contribute positive or negative to “Material Assets, Cultural Heritage including Architectural and Archaeological Heritage”?

| 17
Environmental Is-sues
Environmental Objectives and Targets
Indicators Source: European Environment Agency - Indicators and fact sheets about Europe's environment - Website 10.3.2014
Assessment Question
which are located in any area within the jurisdiction of the Parties. The archaeological heritage shall include structures, constructions, groups of buildings, developed sites, moveable objects, monuments of other kinds as well as their context, whether situated on land or under water.
Resource Efficiency
Roadmap to a Resource Efficient Europe (COM(2011) 571): By 2020, market and policy incentives that reward business invest-ments in efficiency are in place. These incentives have stimulated new innovations in resource efficient production methods that are widely used. All companies, and their investors, can measure and benchmark their lifecycle resource efficiency. Economic growth and wellbeing is decoupled from resource inputs and come primarily from increases in the value of products and associated services. By 2020, waste is managed as a resource. Waste generated per capita is in absolute decline. Recycling and re-use of waste are economically attractive options for public and private actors due to widespread separate collection and the development of functional markets for secondary raw materials. More materials, including materials having a significant impact on the environment and critical raw materials, are recycled. Waste legislation is fully implemented. Illegal shipments of waste have been eradicated. Energy recovery is limited to non recy-clable materials, landfilling is virtually eliminated and high quality recycling is ensured.
Ecological Footprint of European countries (SEBI 023) - Assess-ment published May 2010
Waste electrical and electronic equipment (waste 003) - As-sessment published Jun 2013
Generation and recycling of packaging waste (CSI 017/waste 002) - Assessment published Nov 2012
Municipal waste generation (CSI 016/waste 001) - Assessment published Dec 2011
Does the NWE-Programme positively / negatively contribute to increase recycling rates?
Does the NWE-Programme positively / negatively contribute to circular econ-omy?
Does the NWE-Programme positively / negatively contribute to decoupling re-source consumption from economic growth?

| 18
4 EXISTING ENVIRONMENTAL PROBLEMS AND TRENDS OF THE ENVIRONMENTAL
DEVELOPMENT
The following text provides a brief and concise review of the state and development of the environ-
mental issues relevant for the NWE-Programme. The main sources for the environmental data and
information integrated in this report are:
Interreg IVB (2013): SWOT-analysis for the smart, sustainable and inclusive growth objectives. A
reviewed SWOT-analysis for North West Europe, presented according to the main objectives of
the Europe 2020 Strategy and the thematic objectives of the CSF-funds regulation - Main Report.
EEA: website
EEA (2010): “The State and Outlook of the European Environment Report (SOER)”, an EEA flag-
ship assessment.
EEA (2013): Report - Trends and projections in Europe 2013 - Tracking progress towards
Europe's climate and energy targets until 2020
Eurostat, European Commission (2013): Pocketbook - Energy, transport and environment indica-
tors.
European Commission (2014): Sustainable development in the European Union - 2013 monitor-
ing report of the EU sustainable development strategy (Eurostat Statistical Books)
Tables in front of the sub-chapters:
The report on “Sustainable development in the European Union - 2013 monitoring report of the EU
sustainable development strategy” (2014) provides 12 ’headline indicators’ which reflect the results
of the progress evaluation since 2000. They are intended to give an overall picture whether the EU
has achieved progress towards sustainable development in terms of the objectives and targets de-
fined in the EU Sustainable Development Strategy. As far as they are relevant for the environmental
issues assessed in this report, these headline indicators are shown in tables placed in front of the
correspondent sub-chapters.
Graphic 2: Categories and associated symbols for the evaluation of the indicators
(European Union (2013): Sustainable development in the European Union P. 24)

| 19
The Categories and associated weather symbols for the evaluation of the indicators are shown in
Graphic 2. The tables show different types of indicators:
Level 1: Overall objectives
they are related to the seven key challenges of the EU SDS. On the whole they are widely used
indicators with a high communicative and educational value. They are robust and available for
most EU Member States, generally for a period of at least five years.
Level 2: Operational objectives and targets
these indicators related to the ‘operational objectives’ of the Strategy. They are the lead indica-
tors in their respective sub-themes. They are robust and available for most EU Member States
for a period of at least three years.
Level 3 Actions/explanatory variables
indicators related to actions described in the strategy or to other issues which are useful for ana-
lysing progress towards its objectives. Breakdowns of higher level indicators, for example by
gender or income group, are usually also found at level 3. 19
For more information see the report: Sustainable development in the European Union (2013).
Graphic 3: Evaluation of changes in the public health theme (EU-27, from 2000)
(European Union (2013): Sustainable development in the European Union; p. 157)
POPULATION / HUMAN HEALTH
Human health depends on different factors, as socio-economic criteria (like income, health care,
education). But also a clean environment is essential for human health; this report will reflect envi-
ronmental aspects exclusively. The major environment-related health concerns are related to out-
door and indoor air pollution, poor water quality, poor sanitation and hazardous chemicals. All envi-
ronmental issues, which are assessed in this report, show interdependencies to human health, as for
example man made emission pollutes water and polluted water threatens human health. As emis-
sions and pollution may increase with production, to move towards a more sustainable economic
growth is essential for public health, i.e. transition to green economy.
Climate Change can multiply risks and existing health problems. Its impacts can affect human health
in different ways:
19
European Union (2013): Sustainable development in the European Union; p. 22

| 20
directly as for example by heat waves, floods or the extend of the Asian tiger mosquito
indirectly through changes in water, air and food quality and quantity, ecosystems, agriculture,
livelihoods and infrastructure.20
Therefore, potential health effects depend on population’s vulnerability and the ability to adapt.
The key trends in public health are summarized in the report “Sustainable development in the Euro-
pean Union” as follows21:
Improvements in life-expectancy not leading to longer life in good health
Improvements in health indicators slowing since the onset of the economic crisis, and health
inequalities persist
No or insufficient improvements in health determinants such as toxic chemical production
and exposure to air pollution.
The SWOT-analysis for NWE-area summarizes the key facts concerning health in NWE and stresses
the connection of many respiratory diseases with air pollution, which makes this topic transnationally
relevant.22
LANDSCAPE
Landscape represents a multifunctional resource capable of delivering a wide range of environmental
and quality of life benefits, including maintaining and improving ecological functions. In Europe most
landscapes are transformed into man-made environments and also reflect economic, cultural, his-
torical and aesthetic aspects.
Europe is one of the most intensively used continents on the globe, with the highest share of land
used for settlement, production systems (including agriculture and forestry) and infrastructure (up to
80 %).23 Annually, more than 1,000 km² are subject to land take for housing, industry, roads or rec-
reation.24 Land take causes change of the use of land as well as fragmentation of land and affects
biodiversity by the expansion of different areas of human activity.
In the last years urban sprawl seemed to be slowing: artificial land cover, such as roads and build-
ings, increased 2.3 % per year between 1990 and 2000, but this rate fell to 1.5 % between 2000
and 2006.25 The last assessment of land take in Europe for the period 2000-2006 showed that in general more forests, natural grasslands and open spaces were taken by artificial land development then in the previous decade. This meant a higher loss of natural ecosystems.26
Accordant to the population density the Benelux countries show the highest shares of artificial areas in total land area in the NWE region.27
The SWOT-analysis for NWE gives a detailed overview of land cover features, changes in land use and
landscape diversity in NWE28 and stresses the importance of this topic: “Addressing the challenge of
increasing urban land use and growing soil sealing as well as of a further fragmentation of landscapes
and of a loss of biodiversity in NWE is thus also a core issue of relevance for transnational co-
20
EEA Climate change and health is an emerging challenge for Europe (website 6.3.2014) http://www.eea.europa.eu/soer/synthesis/synthesis/chapter5.xhtml
21 European Union (2013): Sustainable development in the European Union; p. 13
22 Interreg IVB (2013): SWOT-analysis for North West Europe, Main report; p. 63
23 EEA: Landuse, website 8.3.2014 http://www.eea.europa.eu/themes/landuse
24 European Commission 2011: Roadmap to resource efficient Europe (COM(2011) 571), p.15
25 EEA: Urban sprawl eating into wildlife habitats in Europe, website 8.3.2014 http://www.eea.europa.eu/highlights/urban-
sprawl-eating-into-wildlife 26
EEA (Website 5.3.2014) Land take http://www.eea.europa.eu/data-and-maps/indicators/land-take-2/assessment-2 27
Eurostat (2013): Sustainable development in the European Union P. 232 28
Interreg IVB (2013): SWOT-analysis for North West Europe, Main report; p. 39-40

| 21
operation, which could be addressed best through designing and implementing large-scale or place-
based integrated policy approaches helping to balance sector demands on land and to manage land
use in a sustainable manner, both in the urbanised and in the less urbanised areas.”29
Graphic 4 captures some of the complexity of the multiple demands on land resources, with urban
sprawl, agricultural intensification and land abandonment exerting pressures on biodiversity and
water resources.
Graphic 4: Indicative map of combined environmental challenges related to land use
EEA: Data and maps website 10.3.2014
29
Interreg IVB (2013): SWOT-analysis for North West Europe, Main report; p. 40

| 22
FLORA, FAUNA, BIODIVERSITY
“From the depths of oceans to the highest summits, from icy waters to baking deserts, life flourishes in every corner of our planet. We are currently witnessing a steady loss of biodiversity, with profound consequences for the natural world and for human well-being.” 30
Changes in land use and land cover due to growing human demands for food, renewable energy and infrastructure are key factors behind biodiversity decline (see also sub-chapter “landscape”).
Where does Europe stand in 2010 with biodiversity?
Species faced with the risk of extinction Up to 25% of European animal species, including mammals, amphibians, reptiles, birds and butterflies face the risk of extinction and are therefore included in the EU Regional Red List by IUCN.
Poor conservation status 62% of the habitats and 52% of the species covered by the EU Habitats Directive are considered to be in an unfavourable conservation status (EEA-ETC/BD, 2009).
Natura 2000 site designation - nearly completed Designation of Natura 2000 terrestrial sites in Europe is nearly completed. Much more effort is needed for the marine sites (EEA-ETC/BD, 2010).
Source: EEA: biodiversity, website 10.3.2014
The EEA (2010) assessed status and trend regarding the EU biodiversity objectives as follows:
The EU missed its objective “To halt the loss of biodiversity by 2010 – and beyond” and all re-spective efforts are still insufficient. For example: Although the total area of nationally desig-nated protected areas and Natura 2000 areas increased, the loss of biodiversity is not stopped yet and the EU failed to achieve its 2010 biodiversity target. The trend is still negative.
Europe is not on the track to meet the 2020 objective “To halt the loss of biodiversity”, terres-trial as well as marine with negative development (decreasing trend).
Regarding the objective “To achieve favourable conservation status, set up Natura 2000 net-work”, the progress is different across the EU, but the overall problem remains with stable trend.31
Climate change is projected to play a substantial role in biodiversity loss and puts terrestrial as well
as aquatic ecosystem functions at risk. Also migration of species and the invasion of alien species into
the eco-systems because of climate change cause dramatic changes in the biotopes.
Birds are a good indicator to monitor the overall status of biodiversity: they reflect environmental changes in ecosystems rather rapidly because they are at, or close to the top of the food chain.32
Between 2000 and 2011 the index of all common birds in Europe remained relatively stable. But
there is an important difference between the developing of forest birds and farmland birds: forest
birds increased by 9.7 percentage points between 2000 and 2011, farmland birds continued to de-
crease dramatically and reached an all-time low in 2010.33 In the NWE region Germany and the
United Kingdom showed the highest annual average rates of decline of the common farmland birds
(see Graphic 5).
Changes in agricultural methods, intensification and specialisation are mainly responsible for the
decline of “High Nature Value Farmland” and farmland bird in Northern and Western Europe. Fur-
30
EEA: Biodiversity Baseline: where do we stand? website 10.3.2014, http://www.eea.europa.eu/themes/biodiversity/where-
we-stand 31
EEA 2010: The European Environment, State and Outlook, Synthesis, p.18 32
European Union (2013): Sustainable development in the European Union; p. 223 33
European Union (2013): Sustainable development in the European Union; p. 221

| 23
thermore, rising demand for biomass for bio-energy production has led to a significant increase in
cultivation of high-input crops such as corn and rape, which has resulted in additional threats to bio-
diversity and ecosystem functions.34
Graphic 5: Farmland bird index by EU Member States
(European Union (2013): Sustainable development in the European Union, p. 221)
WATER
Water quality is closely linked to human health and biodiversity. Furthermore it is in manifold ways
essential for human life.
The European Water Framework Directive (WFD) (2000/60/EC) aims to protect “water” by an inte-
grated, all-embracing ‘ecosystem-based approach’. Water ecosystems shall be protected equally in
terms of water quality, water quantity, and their role as habitats. The achievement of these objec-
tives are supported by the Blueprint to safeguard Europe’s water resources (SWD (2012) 382) which
propose packages to improve management and knowledge of water protection.
During the last 25 years, significant progress has been made in numerous European waters in reduc-
ing the pollution. This progress includes improved wastewater treatment, reduced volumes of indus-
trial effluents, reduced use of fertilizers, reduced or banned phosphate content in detergents, as well
as reduced atmospheric emissions.35
Nevertheless, more than 50 % of the surface water bodies in Europe are still in less than good eco-
logical status or potential. Concerning ecological status and pressures in freshwater the worst areas
of Europe are in Central and North-Western Europe. For coastal and transitional waters, the Baltic
Sea and Greater North Sea regions are most negatively affected. Poor chemical status for groundwa-
ter, by area, was stated for 25 % across Europe. Referring to rivers, lakes, and transitional and coastal
waters, poor chemical status does not exceed 10 % in whole Europe. Admittedly the chemical status
of many of Europe's surface waters - ranging between one third of the lakes and more than half of
transitional waters - remains unknown.36
In 2010, the EEA assessed status and trend regarding the EU water quality objective as follows:
34
European Union (2013): Sustainable development in the European Union; p. 222 35
EEA (2012): European waters - assessment of status and pressures, p.8 36
EEA (2012): European waters - assessment of status and pressures, p. 8-9

| 24
Regarding the objective “To achieve good ecological and chemical status of water bodies” as well as
concerning water exploitation and the objective “To achieve good quantitative status of water bod-
ies” the EU is attested a “mixed progress” by remaining overall problem and stable trend.37
“Pollution of rivers and lakes and other freshwater resources is still an important issue in NWE which should
be addressed by transnational co-operation. NWE is the part in the EU where the annual diffuse agricultural
emissions of nitrogen to freshwater are most significant. The core areas with the highest values are the
South of Ireland, Northern Ireland, Wales and the South-West and North-West of England in the UK, Bre-
tagne and Normandy in France, most of the Netherlands and the bordering provinces and regions in Belgium
and Germany. The annual average nitrate river concentration was highest in the river basin districts in the
East of England, followed at a still high level by the river basin districts in many other parts of England, in
western France, Belgium, Luxembourg and smaller parts along the German north-western border”.
Interreg IVB (2013): SWOT-analysis for North West Europe, Main report; p. 39)
In most NWE Partner States decoupling of manufacturing industries emissions into waters from the
GVA (gross value added) is observed, resp. decrease in emission coupled with decrease in GVA.38
“Absolute decoupling of nutrient emissions (as an indicator for of potential water pollution) from
domestic sector and the population growth over the period of almost two decades (1990-2009) is
observed in thirteen countries (Austria, Belgium, Czech Republic, Germany, Greece, Finland, Ireland,
Switzerland, the Netherlands, Norway, Portugal, Slovenia and Turkey). The actual extent of decoup-
ling, and the differences in trends among countries, may be partially explained by different levels of
numbers of inhabitants connected to tertiary wastewater treatment technologies.” 39
Graphic 6: Water Exploitation Index (WEI)40 for the NWE Partner States
http://www.eea.europa.eu/data-and-maps/figures/water-exploitation-index-wei-3 (06.03.2014)
37
EEA 2010: The European Environment State and outlook, Synthesis; p.19 EEA 2013: “Towards a green economy in Europe”, p.6
38 EEA website 6.3.2014 http://www.eea.europa.eu/data-and-maps/indicators/emission-intensity-of-manufacturing-
industries/assessment 39
EEA website 7.3.2014 http://www.eea.europa.eu/data-and-maps/indicators/emission-intensity-of-domestic-sector/assessment 40
The Water Exploitation Index (WEI) describes annual total water abstraction as a percentage of available long-term freshwater resources: “The warning threshold for the WEI, which distinguishes a non-stressed from a stressed region, is around 20 % (Raskin et al. 1997). Severe water stress can occur where the WEI ex-ceeds 40 %, indicating unsustainable water use.”http://www.eea.europa.eu/data-and-maps/indicators/use-of-freshwater-resources/use-of-freshwater-resources-assessment-2 (06.03.2014)
0
0,05
0,1
0,15
0,2
0,25
0,3
0,35
0,4
Belgium
Franc
e
Ger
man
y
Ireland
Luxe
mbo
urg
Net
herla
nds
Swirt
zerla
nd
Uni
ted
Kingd
om*
WEI-1990
WEI-2002
WEI-2005
WEI-latest year

| 25
Total water abstraction decreased over the past decade in most regions of Europe as well as in NWE;
Belgium made significant progress towards more sustainable water management.41 Though NWE-
countries show big differences: Between 2000 and 2011 in NWE, the highest increase in total ab-
straction of fresh surface water per capita were recorded in the Netherlands (17 % in 2001-10), while
the highest decreases were recorded in the United Kingdom (– 41 %).42
Wastewater treatment in all parts of Europe has improved during the last 15-20 years. In NWE the
share of population connected to wastewater treatment is higher than in other parts of Europe.43
SOIL
Soil is one of the planet's invaluable resources but its degradation continues in Europe. The mineral
particles, water, air, organic matter, and living organisms that constitute soil perform key functions
which underpin our society.44 “The unsustainable use and management of land is leading to in-
creased soil degradation and the loss of a key resource that is fundamental to life on the planet.”45
Despite its importance for our society, and unlike air and water, there is no EU legislation specifically
targeting the protection of soil.
Land take causes soil sealing (see sub-chapter “landscape”), air pollution causes acidification and
eutrophication of soils (see below “air”).
For Europe there is no systematic data collection concerning soil erosion. But it is estimated that the
surface area in the EU‐27 (excluding Greece, Cyprus and Malta, which lack CORINE land cover data
for 2006) affected by water erosion sums up to 130 million ha. Wind erosion is estimated to be a
serious problem in many parts of eastern England, north-western France, northern Germany, parts of
the Iberian Peninsula and the eastern Netherlands.46
Soil erosion depends on land use; it may also increase in the course of climate change, caused by
changing rain patterns, storm and floods (as could be observed recently at the Channel coast of the
United Kingdom).
The EEA (2010) assessed status and trend regarding the EU soil objective as follows:
EU is not on the track to achieve the objective “To prevent further soil degradation and pre-
serve its functions”. The development is also stated negative (increasing trend).47
41
European Union (2013): Sustainable development in the European Union; p.15 42
Eurostat: Energy, transport and environment indicators; p. 209 43
EE: urban waste water treatment: website 7.3.2014 http://www.eea.europa.eu/data-and-maps/indicators/urban-waste-water-
treatment/urban-waste-water-treatment-assessment-3 44
EEA: Soil, website 8.3.2014 http://www.eea.europa.eu/themes/soil 45
EEA 2012: The State of Soil in Europe, p.4 46
EEA: Soil erosion, website 10.3.2014, http://www.eea.europa.eu/data-and-maps/indicators/soil-erosion-by-water-1/assessment 47
EEA 2010: The European Environment, State and outlook, Synthesis, p.18

| 26
Graphic 7. Estimated years of life lost (YOLL) in reference year 2005 attributable to long-term
PM2.5 exposure
(EEA Website 6.3.2014, EEA, ETC Air and Climate Change,
http://www.eea.europa.eu/soer/synthesis/synthesis/chapter5.xhtml)
Graphic 8: Annual changes in concentrations of PM10, O3 and NO2 in the period 2001–2010
(EEA Website 3.5.2014 http://www.eea.europa.eu/publications/air-quality-in-europe-2013)

| 27
AIR
Air pollution is a major environmental risk to human health and also harms the environment. In
Europe, emissions of many air pollutants have declined over the past decades, resulting in improved
air quality across the region. But air pollutant concentrations are still too high, and air quality prob-
lems persist. A significant proportion of Europe’s population live in areas, especially urban areas,
where exceedances of air quality standards occur.48
As the actual report on air quality in EU states, the main air pollutants in Europe declined in the con-
sidered period 2002–2011. But nonetheless, particulate matter, organic pollutants and ozone are still
Europe's most problematic pollutants in terms of harm to human health. Thus the report stresses:
“Particulate Matter (PM) and Ozone (O3) pollution are particularly associated with serious health
risks, and exposure to high levels of organic pollutants, in particular PAHs (PAHs: a type of carcino-
genic substances) is a growing health concern in Europe.”49
Graphic 7 shows that the population in the most parts of NWE are affected by pollution of particular
matter as an example for air pollution. Although the concentration of PM10 is declining, in NWE still
serious health risks are persisting connected with air pollution.
Graphic 9: Atmospheric emissions, EU-27
(European Union (2013): Sustainable development in the European Union; p. 84)
Negative impacts of air pollution on ecosystems are damage to vegetation by ozone, eutrophication
and acidification: “As SO2 emissions have fallen, ammonia (NH3) emitted from agricultural activities,
and nitrogen oxides (NOX - a family of gases that includes nitrogen dioxide - NO2 and nitrogen oxide -
NO) emitted from combustion processes have become the predominant acidifying and eutrophying
air pollutants.”50
48
EEA: Air, website 8.3.2014, http://www.eea.europa.eu/themes/air/intro 49
EEA 2013: Air quality in Europe - 2013 report; p. 9 50
EEA 2013: Air quality in Europe - 2013 report; p. 8

| 28
Air pollution also damages our environment.
Acidification was substantially reduced between 1990 and 2010 in Europe’s sensitive ecosystem areas that were subjected to acid deposition of excess sulphur and nitrogen compounds.
Eutrophication, an environmental problem caused by the input of excessive nutrients into ecosystems, saw less progress. The area of sensitive ecosystems affected by excessive atmospheric nitrogen diminished only slightly between 1990 and 2010.
Crop damage is caused by exposure to high ozone concentrations. Most agricultural crops are exposed to ozone levels that exceed the EU long-term objective intended to protect vegetation. This notably includes a significant proportion of agricultural areas, particularly in southern, central and eastern Europe.
Source: EEA: Air website 10.3.2014
In the period from 1990 to 2010, transport emission driven main pollutants that contribute to acidi-
fication and particulate and ozone formation have shown a decreasing trend in the EEA‑32. The larg-
est percentage decreases over this period have been for CO (76 %) and non-methane volatile organic
compound (NMVOC) (75 %). The decline has occurred in spite of a growth in transport activities. This
trend follows the progressive introduction of tighter Euro emission standards on new road vehicles
supplemented by improvements in fuel quality driven by EU Fuel Quality Directives.51
The EEA (2010) assessed status and trend regarding the EU air pollution objectives as follows:
The EU is related to “Air quality in urban areas (PM and O3)” not on the track to meeting en-
vironmental targets and objectives.52
The EU is related “Pressure on ecosystems (from air pollution, e.g. eutrophication)” not on
the track to meeting environmental targets and objectives.53
GLOBALE CLIMATE
“Climate change is happening now: Temperatures are rising, rainfall patterns are shifting, glaciers
and snow are melting, and the global mean sea level is rising. We expect that these changes will con-
tinue, and that extreme weather events resulting in hazards such as floods and droughts will become
more frequent and intense.”54
Graphic 10: Evaluation of changes in the climate change and energy theme (EU-27, from 2000)
(European Union (2013): Sustainable development in the European Union; p.179)
51
EEA: Transport emissions of air pollutants, website 10.3.2014, http://www.eea.europa.eu/data-and-maps/indicators/transport-emissions-of-air-pollutants-8/transport-emissions-of-air-pollutants-9
52 EEA 2010: The European Environment, State and Outlook, p.19 Synthesis; EEA 2013: Towards a green economy in Eu-
rope, p.6 53
EEA 2010: The European Environment, State and Outlook, p.19 Synthesis; EEA 2013: Towards a green economy in Eu-rope, p.6
54 EEA: Climate Change, Website 19.3.2014, http://www.eea.europa.eu/themes/climate

| 29
Greenhouse Gas Emission
The global average concentrations of various greenhouse gases in the atmosphere remain increasing.
Since 1990 the greenhouse gas emissions in Europe have fallen clearly. The Europe 2020 target re-
ducing the GHG-emission by 20 % compared to 1990 is in reach. Nevertheless the global mean tem-
perature is rising, caused by still rising global emissions.
The global combustion of fossil fuels from human activities and land-use changes are largely respon-
sible for this increase.55 The main sources of man-made GHGs are:
burning of fossil fuels (coal, oil and gas) in electricity generation, transport, industry and
households (CO2);
agriculture (CH4) and land-use changes like deforestation (CO2);
land filling of waste (CH4);
use of industrial fluorinated gases.56
There is no clear trend towards lower energy demand: “After having risen more or less continuously
between 1990 and 2006, primary energy consumption in the EU fell to 1990 levels in 2011. Yet, the
downward trend was not continuous. It remains to be seen if the decline can be maintained once the
EU economy returns to higher economic growth”.57
Graphic 11: Greenhouse gas emissions by NWE Countries: Absolute change 2010-2011
EEA: Greenhouse-gas-emission-trends Website 10.3.2014
55
EEA Website 6.3.2014 http://www.eea.europa.eu/data-and-maps/indicators/atmospheric-greenhouse-gas-concentrations-3/assessment
56 EEA: Climate Change, website 8.3.2014, http://www.eea.europa.eu/themes/climate/intro
57 European Union (2013): Sustainable development in the European Union; p. 14

| 30
The EEA (2010) assessed status and trend regarding the world’s climate objectives as follows:
The world is not on the track, meeting the objective “to limit increases to below 2°C globally”.
The development is negative (increasing trend).58
The EEA-report “Trends and projections in Europe 2013 - Tracking progress towards Europe's climate
and energy targets until 2020” summarizes the latest findings respective Europe’s climate and en-
ergy targets:59
Progress towards 2008–2012 Kyoto targets:
EU is on the track towards its 8 % reduction target. Total average emissions of the EU-15 in the
2008–2012 period have declined by 12.2 % compared to base year levels.
Individual Greenhouse Gas targets of the EU countries:
Almost all European countries with an individual GHG limitation or reduction target under the
Kyoto Protocol (KP) (26 EU Member States, Iceland, Liechtenstein, Norway and Switzerland)
are on track towards achieving their respective targets.
The 20/20/20 objectives:
- 20 % reduction of the EU's GHG emissions compared to 1990:
The EU is very close to reaching its 20 % reduction target, eight years ahead of 2020.
- 20 % share of renewable energy in the EU's gross final energy consumption:
Renewable energies contributed 13 % of gross final energy consumption in the EU-27 in
2011. The EU has therefore met its 10.8 % indicative target for 2011–2012 and is currently
on track towards its target of 20 % of renewable energy consumption in 2020.
- 20 % increase of the EU's energy efficiency:
EU Member States are moving towards the level of ambition required by the Energy Effi-
ciency Directive. Their collective primary energy consumption in 2020 is expected to be
close to the level required by the EU political objective of 1,483 Mtoe (million tonnes of oil
equivalent) but will remain insufficient to achieve the 20 % energy efficiency target.
The NWE countries belong to the major polluters of the EU in terms of greenhouse gas emissions which contribute to global climate change: Germany, the UK and France have the greatest share in the total EU27 greenhouse emission. Reaching the reduction targets established will thus prove to be a difficult task espe-cially in the case of Luxembourg and the Netherlands, given the little decrease which is observed in both countries (in the Netherlands even an increase in emissions is observed between 2005 and 2010). There are, however, significant differences in the national approaches regarding CO2 reduction and the regional and local strategies might even further differ from the national ones and exceed national targets in their ambi-tions. Interreg IVB (2013): SWOT-analysis for North West Europe, Main report; p. 37)
Renewable Energy
The share of renewable energy in final energy consumption in the EU-27 increased between 2005
and 2011 and reached 12.5 % in 2010 representing 60% of the Europe 2020 target (20 %). Renewable
energies represented in 2010, 14.3 % of total final heat consumption, 19.6 % of electricity consump-
tion and 4.7 % of transport fuels consumption. The contribution of biomass is by far the largest, but
wind and solar energy have expanded fastest. The share of renewables used in transport went down
58
EEA 2010: The European Environment State and outlook, Synthesis; p.18 59
EEA 2013: Trends and projections in Europe 2013 - Tracking progress towards Europe's climate and energy targets until 2020, p.10-11

| 31
in 2011 compared to the previous year.60
So the European Union is on the track to reach its target “increase renewable energy to at least 20 %
of final energy consumption by 2020”.
The share of renewable energy in the final energy consumption in NWE differs considerably across
the Partner States (see graphic 12). Efforts are still necessary to reach the respective national targets
set in the Directive on the promotion of the use of energy from renewable sources - Annex 1 for each
EU Member State.
Increasing the share of renewable energies in the production and consumption mix: The share of renew-ables in energy production and consumption is below EU 27 average in all of NWE countries except Germany. Transnational cooperation may bring opportunities in the development of efficient and sustainable transna-tional infrastructures for renewable energy production and distribution (e.g. smart grids). The NWE area is directly concerned by a number of European priority corridors for future infrastructure development in the field of electricity, gas and oil (e.g. North Seas Offshore Grid). It is worth highlighting that NWE coastal re-gions possess a very high potential for wave power generation. In addition, the EU Maritime Strategy for the Atlantic Area provides a valuable basis for the development of joint actions in the field of environmental protection, energy efficiency and renewable energy.
Interreg IVB (2013): SWOT-analysis for North West Europe, Main report; p. 55)
Graphic 12: Share of renewable energy in final energy consumption (FEC) (%)
(http://www.eea.europa.eu/data-and-maps/figures/share-of-renewable-energy-to-7 (06.03.2014))
60
EEA website 7.3.2014 http://www.eea.europa.eu/data-and-maps/indicators/renewable-gross-final-energy-consumption-1/assessment; and European Union (2013): Sustainable development in the European Union; p.14
0
5
10
15
20
25
Belgium
Franc
e
Ger
man
y
Ireland
Luxe
mbo
urg
Net
herla
nds
Switz
erla
nd
Uni
ted
Kingd
om
EU-2
7
2005
2010
Target 2020 EU-Directive

| 32
Energy Efficiency
The indicator “Progress on energy efficiency in Europe” shows, that over the period 1990-2010, en-
ergy efficiency increased by 20 % in EU-27 countries at an annual average rate of 1.1 %/year, driven
by improvements in the industrial sector (1.7 %/year) and households (1.6 %/year)”.61
Increasing resource efficiency: As is the case of other European countries, there is still a significant challenge regarding the de-coupling of economic growth and resource consumption. In the NWE area, part of this solu-tion lies within the optimisation of resource use and consumption through for example industrial symbiosis schemes and the implementation of closed circuits (e.g. water). Increasing resource efficiency can bring about major economic opportunities, improve productivity, drive down costs and boost competitiveness (securing jobs and growth). Transnational cooperation aimed at supporting resource efficiency would be a good complement to Regional Operation programmes which will be strongly focused on renewable energy production and consumption.
Interreg IVB (2013): SWOT-analysis for North West Europe, Main report; p.54)
Transport
A third of all final energy consumption in the EEA member countries and more than a fifth of green-
house gas emissions is caused by transport. Transport in terms of energy consumption trends, is the
fastest growing sector. Transport is also responsible for air pollution, for the fragmentation of the
land witch causes negative effects on biodiversity as well as for negative effects on human health by
noise exposure, but also accidents.62
The annual energy consumption from transport rose continually between 1990 and 2007 in EEA
member countries. Between 2007 and 2009, the total energy demand from transport fell by 4 %, due
to the effects of the economic recession.63
Achieving Europe's targeted 60 % CO2 reduction by 2050 compared with 1990 will require the con-
sumption of oil in the transport sector to drop by around 70 %. The current 96 % oil dependence of
the transport-sector is unsustainable.64
The Report “Sustainable development in the European Union” (2014: P. 14-15) summarizes the
trends in sustainable transport as follows:
No absolute decoupling of energy consumption of transport from economic growth:
Overall, between 2000 and 2011 transport energy use increased by 6.7 %, while economic
growth was faster, with 16.5 %. This implies relative decoupling of energy consumption of
transport from economic growth, but it is uncertain whether this is an ongoing trend or merely
a consequence of the economic crisis.
No substantial change of transport modes and mobility:
Modal split of passenger transport in 2011 remained very similar to its 2000 levels. Freight
transport has shown slight shifts since 2009, with rail regaining its lost share from road trans-
port.
Negative transport impacts yet to be reduced:
- Greenhouse gas emissions from transport still have to decrease
61
EEA website 7.3.2014 http://www.eea.europa.eu/data-and-maps/indicators/progress-on-energy-efficiency-in-europe/assessment
62 EEA: Transport, website 17.1.2014 http://www.eea.europa.eu/themes/transport/intro
63 EEA: Transport, website 17.1.2014 http://www.eea.europa.eu/themes/transport/intro
64 EEA: Transport, website 17.1.2014 http://www.eea.europa.eu/themes/transport/intro

| 33
- road fatalities have continued to fall since 2000, but further efforts need to be imple-
mented to attain the 2020 goal of fewer than 15 500 fatalities (27 000 in 2010).
Concerning the use of biofuels the EEA provides data only for the transport sector. The average share
of renewable energy across the EU-28 consumed in transport between 2010 and 2011 increased
from 3.5 % to 3.8 %. In the NWE Partner States, the extent using biofuels compliant with the Direc-
tive (on the promotion of the use of energy from renewable sources) is quite different, although con-
siderable improvements can be seen since 2005.65
Graphic 13: Share of renewable energy consumed in transport
(EEA: Use of cleaner and alternative fuels, Website 12.3.2014)
Graphic 14: Evaluation of changes in the sustainable transport theme (EU-27, from 2000)
(European Union (2013): Sustainable development in the European Union; p. 199)
65
EEA: Use of cleaner and alternative fuels (CSI 037/TERM 031) website 12.3.2014 http://www.eea.europa.eu/data-and-maps/indicators/use-of-cleaner-and-alternative-fuels/use-of-cleaner-and-alternative-7

| 34
Adaptation to Climate Change
European regions particularly vulnerable to climate change risks include:
Southern Europe and the Mediterranean basin (due to increases in heat waves and droughts);
mountainous areas (due to increasing melting of snow and ice);
coastal zones, deltas and floodplains (due to sea level rises, and increasing intense rainfall, floods
Europe's far North and the Arctic (due to increasing temperatures and melting ice).
An impression of ‘aggregate potential impact of climate change’ for the EU shows graphic 15.
The EEA provides some indicators to estimate the effects of climate change in Europe. The table
shows some findings of the projections (further information at the website of EEA).
Adaptation is needed to protect people, buildings, infrastructure, businesses and ecosystems of con-
sequences of climate change.
The “EU Strategy on adaptation to climate change” focuses on three key objectives: Promoting action
by Member States; climate-proofing action at EU level; and better informed decision-making. Indica-
tors to measure successful and effective adaptations are not defined yet.
Table 3: Indicators of the EEA concerning estimated effects of climate change in Europe
Floods and health (CLIM 046) -
Assessment published Nov 2012
Heavy precipitation events are likely to become more frequent in many
regions in Europe. In the absence of adaptation, river flooding is esti-
mated to affect 250,000 to 400,000 additional people per year in
Europe by the 2080’s, which corresponds to more than a doubling with
respect to the 1961–1990 period. The increase is projected in Central
Europe and the British Isles.
River flow drought (CLIM 018) -
Assessment published Nov 2012
River flow droughts are projected to increase in frequency and severity
in southern and south-eastern Europe, the United Kingdom, France,
Benelux, and western parts of Germany over the coming decades.
Climate change will affect not only water supply but also water demand.
For example for irrigation
Damages from weather and cli-
mate-related events (CLIM 039) -
Assessment published Nov 2012
Although it is currently difficult to determine accurately the proportion
of losses that are attributable to climate change [vi], in view of current
and projected climate change impacts and risks its contribution to
losses is expected to increase.
Storm surges (CLIM 045) - Assess-
ment published Dec 2013
Several climate modelling studies have projected changes in storm
surge height and frequency for the 21st century.
Larger increases in storm surge for the North Sea region during the 21st
century cannot yet be ruled out.
Storms (CLIM 005) - Assessment
published Nov 2013
Climate change projections from a recent climate model ensemble
study show a small increase in extreme wind speeds over northern parts
of Central and Western Europe, and a decrease in Southern Europe. The
results of studies into changes in winter storm tracks show no clear
signal.
EEA: Indicators website 10.3.2014
| 35
Climate change adaptation & risk prevention/management
One among the many challenges and territorial impacts that result out of climate change in Europe is the increase of frequency and scope of extreme natural events and hazards (e.g. sea level rise, river floods, flash floods, storm surges, heat waves, drought and forest fire etc), which then have significant negative impacts on the areas affected (i.e. loss of human lives, physical & material damages, cost for eliminating damages, cause of other associated technological disasters). Recent ESPON research results on climate change and its aggre-gate potential impact (i.e. the ESPON 2013 project “CLIMATE”) show that in NWE high negative impacts can be expected in larger parts of the Netherlands and Belgium and medium-high negative impacts in France, Ireland and several coastal regions in the UK. The NWE coastal regions present a remarkably high potential physical impact as a result from climate change, which relates to the density of physical structures such as settlements, transport infrastructure, thermal power plants and refineries in these areas that are mainly sen-sitive to extreme events.
In the seas that form part of NWE (North Sea, Channel area, Irish Sea, Atlantic), the observed and projected increases in sea surface temperature will lead to the northward movement of species and changes in the distribution of phytoplankton biomass. Coastal flooding has already impacted low-lying NWE coastal areas in the past and the risks are expected to increase due to sea-level rise and an increased risk of storm surges. The NWE regions located at the North Sea are particularly vulnerable to coastal flooding, especially in the United Kingdom, Belgium and the Netherlands. The highest coastal flood damage potential which is expected to exceed 3 billion EUR at individual points is heavily concentrated along the coasts of Belgium and the Nether-lands, whereas along the coasts of the UK and France or Ireland the expected damage potential is most fre-quently below one billion EUR and only at some points ranging between 1 and 2 billion EUR.
River flooding is an extreme natural event that is historically experienced in NWE, but data from the EEA environmental report 2010 shows that more recently (1998-2009) the frequency of flood events was very high in the UK and much less so – although still present – on the continent. Forecasts show that NWE will also in the future remain an EU-wide “hot-spot” for extreme flooding events. Increases in winter precipitation are projected to increase the intensity and frequency of winter and spring river flooding, although to date no increased trends in flooding have been observed. Within NWE, the expected future riverine flood damage potential is strongly concentrated on the UK and on the Dutch and Belgian regions bordering the Scheldt Es-tuary (expected damage potentials ranging from 100 – 280 million EUR).
NWE is also increasingly affected by heat waves which, in the past, had either a general extension (2003, 2006) or a more “localised” character (heat waves 2007 and 2010 in Germany, autumn heat wave 2011 in the UK), leading not only to health problems and human casualties but also to drought affecting the agriculture in the concerned areas.
Extreme natural events resulting out of climate have also a strong urban dimension because European cities are expected to continue to be vulnerable to heat waves, flooding and droughts which may have significant wide-ranging knock-on effects on infrastructures, public health and the economy (i.e. the water, energy, building and transport infrastructures are particularly vulnerable). Flooding is also expected to take place in urban centres due to the high degree of soil sealing, as the percentage of the population living on urban land that might be exposed to potential floods is estimated in several urban areas of NWE (esp. in Belgium, the Netherlands and in the north and east of France) to range between 6-10 % and in some extreme cases even between 10-20 % or above 20 %. Interreg IVB (2013): SWOT-analysis for North West Europe, Main report; p. 37-38)

| 36
Graphic 15: Aggregate potential impact of climate change, 2009

| 37
MATERIAL ASSETS, CULTURAL HERITAGE INCLUDING ARCHITECTURAL AND ARCHAEOLOGICAL
HERITAGE
The EU does not have decision making power in the cultural heritage policy. However, culture and
cultural heritage play a crucial role in at least four of the Europe 2020 flagship initiatives: innovation
union, the digital agenda, an industrial policy for the globalisation era and an agenda for new skills
and jobs.66
IMPORTANT FIELD OF INTERVENTION: RESSOURCE EFFICIENCY
The ecological footprint is an indicator to exemplify sustainability of life and economy. The key ques-
tion is: Are Europeans using more than their share of the world's resources? The answer is clearly
“yes”. The EU-27 on its own has a Footprint of 4.7 global hectares per person, twice the size of its
bio-capacity, for pan- Europe the deficit per person is significantly smaller. Accordantly the EEA
summarizes: “The Ecological Footprint for pan-Europe67 has been increasing almost constantly since
1961, while Europe's bio-capacity68 has decreased. This results in an ever larger deficit, with negative
consequences for the environment within and outside Europe.”69
Most of the NWE Partner States show an ecological footprint between 4 and around 5 global hec-
tares which is similar to the average value of the EU (no data available for Luxembourg). A consider-
able high value can be stated for Ireland: With 6.26 global hectares per person the ecological foot-
print is some three times higher than the average bio-capacity of the EU (around 2 global hectares
per person).70
Graphic 16: The Ecological footprint of NWE Partner States
(http://www.eea.europa.eu/data-and-maps/figures/ecological-footprint-variation-per-region-2005 (06.03.2014))
66
European Commission Website 17.Nov 2013 http://ec.europa.eu/culture/our-policy-development/cultural-heritage_en.htm 67
For this analysis, data from all European countries were used, except for nations that were excluded because of insuffi-cient population (Cyprus, Iceland, Liechtenstein, Luxembourg and Malta) and nations for which data are lacking (Andor-ra, Monaco, San Marino)
68 Bio-capacity: the capacity of ecosystems to produce useful biological materials and to absorb waste materials generated
by humans, using current management schemes and extraction technologies. 69
EEA: Ecological Footprint of European countries (SEBI 023) website 12.3.2014; http://www.eea.europa.eu/data-and-
maps/indicators/ecological-footprint-of-european-countries/ecological-footprint-of-european-countries 70
http://www.eea.europa.eu/data-and-maps/figures/ecological-footprint-variation-per-region-2005
0
1
2
3
4
5
6
7
Belgium
Franc
e
Ger
man
y
Ireland
Luxe
mbo
urg
Net
herla
nds
Switz
erla
nd
Uni
ted
Kingd
om
EU-2
7
Total Footprint

| 38
To improve sustainability transforming the economy onto a resource-efficient path is one of the key
objectives of the European Union. On the way to a “green economy” in Europe it is necessary to re-
build the complex relationship between economy and ecology.
The “Roadmap to Resource Efficient Europe” comprises the most important aspects in order to de-
couple resource use from economic growth:
Sustainable consumption and production
- Improving products and changing consumption patterns
- Boosting efficient production
Turning Waste into a resource
Supporting research and innovation
To phase out environmentally harmful subsidies71
For the years 2000 to 2011, no unambiguous trend was observed to absolute decoupling of material
use from economic growth. A considerable improvement in resource productivity in that period was
seen and the GDP was growing faster than domestic material consumption (DMC). These divergent
trends — GDP growing while DMC falls — imply an absolute decoupling of economic growth from
resource use in the EU between 2000 and 2011. However, it is unclear whether this is an actual turn-
around in resource use patterns or merely a reflection of the impact of the economic crisis on re-
source-intensive industries such as construction.72
Waste Management is very important, because waste may impact human health and the environ-
ment through emissions to air, soil, surface water and groundwater. Waste can also represent loss of
material resources (metals and other recyclable materials), and has potential as an energy source.73
Waste treatment practices have improved considerably in the EU since 2000. In 2011, about 40 % of
municipal waste was recycled or composted.74
Graphic 17: Evaluation of changes in the sustainable consumption and production theme (EU-27,
from 2000)
(European Union (2013): Sustainable development in the European Union; p. 69)
71
European Commission 2011: Roadmap to resource efficient Europe (COM(2011) 571) 72
European Union (2013): Sustainable development in the European Union; p. 9f 73
EEA: Waste, website 8.3.2014 http://www.eea.europa.eu/themes/waste/intro 74
European Union (2013): Sustainable development in the European Union; p. 10

| 39
There is no clear trend towards more sustainable consumption patterns: “Electricity consumption of
households has risen almost continuously since 1990. This trend has been driven mainly by a rise in
the number of households and changes in their consumption patterns, outstripping efficiency im-
provements of electronic devices.”75 On the whole household electricity consumption proved rather
unresponsive to the economic crisis.
Also final energy consumption in the EU has been on the rise since 1990. But 2005 marks a turning
point with energy use stabilising and then falling in the years after. The contractions in the EU econ-
omy in 2009 and 2011 contributed to the drop, pushing final energy consumption in 2011 down to
pre-2000 levels.76
Production patterns have improved in the EU over the past years. The number of organisations im-
plementing a certified environmental management system according to the Eco-Management and
Audit Scheme (EMAS) has grown since 2003.77
In the NWE countries, municipal waste generation between 2003 and 2010 remained in most cases stable (LU, BE) or decreased (IE, NL, DE, UK), but in France and Switzerland one can observe an increase. However, except Belgium, all other NWE countries were in 2010 either significantly (CH, LU, IE) or still clearly (NL, DE, UK, FR) above the European average in terms of municipal waste generation. In order to reduce the environ-mental pressures from landfill (esp. methane emissions and leachates), the EU Directive on the landfill of waste requires Member States to reduce landfill of biodegradable municipal waste to 75 % of the amounts generated in 1995 by 2006, to 50 % by 2009, and to 35 % by 2016. Most of the NWE countries had already met the 2016 target in 2006 (DE, CH, BE, LU, NL) and France was already close by. Only Ireland and the United Kingdom, both with derogation periods, still needed to further reduce landfill of biodegradable municipal waste in order to meet the 2006 target (substantial decrease needed in Ireland). As concerns a recycling of packaging waste, one can observe for 2009 that the rates are highest in Germany, Belgium, Switzerland and the Netherlands (> 65%) and slightly lower in France, Luxembourg Ireland and the UK (55-65%).
Within NWE, the percentage of waste that is recycled is slightly growing year by year. Most waste (relatively speaking) is recycled in Germany and Belgium. In absolute numbers, by far most waste is recycled in Germany, the UK and France.
At regional level, the highest material recycling rate is found in most German regions, especially East‐Germany, and in Belgium regions.
SWOT-analysis for North West Europe, Main report (2013; p. 36)
5 ENVIRONMENTAL EFFECTS OF THE PROGRAMME
5.1 DISCUSSION OF ALTERNATIVES
The NWE-Programme is located at a high strategic level. In principle, at this strategic level possible
alternatives can be seen related to spending the available funds differently as proposed in the Pro-
gramme and to changing the main environmental issues as addressed in the Programme:
For option A it can be said that shifts in the share of funds dedicated to the individual defined
Priorities and Specific Objectives can be seen as alternatives. At present, the Priority 2 (‘Low
Carbon’) receives 39.36 %78 of the available ERDF funds (146 Mio. €), Priority 1 (‘Innovation’)
receives 35.12 % (131 Mio €) while priority 3 (Resource and material efficiency’) receives 25.52
75
European Union (2013): Sustainable development in the European Union; p. 10 76
European Union (2013): Sustainable development in the European Union; p. 10 77
European Union (2013): Sustainable development in the European Union; p. 10 78
The shares of the available ERDF-funds are calculated without the funds for Technical Assistance.

| 40
% (95 Mio. €)79. A higher share for Priority 3 could, of course, increase the possibility to achieve
higher quantity of positive effects in the field of resource and material efficiency. Similar holds
for an increase of funds in favour of Priority 2 which could increase quantity of positive effects
in the field of reduced GHG emissions. However, the principle character of effects of Priorities
2 and 3 will not be changed by re-structuring shares of the available funds on the one side. The
determination of the ‘most appropriate funding of priorities’ is highly arbitrary on the other
side. Reference is made to this alternative in the course of description of the overall environ-
mental effects of the NWE-Programme.
Option B focuses on addressing other environmental issues than the ones defined in the NWE-
Programme, e.g. explicit protection of biodiversity or quality of surface and ground waters. The
defined foci of the NWE-Programme, addressing low carbon economy and resource and mate-
rial efficiency, respond to the environmental needs and structural deficits in the Interreg NWE
area as well as the required thematic concentration on reduction of CO2-emissions (Art. 4, 1(a),
EFRE regulation). The orientation on other environmental issues than the chosen ones cannot
be seen as a “reasonable alternative”.
Changes in phasing the implementation of the NWE-Programme cannot be seen as a ‘reasonable
alternative’. Actually, phases for the implementation of the different Types of Actions are not pre-
dictable.
The zero alternative, i.e. non-implementation of the Programme, is kept as an alternative and serve
as base for the following assessment.
Serious alternatives can be seen at the level of individual projects. Improvements in the considera-
tion of environmental issues can be realised by demanding guiding principles for the application,
selection, conduction and monitoring of projects funded by the NWE-Programme.
5.2 ASSESSMENT OF THE STRATEGIC APPROACH - CONSIDERATION OF ENVIRONMENTAL
OBJECTIVES IN THE DEVELOPMENT OF THE NWE-PROGRAMME
The NWE-Programme shows a strong orientation towards aspects of climate and resource protec-
tion. In this respect, the NWE-Programme responds to the formal requirements of thematic focussing
as stipulated in the EFRE regulation (Art. 4, 1(a)) as well as to the identified challenges of the Interreg
NW area80.
PRIORITIES AND SPECIFIC OBJECTIVES
The NWE-Programme includes three (3) priorities out of which two priorities explicitly deal with im-
portant environment-related issues of the European Union:
The potential of Priority 1 (‘Innovation’) to contribute to environment, climate and resource
protection is different than the one of Priorities 2 and 3. Whereas priorities 2 and 3 explicitly
contribute, the potential of Priority 1 is implicit and must be tapped by adequate application
and selection criteria. The enhancement of innovation performance in NWE through interna-
tional cooperation (Specific Objective 1) can open the door for the development and market-
readiness of eco-innovations; indirect positive effects on the environment can be realised.
Contrary to Priorities 2 and 3 which focus purposely on particular protection issues the charac-
ter of Priority 1 allows the consideration of different environmental issues and such broadens
79
NWE-Programme; p. 18 80
NWE-Programme; p. 7ff

| 41
the potential range of positive effects on environmental issues - in case the implicit potential is
actually exploited. In the NWE-Programme, criteria are stated which covers the consideration
of environmental issues:
a) As sector specific guiding principle for the selection of operations, it is required “that they
contribute to one or more social, economic or environmental challenge of the NWE area”.81
b) In Chapter 8.1 (horizontal principle ‘Sustainable Development’), it is mentioned that “pro-
ject proposals are only eligible if the project objectives and activities do not conflict with
principles of sustainable development” and “applicants are obliged to define in their appli-
cation how their projects contribute to sustainable development in NWE.”82
Although the commitment of the Programme to consider sustainable development and envi-
ronmental protection in the implementation of Priority 1 can be seen, the quite soft state-
ments in the NWE-Programme show that utilising the potential of Priority 1 to contribute to
environment, climate and resource protection is not actively challenged.
Priority 2 (‘Low Carbon’) addresses environmental objectives in the area of climate protection.
By its three Specific Objectives this priority covers a wide range of possible intervention areas
for reducing GHG-emissions. The integration of adaptation solutions (combined with mitiga-
tion solutions as part of Specific Objective 2) reflects the need for strengthening resilience
against negative impacts and risks of the climate change. Specific Objective 4 deals exclusively
with GHG emissions caused by the transport sector, which forms a particular challenge in the
NWE area. Positive effects can be generated due to the approach that “real solutions” should
put into practise and the uptake of low carbon technologies will be supported rather than con-
ceptual work. This Priority contributes to the aims of the Roadmap for moving to a competitive
low-carbon economy in 2050; relevance is given for all the sectoral perspectives of the road-
map. Furthermore, the 20-20-20 targets of the “Europe-2020”-Strategy, the Directive on the
promotion of the use of energy from renewable sources, the Energy efficiency action plan and
Energy efficiency directive, the Directive on the energy performance of buildings, the Thematic
strategy on air pollution, Communication on Green Infrastructure or the Roadmap to a single
European transport area - towards a competitive and resource efficient transport system (white
paper) are supported.
Priority 3 (‘Resource and materials efficiency’) contributes to the overarching aim of the Euro-
pean Union to decouple economic growth from consumption of resources. The Specific Objec-
tive of this Priority targets directly the use and reuse of material and natural resources by
promoting implementation and application of respective technologies, services, products and
processes. This priority contributes to the aims of the Roadmap to a resource efficient Europe.
Relevance is given to the priority ‘sustainable growth’ of the “Europe 2020”-Strategy and the
Eco-innovation Action Plan. More indirectly also other strategies and directives are addressed
as the EU biodiversity strategy to 2020 or the Water framework directive.
The strategic approach of the NWE-Programme reveals the commitment to support the overarching
target of the EU to moving towards a green economy: The Priorities 2 and 3 explicitly contribute posi-
tively to this target, whereas the contribution of Priority 1 cannot be predicted without having more
detailed information on actual projects within this Priority (see Graphic 18).
81
NWE-Programme; p. 26 82
NWE-Programme; p. 81

| 42
Graphic 18: Contribution of the Priorities to ‘Green Economy’ as an overarching target of the Euro-
pean Union
The distribution of the available funds to the individual Priorities respectively Specific Objectives illus-
trates that the individual Specific Objectives of Priority 2 (SO2, SO3, SO4) are financially less equipped
than Specific Objective 1 and Specific Objective 5 (see Table 4). However, summing up the shares of
all Specific Objectives of Priority 2 the entire share for contributing to low carbon economy is the
biggest of all three Priorities. All together almost two thirds of the available EFRE-funds (without
funds for Technical Assistance) will be spent for contributing explicitly to improved environmental
protection, either for reduction of GHG-emission or resource and material efficiency. Taking the im-
plicit potential of Priority 1 into account, it can be stated that the NWE-Programme presents a posi-
Pri
ori
ty 1
In
no
vati
on
SO 1
?
Pri
ori
ty 2
Low
Car
bo
n
SO 2
SO 3
SO 4
Pri
ori
ty 3
R
eso
urc
e an
d m
ate
-
rial
s e
ffic
ien
cy
SO 5
Explicit positive contribution ? Unpredictable contribution
Source: http://www.eea.europa.eu/thees/economy/intro

| 43
tive orientation to tackle the environmental challenges in the NWE area and contribute to important
environmental objectives of the European Union.
Table 4: Distribution of ERDF-funds per Specific Objectives
Priorities Specific Objectives assigned
ERDF-funds [in Mio. €]*
assigned ERDF-
funds [%]*
P1: Innovation SO1: To enhance innovation performance in NWE through international cooperation
130.7 35.1
P2: Low Carbon
SO2: To reduce GHG emissions in NWE through interna-tional cooperation on the implementation of low car-bon, energy or climate protection strategies
47.5 12.8
SO3: To reduce GHG emissions in NWE through interna-tional cooperation on the uptake of low carbon tech-nologies, products, processes and services
51.5 13.8
SO4: To reduce GHG emissions in NWE through interna-tional cooperation on transnational low carbon solu-tions in transport systems
47.5 12.8
P3: Resource and materials effi-ciency
SO5: To optimise (re)use of material and natural re-sources in NWE through international cooperation
95.0 25.5
TOTAL 372.2 100.0
* without funds for Technical Assistance
INTERNAL INTERRELATIONS
A clear distinction is made between actions financed under Priority 2 and those financed under Prior-
ity 383. Although the reduction of GHG emissions is linked to resource efficiency and vice versa it is
comprehensible to follow a thematic concentration under each priority. Nevertheless, a value added
for positive effects on the environment by actively promoting interrelations between the two Priori-
ties can be generated.
More important are the relations between Priorities 2 and 3 on the one hand and Priority 1 on the
other. As stated in the NWE-Programme, Priority 3 respectively Specific Objective 5 “is complemen-
tary to IP1b since it focuses on the implementation and uptake of technologies, products and ser-
vices, rather than on the development and proof of concept of innovations (IP1b focuses on applied
research and innovation).”84 This understanding can also be highlighted for the relation between the
Priorities 1 and 2.
Linking Priority 1 with Priorities 2 and 3 could provide a robust base for utilising the potentials of
each priority better. The development and proof of concepts of innovations can benefit from an ex-
change with projects under Priorities 2 and 3 in order to test, implement and uptake the innovation
results and to contribute better to topics of environmental protection. The other way round, Priori-
ties 2 and 3 can gain inputs from projects under Priority 1.
Strong internal interrelations, mainly in form of exchange and cross-cutting cooperation, could sup-
port the further strengthening of potential positive effects as well as mitigating potential negative
83
NWE-Programme; p. 46 84
NWE-Programme; p. 46

| 44
effects on environmental, climate and resource protection and contribution to the environmental
objectives of the EU. Synergistic effects could be better utilized.
HORIZONTAL PRINCIPLE ‘SUSTAINABLE DEVELOPMENT’
The consideration of the horizontal principle ‘Sustainable development’ (acc. Art. 8 CPR) is described
in chapter 8.1 of the NWE-Programme85.
The link between Priorities 2 and 3 and the horizontal principle is elaborated in a concise manner.
The link between Priority 1 and this principle is explained by the statement that “innovation in the
NWE programme strategy also includes eco-innovation: innovation that contributes to sustainable
development of NWE”.86
A criterion for the project application and selection is provided which requires that project proposals
are eligible only if they “do not conflict with the principles of sustainable development as defined by
the programme”87. Contributions of the projects to sustainable development have to be mentioned
in the application and the applicant, by signing the application, immediately agrees to the principles
of sustainable development88. At the first glance, these formal requirements sound sufficient and
straight forward to consider the horizontal principle. Problems arise because the principles of sus-
tainable development are very broad and the meaning of ‘sustainable development’ can be inter-
preted according to concrete situations. What is missing are unambiguous definitions what is under-
stood by principles of sustainable development and in which way they should be respected in the
applications. Getting a clear idea is helpful for the applicants as well as for the assessors of the pro-
ject applications.
Regarding the monitoring of the NWE-Programme’s effects on the environment it is mentioned that
“the promotion of sustainable development will be part of the NWE programme evaluation”89.
Statements are missing in which way the consideration of sustainable development and the preven-
tion of negative effects can be included in the continuous monitoring of the implementation of the
programme and the execution of the individual projects.
INDICATORS
In a number of output indicators to each Specific Objective binding targets are defined which show
relevance for environmental protection:
For the reduction of GHG-emissions and promoting of low carbon economy five out of seven
output indicators consider new solutions, technologies, products, services or management sys-
tems. Across all Specific Objectives, a total of 37 of such targets have to be realised. According
the wide range of types of actions the nature of these solutions, technologies, etc. will be quite
different.
For resource and materials efficiency (Priority 3), the NWE-Programme foresees the imple-
mentation and testing of at least 24 solutions, processes, products and services (two out of
three defined output indicators).
85
NWE-Programme; p. 81 86
NWE-Programme; p. 81 87
NWE-Programme; p. 81 88
NWE-Programme; p. 81 89
NWE-Programme; p. 81

| 45
The formulation of these targets (in total 61 solutions, technologies, products, etc.) underlines the
commitment of the NWE-Programme to tackle key environmental challenges in the NWE area com-
prehensively.
In the relevant output indicator concerning Priority 1, Specific Objective 1 “Number of technologies,
products, services and processes developed and tested in real life conditions”, a hint is missing on
preference of eco-innovations, circular economy or resource efficiency.
Due to the fact that at the time of the development of the environmental report target values for the
result indicators were not defined yet, the result indicators could not be considered.

| 46
Table 5: Compliance of the NWE Programme with the general EU environmental policy - relations to priorities stated in key documents
INTERREG NWE Pro-gramme 2014-2020
Europe 2020 Low-carbon
Roadmap Resource Efficiency
Roadmap EU Adaptation
Strategy
7. Environmental Action Plan
(7. EAP)
The Eco-innovation Ac-tion Plan (Eco-AP)
Priority 1: Innovation
SO1: To enhance inno-vation performance in NWE through interna-tional cooperation
Smart growth - developing an economy based on
knowledge and innovation
Sustainable growth - pro-moting a more resource
efficient, greener and more competitive economy
(depending on the actual projects)
Inclusive growth - fostering a high-employment econ-omy delivering economic, social and territorial cohe-
sion
---
Sustainable consump-tion and production (depending on the
actual projects)
Turning waste into a resource
(depending on the actual projects)
Key sector: Ensuring efficient mobility
(depending on the actual projects)
---
Priority objective 3: To safeguard the Union’s
citizens from environment-related pressures and risks
to health and well-being (depending on the actual
projects)
Priority objective 5: To improve the knowledge and
evidence base for Union environment policy
(depending on the actual projects)
Action 3: Standards and performance targets for key
goods, processes and ser-vices to reduce their envi-
ronmental footprint (depending on the actual
projects)
Action 5: International cooperation
Priority 2: Low car-bon
SO2: To reduce GHG emissions in NWE through international cooperation on the implementation of low carbon, energy or climate protection
Sustainable growth - pro-moting a more resource
efficient, greener and more competitive economy
Reducing Europe's energy bill and its de-
pendency on fossil fuel imports
Improving air quality and health
---
Action 4: Bridge the knowledge gap
Action 7: Ensuring more resilient infrastructure
Priority objective 3: To safeguard the Union’s
citizens from environment-related pressures and risks
to health and well-being
Priority objective 8: To enhance the sustainability
Action 5: International cooperation
Action 7: European Innova-tion Partnerships

| 47
strategies of the Union’s cities
SO3: To reduce GHG emissions in NWE through international cooperation on the uptake of low carbon technologies, products, processes and services
Sustainable growth - pro-moting a more resource
efficient, greener and more competitive economy
Reducing Europe's energy bill and its de-
pendency on fossil fuel imports
Improving air quality and health
Industrial sectors, in-cluding energy inten-
sive industries
--- Action 7: Ensuring more resilient infrastructure
Priority objective 6: To secure investment for
environment and climate policy and address envi-ronmental externalities
Action 2: Demonstration projects and partnerships
for eco-innovation
SO4: To reduce GHG emissions in NWE through international cooperation on trans-national low carbon solutions in transport systems
Sustainable growth - pro-moting a more resource
efficient, greener and more competitive economy
Reducing Europe's energy bill and its de-
pendency on fossil fuel imports
Improving air quality and health
Sustainable mobility through fuel efficiency,
electrification and getting prices right
--- ---
Priority objective 2: To turn the Union into a resource-efficient, green and com-petitive low-carbon econ-
omy
Action 5: International cooperation
Action 7: European Innova-tion Partnerships
Priority 3: Resource and materials efficiency
SO5: To optimise (re)use of material and natural resources in NWE through interna-tional cooperation
Sustainable growth - pro-moting a more resource
efficient, greener and more competitive economy
---
Sustainable consump-tion and production
Turning waste into a resource
Key sector: Ensuring efficient mobility
---
Priority objective 2: To turn the Union into a resource-efficient, green and com-petitive low-carbon econ-
omy
Action 2: Demonstration projects and partnerships
for eco-innovation
Action 3: Standards and performance targets for key
goods, processes and ser-vices to reduce their envi-
ronmental footprint

| 48
5.3 ASSESSMENT OF THE INDIVIDUAL SPECIFIC OBJECTIVES
In the following chapter, the potential significant effects of the defined Types of Actions per Specific
Objective on the environment are described. The effects are presented in tabular form as an over-
view and are subsequently clarified textually.
The tabular assessment scheme is based on a simple categorization in order to increase the informa-
tion value:
+ potential positive effect, (+) potential positive effect possible, depending on the individual project
0 neutral, no significant effect
- potential negative effect, (-) potential negative effect possible, depending on the individual project
-/+ Potential negative or positive effect possible depending on the individual project
? no assessment statement possible
Some hints need to be given to avoid misunderstandings of the following assessment:
1. Detailed conditions of the individual funded projects (location, volume, aim, activities, etc.) are
not known. Due to the uncertainties only general cause-effect-relations can be presented. Ac-
tual effects on the environment and eco-systems depend on the specific design of the individ-
ual projects and the respective spatial patterns.
2. Though the assessment of the effects focuses on the individual environmental issues, the
complex interdependencies between the environmental issues are seen. Nevertheless, a de-
tailed description of complex effect-chains is not possible at this high strategic programming
level. Principle potential synergistic effects will be mentioned in chapter 5.5.
3. ‘Resource efficiency’90 is seen as a field of intervention of outstanding importance for the NWE
area. It is included in the assessment although it is not an environmental issue in the narrow
sense. However, resource consumption is directly linked to numerous effects on environ-
mental issues. The consideration of interventions in the field of resource efficiency in the
scope of the individual Types of Actions provides additional information to which extent the
NWE-Programme serves environmental protection and sustainable development and contrib-
utes to the target of the European Union to decouple economic growth from resource con-
sumption.
4. The following summarising tabular presentation of potential effects reflects potential direct ef-
fects of the defined Types of Actions. Potential indirect effects are described in the textual ex-
planations.
5. Due to further development of the NWE-Programme and clarification of some defined Types
of Actions the assessment results might differ from the ones stated in the Scoping Note.
90
For definition of resource efficiency see chapter 3 (p. 9f).

| 49
5.3.1 PRIORITY 1: INNOVATION
Priority 1 aims to bring innovations closer to the market; existing disparities in innovative perform-
ance between the regions of the NWE area should be reduced and the implementation of smart spe-
cialisation strategies should be supported. Additionally, innovations with a high impact on societal
problems (‘social innovations’) will be promoted.91
For Priority 1, a share of 35.1 % of the available EFRE-funds is earmarked (130.7 Mio. €).
INVESTMENT PRIORITY IP 1.1: PROMOTING BUSINESS […] INVESTMENT IN INNOVATION AND
RESEARCH, AND DEVELOPING LINKS AND SYNERGIES BETWEEN ENTERPRISES, R&D CENTRES AND
HIGHER EDUCATION […]
Specific Objective 1: To enhance innovation performance in NWE through international cooperation
Table 6: Summary of potential effects - Specific Objective 1
Type of Action
Environmental issues Inter-
vention field
Po
pu
lati
on
Hu
man
Hea
lth
Lan
dsc
ape
Flo
ra, F
aun
a,
Bio
div
ersi
ty
Wat
er
Soil
Air
Glo
bal
Clim
ate
Cu
ltu
ral
Her
itag
e
Res
ou
rce
effi
cien
cy
ToA1: Building the capacity of regions and territories to improve their innovation performance.
0 0 0 0 0 0 0 0 0
ToA2: Improving the competitive-ness of enterprises, through coop-erative actions that take forward the development of specific prod-ucts, services or processes to a stage of market-readiness.
0 ? ? ? ? ? ? 0 (+)
ToA3: Delivering societal benefits
through innovation. + 0 0 0 0 0 0 0 0
Each individual ToA covers a wide range of possible projects. In principle, the exploitation of research
outcomes in the different areas should be improved.
Potential direct effects:
The potential direct effects of the envisaged ToA’s are very limited except ToA2.
Concerning ToA2 it can be assumed that the further development, demonstrating and testing of in-
novative products, services or processes can generate positive effects on resource efficiency. Due to
the fact that no details of those products, services and processes are known, a reliable statement is
not possible (therefore the plus in the table is put in parentheses). For the identification of potential
other effects sufficient information are not available but those effects cannot be neglected per se (in
the table marked by question marks).
91
For more detailed description of Priority 1 see NWE-Programme; p. 21

| 50
Concerning ToA3, the projects will have a positive effect on population/human health. By this ToA
particularly excluded population or population at risk for exclusion and communities under pressure
shall be supported. Social needs and problems shall be addressed by funded projects.
Potential indirect effects:
Potential indirect effects depend on the specific design of the funded projects. In case of realised
improved resource efficiency (ToA2) an impact-chain can be presumed with positive effects on the
environmental issues landscape, flora-fauna-biodiversity, water, soil and air and following this on
human health.
5.3.2 PRIORITY 2: LOW CARBON
Priority 2 aims to contribute to the transition to a low carbon economy.92
For Priority 2, a share of 39.4 % of the available EFRE-funds is earmarked (146.5 Mio. €).
INVESTMENT PRIORITY IP 4E: SUPPORTING THE SHIFT TOWARDS A LOW CARBON ECONOMY IN ALL
SECTORS THROUGH (4E) PROMOTING LOW CARBON STRATEGIES FOR ALL TYPES OF TERRITORIES, IN
PARTICULAR URBAN AREAS, INCLUDING THE PROMOTION OF SUSTAINABLE URBAN MOBILITY AND
MITIGATION RELEVANT ADAPTATION MEASURES.
Specific Objective 2: To reduce GHG emissions in NWE through international cooperation on the
implementation of low carbon, energy or climate protection strategies.
Table 7: Summary of potential effects - Specific Objective 2
Type of Action
Environmental issues Inter-
vention field
Po
pu
lati
on
Hu
man
Hea
lth
Lan
dsc
ape
Flo
ra, F
aun
a,
Bio
div
ersi
ty
Wat
er
Soil
Air
Glo
bal
Clim
ate
Cu
ltu
ral
Her
itag
e
Res
ou
rce
effi
cien
cy
ToA4: Promoting carbon reduction in cities and regions through the implementation of emerging or existing low carbon, energy or climate protection strategies
0 0 0 0 0 + + (-) +
ToA5: Implementing combined mitigation and adaptation solu-tions, to demonstrate feasibility and refine design and development plans for the future.
+ (-) (-) (-/+) (-/+) + + (+) +
Regional and local stakeholders increasingly have to deliver strategies aimed at reducing emissions
and optimising energy performance. The actions under ToA4 support the implementation of low
carbon, energy and climate protection strategies. As a second pillar of this Specific Objective 2 com-
bined mitigation and adaptation measures will be supported. The high urbanisation rate, population
density and extensive infrastructure make the NWE area highly vulnerable for climate change effects.
92
For more detailed description of Priority 2 see NWE-Programme; p. 29

| 51
Potential direct effects:
The implementation of emerging or existing low carbon, energy or climate protection strategies
(ToA4) shows positive effects on global climate, air quality and resource efficiency throughout.
Same holds for the implementation of mitigation measures as part of combined mitigation and adap-
tation solutions (ToA5).
Direct effects on other environmental issues can be expected by adaptation measures as well. De-
pending on the actual design of projects, adaptation measures may contribute positively to the qual-
ity of waters by measures to reduce water consumption, renaturation of rivers, improved manage-
ment of catchment areas, etc. Also soil erosion can be mitigated by adequate measures. Finally,
measures to mitigate risks and impacts of climate change will result in positive effects on the popula-
tion and human health. Measures to increase the resilience of physical infrastructure against climate
change effects (floods, storms, etc.) can also include structures important for cultural heritage. Posi-
tive effects on this issue can be presumed if addressed by projects. Possible direct negative effects
can occur with regard to cultural heritage, for example due to external insulation measures, which
are taken for housing, in order to increase energy efficiency. Due to the fact that no details of finally
implemented projects are known reliable statements are not possible (therefore the mark for cul-
tural heritage in the table is put in parentheses).
Adaptation measures for reducing vulnerability of infrastructure which are linked to construction
works could generate negative effects on landscape, biodiversity, soil, and water (by obstruction of
waters). Due to the fact that no details of finally implemented projects are known reliable state-
ments are not possible (therefore the marks for the environmental issues water, soil, landscape and
biodiversity in the table are put in parentheses).
Referring to provided possible actions for ToA593 it must be stated that the examples for combined
mitigation and adaptation solutions under bullet points 2 and 3 are misleading:
Bullet point 2 ‘Water planning at a catchment level to address adaptation whilst promoting
mitigation; for example where water is allocated between hydroelectricity and consumption’:
The allocation of water for hydroelectricity shows a link to mitigation whereas the link be-
tween allocation for consumption and adaptation is finally not clear. A more explaining exam-
ple could be the combination of hydroelectricity and flood prevention measures at the level of
a catchment area.
Bullet point 3 ‘Adapting regional economies to the effects of climate change; for example by
addressing environmental risks in a way which will reduce CO2 emissions, such as reducing the
vulnerability of electricity distribution networks to extreme weather’: Reducing the vulnerabil-
ity of electricity distribution networks to extreme weather can be seen as an adaptation meas-
ure. The link to reduce GHG-emissions and by this contribute to mitigation is not obvious.
Adapting regional economies to the effects of climate change by consideration of mitigation
could be seen in a territorial perspective that adaptation and mitigation measures are ele-
ments of the same (regional) strategy but not definitely elements of the same individual pro-
ject.
Potential indirect effects:
Realised improved air quality has positive effects on human health.
93
NWE-Programme; p. 33

| 52
Reduction of GHG-emissions, improvement of air quality and improved resource efficiency can have
positive effects on the environmental issues landscape, flora-fauna-biodiversity, water, soil and fol-
lowing this on human health.
Potential negative effects could be caused by supporting energy generation or distribution under
ToA4 or ToA5:
Wind energy plants can negatively affect birds, bats and other terrestrial and marine mam-
mals and also “pollute” landscape.94
Biomass plants could cause the further promotion of monoculture of biomass with negative
impacts on natural goods as landscape, water, soil, biodiversity in Europe but also in other
regions of the World due to possible imports of biomass. Particularly by the transition of
grassland into production land for biomass the biodiversity is reduced; the farmland bird in-
dex forms a qualified indicator in this respect (see chapter 4; p. 23)95. The so-called second
generation of biomass (straw, sludge, and agricultural waste) has to be put on the agenda
regarding the further promotion of biomass plants.
The construction of hydropower plants could cause negative impacts on water flows and
aquatic habitats because of constructions; also fish population might be affected negatively.
The construction of extended solar power plants on ‘green fields’ could generate negative
impacts on landscape.
Distribution networks could show negative effects on landscape and soil (construction work).
Increasingly, conflicts between climate protection aims and protection of natural assets and biodiver-
sity aims can be stated in the last years in Europe. Support of energy generation by renewable
sources has to take those conflicts into account and find an acceptable balance between the possible
conflicting protection objectives.
INVESTMENT PRIORITY IP 4F: PROMOTING RESEARCH, INNOVATION AND ADOPTION OF LOW
CARBON TECHNOLOGIES.
Specific Objective 3: To reduce GHG emissions in NWE through international cooperation on the
uptake of low carbon technologies, products, processes and services.
Table 8: Summary of potential effects - Specific Objective 3
Type of Action
Environmental issues Inter-
vention field
Po
pu
lati
on
Hu
man
Hea
lth
Lan
dsc
ape
Flo
ra, F
aun
a,
Bio
div
ersi
ty
Wat
er
Soil
Air
Glo
bal
Clim
ate
Cu
ltu
ral
Her
itag
e
Res
ou
rce
effi
cien
cy
ToA6: Implementing low carbon technologies and other solutions through demonstrations and roll-out of existing low carbon prod-ucts, technologies, or solutions.
0 (-) (-) (-) 0 + + 0 +
94 See also European Commission (2011): Wind energy developments and Natura 2000. Guidance Document 95
UNEP World Conservation Monitoring Center Website 25.11.2013 Another appropriate impact indicator in this respect is described in EEA (2013): The European grassland butterfly indica-
tor: 1990-2011

| 53
Specific Objective 3 aims on the increase of the proportion of renewable energies in the production
and consumption mix in the NWE area. The market opportunities presented by Low Carbon and Envi-
ronmental Goods and Services (LCEGS) should be better realised.
Potential direct effects:
The demonstration and roll-out of existing low carbon products, technologies and solutions show
positive effects on global climate, air quality and resource efficiency throughout.
Potential negative effects could be caused by supporting energy generation or distribution (see ex-
planation under Specific Objective 2, p. 52). Due to the fact that no details of finally implemented
projects are known reliable statements are not possible (therefore the minus marks in the table are
put in parentheses).
It is a positive move of the NWE-Programme to explicitly recognise that bio-fuel production could
have negative effects on landscape, biodiversity, soil and water resources and that the example is
stated to “finding ways for bio-fuel production to not negatively impact on agricultural and water
resources”96.
Potential indirect effects:
Realised improved air quality has positive effects on human health.
Reduction of GHG-emissions, improvement of air quality and improved resource efficiency can have
positive effects on the environmental issues landscape, flora-fauna-biodiversity, water, soil and fol-
lowing this on human health.
The cultivation of biomass because of the promotion of biogas technologies could have - beside the
above mentioned environmental issues - negative effects on soil as well.
INVESTMENT PRIORITY IP 7C: DEVELOPING ENVIRONMENTAL FRIENDLY AND LOW CARBON
TRANSPORT SYSTEMS INCLUDING RIVER AND SEA TRANSPORT, PORTS AND MULTIMODAL LINKS […].
Specific Objective 4: To reduce GHG emissions in NWE through international cooperation on trans-
national low carbon solutions in transport systems
Table 9: Summary of potential effects - Specific Objective 4
Type of Action
Environmental issues Inter-
vention field
Po
pu
lati
on
Hu
man
Hea
lth
Lan
dsc
ape
Flo
ra, F
aun
a,
Bio
div
ersi
ty
Wat
er
Soil
Air
Glo
bal
Clim
ate
Cu
ltu
ral
Her
itag
e
Res
ou
rce
effi
cien
cy
ToA7: Implementing transnational solutions for low carbon transport systems to reduce GHG emissions.
0 0 0 0 0 + + 0 +
ToA8: Implementing solutions for optimised traffic management to enhance capacity and to show tangible transfer to lower-carbon forms of transport, in order to reduce GHG emissions.
0 0 0 0 0 + + 0 +
96
NWE-Programme; p. 37

| 54
The transport sector is one of the main sources of GHG-emissions. In the NWE area transport is still
growing using more and more energy and increasing pollution. Specific Objective 4 aims to promote
solutions for low carbon transport systems as well as for more efficient traffic management. Con-
struction of physical transport infrastructure is not funded by the NWE-Programme.
Potential direct effects:
The implementation of transnational solutions for low carbon transport systems (ToA7) and solutions
for optimised traffic management to enhance capacity and to show tangible transfer to lower-carbon
forms of transport (ToA8) shows positive effects on global climate, air quality and resource efficiency
throughout.
Direct negative effects cannot be expected.
Potential indirect effects:
Realised improved air quality has positive effects on human health.
By the reduction of GHG-emissions, improvement of air quality and improved resource efficiency an
impact-chain can be initiated generating positive effects on the environmental issues landscape,
flora-fauna-biodiversity, water, soil and following this on human health.
As an element of ToA7, also the use of alternative fuels can be subject of supported projects. In case
of the production of bio-fuel, negative effects on landscape, biodiversity, soil and water resources
can be generated. Possible negative effects can be mitigated or even avoided if the provision of the
NWE-Programme (“finding ways for bio-fuel production to not negatively impact on agricultural and
water resource”; see p. 53) will be applied strictly.
5.3.3 PRIORITY 3: RESOURCE AND MATERIALS EFFICIENCY
Priority 3 responds to the growing need to foster decoupling economic growth from consumption of
resources. The aim is to achieve better results in resource efficiency and to strengthen the transition
to a circular economy. For Priority 3, a share of 25.5 % of the available EFRE-funds is earmarked (95.0
Mio. €).
INVESTMENT PRIORITY 6F: PROMOTING INNOVATIVE TECHNOLOGIES TO IMPROVE
ENVIRONMENTAL PROTECTION AND RESOURCE EFFICIENCY IN THE WASTE SECTOR, WATER SECTOR,
SOIL PROTECTION OR TO REDUCE AIR POLLUTION.
Specific Objective 5: To optimise (re)use of material and natural resources in NWE through interna-
tional cooperation
Table 10: Summary of potential effects - Specific Objective 5
Type of Action
Environmental issues Inter-
vention field
Po
pu
lati
on
Hu
man
Hea
lth
Lan
dsc
ape
Flo
ra, F
aun
a,
Bio
div
ersi
ty
Wat
er
Soil
Air
Glo
bal
Clim
ate
Cu
ltu
ral
Her
itag
e
Res
ou
rce
effi
cien
cy
ToA9: Implementing new tech-nologies, services, products and processes to improve resource efficiency.
0 0 + + 0 (+) (+) 0 +

| 55
By the projects funded under this Specific Objective 5, the development and uptake of technologies,
services, products and processes to better (re)use material and natural resources is supported. As
the result of Specific Objective 5 more organisations benefit from international cooperation in this
field of eco-innovations.
Potential direct effects:
The increase of resource efficiency by optimizing (re)use of materials and natural resources will have
positive effects on flora-fauna-biodiversity and water.
Depending on the type of projects being implemented also positive effects could be generated for
global climate and air quality. But due to the fact that no details of finally implemented projects are
known reliable statements are not possible (therefore the plus marks in the table are put in paren-
theses).
Potential indirect effects:
A reduction of landfill needs as a consequence of improved recycling and use of waste (secondary
raw materials) could generate positive effects on landscape, soil and groundwater.
Positive effects on the environmental issues water, biodiversity and, possibly, on landscape and soil
will generate positive effects on human health.
5.3.4 CHARACTERISTICS OF POTENTIAL EFFECTS
According the EU SEA-Directive (annex II) the effects shall be assessed concerning their characteris-
tics as the probability, duration, frequency and reversibility. A serious assessment of these character-
istics is not possible because the NWE-programme provides only general proposals on individual
projects and concrete measures. Spatial conditions, volume and technical particularities of the im-
plementation are not known. The actual interventions cannot be predicted.
The approach of the NWE-Programme bases on transnational cooperation between the Member
States and possibly neighbouring states and/or regions. Transboundary nature of the potential ef-
fects is difficult to expect; most of the effects - beside global climate - will appear spatially linked to
the ultimate intervention. “Magnitude and spatial extent of the effects (geographical area and size of
the population likely to be affected)”97 depend on the nature of the concrete interventions. Im-
provement of water quality can in principle influence the water quality downstream; but the volume
of the NWE-Programme and the extent of potential effects are limited. The reduction of GHG emis-
sions contributes of course per definition to a wider area. The reduction of resource consumption
might also have global effects outside the programme’s area if the resources are imported. Against
the knowledge background of actual implementation no reasonable conclusions can be drawn.
General statements can be given to potential reversibility of effects. The effects generated by con-
structions are usually irreversible because natural structures can be damaged or destroyed definitely.
The effects generated by eco-innovations (e.g. mitigation of GHG-emission or resource consumption)
usually are reversible. If the application and the use of innovation products, technologies, processes
will be halted the effects will be reduced or even halted as well.
Facing this unpredictability, the more important is to realise further environmental assessments
closer to concrete measures. The opportunity respectively requirement and the appropriate proce-
dure for ‘tiering’ again depend on nature, extent and spatial context of the planned measure. The
following procedures can be applied according to the specific conditions and national legislation:
97
EU SEA-Directive; Annex II

| 56
Environmental impact assessment (EIA)
Impact assessment under nature protection law
Flora-Fauna-Habitat (FFH) impact assessment
Approval process (e.g. for pollution or immission control of technologies or industrial sites)
Strategic environmental assessment (SEA) for plans and programmes
The following table provides an overview on general reversibility of effects and principle possibilities
for assessments of potential environmental effects on lower strategic or operational level:

| 57
Table 11: Overview on general reversibility and principle possibilities for tiering of potential effects
Intervention system Reversibility Possibility for tiering
SO1: To enhance innovation performance in NWE through international cooperation
ToA1: Building the capacity of regions and territories to improve their innovation performance. --- ---
ToA2: Improving the competitiveness of enterprises, through cooperative actions that take forward the development of specific products, services or processes to a stage of market-readiness.
yes EIA
Approval process
ToA3: Delivering societal benefits through innovation. yes ---
SO2: To reduce GHG emissions in NWE through international cooperation on the implementation of low carbon, energy or climate protection strategies
ToA4: Promoting carbon reduction in cities and regions through the implementation of emerging or existing low carbon, energy or climate protection strategies
yes
EIA
Approval process
SEA
ToA5: Implementing combined mitigation and adaptation solutions, to demonstrate feasibility and refine design and devel-opment plans for the future.
yes (technologies)
no (construction meas-
ures)
EIA
Impact assessment under nature protection law
FFH impact assessment
Approval process
SEA
SO3:To reduce GHG emissions in NWE through international cooperation on the uptake of low carbon technologies, prod-ucts, processes and services
ToA6: Implementing low carbon technologies and other solutions through demonstrations and rollout of existing low car-bon products, technologies, or solutions.
yes EIA
Approval process
SO4: To reduce GHG emissions in NWE through international cooperation on transnational low carbon solutions in trans-port systems
ToA7: Implementing transnational solutions for low carbon transport systems to reduce GHG emissions. yes EIA
Approval process
ToA8: Implementing solutions for optimised traffic management to enhance capacity and to show tangible transfer to lower-carbon forms of transport, in order to reduce GHG emissions.
yes ---
SO5: To optimise (re)use of material and natural resources in NWE through international cooperation
ToA9: Implementing new technologies, services, products and processes to improve resource efficiency. EIA
Approval process

| 58
5.4 EFFECTS CAUSED BY THE NWE-PROGRAMME ON THE INDIVIDUAL ENVIRONMENTAL
ISSUES
POPULATION / HUMAN HEALTH
Assessment questions Findings
Does the NWE-Programme positively / negatively contrib-ute to human health?
Projects of two ToA’s can contribute directly positive to this issue: ToA3 by delivering societal benefits through innovation and ToA5 by implementing adaptation measures (combined with mitigation).
Indirectly, positive contributions may be generated by all ToA’s which con-tribute to mitigation of GHG-emissions and improvement of resource effi-ciency. Impact-chains with positive effects on for example air and water result in positive effects on the population and human health finally. Measures in the frame of ToA7 aim to implement solutions for low carbon transport systems; optimised traffic management (ToA8) could result in reduced traffic. Therefore, by measures of both ToA’s indirect positive contributions can be realised to reduce emissions and noise.
Does the NWE-Programme positively / negatively contrib-ute to reduce concentrations of air pollutants in urban areas?
All measures under Priority 2 (‘Low carbon’) generate direct positive con-tributions to reduction of air pollutants. Efforts to reduce GHG-emission will cause also in the mitigation of other air pollutants as well. Optimised traffic management (ToA8) could result in reduced traffic which causes less air pollution. For ToA4 and ToA5 the potential of energy-generating build-ings especially in urban areas is particularly mentioned as being of impor-tance.
98
LANDSCAPE
Assessment questions Findings
Does the NWE-Programme positively / negatively contrib-ute to land take?
In the frame of several ToA’s (5, 6) construction can be supported (for en-ergy generation, adaptation measures); land might be sealed and used for buildings or physical infrastructure. This may cause direct negative contri-butions.
Indirect positive contribution could be achieved by improved recycling and reuse of waste which reduce the need for land fills (ToA9). Indirect negative contribution might appear if the implementation of low carbon, energy or climate protection strategies (ToA4) includes also the construction of re-generative energy power plants, for example solar power plants, wind farms, cultivation of crops for biomass production.
FLORA, FAUNA, BIODIVERSITY
Assessment questions Findings
Does the NWE-Programme positively / negatively contrib-ute to halt the loss of biodiver-
The contribution of the NWE-Programme to halt the loss of biodiversity is quite different. Potential direct positive contribution can be generated in case of improved resource efficiency (ToA9). Reduced consumption of re-
98
NWE-Programme; p. 33

| 59
sity and the degradation of ecosystem services?
sources and optimising (re)use of materials, i.e. less waste disposal, could help at least to slow down the loss of biodiversity and the degradation of ecosystems. Direct negative contribution can be caused by the support of constructions for energy generation (ToA5 and ToA6) and for adaptation measures (ToA6).
Indirect positive contributions may be expected in case of mitigation of GHG-emission and improvement of air quality (ToA4, ToA5, ToA6, ToA7, ToA8) which could generate positive effects on biodiversity. Depending on the concrete projects, also measures of ToA2 could realise indirect positive contributions by the development of innovative products, services or proc-esses contributing to resource efficiency which may have positive effects on biodiversity. Indirect negative contribution might appear if the imple-mentation of low carbon, energy or climate protection strategies (ToA4) includes also the construction of regenerative energy power plants and adaptation structures, for example solar power plants, wind farms, hydro-power plants, cultivation of crops for biomass production. It is particularly problematic if biomass production causes changes in agricultural methods, intensification and specialisation.
In case of import of biomass for the production of alternative fuels or the import of bio-ethanol from regions outside the EU indirect negative im-pacts on the environment in these regions are likely (ToA7).
Does the NWE-Programme positively / negatively contrib-ute to the progress with the national designation of pro-tected areas as a tool for biodi-versity conservation?
The NWE-Programme does not contribute to the designation of protected areas.
Does the NWE-Programme positively / negatively contrib-ute to reach the targets for reducing the exposure of eco-systems to acidification, eutro-phication and ozone?
Direct contributions will not be generated by the NWE-Programme.
Indirect positive contributions may be expected in case of mitigation of GHG-emission and improvement of air quality (ToA4, ToA5, ToA6, ToA7, ToA8). Depending on the concrete projects, also measures of ToA2 could realise indirect positive contributions by the development of innovative products, services or processes contributing to resource efficiency which in turn may have positive effects on biodiversity by reducing the exposure of ecosystems to acidification, eutrophication and ozone.
Does the NWE-Programme positively / negatively contrib-ute to land take?
In the frame of several ToA’s (5, 6) constructions can be supported (for energy generation, adaptation measures); land might be sealed and used for buildings or physical infrastructure. This may cause direct negative ef-fects.
Indirect positive contributions could be achieved by improved recycling and reuse of waste which reduce the need for land fills (ToA9). Indirect negative contributions might appear if the implementation of low carbon, energy or climate protection strategies (ToA4) includes also the construction of re-generative energy power plants.

| 60
WATER
Assessment questions Findings
Does the NWE-Programme positively / negatively contrib-ute to decoupling emission of nutrients and heavy metals to water by manufacturing indus-tries from economic growth?
Measures in the frame of ToA9 aim to improve resource efficiency. Direct positive contributions can be realised to decouple emissions to water from economic growth.
Depending on the concrete projects, also measures of ToA2 could realise indirect positive contributions by the development of innovative products, services or processes contributing to resource efficiency which may have positive effects on decoupling emission of nutrients and heavy metals to water by manufacturing industries from economic growth.
Does the NWE-Programme positively / negatively contrib-ute to decoupling emission of nutrients and heavy metals to water by the domestic sector from urban and population growth?
The NWE-Programme does not contribute to decoupling emission of nutri-ents and heavy metals to water by the domestic sector from urban and population growth.
Highly indirectly, measures in the frame of ToA2 could contribute posi-tively.
Does the NWE-Programme positively / negatively contrib-ute to sustainable water use?
Measures in the frame of ToA9 aim to improve resource efficiency. Positive direct contributions can be realised to sustainable water use.
Depending on the concrete projects, also measures of ToA2 could realise indirect positive contributions by the development of innovative products, services or processes contributing to resource efficiency which may have positive effects on sustainable water use.
Does the NWE-Programme positively / negatively contrib-ute to the target of the EU Wa-ter Framework Directive “All surface and groundwater bod-ies in river basins achieve 'good status' by 2015”?
Measures in the frame of ToA9 aim to improve resource efficiency. Positive direct contributions can be realised to achieve good status of surface and groundwater bodies in river basins.
Depending on the concrete projects, also measures of ToA2 could realise indirect positive contributions by the development of innovative products, services or processes contributing to resource efficiency which may have positive effects on achieve good status of surface and groundwater bodies in river basins.
Indirect negative contributions might be caused if the implementation of low carbon, energy or climate protection strategies (ToA4) promotes also the construction of hydro power plants.
SOIL
Assessment questions Findings
Does the NWE-Programme positively / negatively contrib-ute to land take?
In the frame of several ToA5 and ToA6 constructions can be supported (for energy generation, adaptation measures); soil might be sealed and will be destroyed and will get lost of all of its functions.
Indirect positive contributions could be achieved by improved recycling and reuse of waste which reduce the need for land fills (ToA9). Indirect negative contributions might appear if the implementation of low carbon, energy or climate protection strategies (ToA4) includes also the construction of regen-

| 61
erative energy power plants.
Does the NWE-Programme positively / negatively contrib-ute to reduce soil erosion?
Adaptation measures (ToA5) might contribute to mitigation of soil erosion.
Does the NWE-Programme positively / negatively contrib-ute to reach the targets for reducing the exposure of eco-systems to acidification, eutro-phication and ozone?
Direct contributions will not be generated by the NWE-Programme.
Indirect positive contributions may be expected in case of mitigation of GHG-emission and improvement of air quality (ToA4, ToA5, ToA6, ToA7, ToA8). Depending on the concrete projects, also measures of ToA2 could realise indirect positive contributions by the development of innovative products, services or processes contributing to resource efficiency which may have positive effects on soils by reducing the exposure of ecosystems to acidification, eutrophication and ozone.
AIR
Assessment questions Findings
Does the NWE-Programme positively / negatively contrib-ute to reduce concentrations of air pollutants in urban areas?
All measures under Priority 2 (‘Low carbon’) generate direct positive con-tributions to air quality. Efforts to reduce GHG-emission will cause also in the mitigation of other air pollutants as well. Optimised traffic manage-ment (ToA8) could result in reduced traffic which stands for less air pollu-tion. For ToA4 and ToA5 the potential of energy-generating buildings espe-cially in urban areas is particularly mentioned as being of importance.
Depending on the concrete projects, measures of ToA2 could realise indi-rect positive contributions by the development of innovative products, services or processes contributing to resource efficiency which in turn may have positive effects on air quality.
Does the NWE-Programme positively / negatively contrib-ute to reduce emissions of acidifying substances, particu-lates and ozone precursors from transport?
Measures in the frame of ToA7 aim to implement solutions for low carbon transport systems. By those measures also direct positive contributions can be realised to reduce emissions of acidifying substances, particulates and ozone precursors. Optimised traffic management (ToA8) could result in reduced traffic which causes less air pollution, and show direct positive contributions as well.
Depending on the concrete projects, also measures of ToA2 could realise indirect positive contributions by the development of innovative products, services or processes contributing to resource efficiency which may have positive effects on air by reducing emissions of acidifying substances, par-ticulates and ozone precursors from transport.
Does the NWE-Programme positively / negatively contrib-ute to reduce the exposure of ecosystems to acidification, eutrophication and ozone?
Direct contributions will not be generated by the NWE-Programme.
Indirect positive contributions may be expected in case of mitigation of GHG-emission and improvement of air quality (ToA4, ToA5, ToA6, ToA7, ToA8). Depending on the concrete projects, also measures of ToA2 could realise indirect positive contributions by the development of innovative products, services or processes contributing to resource efficiency which may have positive effects on air by reducing the exposure of ecosystems to acidification, eutrophication and ozone.

| 62
GLOBALE CLIMATE
Assessment questions Comments
Does the NWE-Programme contribute to reduce GHG-emission?
All ToA’s of Priority 2 (ToA4, ToA5, ToA6, ToA7, ToA8) contribute directly positive to the reduction of GHG-emissions. Also measures in the frame of ToA9 (improvement of resource efficiency) might contribute direct posi-tively depending on concrete projects.
Depending on the concrete projects, also measures of ToA2 could realise indirect positive contributions by the development of innovative products, services or processes contributing to resource efficiency which may have positive effects on global climate by reducing GHG-emissions.
Does the NWE-Programme positively / negatively contrib-ute to raise the share of renew-able energy in final energy consumption?
Four out of the five ToA’s of Priority 2 (ToA4, ToA5, ToA7 and partly ToA6) contribute directly positively to raise the share of renewable energy in final energy consumption. Depending on the concrete projects, measures of ToA2 could realise direct positive contributions by the development of innovative products, services or processes contributing to raise the share of renewable energy in final energy consumption.
Indirect positive contribution might appear if the implementation of low carbon, energy or climate protection strategies (ToA4) includes also raising the share of renewable energy in final energy consumption.
Does the NWE-Programme positively / negatively contrib-ute to progress on energy effi-ciency?
All ToA’s of Priority 2 (ToA4, ToA5, ToA6, ToA7, ToA8) contribute directly positive to progress on energy efficiency. Depending on the concrete pro-jects, also measures of ToA2 could realise direct positive contributions by the development of innovative products, services or processes contributing to progress on energy efficiency.
Indirect positive contribution might appear if the implementation of low carbon, energy or climate protection strategies (ToA4) includes also the promotion of energy efficiency.
Does the NWE-Programme positively / negatively contrib-ute to reduce emissions of greenhouse gases by transport?
Measures in the frame of ToA7 aim to implement solutions for low carbon transport systems. By those measures direct positive contributions can be realised to reduce emissions of greenhouse gases by transport. Optimised traffic management (ToA8) will result in reduced traffic which causes less greenhouse gases by transport, and show direct positive contributions as well. Depending on the concrete projects, also measures of ToA2 could realise direct positive contributions by the development of innovative products, services or processes contributing to reduce emissions of green-house gases by transport.
Does the NWE-Programme positively / negatively contrib-ute to increase the use of cleaner and alternative fuels?
Measures in the frame of ToA7 contribute directly positive to increase the use of cleaner and alternative fuels.
Depending on the concrete projects, also measures of ToA2 could realise indirect positive contributions by the development of innovative products, services or processes contributing to increase the use of cleaner and alter-native fuels.
Does the NWE-Programme positively / negatively contrib-ute to Modal split?
Measures in the frame of ToA8 (implementation of optimised traffic man-agement) contribute directly positive to Modal split.

| 63
Does the NWE-Programme positively / negatively contrib-ute to adaptation to climate change concerning human health, biodiversity, soil ero-sion, floods, droughts, damages from weather?
The implementation of adaptation measures (combined with mitigation) is the purpose of ToA5. All stated topics might be addressed by the measures.
CULTURAL HERITAGE
Assessment questions Comments
Does the NWE-Programme positively / negatively contrib-ute positive or negative to “Ma-terial Assets, Cultural Heritage including Architectural and Archaeological Heritage”?
Direct positive contributions to “Material Assets, Cultural Heritage includ-ing Architectural and Archaeological Heritage” could be made by the im-plementation of adaptation measures (ToA5), depending on the particular aims of the applied projects.
Possible negative effects can occur with regard to cultural heritage, for example due to external insulation measures, which are taken for housing, in order to increase energy efficiency.
IMPORTANT FIELD OF INTERVENTION
RESSOURCE EFFICIENCY
Assessment questions Findings
Does the NWE-Programme positively / negatively contrib-ute to increase recycling rates?
Measures in the frame of ToA9 (improvement of resource efficiency) could contribute directly positive to increase recycling rates, depending on the particular aims of the applied projects.
Depending on the concrete projects, also measures of ToA2 could realise indirect positive contributions by the development of innovative products, services or processes contributing to increase recycling rates.
Does the NWE-Programme positively / negatively contrib-ute to circular economy?
Measures in the frame of ToA9 (improvement of resource efficiency) could contribute directly positive to circular economy, depending on the particu-lar aims of the applied projects.
Depending on the concrete projects, also measures of ToA2 could realise indirect positive contributions by the development of innovative products, services or processes contributing to circular economy.
Does the NWE-Programme positively / negatively contrib-ute to decoupling resource consumption from economic growth?
Measures in the frame of ToA9 (improvement of resource efficiency) could contribute directly positive to decoupling resource consumption from eco-nomic growth, depending on the particular aims of the applied projects. Depending on the concrete projects, also measures of ToA2 could realise direct positive contributions by the development of innovative products, services or processes contributing to decoupling resource consumption from economic growth.
All other ToA’s could contribute indirectly positive, depending on the par-ticular aims of the applied projects.

| 64
Particular importance receives ToA1 (‘building capacities of regions and territories to improve their
innovation performance’) of Priority 1. By establishing mechanisms on collaboration, networking,
know-how sharing and infrastructure sharing for research and innovation, this ToA might generate
indirect positive contributions to almost all of the topics stated above as assessment questions.
As mentioned in chapter 5.2 (p. 42), the potential of Priority 1, especially of ToA1 but also ToA2 could
be challenged more actively in order to increase the positive contributions of the NWE-Programme
to crucial environmental targets of the European Union.
5.5 CUMULATIVE UND SYNERGISTIC EFFECTS
The high level of abstraction of this type of programme hampers a detailed, quantitative and spatially
differentiated assessment of the potential effects of the NWE-Programme. The assessment thus has
been based on the verification how far the strategic approach and the individual specific objectives
contribute to EU environmental objectives, to general EU environmental policy and to the environ-
mental challenges of the NWE area. The assessment of possible cumulative and synergistic effects
follows this approach.
The assessment of the cumulative and synergistic effects can be done in abstract manner only. Im-
portant criteria of a detailed assessment are not known as:
The particular spatial conditions and
the extent, duration, and frequency and as well the range of the effects.
Cumulative effects, on the one hand, result of effects on the same environmental issue by several
measures. For the entire NWE area - without any spatial differentiation - two fields of possible cumu-
lative effects can be seen caused by the Programme’s intervention:
Three Specific Objectives with together five ToA’s directly aim to reduce GHG-emissions and
promoting of low carbon economy. Additionally, this topic can be subject of innovation activi-
ties in the scope of Specific Objective 1. Although the actual interventions will contribute to
limited extent each the cumulative effect of all interventions on climate protection might be
significant.
Counting the expected direct interventions in the field of resource efficiency together with
possible relevant development of new technologies under Specific Objective 1, the added ef-
fects can generate a considerable cumulative effect.
A more focussed orientation of projects under Specific Objective 1 on eco-innovations could
strengthen the cumulative effect of the contributions regarding climate protection and resource effi-
ciency.
Significant negative cumulative effects caused by the Programme’s implementation can not be pre-
sumed.
Cumulative effects, on the other hand, can also appear affecting particular territories caused by sig-
nificant effects on different environmental issues more or less simultaneously. The overall carrying
capacity of the affected territories’ ecosystems might be overstressed. Due to lack of details regard-
ing territorial aspects and contents of the projects possible cumulative effects on particular territo-
ries cannot be assessed.
It has to be taken into account that similar effects as the Programme’s ones will be generated by
other cross-border, national, regional and local initiatives in the NWE area in the period 2014+. The

| 65
final cumulative impacts on particular environmental issues depend on the overall effects in the area.
This holds for cumulative effects on particular environmental issues and on particular territories as
well.
By promotion of low-carbon economy as well as resource efficiency the NWE-Programme tackles two
areas which could generate a number of potential indirect synergistic effects. The mitigation of GHG-
emissions and the reduction of the consumption of resources for (industrial) production and energy
generation support also the protection of other environmental media as air, water, soil, biodiversity
and landscape. Human health and human well-being is positively influenced by less polluted air, par-
ticularly in urban areas, but also by better quality of waters, landscape and soil. It must be high-
lighted again, that better use of projects under Specific Objective 1 could increase the potential posi-
tive synergistic effects.
5.6 MITIGATION OF POTENTIAL NEGATIVE ENVIRONMENTAL EFFECTS
Direct negative effects on environmental issues - as far as it can be verified on base of the described
types of actions and available information - can be seen connected to two areas of interventions:
Potential negative effects have to be considered in case of promotion of wind power plants,
hydro power plants, biomass power plants, large solar power plants on green fields or distribu-
tion networks (see explanations on p. 52).
Constructions (for example linked to adaptation measures) could generate negative direct and
indirect effects on landscape, biodiversity, water, soil and air.
As highlighted several times above, the decisive element for generating effects are the projects
funded by the NWE-Programme, not the programme as such. Options for mitigating potential nega-
tive effects are thus linked to the application, selection and execution of those projects. Selection
and monitoring procedures have to include arrangements to emphasise on environmental protection
and sustainable development.
For mitigating the negative effects of those possible interventions only general procedural recom-
mendations can be made:
The potential for tiering, i.e. assessing effects on the level of projects being funded by the
NWE-Programme, must be used strictly. The existing formal procedures for assessing effects of
plans, programmes or projects (see chapter 5.3.4) have to be applied as part of the application
and approval process.
Beside the application of formal procedures, environmental competences must be integrated
with the approval of those applications showing the risk of potential negative effects on envi-
ronmental issues. Authorities responsible for environmental and natural protection should be
contacted in order to check the application and to provide recommendations for further han-
dling of the application (rejection, amendment of critical approaches and solutions, definition
of implementation conditions).
Prior to the approval phase, an important instrument for the mitigation of potential negative
effects (and strengthening potential positive effects too of course) is building capacities to
provide advise to the applicants. An early consideration of environmental protection aspects
helps to avoid potential negative effects in the planning phase already and opens options to
design the project in a way that positive environmental effects could be generate.

| 66
5.7 OVERALL ENVIRONMENTAL EFFECT OF THE NWE-PROGRAMME
The ambition of the NWE-Programme reads “To be a key economic player in the world and create an
attractive place to work and live, with high levels of innovation, sustainability and cohesion”. This
ambition should be achieved by a 3-track approach: (1) innovation, (2) low carbon, and (3) resource
and material efficiency. This approach reflects the orientation of the NWE-Programme towards envi-
ronmental, climate and resource protection as key elements of sustainable development.
However, the (financial) extent of the Programme and the proposed Types of Actions do not allow,
considering the spatial coverage of the programme, widespread significant direct effects on the envi-
ronment in the short run. Instead, ERDF-programmes like the NWE-Programme have an important
function for strengthening the framework conditions for the transition to a resource efficient, low
carbon economy (‘green economy’) and for the establishment of a circular economy. The NWE-
Programme serves this function by its strategic approach and by the proposed Types of Actions as
well.
At the strategic level two elements are decisive to support positive contributions of the NWE-
Programme to the EU environmental objectives:
Two out of the three priorities (Priority 2: ‘low carbon’ and Priority 3: ‘Resource and material
efficiency’) aim directly at the improvement of development, testing and uptake of new tech-
nologies in the fields of reduction of GHG-emission and resource efficiency. The term ‘new
technologies’ includes products, services, and processes but also management systems, gov-
ernance arrangements and networks. A comprehensive set of necessary conditions for further
improvement of climate protection and resource efficiency can therefore directly be ad-
dressed. Under Priority 1 (‘Innovation’) capacities will be developed to improve the innovation
performance in regions and of enterprises. These capacities could serve as important interme-
diate structures and ‘transmission belts’ for promoting the transition towards green economy.
The criterion “project proposals are only eligible if the project objectives and activities do not conflict with the principles of sustainable development, as defined by the pro-gramme”99 asks for an early consideration of the principles of sustainable development in the
preparation of projects, even though the criterion is formulated quite soft.
At the level of type of actions, the actual effects and their characteristics depend on the design, exe-
cution conditions and results of the projects supported by the NWE-Programme which in turn de-
pend on the effective application of selection criteria related to environmental, climate and resource
protection.
According to the orientation of the Priorities 2 and 3 with the Specific Objectives 2 - 5, all supported
projects need to contribute to the mitigation of GHG-emissions or to resource efficiency. Additionally
under Specific Objective 2 (ToA5) projects will contribute to adaptation to risks of climate change.
For the supported projects under Priority 1 respectively Specific Objective 1 the link to topics related
to environmental, climate or resource protection is not required in the NWE-Programme consistently
but the consideration of principles of sustainable development definitely.
The positive effects could be even more strengthened if the outcomes of the individual projects un-
der the respective specific objectives would be exchanged and mutually acknowledged and possibly
utilised by the beneficiaries. Due to the fact that beside stand-alone solutions also systemic arrange-
ments will be supported, added value of outcomes for other actors might be given. It should be ac-
99
NWE-Programme; p. 81

| 67
counted, however, that the ‘rebound effect’ could lead to an increased consumption because of the
existence of efficient, resource and by this cost saving technologies100.
Summarising it can be stated that the NWE-Programme shows a strong potential to generate positive
effects on the environment. This holds for effects delivered by the projects as well as for developing
framework conditions to strengthen the transition towards a green economy and to respect sustain-
able development.
A possible principle alternative was presented for the funding of the different Priorities and Specific
Objectives (see chapter 5.1, p. 39f). In the NWE-Programme, 35.12 % of the funds are assigned for
priority 1, 39.36 % for Priority 2 and 25.52 % for Priority 3. As described in the chapters 5.2 and 5.3,
Priorities 2 and 3 and their Types of Actions have the biggest potential to generate direct and indirect
positive effects. At a first glance it might be stated that a larger share for these Priorities could
enlarge the number of projects and/or the uptake and implementation of innovative products, tech-
nologies, processes contributing to mitigation of GHG-emission, to adaptation to climate change
impacts and to improvement of resource efficiency. However, two critical aspects must be recog-
nised:
1. The Priorities 2 and 3 focus on demonstration, testing, uptake and implementation of innova-
tive products, technologies, processes and solutions on transnational level. An immediate
widespread dissemination of these products, technologies, processes and solutions across the
NWE area is not possible with the available funds for the NWE-Programme. Even an internal
shifting of finances and spending more funds for Priorities 2 and 3 would not allow a signifi-
cantly change of this approach.
2. As described in chapter 5.2, Priority 1 shows an implicit potential. The building of (regional) in-
novation capacities and the improvement of competitiveness of enterprises to development
innovative products, services or processes are crucial to ensure eco-innovations in the long
run. A reduction of funds would reduce the long term perspective to be capable to contribute
to the solution of the environmental challenges.
It can be concluded that shifting of the funds in favour of Priorities 2 and 3 would generate limited
additional positive effects concerning climate and resource protection, but at the same time would
weaken the enhancement of innovation performance capabilities in the NWE area.
The risk of significant negative effects and conflicting contributions to sustainable development is
limited, nevertheless existent. Potential negative effects have to be considered connected to the
promotion of energy generation out of renewable energy sources, e.g. wind power plants, hydro
power plants, biomass power plants, large solar power plants on green fields or distribution net-
works, but also connected to construction work linked to adaptation measures.
In the NWE-programme, due to its nature, only Types of Actions and examples can be presented. As
mentioned above, the actual effects and their characteristics depend on the design and implementa-
tion conditions of the supported individual projects. Decisive tools to exploit the potential of the
programme are:
A thorough assessment of the application according to their relevance for environmental, cli-
mate or resource protection,
the selection of the projects ensuring best possible contribution to environmental, climate or
resource protection and to contribute to the solution of the of the environmental challenges in
the NWE area and
an effective monitoring of the implementation of the supported projects.
100
European Commission (2011): Roadmap to a Resource efficient Europe; p. 5

| 68
6 RECOMMENDATIONS
Although the NWE-Programme contributes to the set EU environmental objectives recommendations
can be given in order to exploit the potential to an optimum. The recommendations aim mainly on
arrangements concerning the implementation of the programme.
1. In chapter 8.1 it is stated that “innovation in the NWE programme strategy also includes eco-
innovation”101. However, the consideration of eco-innovations as a privilege for the selection
of projects should be added for Priority 1, respectively Specific Objective 1. Projects under pri-
ority 1 should also, as far as possible, respond on the environmental challenges in the NWE
area and contribute to the transition towards green economy.
The compliance of Priority 1 with important EU environmental priorities could be strength-
ened; the positive contribution to these priorities would not “depend on the actual pro-
jects”.102
2. Additionally to recommendation 1, selection criteria should be included in chapter 8.1 clearly
asking for the contribution of the proposed projects on the environmental challenges in the
NWE are as there are resource and materials efficiency, GHG-emission and vulnerability to cli-
mate change events.
The current formulation “do not conflict with the principles of sustainable development” as
stated in chapter 8.1 opens a wide room for interpretations and different perceptions.
It should also be stated explicitly that EU and national environmental legislations must be ap-
plied and EU and national environmental standards must be met by all supported projects.
3. In the selection process for projects aiming on the promotion of energy generation by renew-
ables and distribution networks (ToA4 and ToA5 of SO2, ToA6 of SO3), the possible effects on
biodiversity, landscape, soil and water have to be taken into account seriously. The use of sec-
ond generation biomass (e.g. agricultural waste, organic waste, sludge) should be promoted.
4. By designing appropriate implementation guidance or application manuals, the consideration
and incorporation of criteria concerning environmental, climate and resource protection in
project applications must be ensured. The criteria must not be too strict but should guarantee
a sufficient environmental quality standard of the projects.
5. Each project application should be complemented by a concise description of the environ-
ment-related aspects to be addressed and of expected environmental effects. Depending
whether the project has a clear territorial focus, a short description of the existing environ-
mental conditions could be added.
6. At the level of the Member States, arrangements should be established to enable applicants to
receive information and advice for the consideration of environmental aspects in the design
and execution of projects.
7. Relevant national or regional authorities responsible for environmental and nature protection
should be involved in the assessment and selection of relevant project applications.
101
NWE-Programme; p. 81 102
see Table 5 on p. 46

| 69
8. To exploit the potential to an optimum, the Joint Secretariat should support the exchange of
information and knowledge between beneficiaries on the projects’ outputs and lessons
learned of the different Types of Actions. This should be done for projects within one priority
or across the different priorities. The functions of the Joint Secretariat could be complemented
with: “Promotion of information exchange and cooperation between the beneficiaries of the
different supported projects.” It could be linked to the listed function “to assist and organise
activities to support project generation and development” (function h) 103.
7 NOTES ON PROBLEMS IN THE COMPILATION OF REQUIRED DATA AND
INFORMATION
In the course of the assessment, no problems occurred to find and use accurate data and informa-
tion.
8 PROPOSED MONITORING MEASURES
The SEA Directive requires that “Member States shall monitor the significant environmental effects
of the implementation of the plans and programmes, in order, inter alia, to identify at an early stage
unforeseen adverse effects, and to be able to undertake appropriate remedial action.”104
The lack of details of supported projects does not allow the identification of measures to monitor
concrete possible effects on the environment. The monitoring must aim to ensure that no adverse
effects to the EU environmental objectives and the EU environmental policy are supported by the
Programme, even if the effects will only occur in the long run.
Monitoring measures should include:
1. Environmental criteria have to be safeguarded by including them in the project implementa-
tion guidance or application manuals of the NWE-Programme.
2. The consideration of potential environmental effects has to be proven in the application for a
project. Projects which potentially show effects not compliant with EU environmental objec-
tives and with the principles of sustainable development as described in the application man-
ual can be screened out or amendments can be demanded by the Monitoring Committee. The
selection process must be used to avoid contradictions to the effective EU environmental ob-
jectives and the general EU environmental policy.
3. In the progress and final reports of the projects the initiated indirect effects should be de-
scribed and assessed towards the expected effects stated in the applications.
4. As part of the function “to monitor progress made by projects through collecting and checking
project monitoring reports, monitoring outputs, results and financial implementation”105 of the
103
NWE-Programme; p. 64 104
Directive 2001/42/EC, Art. 10 105
NWE-Programme; p. 64

| 70
Joint Secretariat, the expected effects and contributions and the actually initiated ones as
stated in the projects progress and final reports have to be compiled and assessed on regular
base in order to avoid incompatibility of the overall implementation orientation of the NWE-
Programme towards the effective EU environmental objectives and general environmental pol-
icy.
5. As part of the monitoring systems to be established and in the course of defining indicators,
complementary to the result and output indicators, to ensure an effective progress and im-
plementation monitoring106, adequate indicators should be defined to measure the contribu-
tion of the NWE-Programme to the effective EU environmental objectives in particular and
sustainable development in general. Areas of monitoring could be:
- Energy consumption
- (Raw-) material consumption
- Land take for construction
- Direct and indirect impacts on biodiversity
- Pollution of water and air.
6. Depending on the nature of the individual projects, relevant existing national, regional and/or
local environmental monitoring systems should be used (for example to measure air pollution,
noise, water pollution). Relevance and mode of utilisation could be clarified by involvement of
the authorities responsible for the monitoring (linked to recommendations6 and 7 - chapter 6,
p. 68).
106
NWE-Programme; p. 69

| 71
9 REFERENCES
Council of Europe (1992): European Convention on the Protection of the Archaeological Heritage (Revised) http://conventions.coe.int/Treaty/en/Treaties/Html/143.htm
Council of Europe (2000): European Landscape Convention http://conventions.coe.int/Treaty/en/Treaties/Html/176.htm
DIRECTIVE 2000/60/EC OF THE EUROPEAN PARLIAMENT AND OF THE COUNCIL of 23 October 2000 establishing a framework for Community action in the field of water policy http://eur-lex.europa.eu/LexUriServ/LexUriServ.do?uri=OJ:L:2000:327:0001:0072:EN:PDF
DIRECTIVE 2001/42/EC OF THE EUROPEAN PARLIAMENT AND OF THE COUNCIL of 27 June 2001 on the assess-ment of the effects of certain plans and programmes on the environment http://eur-lex.europa.eu/LexUriServ/LexUriServ.do?uri=OJ:L:2001:197:0030:0037:EN:PDF
DIRECTIVE 2001/81/EC OF THE EUROPEAN PARLIAMENT AND OF THE COUNCIL of 23 October 2001 on national emission ceilings for certain atmospheric pollutants (amended 2006 and 2009) http://eur-lex.europa.eu/LexUriServ/LexUriServ.do?uri=OJ:L:2001:309:0022:0030:EN:PDF
DIRECTIVE 2008/56/EC OF THE EUROPEAN PARLIAMENT AND OF THE COUNCIL of 17 June 2008 establishing a framework for community action in the field of marine environmental policy (Marine Strategy Framework Di-rective) http://eur-lex.europa.eu/LexUriServ/LexUriServ.do?uri=OJ:L:2008:164:0019:0040:EN:PDF
DIRECTIVE 2009/28/EC OF THE EUROPEAN PARLIAMENT AND OF THE COUNCIL of 23 April 2009 on the promo-tion of the use of energy from renewable sources and amending and subsequently repealing Directives 2001/77/EC and 2003/30/EC http://eur-lex.europa.eu/LexUriServ/LexUriServ.do?uri=OJ:L:2009:140:0016:0062:EN:PDF
DIRECTIVE 2010/31/EU OF THE EUROPEAN PARLIAMENT AND OF THE COUNCIL of 19 May 2010on the energy performance of buildings http://eur-lex.europa.eu/LexUriServ/LexUriServ.do?uri=OJ:L:2010:153:0013:0035:EN:PDF
DIRECTIVE 2012/27/EU OF THE EUROPEAN PARLIAMENT AND OF THE COUNCIL of 25 October 2012 on energy efficiency, amending Directives 2009/125/EC and 2010/30/EU and repealing Directives 2004/8/EC and 2006/32/EC http://eur-lex.europa.eu/LexUriServ/LexUriServ.do?uri=CELEX:32012L0027:EN:HTML:NOT
ESPON: (European Observation Network for Territorial Development and Cohesion) website http://www.espon.eu/main/
European Commission (2000): Action Plan to Improve Energy Efficiency in the European Community; COM(2000) 247 http://eur-lex.europa.eu/smartapi/cgi/sga_doc?smartapi!celexplus!prod!DocNumber&lg=en&type_doc=COMfinal&an_doc=2000&nu_doc=247
European Commission (2004): Implementation of Directive 2001/42 on the assessment of the effects of certain plans and programmes on the environment http://ec.europa.eu/environment/eia/pdf/030923_sea_guidance.pdf
European Commission (2005): Thematic Strategy on air pollution; COM(2005) 446 http://eur-lex.europa.eu/LexUriServ/LexUriServ.do?uri=COM:2005:0446:FIN:EN:PDF
European Commission (2006): Thematic Strategy for soil protection; COM(2006) 231 http://eur-lex.europa.eu/LexUriServ/LexUriServ.do?uri=COM:2006:0231:FIN:EN:PDF
European Commission (2010): EUROPE 2020 - A strategy for smart, sustainable and inclusive growth; COM(2010) 2020 http://eur-lex.europa.eu/LexUriServ/LexUriServ.do?uri=COM:2010:2020:FIN:EN:PDF
European Commission (2011): Our life insurance, our natural capital: An EU biodiversity strategy to 2020 (COM(2011) 24) http://eur-lex.europa.eu/LexUriServ/LexUriServ.do?uri=COM:2011:0244:FIN:EN:PDF
European Commission (2011): Regulation on specific provisions for the support from the European Regional Development Fund to the European territorial cooperation goal (ETC-Regulation) COM(2011) 611 http://eur-lex.europa.eu/LexUriServ/LexUriServ.do?uri=COM:2011:0611:FIN:EN:PDF
European Commission (2011): Wind energy developments and Natura 2000. Guidance Document. http://ec.europa.eu/environment/nature/natura2000/management/docs/Wind_farms.pdf

| 72
European Commission (2011):A Roadmap for Moving to a Competitive Low Carbon Economy in 2050; COM(2011) 112 http://eur-lex.europa.eu/LexUriServ/LexUriServ.do?uri=COM:2011:0112:FIN:EN:PDF
European Commission (2011): WHITE PAPER -Roadmap to a Single European Transport Area - Towards a com-petitive and resource efficient transport system; COM(2011) 144 http://eur-lex.europa.eu/LexUriServ/LexUriServ.do?uri=COM:2011:0144:FIN:EN:PDF
European Commission (2011): Innovation for a sustainable Future - The Eco-innovation Action Plan (Eco-AP) COM(2011) 899 http://eur-lex.europa.eu/LexUriServ/LexUriServ.do?uri=COM:2011:0899:FIN:EN:PDF
European Commission (2011): Roadmap to resource efficient Europe (COM(2011) 571). 26 P. http://ec.europa.eu/environment/resource_efficiency/pdf/com2011_571.pdf
European Commission (2012): A Blueprint to Safeguard Europe's Water Resources; SWD(2012) 382 http://eur-lex.europa.eu/LexUriServ/LexUriServ.do?uri=COM:2012:0673:FIN:EN:PDF
European Commission (2012): Report on The implementation of the Soil Thematic Strategy and ongoing activi-ties; COM(2012) 46 http://eur-lex.europa.eu/LexUriServ/LexUriServ.do?uri=COM:2012:0046:FIN:EN:PDF
European Commission (2013): An EU Strategy on Adaptation to Climate Change COM(2013) 216 http://eur-lex.europa.eu/LexUriServ/LexUriServ.do?uri=COM:2013:0216:FIN:EN:PDF
European Commission (2013): Cultural Heritage; Website 17.Nov 2013 http://ec.europa.eu/culture/our-policy-development/cultural-heritage_en.htm
European Commission (2013): Guidance document on ex-ante evaluation http://ec.europa.eu/regional_policy/sources/docoffic/2014/working/ex_ante_en.pdf
European Commission (2013): Guidance on Integrating Climate Change and Biodiversity into Strategic Environ-mental Assessment http://ec.europa.eu/environment/eia/pdf/SEA%20Guidance.pdf
European Commission (2013): Programme for the Environment and Climate Action (LIFE Programme) for the period 2014 - 2020 (PE-COS 70/13, 16103/13 ADD1) http://www.climateactionprogramme.org/
European Commission (2013): Green Infrastructure (GI) - Enhancing Europe’s Natural Capital (COM(2013) 249) http://eur-lex.europa.eu/LexUriServ/LexUriServ.do?uri=COM:2013:0249:FIN:EN:PDF
European Commission, Joint Research Centre, Institute for Environment and sustainability (2012): The State of Soil in Europe. 26 p. http://ec.europa.eu/dgs/jrc/downloads/jrc_reference_report_2012_02_soil.pdf
European Environment Agency (2010): The European environment – state and outlook 2010: Synthesis. State of the environment. Report No 1/2010. 222 p. http://www.eea.europa.eu/soer/synthesis/synthesis
European Environment Agency (2011): Resource efficiency in Europe. Policies and approaches in 31 EEA mem-ber and cooperating countries. Report No 5/2011; 84 p. http://www.eea.europa.eu/publications/resource-efficiency-in-europe/at_download/file
European Environment Agency (2012): Soil - SOER 2010 thematic assessment http://www.eea.europa.eu/soer/europe/soil/at_download/file
European Environment Agency (2013): Air quality in Europe - 2013 report; Report No 9/2013 http://www.eea.europa.eu/publications/air-quality-in-europe-2013/at_download/file
European Environment Agency (2013): Report - Trends and projections in Europe 2013 - Tracking progress towards Europe's climate and energy targets until 2020. 148 p. http://www.eea.europa.eu/publications/trends-and-projections-2013/full-report-ghg-trends-and-1
European Environment Agency (2013): The European grassland butterfly indicator: 1990-2011; Report No. 11/2013 http://www.eea.europa.eu/publications/the-european-grassland-butterfly-indicator-19902011/at_download/file
European Environment Agency (2013): Towards a green economy in Europe - EU environmental policy targets and objectives 2010-2050; Report No 8/2013, 52 p. http://www.eea.europa.eu/publications/towards-a-green-economy-in-europe/at_download/file

| 73
European Environment Agency (2013): Trends and projections in Europe 2013 - Tracking progress towards Europe's climate and energy targets until 2020; Report No 10/2013 http://www.eea.europa.eu/publications/trends-and-projections-2013/full-report-ghg-trends-and-1
European Environment Agency 2012: European waters - assessment of status and pressures; Report No 8/2012 http://www.eea.europa.eu/publications/european-waters-assessment-2012/at_download/file
European Environment Agency: website http://www.eea.europa.eu/
European Union (2007): The Lisbon Treaty http://europa.eu/lisbon_treaty/index_en.htm
European Union (2011): EU Resource Efficiency Perspectives in a Global Context http://ec.europa.eu/environment/enveco/studies_modelling/pdf/res_efficiency_perspectives.pdf
European Union (2013): Sustainable development in the European Union - 2013 monitoring report of the EU sustainable development strategy (Eurostat Statistical Books). 292 p. http://epp.eurostat.ec.europa.eu/cache/ITY_OFFPUB/KS-02-13-237/EN/KS-02-13-237-EN.PDF
Eurostat, European Commission (2013): Pocketbook - Energy, transport and environment indicators. 252 p. http://epp.eurostat.ec.europa.eu/cache/ITY_OFFPUB/KS-DK-13-001/EN/KS-DK-13-001-EN.PDF
Interreg IVB (2013): SWOT-analysis for the smart, sustainable and inclusive growth objectives. A reviewed SWOT-analysis for North West Europe, presented according to the main objectives of the Europe 2020 Strategy and the thematic objectives of the CSF-funds regulation - Main Report.
Osterburg B., Laggner B., Nitsch H., Roggendorf W. and Röder N. (2011): Analysis of grassland conversion into arable land in Northwest Germany; In: Grassland Science in Europe, Vol. 16, p. 350-2 http://www.egf2011.at/files/pubs/350_osterburg.pdf
Umweltbundesamt (2009): Leitfaden zur Strategischen Umweltprüfung http://www.umweltbundesamt.de/sites/default/files/medien/publikation/long/3746.pdf
UNEP World Conservation Monitoring Center (2009): The impacts of biofuel production on biodiversity: A re-view of the current literature; Website 25.11.2013 http://www.unep-wcmc.org/the-impacts-of-biofuel-production-on-biodiversity-a-review-of-the-current-literature_641.html
United Nations (2003): Protocol on strategic environmental assessment to the convention on environmental impact assessment in a transboundary context; 88 p. https://treaties.un.org/doc/Publication/CTC/Ch_XXVII_4_b.pdf