Strategic Energy Management Plan - GreenCare...2.3 VCH Electrical Energy Breakdown – 2014..... 71...
97
VCH Strategic Energy Management Plan Vancouver Coastal Health (VCH) Strategic Energy Management Plan 2015-16 The LMFM 2015-2016 Strategic Energy Management Plan (SEMP) is a foundational document of the Energy & Environmental Sustainability within Lower Mainland Facilities Management (LMFM) and reports on past, current, and forecasted energy consumption and conservation projects within four lower mainland health organizations: Fraser Health, Vancouver, Coastal Health, Providence Health Care, and Provincial Health Services Authority. Issued: March 15, 2016 Energy Managers: Fraser Health – Robert Bradley Providence Health Care – Sabah Ali Provincial Health Services Authority – Sabah Ali Vancouver Coastal Health – John Manougian Sustainability Managers: LMFM - Ruth Abramson LMFM - Glen Garrick Energy & Environmental Sustainability Director: LMFM – Mauricio Acosta OUR PASSION OUR MANDATE OUR POTENTIAL Strategy Energy Management Plan Page 1
Transcript of Strategic Energy Management Plan - GreenCare...2.3 VCH Electrical Energy Breakdown – 2014..... 71...

VCH Strategic Energy Management Plan
Vancouver Coastal Health (VCH) Strategic Energy Management Plan
2015-16 The LMFM 2015-2016 Strategic Energy Management Plan (SEMP) is a foundational document of the Energy & Environmental Sustainability within Lower Mainland Facilities Management (LMFM) and reports on past, current, and forecasted energy consumption and conservation projects within four lower mainland health organizations: Fraser Health, Vancouver, Coastal Health, Providence Health Care, and Provincial Health Services Authority. Issued: March 15, 2016
Energy Managers: Fraser Health – Robert Bradley
Providence Health Care – Sabah Ali Provincial Health Services Authority – Sabah Ali
Vancouver Coastal Health – John Manougian
Sustainability Managers: LMFM - Ruth Abramson
LMFM - Glen Garrick
Energy & Environmental Sustainability Director: LMFM – Mauricio Acosta
OUR PASSION OUR MANDATE OUR POTENTIAL
Strategy Energy Management Plan Page 1

VCH Strategic Energy Management Plan
Preface This document is developed by the Energy & Environmental Sustainability (EES) team within Lower Mainland Facilities Management (LMFM). The EES team are within a consolidated department, and therefore collectively serve all four of the Lower Mainland Health Authorities. While each Health Authority has a dedicated Energy Manager, Energy Management is a coordinated effort with a shared vision, goals, targets, and approach. This enhances efficiency and leverages the collective knowledge of the team for the benefit of each health organization. As such, this document is the amalgamation of four separate Strategic Energy management Plan (SEMP) documents with a Preface from an LMFM perspective This document consists of five distinct sections summarized below, each with its own Table of Contents:.
LMFM Strategic Energy Management Plan Preface Fraser Health Authority (FHA) SEMP Providence Health Care (PHC) SEMP Providence Health Services Authority (PHSA) SEMP Vancouver Coastal Health (VCH) SEMP
Strategy Energy Management Plan Page 2

VCH Strategic Energy Management Plan
Vancouver Coastal Health (VCH) Strategic Energy Management Plan
(SEMP)
Strategy Energy Management Plan Page 3

VCH Strategic Energy Management Plan
Table of Contents
1. Vancouver Coastal Health – Energy Management..................................................................................................................................6 1.1 BC Hydro SEMP Evaluation Requirements ........................................................................................................................................... 7 1.2 ORGANIZATION .............................................................................................................................................................................................. 8
1.2.1 Organizational ........................................................................................................................................................................................ 8 1.2.2 Facility Profiles ..................................................................................................................................................................................... 10 1.2.3 Key Performance Indicators ............................................................................................................................................................ 12
1.3 UNDERSTANDING THE VCH SITUATION .............................................................................................................................................12 1.3.1 Energy Utilities Consumption and Costs - 2014 & Cost Intensity (ECI) by Site............................................................... 13 1.3.2 Energy Intensity – Floor Area - 2014 ............................................................................................................................................ 18 1.3.3 Energy Intensity – Key Performance Indicators........................................................................................................................ 18 1.3.4 Building Performance Index (BEPI) - Total and by Site 2014................................................................................................ 20 1.3.5 Worst Performing Buildings – Hospitals and Long Term Care Facilities…………………………………………………………27
1.4 VCH GOALS & OBJECTIVES.......................................................................................................................................................................30 1.4.1 Energy Utilities Consumption Goals - 2015/2016 ..................................................................................................................... 30 1.4.1 Targeted Quarterly kWh Savings - 2015/2016 and Targeted Savings by Site ................................................................. 31 1.4.2 Completed Energy Projects – 2014/2015 ..................................................................................................................................... 32
1.5 PLANNED ACTIONS.....................................................................................................................................................................................35 1.5.1 Energy Studies 2003/2004 – 2014/2015 .................................................................................................................................... 34 1.5.2 Energy Conservation Projects – 2014/2015 – 2016/2017 - Completed, In progress, and Planned ....................... 38 1.5.3 Completed Energy Projects and Cost Savings/Avoidance 2008/2009 - 2014/2015.................................................... 42
1.5.4 Energy Conservation Awareness and Education Programs……………………………………………………………………………52 1.5.5 Continuous Optimization Program ................................................................................................................................................. 58 1.5.6 BC Hydro New Construction Program............................................................................................................................................ 59 1.5.7 Renewable Energy Solutions ............................................................................................................................................................. 65 1.5.8 District Energy Systems....................................................................................................................................................................... 65
1.6 Other – Mechanical and Electronic Equipment Inventories .......................................................................................................66 2. Appendices ...........................................................................................................................................................................................................67
2.1 VCH – Sustainability Policy:...................................................................................................................................................................... 67 2.2 Key Stakeholders - 2014/2015 ................................................................................................................................................................ 71 2.3 VCH Electrical Energy Breakdown – 2014 ........................................................................................................................................... 71 2.4 List of Green + Leaders Energy Volunteers - VCH ............................................................................................................................. 88 2.5 VCH – EMA – Year 5.................................................................................................................................................................................... 88 2.6 VCH – Imaging Equipment Inventory by Site ..................................................................................................................................... 89 2.7 Chillers Inventory by Site ........................................................................................................................................................................... 93 2.8 VCH Cooling Towers Inventory by Site ................................................................................................................................................. 94 2.9 Lions Gate Hospital – Energy Equipment Inventory ........................................................................................................................ 94
Strategy Energy Management Plan Page 4

VCH Strategic Energy Management Plan
List of Tables
Table VCH-1: VCH Internal Floor Areas changes 2007 – 2015 ........................................................................................11 Table VCH-2: Total VCH CORE Sites 2014 Energy & utilities Consumptions, Costs and Variances from 2013…………...….……13 Table VCH-3: Actual Energy Utilities Consumption and Costs Breakdown for VCH CORE Sites - 2013………………………….…..15 Table VCH-4: Actual Energy Utilities Consumption and Costs Breakdown for VCH CORE Sites - 2014…………………………......15 Table VCH-5: Adjusted Electrical kWh Consumptions for VCH CORE Sites 2013-2014 and Variances…………………………….….16 Table VCH-6: Adjusted Natural gas GJ onsumptions for VCH CORE Sites 2013-2014 and Variances…………………….…………...16 Table VCH-7: Fuel Oil Purchases/Consumptions for VCH CORE Sites 2013-2014 and Variances ………………………….………..….16 Table VCH-8: Purchased Steam for VCH CORE Sites 2013-2014 and Variances ………………………………………………………………..17 Table VCH-9: VCH Internal Floor Areas Changes 2007-2015……………………………………………………………………………………………..18 Table VCH-10: Adjusted Utilities Consumptions and Energy Intensity for VCH CORE Sites - 2013………………………….….……...19 Table VCH-11: Adjusted Utilities Consumptions and Energy Intensity for VCH CORE Sites - 2014…………………………..…….……20 Table VCH-12: Adjusted 2014 Utilities Consumptions and Energy Intensity for VCH CORE Sites & Variances from 2013.…..20 Table VCH-13: Adjusted Total Energy Intensity (BEPI) Comparisons by Site - 2013-2014……………………………………………….….21 Table VCH-14: Adjusted Electricak kWh Consumptions for VCH CORE Sites 2013-2014 and Variances ……………………….….…21 Table VCH-15: VCH Acute Care and Residential Care Electricity Energy Intensity 2013 and 2014 Comparison…….………….…22 Table VCH-16: Adjusted Natural Gas GJ Consumptions for VCH CORE Sites 2013-2014 and Variances………………………..……23 Table VCH-17: VCH Acute and Residential Care Natural Gas GJ Energy Intensity 2013 and 2014 Comparison ………..….…...23 Table VCH-18: Fuel Oil Purchases/Consumptions for VCH Core Sites 2013-2014 and Variances……………………………………....24 Table VCH-19: In Progress and Planned Energy Projects - 2015/2016…………………………………………………………………….………..30 Table VCH-20: Targeted Quarterly kWh Savings 2015/2016………………………………………………………………………………………….…31 Table VCH-21: VCH Completed, Planned and In progress Projects - kWh Savings 2013/2014 - 2016/2017 - Targeted……...31 Savings by Site Table VCH-22: Completed Energy Projects and kWh , GJ, and GHG Savings -014/2015…………………………………………………...32 Table VCH-23: Energy Conservation Projects - 2014/2015 - 2016/2017…………………………………………………………………….……...38 Table VCH-24: Completed Energy Projects – 2014/2015 ...............................................................................................39 Table VCH-25: In Progress and Planned Energy projects - 2015/2016……………………………….………………………………………. ..…..40 Table VCH-26: In-Progress and Planned Energy Projects – 2016/2017 ............................................................................41 Table VCH-27: Annual Estimated kWh and GHG tCO2e Savings - Non Cumulative Completed Projects 2008/2009 ………….45 2014/2015 Table VCH-28: Estimated kWh and GHG Savings/Avoidance - Cumulative - 2008/2009 - 2014/2015 ……………………………….46 Table VCH-29: Annual Estimated GJ and GHG tCO2e Savings - Non-Cumulative 2008/2009 - 2014/2015 ..........................47 Table VCH-30: Estimated GJ and GHG tCO2e Savings/Cost Avoidance - Cumulative 2008/2009 - 2014/2015 ....................49 Table VCH-31: Consolidated Summary - Estimated kWh, GJ, and GHG tCO2e Cost Savings/Avoidance………………………...…..50
Cumulative and Non-Cumulative - 2008/2009 - 2014/2015 Table VCH-32: VCH BC Hydro Continuous Optimization Program (COP) Plan and Estimated Costs and Savings……………....56 2011/2012 - 2016/2017 - Non-Cumulative List of Figures Figure VCH-1: VCH 2014 Total Owned Acute and Residential Care Facilities- Utilities Consumptions and Costs .................14 Figure VCH-2: VCH 2014 Acute Care Facilities - Energy Intensity by Site .........................................................................25 Figure VCH-3: VCH 2014 Residential Care Facilities - Energy Intensity by Site …………………………………………….…………………….25 Figure VCH-4: Completed Energy Projects kWh Savings by Category – 2008/2009 – 2014/2015…………………….………………..33 Figure VCH-5: Annual and Cumulative Electricity kWh Savings - 2008/2009 - 2014/2015.................................................43 Figure VCH-6: Annual and Cumulative Natural Gas GJ Savings - 2008/2009 - 2014/2015.................................................43 Figure VCH-7: Annual and Cumulative kWh and GJ Cost Savings - 2008/2009 - 2014/2015……….……………………….…………….44 Figure VCH-8: Annual and Cumulative GHG Carbon Offsets Cost Savings - 2008/2009 - 2014/2015..................................44
Strategy Energy Management Plan Page 5

VCH Strategic Energy Management Plan
1. VANCOUVER COASTAL HEALTH – ENERGY MANAGEMENT
Energy Manager Manougian, John Energy Coordinator /
Specialist Lin, Alan
Executive Support
Mary Ackenhausen President & Chief Executive Officer Dr. Patricia Daly, VP, Public Health & Chief Medical Officer
Energy Committee
Energy Volunteers Green+ Leaders
1.1 BC Hydro SEMP Evaluation Requirements
Energy Manager 4th Quarter Assessment Form
SEMP Evaluation For BC Hydro to complete
Company Name Energy Manager
File Number
Quarter PSE Signature: SEMP Completed
Date:
Projects that used PS incentives:
PS Program Incentive kWhPSPPSP ExpressNew Construction TotalBehavioural Program (2%)
Turn around time for 4th Q review: _______days
Strategy Energy Management Plan Page 6

VCH Strategic Energy Management Plan
Energy Manager: Please complete appropriate year below Note: All areas (in your contract Year) must be covered in order to receive 4th quarter payment
Strategic Energy Management Plan Requirements
8 Critical elements must be included in the SEMPPage Number where the
element is addressed in the SEMP
EMevaluation
PSEAgrees
1) A Purpose statement which answers the following questions:
a) What is your kWh reduction target? 30-31, 40-41
b) What is the Key Performance indicator for your organization? 12, 18 Yes
c) Who do you need to engage to make your plan successful? 6, 69-74, 75
2) A table that compares all of your buildings in your portfolio 19-25
a) BEPI - updated to the current year 19-25b) Explanation of the Top 10 worst performing buildings 26-29 Yes
3) Explain what the opportunities are to become more efficient:
a) Project list 30-33, 38-41
b) Initiative list: Behavioural and Organizational 51-55 Yesc) Studies: Outline which buildings had studies completed 34-37
4) Outline the budget to implement projects: 10 Yesa) if no budget or unable to forcast, WHY? What do you need to enable a budget/forcaste?
5) Conclusion: How is your plan doing?
a) Outlined kWh saved 38-39, 41-50b) Outlined GHG tonnes saved 38-39, 41-50c) Outlined total dollars saved to the organization 39, 41-42 Yesd) Oulined avoided costs 42, 44, 46, 49-50
e) Outline total dollars saved 41-42, 44-50
6) Senior Management Support:
a) Approval of the SEMP: Signature on the SEMP Front Cover Yes
Strategy Energy Management Plan Page 7
VCH Strategic Energy Management Plan
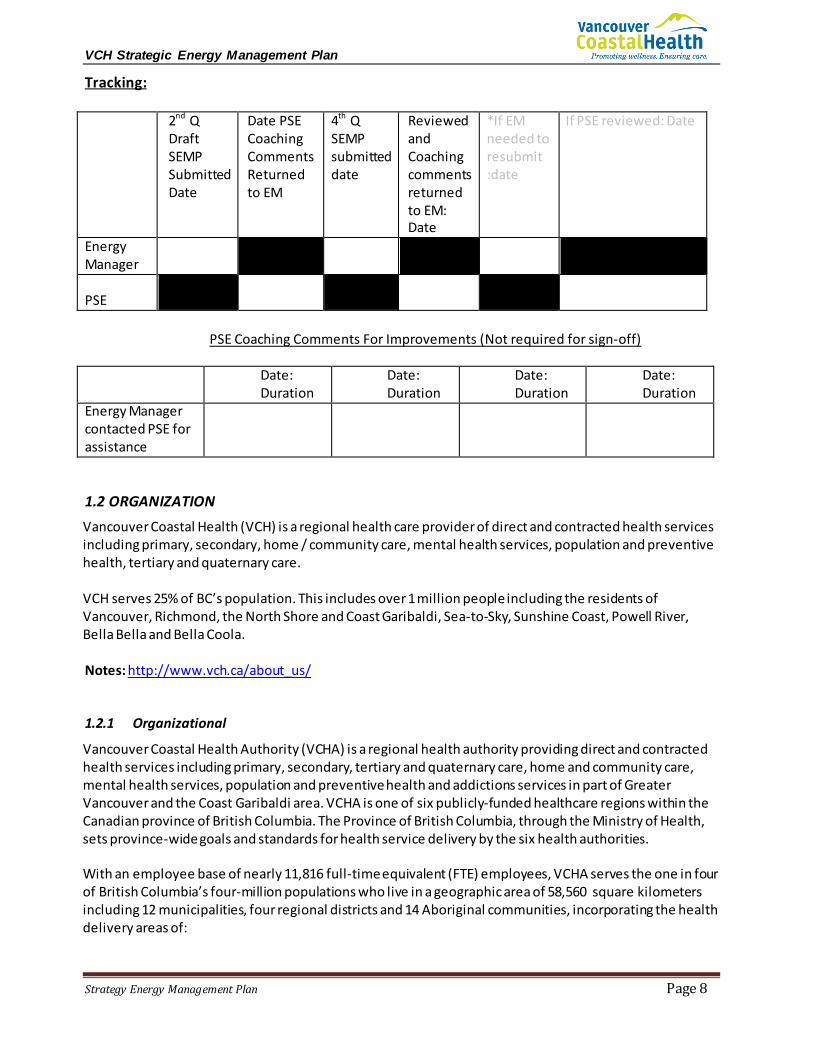
Tracking:
2nd Q Draft SEMP Submitted Date
Date PSE Coaching Comments Returned to EM
4th Q SEMP submitted date
Reviewed and Coaching comments returned to EM: Date
*If EM needed to resubmit :date
If PSE reviewed: Date
Energy Manager
PSE
PSE Coaching Comments For Improvements (Not required for sign-off)
Date:
Duration Date: Duration
Date: Duration
Date: Duration
Energy Manager contacted PSE for assistance
1.2 ORGANIZATION Vancouver Coastal Health (VCH) is a regional health care provider of direct and contracted health services including primary, secondary, home / community care, mental health services, population and preventive health, tertiary and quaternary care. VCH serves 25% of BC’s population. This includes over 1 million people including the residents of Vancouver, Richmond, the North Shore and Coast Garibaldi, Sea-to-Sky, Sunshine Coast, Powell River, Bella Bella and Bella Coola. Notes: http://www.vch.ca/about_us/ 1.2.1 Organizational
Vancouver Coastal Health Authority (VCHA) is a regional health authority providing direct and contracted health services including primary, secondary, tertiary and quaternary care, home and community care, mental health services, population and preventive health and addictions services in part of Greater Vancouver and the Coast Garibaldi area. VCHA is one of six publicly-funded healthcare regions within the Canadian province of British Columbia. The Province of British Columbia, through the Ministry of Health, sets province-wide goals and standards for health service delivery by the six health authorities. With an employee base of nearly 11,816 full-time equivalent (FTE) employees, VCHA serves the one in four of British Columbia’s four-million populations who live in a geographic area of 58,560 square kilometers including 12 municipalities, four regional districts and 14 Aboriginal communities, incorporating the health delivery areas of:
Strategy Energy Management Plan Page 8

VCH Strategic Energy Management Plan
• Vancouver • Richmond (within Greater Vancouver)) • The North Shore (The municipalities and districts of North and West Vancouver, within
Greater Vancouver) • Coast-Garibaldi (Sea-to-Sky, including Whistler, Sunshine Coast, Powell River, Bella Bella
and Bella Coola).
Vancouver Coastal Health administers 9 Core hospitals (11 acute Care Facilities including the Hope Centre, Bella Coola and R.W. Memorial hospitals), 9 residential care facilities, and more than 400 facilities provide a range of direct and contracted services including home and community care, mental health services, population and preventive health, addictions services and primary care and other support services.
Organization Profile
P E O P L E
Sector
X
Government Education Health Commercial (_____________________) Other (_____________________)
Number of Employees
11,816 FTE
aEmployees of contracted out t services and Academic areas not sincluded in FTE count.
Number of Sites – (Owned, Leased, 3rd party run facilities with contracts for services with VCH Facilities: 231 Buildings Locations: 557 Ft2: 12 Million Owned and Leased Buildings/Leases:
184 - 8,747,138 ft2 Owned: 6,746,003 ft2 Leased: 1,806,496 ft2 Core Sites: Acute Care Facilities: 11 (5,761,129 ft2)** Residential & Clinics: 9 ( 984,874 ft2 )* Total Core Sites: 20 ( 6,746,003 ft2) * Includes 1 P3 (Diamond Care Centre – 373,663 ft2) **Includes new St Mary’s Hospital – 56,400 and the Hope Centre – 150,640 ft2 And Bella Coola and RW Large Memorial Hospitals
O P E R A T I O N S
Energy Management Issues / Obstacles
Timely Funding allocation for energy efficiency projects Shortage of funding for energy efficiency projects Lack of resources - Staffing Aging Facilities and Infrastructure Challenges Procurement Challenges Geographic locations/spread of VCH Facilities (effective April 1, 2014, VCH assumed ownership of Bella Coola
Hospital in Bella Coola and RW Large Memorial Hospital in Bella Bella). Increasing Portfolio Lack of Control in leased sites Lack of Control/Influence in P3 sites Reduction of Facilities Maintenance budgets
Core Business Metrics
VCH uses a variety of Productivity and Activity Indicators based on employee hours analysis as well as patient activity indicators such as Patient Cases, Average length of Patient Days (ALOS). The Productivity Indicators include productive hr/IP day, and ALOS hours for Acute, Mental Health, and Residential Care.
Business Year April 1st March 31st
Budget Cycle April 1st March 31st
Maintenance Cycle
START END
April 1- March 31 2011/2012
April 1-March 31 2012/2013
April 1-March 31 2013/2014
April 1-March 31 2014/2015
Strategy Energy Management Plan Page 9

VCH Strategic Energy Management Plan
Maintenance Budget
$67,400 k
$ 72,000 k $ 74,879 k $ 76,125 k
Energy Efficiency Projects Budget
$ 757 k
(internal)
$ 1,000 k
(internal)
$ 1,900 k
(internal)
$ 1,650 k
(internal)
Operations Budget (excludes Maintenance & Utilities Budgets)
$ 286,119 k
$ 309,857 k
$ 279,000 k
$ 284,188 k
Utilities budget
$ 17,780 k
$ 15,318 k
$ 16,740 k
$ 17,879 k
Other Incentives $ 594 k
$ 0
$ 0 $ 0
Capital Budget
2011/12
Facilities IMIS
Equipment Minor Capital
Contingency
$
52.6 m 4.6 m
0m 19.3 m
Total: _______76.5 m
2012/13
Facilities
$
231.7 m1
_____Total: __231.7 m1
2013/14
Capital Projects
$
110.6 m
Total: 110.6 m (VCH Only)
2014/15
Capital Projects
$ 219.2 m2 Total: 219.2 m2 (VCH Only)
1 Excludes the project costs for the P3 portion of the Diamond Care Centre at VGH
2 Excludes the construction costs for the Willingdon Creek Village Complex Care facility in Powell River but includes $ 1,061,518 for 4 CNCP (Carbon Neutral Capital Program) projects.
Comments: While there has been continuous improvement of funding for energy related initiatives through internal sources, and incentives from BC hydro, Fortis BC, PSECA, and NRCan from 2008/2009 to 2014/2015, internal funding for 2014/2015 was been reduced from the 2013/2014 levels by about 15%. The Ministry approved four (4) capital projects funding for VCH in July, 2014, through the CNCP (Carbon Neutral Capital Program) for the total of $ 1,161,118. This sum is the average of 3 years VCH Carbon Offset payments. The approved funding is to be used for projects over $ 100,000 and targeting GHG reductions the funded projects were to be completed by March 31, 2015 resulting in substantial pressure in implementing and completing these projects. Fortis BC provided incentives for these 4 projects for $ 54,123 upon completion and verification. These incentives will not be payable until after March 31, 2015. These CNCP projects are primarily targeted towards GJ savings rather than electrical savings to maximize GHG reduction. A New CNCP project, to be implemented by March 31, 2016, has been approved by MOH for $ 1,115,595 with additional incentive funding from Fortis BC for $ 85,000. This energy retrofit project at Powell River Hospital (Boilers Replacement, Installation of a Demand Control Ventilation System in the kitchen Supply and Exhaust Ventilation, and high temperature Domestic (DHW) Temperature Set point Reduction will save an estimated 1,518 GJ of Natural Gas, 16,106 kWh and reduce GHG emissions by 76.1 tCO2e (tonnes) per annum 1.2.2 Facility Profiles While it is the goal of the Energy Management Team to identify energy consumptions for all owned, leased, P3 and affiliated facilities under the Vancouver Coastal Health umbrella, current focus is on the VCH owned CORE facilities – 9 Hospitals (a P3 facility at the VGH site has been excluded from the Core hospitals) and 7 Clinical, Nursing and Residential Care facilities (587,136 m2 - 6,317,583 ft2). This CORE list includes 88% of the owned facilities and 72% of the total leased and owned facilities. Two additional
Strategy Energy Management Plan Page 10

VCH Strategic Energy Management Plan
hospitals, Bella Coola General Hospital in Bella Coola and R.W. Memorial Hospital in Bella Bella, previously owned by the United Church of Canada, became VCH property as of April 1, 2014. The energy management team has the greatest influence and ability to track the energy consumption of this CORE group of sites. With additional resources and systems, we may be able to look after additional sites in the future. From 2007 to 2015, the CORE VCH sites experienced a total net space increase of 87,339 m2 (16.8%) (Table VCH-1). This includes the addition of 8 new facilities since 2007 (95,373 m2 – 1,026,213 ft2). A further increase of 5,089 m2 (1%) occurred in April 2014 when the ownerships of Bella Coola General Hospital in Bella Coola and the R.W. Large Memorial Hospital in Bella Bella were transferred from the United Church of Canada to Vancouver Coastal Health. The 7 new facilities do not include 9020 Bridgeport which is a replacement for Lions Manor in Richmond and the Willingdon Creek Village residence in Powell River which is a replacement for Olive Devaud residence in Powell River.
Table VCH-1 - VCH Internal Floor Areas changes 2007 – 2015
VCH CORE SITES - FLOOR AREA1 (M2) CHANGES 2007 - 2015
Calendar Year
Increase/Decrease
% From 2007
Increase (m2) From
2007 2015 2014 2013 2012 2011 2010 2009 2008 2007Vancouver General Hospital -5.0% -11,635 222,269 222,269 226,324 226,324 226,324 226,324 234,388 222,527 233,904VGH - ICORD/Blusson (NEW) 100% 11,861 11,861 11,861 11,861 11,861 11,861 11,861 11,861 11,861 VGH - Diamond Health Care Centre (NEW) 100% 34,727 34,727 34,727 34,727 34,727 34,727 34,727 - - - VGH - Jack Bell Robert HO (NEW) 100% 6,704 6,704 6,704 6,704 6,704 - - - - - UBC Hospital 0.0% - 71,370 71,370 71,370 71,370 71,370 71,370 71,370 71,370 71,370 Djavad Mowafaghian Centre for Brain Health at UBCH (NEW) 100% 15,764 15,764 15,764 - - - - - - - Richmond Hospital 3.5% 1,170 34,398 34,398 34,398 34,398 34,398 34,398 33,228 33,228 33,228Lions Gate Hospital 0.0% - 61,518 61,518 61,518 61,518 61,518 61,518 61,518 61,518 61,518Lions Gate Hospital - HOPE Centre (NEW) 100% 14,000 14,000 - - - - - - - Lions Gate Hospice (NEW) 100% 3,134 3,134 3,134 3,134 3,134 3,134 - - - - St Mary's Hospital 0.0% - 8,837 8,837 8,837 8,837 8,837 8,837 8,837 8,837 8,837St. Mary's Hospital Expansion (NEW) 100% 5,254 5,254 5,254 5,254 - - - - - - Powell River Hospital / Evergreen 0.0% - 15,040 15,040 15,040 15,040 15,040 15,040 15,040 15,040 15,040Squamish Hospital / Hilltop House 0.0% - 7,252 7,252 7,252 7,252 7,252 7,252 7,252 7,252 7,252Squamish - Hilltop House North & Pharmacy Addition (NEW) 100% 3,929 3,929 3,929 3,929 3,789 3,789 3,789 - - - Whistler Health Care Centre 3.4% 90 2,755 2,755 2,755 2,755 2,755 2,755 2,665 2,665 2,665GF Strong 0.0% - 19,890 19,890 19,890 19,890 19,890 19,890 19,890 19,890 19,890
SUB-TOTAL ACUTE CARE 18.7% 84,998 538,702 524,702 512,993 507,599 500,895 497,761 466,049 454,188 453,704
George Pearson Centre 0.0% - 18,315 18,315 18,315 18,315 18,315 18,315 18,315 18,315 18,315Richmond Lions Manor -100% (6,128) - 6,128 6,128 6,128 6,128 6,128 6,128 6,128 6,1289020 Bridgeport - Replacement for Lions Manor (NEW) 100% 4,604 4,604 4,604 - - - - - - - Shorncliffe Intermediate Care 0.0% - 2,718 2,718 2,718 2,718 2,718 2,718 2,718 2,718 2,718North Shore Yiwanis Care Centre 0.0% - 17,248 17,248 17,248 17,248 17,248 17,248 17,248 17,248 17,248Cedarview Lodge 0.0% - 6,599 6,599 6,599 6,599 6,599 6,599 6,599 6,599 6,599Olive Devaud Residence -100% (2,935) - 2,935 2,935 2,935 2,935 2,935 2,935 2,935 2,935PRH Willingdon Creek Residential Care (NEW) 100% 6,800 6,800 - - - - - - - - Minoru Residence 0.0% - 11,890 11,890 11,890 11,890 11,890 11,890 11,890 11,890 11,890
SUB-TOTAL RESIDENTIAL CARE 3.6% 2,341 68,174 70,437 65,833 65,833 65,833 65,833 65,833 65,833 65,833OVERALL TOTALS - CORE FACILITIES 16.8% 87,339 606,876 595,139 578,826 573,432 566,728 563,594 531,882 520,021 519,537
NET INCREASE FROM 2007% INCREASE 16.8%
ADDITIONAL INCREASESRW Large Memorial Hospital (Bella Bella) (NEW)2 100% 3,000 3,000 3,000 - - - - - - Bella Coola General Hospital (Bella Coola) (NEW)2 100% 2,089 2,089 2,089 - - - - - -
NET INCREASE FROM 2007 5,089 5,089 5,089 - 573,432 566,728 563,594 531,882 520,021 519,537 % INCREASE 1.0%
TOTAL NET INCREASE FROM 2007 17.8% 92,428 611,965 600,228 578,826 573,432 566,728 563,594 531,882 520,021 519,537 1 Internal Floor Areas excluding parkades, interstitial spaces, etc…2 United Church of Canada Facilities became part of VCH in April, 2014
Strategy Energy Management Plan Page 11

VCH Strategic Energy Management Plan
1.2.3 Key Performance Indicators
VCH uses a variety of Productivity and Activity Indicators based on patient activity, including Acute Care Inpatient Days and Cases, ALOS (Average Length of Stay) for patients for Acute, Mental Health, and Residential Care, Admissions through Emergency, as well as various employee hours analysis. Activity Indicator Guidelines used:
• Meets/Surpasses activity target and financial result is break even or surplus • Activity variance within +/- 3% and financial deficit; or activity variance below plan within >-3%
and financial surplus • Activity variance > +/- 3% and financial deficit ; or activity variance below plan >-3% and financial
surplus
1.3 UNDERSTANDING THE VCH SITUATION
VCH conducted its 6th Energy Management Assessment (EMA) on December 5, 2014. This was our 6th Session since March, 2007 and there has been continuous improvement in our scores. The latest diagnostic session revealed:
• A SEGEMA LR of 1.64; up 1.23% from the 2013 SEGEMA of 1.62 and • Our current SEGEMA TBR of 0.51, a change of 1.9% from the previous EMA, still signals some
imbalance in our energy management approach and bringing key interrelated management business practices into better alignment will work to improve the overall energy performance.
Based on the results of the diagnostic session, it is recommended that we focus on the elements of: (1) Policy, (2) Targets / Reporting, (3) Plans / Actions. (4) Teams / Committees, and (5) Employee Awareness/Training.
Detailed recommendations are in the Final Report & Action Plan. December, 2014 Appendix 2.5 VCH – EMA – Year 6 – Page 79
Strategy Energy Management Plan Page 12

VCH Strategic Energy Management Plan
1.3.1 Energy Utilities Consumption and Costs – Total and by Site - 2014 In 2014 the VCH CORE sites consumed 116,427,390 kWh of electricity, 683,814 GJ of natural gas, 156,316 litres of fuel oil, and 50,284,524 lbs of Purchased Steam (UBC Hospital and GF Strong), 1,106,483 m3 of water and sewage and generated approximately 43,600 tCO2e (tonnes) of GHG emissions for a total cost of $ 18,747,667 (Table VCH-3, 4, 5 for energy utilities and Table VCH-2 and Figure VCH-1 for total utilities including Water & Sewage). The VGH natural gas consumptions were reduced to exclude the gas GJ used to generate steam for sale to the BC Cancer buildings and the P3 Diamond Care Centre. The total costs for 2014 represents a net increase of $ 2,140,426 from the 2013 costs of $ 16,607,241. An increase of $ 897,326 (11.1%) was from electricity, $ 603,477 (11%) from gas consumptions, $ 71,919 (54.4%) from fuel oil, and $ 317,997 (38%) from purchased steam, and $ 249,707 (12.1%) from water and sewage costs. Consumptions of electricity and natural gas and costs reflect unit rate increases in 2014 of 7.3% for electricity, 12% for Natural Gas, 53.2% for Purchased steam, and 5.3% for Water and Sewage (Table VCH-2). The substantial increase in purchased steam costs for the UBC Hospital is due to the withholding of steam rates payment to the UBC Campus during 2013.
Water & Sewage units include those from 7 non-metered CORE facilities (Powell River Hospital, St Mary’s Hospital in Sechelt, Squamish General Hospital, North Shore Yiwanis Care Centre, Olive Devaud Residence in Powell River, Shorncliffe Intermediate Care in Sechelt, and Whistler Health Care Centre) representing 66,407 m2 (11.21%) of the total area of 592,296 m2 for 2013. Water and Sewage costs for these non-metered facilities are estimated annual charges.
Table VCH-2 - Total VCH CORE Sites 2014 Energy & Utilities Consumptions, Costs, and Variances from 2013
2014 Utilities Consumptions, Total and Per Unit Costs and Per Unit Cost Variances from 2013
Utility2014
ConsumptionUnits
2014Costs
($)
2014 $ %
of Total
2013Costs
($)
2014-2013Costs
($)
CostPer Unit
2014
CostPer Unit
2013
ChangeFrom2013
%Change
From2013
Electricity13 116,427,390 kWh 8,994,213$ 48% 8,096,887$ 897,326$ 0.077$ 0.072$ 0.005$ 7.3%Fuel Oil 156,316 Litres 204,031$ 1% 132,112$ 71,919$ 1.305$ 1.262$ 0.043$ 4.3%Natural Gas23 683,814 GJ 6,088,987$ 32% 5,485,510$ 603,477$ 8.904$ 7.950$ 0.954$ 12.0%Purchased Steam 50,284,524 lbs 1,155,650$ 6% 837,653$ 317,997$ 0.023$ 0.015$ 0.008$ 53.2%Water & Sewage3 1,106,483 m3 2,304,786$ 12% 2,055,079$ 249,707$ 2.083$ 1.979$ 0.104$ 5.3%
TOTAL COSTS 18,747,667$ 100% 16,607,241$ 2,140,426$ 12.89%VCH 2013 Q4 Energy Report w ith BAU report LP May 20 2014 JM Revised 5-22-2014 SEMP-VCH 2014 7-07-2014 rev 7-02-20151 Includes electrical consumption (full year) for Djavad Mow afaghian Centre for Brain health at the UBC Hospital and Diamond Health Care Centre (full year) at VGH 2 Includes Natural Gas Consumption (Partial Year) for Djavas Mow afaghian Centre for Brain health at the UBC Hospital3 The Richmond Lions Manor utilities consumptions are not included in 2014 as it w as closed it late 2013 and residents moved to a leased facility in early 2014.
Strategy Energy Management Plan Page 13

VCH Strategic Energy Management Plan
Figure VCH-1 - VCH 2014 Total Owned Acute Care and Residential Care Facilities – Consumptions Breakdown and Costs by Utility
Site Energy Consumptions, Costs and Variances – 2013 - 2014
Adjusted energy utility consumptions for VCH CORE sites are identified in Table VCH-3 for 2013 and Table VCH-4 for 2014. Individual breakdown of utilities per site for 2014 and 2013 and consumption variances are identified in Table VCH-5 for electricity, Table VCH-6 for Natural Gas, Table VCH-7 for fuel oil and Table VCH-8 for purchased steam. • The overall electrical kWh consumption for 2014 was for 116,427,590 kWh, an increase of 3,224,589
kWh (2.85%) from the 2013 consumption of 113,203,001 kWh • Electrical consumptions for the CORE hospitals for 2014 was for 108,443,330 kWh, an increase of
2,990,883 (2.84%) from the 2013 consumption of 105,457,497 kWh (Table VCH-5). Electrical consumptions for the Residential Care facilities of 7,979,260 kWh, represents an increase 233,756 kWh (3.0%) from the 2013 consumption of 7,745,504 kWh.
• Total natural gas consumptions decreased in 2014 by 15,229 GJ (2.03%) from the 2013 consumption of 749,120 GJ (Table VCH-6).
• Natural Gas consumptions for the CORE hospitals for 2014 were for 674,451 GJ, a decrease of 14,357 GJ (2.1%) from the 2013 consumption of 688,808 GJ.
• Natural Gas consumptions for the Residential Care facilities for 2014 were for 59,440 GJ, a decrease of 872 GJ (1.4%) from the 2013 consumptions of 60,312 GJ.
• Purchased steam for both the UBC Hospital and GF Strong decreased in 2014 by 4,245,224 (7.8%) from 2013 (Table VCH-8).
• Purchased fuel oil increased by 53,459 litres in 2014 (51.07%) from 2013 (Table VCH-7). Increase in fuel oil purchases in 2014 does not reflect actual use but replenishment of stored oil supplies.
• Total energy utilities and water and sewage costs of $ 18,667,667 for 2014 represents an increase of $ 2,140,426 (12.9%) from the 2013 costs of $ 16,607,241.
Strategy Energy Management Plan Page 14

VCH Strategic Energy Management Plan
Table VCH-3 - Actual Energy Utilities Consumption and Costs Breakdown for VCH CORE Sites - 2013
Total Actual 2013 Energy Utilities Consumption by Site and Costs by Fuel Type and M2 16-Jun-2015
Year 2013
CORE FACILITIES ELECTRICITY NATURAL GAS PURCHASED STEAM FUEL OILFACILITY
SIZE2
TOTAL ACTUAL COSTS
2013
TOTAL COST ($)PER M2
Site (kWh) $ $/kWh1 (GJ) $ $/GJ1 (lbs) $ $/lb1 (L) $ $/L1 (M2) $ $/M2Vancouver General Hospital + Diamond Care Centre 61,504,041 4,303,837$ 0.0700$ 392,047 2,783,739$ 7.10$ 45,889 59,264$ 1.29$ 262,525 7,146,840$ 27.22$ UBC Hospital + Brain Health 12,885,960 961,691$ 0.0746$ 41,367 324,692$ 7.85$ 37,082,381 580,845$ 0.016$ 17,553 20,398$ 1.16$ 71,370 1,887,626$ 26.45$ Whistler Health Care Centre 756,000 61,124$ 0.0809$ 4,105 79,764$ 19.43$ 0 -$ -$ 773 1,181$ 1.53$ 3,210 142,069$ 44.26$ Richmond Hospital 8,217,000 599,919$ 0.0730$ 54,273 441,817$ 8.14$ 0 -$ -$ 0 -$ -$ 34,398 1,041,736$ 30.28$ Lions Gate Hospital 9,495,013 650,317$ 0.0685$ 81,398 613,398$ 7.54$ 0 -$ -$ 12,740 16,427$ 1.29$ 61,518 1,280,142$ 20.81$ St Mary's Hospital 3,347,017 261,152$ 0.0780$ 18,720 264,480$ 14.13$ 0 -$ -$ 10,013 12,716$ 1.27$ 14,090 538,348$ 38.21$
Powell River Hospital3 4,765,240 353,116$ 0.0741$ 21,076 306,489$ 14.54$ 0 -$ -$ 16,119 19,908$ 1.24$ 15,040 679,513$ 45.18$ Squamish Hospital 2,306,226 187,532$ 0.0813$ 16,200 150,978$ 9.32$ 0 -$ -$ 1,591 2,218$ 1.39$ 14,116 340,728$ 24.14$ GF Strong 2,181,000 147,572$ 0.0677$ 239 2,694$ 11.27$ 17,447,367 256,808$ 0.015$ 0 -$ -$ 19,890 407,074$ 20.47$
HOSPITALS 105,457,497 7,526,260$ 0.0714$ 629,425 4,968,051$ 7.89$ 54,529,748 837,653$ 0.0154$ 104,678 132,112$ 1.26$ 496,157 13,464,076$ 27.14$
George Pearson Centre 1,866,524 138,307$ 0.0741$ 24,526 205,270$ 8.37$ 0 -$ -$ 0 -$ -$ 18,315 343,577$ 18.76$ Shorncliffe Intermediate Care 684,600 53,975$ 0.0788$ 1,284 22,136$ 17.24$ 0 -$ -$ 0 -$ -$ 2,718 76,111$ 28.00$ North Shore Kiwanis Care Centre 2,111,400 149,074$ 0.0706$ 16,419 138,296$ 8.42$ 0 -$ -$ 0 -$ -$ 17,248 287,370$ 16.66$ Minoru Residence 1,946,880 145,921$ 0.0750$ 15,250 124,664$ 8.17$ 0 -$ -$ 0 -$ -$ 11,890 270,585$ 22.76$ Richmond Lions ManorCedarview Lodge 1,136,100 83,350$ 0.0734$ 2,833 27,093$ 9.56$ 0 -$ -$ 0 -$ -$ 6,599 110,443$ 16.74$ Olive Devaud ResidenceNURSING AND RESIDENTIAL CARE 7,745,504 570,627$ 0.0737$ 60,312 517,459$ 8.58$ 0 -$ -$ 0 -$ -$ 56,770 1,088,086$ 19.17$
TOTALS 113,203,001 8,096,887$ 0.0715$ 689,737 5,485,510$ 7.95$ 54,529,748 837,653$ 0.015$ 104,678 132,112$ 1.26$ 552,927 14,552,162$ 26.32$ 1 Costs are based on 2013 actual costs and include electricity Demand, Levys, credits and natural gas Carbon Taxes where applicable and GST @ 5% taxes 2 VCH Internal floor areas excluding parkades, interstitials etc.. But includes added additional spaces. Diamond Care Centre is included in VGH and the Brain Health Centre (partial year) at the UBC Hospital 3 Olive Devaud utilities costs are included with Powell River Hospital SEMP - VCH 2014/VCH 2013 Q4 Energy Report with BAU report LP May 20, 2014 JM Revised 5-22-2014 SEMP-VCH-2014 7-07-2014 re 6-12-2015 - No Diamond
VCH - 2013 Energy Utilities Consumptions by Site and Cost by Fuel Type and M2
Table VCH-4 - Actual Energy Utilities Consumption and Costs Breakdown for VCH CORE Sites – 2014 and Variance from 2013
Total Actual 2014 Energy Utilities Consumption by Site and Costs by Fuel Type & by M2 15-Jun-2015
Year 2014
CORE FACILITIES ELECTRICITY NATURAL GAS PURCHASED STEAM FUEL OILFACILITY
SIZE2
TOTAL ACTUAL COSTS
2014
TOTAL COST ($)PER M2
Variance$ From
2013Variance
% From 2013
Site (kWh) $ $/kWh1 (GJ) $ $/GJ1 (lbs) $ $/lb1 (L) $ $/L1 (M2) $ $/M2 $/M2 %/M2
Vancouver General Hospital2 60,751,199 4,583,815$ 0.0755$ 390,799 3,167,419$ 8.10$ 0 -$ -$ 60,278 79,809$ 1.32$ 275,561 7,831,043$ 28.42$ 1.20 4.4%UBC Hospital + Brain Health2 16,253,920 1,257,850$ 0.0774$ 45,627 412,265$ 9.04$ 34,170,047 893,619$ 0.026$ 16,572 19,964$ 1.20$ 87,134 2,583,698$ 29.65$ 3.20 12.1%Whistler Health Care Centre 815,400 68,681$ 0.0842$ 4,044 80,864$ 20.00$ 0 -$ -$ 0 -$ -$ 3,210 149,545$ 46.59$ 2.33 5.3%Richmond Hospital 7,908,960 613,971$ 0.0776$ 49,585 463,793$ 9.35$ 0 -$ -$ 33,478 43,362$ -$ 34,398 1,121,126$ 32.59$ 2.31 7.6%Lions Gate Hospital 9,774,308 751,676$ 0.0769$ 79,959 681,747$ 8.53$ 261 6,658$ 25.51$ 7,448 9,578$ 1.29$ 61,518 1,449,659$ 23.56$ 2.75 13.2%St Mary's Hospital2 3,236,129 266,083$ 0.0822$ 16,693 234,265$ 14.03$ 0 -$ -$ 0 -$ -$ 14,091 500,348$ 35.51$ -2.70 -7.1%Powell River Hospital3 5,195,760 448,256$ 0.0863$ 21,584 307,998$ 14.27$ 0 -$ -$ 32,705 40,710$ 1.24$ 15,040 796,964$ 52.99$ 7.81 17.3%Squamish Hospital 2,303,454 177,685$ 0.0771$ 15,866 162,736$ 10.26$ 0 -$ -$ 1,753 2,254$ 1.29$ 11,181 342,675$ 30.65$ 6.51 27.0%GF Strong 2,209,000 176,708$ 0.0800$ 217 2,704$ 12.46$ 16,114,216 255,373$ 0.016$ 0 -$ -$ 19,890 434,785$ 21.86$ 1.39 6.8%HOSPITALS 108,448,130 8,344,725$ 0.0769$ 624,374 5,513,791$ 8.83$ 50,284,524 1,155,650$ 0.0230$ 152,234 195,677$ 1.29$ 522,023 15,209,843$ 29.14$ 2.00 7.4%George Pearson Centre 1,941,600 155,434$ 0.0801$ 23,453 223,091$ 9.51$ 0 -$ -$ 1,005 1,288$ 1.28$ 18,315 379,813$ 20.74$ 1.98 10.5%Shorncliffe Intermediate Care 671,400 59,180$ 0.0881$ 1,397 23,981$ 17.17$ 0 -$ -$ 0 -$ -$ 2,718 83,161$ 30.60$ 2.60 9.3%North Shore Kiwanis Care Centre 2,143,200 169,865$ 0.0793$ 15,996 150,876$ 9.43$ 0 -$ -$ 1,495 2,693$ 1.80$ 17,248 323,434$ 18.75$ 2.09 12.6%Minoru Residence 1,982,160 164,235$ 0.0829$ 15,908 148,876$ 9.36$ 0 -$ -$ 3,402 4,363$ 1.28$ 11,890 317,474$ 26.70$ 3.94 17.3%Richmond Lions ManorCedarview Lodge 1,240,900 100,774$ 0.0812$ 2,686 28,372$ 10.56$ 0 -$ -$ 0 -$ -$ 6,599 129,146$ 19.57$ 2.83 16.9%Olive Devaud Residence3
NURSING AND RESIDENTIAL CARE 7,979,260 649,488$ 0.0814$ 59,440 575,196$ 9.68$ 0 -$ -$ 5,902 8,344$ 1.41$ 56,770 1,233,028$ 21.72$ 2.55 13.3%TOTALS 116,427,390 8,994,213$ 0.0773$ 683,814 6,088,987$ 8.90$ 50,284,524 1,155,650$ 0.023$ 158,136 204,021$ 1.29$ 578,793 16,442,871$ 28.41$ 2.09 7.9%
1 Costs are based on 2014 actual costs and include electricity Demand, Levys, credits and natural gas Carbon Taxes where applicable and GST @ 5% taxes 2 VCH Internal floor areas excluding parkades , inters ti tia l s etc.. But includes added additional spaces . Diamond Care Centre i s included in VGH and the Bra in Heal th Centre (ful l year) at the UBC Hospita l 3 Ol ive Devaud res idents were moved to the new Wi l l ingdon Creek Vi l lage at Powel l Rive Hospi ta l in February, 2015. The Uti l i ties consumptions of Ol ive Devaud for 2014 are included with Powel l River. For 2015, the Wi l l ingdon Creek uti l i ties and costs wi l l replace Ol ive Devaud's data and costs
SEMP - VCH 2014/VCH 2013 Q4 Energy Report with BAU report LP May 20, 2014 JM Revised 5-22-2014 SEMP-VCH-2014 7-07-2014 rev 6-12-2015- No Diamond
VCH - 2014 Energy Utilities Consumptions by Site and Cost by Fuel Type & by M2
Strategy Energy Management Plan Page 15

VCH Strategic Energy Management Plan
Table VCH-5 - Adjusted Electrical kWh Consumptions for VCH CORE Sites 2013-2014 and Variances VCH Adjusted Electrical Consumptions Comparisons By Site - 2013 & 2014
Adjusted2013
Electrical kWhConsumptions
Adjusted2014
Electrical kWhConsumption
Electrical kWhConsumption
Variances %
Variance
SITE (kWh) (kWh) (kWh) %Vancouver General Hospital 61,504,041 60,751,199 (752,842) -1.2%UBC Hospital 12,885,960 16,253,920 3,367,960 26.1%Whistler Health Care Centre 756,000 815,400 59,400 7.9%Richmond Hospital 8,217,000 7,908,960 (308,040) -3.7%Lions Gate Hospital 9,495,013 9,774,308 279,295 2.9%St Mary's Hospital (Sechelt Hospital) 3,347,017 3,236,129 (110,888) -3.3%Powell River Hospital 4,765,240 5,195,760 430,520 9.0%Squamish Hospital 2,306,226 2,303,454 (2,772) -0.1%GF Strong 2,181,000 2,209,200 28,200 1.3%
Total Hospitals 105,457,497 108,448,330 2,990,833 2.84%George Pearson Centre 1,866,524 1,941,600 75,076 4.0%Shorncliffe Intermediate Care 684,600 671,400 (13,200) -1.9%North Shore Kiwanis Care Centre 2,111,400 2,143,200 31,800 1.5%Minoru Residence 1,946,880 1,982,160 35,280 1.8%Richmond Lions Manor (facility closed)Cedarview Lodge 1,136,100 1,240,900 104,800 9.2%Olive Devaud Residence
Total Residential Care 7,745,504 7,979,260 233,756 3.0%TOTALS 113,203,001 116,427,590 3,224,589 2.85%
SEMP - VCH 2015/Electrical BEPI Comparisson 2013 & 2014 6-30-2015
-
20,000,000
40,000,000
60,000,000
80,000,000
100,000,000
120,000,000
140,000,000
kWh 2
013 -
2014
FACILITY/SITE
Electrical kWh Consumptions Comparisons By Site - 2013 and 2014
Adjusted2013Electrical kWhConsumptions
Adjusted2014Electrical kWhConsumption
Table VCH-6 - Adjusted Natural Gas GJ Consumptions for VCH CORE Sites 2013-2014 and Variances VCH Adjusted Natural Gas Consumption By Site - 2013 & 2014
Adjusted2013
Gas GJConsumption
Adjusted2014
Gas GJConsumption
Gas GJConsumption
Variances %
Variance
SITE (GJ) (GJ) (GJ) %Vancouver General Hospital and Diamond Care 392,048 390,799 (1,249) -0.3%UBC Hospital and Brian Health* 81,018 77,131 (3,887) -4.8%Whistler Health Care Centre 4,105 4,044 (61) -1.5%Richmond Hospital 54,273 49,485 (4,788) -8.8%Lions Gate Hospital 81,398 79,959 (1,439) -1.8%St Mary's Hospital, Totem Lodge and New Tower 18,720 16,693 (2,027) -10.8%Powell River Hospital, Evergreen, and Olive Devaud 21,076 21,584 508 2.4%Squamish Hospital & Hilltop House 16,200 15,866 (334) -2.1%GF Strong* 19,970 18,890 (1,080) -5.4%
Total Hospitals 688,808 674,451 (14,357) -2.1%George Pearson Centre 24,526 23,453 (1,073) -4.4%Shorncliffe Intermediate Care 1,284 1,387 103 8.0%North Shore Kiwanis Care Centre 16,419 15,996 (423) -2.6%Minoru Residence 15,250 15,908 658 4.3%Richmond Lions Manor (Closed)Cedarview Lodge 2,833 2,686 (147) -5.2%Olive Devaud Residence (closed)
Total Residential Care 60,312 59,440 (872) -1.4%TOTAL 749,120 733,891 (15,229) -2.03%
SEMP - VCH 2015/Electrical BEPI Comparisson 2012 & 2013 7-02-2015
-
100,000
200,000
300,000
400,000
500,000
600,000
700,000
800,000
GJ N
atur
al G
as
FACILITY/SITE
Natural Gas GJ Consumption Comparisons by Site - 2013 and 2014
Adjusted2013Gas GJConsumption
Adjusted2014Gas GJConsumption
*Purchased Steam for the UBC Hospital from the UBC Campus and Purchased Steam for GF Strong from the Womens and Childrens Power Plant have been converted to GJ. Table VCH-7 - Fuel Oil Purchases/Consumptions for VCH CORE Sites 2013-2014 and Variances VCH Fuel Oil Purchases/Consumption Comparisons By Site - 2013 & 2014
2013Fuel Oil (Litres)
2014Fuel Oil (Litres)
2013-2014Fuel Oil (Litres)
Variances %
Variance
SITE Litres Litres Litres %Vancouver General Hospital and Diamond Care 45,889 60,278 14,389 31.4%UBC Hospital and Brain Health 17,553 16,572 (981) -5.6%Whistler Health Care Centre 773 - (773) -100.0%Richmond Hospital - 33,479 33,479 100.0%Lions Gate Hospital 12,740 7,448 (5,292) -41.5%St Mary's Hospital, Totem Lodge and New Tower 10,013 - (10,013) -100.0%Powell River Hospital, Evergreen, and Olive Devaud 16,119 32,705 16,586 102.9%Squamish Hospital & Hilltop House 1,591 1,753 162 10.2%GF Strong - - -
Total Hospitals 104,678 152,235 47,557 45.4%George Pearson Centre - 1,005 1,005 100.0%Shorncliffe Intermediate Care - - - North Shore Kiwanis Care Centre - 1,495 1,495 100.0%Minoru Residence - 3,402 3,402 100.0%Richmond Lions Manor (Closed)Cedarview Lodge - - - Olive Devaud Residence (closed)
Total Residential Care 0.00 5,902 5,902 100.0%TOTAL 104,678 158,137 53,459 51.07%
SEMP - VCH 2015/Electrical BEPI Comparisson 2012 & 2013 7-02-2015
-
20,000
40,000
60,000
80,000
100,000
120,000
140,000
160,000
180,000
Fuel
Oil
FACILITY/SITE
VCH Fuel Oil (litres) Comparisons - 2013 and 2014
2013Fuel Oil(Litres)
2014Fuel Oil(Litres)
Strategy Energy Management Plan Page 16

VCH Strategic Energy Management Plan
Table VCH-8 - Purchased Steam for VCH CORE Sites 2013-2014 and Variances VCH Purchased Steam By Site - 2013 - 2014
2013Purchased Steam
(lbs)
2014Purchased Steam
(lbs)
2013-2014Purchased Steam
(lbs)Variances
%Variance
SITE lbs lbs lbs %Vancouver General Hospital and Diamond CareUBC Hospital and Brain Health 37,082,481 34,170,047 (2,912,434) -7.9%Whistler Health Care Centre - Richmond Hospital Lions Gate Hospital 261 261 -100.0%St Mary's Hospital, Totem Lodge and New Tower Powell River Hospital, Evergreen, and Olive DevaudSquamish Hospital & Hilltop HouseGF Strong 17,447,367 16,114,216 (1,333,151) -7.6%
Total Hospitals 54,529,848 50,284,524 (4,245,324) -7.8%George Pearson Centre - Shorncliffe Intermediate Care - North Shore Kiwanis Care Centre - Minoru Residence - Richmond Lions Manor (Closed)Cedarview Lodge - Olive Devaud Residence (closed)
Total Residential Care - TOTAL 54,529,848 50,284,524 (4,245,324) -7.79%
SEMP - VCH 2015/Electrical BEPI Comparisson 2012 & 2013 7-02-2015
-
10,000,000
20,000,000
30,000,000
40,000,000
50,000,000
60,000,000
Pu
rch
as
ed
Ste
am
(lb
s)
FACILITY/SITE
VCH Purchased Steam (lbs) Comparisons - 2013 and 2014
2013PurchasedSteam(lbs)
2014PurchasedSteam(lbs)
1.3.2 Energy Intensity – Floor Area - 2014
From 2007 to 2014, the CORE VCH sites experienced a total net space increase of 75,602 m2 (14.6%) from 2017 and an increase of 16,313 m2 (2.82%) from 2013 (Table VCH-9). By 2015, the increases will be 87,339 m2 from the 2017 space (16.8%). The increases are the result of 8 new buildings constructed since 2007. A 9th building, the 12,400 m2 mental health facility (The Joseph and Rosalie Segal Family Health Centre), is currently under construction at the VGH site and expected to be completed and occupied in late 2017 and/or early 2018. All of these new buildings are highly energy efficient, and with 5 participating in the BC hydro’s New Construction Energy program, our energy consumption at VCH have increased and will increase accordingly. Also, effective April 1st, 2014, VCH assumed ownership of the Bella Coola General Hospital in Bella Coola and the RW Large Memorial Hospital in Bella Bella. These 2 facilities (5,089 m2) were previously owned by the United Church of Canada and were considered affiliates of Vancouver Coastal Health. These 2 facilities add a further 1% increase in VCH space when compared to the 2007 baseline
Strategy Energy Management Plan Page 17

VCH Strategic Energy Management Plan
Table VCH-9 - VCH Internal Floor Areas Changes 2007 – 2015 VCH CORE SITES - FLOOR AREA1 (M2) CHANGES 2007 - 2015
Calendar Year
Increase/Decrease
% From 2007
Increase (m2) From
2007 2015 2014 2013 2012 2011 2010 2009 2008 2007Vancouver General Hospital -5.0% -11,635 222,269 222,269 226,324 226,324 226,324 226,324 234,388 222,527 233,904VGH - ICORD/Blusson (NEW) 100% 11,861 11,861 11,861 11,861 11,861 11,861 11,861 11,861 11,861 VGH - Diamond Health Care Centre (NEW) 100% 34,727 34,727 34,727 34,727 34,727 34,727 34,727 - - - VGH - Jack Bell Robert HO (NEW) 100% 6,704 6,704 6,704 6,704 6,704 - - - - - UBC Hospital 0.0% - 71,370 71,370 71,370 71,370 71,370 71,370 71,370 71,370 71,370 j Mowafaghian Centre for Brain Health at UBCH (NEW) 100% 15,764 15,764 15,764 - - - - - - - Richmond Hospital 3.5% 1,170 34,398 34,398 34,398 34,398 34,398 34,398 33,228 33,228 33,228Lions Gate Hospital 0.0% - 61,518 61,518 61,518 61,518 61,518 61,518 61,518 61,518 61,518Lions Gate Hospital - HOPE Centre (NEW) 100% 14,000 14,000 - - - - - - - Lions Gate Hospice (NEW) 100% 3,134 3,134 3,134 3,134 3,134 3,134 - - - - St Mary's Hospital 0.0% - 8,837 8,837 8,837 8,837 8,837 8,837 8,837 8,837 8,837St. Mary's Hospital Expansion (NEW) 100% 5,254 5,254 5,254 5,254 - - - - - - Powell River Hospital / Evergreen 0.0% - 15,040 15,040 15,040 15,040 15,040 15,040 15,040 15,040 15,040Squamish Hospital / Hilltop House 0.0% - 7,252 7,252 7,252 7,252 7,252 7,252 7,252 7,252 7,252Squamish - Hilltop House North & Pharmacy Addition (NEW) 100% 3,929 3,929 3,929 3,929 3,789 3,789 3,789 - - - Whistler Health Care Centre 3.4% 90 2,755 2,755 2,755 2,755 2,755 2,755 2,665 2,665 2,665GF Strong 0.0% - 19,890 19,890 19,890 19,890 19,890 19,890 19,890 19,890 19,890
SUB-TOTAL ACUTE CARE 18.7% 84,998 538,702 524,702 512,993 507,599 500,895 497,761 466,049 454,188 453,704
George Pearson Centre 0.0% - 18,315 18,315 18,315 18,315 18,315 18,315 18,315 18,315 18,315Richmond Lions Manor -100% (6,128) - 6,128 6,128 6,128 6,128 6,128 6,128 6,128 6,1289020 Bridgeport - Replacement for Lions Manor (NEW) 100% 4,604 4,604 4,604 - - - - - - - Shorncliffe Intermediate Care 0.0% - 2,718 2,718 2,718 2,718 2,718 2,718 2,718 2,718 2,718North Shore Yiwanis Care Centre 0.0% - 17,248 17,248 17,248 17,248 17,248 17,248 17,248 17,248 17,248Cedarview Lodge 0.0% - 6,599 6,599 6,599 6,599 6,599 6,599 6,599 6,599 6,599Olive Devaud Residence -100% (2,935) - 2,935 2,935 2,935 2,935 2,935 2,935 2,935 2,935PRH Willingdon Creek Residential Care (NEW) 100% 6,800 6,800 - - - - - - - - Minoru Residence 0.0% - 11,890 11,890 11,890 11,890 11,890 11,890 11,890 11,890 11,890
SUB-TOTAL RESIDENTIAL CARE 3.6% 2,341 68,174 70,437 65,833 65,833 65,833 65,833 65,833 65,833 65,833OVERALL TOTALS - CORE FACILITIES 16.8% 87,339 606,876 595,139 578,826 573,432 566,728 563,594 531,882 520,021 519,537
NET INCREASE FROM 2007% INCREASE 16.8%
Net Increase from 2007 75,602 14.6%ADDITIONAL INCREASES
RW Large Memorial Hospital (Bella Bella) (NEW)2 100% 3,000 3,000 3,000 - - - - - - Bella Coola General Hospital (Bella Coola) (NEW)2 100% 2,089 2,089 2,089 - - - - - -
NET INCREASE FROM 2007 5,089 5,089 5,089 - 573,432 566,728 563,594 531,882 520,021 519,537 % INCREASE 1.0%
TOTAL NET INCREASE FROM 2007 17.8% 92,428 611,965 600,228 578,826 573,432 566,728 563,594 531,882 520,021 519,537 1 Internal Floor Areas excluding parkades, interstitial spaces, etc… Net Increase from 2007 80,691 15.5%2 United Church of Canada Facilities became part of VCH in April, 2014 1.3.3 Energy Intensity – Key Performance Indicators
VCHA recognizes the value and limitations of various key performance metrics (YPI). With this acknowledged, VCHA has strategically focused on the use of the following energy consumption metrics as key indicators for their energy savings initiatives as well as their GHG gas reductions initiatives. Other performance metrics will be included in the future should additional and reliable information data and resources be available.
Building Energy Performance Index (BEPI) – Electricity, Natural Gas, Purchased Steam, Fuel Oil, and Propane (ekWh/m2 or GJ/m2) Electrical Consumption (kWh/m2) Natural Gas Consumption (GJ/m2) Total Fuel Usage (Natural Gas, Purchased Steam, and Fuel oil) (ekWh/m2 or GJ/m2) Energy Cost Intensity (ECI) ($/m2) GHG emissions (tCO2e)
Strategy Energy Management Plan Page 18

VCH Strategic Energy Management Plan
1.3.4 Building Energy Performance Index (BEPI) – Total and by Site - 2014 For calendar year 2014, Building Energy Performance Index (BEPI) for the VCH CORE facilities, including 9 Acute Care and 6 Residential Care facilities (excluding Richmond Lions Manor) had an average of 572 ekWh/m2 for the Acute Care facilities, 433 ekWh/m2 for the Residential Care facilities and a combined 558/m2 for all 15 facilities (Table VCH-11). The 572 ekWh/m2 for the Acute Care facilities is a decrease of 28 ekWh/m2 (4.7%) from the 603 ekWh/m2 in 2013 (Table VCH-10) but an increase of 53 ekWh/m2 (10.2%) from NRCan’s average Benchmark of 519 for Acute care facilities for BC (Figures VCH-2 and VCH-3) and 132 ekWh/m2 (44%) from NRCan’s average Benchmark of 300 ekWh/m2 for Residential Care Facilities. Only two (2) Acute Care facilities (UBC Hospital and GF Strong) and one (1) Residential Care facility (Cedarview Lodge in North Vancouver) were better that NRCan’s Intensity Benchmarks. Lions Gate Hospital was a close third with an energy intensity of 521 ekWh/m2 compared to the NRCan’s average of 519 for Acute Care facilities. In 2014 the actual average total Building Energy Intensity (BEPI) of 572 ekWh/m2 for the Acute Care facilities represents a decrease of 28% from the BEPI of 603 for 2013, an increase of 0.23% for the Residential Care facilities (433 ekWh for 2014 from 432 for 2013) and a total combined reduction of 24% from 2013 (558 from 582) (Table VCH-12). Table VCH-10 - Adjusted Utilities Consumption and Energy Intensity for VCH CORE Sites 2013
Total Actual Energy Consumption by Energy Utility, and Energy Intensity (BEPI) per Facility - 2013 6/10/2015
Year 2013
CORE FACILITIES ELECTRICITY NATURAL GAS PURCHASED STEAM FUEL OILFACILITY
SIZE2
Total Energy1
Consumption
2013Energy
IntensityBEPI
2013ElectricityIntensity
BEPI
2013Fuel
IntensityBEPI
Site (kWh) ekWh ekWh/m2 (GJ) ekWh ekWh/m2 (lbs) ekWh ekWh/m2 (L) ekWh ekWh/m2 (M2) kWh/yr ekWh/yr/m2 ekWh/yr/m2 ekWh/yr/m2Vancouver General Hospital2
+ Diamond Care Centre 61,504,041 61,504,041 234 392,048 108,903,093 415 45,889 492,848 1.88 262,525 170,899,982 651 234 417UBC Hospital+Brain Health2 12,885,960 12,885,960 181 41,367 11,490,925 161 37,082,381 10,896,254 153 17,553 188,519 2.64 71,370 35,461,659 497 181 316Whistler Health Care Centre 756,000 756,000 236 4,105 1,140,287 355 0 - - 773 8,302 2.59 3,210 1,904,589 593 236 358Richmond Hospital 8,217,000 8,217,000 239 54,273 15,075,954 438 0 - - 0 - - 34,398 23,292,954 677 239 438Lions Gate Hospital 9,495,013 9,495,013 154 81,398 22,610,736 368 0 - - 12,740 136,828 2.22 61,518 32,242,577 524 154 370St Mary's Hospital 3,347,017 3,347,017 238 18,720 5,200,042 369 0 - - 10,013 107,540 7.63 14,090 8,654,598 614 238 377Powell River Hospital 3 4,765,240 4,765,240 317 21,076 5,854,491 389 0 - - 16,119 173,118 11.51 15,040 10,792,849 718 317 401Squamish Hospital 2,306,226 2,306,226 206 16,200 4,500,036 402 0 - - 1,591 17,087 1.53 11,181 6,823,349 610 206 404GF Strong 2,181,000 2,181,000 110 239 66,389 3 17,447,367 5,126,719 258 0 - - 19,890 7,374,108 371 110 261HOSPITALS 105,457,497 105,457,497 214 629,426 174,841,954 354 54,529,748 16,022,973 32 104,678 1,124,242 2.28 493,222 297,446,666 603 214 389George Pearson Centre 1,866,524 1,866,524 102 24,526 6,812,832 372 0 - - 0 - - 18,315 8,679,356 474 102 372Shorncliffe Intermediate Care 684,600 684,600 252 1,284 356,670 131 0 - - 0 - - 2,718 1,041,270 383 252 131North Shore Kiwanis Care Centre 2,111,400 2,111,400 122 16,419 4,560,870 264 0 - - 0 - - 17,248 6,672,270 387 122 264Minoru Residence 1,946,880 1,946,880 164 15,250 4,236,145 356 0 - - 0 - - 11,890 6,183,025 520 164 356Richmond Lions Manor4
Cedarview Lodge 1,136,100 1,136,100 172 2,833 786,951 119 0 - - 0 - - 6,599 1,923,051 291 172 119Olive Devaud ResidenceNURSING AND RESIDENTIAL CARE 7,745,504 7,745,504 136 60,312 16,753,467 295 0 - - 0 - - 56,770 24,498,971 432 136 295
TOTALS 113,203,001 113,203,001 206 689,738 191,595,422 348 54,529,748 16,022,973 29 104,678 1,124,242 2.04 549,992 321,945,638 585 206 3801 Includes Electricity, Natural Gas, Purchased Steam, and Fuel Oil but excludes Water and Sewage2 VCH Internal floor areas excluding parkades, interstitials etc.. But includes added additional spaces. Diamond Care Centre is included with VGH. UBC Hospital includes the Brain Health Centre (partial year)3 Powell River Hospital Includes Evergreen and Olive Devaud4 Richmond Lions Manor was closed in 2014. It is not included in 2013 for comparisson purposes with 2014SEMP - VCH 2014/VCH 2013 Q4 Energy Report w ith BAU report LP May 20, 2014 JM Revised 5-22-2014 SEMP-VCH-2014 7-07-2014 rev 6-12-2015 - No Diamond
VCH - 2013 Energy Utilities Consumptions, and Energy Intensity (BEPI) by Site
Strategy Energy Management Plan Page 19

VCH Strategic Energy Management Plan
Table VCH-11 - Adjusted Utilities Consumption and Energy Intensity for VCH CORE Sites - 2014 Total Actual Energy Consumption by Energy Utility, and Energy Intensity (BEPI) per Facility - 2014 6/10/2015
Year 2014
CORE FACILITIES ELECTRICITY NATURAL GAS PURCHASED STEAM FUEL OILFACILITY
SIZE2
Total Energy1
Consumption
2014Energy
IntensityBEPI
2014ElectricityIntensity
BEPI
2014Fuel
IntensityBEPI
Site (kWh) ekWh ekWh/m2 (GJ) ekWh ekWh/m2 (lbs) ekWh ekWh/m2 (L) ekWh ekWh/m2 (M2) kWh/yr ekWh/yr/m2 ekWh/yr/m2 ekWh/yr/m2Vancouver General Hospital + Diamond Care Centre 60,751,199 60,751,199 220 390,799 108,556,146 394 60,278 647,386 2.35 275,561 169,954,731 617 220 396UBC Hospital + Brain Health 16,253,920 16,253,920 187 45,627 12,674,268 145 34,170,047 10,040,497 115 16,572 177,983 2.04 87,134 39,146,668 449 187 263Whistler Health Care Centre 815,400 815,400 296 4,044 1,123,342 408 0 - - 0 - - 2,755 1,938,742 704 296 408Richmond Hospital 7,908,960 7,908,960 230 49,585 13,773,721 400 0 - - 33,478 359,554 10.45 34,398 22,042,235 641 230 411Lions Gate Hospital 9,774,308 9,774,308 159 79,959 22,211,011 361 261 84 0 7,448 79,992 1.30 61,518 32,065,387 521 159 362St Mary's Hospital 3,236,129 3,236,129 230 16,693 4,636,982 329 0 - - 0 - - 14,091 7,873,111 559 230 329Powell River Hospital 5,195,760 5,195,760 345 21,584 5,995,604 399 0 - - 32,705 351,252 23.35 15,040 11,542,615 767 345 422Squamish Hospital 2,303,454 2,303,454 206 15,866 4,407,257 394 0 - - 1,753 18,827 1.68 11,181 6,729,539 602 206 396GF Strong 2,209,200 2,209,200 111 217 60,278 3 16,114,216 4,734,987 238 0 - - 19,890 7,004,465 352 111 241HOSPITALS 108,448,330 108,448,330 208 624,374 173,438,610 333 50,284,524 14,775,568 28 152,234 1,634,993 3.13 521,568 298,297,493 572 208 364George Pearson Centre 1,941,600 1,941,600 106 23,453 6,514,774 356 0 - - 1,005 10,794 0.59 18,315 8,467,168 462 106 356Shorncliffe Intermediate Care 671,400 671,400 247 1,397 388,059 143 0 - - 0 - - 2,718 1,059,459 390 247 143North Shore Kiwanis Care Centre 2,143,200 2,143,200 124 15,996 4,443,369 258 0 - - 1,495 16,056 0.93 17,248 6,602,625 383 124 259Minoru Residence 1,982,160 1,982,160 167 15,908 4,418,924 372 0 - - 3,402 36,537 3.07 11,890 6,437,622 541 167 375Richmond Lions Manor3
Cedarview Lodge 1,240,900 1,240,900 188 2,686 746,117 113 0 - - 0 - - 6,599 1,987,017 301 188 113Olive Devaud Residence4 -
NURSING AND RESIDENTIAL CARE 7,979,260 7,979,260 141 59,440 16,511,243 291 0 - - 5,902 63,387 1.12 56,770 24,553,891 433 141 292TOTALS 116,427,590 116,427,590 201 683,814 189,949,853 328 50,284,524 14,775,568 26 158,136 1,698,381 2.94 578,338 322,851,384 558 201 357
1 Includes Electricity, Natural Gas, Purchased Steam, and Fuel Oil but excludes Water and Sew age2 VCH Internal f loor areas excluding parkades, interstitials etc.. But includes added additional spaces. Diamond Care Centre at the VGH and the Brain Health Centre at the UBCH are included
3 The Richmond Lions Manor w as closed in February 2014 and the residents relocated to a leased facility in Richmond4 Olive Devaud has been included in Pow ell River Hospital
SEMP - VCH 2014/VCH 2013 Q4 Energy Report w ith BAU report LP May 20, 2014 JM Revised 5-22-2014 SEMP-VCH-2014 7-07-2014 rev 6-11-2015 - No Diamond
VCH - 2014 Energy Utilities Consumptions, and Energy Intensity (BEPI) by Site
Table VCH-12 - Adjusted 2014 Utilities Consumption and Total Energy Intensity for VCH CORE Sites and Variances from 2013
Total Actual Energy Consumption by Energy Utility, and Energy Intensity (BEPI) per Facility - 2014 and BEPI Variance from 2013 6/10/2015
Year 2014
CORE FACILITIES ELECTRICITY NATURAL GAS PURCHASED STEAM FUEL OILFACILITY
SIZE2
Total Energy1
Consumption
2014Energy
IntensityBEPI
2013Energy
IntensityBEPI
2014-2013Energy
IntensityVARIANCE
Site (kWh) ekWh ekWh/m2 (GJ) ekWh ekWh/m2 (lbs) ekWh ekWh/m2 (L) ekWh ekWh/m2 (M2) kWh/yr ekWh/yr/m2 ekWh/yr/m2 ekWh/yr/m2Vancouver General Hospital + Diamond Care Centre 60,751,199 60,751,199 220 390,799 108,556,146 394 60,278 647,386 2.35 275,561 169,954,731 617 651 -34UBC Hospital + Brain Health 16,253,920 16,253,920 187 45,627 12,674,268 145 34,170,047 10,040,497 115 16,572 177,983 2.04 87,134 39,146,668 449 497 -48Whistler Health Care Centre 815,400 815,400 296 4,044 1,123,342 408 0 - - 0 - - 2,755 1,938,742 704 593 111Richmond Hospital 7,908,960 7,908,960 230 49,585 13,773,721 400 0 - - 33,478 359,554 10.45 34,398 22,042,235 641 677 -36Lions Gate Hospital 9,774,308 9,774,308 159 79,959 22,211,011 361 261 84 0 7,448 79,992 1.30 61,518 32,065,387 521 524 -3St Mary's Hospital 3,236,129 3,236,129 230 16,693 4,636,982 329 0 - - 0 - - 14,091 7,873,111 559 614 -55Powell River Hospital 5,195,760 5,195,760 345 21,584 5,995,604 399 0 - - 32,705 351,252 23.35 15,040 11,542,615 767 718 49Squamish Hospital 2,303,454 2,303,454 206 15,866 4,407,257 394 0 - - 1,753 18,827 1.68 11,181 6,729,539 602 483 119GF Strong 2,209,200 2,209,200 111 217 60,278 3 16,114,216 4,734,987 238 0 - - 19,890 7,004,465 352 371 -19HOSPITALS 108,448,330 108,448,330 208 624,374 173,438,610 333 50,284,524 14,775,568 28 152,234 1,634,993 3.13 521,568 298,297,493 572 600 -28George Pearson Centre 1,941,600 1,941,600 106 23,453 6,514,774 356 0 - - 1,005 10,794 0.59 18,315 8,467,168 462 474 -12Shorncliffe Intermediate Care 671,400 671,400 247 1,397 388,059 143 0 - - 0 - - 2,718 1,059,459 390 383 7North Shore Kiwanis Care Centre 2,143,200 2,143,200 124 15,996 4,443,369 258 0 - - 1,495 16,056 0.93 17,248 6,602,625 383 387 -4Minoru Residence 1,982,160 1,982,160 167 15,908 4,418,924 372 0 - - 3,402 36,537 3.07 11,890 6,437,622 541 520 21Richmond Lions Manor3
Cedarview Lodge 1,240,900 1,240,900 188 2,686 746,117 113 0 - - 0 - - 6,599 1,987,017 301 291 10Olive Devaud Residence4 - 0NURSING AND RESIDENTIAL CARE 7,979,260 7,979,260 141 59,440 16,511,243 291 0 - - 5,902 63,387 1.12 56,770 24,553,891 433 432 1
TOTALS 116,427,590 116,427,590 201 683,814 189,949,853 328 50,284,524 14,775,568 26 158,136 1,698,381 2.94 578,338 322,851,384 558 582 -241 Includes Electricity, Natural Gas, Purchased Steam, and Fuel Oil but excludes Water and Sew age2 VCH Internal f loor areas excluding parkades, interstitials etc.. But includes added additional spaces. Diamond Care Centre at the VGH and the Brain Health Centre at the UBCH are included
3 The Richmond Lions Manor w as closed in February 2014 and the residents relocated to a leased facility in Richmond4 Olive Devaud has been included in Pow ell River Hospital
SEMP - VCH 2014/VCH 2013 Q4 Energy Report w ith BAU report LP May 20, 2014 JM Revised 5-22-2014 SEMP-VCH-2014 7-07-2014 rev 6-11-2015 - No Diamond
VCH - 2014 Energy Utilities Consumptions, and Energy Intensity (BEPI) by Site and BEPI Variance from 2013
Strategy Energy Management Plan Page 20

VCH Strategic Energy Management Plan
Table VCH-13 - Adjusted Total Energy Intensity (BEPI) Comparisons by Site – 2013-2014
VCH Adjusted Total Energy Intensity BEPIs Comparisons By Site - 2013 & 2014
Adjusted2013
Energy Intensity
(BEPI)
Adjusted2014
Energy Intensity
(BEPI)
Energy Intensity
(BEPI)Variances
%Variance
SITE (ekWh/yr/m2) (ekWh/yr/m2)(ekWh/yr/m2) %Vancouver General Hospital and Diamond Care 651 617 (34) -5.2%UBC Hospital and Brain Health 497 449 (48) -9.7%Whistler Health Care Centre 593 704 111 18.7%Richmond Hospital 677 641 (36) -5.3%Lions Gate Hospital 524 521 (3) -0.6%St Mary's Hospital, Totem Lodge and New Tower 614 559 (55) -9.0%Powell River Hospital, Evergreen, and Olive Devaud 718 767 49 6.8%Squamish Hospital & Hilltop House 610 602 (8) -1.3%GF Strong 371 352 (19) -5.1%
Total Hospitals 600 572 (28) -4.7%George Pearson Centre 474 462 (12) -2.5%Shorncliffe Intermediate Care 383 390 7 1.8%North Shore Kiwanis Care Centre 387 383 (4) -1.0%Minoru Residence 520 541 21 4.0%Richmond Lions Manor (Closed)Cedarview Lodge 291 301 10 3.4%Olive Devaud Residence (closed)
Total Residential Care 432 433 1 0.2%TOTAL 582 558 (24.0) -4.12%
SEMP - VCH 2015/Electrical BEPI Comparisson 2012 & 2013 7-02-2015
-
100
200
300
400
500
600
700
800
900
BE
PI
-e
kW
h/y
r/m
2
FACILITY/SITE
VCH Total Building Energy Intensity (BEPI) Comparisons 2013 and 2014
Adjusted2013EnergyIntensity(BEPI)
Adjusted2014EnergyIntensity(BEPI)
Electrical Energy Consumptions and Intensity – 2014 For Electrical BEPIs, the adjusted 208 kWh/m2 for Acute Care Facilities for 2014 represents a decrease of 2.9% from the electrical BEPI of 214 for 2013 for the same facilities (Table VCH-15). For the Residential Care facilities, the electrical BEPI of 141 kWh/m2 for 2014 represents an increase of 3.6% from the 2013 BEPI of 136. Total combined electricity fuel consumption BEPIs is at 201 kWh/m2 for 2014 compared with 206 kWh/m2 for 2013, an overall decrease of 2.4%. Table VCH-14 - Adjusted Electrical kWh Consumptions for VCH CORE Sites 2013-2014 and Variances VCH Adjusted Electrical Consumptions Comparisons By Site - 2013 & 2014
Adjusted2013
Electrical kWhConsumptions
Adjusted2014
Electrical kWhConsumption
Electrical kWhConsumption
Variances %
Variance
SITE (kWh) (kWh) (kWh) %Vancouver General Hospital 61,504,041 60,751,199 (752,842) -1.2%UBC Hospital 12,885,960 16,253,920 3,367,960 26.1%Whistler Health Care Centre 756,000 815,400 59,400 7.9%Richmond Hospital 8,217,000 7,908,960 (308,040) -3.7%Lions Gate Hospital 9,495,013 9,774,308 279,295 2.9%St Mary's Hospital (Sechelt Hospital) 3,347,017 3,236,129 (110,888) -3.3%Powell River Hospital 4,765,240 5,195,760 430,520 9.0%Squamish Hospital 2,306,226 2,303,454 (2,772) -0.1%GF Strong 2,181,000 2,209,200 28,200 1.3%
Total Hospitals 105,457,497 108,448,330 2,990,833 2.84%George Pearson Centre 1,866,524 1,941,600 75,076 4.0%Shorncliffe Intermediate Care 684,600 671,400 (13,200) -1.9%North Shore Kiwanis Care Centre 2,111,400 2,143,200 31,800 1.5%Minoru Residence 1,946,880 1,982,160 35,280 1.8%Richmond Lions Manor (facility closed)Cedarview Lodge 1,136,100 1,240,900 104,800 9.2%Olive Devaud Residence
Total Residential Care 7,745,504 7,979,260 233,756 3.0%TOTALS 113,203,001 116,427,590 3,224,589 2.85%
SEMP - VCH 2015/Electrical BEPI Comparisson 2013 & 2014 6-30-2015
-
20,000,000
40,000,000
60,000,000
80,000,000
100,000,000
120,000,000
140,000,000
kWh
2013
-20
14
FACILITY/SITE
Electrical kWh Consumptions Comparisons By Site - 2013 and 2014
Adjusted2013Electrical kWhConsumptions
Adjusted2014Electrical kWhConsumption
Strategy Energy Management Plan Page 21

VCH Strategic Energy Management Plan
Table VCH-15 - VCH Acute Care and Residential Care Electricity Energy Intensity 2013 and 2014 Comparison
VCH Adjusted Electrical BEPIs Comparisons By Site - 2013 & 2014
Adjusted2013
ElectricalBEPI
Adjusted2014
ElectricalBEPI
Electrical BEPI
Variances %
Variance
SITE (ekWh/yr/m2)(ekWh/yr/m2)(ekWh/yr/m2) %Vancouver General Hospital 234 220 (14) -6.1%UBC Hospital 181 187 6 3.2%Whistler Health Care Centre 236 296 60 20.3%Richmond Hospital 239 230 (9) -3.9%Lions Gate Hospital 154 159 5 2.9%St Mary's Hospital (Sechelt Hospital) 238 230 (8) -3.5%Powell River Hospital 317 345 28 8.1%Squamish Hospital 206 206 - 0.0%GF Strong 110 111 1 0.9%
Total Hospitals 214 208 (6) -2.9%George Pearson Centre 102 106 4 3.8%Shorncliffe Intermediate Care 252 247 (5) -2.0%North Shore Kiwanis Care Centre 122 124 2 1.6%Minoru Residence 164 167 3 1.8%Richmond Lions Manor (facility closed)Cedarview Lodge 172 188 16 8.5%Olive Devaud Residence
Total Residential Care 136 141 5 3.5%TOTALS 206 201 (5.0) -2.49%
SEMP - VCH 2015/Electrical BEPI Comparisson 2013 & 2014 6-29-2015
113,208,001 kWh
116,427,590 kWh
(3,219,589) kWh -2.84%
0
50
100
150
200
250
300
350
400
BEPI
-kW
h/yr
/m2
FACILITY/SITE
Electrical Energy Intensity BEPI Comparisons 2013 and 2014
Adjusted2013ElectricalBEPI
Adjusted2014ElectricalBEPI
The total adjusted electrical consumption in 2014 (116,427,590 kWh) for the Acute Care facilities increased by 3,219,589kWh (2.84%) from the 2013 consumption of 113,206,001 kWh (Table VCH-14). Variance Clarifications:
• The UBCH Hospital’s electrical consumption in 2014 increased by 3,367,960 kWh (20.7%) from 2013 due to construction activity and the opening of a new 15,764 m2 facility in 2014 (the Djavad Mowafaghian Centre for Brain Health Centre). This facility was still under construction in 2013. This clinical facility increased the square footage of the UBC Hospital by 22.1%
• The Whistler Health Care Centre electrical consumption increase of 59,400 kWh (7.3%) is due to the increased patient use of radiology equipment and the CT scanner in the winter months (due to the warmer winter and falls due to slippery ice) as well as the occupancy of closed areas on the 2nd floor of the facility.
• the Lions Gate Hospital electrical consumption increased by 279,295 kWh (2.9%) resulting from operational activity increases, particularly in the recently renovated and expanded Emergency.
• The Powell River Hospital electrical consumption increased by 430,520 kWh (8.3%) due to construction activity of the Willingdon Creek Village Residential Care facility (6,800 m2). This facility was opened in late 2014 and was using the electrical lines of the hospital during the construction phase. Substantial use of electrical dehumidifiers were in use during the latter part of the construction period in preparation for painting. Olive Devaud electrical consumption has been included in Powell River hospital as it was closed in late 2014 and the residents relocated to the new Willingdon Creek Village in February 2015.
• Vancouver General Hospital’s electrical consumption decreased by 752,842 kWh (1.2%) resulting from the COP implementation of JP South (76,692 m2), major multi buildings lighting retrofits in 2013, as well as closure and demolition of Willow Chest Centre (3,608 m2).
• The total electrical consumption for the Residential Care facilities in 2014 (7,979,260 kWh) increased by 233,756 kWh (2.9%) from the 2013 consumptions of 7,745,504 kWh. Electrical consumption at Minoru Residence in Richmond increased by 35,280 kWh (1.8%) and Cedar Lodge kWh Increased by 104,800 kWh (8.4%) due to increased air conditioning and chillers use.
• The total electrical intensity for the VCH Core sites decreased by 2.9% from that of 2013 (Table VCH-15).
Strategy Energy Management Plan Page 22

VCH Strategic Energy Management Plan
Natural Gas Consumptions and Intensity – 2014 Table VCH-16 - Adjusted Natural Gas GJ Consumptions for VCH CORE Sites 2013-2014 and Variances VCH Adjusted Natural Gas Consumption By Site - 2013 & 2014
Adjusted2013
Gas GJConsumption
Adjusted2014
Gas GJConsumption
Gas GJConsumption
Variances %
Variance
SITE (GJ) (GJ) (GJ) %Vancouver General Hospital and Diamond Care 392,048 390,799 (1,249) -0.3%UBC Hospital and Brian Health* 81,018 77,131 (3,887) -4.8%Whistler Health Care Centre 4,105 4,044 (61) -1.5%Richmond Hospital 54,273 49,485 (4,788) -8.8%Lions Gate Hospital 81,398 79,959 (1,439) -1.8%St Mary's Hospital, Totem Lodge and New Tower 18,720 16,693 (2,027) -10.8%Powell River Hospital, Evergreen, and Olive Devaud 21,076 21,584 508 2.4%Squamish Hospital & Hilltop House 16,200 15,866 (334) -2.1%GF Strong* 19,970 18,890 (1,080) -5.4%
Total Hospitals 688,808 674,451 (14,357) -2.1%George Pearson Centre 24,526 23,453 (1,073) -4.4%Shorncliffe Intermediate Care 1,284 1,387 103 8.0%North Shore Kiwanis Care Centre 16,419 15,996 (423) -2.6%Minoru Residence 15,250 15,908 658 4.3%Richmond Lions Manor (Closed)Cedarview Lodge 2,833 2,686 (147) -5.2%Olive Devaud Residence (closed)
Total Residential Care 60,312 59,440 (872) -1.4%TOTAL 749,120 733,891 (15,229) -2.03%
SEMP - VCH 2015/Electrical BEPI Comparisson 2012 & 2013 7-02-2015
-
100,000
200,000
300,000
400,000
500,000
600,000
700,000
800,000
GJ N
atur
al G
as
FACILITY/SITE
Natural Gas GJ Consumption Comparisons by Site - 2013 and 2014
Adjusted2013Gas GJConsumption
Adjusted2014Gas GJConsumption
*Purchased Steam for the UBC Hospi ta l from the UBC Campus and Purchased Steam for GF Strong from the Womens and Chi ldrens Power Plant have been converted to GJ.
Table VCH-17 - VCH Acute Care and Residential Care Natural Gas GJ Energy Intensity 2013 and 2014 Comparison
VCH Adjusted Natural Gas BEPIs Comparisons By Site - 2013 & 2014
Adjusted2013GasBEPI
Adjusted2014GasBEPI
Natural GasBEPI
Variances %
Variance
SITE (ekWh/yr/m2) (ekWh/yr/m2)(ekWh/yr/m2) %Vancouver General Hospital and Diamond Care 415 394 (21) -5.3%UBC Hospital and Brian Health* 314 260 (54) -20.8%Whistler Health Care Centre 355 408 53 13.0%Richmond Hospital 438 400 (38) -9.5%Lions Gate Hospital 368 361 (7) -1.9%St Mary's Hospital, Totem Lodge and New Tower 369 329 (40) -12.2%Powell River Hospital, Evergreen, and Olive Devaud 389 399 10 2.5%Squamish Hospital & Hilltop House 402 394 (8) -2.0%GF Strong 261 241 (20) -8.3%
Total Hospitals 386 361 (25) -6.9%George Pearson Centre 372 356 (16) -4.5%Shorncliffe Intermediate Care 131 143 12 8.4%North Shore Kiwanis Care Centre 264 268 4 1.5%Minoru Residence 356 372 16 4.3%Richmond Lions Manor (Closed)Cedarview Lodge 119 113 (6) -5.3%Olive Devaud Residence (closed)
Total Residential Care 295 291 (4) -1.4%TOTAL 348 328 (20.0) -6.10%
SEMP - VCH 2015/Electrical BEPI Comparisson 2012 & 2013 7-02-2015
-
50
100
150
200
250
300
350
400
450
500
BEP
I -kW
h/yr
/m2
FACILITY/SITE
Natural Gas Energy Intensity BEPI Comparisons 2013 and 2014
Adjusted2013GasBEPI
Adjusted2014GasBEPI
*BEPIs for the UBC Hospital and GF Strong include GJ for Purchased Steam Natural Gas consumption for 2014 was reduced by 14,357 GJ (2.1%) for Acute Care facilities, 872 GJ (1.4%) for Residential Care facilities and a combined 15,229 GJ (2.03%) reduction from the 2013 consumptions (Table VCH-16).
• Gas consumption at the UBC Hospital was reduced by 3,887 GJ (4.8%) primarily from the reduction of purchased steam from the UBC Campus as well as a reduction of 512 GJ Natural Gas GJ (1.3%) purchased from Fortis BC.
Strategy Energy Management Plan Page 23

VCH Strategic Energy Management Plan
• The Powell River Hospital increased Gas consumption of 508 GJ (2.4%) due to construction activity of the Willingdon Creek Village Residential Care facility (6,800 m2) that was opened in late 2014 (the heating of the new building is through the Powell River Hospital’s boilers). Olive Devaud Gas consumption has been included in Powell River Hospital.
• Gas consumption at GF Strong was reduced by 1,058 GJ (5.4%) due to a reduction of purchased steam from the Womens and Childrens Hospital as well as a reduction of 22 GJ (9.2%) from GJ purchased from Fortis BC.
• Gas consumption at St Mary’s Hospital (now Sechelt Hospital) was reduced by 2017 GJ (10.8%) resulting from the GeoExchange installation in the new tower.
• Overall Natural Gas BEPI in 2014 was reduced by 6.10% from that of 2013 (Table VCH-17). Fuel Oil Purchases/Consumptions – 2014 Table VCH-18 - Fuel Oil Purchases/Consumptions for VCH CORE Sites 2013-2014 and Variances VCH Fuel Oil Purchases/Consumption Comparisons By Site - 2013 & 2014
2013Fuel Oil (Litres)
2014Fuel Oil (Litres)
2013-2014Fuel Oil (Litres)
Variances %
Variance
SITE Litres Litres Litres %Vancouver General Hospital and Diamond Care 45,889 60,278 14,389 31.4%UBC Hospital and Brain Health 17,553 16,572 (981) -5.6%Whistler Health Care Centre 773 - (773) -100.0%Richmond Hospital - 33,479 33,479 100.0%Lions Gate Hospital 12,740 7,448 (5,292) -41.5%St Mary's Hospital, Totem Lodge and New Tower 10,013 - (10,013) -100.0%Powell River Hospital, Evergreen, and Olive Devaud 16,119 32,705 16,586 102.9%Squamish Hospital & Hilltop House 1,591 1,753 162 10.2%GF Strong - - -
Total Hospitals 104,678 152,235 47,557 45.4%George Pearson Centre - 1,005 1,005 100.0%Shorncliffe Intermediate Care - - - North Shore Kiwanis Care Centre - 1,495 1,495 100.0%Minoru Residence - 3,402 3,402 100.0%Richmond Lions Manor (Closed)Cedarview Lodge - - - Olive Devaud Residence (closed)
Total Residential Care 0.00 5,902 5,902 100.0%TOTAL 104,678 158,137 53,459 51.07%
SEMP - VCH 2015/Electrical BEPI Comparisson 2012 & 2013 7-02-2015
-
20,000
40,000
60,000
80,000
100,000
120,000
140,000
160,000
180,000F
ue
l Oil
FACILITY/SITE
VCH Fuel Oil (litres) Comparisons - 2013 and 2014
2013Fuel Oil(Litres)
2014Fuel Oil(Litres)
The total Fuel Oil purchases in 2014 increased by 53,459 litres from 2013 (51.07%). The majority of the fuel oil is used as a backup for natural gas during curtailments in winter. This applies primarily to the large facilities and hardly, if at all, to the residential care facilities. Some fuel oil is used for generators testing and a substantial amount of purchased oil is not used but is purchased as contingency in the event of gas curtailment in the winter months. Smaller sites, including residential care facilities, do not get gas curtailed in the winter months
Strategy Energy Management Plan Page 24

VCH Strategic Energy Management Plan
Figure VCH-2 - VCH 2014 Acute Care Facilities - Energy Intensity by Site
*St Mary’s Hospital includes the new tower. UBC Hospital includes the new Brain Health Centre. Powell River Hospital includes Evergreen Residence and Olive Devaud. VGH includes the P3 Diamond Care Centre
Figure VCH-3 - VCH 2014 Residential Care Facilities - Energy Intensity by Site
*Olive Devaud Residence was closed and residence moved to the new Willingdon Creek Village. The intensity is now included with Powell River Hospital. Richmond Lions manor was also closed in 2014 and residents moved to a leased facility.
Strategy Energy Management Plan Page 25

VCH Strategic Energy Management Plan
1.3.5 Worst Performing Buildings – BEPIs - Hospitals and Long Term Care Facilities
Overall, the VCH Acute Care facilities have shown substantial improvement (4.7%) in the total Building Energy Intensity (BEPI) in 2014 as compared to 2013 (Table VCH-13) with the exception of Whistler Health Care Centre, which experienced an increase of 18.7%, and Power River Hospital, which experienced an increase of 6.8% from 2013. Total adjusted electrical BEPIs for the acute care facilities also show an overall decrease of 2.9% from 2013. Whistler Health Care Centre indicates an increase of 20.3% from 2013 reflecting the increase of kWh consumption of 59,400 (7.9%) kWh for operational reasons (Tables VCH-13, VCH-14). The UBC Hospital and Powell River Hospital electrical consumptions also increased by 26.1% and 9.0% due to new construction. For the Residential Care facilities, the overall building intensity increased by 0.2% and the adjusted electrical consumption increased by 3.0% (233,756 kWh) from 2013 resulting mainly from the increased use of chillers in the summer months (Table VCH-13, VCH-14). The worst performing buildings, in part, only reflects the total Building Energy Intensity as compared to NRCan’s average BEPI (for lack of any other measure at this time) for BC (Figure VCH-3, VCH-4). Worst Performing Buildings – Hospitals Vancouver General Hospital - Vancouver: Vancouver General Hospital (VGH) is our most intense Acute Care, research and teaching facility and the largest (275,561 m2) in VCH’s buildings portfolio with over 24 buildings with some buildings dating back to the 1920s. The site is under on-going development with some of the older buildings undergoing major renovations or replaced with new and high energy efficient ones but higher intensity 24/7 in-patient buildings. A low energy intensity building (Willow Pavilion – 5,378 m2) was renovated to a 24/7 in-patient building in 2012/2013. A 2nd low energy intensity building (Willow Chest) was demolished in 2014 and a new 24/7 in-patient building (LEED Gold construction) is currently under construction (The Joe and Rosalee Segal Family Care Centre). • While VGH’s electricity consumption decreased in 2014 by 762,842 kWh (1.2%) from 2013 due to a
number of electrical savings projects (lighting retrofits in 7 buildings) and COP measures implementation completed in late 2013 and additional COPs ongoing in 2014. A number of other energy savings measures are currently in progress and/or planned for 2015.
• Savings from 8 COP projects, currently in various phases of investigation and/or implementation. • A COP implementation for JP South has just been completed for an estimated savings of 1.95 GWh
and 7,241 GJ of natural gas savings. • An approved chiller upgrade project, completed in March 2015 in JP South, will generate an
estimated savings of 420,000 kWh per annum. • An approved 2014 Ministry funded CNCP project (Carbon Neutral Capital Program) to replace the 33
year old JP North DHW system saved an estimated 2,711 GJ of natural gas per annum. • For 2014, there was a decrease in the gas consumption of 1,249 GJ (0.3%) from 2013’s reduction of
building intensity of 3.1% (615 from 635 ekWh/m2). • The overall Building Energy Intensity (BEPI) is higher than NRCan’s average of 519 by 97 ekWh/m2
(18.7%) and primarily due to Gas consumption. Natural gas at the VGH is used to generate steam for the VGH buildings heating and approximately 33% of the team is lost through transmission resulting in substantial higher natural gas usage and impacts the VGH’s energy intensity. As old buildings are demolished, they are being replaced by more efficient hot water systems rather than steam from the VGH steam plant.
Strategy Energy Management Plan Page 26

VCH Strategic Energy Management Plan
Richmond General Hospital - Richmond
Richmond General Hospital (43,546 m2 including a 12,910 m2 interior parking space) is a 175-bed acute community hospital serving Richmond, Delta and travellers using the Vancouver International Airport and the BC Ferries.
• Total Energy Intensity for RGH for 2014 shows a reduction of 5.3% from 2013 (Table VCH-13). • Electrical Intensity for 2014 was reduced by 3.9% from that of 2013 (Table VCH-15). • RGH electrical consumption for 2014 shows a reduction of 308,040 kWh (3.7%) from the 2013
consumption (Table VCH-14) in spite of impact of operational pressures and on-going renovations and construction.
• Overall building energy intensity was reduced by 5.3% in 2014 from 2013 (Table VCH-13). • Natural Gas consumption was also reduced in 2014 by 4,788 GJ (8.8%) from the 2013 consumption
(Table VCH-16). A new lighting retrofit has been approved for 2015 with an estimated savings of 75,000 kWh and planned for completion by March 2016. Whistler Health Care Centre - Whistler Whistler Health Care Centre is a 2,755 m2 facility in Whistler BC. While this facility does not have inpatient units at this time, it provides substantial emergency services and clinical support to Whistler and the neighbouring communities. Total Building Energy Intensity in 2014 increased by 18.7% from 2013, Electrical BEPI increased 20.3% and electrical consumption increased by 59,400 kWh (7.9%) from 2013 mostly due to the increased use of emergency services and radiology/imaging and CT Scan use (Tables VCH-13,14, 15) and the reopening of previously closed areas of the building.
• Funding was approved by the MOH in 2014 under CNCP (Carbon Neutral Capital Program) to install new boilers and update the building control systems. This project was completed in December 2014 for an estimated annual savings of 287 GJ of natural gas per annum, a reduction of 7% from the natural gas consumption in 2013. Installation of 2 Gundfos Magna pumps as part of this project will save 30,194 kWh per annum.
• A lighting audit is currently in progress for a total lighting retrofit for estimated savings of 75,000 kWh (10%) per annum from the 2013 electrical consumption. The lighting retrofit may start in 2015/2016 and completed in 2016/2017.
Powell River Hospital & Evergreen Residence – Powell River Powell River Hospital, an Acute Care facility built in 1993 (33 beds - 132,967 ft2) and Evergreen Extended Care facility built in 1989 (75 beds - 33,933 ft2), are located on the same grounds in Powell River. The 2014 BEPI of 767 for 2014 is higher than 2013 BEPI of 718 by 6.8% and the electrical consumption increased by 430,520 kWh (9.0%) from 2013. The BEPI is also higher than NRCan’s average BEPI of 519 by 47.8%. This is also due to the substantial increase in electrical consumption resulting from the construction of the 6,800 m2 new Willingdon Creek Residential Care Centre completed in late 2014 (the construction project was using the electrical lines of the hospital during the construction phase with substantial use of electrical dehumidifiers during the latter part of the construction period in preparation for painting).
Strategy Energy Management Plan Page 27

VCH Strategic Energy Management Plan
• Powell River Hospital completed a COP Implementation phase (July 2014) for Powell River Hospital for estimated savings of 618,075 kWh and 830 GJ of Natural Gas
• A Ministry funding approval of $ 301,560, including $ 15,400 incentive from Fortis BC, from CNCP
(Carbon Neutral Capital Program) for Evergreen Residential Care boilers replacement, was completed in March, 2015, and will save 448 GJ of natural gas and 19,900 kWh per annum.
UBC Hospital - Vancouver The UBC Hospital is a 71,370 m2 facility located on the grounds of the UBC campus. The Acute Care building was built in 1980, the long term/complex care facility in 1977, and the psychiatric facility in 1967. A new 15,764 m2 facility (Djavad Mowafaghian Centre for Brain Health) was opened in February 2014 and resulted in an increase of 3,367,960 kWh (26.1%) from the electrical consumption of 2013. The Electrical BEPI increased by 3.2% from that of 2013 (Tables VCH-14, VCH-15). The building energy intensity of 449 ekWh/m2 is better that NRCan’s average building intensity (519 ekWh/m2) by 13.5% (Figure VCH-3). The following energy projects are currently in progress at the UBCH and will generate further savings:
• Purdy Pavilion, the 163,278 ft2 254 bed long term/complex care facility, is currently undergoing a COP project at the Implementation phase and scheduled for completion by March, 2015 for estimated savings of 134,604 kWh and 1,501 GJ per annum.
• Detwiller Pavilion, the 143,031 ft2 75 bed acute mental health care facility, is currently undergoing a COP project at the Implementation phase and scheduled for completion by March, 2015 for estimated savings of 187,905 kWh and 4,257 GJ per annum.
• A lighting retrofit was completed on August 15, 2015 and will save 75,000 kWh per annum.
Worst Performing Buildings – Residential & Long Term Care Facilities For the Residential Care facilities, the overall building intensity increased by 0.2% and the adjusted electrical consumption increased by 3.0% (233,756 kWh) from 2013 resulting mainly from the increased use of chillers in the summer months (Table VCH-13, VCH-14). The overall average BEPI of 432 ekWh/m2 for the VCH residential standalone sites is 44% higher than NRCan’s average BEPI of 300 ekWh/yr/m2 for BC (Figure VCH-4). Shorncliffe Intermediate Care Centre in Sechelt, Minoru Residence in Richmond, and Cedarview Lodge in North Vancouver all show an increase of their Building Energy Intensities by 1.8% (Shorncliffe), 4% (Minoru), and 3.4% (Cedarview) from 2013 (Table VCH-13). Electrical BEPIs for George Pearson in Vancouver increased by 3.8%, 1.6% increased for Yiwanis Care Centre in North Vancouver, 8.5% increased for Cedarview Lodge in North Vancouver, and 1.8% increased for Minoru Residence in Richmond from 2013. The electrical BEPI increases are reflected in the increased electrical consumptions for some of these facilities in 2014 (Table VCH-14). Shorncliffe Intermediate Care Centre – Sechelt
Built in 1982, Shorncliffe is a 50 bed 2,718 m2 Intermediate Care Centre. A 10 bed special care wing was renovated in 1993. All patient rooms are heated by electric baseboard heaters. The actual electrical consumption of 671,400 kWh in 2014 decreased by 13,200 kWh (1.9%) from the electrical consumption of 684,600 kWh for 2013. Planning is currently in place to potentially replace this facility due to its condition.
Strategy Energy Management Plan Page 28

VCH Strategic Energy Management Plan
The following energy reduction measures/projects were completed at Shorncliffe in March, 2014
• PSECA III project to replace/repair the Air Handling Unit and Phoenix Heat Recovery System with a new AHU for an estimated annual savings of 121,600 kWh. • PSECA III project to install a new DDC System to replace the current manual system was Completed in 2014 for estimated annual savings of 49,824 kWh and 102 GJ of natural gas.
North Shore Kiwanis Care Centre – North Vancouver
Yiwanis Care Centre, built in 1998, is a 192 bed Continuing/Complex care facility in North Vancouver. The centre has a 27 bed Special Care Unit and 172 single rooms and 10 double rooms. A 1,000 ft2 space on the 1st floor is sub-leased to the Emergency Health Services Commission. Building Energy Intensity in 2014 of 383 ekWh/yr/m2 decreased by 1.0% from 2013 but is higher than NRCan’s average BEPI (300) for residential Care facilities by 27.67%. Electrical consumption in 2014 of 2,143,200 kWh increased 31,800 kWh (1.5%) from the electrical consumption of 2,111,400 kWh in 2013. (Tables VCH-13, 14 and Figure VCH-4). Total natural gas consumption of 15,996 GJ in 2014 decreased by 423 GJ (2.6%) from the 2013 consumption of 16,419 GJ (Table VCH-16).
A COP project Investigation Phase will be starting in September, 2015. The Implementation Phase will be completed in 2016/2017.
Minoru Residence – Richmond
Built in 1993, Minoru Residence in Richmond is a three storey 250-bed in-patient Residential Care facility with 229 permanent Complex Care beds, 10 Bridging beds, 10 Transitional Care beds, and 1 Respite bed. Minoru Residence provides 24-hour nursing care, together with regular and ongoing medical supervision, for individuals who have a high level of care need. The overall BEPI for Minoru residence for 2014 of 541 ekWh/m2 represents an increase of 4% from 2013 and is higher than NRCan’s average BEPI for residential facilities by 80% (Figure VCH-4) and primarily due to the natural Gas consumption. The electrical consumption in 2014 of 1,982,160 kWh increased by 35,280 kWh (1.8%) from the 2013 electrical consumption of 1,946,880 kWh in 2013 (Table VCH-14). The increase was primarily due to the increase of chiller use in the summer months. Overall BEPIs of 541 ekWh/m2 in 2014 increased by 4% from the 2013 BEPI of 520 (Table VCH-13) primarily due to the increased natural gas consumption of 658 GJ (4.3%) from the 2013 consumption of 15,250 GJ (Table VCH-16). A FortisBC custom program is currently underway to identify natural gas savings at this facility and implement a natural gas savings project.
Strategy Energy Management Plan Page 29

VCH Strategic Energy Management Plan
1.4 VCH GOALS & OBJECTIVES
1.4.1 Energy Utilities Consumption Goals - 2015/2016
VCH currently has thirty one (31) energy conservation projects in progress, planned, and planned Pending funding with 23 projects targeted for completion by March 31, 2016. Savings from these energy projects are estimated at 3,509,569 kWh of electricity, 16,174 GJ of natural gas and 856 tCO2e of GHG emissions reduction per annum (Table VCH-19). Estimated cost savings are for $ 280k for electricity, $ 162k for natural gas, and $ 22k for GHG Carbon Offset payment avoidance for a total estimated consolidated savings of $ 464k per annum. Targeted Quarterly energy savings for 2015/2016 are identified in Table VCH-20. Targeted savings by site are identified in Table VCH-21.
Table VCH-19 - In Progress and Planned Energy Projects - 2015/2016 VCH TECHNICAL PROJECTS - IN PROGRESS & PLANNED ENERGY PROJECTS - ESTIMATED kWh, GJ & GHG SAVINGS - 2015/2016 7/8/2015
IN PROGRESS & PLANNED ENERGY PROJECTS - ESTIMATED kWh, GJ & GHG SAVINGS - 2015/2016
REF FACILITY PROJECT DESCRIPTION STATUS
Estimated
kWh
EstimatedGJ
Savings
EstimatedGHG tCO2e
Savings
Estimated Completion
Date
1Squamish Hospital - Main Hospital & Hilltop House South) Lighting Retrofit In Progress 185,000 - 2.22 Jul-15
2 Squamish Hospital - Hilltop House North & PharmacyAdditional Lighting Retrofit (re-lamp) Hilltop House North Including new Pharmacy Addition In Progress 29,000 - 0.35 Jul-15
3 VGH - JP NorthContinuous Optimization Program (COp) Implementation In Progress 110,189 275 15.15 Jul-15
4 VGH - Centennial PavilionContinuous Optimization Program (COp) Implementation In Progress 412,530 2,604 135.93 Jul-15
5 VGH - Blusson/ICORDContinuous Optimization Program (COp) Implementation In Progress 113,538 444 23.70 Jul-15
6 VGH - Banfield PavilionContinuous Optimization Program (COp) Implementation In Progress 122,656 214 12.24 Jul-15
7 VGH - Eye Care CentreContinuous Optimization Program (COp) Implementation In Progress 73,226 628 32.47 Jul-15
8 VGH - Energy CentreContinuous Optimization Program (COp) Implementation On Hold -
9 VGH - Research CentreContinuous Optimization Program (COp) Implementation In Progress 40,040 108 5.91 Jul-15
10 VGH - Jack Bell & Robert H Ho Research Continuous Optimization Program (COp) Implementation In Progress 256,324 875 47.09 Jul-15
11 UBC Hospital - Stairwells and Purdy Linen Room Lighting Retrofit In Progress 66,455 - 0.80 Aug-15
12 VGH - JPS/JPN/Centennial/Jack Bell/Eye Care/ResearMiscellaneous Other Lighting Retrofit Planned 132,593 1.59 Aug-15
13VGH - Jim Pattison - North + JP South/Centennial/Research Maintenance/Jack Bell Lighting Retrofit In Progress 977,000 - 11.72 Sep-15
14 VGH - Appendix K - JPN/Parkade/JPS/ Gen Room Lighting Retrofit In Progress 68,641 - 0.82 Sep-15
15 UBC Hospital - Purdy Pavilion Continuous Optimization Program (COp) Implementation In Progress 134,604 1,012 52.52 Jan-16
16 UBC Hospital - Detwiller Pavilion Continuous Optimization Program (COp) Implementation In Progress 187,905 4,257 216.38 Jan-16
17 North Shore Kiwanis Lodge Continuous Optimization Program (COp) Investigation Planned
18 VGH - P3 Diamond Care Centre Continuous Optimization Program (COp) Investigation On Hold -
19 VGH Diamond Care Centre Parkade Lighting Retrofit - 600 Car Parkade (190,500 ft2) Planned (pending funding) 243,656 2.92 Feb-16
20 LGH - Northern Expansion & Acute TowerContinuous Optimization Program (COp) Implementation In Progress 229,629 2,423 124.63 Feb-16
21 St Mary's Hospital - New Building Continuous Optimization Program (COp) Investigation & Implementation In Progress 25,847 1,016 51.41 Mar-16
22 Squamish Hospital Continuous Optimization Program (COp) Investigation In Progress - Mar-16
23 Minoru Residence - CCDPa-34Subsidized Gas Savings Project for FORTIS BC Custom Energy program - BES In Progress - Mar-16
24St Mary's Hospital - CCDPa-48
Subsidized Gas Savings Project for FORTIS BC Custom Energy program - CES In Progress 9,630 800 40.36 Mar-16
25 St Mary's Hospital Tower (Sechelt Hospital North) Lighting Retrofit Planned - Mar-16
26 Whistler Health Care Centre Lighting Retrofit Planned - Mar-1627
Powell River Hospital - CCDPa-81Subsidized Gas Savings Project for FORTIS BC Custom Energy program - BES In Progress - Mar-16
28
UBC Hospital - Hot Water Conversion- CCDPa-25Subsidized Gas Savings Audit for FORTIS BC Custom Energy program - AME In Progress - Dec-16
29 Powell River Hospital - CNCP Powell River Hospital - Replace 2 Boilers at 10,500 MBH each and Implement other ECMs In Progress 16,106 1,518 76.55 Mar-16
30 Richmond General Hospital Outside Lighting Retrofit In Progress 75,000 0 0.90 Mar-16
31VGH - Joe & Rosalee Segal Care Centre - New Construction Program (6,064 m2) * BC Hydro New Construction Program In Progress - Nov-17
ECM 1 - Increased Roof R-Value In Progress - Nov-17
ECM 2 - Increased Wall R-Value In Progress - Nov-17ECM 3 - High Performance Glazing In Progress - Nov-17
ECM 4 - External Shading (Overhangs…) In Progress - Nov-17
ECM 5 - Reduced LPD (Interior Lighting) In Progress - Nov-17ECM 6 - Reduced LPD (Exterior Lighting) In Progress - Nov-17ECM 7 - Interior Lighting Controls (Occupancy Sensors) In Progress - Nov-17
ECM 7a - Exterior Lighting Controls In Progress - Nov-17ECM 8 - High Efficiency Plant In Progress - Nov-17
ECM 9 - Low Flow Plumbing Fixtures (DW) In Progress - Nov-17 * The Joe and Rosalee Segal Care Centre is currently under construction. The facility is participating BC hydro's New Construction Program. The facility w ill not be completed and occupied until late 2017 or early 2018
TOTALS ESTIMATED kWh, GJ, & GHG (tCO2e)
SAVINGS 3,509,569 16,174 856 SEMP - VCH 2015/7-2015 Completed In Progress & Planned Projects SEMP-2014-2015 7-08-2015
Strategy Energy Management Plan Page 30

VCH Strategic Energy Management Plan
Table VCH-20 - Targeted Quarterly kWh Savings - 2015/20161 VCH TECHNICAL PROJECTS - IN PROGRESS & PLANNED ENERGY PROJECTS - ESTIMATED kWh, GJ & GHG SAVINGS - 2015/2016 7/8/2015
IN PROGRESS & PLANNED ENERGY PROJECTS - ESTIMATED kWh, GJ & GHG SAVINGS - 2015/2016
REF FACILITY PROJECT DESCRIPTION STATUS
Estimated
kWh
EstimatedGJ
Savings
EstimatedGHG tCO2e
Savings
Estimated Completion
Date QUARTERLY TARGETS
1Squamish Hospital - Main Hospital & Hilltop House South) Lighting Retrofit In Progress 185,000 - 2.22 Jul-15 Q-1 - April/May/June
2 Squamish Hospital - Hilltop House North & PharmacyAdditional Lighting Retrofit (re-lamp) Hilltop House North Including new Pharmacy Addition In Progress 29,000 - 0.35 Jul-15 Electricity kWh GAS GJ
3 VGH - JP NorthContinuous Optimization Program (COp) Implementation In Progress 110,189 275 15.15 Jul-15 - -
4 VGH - Centennial PavilionContinuous Optimization Program (COp) Implementation In Progress 412,530 2,604 135.93 Jul-15
5 VGH - Blusson/ICORDContinuous Optimization Program (COp) Implementation In Progress 113,538 444 23.70 Jul-15
6 VGH - Banfield PavilionContinuous Optimization Program (COp) Implementation In Progress 122,656 214 12.24 Jul-15
7 VGH - Eye Care CentreContinuous Optimization Program (COp) Implementation In Progress 73,226 628 32.47 Jul-15
8 VGH - Energy CentreContinuous Optimization Program (COp) Implementation On Hold -
9 VGH - Research CentreContinuous Optimization Program (COp) Implementation In Progress 40,040 108 5.91 Jul-15
10 VGH - Jack Bell & Robert H Ho Research Continuous Optimization Program (COp) Implementation In Progress 256,324 875 47.09 Jul-15
11 UBC Hospital - Stairwells and Purdy Linen Room Lighting Retrofit Completed 66,455 - 0.80 Aug-15
12 VGH - JPS/JPN/Centennial/Jack Bell/Eye Care/ResearMiscellaneous Other Lighting Retrofit Planned 132,593 1.59 Aug-15 Q-2 Jul/Aug/Sept
13
South/Centennial/Research Maintenance/Jack Bell Maintenance/Parkade Roof Deck Lighting Retrofit In Progress 977,000 - 11.72 Sep-15 Electricity kWh GAS GJ
14 VGH - Appendix K - JPN/Parkade/JPS/ Gen Room Lighting Retrofit In Progress 68,641 - 0.82 Sep-15 2,587,192 5,148
15 UBC Hospital - Purdy Pavilion Continuous Optimization Program (COp) Implementation In Progress 134,604 1,012 52.52 Jan-16
16 UBC Hospital - Detwiller Pavilion Continuous Optimization Program (COp) Implementation In Progress 187,905 4,257 216.38 Jan-16 Q-3 Oct/Nov/Dec
17 North Shore Kiwanis Lodge Continuous Optimization Program (COp) Investigation Planned Electricity kWh GAS GJ
18 VGH - P3 Diamond Care Centre Continuous Optimization Program (COp) Investigation On-Hold - -
19 VGH Diamond Care Centre Parkade Lighting Retrofit - 600 Car Parkade (190,500 ft2) Planned 243,656 2.92 Feb-16
20 LGH - Northern Expansion & Acute TowerContinuous Optimization Program (COp) Implementation In Progress 229,629 2,423 124.63 Feb-16
21 St Mary's Hospital - New Building Continuous Optimization Program (COp) Investigation & Implementation In Progress 25,847 1,016 51.41 Mar-16 Q-4 Jan/Feb/Mar
22 Squamish Hospital Continuous Optimization Program (COp) Investigation In Progress - Mar-16 Electricity kWh GAS GJ
23 Minoru Residence - CCDPa-34Subsidized Gas Savings Project for FORTIS BC Custom Energy program - BES In Progress - Mar-16 922,377 11,026
24St Mary's Hospital - CCDPa-48
Subsidized Gas Savings Project for FORTIS BC Custom Energy program - CES In Progress 9,630 800 40.36 Mar-16
25 St Mary's Hospital Tower (Sechelt Hospital North) Lighting Retrofit Planned - Mar-16
26 Whistler Health Care Centre Lighting Retrofit Planned - Mar-1627
Powell River Hospital - CCDPa-81Subsidized Gas Savings Project for FORTIS BC Custom Energy program - BES In Progress - Mar-16
28
UBC Hospital - Hot Water Conversion- CCDPa-25Subsidized Gas Savings Audit for FORTIS BC Custom Energy program - AME In Progress -
29 Powell River Hospital - CNCP Powell River Hospital - Replace 2 Boilers at 10,500 MBH each and Implement other ECMs In Progress 16,106 1,518 76.55 Mar-16
30 Richmond General Hospital Outside Lighting Retrofit In Progress 75,000 0 0.90 Mar-16
31VGH - Joe & Rosalee Siegel Care Centre - New Construction Program (6,064 m2) * BC Hydro New Construction Program In Progress Nov-17
ECM 1 - Increased Roof R-Value In Progress Nov-17
ECM 2 - Increased Wall R-Value In Progress Nov-17ECM 3 - High Performance Glazing In Progress Nov-17
ECM 4 - External Shading (Overhangs…) In Progress Nov-17
ECM 5 - Reduced LPD (Interior Lighting) In Progress Nov-17ECM 6 - Reduced LPD (Exterior Lighting) In Progress Nov-17ECM 7 - Interior Lighting Controls (Occupancy Sensors) In Progress Nov-17
ECM 7a - Exterior Lighting Controls In Progress Nov-17ECM 8 - High Efficiency Plant In Progress Nov-17ECM 9 - Low Flow Plumbing Fixtures (DW) In Progress Nov-17
* The Joe and Rosalee Segal Care Centre is currently under construction. The facility is participating BC hydro's New Construction Program. The facility w ill not be completed and occupied until late 2017 or early 2018
TOTALS ESTIMATED kWh & GJ SAVINGS 3,509,569 16,174 856 3,509,569 16,174 1
Projects and Savings do not include COP Implementation phase at Adanac Park Lodge for estimated savings of 163,608 kWh and 1,677 GJ of natural gas. Adanac Park Lodge is part of Little Mountain Residential Care and Housing Society. VCH is assisting in the coordination of the implementation of the COP project which started in 2012. Implementation Phase will be completed by March, 2016
Total annual savings for completed, in progress and planned electrical savings are identified individually for key VCH core sites from 2014/2015 to 2016/2017. Total annual savings for all core sites are for a reduction of 2.25% for 2014/2015 from 2013/2014, 3.01% for 2015/2016 from 2014/2015, and 1.75% for 2016/2017 from 2015/2016 (Table VCH-21).
Table VCH-21 - VCH Completed, Planned and In Progress Projects – kWh Savings 2013/2014 – 2016/2017 – Targeted Savings by Site
VCH Completed Projects kWh Savings - 2013/2014 - 2016/2017 - Targeted Annual Savings by Key Core Site and Total Core Sites
VCH CORE SITES
AdjustedElectrical kWhConsumptions
2013/2014
Completed Energy Projects
Target kWhSavings
2014/2015
Targeted% kWhSavings
from 2013/2014
AdjustedElectrical kWhConsumptions
2014/2015
Targeted Energy Projects
kWhSavings
2015/2016
Targeted% kWhSavingsby Sitefrom
2014/2015
Projected Electrical
kWh Consumptions
by Site2015/2016
Targeted Energy Projects
kWhSavingsby Site
2016/2017
Targeted% kWhSavingsby Site
from 2015/2016
Projected Electrical
kWh Consumptions
by Site2016/2017
FACILITY (kWh) (kWh) % (kWh) (kWh) % (kWh) (kWh) % (kWh)Vancouver General Hospital 61,504,041 926,864 1.51% 60,751,199 2,561,263 4.22% 58,189,936 1,589,419 2.73% 56,600,517 UBC Hospital 12,885,960 - - 16,253,920 388,964 2.39% 15,864,956 - - 15,864,956 Whistler Health Care Centre 756,000 - - 815,400 - - 815,400 70,280 8.62% 745,120 Richmond Hospital 8,217,000 - - 7,908,960 75,000 0.95% 7,833,960 - - 7,833,960 Lions Gate Hospital1 9,495,013 1,163,522 12.25% 9,774,308 229,629 2.35% 9,544,679 - - 9,544,679 St Mary's Hospital (Sechelt Hospital) 3,347,017 - 3,236,129 24,607 0.76% 3,211,522 134,029 4.17% 3,077,493 Powell River Hospital2 4,765,240 155,536 3.26% 5,195,760 16,106 0.31% 5,179,654 - - 5,179,654 Squamish Hospital 2,306,226 - - 2,303,454 214,000 9.29% 2,089,454 92,249 4.41% 1,997,205 GF Strong 2,181,000 128,900 5.91% 2,209,200 - - 2,209,200 - - 2,209,200
Total Hospitals 105,457,497 2,374,822 2.25% 108,448,330 3,509,569 3.24% 104,938,761 1,885,977 1.80% 103,052,784 George Pearson Centre 1,866,524 - - 1,941,600 - - 1,941,600 - - 1,941,600 Shorncliffe Intermediate Care 684,600 - - 671,400 - - 671,400 - - 671,400 North Shore Kiwanis Care Centre 2,111,400 - - 2,143,200 - - 2,143,200 91,056 4.25% 2,052,144 Minoru Residence 1,946,880 - - 1,982,160 - - 1,982,160 - - 1,982,160 Richmond Lions Manor (facility closed) - - - - - - - - -
Cedarview Lodge 1,136,100 - - 1,240,900 - - 1,240,900 - - 1,240,900 Olive Devaud Residence - - - - - - - - -
Total Residential Care 7,745,504 - - 7,979,260 - - 7,979,260 91,056 1.14% 7,888,204 TOTALS 113,203,001 2,374,822 2.25% 116,427,590 3,509,569 3.01% 112,918,021 1,977,033 1.75% 110,940,988
SEMP - VCH 2015/Electrical BEPI Comparisson 2013 & 2014 7-14-20151 Includes the new Hope Centre2 Includes Willingdon Creek Village Care Centre
Strategy Energy Management Plan Page 31

VCH Strategic Energy Management Plan
1.4.2 Completed Energy Projects – 2014/2015
Eighteen (18) energy efficiency projects were completed in 2014/2015 (Table VCH-22) for savings of 2,374,822 kWh in electricity, 15,311 GJ in natural gas and GHG emissions reductions of 861 tCO2e (tonnes) and for a total estimated cost savings per annum of $ 180,850 for electricity, $ 153,824 for natural gas, $ 21,707 in Carbon Offset payments avoidance for total combined savings of $ 356,381 per annum, including applicable taxes. For the kWh savings, 443,631 kWh (18.7%) were from COP energy measures, 1,286,271 (54.2%) were from New Building Construction program, 639,864 kWh, (26.9% ) were from HVAC projects, and 5,056 kWh (0.21%) savings from 1 PSPX project (VCH Figure-4).
Table VCH-22 - Completed Energy Projects and kWh, GJ, and GHG Savings – 2014/2015 VCH TECHNICAL PROJECTS - COMPLETED PROJECTS - ESTIMATED kWh, GJ & GHG SAVINGS/AVOIDANCE - 2014/2015 7/8/2015
COMPLETED PROJECTS - ESTIMATED kWh, GAS GJ & GHG SAVINGS & COST AVOIDANCE - 2014/2015
REF FACILITY PROJECT DESCRIPTION STATUS
Estimated
kWh
EstimatedGJ
Savings
EstimatedGHG tCO2e
Savings
Estimated Completion
Date
1LGH - The Hope Centre - New Construction Program (14,000 m2) BC Hydro New Construction Program - Nov-14
ECM 1 - Increased Roof R-Value Completed 9,498 1,262.06 63.60 Nov-14ECM 2 - Increased Wall R-Value Completed 12,178 21 1.20 Nov-14ECM 3 - High Performance Glazing Completed 67,900 47 3.18 Nov-14ECM 5 - Reduced LPD (Interior Lighting) Completed 177,435 (125) (4.16) Nov-14ECM 6 - Reduced LPD (Exterior Lighting) Completed 12,027 - 0.14 Nov-14ECM 7 - Interior Lighting Controls (Occupancy sensors) Completed 13,544 (9) (0.29) Nov-14
ECM 7a - Exterior Lighting Controls Completed 4,871 - 0.06 Nov-14ECM 8 - Htg/Clg Plant w/AHU's w/ACB's and RP's Completed 833,282 (1,217) (51.22) Nov-14ECM 9 - Low Flow Plumbing Fixtures (DW) Completed - 377 18.96 Nov-14
2PRH - Willingdon Creek Village - New Construction Program (6,800 m2) BC Hydro New Construction Program Feb-15
ECM 1 - Increased Roof R-Value (R-43 Overall) Completed 2,818 188 9.49 Feb-15ECM 2 - Increased Wall R-Value (R-16.8 Overall) Completed 1,835 108 5.45 Feb-15ECM 4 - High Performance Glazing (U-0.29 Overall) Completed 2,957 205 10.35 Feb-15
ECM 5 - Reduced Interior Lighting Power Density (LPD) Completed 27,053 699 35.48 Feb-15
ECM 6 - Reduced Exterior Lighting Power Density (LPD) Completed 3,788 - 0.05 Feb-15
ECM 7 - Interior Lighting Controls (Occupancy Sensors) Completed - - -
Feb-15
ECM 8 - Exterior Lighting Controls (Photocell and Time Clock) Completed 1,317 - 0.02
Feb-15
ECM 9 - Low Flow Domestic Hot Water (DHW) Fixtures Completed 6,471 227 11.50 Feb-15
ECM 10 - High Efficiency Cooling Plant/Mechanical System Completed - 2,379 119.66
Feb-15
ECM 11 - High Efficiency DHW Heating Plant Completed 109,297 - 1.31 Feb-15
ECM 12 - High Efficiency Exhaust Air Heat Recovery (Air to Air) Completed - 338 17.00
Feb-15
3 VGH - JP SouthContinuous Optimization Program (COp) Implementation Completed 287,000 4,824 246.09 Jun-14
4 LGH - Evergreen House North & SouthContinuous Optimization Program (COp) Implementation Completed 27,731 1,262 63.81 Jan-15
5 GF Strong Rehabilitation Centre Continuous Optimization Program (COp) Implementation Completed 128,900 1,880 96.11 Feb-15
6 LGH - Northern Expansion & Acute TowerContinuous Optimization Program (COp) Investigation Completed - May-15
7 VGH - Jack Bell & Robert H Ho Research Continuous Optimization Program (COp) Investigation Completed - Sep-14
8 UBC Hospital - Purdy PavilionContinuous Optimization Program (COp) Investigation Completed - Aug-14
9 UBC Hospital - Detwiller PavilionContinuous Optimization Program (COp) Investigation Completed - Aug-14
10 VGH - JP SouthInstallation of 2 X100 HP Variable Frequensy Drives (VFD) - JP South Completed 153,000 - 1.84 Mar-15
11 VGH - JP South Cooling Tower Fan VFD Upgrade - JPS Completed 66,864 - 0.80 Mar-15
12 Powell River Hospital
CNCP - Powell River Hospital - Replace 2 boilers at 10,500 MBH each & Implement other ECMs - Audit & Report Completed - - - Feb-15
13 VGH - JP North CNCP - VGH JP North - Upgrade DHW System Completed - 2,711 136.36 Mar-15
14 St Mary's Hospital CNCP - SMH - Replace Boiler # 2 Completed - 627 31.54 Mar-15
15 Whistler Health Care Centre
CNCP - Whistler Health Care - Replace 2 Atmospheric boilers with 6 small boilers. CoA-526-17203 Completed - 300 15.09 Mar-15
16 Powell River Hospital - EvergreenCNCP - PRH Evergreen - Replace 3 boilers of 1200 MBH each & Implement Other ECMs Completed - 448 22.53 Mar-15
17 VGH - JP SouthJPS Chiller 3 Trane Adaptive Frequency Drive Upgrade Completed 420,000 - 5.04 Mar-15
18 Lions Gate Hospital PSPX - Freezer Replacement at LGH Kitchen Completed 5,056 0.06 Dec-14
19 TOTALS ESTIMATED kWh & GJ SAVINGS 2,374,822 16,552 861 20 ESTIMATED TOTAL COST SAVINGS/AVOIDANCE ESTIMATED kWh & GJ $ SAVINGS 180,850$ 153,824$ 21,707$ 356,381$
1 Estimated $ cost savings are based on costs for kWh and GJ for 2014 per VCH CORE sites. Costs have not been adjusted for 2015SEMP - VCH 2015/7-2015 Completed In Progress & Planned Projects SEMP-2014-2015 7-08-2015
Strategy Energy Management Plan Page 32

VCH Strategic Energy Management Plan
VCH Figure-4 - Completed Energy Projects kWh Savings by Category – 2008/2009 – 2014/2015
1.5 Planned Actions As part of the annual energy reduction plan, VCH is committed to identify additional energy measures through:
• Site specific energy audits • BC hydro New Construction Program for new construction and major building retrofits. • BC hydro custom energy programs • Fortis BC’s Commercial Custom Design Program – New Construction • Fortis BC custom energy programs • Renewable energy initiatives • Front line staff energy awareness to reduce energy in their work place • Sustainability initiatives to reduce energy consumption • BC Hydro Continuous Optimization Program (COP) • Potential District Energy Systems • Working with Capital Planning and Construction to implement energy efficient systems and
measures
Strategy Energy Management Plan Page 33

VCH Strategic Energy Management Plan
1.5.1 Energy Studies 2003/2004 – 2014/2015
Energy Studies/Audits – 2003/2004 – 2007/2008 A comprehensive energy audit was conducted by Prism Engineering in 2003 at the VGH campus and included lighting as well as detailed mechanical systems. This audit generated a detailed review of all electrical and mechanical systems and proposed retrofits with potential savings. This was the base audit which was subsequently used to implement a number energy retrofits at the VGH site. Energy Studies/Audits – 2007/2008 – 2011/2012 A comprehensive number of energy audits/studies were carried out from 2007/2008 to 2011/2012 and resulted in a number of energy retrofits proceeding to the implementation stage. These audits included:
• Seventeen (17) lighting audits of which fifteen (15) proceeded to the retrofit stage. • Twenty five (25) audits and submissions to the Ministry for PSECA funding approval of which nine
(9) were approved for implementation at various VCH sites. These included electrical, mechanical, HVAC, DDC and boiler retrofits upgrades.
• One (1) energy audit was carried out in March, 2011 by UBC Engineering students of the VGH Eye Care Centre. This included a lighting system review, including lighting controls, roof insulation, steam-saving measures, fume hoods standby, HVAC and mechanical systems. A total lighting retrofit was completed at this facility in August, 2013.
• A lighting audit/review of the VGH Jack Bell Research was completed in 2010/2011 (PRISM) and a lighting retrofit was completed in September, 2011, with savings of 67,000 kWh.
• A lighting audit/review of the VGH Research Pavilion was carried out in 2010/2011 (PRISM) and a lighting retrofit was completed in August, 2011 with savings of 74,414 kWh.
• Lighting audit/review of the Squamish General Hospital and Hilltop House Residential Care facility was carried out in 2010/2011 (PRISM) – Lighting retrofit was planned for 2014/2015 or 2015/2016 should funding became available. The lighting retrofit is currently in progress with targeted completion by end of September, 2015,
• A lighting audit/review of the Richmond Hospital interior parking (Quantum) was carried out in 2010 – A total retrofit was completed in March, 2011 with savings of 118,733 kWh.
• A lighting audit/review of the Richmond Hospital South Tower was carried out in 2010/2011 (Quantum). A lighting retrofit was completed in June, 2011 with savings of 76,500 kWh.
• A Thermal Energy Conservation Review was completed at Lions Gate Hospital (Cobalt Engineering) in July 2010 which Identified 16 energy conservation measures (primarily targeted at mechanical systems, including HVAC and boilers efficiency).
• A Thermal Energy Conservation Review was completed at Vancouver General Hospital (Stantec Engineering) in July 2010 which identified 22 energy conservation measures (primarily targeted at mechanical systems, including HVAC and boilers efficiency) – Identified savings were estimated of 102,000 GJ of natural gas and 2.9 GWh of electrical savings.
• A Thermal Energy Conservation Review was completed at Richmond General Hospital (AME Group) in July 2010 which Identified eight (8) energy conservation measures (primarily targeted at mechanical systems including HVAC and boilers efficiency) – Identified energy savings of 430,000 of electrical kWh and 14,500 GJ of natural gas.
• A lighting audit/review of ten (10) buildings was completed for the VGH site in 2011 (PRISM). Identified estimated savings of 2.5 GWh. Lighting Retrofit implementation was completed in 6 buildings (1,587,648 ft2) between June 2013 and December 2013 for a total savings of 1.52 GWh and 245 kW demand:
Strategy Energy Management Plan Page 34

VCH Strategic Energy Management Plan
• Child Care Centre – 7,872 ft2 – Achieved savings of 11,770 kWh • Centennial Pavilion – 386,880 ft2 – Achieved savings of 474,107 kWh • Eye Care Centre – 68,813 ft2 – Achieved savings of 99,902 kWh • Heather Pavilion – 203,596 ft2 – Achieved savings of 106,970 kWh • Jim Pattison South – 868,482 ft2 – Achieved savings of 736,361 kWh • Tunnels – 52,005 ft2 – Achieved savings of 91,469 kWh
Four (4) other buildings (1.1 GWh estimated savings) were removed from implementation due to lack of funding as well as potential demolition and/or major renovation of some of these buildings in the near future. Implementation of lighting retrofit of 1 building (JP North – 807,560 kWh savings estimate) was planned for 2014/2015 or 2015/2016, should funding be available. Lighting retrofit for JP North as well as a number of other areas are currently (2014/2015) in progress with estimated completion in September, 2015.
• A lighting audit/review of Richmond Hospital was carried out in 2011 (Quantum) which Identified estimated savings of 194,000 kWh. A lighting retrofit implementation was completed in November, 2013.
• A lighting audit/review of Evergreen House in North Vancouver was carried out in 2011 (Quantum) which identified estimated savings of 63,000 kWh. Lighting Retrofit was completed in October, 2013.
• A lighting audit/review of George Pearson Centre in Vancouver was carried out 2011 (Quantum). Implementation was cancelled due to the pending redevelopment of that site.
• A lighting audit of the Brock Fahrni residential care facility interior parking was carried out in 2011 (Quantum) for identified savings of 28,000 kWh per annum. Retrofit was implemented and completed in October 2011 in Richmond.
• Richmond Lions Manor Residential Care facility underwent a lighting audit by City Green Solutions in February, 2012 with estimated savings of 50,000 kWh. No implementation is scheduled due to the pending demolition of this facility. Lions Manor was evacuated in January, 2014 and the residents moved to a leased facility.
• Richmond Alder Residential Care facility in Lions Park underwent a lighting audit by City Green Solutions in February, 2012. Estimated savings of 4,000 kWh per annum.
• UBC Hospital underwent an energy audit by UBC Clean Energy engineering Master’s students in 2012/2013
Thermal Energy Audits – 2012/2013 We completed fourteen (14) thermal energy audits in 2012/2013 at 14 VCH facilities: • Kiwanis Care Centre (North Vancouver). Audit completed on April 19, 2012 - report received
June 4, 2012. • UBC Hospital – Koerner (Acute Care) Pavilion (Vancouver). Audit completed on April 11, 2012 -
report received June 4, 2012. • Cedarview Lodge (North Vancouver). Audit completed on August 2, 2012 - report received
September 4, 2012. • Powell River Hospital. Audit completed on November 1, 2012 - report received November 27,
2012. • Powell River Evergreen Residential Care. Audit completed on November 1, 2012 - report received
November 27, 2012.
Strategy Energy Management Plan Page 35

VCH Strategic Energy Management Plan
• George Pearson Centre (Vancouver). Audit completed on November 15, 2012 - report received November 27, 2012.
• Minoru Residence (Richmond). Audit completed on November 16, 2012 - report received November 27, 2012.
• Squamish General Hospital (Squamish). Audit completed on November 29, 2012 - report received December 14, 2012.
• Whistler Health Care Centre (Whistler). Audit completed on November 30, 2012 - report received December 19, 2012.
• Squamish Hilltop House North (Squamish). Audit completed on November 29, 2012 - report received December 19, 2012.
• Squamish Hilltop House South (Squamish). Audit completed on November 29, 2012 - report received December 19, 2012.
• Olive Devaud Residence (Powell River). Audit completed on November 1, 2012 - report received January 4, 2013.
• St Mary’s Hospital (Sechelt). Audit completed on December 3, 2012 - report received January 21, 2013.
• GF Strong Rehabilitation Centre (Vancouver). Audit completed on January 30, 2013 - report received March 6, 2013.
Water Consumption Audits – 2012/2013
We completed two (2) water audits in March, 2013: • UBC Hospital. Three day audit completed on March 6,7,10. • GF Strong. Audit completed on March 8, 2013.
Energy Studies/Audits – 2013/2014
• A lighting audit was completed by PRISM engineering for the Richmond Hospital exterior lighting and the interior parking roof top lighting in March 2014. Estimated savings of 74,170 kWh. Was put on hold pending funding availability. This project has now been funded (235k) and will proceed shortly with planned completion by March, 2016.
• High Level Thermal studies for CNCP (Carbon Neutral Capital Program) were implemented for submission to the Ministry for funding over 100k per project. These were: • St Mary’s Hospital boiler #2 replacement ($ 295k) – Integral Group. • VGH JP North DHW System replacement ($ 314k) – Rocky Point Engineering. • Powell River Evergreen Extended Care boilers (3) replacement ($ 302k) – BES Building Energy
Solutions. • Whistler Health Care Centre boilers replacement ($352k) – Rocky Point Engineering.
All submissions were approved for funding by the Ministry and projects were completed by March, 2015.
Strategy Energy Management Plan Page 36

VCH Strategic Energy Management Plan
Energy Studies/Audits – 2014/2015
Custom Retrofit Program studies were implemented at:
• Richmond Hospital – The consultant, Enersolv Design and Build, completed the final draft report on July 14, 2014. Energy study completed – August 2014 (Fortis BC Custom Program).
• St Mary’s Hospital – CES Engineering is currently working on Energy Study. Projected energy study completion – September 2014. Projected implementation is for March 2016 (Fortis BC Custom Program).
• Powell River Hospital – BES Engineering energy study with completion target for February 2015. Project implementation target is for August, 2016. Project approved for implementation by Ministry ($ 1.2 million). Project is currently in progress and scheduled for completion by March, 2016.
• UBC Hospital – Energy study for the UBCH Hot Water Conversion/Steam, originally planned for 2013/2014, was completed in January, 2015 (Fortis BC Custom Program).
• UBC Hospital – Mechanical Systems Energy Study – PRISM Engineering. Completed study report submitted September 23, 2014 (BC Hydro Custom Program).
• Squamish Hospital – Lighting Audit Completed. Retrofit is in progress and scheduled for completion by September, 2015.
• Richmond Hospital – Lighting audit of exterior lighting completed in April, 2013 – PRISM Engineering. Retrofit approved ($ 235k) in July, 2015 and is in progress with projected completion in March, 2016.
Energy Studies/Audits – 2015/2016 – YTD
• Whistler Health Care Centre – Lighting audit – PRISM Engineering. In progress.
• St Mary’s Hospital (Sechelt Hospital – North Tower) – Lighting retrofit audit – PRISM Engineering. In progress.
• Minoru Residence – Fortis BC Thermal audit custom program – BES Engineering. In progress.
• UBC Hospital - Lighting retrofit audit for the UBC Hospital stairwells and the Purdy Linen room for LED lighting was completed in May, 2015 - Quantum Lighting. Project has proceeded to the implementation stage and was completed on August 15, 2015.
• VGH Diamond Care Centre – Lighting retrofit audit of internal parking areas (190,000 ft2) completed in March, 2015 – PRISM Engineering. Retrofit implementation currently on hold, pending funding, and negotiations with the P3 managing company (Access Health). Retrofit could be implemented and completed by March, 2015 or in 2016/2017, should funding become available.
Strategy Energy Management Plan Page 37

VCH Strategic Energy Management Plan
1.5.2 Energy Conservation Projects – 2014/2015 – 2016/2017
VCH completed 18 energy conservation projects in 2014/2015 for savings of 2,374,822 kWh and 15,311 GJ (Tables VCH-23, 24). For 2015/2016, 31 projects are currently planned and in progress with 30 projects planned for completion by March 31, 2016 (Tables VCH-23, 25) for estimated savings of 3,509,569 kWh and 16,174 GJ. For 2016/2017, 15 interim projects are planned and in progress with 14 projects targeted for completion by March 31, 2017 for estimated savings of 1,977,004 kWh and 14,949 GJ of gas (Tables VCH-23, 26). The new Joe and Rosalee Segal Family Health Care Centre at the VGH is currently under construction and is participating in both BC Hydro’s and Fortis BC’s New Construction Programs. Completion and occupancy is projected for late 2017 or early 2018. Non-cumulative energy savings from 2014/2015 to 2016/2017 are estimated at 7.86 GWh of electricity, 46,434 GJ of natural gas, and GHG emissions reductions of 2,426 tCO2e (tonnes).
Table VCH-23 - Energy Conservation Projects – 2014/2015 – 2016/2017
VCH ENERGY CONSERVATION PROJECTS - 2014/2015 - 2016/2017 - ANNUAL NON CUMULATIVE SAVINGS
YEARPLANNED
PROJECTS
ELECTRICITYSAVINGS
(kWh)
GAS SAVINGS
(GJ)
GHGREDUCTIONS
(tCO2e) COMPLETED NOTES
2014/2015 18 2,374,822 15,311 799 18
Includes 2 new buildings constructed. Four (4) buildings COP Investigation phases completed
2015/2016 31 3,509,569 16,174 856 Planned and in Progress
31 projects in progress; 30 planned for completion in 2015/2016; 1 new building under constuction and planned for completion in 2017/2018
2016/2017 15 1,977,004 14,949 771 Planned and in Progress
14 projects in progress and planned for completion in 2017/2018. 1 New Constructionat the VGH site is in progress and scheduled for completion in late 2017 or early 2018
TOTALS 64 7,861,395 46,434 2,426
Completed Energy Projects – 2014/2015 Eighteen (18) energy efficiency projects were completed in 2014/2015 (Table VCH-24) for savings of 2,374,822 kWh in electricity, 15,311 GJ in natural gas and GHG emissions reductions of 799 tCO2e for a total estimated cost savings of $ 180,850 per annum for electricity, $ 153,824 for natural gas and $ 20,134 in GHG Carbon Offset payments cost avoidance for total combined savings of $ 354,808 per annum, including applicable taxes. For the kWh savings, 443,631 kWh (18.7%) were from COP energy measures, 1,286,271 (54.2%) were from two (2) New Building Construction programs, 639,864 kWh (26.9% ) were from HVAC projects and 5,056 kWh (0.21%) savings from one (1) PSPX project
Strategy Energy Management Plan Page 38

VCH Strategic Energy Management Plan
Table VCH-24 - Completed Energy Projects – 2014/2015 VCH TECHNICAL PROJECTS - COMPLETED PROJECTS - ESTIMATED kWh, GJ & GHG SAVINGS/AVOIDANCE - 2014/2015 7/8/2015
COMPLETED PROJECTS - ESTIMATED kWh, GAS GJ & GHG SAVINGS & COST AVOIDANCE - 2014/2015
REF FACILITY PROJECT DESCRIPTION STATUS
Estimated
kWh
EstimatedGJ
Savings
EstimatedGHG tCO2e
Savings
Estimated Completion
Date
1LGH - The Hope Centre - New Construction Program (14,000 m2) BC Hydro New Construction Program - Nov-14
ECM 1 - Increased Roof R-Value Completed 9,498 21 1.17 Nov-14ECM 2 - Increased Wall R-Value Completed 12,178 21 1.20 Nov-14ECM 3 - High Performance Glazing Completed 67,900 47 3.18 Nov-14ECM 5 - Reduced LPD (Interior Lighting) Completed 177,435 (125) (4.16) Nov-14ECM 6 - Reduced LPD (Exterior Lighting) Completed 12,027 - 0.14 Nov-14ECM 7 - Interior Lighting Controls (Occupancy sensors) Completed 13,544 (9) (0.29) Nov-14
ECM 7a - Exterior Lighting Controls Completed 4,871 - 0.06 Nov-14ECM 8 - Htg/Clg Plant w/AHU's w/ACB's and RP's Completed 833,282 (1,217) (51.22) Nov-14ECM 9 - Low Flow Plumbing Fixtures (DW) Completed - 377 18.96 Nov-14
2PRH - Willingdon Creek Village - New Construction Program (6,800 m2) BC Hydro New Construction Program Feb-15
ECM 1 - Increased Roof R-Value (R-43 Overall) Completed 2,818 188 9.49 Feb-15ECM 2 - Increased Wall R-Value (R-16.8 Overall) Completed 1,835 108 5.45 Feb-15ECM 4 - High Performance Glazing (U-0.29 Overall) Completed 2,957 205 10.35 Feb-15
ECM 5 - Reduced Interior Lighting Power Density (LPD) Completed 27,053 699 35.48 Feb-15
ECM 6 - Reduced Exterior Lighting Power Density (LPD) Completed 3,788 - 0.05 Feb-15
ECM 7 - Interior Lighting Controls (Occupancy Sensors) Completed - - -
Feb-15
ECM 8 - Exterior Lighting Controls (Photocell and Time Clock) Completed 1,317 - 0.02
Feb-15
ECM 9 - Low Flow Domestic Hot Water (DHW) Fixtures Completed 6,471 227 11.50 Feb-15
ECM 10 - High Efficiency Cooling Plant/Mechanical System Completed - 2,379 119.66
Feb-15
ECM 11 - High Efficiency DHW Heating Plant Completed 109,297 - 1.31 Feb-15
ECM 12 - High Efficiency Exhaust Air Heat Recovery (Air to Air) Completed - 338 17.00
Feb-15
3 VGH - JP SouthContinuous Optimization Program (COp) Implementation Completed 287,000 4,824 246.09 Jun-14
4 LGH - Evergreen House North & SouthContinuous Optimization Program (COp) Implementation Completed 27,731 1,262 63.81 Jan-15
5 GF Strong Rehabilitation Centre Continuous Optimization Program (COp) Implementation Completed 128,900 1,880 96.11 Feb-15
6 LGH - Northern Expansion & Acute TowerContinuous Optimization Program (COp) Investigation Completed - May-15
7 VGH - Jack Bell & Robert H Ho Research Continuous Optimization Program (COp) Investigation Completed - Sep-14
8 UBC Hospital - Purdy PavilionContinuous Optimization Program (COp) Investigation Completed - Aug-14
9 UBC Hospital - Detwiller PavilionContinuous Optimization Program (COp) Investigation Completed - Aug-14
10 VGH - JP SouthInstallation of 2 X100 HP Variable Frequensy Drives (VFD) - JP South Completed 153,000 - 1.84 Mar-15
11 VGH - JP South Cooling Tower Fan VFD Upgrade - JPS Completed 66,864 - 0.80 Mar-15
12 Powell River Hospital
CNCP - Powell River Hospital - Replace 2 boilers at 10,500 MBH each & Implement other ECMs - Audit & Report Completed - - - Feb-15
13 VGH - JP North CNCP - VGH JP North - Upgrade DHW System Completed - 2,711 136.36 Mar-15
14 St Mary's Hospital CNCP - SMH - Replace Boiler # 2 Completed - 627 31.54 Mar-15
15 Whistler Health Care Centre
CNCP - Whistler Health Care - Replace 2 Atmospheric boilers with 6 small boilers. CoA-526-17203 Completed - 300 15.09 Mar-15
16 Powell River Hospital - EvergreenCNCP - PRH Evergreen - Replace 3 boilers of 1200 MBH each & Implement Other ECMs Completed - 448 22.53 Mar-15
17 VGH - JP SouthJPS Chiller 3 Trane Adaptive Frequency Drive Upgrade Completed 420,000 - 5.04 Mar-15
18 Lions Gate Hospital PSPX - Freezer Replacement at LGH Kitchen Completed 5,056 0.06 Dec-14
19 TOTALS ESTIMATED kWh & GJ SAVINGS 2,374,822 15,311 799 20 ESTIMATED TOTAL COST SAVINGS/AVOIDANCE ESTIMATED kWh & GJ $ SAVINGS 180,850$ 153,824$ 20,134$ 354,808$
1 Estimated $ cost savings are based on costs for kWh and GJ for 2014 per VCH CORE sites. Costs have not been adjusted for 2015SEMP - VCH 2015/7-2015 Completed In Progress & Planned Projects SEMP-2014-2015 7-08-2015 In-Progress and Planned Energy Projects – 2015/2016
Thirty one (31) energy conservation projects are currently in progress and planned for 2015/2016 with 30 projects scheduled for completion by March 31, 2016 for annual savings of 3,509,569 kWh, 16,174 GJ, and 856 GHG tCO2e emissions reduction for total estimated cost savings of $ 470,000 per annum (Table VCH-25). One (1) potential project is on hold pending funding availability. A 2nd project, the P3 Diamond Care Centre COP (Investigation phase) is planned, pending negotiations with Access Health, the P3 management company.
Strategy Energy Management Plan Page 39

VCH Strategic Energy Management Plan
Table VCH-25 - In-Progress and Planned Energy Projects – 2015/20161 VCH TECHNICAL PROJECTS - IN PROGRESS & PLANNED ENERGY PROJECTS - ESTIMATED kWh, GJ & GHG SAVINGS - 2015/2016 7/8/2015
IN PROGRESS & PLANNED ENERGY PROJECTS - ESTIMATED kWh, GJ & GHG SAVINGS - 2015/2016
REF FACILITY PROJECT DESCRIPTION STATUS
Estimated
kWh
EstimatedGJ
Savings
EstimatedGHG tCO2e
Savings
Estimated Completion
Date
1Squamish Hospital - Main Hospital & Hilltop House South) Lighting Retrofit In Progress 185,000 - 2.22 Jul-15
2 Squamish Hospital - Hilltop House North & PharmacyAdditional Lighting Retrofit (re-lamp) Hilltop House North Including new Pharmacy Addition In Progress 29,000 - 0.35 Jul-15
3 VGH - JP NorthContinuous Optimization Program (COp) Implementation In Progress 110,189 275 15.15 Jul-15
4 VGH - Centennial PavilionContinuous Optimization Program (COp) Implementation In Progress 412,530 2,604 135.93 Jul-15
5 VGH - Blusson/ICORDContinuous Optimization Program (COp) Implementation In Progress 113,538 444 23.70 Jul-15
6 VGH - Banfield PavilionContinuous Optimization Program (COp) Implementation In Progress 122,656 214 12.24 Jul-15
7 VGH - Eye Care CentreContinuous Optimization Program (COp) Implementation In Progress 73,226 628 32.47 Jul-15
8 VGH - Energy CentreContinuous Optimization Program (COp) Implementation On Hold -
9 VGH - Research CentreContinuous Optimization Program (COp) Implementation In Progress 40,040 108 5.91 Jul-15
10 VGH - Jack Bell & Robert H Ho Research Continuous Optimization Program (COp) Implementation In Progress 256,324 875 47.09 Jul-15
11 UBC Hospital - Stairwells and Purdy Linen Room Lighting Retrofit In Progress 66,455 - 0.80 Aug-15
12 VGH - JPS/JPN/Centennial/Jack Bell/Eye Care/ResearMiscellaneous Other Lighting Retrofit Planned 132,593 1.59 Aug-15
13VGH - Jim Pattison - North + JP South/Centennial/Research Maintenance/Jack Bell Lighting Retrofit In Progress 977,000 - 11.72 Sep-15
14 VGH - Appendix K - JPN/Parkade/JPS/ Gen Room Lighting Retrofit In Progress 68,641 - 0.82 Sep-15
15 UBC Hospital - Purdy Pavilion Continuous Optimization Program (COp) Implementation In Progress 134,604 1,012 52.52 Jan-16
16 UBC Hospital - Detwiller Pavilion Continuous Optimization Program (COp) Implementation In Progress 187,905 4,257 216.38 Jan-16
17 North Shore Kiwanis Lodge Continuous Optimization Program (COp) Investigation Planned
18 VGH - P3 Diamond Care Centre Continuous Optimization Program (COp) Investigation On Hold -
19 VGH Diamond Care Centre Parkade Lighting Retrofit - 600 Car Parkade (190,500 ft2) Planned (pending funding) 243,656 2.92 Feb-16
20 LGH - Northern Expansion & Acute TowerContinuous Optimization Program (COp) Implementation In Progress 229,629 2,423 124.63 Feb-16
21 St Mary's Hospital - New Building Continuous Optimization Program (COp) Investigation & Implementation In Progress 25,847 1,016 51.41 Mar-16
22 Squamish Hospital Continuous Optimization Program (COp) Investigation In Progress - Mar-16
23 Minoru Residence - CCDPa-34Subsidized Gas Savings Project for FORTIS BC Custom Energy program - BES In Progress - Mar-16
24St Mary's Hospital - CCDPa-48
Subsidized Gas Savings Project for FORTIS BC Custom Energy program - CES In Progress 9,630 800 40.36 Mar-16
25 St Mary's Hospital Tower (Sechelt Hospital North) Lighting Retrofit Planned - Mar-16
26 Whistler Health Care Centre Lighting Retrofit Planned - Mar-1627
Powell River Hospital - CCDPa-81Subsidized Gas Savings Project for FORTIS BC Custom Energy program - BES In Progress - Mar-16
28
UBC Hospital - Hot Water Conversion- CCDPa-25Subsidized Gas Savings Audit for FORTIS BC Custom Energy program - AME In Progress - Dec-16
29 Powell River Hospital - CNCP Powell River Hospital - Replace 2 Boilers at 10,500 MBH each and Implement other ECMs In Progress 16,106 1,518 76.55 Mar-16
30 Richmond General Hospital Outside Lighting Retrofit In Progress 75,000 0 0.90 Mar-16
31VGH - Joe & Rosalee Segal Care Centre - New Construction Program (6,064 m2) * BC Hydro New Construction Program In Progress - Nov-17
ECM 1 - Increased Roof R-Value In Progress - Nov-17
ECM 2 - Increased Wall R-Value In Progress - Nov-17ECM 3 - High Performance Glazing In Progress - Nov-17
ECM 4 - External Shading (Overhangs…) In Progress - Nov-17
ECM 5 - Reduced LPD (Interior Lighting) In Progress - Nov-17ECM 6 - Reduced LPD (Exterior Lighting) In Progress - Nov-17ECM 7 - Interior Lighting Controls (Occupancy Sensors) In Progress - Nov-17
ECM 7a - Exterior Lighting Controls In Progress - Nov-17ECM 8 - High Efficiency Plant In Progress - Nov-17
ECM 9 - Low Flow Plumbing Fixtures (DW) In Progress - Nov-17 * The Joe and Rosalee Segal Care Centre is currently under construction. The facility is participating BC hydro's New Construction Program. The facility w ill not be completed and occupied until late 2017 or early 2018
TOTALS ESTIMATED kWh, GJ, & GHG (tCO2e)
SAVINGS 3,509,569 16,174 856 SEMP - VCH 2015/7-2015 Completed In Progress & Planned Projects SEMP-2014-2015 7-08-2015 1
Projects and Savings do not include 1 COP Implementation phase at Adanac Park Lodge for estimated savings of 163,608 kWh and 1,677 GJ of natural gas. Adanac Park Lodge is part of Little Mountain Residential Care and Housing Society. VCH is assisting in the coordination of the implementation of the COP project which started in 2012.
In-Progress and Planned Energy Projects – 2016/2017
Fifteen (15) energy conservation projects are in progress and planned for 2016/2017 with 14 projects potentially scheduled for completion by March 31, 2017 for a total interim savings of 1.98 GWh of electricity, 14,949 GJ of natural gas and 771 tCO2e of GHG emissions reduction (Table VCH-26) per annum. Two (2) Fortis BC custom programs are also planned for completion in 2016/2017 but the studies for these have not yet been completed and savings not yet identified. A COP project (Investigation and Implementation phases) for the VGH P3 Diamond Care Centre is contingent upon successful negotiations with Access Health, the P3 management company.
Strategy Energy Management Plan Page 40

VCH Strategic Energy Management Plan
Table VCH-26 - In-Progress and Planned Energy Projects – 2016/2017 VCH TECHNICAL PROJECTS - 2016/2017 - ESTIMATED kWh, GJ and GHG SAVINGS 7/8/2015
IN PROGRESS AND PLANNED ENERGY PROJECTS - ESTIMATED kWh, GAS GJ & GHG SAVINGS - 2016/2017
REF FACILITY PROJECT DESCRIPTION STATUS
Estimated
kWh
EstimatedGJ
Savings
EstimatedGHG tCO2e
Savings
Estimated Completion
Date
1 North Shore Kiwanis Lodge Continuous Optimization Program (COp) Implementation In Progress & Planned Completion 91,056 1,153 59 Jul-16
2St Mary's Hospital FortisBC CCDP1
Planned Apr-16
3Powell River Hospital FortisBC CCDP1
Planned Aug-16
4 Squamish HospitalContinuous Optimization Program (COP) - Implementation Investigation Phase in progress 92,249 1,134 58 Oct-16
5St Mary's Hospital
Lighting Retrofit - North Tower Lighting Audit in Progress 134,000 0 2 Oct-16
6 Whistler Health Care Centre Lighting Retrofit Lighting Audit in Progress 70,280 0 1 Sep-16
7 VGH - JP North
, , q p scheduling, Controls optimization and programming energy measures In Progress & Planned Completion 682,068 5,127 265 Sep-16
8 VGH - Centennial
10 Various Mechanical, HVAC, Equipment scheduling, Controls optimization and programming energy measures In Progress & Planned Completion 262,900 2,996 153 Oct-16
9 VGH - Blusson (ICORD)7 Various Mechanical, HVAC, Equipment scheduling, Controls optimization and programming energy In Progress & Planned Completion 48,469 1,386 70 Nov-16
10 VGH - BanfieldUpgrade DHW Controls to include them on building BAS In Progress & Planned Completion 382 296 15 Nov-16
11 VGH - Eye Care Centre3 Energy measures for Controls resets and Optimization In Progress & Planned Completion 130,058 463 25 Nov-16
12 VGH - Research Pavilion3 Energy measures for controls optimization, Equipment scheduling and enabling In Progress & Planned Completion 58,384 613 31 Nov-16
13 VGH - Jack Bell Research 3 Energy measures to address controls problems In Progress & Planned Completion 127,158 1,009 52 Nov-16
14 P3 Diamond Care CentreContinuous Optimization Program (COP) - Investigation/Implementation Planned 280,000 772 42 Feb-17
15VGH - Joe & Rosalee Siegel Care Centre - New Construction Program (6,064 m2)2 BC Hydro New Construction Program In Progress & Planned Completion2 2 2 2 Jan-18
ECM 1 - Increased Roof R-Value In Progress & Planned Completion2 2 2 2 Jan-18
ECM 2 - Increased Wall R-Value In Progress & Planned Completion2 2 2 2 Jan-18
ECM 3 - High Performance Glazing In Progress & Planned Completion2 2 2 2 Jan-18
ECM 4 - External Shading (Overhangs…) In Progress & Planned Completion2 2 2 2 Jan-18
ECM 5 - Reduced LPD (Interior Lighting) In Progress & Planned Completion2 2 2 2 Jan-18
ECM 6 - Reduced LPD (Exterior Lighting) In Progress & Planned Completion2 2 2 2 Jan-18ECM 7 - Interior Lighting Controls (Occupancy Sensors) In Progress & Planned Completion2 2 2 2 Jan-18
ECM 7a - Exterior Lighting Controls In Progress & Planned Completion2 2 2 2 Jan-18ECM 8 - High Efficiency Plant In Progress & Planned Completion2 2 2 2 Jan-18ECM 9 - Low Flow Plumbing Fixtures (DW) In Progress & Planned Completion2 2 2 2 Jan-18
TOTALS ESTIMATED kWh, GJ, AND GHG 1,977,004 14,949 771 2The Joe and Rosalee Segal building is currently under construction and w ill not be completed until late 2017 or early 2018. Savings are not yet confirmed1GJ savings are not yet confirmed
SEMP - VCH 2015/7-2015 Completed In Progress & Planned Projects SEMP-2014-2015 7-08-2015
1.5.3 Completed Energy Projects and Cost Savings/Avoidance 2008/2009 – 2014/2015
Energy Savings - 2008/2009 – 2014/2015 – Annual Non-Cumulative and Cumulative/Cost Avoidance From 2008/2009 to 2014/2015, VCH identified, planned, implemented and completed 115 energy efficiency projects. Five (5) BC Hydro’s New Construction Programs were implemented at VCH from 2010/2011 – 2014/2015 (Robert Ho Research at VGH, St Mary’s Hospital expansion in Sechelt, Willow Pavilion at VGH, the Hope Centre at Lions Gate Hospital in North Vancouver, and Willingdon Creek Residential Care Centre in Powell River. A 6th facility, currently under construction at VGH (The Joe and Rosalee Segal Family Mental Health Centre), is also participating in this program. This 24/7 mental health facility will be occupied late 2017 or early 2018. Total Estimated Savings:
1. Electricity Savings and tCO2e GHG
• Over 16.7 GWh annual non-cumulative savings of electricity and GHG emissions reductions of 373 tCO2e. Total annual kWh savings of $ 1,093,818, $ 9,408 for GHG, and combined savings of $ 1,103,226 (Tables VCH-27, 31; Figure VCH-5).
• Over 61.4 GWh cumulative savings of electricity and estimated cost avoidance of $ 4,075,771 (Tables VCH-28, 31; Figure VCH-5).
Strategy Energy Management Plan Page 41

VCH Strategic Energy Management Plan
• Over 61.4 GWh cumulative savings of electricity and GHG emissions reductions/avoidance of 1,297 tCO2e and total cost avoidance of $ 4,108,461 (Table VCH-28, 31; Figure VCH-5).
2. Natural Gas Savings and tCO2e GHG
• Over 143,525 GJ non-cumulative savings of natural gas and GHG emissions reductions of 7,211 tCO2e. Total annual savings of $ 1,278,528 for GJ and $ 1,460,321 for both GJ and GHG (Tables VCH-29, 31; Figure VCH-6).
• Over 641,242 GJ cumulative savings of natural gas and GHG emissions cumulative reductions/avoidance of 32,173 tCO2e and total cost avoidance of $ 6,206,997 (Tables VCH-30, 31; Figure VCH-6).
3. Summary: Electricity + Natural Gas + tCO2e GHG
• An estimated non-cumulative kWh, GJ and GHG costs savings of $ 2,562,592 (Table VCH-31). • An estimated cumulative combined kWh, GJ and GHG costs savings/avoidance of $
10,315,458 (Table VCH-31).
4. GHG tCO2e (tonnes) Savings and Cost Avoidance (Table VCH-31, Figure VCH-8)
• An estimated total non-cumulative GHG (tCO2e) reductions of 335 tCO2e (tonnes) from kWh savings from 2008/2009 – 2014/2015 for cost savings of $ 8,454.
• An estimated total cumulative GHG (tCO2e) reductions of 1,297 tCO2e (tonnes) from kWh savings for a cost savings/avoidance of $ 32,690.
• An estimated total non-cumulative GHG (tCO2e) reductions of 7,211 tCO2e (tonnes) from GJ savings from 2008/2009 – 2014/2015 for cost savings of $ 181,793.
• An estimated total cumulative GHG (tCO2e) reductions of 32,173 tCO2e (tonnes) from GJ savings for cost savings/avoidance of $ 811,083.
• An estimated total non-cumulative GHG (tCO2e) reductions of 7,546 tCO2e (tonnes) from both kWh & GJ savings and cost savings of $ 190,246.
• An estimated total cumulative GHG (tCO2e) reductions of 33,470 tCO2e (tonnes) from both kWh & GJ savings and cost savings/avoidance of $ 843,773.
Strategy Energy Management Plan Page 42

VCH Strategic Energy Management Plan
Figure VCH-5 - Annual and Cumulative Electricity kWh Savings
2008/2009 – 2014/2015
Figure VCH-6 - Annual and Cumulative Natural Gas GJ Savings
2008/2009 – 2014/2015
Strategy Energy Management Plan Page 43

VCH Strategic Energy Management Plan
Figure VCH-7 - Annual and Cumulative kWh and GJ Cost Savings
2008/2009 – 2014/2015
Figure VCH-8 - Annual and Cumulative GHG Carbon Offsets Cost Savings
2008/2009 – 2014/2015
Strategy Energy Management Plan Page 44

VCH Strategic Energy Management Plan
Table VCH-27 - Annual Estimated kWh and GHG tCO2e Savings - Non Cumulative
Completed Projects - Non-Cumulative 2008/2009 – 2014/2015 VCH COMPLETED PROJECTS - kWh and tCO2e SAVINGS/AVOIDANCE - 2008/2009 - 2014/2015 - NON CUMULATIVE
Fiscal Year 2008/2009 2009/2010 2010/2011 2011/2012 2012/2013 2013/2014 2014/2015 2015/2016 TOTALS
Estimated kWh Savings 4,424,712 172,938 16,435 2,490,004 2,509,714 4,738,986 2,369,766 16,722,555 Estimated tCO2e Savings 115 4 0.4 65 65 95 28 373 Estimated GHG tCO2e Savings 2,900$ 113$ 11$ 1,632$ 1,645$ 2,389$ 717$ 9,408$ Estimated kWh Cost Savings 252,209$ 10,774$ 965$ 155,625$ 156,857$ 336,942$ 180,446$ 1,093,818
TOTAL COST SAVINGS kWh & GHG 2008/2009 - 2014/2015 255,109$ 10,887$ 976$ 157,257$ 158,502$ 339,331$ 181,163$ 1,103,226$
kWh Savings 4,424,712 172,938 16,435 2,490,004 2,509,714 4,738,986 2,369,766 16,722,555 kWh & GHG $ Savings 255,109$ 10,887$ 976$ 157,257$ 158,502$ 339,331$ 181,163$ 1,103,226$ Total YTD kWh Savings 16,722,555 Total YTD $ kWh Savings 1,093,818$
TABLE 1
VCH COMPLETED PROJECTS - kWh SAVINGS/AVOIDANCE - 2008/2009 - 2014/2015 - NON CUMULATIVE
Fiscal Year 2008/2009 2009/2010 2010/2011 2011/2012 2012/2013 2013/2014 2014/2015 2015/2016 TOTALS
Estimated kWh Savings 4,424,712 172,938 16,435 2,490,004 2,509,714 4,738,986 2,369,766 16,722,555
TABLE 2
VCH COMPLETED PROJECTS - kWh COST SAVINGS/AVOIDANCE - 2008/2009 - 2014/2015 - NON CUMULATIVE
Fiscal Year 2008/2009 2009/2010 2010/2011 2011/2012 2012/2013 2013/2014 2014/2015 2015/2016 TOTALS
Estimated kWh Cost Savings 252,209$ 10,774$ 965$ 155,625$ 156,857$ 336,942$ 180,446$ 1,093,818$
TABLE 3
VCH COMPLETED PROJECTS - kWh and tCO2e Cost SAVINGS/AVOIDANCE - 2008/2009 - 2014/2015 - NON CUMULATIVE
Fiscal Year 2008/2009 2009/2010 2010/2011 2011/2012 2012/2013 2013/2014 2014/2015 2015/2016 TOTALS
Estimated kWh & GHG Carbon Offset Savings 255,109$ 10,887$ 976$ 157,257$ 158,502$ 339,331$ 181,163$ 1,103,226$
0
200000
400000
600000
800000
1000000
1200000
2008/2009 2009/2010 2010/2011 2011/2012 2012/2013 2013/2014 2014/2015 2015/2016 TOTALS
kWh
Cost
$ Sa
ving
s
Fiscal Year
Completed Projects - kWh $ Savings Per Annum 2008/2009 - 2014/2015 - Non Cumulative
-
2,000,000
4,000,000
6,000,000
8,000,000
10,000,000
12,000,000
14,000,000
16,000,000
18,000,000
2008/2009 2009/2010 2010/2011 2011/2012 2012/2013 2013/2014 2014/2015 2015/2016 TOTALS
kWh
Sav
ings
Fiscal Year
Completed Projects - kWh Savings Per Annum 2008/2009 - 2014/2015 - Non Cumulative
0
200000
400000
600000
800000
1000000
1200000
2008/2009 2009/2010 2010/2011 2011/2012 2012/2013 2013/2014 2014/2015 2015/2016 TOTALS
kWh &
GHG
Cost
Savin
gs
Fiscal Year
VCH Completed Projects - Estimated kWh and tCO2e GHG Cost Savings/Avoidance 2008/2009 - 2014/2015
Strategy Energy Management Plan Page 45

VCH Strategic Energy Management Plan
Table VCH-28 - Estimated kWh and GHG Savings/Avoidance
Cumulative - 2008/2009 – 2014/2015 VCH COMPLETED PROJECTS - ESTIMATED kWh and tCO2e SAVINGS/ COST AVOIDANCE - 2008/2009 - 2014/2015 - CUMULATIVE
Fiscal Year 2008/2009 2009/2010 2010/2011 2011/2012 2012/2013 2013/2014 2014/2015 2015/2016 TOTALS
Estimated kWh Savings 4,424,712 4,597,650 4,614,085 7,104,089 9,613,803 14,352,789 16,722,555 61,429,683 Estimated tCO2e Savings 115 120 120 185 250 307 201 1,297 Estimated GHG tCO2e Savings 2,900$ 3,014$ 3,024$ 4,656$ 6,301$ 7,735$ 5,059$ 32,690$ Estimated kWh Cost Savings 252,209$ 286,434$ 270,847$ 444,006$ 600,863$ 1,020,483$ 1,200,929$ 4,075,771$
TOTAL COST SAVINGS kWh & GHG 2008/2009 - 2014/2015 255,109$ 289,448$ 273,871$ 448,662$ 607,164$ 1,028,218$ 1,205,988$ 4,108,461$
kWh Savings 4,424,712 4,597,650 4,614,085 7,104,089 9,613,803 14,352,789 16,722,555 61,429,683 kWh & GHG $ Savings 255,109$ 289,448$ 273,871$ 448,662$ 607,164$ 1,028,218$ 1,205,988$ 4,108,461$ Total YTD kWh Savings 61,429,683 Total YTD $ kWh & GHG Savings 4,108,461$
TABLE 1
VCH COMPLETED PROJECTS - ESTIMATED kWh SAVINGS/COST AVOIDANCE - 2008/2009 - 2014/2015 - CUMULATIVE
Fiscal Year 2008/2009 2009/2010 2010/2011 2011/2012 2012/2013 2013/2014 2014/2015 2015/2016 TOTALS
Estimated kWh Savings 4,424,712 4,597,650 4,614,085 7,104,089 9,613,803 14,352,789 16,722,555 61,429,683
TABLE 2
VCH COMPLETED PROJECTS - kWh COST SAVINGS/COST AVOIDANCE - 2008/2009 - 2014/2015 - CUMULATIVE
Fiscal Year 2008/2009 2009/2010 2010/2011 2011/2012 2012/2013 2013/2014 2014/2015 2015/2016 TOTALS
Estimated kWh Cost Savings 252,209$ 286,434$ 270,847$ 444,006$ 600,863$ 1,020,483$ 1,200,929$ 4,075,771$
TABLE 3
VCH COMPLETED PROJECTS - ESTIMATED kWh and tCO2e Cost SAVINGS/COST AVOIDANCE - 2008/2009 - 2014/2015 - CUMULATIVE
Fiscal Year 2008/2009 2009/2010 2010/2011 2011/2012 2012/2013 2013/2014 2014/2015 2015/2016 TOTALS
Estimated kWh & GHG Carbon Offset Savings 255,109$ 289,448$ 273,871$ 448,662$ 607,164$ 1,028,218$ 1,205,988$ 4,108,461$
0
500000
1000000
1500000
2000000
2500000
3000000
3500000
4000000
4500000
2008/2009 2009/2010 2010/2011 2011/2012 2012/2013 2013/2014 2014/2015 2015/2016 TOTALS
kWh
Cost
$ Sa
ving
s
Fiscal Year
Completed Projects - kWh $ Savings Per Annum 2008/2009 - 2014/2015 - Cumulative
-
10,000,000
20,000,000
30,000,000
40,000,000
50,000,000
60,000,000
70,000,000
2008/2009 2009/2010 2010/2011 2011/2012 2012/2013 2013/2014 2014/2015 2015/2016 TOTALS
kWh
Sav
ings
Fiscal Year
Completed Projects - kWh Savings Per Annum 2008/2009 - 2014/2015 - Cumulative
0
500000
1000000
1500000
2000000
2500000
3000000
3500000
4000000
4500000
2008/2009 2009/2010 2010/2011 2011/2012 2012/2013 2013/2014 2014/2015 2015/2016 TOTALS
kWh
& GH
G Co
st S
avin
gs
Fiscal Year
Completed projects - Estimated kWh and tCO2e GHG Cost Savings/Avoidance 2008/2009 - 2014/2015 - Cumulative
Strategy Energy Management Plan Page 46

VCH Strategic Energy Management Plan
VCH ANNUAL ESTIMATED tCO2e GHG COST AVOIDANCE FROM kWh SAVINGS - 2008/2009 - 2014/2015 - CUMULATIVE
Fiscal Year 2008/2009 2009/2010 2010/2011 2011/2012 2012/2013 2013/2014 2014/2015 2015/2016 TOTALS
Estimated tCO2e GHG Carbon Offset Savings 2,900$ 3,014$ 3,024$ 4,656$ 6,301$ 7,735$ 5,059$ 32,690$
SEMP-VCH 2015/7-VCH Energy Utilities and GHG Savings 2008-2009 - 2015-2016 JM 6-23-2015
0
5000
10000
15000
20000
25000
30000
35000
2008/2009 2009/2010 2010/2011 2011/2012 2012/2013 2013/2014 2014/2015 2015/2016 TOTALS
GHG
Cost
Savi
ngs
Fiscal Year
GHG Cost Savings/Avoidance from kWh Savings 2008/2009 - 2014/2015 - Cumulative
Strategy Energy Management Plan Page 47

VCH Strategic Energy Management Plan
Table VCH-29 - Annual Estimated GJ and GHG tCO2e Savings
Non-Cumulative 2008/2009 – 2014/2015 8/15/2015
VCH COMPLETED PROJECTS - ANNUAL ESTIMATED NATURAL GAS GJ and tCO2e GHG SAVINGS/AVOIDANCE - 2008/2009 - 2014/2015 - NON CUMULATIVE
Fiscal Year 2008/2009 2009/2010 2010/2011 2011/2012 2012/2013 2013/2014 2014/2015 2015/2016 TOTALS
Estimated GJ Savings 2008/2009 - 2014/2015 24,008 45,000 5,414 11,706 30,177 11,909 15,311 143,525 Estimated tCO2e Savings 1,208 2,264 272 589 1,518 595 766 7,211 Estimated GJ COST Savings 286,899$ 409,950$ 54,032$ 57,711$ 221,197$ 94,915$ 153,824$ 1,278,528$ Estimated tCO2e Cost Savings 30,444$ 57,063$ 6,865$ 14,844$ 38,266$ 15,011$ 19,300$ 181,793$
TOTAL COST SAVINGS GJ & GHG 2008/2009 - 2014/2015 317,343$ 467,013$ 60,897$ 72,555$ 259,463$ 109,926$ 173,123$ 1,460,321$
GJ $ SAVINGS 286,899$ 409,950$ 54,032$ 57,711$ 221,197$ 94,915$ 153,824$ 1,278,528$ GJ & GHG $ SAVINGS 317,343$ 467,013$ 60,897$ 72,555$ 259,463$ 109,926$ 173,123$ 1,460,321$ TOTAL YTD GJ SAVINGS 143,525 TOTAL YTD $ GJ SAVINGS 1,278,528$
TABLE 1
VCH COMPLETED PROJECTS - ESTIMATED GJ SAVINGS - 2008/2009 - 2014/2015 - NON CUMULATIVE
Fiscal Year 2008/2009 2009/2010 2010/2011 2011/2012 2012/2013 2013/2014 2014/2015 2015/2016 TOTALS
Estimated GJ Savings 24,008 45,000 5,414 11,706 30,177 11,909 15,311 143,525
TABLE 2
VCH COMPLETED PROJECTS - ESTIMATED GJ $ SAVINGS/COST AVOIDANCE - 2008/2009 - 2014/2015 - NON CUMULATIVE
Fiscal Year 2008/2009 2009/2010 2010/2011 2011/2012 2012/2013 2013/2014 2014/2015 2015/2016 TOTALS
Estimated GJ Cost Savings 286,899$ 409,950$ 54,032$ 57,711$ 221,197$ 94,915$ 153,824$ 1,278,528$
0
200000
400000
600000
800000
1000000
1200000
1400000
2008/2009 2009/2010 2010/2011 2011/2012 2012/2013 2013/2014 2014/2015 2015/2016 TOTALS
Cost
$ S
avin
gs
Fiscal Year
GJ $ Savings Per Annum - 2008/2009 - 2014/2015 - Non Cumulative
-
20,000
40,000
60,000
80,000
100,000
120,000
140,000
160,000
2008/2009 2009/2010 2010/2011 2011/2012 2012/2013 2013/2014 2014/2015 2015/2016 TOTALS
GJ
Sav
ings
Fiscal Year
Completed Projects - Estimated GJ Savings Per Annum 2008/2009 - 2014/2015 - Non Cumulative
Strategy Energy Management Plan Page 48

VCH Strategic Energy Management Plan
TABLE 3
VCH COMPLETED PROJECTS - ESTIMATED GHG tCO2e SAVINGS FROM GJ SAVINGS - 2008/2009 - 2014/2015 - NON CUMULATIVE
Fiscal Year 2008/2009 2009/2010 2010/2011 2011/2012 2012/2013 2013/2014 2014/2015 2015/2016 TOTALS
Estimated tCo2e GHG Savings 1,208 2,264 272 589 1,518 595 766 7,211
TABLE 4
VCH ANNUAL ESTIMATED tCO2e GHG COST AVOIDANCE FROM GJ SAVINGS - 2008/2009 - 2014/2015 - NON CUMULATIVE
Fiscal Year 2008/2009 2009/2010 2010/2011 2011/2012 2012/2013 2013/2014 2014/2015 2015/2016 TOTALS
Estimated tCo2e GHG Cost Savings 30,444$ 57,063$ 6,865$ 14,844$ 38,266$ 15,011$ 19,300$ 181,793$
SEMP-VCH 2015/7-VCH Energy Utilities and GHG Savings 2008-2009 - 2015-2016 JM 6-23-2015
0
1000
2000
3000
4000
5000
6000
7000
8000
2008/2009 2009/2010 2010/2011 2011/2012 2012/2013 2013/2014 2014/2015 2015/2016 TOTALS
GHG
tCO
2e sa
ving
s
Fiscal Year
GHG tCO2e Savings/Avoidance 2008/2009 - 2014/2015 - Non Cumulative
0
20000
40000
60000
80000
100000
120000
140000
160000
180000
200000
2008/2009 2009/2010 2010/2011 2011/2012 2012/2013 2013/2014 2014/2015 2015/2016 TOTALS
GHG
tCO
2e S
avin
gs
Fiscal Year
GHG tCO2e Cost Savings/Avoidance From GJ Savings 2008/2009 - 2014/2015 - Non Cumulative
Strategy Energy Management Plan Page 49

VCH Strategic Energy Management Plan
Table VCH-30 - Estimated GJ and GHG tCO2e Savings/Cost Avoidance
Cumulative 2008/2009 – 2014/2015 VCH COMPLETED PROJECTS - ESTIMATED NATURAL GAS GJ and tCO2e GHG SAVINGS/AVOIDANCE - 2008/2009 - 2014/2015 - CUMULATIVE
Fiscal Year 2008/2009 2009/2010 2010/2011 2011/2012 2012/2013 2013/2014 2014/2015 2015/2016 TOTALS
Estimated GJ Savings 2008/2009 - 2014/2015 24,008 69,008 74,422 86,128 116,305 128,030 143,341 641,242 Estimated GHG tCO2e Savings 1,208 3,471 3,743 4,332 5,850 6,402 7,167 32,173 Estimated GJ COST Savings 286,899$ 628,663$ 742,732$ 424,611$ 852,516$ 1,020,399$ 1,440,094$ 5,395,913$ Estimated GHG tCO2e Cost Savings 30,444$ 87,506$ 94,372$ 109,216$ 147,482$ 161,382$ 180,681$ 811,083$
TOTAL COST SAVINGS GJ & GHG 2008/2009 - 2014/2015 317,343$ 716,169$ 837,103$ 533,827$ 999,998$ 1,181,781$ 1,620,775$ 6,206,996$
GJ SAVINGS 286,899$ 628,663$ 742,732$ 424,611$ 852,516$ 1,020,399$ 1,440,094$ 5,395,913$ GJ & GHG $ SAVINGS 317,343$ 716,169$ 837,103$ 533,827$ 999,998$ 1,181,781$ 1,620,775$ 6,206,996$ TOTAL YTD GJ SAVINGS 641,242 TOTAL YTD $ GJ SAVINGS 5,395,913$
TABLE 1
VCH COMPLETED PROJECTS - ESTIMATED GJ SAVINGS - 2008/2009 - 2014/2015 - CUMULATIVE
Fiscal Year 2008/2009 2009/2010 2010/2011 2011/2012 2012/2013 2013/2014 2014/2015 2015/2016 TOTALS
Estimated GJ Savings 24,008 69,008 74,422 86,128 116,305 128,030 143,341 641,242
TABLE 2
VCH COMPLETED PROJECTS - ESTIMATED GJ $ SAVINGS/COST AVOIDANCE - 2008/2009 - 2014/2015 - CUMULATIVE
Fiscal Year 2008/2009 2009/2010 2010/2011 2011/2012 2012/2013 2013/2014 2014/2015 2015/2016 TOTALS
Estimated GJ Cost Savings 286,899$ 628,663$ 742,732$ 424,611$ 852,516$ 1,020,399$ 1,440,094$ 5,395,913$
TABLE 3
VCH COMPLETED PROJECTS - ESTIMATED GHG tCO2e SAVINGS FROM GJ SAVINGS - 2008/2009 - 2014/2015 - CUMULATIVE
Fiscal Year 2008/2009 2009/2010 2010/2011 2011/2012 2012/2013 2013/2014 2014/2015 2015/2016 TOTALS
Estimated tCo2e GHG Savings 1,208 3,471 3,743 4,332 5,850 6,402 7,167 32,173
SEMP-VCH 2015/7-VCH Energy Utilities and GHG Savings 2008-2009 - 2015-2016 JM 6-23-2015
0
1000000
2000000
3000000
4000000
5000000
6000000
2008/2009 2009/2010 2010/2011 2011/2012 2012/2013 2013/2014 2014/2015 2015/2016 TOTALS
Cost
$ S
avin
gs
Fiscal Year
Completed Projects - Natural Gas - GJ $ Savings Per Annum - 2008/2009 - 2014/2015 - Cumulative
-
100,000
200,000
300,000
400,000
500,000
600,000
700,000
2008/2009 2009/2010 2010/2011 2011/2012 2012/2013 2013/2014 2014/2015 2015/2016 TOTALS
GJ
Sav
ings
Fiscal Year
Completed Projects - Gas GJ Savings Per Annum 2008/2009 - 2014/2015 - Cumulative
0
5000
10000
15000
20000
25000
30000
35000
2008/2009 2009/2010 2010/2011 2011/2012 2012/2013 2013/2014 2014/2015 2015/2016 TOTALS
GHG
tCO
2e sa
ving
s
Fiscal Year
GHG tCO2e Savings/Avoidance 2008/2009 - 2014/2015 - Cumulative
Strategy Energy Management Plan Page 50

VCH Strategic Energy Management Plan
TABLE 4
VCH ANNUAL ESTIMATED tCO2e GHG COST AVOIDANCE FROM GJ SAVINGS - 2008/2009 - 2014/2015 - CUMULATIVE
Fiscal Year 2008/2009 2009/2010 2010/2011 2011/2012 2012/2013 2013/2014 2014/2015 2015/2016 TOTALS
Estimated tCo2e GHG Cost Savings 30,444$ 87,506$ 94,372$ 109,216$ 147,482$ 161,382$ 180,681$ 811,083$
SEMP-VCH 2015/7-VCH Energy Utilities and GHG Savings 2008-2009 - 2015-2016 JM 6-23-2015
0
100000
200000
300000
400000
500000
600000
700000
800000
900000
2008/2009 2009/2010 2010/2011 2011/2012 2012/2013 2013/2014 2014/2015 2015/2016 TOTALS
GH
G t
CO2e
Sav
ings
Fiscal Year
GHG tCO2e Cost $ Savings/Avoidance From GJ Savings 2008/2009 - 2014/2015 - Cumulative
Strategy Energy Management Plan Page 51

VCH Strategic Energy Management Plan
Table VCH-31 - Consolidated Summary - Estimated kWh, GJ, and GHG tCO2e Savings/Cost Avoidance – Cumulative and Non-Cumulative – 2008/2009 – 2014/2015
VCH ANNUAL ESTIMATED NATURAL kWh, GJ and tCO2e SAVINGS/AVOIDANCE - 2008/2009 - 2014/2015 - CUMULATIVE
Fiscal Year 2008/2009 2009/2010 2010/2011 2011/2012 2012/2013 2013/2014 2014/2015 2015/2016 TOTALS
Estimated kWh Savings 4,424,712 4,597,650 4,614,085 7,104,089 9,613,803 14,352,789 16,722,555 61,429,683 Estimated tCO2e Savings 115 120 120 185 250 307 201 1,297 Estimated GHG $ Cost Savings 2,900$ 3,014$ 3,024$ 4,656$ 6,301$ 7,735$ 5,059$ 32,690$ Estimated kWh $ Cost Savings 252,209$ 286,434$ 270,847$ 444,006$ 600,863$ 1,020,483$ 1,200,929$ 4,075,771$
KWH & GHG COST SAVINGS PER ANNUM2008/2009 - 2014/2015 255,109$ 289,448$ 273,871$ 448,662$ 607,164$ 1,028,218$ 1,205,988$ 4,108,461$
TOTAL COST YTD SAVINGS 4,108,461$ kWh YTD SAVINGS 61,429,683
Estimated GJ Savings 24,008 69,008 74,422 86,128 116,305 128,030 143,341 641,242 Estimated tCO2e Savings 1,208 3,471 3,743 4,332 5,850 6,402 7,167 32,173 Estimated GHG $ Cost Savings 30,444$ 87,506$ 94,372$ 109,216$ 147,482$ 161,382$ 180,681$ 811,083$ Estimated GJ $ Cost Savings 286,899$ 628,663$ 742,732$ 424,611$ 852,516$ 1,020,399$ 1,440,094$ 5,395,914$
GJ & GHG COST SAVINGS PER ANNUM2008/2009 - 2014/2015 317,343$ 716,169$ 837,104$ 533,827$ 999,998$ 1,181,781$ 1,620,775$ 6,206,997$
TOTAL COST YTD SAVINGS 6,206,997$ GJ YTD SAVINGS 641,242
TOTAL SAVINGS kWh + GJ + CARBON OFFSETS
Total kWh + GJ $ Savings 539,108$ 915,097$ 1,013,579$ 868,617$ 1,453,379$ 2,040,882$ 2,641,023$ 9,471,685$ Total tCO2 Savings 1,323 3,591 3,863 4,517 6,100 6,708 7,368 33,470 Total tCO2e Carbon Offset Savings 33,344$ 90,520$ 97,396$ 113,872$ 153,784$ 169,117$ 185,740$ 843,773$
Fiscal Year 2008/2009 2009/2010 2010/2011 2011/2012 2012/2013 2013/2014 2014/2015 2015/2016 TOTALSTOTAL COST kWh + GJ + CARBON
OFFSETS PER ANNUM 572,452$ 1,005,617$ 1,110,975$ 982,489$ 1,607,163$ 2,209,999$ 2,826,763$ 10,315,458$ TOTAL COST SAVINGS 2008/2009 - 2014/2015 10,315,458$
VCH ANNUAL ESTIMATED kWh, GJ and tCO2e SAVINGS/AVOIDANCE - 2008/2009 - 2014/2015 - NON CUMULATIVE
Fiscal Year 2008/2009 2009/2010 2010/2011 2011/2012 2012/2013 2013/2014 2014/2015 2015/2016 TOTALS
Estimated kWh Savings 4,424,712 172,938 16,435 2,490,004 2,509,714 4,738,986 2,374,822 16,727,611 Estimated tCO2e Savings 115 4 0.43 64.74 65.25 56.87 28.50 335 Estimated kWh $ Savings 252,209$ 10,774$ 965$ 155,625$ 156,857$ 336,942$ 180,446$ 1,093,818$ Estimated GHG $ Cost Savings 2,900$ 113$ 11$ 1,632$ 1,645$ 1,434$ 718$ 8,454$
TOTAL COST SAVINGS PER ANNUM2008/2009 - 2014/2015 255,109$ 10,887$ 976$ 157,257$ 158,502$ 338,376$ 181,164$ 1,102,271$
YTD kWh & GHG $ COST SAVINGS 1,102,271$ YTD kWh SAVINGS 16,727,611
Estimated GJ Savings 24,008 45,000 5,414 11,706 30,177 11,909 15,311 143,525 Estimated tCO2e Savings 1,208 2,264 272 589 1,518 595 766 7,211 Estimated GJ $ Cost Savings 286,899$ 409,950$ 54,032$ 57,711$ 221,197$ 94,915$ 153,824$ 1,278,528$ Estimated GHG $ Cost Savings 30,444$ 57,063$ 6,865$ 14,844$ 38,266$ 15,011$ 19,300$ 181,793$
TOTAL COST SAVINGS PER ANNUM2008/2009 - 2014/2015 317,343$ 467,013$ 60,897$ 72,555$ 259,463$ 109,926$ 173,124$ 1,460,321$
YTD GJ & GHG $ COST SAVINGS 1,460,321$ YTD GJ SAVINGS 143,525
TOTAL SAVINGS kWh + GJ + CARBON OFFSETS
Total kWh + GJ Cost Savings 539,108$ 420,724$ 54,997$ 213,336$ 378,054$ 431,857$ 334,270$ 2,372,346$ Total GHG tCO2 Savings 1,323 2,268 273 654 1,583 652 794 7,546 Total tCO2e Carbon Offset Savings 33,344$ 57,176$ 6,876$ 16,476$ 39,911$ 16,445$ 20,018$ 190,246$
TOTAL COST kWh + GJ + CARBON OFFSETS PER ANNUM 572,452$ 477,900$ 61,873$ 229,812$ 417,965$ 448,302$ 354,288$ 2,562,592$ TOTAL COST SAVINGS 2008/2009 - 2014/2015 2,562,592$
SEMP-VCH 2015/7-VCH Energy Utilities and GHG Savings 2008-2009 - 2015-2016 JM 6-23-2015
$-
$500,000
$1,000,000
$1,500,000
$2,000,000
$2,500,000
$3,000,000
$572,452 $1,005,617 $1,110,975 $982,489 $1,607,163 $2,209,999 $2,826,763 $10,315,458Savings per Fiscal Year
Total Estimated Savings kWh + GJ + tCO2e Carbon Offsets - 2008/2009 - 2014/2015 - CUMULATIVE
1.5.4 Energy Conservation Awareness and Education Programs
Strategy Energy Management Plan Page 52

VCH Strategic Energy Management Plan
1. BC Hydro Workplace Conservation Agreement (WCA)
WCA Program Background
In November 2010, Vancouver Coastal Health joined BC Hydro’s Workplace Conservation Awareness (WCA) Program, an initiative to help BC organizations design and deliver energy conservation campaigns in the workplace. The WCA program focuses on encouraging staff to contribute to energy savings through everyday simple actions, from turning off the lights to turning off monitors over lunch time. These simple actions can have a significant impact on energy use when thousands of BC health care workers get involved.
The goal of the program is to save 2% of electricity over 2 years at participating hospitals and extended care facilities. In addition to delivering cost-effective energy savings, changing staff’s energy related habits also helps reduce the negative environmental impacts of operating large healthcare facilities.
The BC Hydro funded WCA began in November 2010 and 5 VCH sites were selected to participate in the annual program.
• Richmond General Hospital (RGH) • Lions Gate Hospital (LGH) • UBC Hospital (UBCH) • Vancouver General Hospital (VGH) • GF Strong Rehab Centre (GFS)
An action plan was developed with the help of a funded consultant (PRISM Engineering) including the various awareness and educational initiatives, such as energy awareness fairs, education sessions for housekeeping and security staff, lights out sticker campaign etc. VCH completed the first year of the BC Hydro funded WCA program in October 2011 and launched the second year of the program in November 2012. The WCA program focused on various awareness and educational initiatives, including:
• Housekeeping and Security presentations: Engaged housekeeping and Security services staff through a 10-minute energy conservation presentation in April to May, 2011. The presentation focused on asking staff to turn off the lights.
Date LocationNumber of
PresentationsNumber of
Participants 3-May-11 GF Strong 1 85-May-11 VGH 11 103
10-May-11 UBC Hospital 1 5012-May-11 Richmond Hospital 7 2518-May-11 Lions Gate Hospital 2 32
TOTALS 22 218
Strategy Energy Management Plan Page 53

VCH Strategic Energy Management Plan
• FMO Training Session and Opportunity Challenge: A full day FM&O training session for FMO staff and supervisors on March 15, 2011. The training session incorporated a “Spot the Opportunities Challenge”, which asked participants to use what they learned to identify and implement low cost energy saving projects. There were 20 participants from GF Strong, VGH, UBC Hospital, Richmond Hospital, and Lions Gate Hospital.
• Planning for GreenCare Fairs: January to March, 2012, was focused on planning for the 2012 GreenCare Fairs in April and May. Planning activities included creating partnerships with several external organizations (TravelSmart, Fortis BC, Sodexo and BC Hydro), developing communication and information material, and scheduling events.
Activities Completed in 2013
Vancouver Coastal Health worked in partnership with Fraser Health and Provincial Health Services Authority to accomplish the following activities in 2013:
• Coordinated the Green + Leaders program, including managing and training volunteers and supporting the implementation of energy conservation toolkits and campaigns;
• Produced stickers, posters and email templates for annual energy conservation campaigns focused on turning off lights and monitors, reducing plug load of unused equipment, and changing computer settings.
• Conducted planning and research for a pilot “Shut the Sash” campaign in the lab at VGH in 2014.
• Conducted research into a timer campaign for large equipment like blanket warmers.
• Worked with Green + Leaders in labs to identify other energy savings opportunities such as turning off ovens when not in use.
• Green + Leaders developed an energy conservation survey for their department.
• Wrote articles and news items, including multiple articles in Lower Mainland Health Authorities internal newsletters.
Research results at VGH found that departments with Green + Leaders demonstrated higher energy conservation awareness and behaviour than those without.
RESULTS BY THE NUMBERS:
Communication and Information Staff Engagement
250 Stickers handed out 5 Kick-off and educational events150 Posters put up 45 Green+Leaders (in VCH)
11News stories profiling Green+Leaders (in VCH news) 2 New Green+Leaders training sessions
12 Green+Leaders monthly newsletters 1 Green+Leaders recognition event
Strategy Energy Management Plan Page 54

VCH Strategic Energy Management Plan
FMO Pulse metering training sessions completed for 2013/2014
The FMO Pulse Metering training session focused on following VCH sites:
• Richmond Hospital (RGH) – September 13, 2013 • Lions Gate Hospital (LGH) – October 16, 2013 • UBC Hospital (UBCH) – August 26, 2013 • Vancouver General Hospital (VGH) – August 15, 2013 • Minoru Residence – September 13, 2013
The goals of Pulse metering training sessions were:
1. Learn how current practice impact energy use 2. Periodically monitor systems to discover anomalies 3. Communicate discoveries to Energy and Environmental Sustainability team (EES) 4. Propose sequence or operational improvements to the EES team 5. Take action, where appropriate, to reduce inefficiencies
Activities Completed in 2014/2015
Vancouver Coastal Health worked in partnership with Fraser Health and Provincial Health Services Authority to accomplish the following activities between April 1, 2014 and March 31, 2015:
• Developed a 2 Year Action Plan for the WCA program.
• Coordinated the Green + Leaders program, including managing and training volunteers and supporting the implementation of energy conservation toolkits and campaigns.
• Produced a new department level Energy Assessment Tool for Green + Leaders.
• Conducted a study to determine the effectiveness of installing timers on blanket warmers.
• Developed a Green Labs Strategy, including online training material.
• Worked with human resources to develop and launch new employee orientation material.
• Conducted a semi-annual GreenCare Survey and produced an infographic to share results with staff.
Strategy Energy Management Plan Page 55

VCH Strategic Energy Management Plan
For 2015 we will:
• Recruit more staff volunteers and continue to support our Green + Leaders. • Hold a Waste Forum for residential care stakeholders to reduce food waste (VCH). • Run Green + Leaders materials reduction campaign in 120 departments across all 4 Health
Authorities by the end of 2015.
The Cut the Carbon / GreenCare Community The Cut the Carbon / GreenCare Community is an online motivational program that promotes a commitment towards specific carbon cutting actions and environmental conservation. The program is a secure, web-based community that allows staff to benchmark themselves, make conservation commitments, compare and share stories of success, and network with other staff. The program was launched in March 2011 across the Lower Mainland Health Authorities (LMHA) and the first year target was a market penetration of 6,000 staff with a reduction of 2,000 tons of CO2. The Green + Leaders Program The Green + Leaders program (G+L) was initially launched in Provincial Health Service Authority in 2009 and was expanded to the other LMHA. The program was rolled at VCH during the fall of 2010. The aim of the program is to recruit volunteers (employees) to be sustainability leaders and provide colleagues with information about the impacts of their daily activities. The volunteers attend training sessions and are provided with the necessary tools to model new behaviours. Target areas include energy reduction, alternative transportation and materials reduction.
List of VCH Green + Leaders Energy Volunteers – Appendix 2.4, Page 75 Culture of Stewardship and Social Sustainability (Submitted by Angie Woo, G+L Coordinator)
TOPIC GOAL Create a culture of sustainability stewardship (environmental, social, and economic) in the workplace and promote active staff engagement. Recruit, train and maintain a minimum of 150 Green + Leaders for each of the LM Health Organizations (LMHO). Status: In 2014, the Green+Leaders program expanded by 43 staff volunteers with a total of 231 by December 31, 2014. Since the program’s inception in 2009, 313 staff across the four LMHOs have been trained. Each G+L is estimated to influence at least 25 people in their workplace. With a staff population of approximately 65,000 in the Lower Mainland, G+L have engaged or influenced at least 7,825 others – or approximately 12% of the workforce through their campaigns and initiatives. These activities focus on achieving zero waste, energy conservation, active and clean transportation, and social sustainability in the workplace. G+Ls carry out behaviour change activities in a broad range of workplaces, including acute care and residential facilities, laboratories and clinics, and administrative offices. Their activities often are open to their entire units, departments or floors. As a result, wide arrays of staff are exposed to sustainability concepts and opportunities to actively create a culture of stewardship.
Strategy Energy Management Plan Page 56

VCH Strategic Energy Management Plan
Moreover, the Green + Leaders program includes frontline staff who have broad exposure to the public. As nurses and pharmacists are among the most trustworthy professions in Canada, according to a recent survey by Ipsos Reid, they have a unique opportunity to share their knowledge, experiences and encouragement with the general public. And, according to a staff survey conducted by GreenCare in December 2014, nearly 65% of respondents would like to help foster environmental sustainability in their workplaces. Of these, over 60% work in an acute or clinical setting.
For the next year, the program will maintain its goal of 150 staff volunteers per health organization, as an optimal number for influencing behavioural and cultural change across organizations.
Special Projects Green + Leaders continue to score highly on staff engagement surveys. As such, they are likely to be more attuned to the people and possibilities in their workplaces. In some cases, G+L program tools are adjusted to suit their audiences’ interests and needs; and in other cases, staff volunteers will undertake special projects to address sustainability challenges particular to their workplaces. Stella Cockett works in the pediatric cardiology clinic at the Children & Women’s Hospital in Vancouver, and has been a G+L since 2012. She started an exam paper recycling project in 2013 that continues to go strong. After testing the paper to determine that it is recyclable, Stella worked with her colleagues to set the paper up to roll directly off the exam table and into a recycling container. The paper is then emptied by housekeeping. With 7,000 patient visits each year, the clinic significantly reduces its paper waste with this slight modification to process while maintaining the same quality of patient care. Number of New G+L per Health Authority in 2014: FH: 15 PHC: 2 PHSA: 9 VCH: 12 (including Sodexo VCH, Brookefield / Johnson Controls (P3 management companies) Sodexo (food Services contractor): 3 (i.e. ARHCC, GF Strong, VGH) LMFM: 1 BCMHA: 1
Strategy Energy Management Plan Page 57

VCH Strategic Energy Management Plan
1.5.5 Continuous Optimization Program
VCH originally committed to 22 Continuous Optimization Programs at 8 VCH sites in 2010. Squamish Hospital was added to the program in 2014. A COP Opportunity Assessment was carried out for the P3 Diamond Care Centre (359,682 ft2) at the VGH in 2013 which was accepted by BC Hydro and a Power Smart incentive agreement generated. However, the COP for this facility is currently on hold until an agreement is reached with Access Health, the P3 building management company, which we hope will be resolved shortly. Total committed costs for all COP projects excluding the P3 Diamond Care Centre at the VGH site, are for $ 1,394,498 based on $ 0.25/ft2 and a total square footage of 5,577,990 ft2.
Table VCH-32 provides a breakdown of the total VCH COP projects from 2011/2012 to 2016/2017 with the estimated completion dates and the estimated annual non-cumulative energy savings in electricity kWh, (6.4 GWh), natural gas GJ (44,736 GJ), and reductions in GHG tCO2e emissions (2,402 tCO2e) for a total estimated annual cost savings of $ 855,580. The nine (9) completed COP projects (Ref 1-9 Table VCH-32) generated savings of 4.4 GWh of electricity, 30,741 GJ of natural gas, and 1,657 tCO2e of GHG emissions reductions for a total non-cumulative cost savings of $ 561,926
Table VCH-32 - VCH BC Hydro Continuous Optimization Program (COP) Plan and
Estimated Costs and Savings -2011/2012 – 2016/2017- Non-Cumulative VCH BC HYDRO CONTINUOUS OPTIMIZATION PROGRAM (COp), COMPLETED, IN PROGRESS AND PLANNED/COMMITTED - 2011/2012 - 2016/2017 - NON CUMULATIVE SAVINGS 7/10/2015
1 2 3 4 5 6 7 8 9 10 11 12 13 14 15 16 17 18 19 20 21 22 23 24 5ESTIMATED ESRIMATED ESTIMATEDELECTRICITY GAS GHG tonnes ESTIMATED
REFFACILITY
SIZEENERGY PROJECT
DESCRIPTION STATUS SAVINGS SAVINGS REDUCTIONS COMPLETION# SITE/FACILITY (SqFt) (kWh) (GJ) (tCO2e) DATE
2011/2012 2012/2013 2013/2014 2014/2015 2015/2016 2016/2017 SUB-TOTALS TOTAL
kWh GJ kWh GJ kWh GJ kWh GJ kWh GJ kWh GJ kWh GJ tCO2e COST SAVINGS
1 Minoru Residence 127,893 BC Hydro COp Implementation COMPLETED 313,312 3,478 182 May-11 313,312 3,478 - - - - - 313,312 3,478 182 41,318$
2 UBC Hospital - Koerner Pavilion 450,413 BC Hydro COp Implementation COMPLETED 843,781 8,000 422 Mar-11 843,781 8,000 - - - - - 843,781 8,000 422 102,813$
3 PHC - Mount St Joseph Hospital 221,146 BC Hydro COp Implementation COMPLETED 190,533 3,478 179 Aug-12 190,533 3,478 190,533 3,478 179 33,564$
4 RGH - North & South Towers 246,974 BC Hydro COp Implementation COMPLETED 95,587 2,713 138 Aug-12 95,587 2,713 - - 95,587 2,713 138 22,832$
5Richmond Hospital - Westminster Health Centre 75,050 BC Hydro COp Implementation COMPLETED 125,502 551 31 Jan-14 125,502 551 125,502 551 31 12,660$
6 VGH - Jim Pattison - South - Phase 1 762,320 BC Hydro COp Implementation COMPLETED 1,692,275 3,790 233 Mar-14 1,692,275 3,790 - - 1,692,275 3,790 233 164,352$
VGH - Jim Pattison - South - Phase 2 762,320 BC Hydro COp Implementation COMPLETED 287,000 4,824 249 Jun-14 287,000 4,824 287,000 4,824 249 63,281$
7 Powell River General Hospital 132,918 BC Hydro COp Implementation COMPLETED 659,896 830 59 Jul-14 659,896 830 659,896 830 59 70,272$
8 LGH - Evergreen House North & South 148,660 BC Hydro COp Implementation COMPLETED 27,731 1,262 64 Mar-15 27,731 1,262 27,731 1,262 64 14,653$
9 GF Strong Rehabilitation Centre 214,020 BC Hydro COp Implementation COMPLETED 128,900 1,880 97 Mar-15 128,900 1,880 128,900 1,880 97 36,191$
10LGH - Northern Expansion & Acute Tower 456,423 BC Hydro COp Implementation IN PROGRESS 229,629 2,423 127 Mar-16 229,629 2,423 229,629 2,423 127 42,748$
11 VGH - Banfield Pavilion 94,686 BC Hydro COp Implementation IN PROGRESS 122,656 214 14 Aug-15 - - 122,656 214 122,656 214 14 11,344$
12 VGH - Centennial Pavilion 411,179 BC Hydro COp Implementation IN PROGRESS 412,530 2,604 141 Aug-15 412,530 2,604 412,530 2,604 141 58,555$
13 VGH - Jim Pattison - North 392,698 BC Hydro COp Implementation IN PROGRESS 110,189 275 17 Aug-15 - - 110,189 275 110,189 275 17 3,478$
14 VGH - Blusson(ICORD) 127,625 BC Hydro COp Implementation IN PROGRESS 113,538 444 25 Aug-15 113,538 444 113,538 444 25 12,803$
15 VGH - Eye Care Centre 71,010 BC Hydro COp Implementation IN PROGRESS 73,226 1,074 56 Aug-15 73,226 1,074 73,226 1,074 56 15,630$
16 VGH - Energy Centre 49,675 BC Hydro COp Implementation ON HOLD - - - - -
17 VGH - Research Pavilion 74,039 BC Hydro COp Implementation IN PROGRESS 40,040 108 6 Aug-15 40,040 108 40,040 108 6 4,060$
18VGH - Jack Bell Research Centre& Robert HO Research 78,154 BC Hydro COp Implementation IN PROGRESS 256,324 875 50 Aug-15 256,324 875 256,324 875 50 27,711$
19 UBC Hospital - Purdy Pavilion 171,080 BC Hydro COp Implementation IN PROGRESS 108,835 1,012 53 Feb-16 108,835 1,012 108,835 1,012 53 18,919$
20 UBC Hospital - Detwiller Pavilion 146,498 BC Hydro COp Implementation IN PROGRESS 67,305 826 43 Feb-16 67,305 826 67,305 826 43 13,762$
21 North Shore Kiwanis Care Centre* 185,656 BC Hydro COp Implementation IN PROGRESS 91,056 1,153 60 Jul-16 91,056 1,153 91,056 1,153 60 19,607$
22 St Mary's Hospital (New Building) 60,000 BC Hydro COp Implementation IN PROGRESS 25,847 1,016 51 Mar-16 25,847 1,016 25,847 1,016 51 17,677$
23 Squamish Hospital 117,553 BC Hydro COp Implementation IN PROGRESS 92,249 1,134 59 Aug-16 92,249 1,134 92,249 1,134 59 20,237$
24 VGH Diamond Care Centre (P3) 359,682 BC Hydro COp Implementation ON HOLD 261,145 772 45 Mar-17 261,145 772 261,145 772 45 27,114$
TOTAL SQUARE FOOTAGE 5,937,672 TOTAL kWh & GJ SAVINGS 6,369,086 44,736 2,402 kWh & GJ ESTIMATED
SAVINGS 1,157,093 11,478 286,120 6,191 2,477,673 5,171 443,631 7,966 1,534,272 9,855 470,297 4,075 6,369,086 44,736 2,402 855,580$
SEMP-VCH 2015/COP Projects Implementation Completion Plan JM 7-24-2014 rev 7-10-2015 2011/2012 2012/2013 2013/2014 2014/2015 2015/2016 2016/2017 TOTALS TOTAL
kWh GJ kWh GJ kWh GJ kWh GJ kWh GJ kWh GJ kWh GJ tCO2e COST SAVINGS
GHG (tCO2e) (tonnes) Reductions 30 574 7 310 64 259 12 398 40 493 12 204 166 2,237 2,402 60,564$
ELECTRICITY kWh, NATURAL GAS GJ, and GHG tCO2e SAVINGS/ PER ANNUM 2011/2012 - 2016/2017 - NON-CUMULATIVE
Strategy Energy Management Plan Page 58

VCH Strategic Energy Management Plan
1.5.6 BC Hydro New Construction Program
A number of facilities at VCH have participated in the BC hydro’s New Construction Program to maximize energy savings. Listed below are the completed, in progress and planned facilities: Completed Facilities 1. VGH Robert H.N. Ho Research Centre – June 2011 Occupancy Robert H.N. Ho Research Centre at the VGH site, a 68,286 ft2 research facility, was completed and occupied in June, 2011. Annual energy savings measures were calculated at 343,148 kWh of electricity, 399 GJ for Natural Gas and GHG reductions of 29 tCO2e. This facility was also presented with a Commercial Building Award - 2012 for Community – Education/Research.
VGH Robert H.N. Ho Research Centre – Occupancy June, 2011
2. VGH Willow Pavilion – June 2012 Occupancy The VGH Willow Pavilion major renovations of this 1930s 57,888 ft2 were completed in June, 2012. Eight (8) ECMs, including high performance glazing, increased roof and wall R-Value insulation, external shading, low flow DHW fixtures, reduced LPD, lighting controls (occupancy sensors), and a high efficiency HVAC system generated estimated savings of 766,712 kWh of electricity, 2,510 GJ of natural gas and 146 tCO2e (tonnes) of GHG reductions and cost avoidance.
Strategy Energy Management Plan Page 59

VCH Strategic Energy Management Plan
VGH Willow Pavilion, Occupancy, June 2012
3. St Mary’s Hospital Expansion (Sechelt General Hospital) – March, 2013 Occupancy
St Mary’s Hospital (now Sechelt Hospital) expansion/renovation project (51,990 ft2) in Sechelt, originally scheduled for occupancy in October, 2012, was completed and occupied in March, 2013. The project included energy efficient renovations in the old St Mary’s Hospital building.
The new facility (Sechelt Hospital North Tower) is a three (3) storey building and the first LEED Gold NC Construction certified building for VCH. Implemented energy conservation savings measures are projected at annual savings of 360,501 kWh in electricity, 193 GJ in natural gas and GHG emissions reductions of 19 tCO2e. The new facility has a GeoExchange system, the first for VCH. The energy savings features include radiant piping in the ground slab to remove excess heat from the building during the summer months. This thermal energy is transferred to an underground water tank which acts like a capacitor, storing the energy until the heating season begins. The main heating system uses heat pumps connected to the geothermal field. The double envelope construction system exploits the thermal properties of air to enhance the energy performance of the building. A 78 solar panels array was installed on the roof of St Mary’s Hospital for estimated annual savings of 21,500 kWh.
Strategy Energy Management Plan Page 60

VCH Strategic Energy Management Plan
St Mary’s Hospital (now Sechelt General Hospital) Expansion – LEED Gold NC Certification –
Occupancy March, 2013
The 78 solar panels array at St Mary’s Hospital expansion – Sechelt
Occupancy – March, 2013
Strategy Energy Management Plan Page 61

VCH Strategic Energy Management Plan
The GeoExchange system piping at St Mary’s Hospital expansion – Sechelt
Occupancy – March, 2013 4. The LGH HOpe Centre Mental Health Facility – Occupancy, November 2014
The Lions Gate Hospital Hope Centre in North Vancouver is the new Centre for Mental Health and Addictions (MS&S). The 150,695 ft2 4 storey Class B healthcare building will house an in-patient section, a dedicated teaching space for the UBC Faculty of Medicine to increase educational opportunities for medical school students and residents and a dedicated permanent home for the BC Ambulance Services of North Vancouver. The facility is built to LEED Gold NC (New Construction) standards. Phased-in occupancy of this facility started in November, 2014 and full occupancy was in January 2015. The BC Hydro New Construction Program identified eight (8) energy measures (ECMs) with total estimated savings of 1,130,735 kWh per annum. The Energy Performance for the building has been calculated at 41% better than the ASHRAE 90.1 2004 Baseline model. The Hope Centre is powered by the Lonsdale Energy Corporation (LEC), an energy provider which includes renewable resources such as solar and geothermal energy in the various sources it uses. The combination of energy efficiency benefits are enhanced by a number of design features such as larger windows for more daylight and careful choice of materials for construction such wood-style siding which acts as an insulator to help maintain regulated temperatures in patient rooms despite direct access to
Strategy Energy Management Plan Page 62

VCH Strategic Energy Management Plan
sunlight. Louvered shades outside many of the windows also help to reduce heat transfer without reducing the positive effects of natural light as well.
The Hope Centre – LEED Gold (NC) Certification
November, 2014 5. Willingdon Creek Village Residential Complex Care Facility – Occupancy – January 2015 Construction of this two (2) storey 102 bed (73,200 ft2) facility was completed in January, 2015 and residents were moved in February, 2015. This facility replaced the Olive Devaud Residence in Powell River and is located on the grounds of the Powell River Hospital and Evergreen Residence. This facility participated in BC hydro’s New Construction Program and Fortis BC’s Commercial Custom Design Program – New Construction for estimated savings of 275,220 kWh, 4,991 GJ of natural gas, and reductions and cost avoidance of 257 tCO2e GHG emissions.
Willingdon Creek Village Complex Care Residential Care Facility River - Artist Rendition
Projected Occupancy – January 2015
Strategy Energy Management Plan Page 63

VCH Strategic Energy Management Plan
IN-PROGRESS - NEW CONSTRUCTION PROGRAM
BC Hydro’s New Construction Program was applied to six (6) facilities at VCH since 2010/2011. Five (5) facilities were completed and occupied and the 6th facility, the Joe and Rosalie Segal Family Mental Health Care Centre at VGH, is also participating in this program. This new facility is currently under construction and will not be ready for occupancy until late 2017 or early 2018. The Joe and Rosalee Segal Health Care Centre
This mental health facility, located at the VGH site, is currently in the construction stage and scheduled for occupancy in late 2017 or early 2018. The facility will provide short-term, acute care to those suffering from major depression, anxiety, schizophrenia, psychotic and mood disorders and drug and alcohol. This facility will be built to LEED Gold (NC) Construction standards and will go through BC Hydro’s New Construction Program and Fortis BC’s Commercial Custom Design Program – New Construction. Energy and Environmental Sustainability (EES) lighting standards will be included in this project. The new Joseph and Rosalie Segal Health Care Centre will include:
• Eight (8) floors of approximately 119,500 ft2, excluding parking and mechanical penthouse • 100 private patient rooms, each with its own bathroom. • Natural light in most areas and the use of calming colours and textures to create healing
environments. • Quite places on each floor for reading and meditating. • Access to outdoor gardens and courtyards, as well exercise facilities, televisions, and the internet. • Improved patient and staff safety and security.
VGH - The Joe and Rosalie Segal Family Health Centre – Artist’s Rendition
Projected Occupancy Late 2017 or Early 2018
Strategy Energy Management Plan Page 64

VCH Strategic Energy Management Plan
1.5.7 Renewable Energy Solutions
Renewable Energy solutions were planned and implemented at two (2) VCH facilities – The North Shore Hospice, adjacent to the Lions Gate Hospital in North Vancouver, and at St Mary’s Hospital (recently renamed Sechelt General Hospital) expansion in Sechelt.
1. VCH North Shore Hospice – November, 2011 The North Shore Hospice, a 16,146 ft2 15 bed Palliative Care facility, was constructed in 2010/2011 and occupied in November, 2011. It was built with a number of innovative features including solar hot water panels to reduce natural gas consumption by an estimated 33%. Sustainability features include:
• Storm Water management; • planting of local plant species to conserve water use by reducing the need for irrigation; • radiant floor heating; • high efficiency condensing hot water boilers; • pre-heating of air intakes; • Heat Recovery Energy Wheels to allow for the recovery of the total energy from both water and
moisture found in the air; • Water to water chiller units which eliminate the need for a cooling tower.
The VCH North Shore Hospice – Occupied, November 2011
2. St Mary’s Hospital (Sechelt General Hospital) Expansion – Sechelt – March, 2013
St Mary’s Hospital new facility has a GeoExchange system, the first for VCH. The energy savings features include radiant piping in the ground slab to remove excess heat from the building during the summer months. This thermal energy is transferred to an underground water tank which acts like a capacitor, storing the energy until the heating season begins. The main heating system uses heat pumps connected to the geothermal field. A 78 solar panels array was installed on the roof of St Mary’s Hospital for estimated annual savings of 21,500 kWh.
Strategy Energy Management Plan Page 65

VCH Strategic Energy Management Plan
1.5.8 District Energy Systems
• A district energy system (Clean Energy Plant) is currently under planning for the Women’s and Children’s hospital campus site and an MOU has been signed with Fortis BC. This plant will also provide energy to the VGH Campus Site. Estimated completion will be in 2017/2018.
• The new HOpe Mental Health Centre and Addictions (MH&A) in North Vancouver, a LEED GOLD NC (New Construction) facility, occupied in November, 2014, is powered by Lonsdale Energy Corporation (LEC), a district energy provider in North Vancouver that includes renewable sources such as solar and geothermal energy in the various sources it uses. The LEC system allows for significant improvements in efficiency and a reduction of greenhouse gases (GHG) produced as it uses hot water rather than steam.
1.6.0 Other – Mechanical and Electronic Equipment Inventories
Inventories of mechanical and electrical equipment including Imaging, Cooling Towers, Chillers, Air Conditioning Units, and Air-Handling Units have been compiled for the following VCH Core facilities:
• Vancouver General Hospital
• UBC Hospital
• Richmond General Hospital
• Powell River Hospital and Evergreen
• GF Strong
• Lions Gate Hospital and Evergreen
• St Mary’s Hospital (Sechelt Hospital)
• Whistler Health Care Centre
• Minoru Residence
Appendices 2.6, 2.7, 2.8, 2.9 - Pages 75-83
Strategy Energy Management Plan Page 66

VCH Strategic Energy Management Plan
2 APPENDICES
2.1 VCH – Sustainability Policy:
Strategy Energy Management Plan Page 67

VCH Strategic Energy Management Plan
Strategy Energy Management Plan Page 68

VCH Strategic Energy Management Plan
Strategy Energy Management Plan Page 69

VCH Strategic Energy Management Plan
Strategy Energy Management Plan Page 70

VCH Strategic Energy Management Plan
2.2 Key Stakeholders - 2015/2016
KEY STAKEHOLDERS
Department Name Position
Lower Mainland Consolidation (LMC)
Lower Mainland Facilities Management (LMFM)
LMFM, Executive
Peter Goldthorpe VP Capital Projects, Real Estate & Facil ities Lower Mainland Facilities Management
Paul Becker Chief Facil ities Operating Officer Vacant ED, Operations, Energy & Technical Services Alan Grossert ED, Facil ities Planning & Projects Orin Jonat ED, Business Performance and Corporate Support Marco Buccini ED, Strategic Development
LMFM, Energy Environment & Sustainability
Mauricio Acosta Director Energy & Environmental Sustainability
Ruth Abramson Sustainability Manager Glen Garrick Sustainability Manager Olive Dempsey (mat leave) Sustainability Coordinator (Green + Leaders) Angie Woo Sustainability Coordinator (Green + Leaders)
Sonja Janousek Sustainability Coordinator (Reduction and Recycling Coordinator)
Ashley Edworthy Sustainability Coordinator (Reduction and Recycling Coordinator)
Alexandra Turnbull Coordinator, Communications & Sustainability Reporting
Eisell Omampo Sustainability Coordinator (TDM)
Robert Bradley Energy Manager (FHA) Alex Hutton (mat leave) Energy Manager (PHSA & PHC) Sabah Ali Interim Energy Manager (PHSA & PHC) John Manougian Energy Manager (VCHA) Jeson Mak Energy Coordinator (FHA) Blair Mcfarlane Interim Energy Coordinator Alan Lin Energy Specialist (VCHA) Richard Wellwood Energy Specialist (PHSA & PHC) Yori Jones Energy Specialist (FHA)
LMFM, Facilities Planning
vacant Director, Facil ities (Strategic) Planning Yen Mah Director, Facil ities (Strategic) Planning John Little Manager, Facil ities Planning Marie Fontaine Manager, Facil ities Planning Mary Lynn Nicodemus Sr. Facil ities Planning Michael Wilson Sr. Facil ities Planning Barbara Dewhirst Sr. Facil ities Planning Julie Yennedy Sr. Facil ities Planning Noor Esmail Sr. Facil ities Planning Deanna Clarke Capital Project Planner
Strategy Energy Management Plan Page 71

VCH Strategic Energy Management Plan
Angela Bennett Capital Project Planner Scott Staniui Capital Project Planner Laura Arpiainen Capital Project Planner
LMFM, Capital Projects
Larry Harder Director, Capital Projects Sharon Petty Director, Capital Projects Hal Coll ier Director, Capital Projects Barry Pearce Chief Project Officer (RCH Redevelopment) Don Mah Manager, Capital Projects (FHA) Phil Delory Manager, Capital Projects (FHA) Janet Gaspar Manager, Capital Projects (Coastal) Joanne Stich Manager, Capital Projects (PHC) Westley Davidson Manager, Capital Projects (Vancouver Acute) Mike Coney Manager, Capital Projects (Richmond) Rob Yolen Project Manager Gary Fry Project Manager Brent Crawley Project Manager Wendy Pearce Project Manager George Desierto Project Manager George Cawdry Project Manager Sarah Thorn Project Manager Paul Hughes Project Manager Cynthia Pan Project Manager Yevin Pan Project Manager Allen Cheng Project Manager Rick Buksa Project Manager Tony Issa Project Manager Chris Dunsford Project Manager Ian Yerr Project Manager Carson McNeill Project Manager Martin Wright Project Manager Yaren Smith Project Manager Jenny Lasmana Project Manager John Percival Project Manager (Contract) Hal Graham Project Manager (Contract) Heather Skappak Project Manager (Construction) Dave Mack Project Manager (Construction) Maureen Haddock Project Planner Siew Chen Brian Wong Project Leader Simone McLachlan Project Leader Darcy Canaday Project Leader Sam McLeod Project Leader Sylvia Mertins Project Coordinator Michael-Ann Dissing Project Coordinator Yathleen Rudd Project Coordinator Sandi Joyce Project Assistant Diana Van Tiel Project Assistant Lucas Smith Owners Rep Greg Smith Owners Rep
LMFM, Clinical Sue Melnychuk Director, Clinical Planning and Lean Design
Strategy Energy Management Plan Page 72

VCH Strategic Energy Management Plan
Planning & LEAN Anders Engstrom Equipment Planning Manager Salima Harji Sr. Clinical Facilities Planner Helen Tam Sr. Clinical Facilities Planner Yelly Duke Sr. Clinical Facilities Planner Cathy Massey Sr. Clinical Facilities Planner Tarnjit McCauley Clinical Planner Colin Meakin Clinical Planner Anders Engstrom Equipment Planning Manager Maziyar Tabarestani Equipment Coordinator Maria Fredriksson Equipment Coordinator
LMFM, Real Estate, Leasing & Property Management
Stef Schiedon Director, Real Estate, Leasing & Property Management Glen Yirk Sr. Manager, Real Estate & Strategic Planning Will Davies Sr. Manager, Real Estate & Strategic Planning Maureen Chow Manager, Property & Asset Management Sher Flemming Manager, Property & Asset Management Nick Bodie Manager, Real Estate & Leasing Adrianna Appel Manager, Real Estate & Leasing Cam Frewin Manager, Real Estate & Leasing Rolando Catapia Manager, Property & Asset Management Corey Thomas Manager, Property & Asset Management George Venini Sr. Facil ities Planning Leader Stephen Cheung Capital Project Planner Carol Jones Property & Asset Management Coordinator Jennifer Jarvis Property & Asset Management Analyst Sue Vanderveide Real Estate & Leasing Analyst Carli Coll ison Property Coordinator
LMFM, Facilities Systems & Support
Yeith Gil l ingham Director, Systems & Support Michael Snow Sr. Project Leader (FM Project Support) Melanie Chow Sr. Project Leader (IWMS Support) Maria Fiorentino Sr. Project Leader (IWMS Support) Jas Bar Analyst System Coordinator (IWMS Support) Gordon Lee Analyst System Coordinator (IWMS Support) Rocky Gonzales Project Leader (CAD/CAFM Systems) Benjamin Tang Building Service Technicians (CAD/CAFM Systems) Fred Van Andel Building Service Technicians (CAD/CAFM Systems) Dana Wong Building Service Technicians (CAD/CAFM Systems) Ida Zhang Building Service Technicians (CAD/CAFM Systems) Dean Fogg Project Leader (Technical Services) Brian Rosier Project Leader (Technical Services) Diana Smith Project Leader (Technical Services)
LMFM, Technical Services
Jay Trethewey Director, Technical Services Wakako Thomson Risk & Performance Specialist Toven Simonsen Manager, Contracts & Optimization Marc Dagneau Manager, Integrity Programs Mark Doucette Sr. Manger, Regional Initiatives Chris Nicol Project Manager, Construction
LMFM, Space Management & Service Intake
Paul Frew Director, Space Management & Service Request Yyle Thompson Facil ities Capital Project Planner Janette Maley Facil ities Capital Project Planner
Strategy Energy Management Plan Page 73

VCH Strategic Energy Management Plan
Maureen McCauley Facil ities Capital Project Planner Laura Devil le Jones Project Coordinator
LMFM, Procurement
Peter Beckett Manager, Facil ities Management Procurement Elizabeth Zhu Facil ities Procurement Coordinator Jason Jew Facil ities Procurement Coordinator Al Yroeker Facil ities Procurement Coordinator Carolyn Wiens Faculties Construction Procurement Buyer
Fraser Health Authority (FHA)
FHA Executive Michael Marchbank President and Chief Executive Officer Martin Pochurko Chief Finance Officer Peter Goldthorpe VP Corporate Services & Facil ities
FHA/LMFM FMO Mitch Weimer Director, Facil ities Maintenance & Operations
RCH Tim Yelly Senior Manager, Facil ities Maintenance & Operations & interim Chief Engineer
Alan Yelly Maintenance Supervisor (Mech) Pat O'Neil Maintenance Supervisor (Elec) Randy Elgert Maintenance Supervisor (Build) vacant Chief Engineer
SMH Steve McTaggart Senior Manager, Facil ities Maintenance & Operations Barry Lilburn Project Manager Paul Niemi Maintenance Supervisor (Build) Gary Reitmayer Maintenance Supervisor (Elec) Sergey Fedorchuk Maintenance Supervisor (Mech) Ron Smith Maintenance Supervisor Amar Girn Chief Engineer
BUH Risto Tauriainen Manager, Facil ities Maintenance & Operations Roy Miller Maintenance Supervisor Ned Causevic Chief Engineer
CGH/FCH/HV Sean Barber Manager, Facil ities Maintenance & Operations Ian Barager Maintenance Supervisor (FCH) Dennis Cross Maintenance Supervisor (HV) Rick Ynocke Maintenance Supervisor (CGH) Carter Waugh Chief Engineer
ERH/QPC/FCC Darrell Vanderbaaren Manager, Facil ities Maintenance & Operations Don Tessier Chief Engineer / Supervisor (ERH) Wayne Pleasants Maintenance Supervisor (QPC/FCC)
LMH vacant Manager, Facil ities Maintenance & Operations Martin Donaldson Maintenance Supervisor
Mark Gushulak Chief Engineer PAH/DEH Andy Emes Manager, Facil ities Maintenance & Operations
Ron Stevenson Maintenance Supervisor (PAH) Ryan Vidulich Maintenance Supervisor (DEH) Derrick Zehner Chief Engineer (PAH)
RMH/MMH/MSA Rick Molnar Manager, Facil ities Maintenance & Operations Brad Henderson Maintenance Supervisor (RMH) Rod Sil l iphant Maintenance Supervisor (MMH/MSA)
REGIONAL Stefan Manea Technical Coordinator REGIONAL Brad Donovan Technical Coordinator(Interim) REGIONAL Dave Simmons Maintenance Supervisor
Strategy Energy Management Plan Page 74

VCH Strategic Energy Management Plan
REGIONAL Lucia Ramirez Business Analyst REGIONAL Linda Goldade Admin Assistant
FHA Finance
Yaren Teixeira Financial Manager Brian Scudder Manager, Facil ities Capital Planning Mildred van Rooyen Financial Analyst Nadia Vivanco Coordinator, Accounts Payable
Providence Health Care (PHC)
PHC Executive
Dianne Doyle President and Chief Executive Officer Mary Procter Vice President, Finance and Planning Gloria Giesbrecht Executive Assistant to Mary Procter Erica Guliker Corporate Director, Strategic Renewal & Capital Assets
PHC/LMFM, FMO Chris Poole Director, Facil ities Maintenance & Operations SPH John Hood Project Manager, Capital Projects (SPH)
Marko Yujala Supervisor Brian Postlethwaite Electrical Supervisor Parm Barn Chief Engineer, Mechanical Department, SPH
MSJ Chris McPhee Supervisor, Facil ities Management, MSJ & HFH Billy Chan HVAC Technician
HFH Stuart Walker Physical Plant Maintenance Brock Fahrni Ryan Hussein Site Manager
St Vincent Langara Residence
Ryan Hussein Site Manager Arif Padamshi Operations / Site Leader, Elder Care Brookie Chan Program Assistant, Elder Care
Youville Residence Ryan Hussein Site Manager St Vincent Heather -
Honoria Conway Ryan Hussein Site Manager
PHC Finance Amanda Wong Director, Accounting & Treasury Ell iott Ebel Financial Analysis
Provincial Health Services Authority (PHSA)
PHSA Executive Carl Roy President and Chief Executive Officer Thomas Chan Chief Financial Officer Richard Woo Corporate Director, Capital Planning
PHSA, LMFM/FMO Frank Levenheck Director, Facil ities Maintenance & Operations C&W Allan Jonzon Manager, Facil ity Operations, C&W
Laurence Bayzand Director Inter Campus Operations Zoltan Nagy-Gyorgy Chief Engineer Wendy Burton Administrative Assistant Dave Marier Manager Arie Frenklach HVAC Lead Hand Harry VanAndel Electrical Supervisor George Grossling Supervisor - Facil ities Maintenance & Operations Todd Smith HVAC Technician Phil Carriere Engineer Mark Pope Electrician Ernest Doe HVAC Technician
Sunny Hill Dave Marier Manager David Alves Senior Building Operator
Strategy Energy Management Plan Page 75

VCH Strategic Energy Management Plan
BCCA, BCCRC Yaren Lemmen Acting Director, BCCA CRC William Man Facil ities Operations Manager, BCCA
BCCA, VICC David Law Facil ities Manager Vacant Director Regional Operations, VICC
BCCA, FVCC Savik Sidhu Director, Regional Operations, AC & FVC BCCA, VCC Vacant Director, Regional Operations, VCC
C&W Redevelopment Project
Dave Ingram Chief Project Officer, Children’s and Women’s Redevelopment Project
Rhonda Lui Manager, C&W Redevelopment Project, Phase II Yevin Zembik Manager, C&W Redevelopment Project, Phase II Meghan Cross Project Coordinator
PHSA Finance Ben Crocker Senior Corporate Financial Analyst, PHSA Hubert Orzech Corporate Financial Analyst, PHSA Manjit Matharu Corporate Financial Analyst, PHSA
Vancouver Coastal Health Authority (VCHA)
VCHA Executive Mary Ackenhausen President and Chief Executive Officer Glen Copping CFO and VP of System Development & Performance Dr. Patricia Daley VP, Public Health & Chief Medical Officer
VCH, Finance
Helen Yung Executive Dir. Financial Services, Financial Planning Mike Wong Capital Analyst Susan Luckey Manager, Capital Finance
Johan Marais Regional Director, Capital and Asset Management and Planning
Rodrigo Lecompt Business Analyst VCH/LMFM - FMO Ian Clearie Acting Director, Facil ities Maintenance & Operations
VGH Rian Dodds Manager, Maintenance & Heliport Blair Steeves Manager, Technical Services - Electrical
Ed Florencio Chief Engineer LGH, NS & Sea-to-
Sky Christopher Nock Senior Manager, Facil ity Operations
LGH Michael Pavan Electrical Supervisor Michele Reitz FMO Supervisor Brian Russell FMO Supervisor David Dehod Chief Engineer
RGH Tom So Senior Manager, Facil ity Operations Joe Yasstan FMO Supervisor Val Tepes FMO Supervisor Mahfuzul Islam Chief Power Engineer Maher Ayach HVAC Technician
Ramil Javarina Electrician UBCH Paul Armstrong Acting Manager, Facil ity Operations
Hassan Fereidouni Maintenance Supervisor Whistler Health Care
Centre David Harrison Manager, Facil ity Operations
Squamish Hospital David Harrison Manager, Facil ity Operations Sechelt Hospital Adam Helfer Manager, Facil ity Operations
Powell River Hospital Gregory Smith Manager, Facil ity Operations Chris Duckett Chief Engineer
G.F Strong Henry Ziolkowski Maintenance Worker
Strategy Energy Management Plan Page 76

VCH Strategic Energy Management Plan
George Pearson Centre
Chanchal Chahal FMO Supervisor
North Shore Kiwanis Jerry Cimino Electrician Other Stakeholders and Partners Interior Health Authority
Lori Holloway CD Plant Services Tanya Stockman Manager Environmental Sustainability Carolyn Reid Energy Manager Vacant Energy Specialist
Vancouver Island Health Authority
Joe Murphy VP, Operations & Support Services Cecil Rhodes CD Facil ities Management & Operations Deanna Fourt Director, Energy Efficiency & Conservation Albert Boulet Energy Manager Joe Ciarniello Energy Manager Yevin Ramlu Energy Specialist Björn Richt Energy Specialist Claudette Poirier Energy Specialist
Northern Health Authority
Albert Sommerfeld Regional Director, Capital Planning & Support Services John Johnson Director, Capital Planning & Support Services Les Sluggert Energy Manager Yeith Hebert Energy Specialist
Ministry of Health (MoH)
Joel Palmer Executive Director Capital Service Branch Dragana Perisic Director, Capital Policy and Planning James Postan Director Capital Services Geoffrey Homer Senior Policy Analyst, Capital Services
Climate Action Secretariat (CAS) Susanna Laaksonen-Craig Head, Climate Action Secretaria
Timothy Lesiuk Executive Director and Chief Negotiator Suzanne Spence Executive Director Heather English Sr. Policy Analyst Dave Aharonian Policy Analyst
Carbon Measurement and Reporting Branch (CMRB)
Orest Maslany Director, Carbon Measurement & Reporting, Shared Services BC
Ron Colquhoun Senior Business Analyst Michael Creekmore Business Analyst Stuart Hall Business Analyst Mark Borland Business Analyst
BC Hydro
Jeff Whitson Senior Yey Account Manager - Health Sector Paul Seo Program Manager - Power Smart Marketing Simon Vickers Program Manager - Energy Managers Jorge Marques Manager, Technology & Innovation Oscar Ceron Program Manager of NCP Gary Hamer Technology and Innovation Manager Craig Hunt Engineering Tech Project Specialist (SEMP Reviewer) Graham Henderson Senior Program Manager, C.Op. Tommy Yim Energy Management Engineer (C.Op.)
Strategy Energy Management Plan Page 77

VCH Strategic Energy Management Plan
Meaghan Fahey Power Smart, C.Op. Coordinator Bojan Andjelkovic Senior Energy Management Engineer, NCP Nikolay Smirnov Lighting Specialist, NCP Allan Chung Senior Regulatory Specialist Senior Regulatory Specialist Program Specialist on NCP WBD Ashley Salvador Operations (SUCH) mailbox Cory Farquharson Commercial Business Account Rep (PSPXpress) Irfan Rehmanji Technology Innovation Manager, Commercial Sector Salah Mahdi Consultant, Power Smart Engineering (NCP) Justine Lepage Parco Field Metering Technologist (C.Op. EMIS) Melodie Bell Business Account Representative
FortisBC
Jennifer Coulthard Energy Solutions & Yey Accounts Manager, Public Healthcare
Colin Norman EEC Program Manager, Portfolio Projects
Angela Falbo Energy Solutions & Yey Accounts Manager, Private Healthcare
Jenelle Anderson Marketing Coordinator Jaime-Ann Lew Program Specialist Ramsay Cook Program Manager Commercial Buildings Alicia Hearn Conservation Education and Outreach Jermin Hsieh Energy Util ization Manager, Market Development Anthony Ho Energy Util ization Manager, Market Development Robert Schuster Marketing Coordinator, Innovative Technologies Dan Bradley Energy Util ization Manager, Market Development Deacon Tong Marketing Coordinator, EAP Yelly Hewson Fortis Electric contact for Yelowna projects Jim Yobialko Program Manager Innovative Technologies
BISS Tracy Shannon Regional Waste Contracts Manager Shemina Patni Regional Contract Manager - Patient Food Service
HSSBC Mansour Rakhmanov Supply Chain Business Analyst
Strategy Energy Management Plan Page 78

VCH Strategic Energy Management Plan
2.3 VCH Estimated Electrical Energy Breakdown – 2015
Our VCH electrical energy actual consumption breakdown and costs for 2015:
Rank End Use Estimated End Use Percent
Electricity Use (kWh/yr)
2015
Cost* ($/yr) 2015
1 HVAC, Fans, Motors and Pumps
25% 29,106,998 $ 2,248,553
2 Plug Load (PCs, servers, data centres, copiers.
25% 29,106,998 $ 2,248,553
3 Lighting 20% 23,285,598 $ 1,798,843 4 Medical Equipment
(MRI, Imaging, CT Scanners…
15% 17,464,199 $ 1,349,132
5 Chillers & Cooling Towers
5% 5,821,400 $ 449,711
6 Refrigeration 5% 5,821,400 $ 449,711 7 MedVacs &
Miscellaneous Patient Care Equipment
3% 3,492,840 $ 269,826
8 Miscellaneous 2% 2,328,560 $ 179,884 Total 100% 116,427,990 $ 8,994,214
* Average Costs for all VCH CORE sites including taxes @ $ 0.0772513/kWh
Strategy Energy Management Plan Page 79

VCH Strategic Energy Management Plan
2.4 List of Green + Leaders Energy Volunteers – VCH
Fifty three (53) VCH Green + Leaders volunteers are currently in the program, an increase of 9 from 2013/2014
GREEN+LEADERS VCH Energy & Sustainability Volunteers First Name Last Name Job Title Unit Agency Unit Type Building
Agnes Chang Registered Nurse Strathcona Mental Health Team VCHAmy Healy Registered Nurse on T15A&B Leukemia/BMT program VCH ClinicalAnju Bedi Program Assistant Healthy Living Program VCH 5913 West BoulevardBenson Low Manager, Support Services, Food Serv (BISS) Richmond Hospital, Bridge
VCH Richmond Hospital
Bernardo Fernandes Unit Clerk ER VCH Richmond HospitalBetty Quon Administative Assistant Clinical and Systems VCH 590 West 8th AvenueCaroline Heisler Health Systems Planning Advisor Transformation VCH 601 West BroadwayCarolyn Martini RN ER VCH Clinical Lions Gate HospitalChun Su Senior Technical Analyst IMITS VCH Operational WillingdonCissy Chen Food Services Manager Food Services Sodexo (VCH) Clinical Richmond Lions ManorCsilla Egri Medical student VCH Clinical Richmond Hospital (based there for
2014)Delia Bortingnon Recruitment Analyst & Admin Assista Recruitment &
VCH 601 West Broadway
Denise Nelson Strathcona Mental Health Team VCHDiana Pham Education Compliance Associate Employee Engagement VCH Office 601 West BroadwayEiselle Omampo TDM Coordinator Integrated Protection Services VCH Operational Willow Chest CentreHana Tahaei Food Services Manager Food Services Sodexo (VCH) Food Services Lions Gate HospitalIan Young Marketing researcher Recruitment Services VCH Operational 620 West 8th AveJill Liu Retail Food Service Manager Koerner Pavillion, UBCH Sodexo (VCH) UBC HospitalJustine Bugayong Nursing Support Services Vancouver Regional Pediatric VCH Clinical Pacific Spirit Community Health Katerina Iliakis Analyst/Admin Assistant Regional Scheduling and Time-
VCH 601 West Broadway
Kelsey Wolfe Registered Nurse T15 Leukemia / BMT VCH Clinical JPPKenneth Hawkins Decision Support Advisor VCH Decision Support VCH 520 West 6th AveKevin MacDuff Director, Special Projects Employee Engagement VCH Operational 601 West BroadwayLaura Muljiani Senior Finance Clerk Finance VCH Operational 590 West 8th AvenueLauri Dunk medical imaging VCH Clinical 5544 Sunshine Coast HighwayLena Lum Cytotechnologist Anatomic Pathology, Cytology VCH Lab VGHLena Dubinina Business Analyst Billing & Accounts Receivable
VCH Office 601 West Broadway
Louise Underwood RN Birth Centre VCH Clinical Richmond HospitalMaile Conwi Communications Leader Communications and Public VCH Office 520 West 6th AveMargaret Fleming VGH Retail Manager Food Services Sodexo (VCH) VGHMarilyn Shamatutu Educator/Clinician T11A, T11D VGH VCH Clinical VGHMarwa Elashi Nursing Unit Assistant VCH Clinical VGHMegan Fekete Regional Clinical Educator Clinical Education VCH Clinical Doctor's ResidenceMelanie Hyde Laboratory Technician Cytogenetics VCH Lab VGHMelissa Bedford Research Assistant Cardiology VCH Office VGH (Diamond Centre)Michael Scott RN Burnaby Centre for Mental Health
VCH Clinical Burnaby Centre for Mental Health and
Mohsen Saberi Food Service Manager Sodexo at UBC Hospital Sodexo (VCH) Operational UBC HospitalMolly Lee Radiation Technologist Radiation Therapy VCH Clinical VGH - JPPNadine Kot Strathcona Mental Health Team VCHNancy Cho VCH Practice Leader, PhysiotherapyProfessional Practice VCH Clinical Heather PavilionNina Romanow Strathcona Mental Health Team VCHPaddy Assenheimer Leader, Transformation, Change and ITransformation, VCH VCH 601 West BroadwayPamela Lau Health Records Clerk Health Records VCH Clerical Lions Gate HospitalRebecca Grey Anesthesia Equipment and Resource COR VCH Clinical VGHRian Dodds Manager, Maintenance Facilities Management VCH Operational VGHRob Behrouzian IT Audit Manager Corporate Services VCH Operational 601 West BroadwaySarabjit Bhangoo PA - VRPT Vancouver Regional Pediatric VCH Clinical Pacific Spirit Community Health Sarah Harris Accountant VCH Finance VCH 590 West 8th AvenueSian Hoe Manager, BC Operational Stress Injury Clinic VCH Operational BC Operational Stress Injury Clinic Susan Oliveira Radiographic Technologist Medical Imaging, Lions Gate VCH Lions Gate HospitalSusan Anderson Registered Nurse CCU, VGH Cardiac VCH Clinical VGHTina Oye RN CCU, VGH Cardiac VCH VGHZameena Rajani LPN Acute Medecine VCH Clinical VGH
Strategy Energy Management Plan Page 80

VCH Strategic Energy Management Plan
2.5 VCH – EMA – Year 6
VCHA S6_EMA Action Plan 12_5_14.pdf
Strategy Energy Management Plan Page 81

VCH Strategic Energy Management Plan
Strategy Energy Management Plan Page 82

VCH Strategic Energy Management Plan
Strategy Energy Management Plan Page 83

VCH Strategic Energy Management Plan
Strategy Energy Management Plan Page 84

VCH Strategic Energy Management Plan
Strategy Energy Management Plan Page 85

VCH Strategic Energy Management Plan
Strategy Energy Management Plan Page 86

VCH Strategic Energy Management Plan
Strategy Energy Management Plan Page 87

VCH Strategic Energy Management Plan
2.4 List of Green + Leaders Energy Volunteers – VCH
2.5 VCH – EMA – Year 6
VCHA S6_EMA Action Plan 12_5_14.pdf
Strategy Energy Management Plan Page 88

VCH Strategic Energy Management Plan
2.6 VCH – Imaging Equipment Inventory by Site The following VCH Imaging Equipment inventory includes all current imaging equipment at VCH sites including CT Scanners, MRIs, Fluoroscopy, Radiography, Ultrasound, and Angiography units.
Vancouver General Hospital Site- Vancouver
Strategy Energy Management Plan Page 89

VCH Strategic Energy Management Plan
UBC Hospital - Vancouver
Richmond General Hospital - Richmond
A new 1.5T Siemens MRI unit was installed in 2009 as well as a 128 Slice CT Scanner.
Strategy Energy Management Plan Page 90

VCH Strategic Energy Management Plan
Lions Gate Hospital – North Vancouver
Powell River Hospital/Evergreen/Willingdon Creek Village – Powell River
A new CT Scanner was installed in 2010 for a limited number of cases (~3,000 exams per year).
Strategy Energy Management Plan Page 91

VCH Strategic Energy Management Plan
St Mary’s Hospital (Sechelt general Hospital) - Sechelt
Squamish General Hospital - Squamish
Whistler Health Care Centre- Whistler
A new CT Scanner was installed at WHCC in late November 2009 (Maximum 3,000 scans per year)
Strategy Energy Management Plan Page 92

VCH Strategic Energy Management Plan
2.7 Chillers Inventory by Site
G.F STRONG REHABILITATION CENTRE - CHILLERS INVENTORY
VCH GFSNEW, Basement, Room 038, Mechanical Chiller Carrier 30HXC126R-1-BA 0705Q04814 2004
LIONS GATE HOSPITAL - CHILLERS INVENTORY
VCH LGHNE, 3rd Floor, Room 3-P-1, Mechanical
Centrifugal Chiller Trane 400 Ton CVHA038R00 R123 N99K08271M677 1979
VCH LGHEHS, 4th Floor, Room 4.R.1, Mechanical
Rotary Liquid Chiller Trane 125 Ton RTAA125AY R22 U99L03491 1970
VCH LGHNE, 3rd Floor, Room 3.R.1, Mechanical
Rotary Liquid Chiller Trane 200 Ton RTAC200 R134A U01A00057 2002
VCH LGHNE, 3rd Floor, Room 3-P-1, Mechanical
Rotary Liquid Chiller Trane 200 Ton RTAC200 R134A U07A01297 2002
RICHMOND HOSPITAL - CHILLERS INVENTORY
VCH RH North Tower, RoofRotary Liquid Chiller Trane 110 Ton RTAA1105XHO1A3DOPD R22 U97A09432 1992
VCH RH Minoru, GroundRotary Liquid Chiller Trane 180 Ton
RTHA180HCUONDUC3CLF2LF R22 1992
VCH RHWHC, 4th Floor - Mechanical, Room 4020, Boiler / Furnace
Rotary Screw Chiller York 126 Ton YSBABASO-CFC R22 SGEM-087730 1997
VCH RHSouth Tower, 4th Floor, Room 4510, Mechanical Chiller York 150 Ton YS BA BA SO CFA R22 SFAM923095 1992
VCH RH North Tower, Roof Chiller Trane 30 Ton CGAG30GAGA1GYCPR R22 J93080915 1992
VCH RHSouth Tower, 4th Floor, Room 4510, Mechanical Chiller York 250 Ton YVRDVDTO-58CS R134A SATM-789100 2008
MINORU RESIDENCE (RICHMOND) - CHILLERS INVENTORY
VCH MRMinoru Residence Roof Above Electrical room Chiller Trane 20 Ton RAUCC205BG030DF R22 J92L83921 1992
UBC HOSPITAL - CHILLERS INVENTORY
VCH UBCHDET, Ground Floor, Room G970, Mechanical
Rotary Liquid Chiller Trane 185 Ton RTAA185 R22 UDOF09851 2000
VCH UBCHKOE, Penthouse, Room P111, Mechanical
Rotary Liquid Chiller Trane 250 Ton
RTAC2505ULONVAFNNINY200NBAONIAOAFOE R134A U06D06973 2006
VCH UBCHKOE, Penthouse, Room P111, Mechanical
Centrifugal Chiller Trane 300 Ton CVHA038E R123 L78L18185 1978
VCH UBCHKOE, Penthouse, Room P111, Mechanical
Centrifugal Chiller Trane 300 Ton CVHA032 R123 L78L18103 1978
VGH CAMPUS - CHILLERS INVENTORY
VCH VGHJack Bell Research, 1st Floor, Room 118, Mechanical
Absorption Chiller Trane 125 Ton ABSC-01B N/A L83L15668 1985
VCH VGHJP North, Basement, Room B12, Mechanical [FM&O Stock Room]
Absorption Chiller Trane 394 Ton ABSC-03J N/A L83J14641 1982
VCH VGHJP South Tower,3rd Floor - Grid Location E10
Absorption Chiller Trane 1225 Ton ABSC-12A N/A L92A00726 1992
VCH VGHJP South Tower,3rd Floor - Grid Location E11
Absorption Chiller Trane 1225 Ton ABSC-12A N/A L92A01095 1992
VCH VGHJack Bell Research, Roof, Room 602, Mechanical
Centrifugal Chiller Trane 280 Ton CVHE-028J Centravac R123 L90A0041 1991
VCH VGHJP North, Basement, Room B12, Mechanical [FM&O Stock Room]
Centrifugal Chiller Trane 396 Ton CVHA-038H R123 L80E14334 1982
VCH VGHJPS, 3rd Floor, Room 3770, Mechanical
Centrifugal Chiller Trane 1280 Ton CVHF-128 R123 L02A01564 1991
VCH VGHECC, Basement, Room 001, Mechanical Modular Chiller Trane / Multistack 100 Ton MS 50Z6A2W-V R22 JD-12-12, JD-12- 2005
VCH VGHEye Care Centre, Basement, Room 095A, Mechanical
Reciprocal Chiller McQuay 30 Ton WHR030C1X 5YE0189600
VCH VGH Heather Pavilion EastReciprocal Chiller Trane 100 Ton CGACD-101 J92L65207 1992
VCH VGH JPS Ground FloorCentrifugal Chiller Trane 1800 Ton CVHF 1720 R123 5/1/2009
Serial # Installation DateOrganization Site Location Equipment Manufacturer Size Model Refrigerant
Strategy Energy Management Plan Page 93

VCH Strategic Energy Management Plan
2.8 VCH Cooling Towers Inventory by Site
VGH CAMPUS - COOLING TOWERS INVENTORY
VCH VGHJP North Roof (adjacent to helicopter pad)
2 cell crossflow Cooling Tower Marley NC8309GC
828803-A2-NC8309CG-08 2009
VCH VGH ECC, RoofTower, Cooling - 007-TOWER-1 Baltimore Air Coil Air Coil 81-9249
VCH VGH JB, Roof, Room 605, Mechanical Cooling Tower CT-1 Baltimore Air Coil Air Coil 83-0067
VCH VGH JPN, Roof - Grid Location B2 Cooling Tower CT-1 Baltimore Air Coil Air Coil 80-8415
VCH VGH JPS, Roof - Grid Location E9 Cooling Tower, CT-1 Baltimore Air Coil Air Coil East 91800379
VCH VGH JPS, Roof - Grid Location E9 Cooling Tower, CT-2 Baltimore Air Coil Air Coil West 91800378
VCH VGH JPN, Roof Cooling Tower, CT-3 Baltimore Air Coil C0102520-01 VT-1-830-SNX
VCH VGH JPN, Roof - Grid Location D2 Cooling Tower CT-2 Baltimore Air Coil Air Coil 83-0095
UBC HOSPITAL - COOLING TOWERS INVENTORY
VCH UBCHKOE, Penthouse, Room P111, Mechanical Cooling Tower # 1 Baltimore Air Coil
BALTIMORE AIRCOIL 78-6651
VCH UBCHKOE, Penthouse, Room P111, Mechanical Cooling Tower # 2 Baltimore Air Coil
BALTIMORE AIRCOIL 78-6650
G.F. STRONG REHABILITATION CENTRE - COOLING TOWERS INVENTORY
VCH GFS GF Strong New Building Cooling Tower Evapco ICT-4-59 2004
LIONS GATE HOSPITAL - COOLING TOWERS INVENTORY
VCH LGH NE, 3rd Floor, Room 3-P-1, Mechanical Cooling Tower (CT-1) Baltimore Air Coil VST-315D 77-6197 1977
RICHMOND HOSPITAL - COOLING TOWERS INVENTORY
VCH RHWHC, 4th Floor - Mechanical, Room 4020A, Mechanical Cooling Tower, #1 120T Baltimore Aircoil VTO-075-KC 96800156 1997
VCH RH South Tower, Roof Above Maternity Cooling Tower, 400 Ton Baltimore Aircoil PT2-0709A-2J2/Q U082562401 2008
MINORU RESIDENCE (RICHMOND) - COOLING TOWERS INVENTORY
VCH MRMinoru Residence Roof Above Electrical Room Cooling Tower, 180 Ton Baltimore Aircoil VTO-131-MMCR 92800287 1992
Manufacturer Model Serial # Installation DateOrganization Site Location Description
Page 82

VCH Strategic Energy Management Plan
2.9 Lions Gate Hospital – Energy Equipment Inventory Lions Gate Hospital - Equipment Inventory
Equipment Type Asset Description Location Manufacturer Serial Number
Cooling Tower Cooling Tower (CT-1) 3-P-1, Mechanical, 3rd Floor, NEBALTIMORE AIRCOIL OF CANADA 77-6197
Chiller Chiller, Air Cooled Screw NE, 3rd Floor, Room 3.R.1, Mechanical TRANE U01A00057Chiller Chiller, Air-Cooled Screw EHS, 4th Floor, Room 4.R.1, Mechanical TRANE U99L03491Chiller Chiller, Air-Cooled Screw 05 215 Ton (CH05) 3-P-1, Mechanical, 3rd Floor, NE TRANE U07A01297Chiller Chiller, Centrifugal 01 400 Ton (CH01) 3-P-1, Mechanical, 3rd Floor, NE TRANE N99K08271M677L07982Boiler Boiler 1- Water Tube 0-40-18, Boiler / Furnace, Basement, NE CLEAVER BROOKS WS276RBoiler Boiler 2 - Water Tube 0-40-18, Boiler / Furnace, Basement, NE CLEAVER BROOKS WS2763Boiler Boiler 3 0-40-18, Boiler / Furnace, Basement, NEAir Handling Unit AHU 13A Lions Gate Hospital Acute TowerAir Handling Unit AHU 13B Lions Gate Hospital Acute TowerAir Handling Unit AHU 15 (Rooftop) Lions Gate Hospital Acute TowerAir Handling Unit AHU 16 (Rooftop) Lions Gate Hospital Acute TowerAir Handling Unit Air Handling Unit (AHU-1) AT, 5th Floor, Room 5.R.1, VacantAir Handling Unit Air Handling Unit (AHU-102 RF) AT, 5th Floor, Room 5.R.1, VacantAir Handling Unit Air Handling Unit (AHU-102 SFVFD) AT, 5th Floor, Room 5.R.1, Vacant ME-21587-02Air Handling Unit Air Handling Unit (M3-1) NE, 4th Floor, Room 4.R.4, Mechanical PACE 3263
Air Handling UnitAir Handling Unit 4 Nutrition Serv, Plant Maintenance (AHU1) Lions Gate Hospital Acute Tower
Air Handling Unit AT, Air Handling Unit Maternity (MZ-1) Lions Gate Hospital Acute Tower PACE 3263Air Handling Unit AT, Air Handling Unit - Old OR (AHU-OLD O.R.) AT, 4th Floor, Room 458.8, MechanicalAir Handling Unit EHN, Air System 01 Evergreen House NorthAir Handling Unit EHN, Air System 02 - Boardroom (Rms. B36 & B37) Evergreen House NorthAir Handling Unit EHN, Air System 03 - Solarium (Smoke Room) Evergreen House North
Air Handling UnitEHS, Air Handling System 01 (AHU01) - General Supply B25, Mechanical, Basement, EHS
Air Handling Unit EHS, Air Handling System 2 (AHU02) - Biomed B25, Mechanical, Basement, EHSAir Handling Unit EHS, Air System 01 - General Supply B25, Mechanical, Basement, EHSAir Handling Unit EHS, Air System 02 - Biomed Shop B25, Mechanical, Basement, EHSAir Handling Unit EHS, Air System 03 B25, Mechanical, Basement, EHSAir Handling Unit EHS, Air System 04 - Pharmacy Room 336 Evergreen House SouthAir Handling Unit EHS, Air System 05 - Information Services Evergreen House SouthAir Handling Unit NE, Air Handling Unit 1 (AHU01), Penthouse 1 3-P-1, Mechanical, 3rd Floor, NE WESTINGHOUSEAir Handling Unit NE, Air Handling Unit 12 (AHU12), Emergency Lions Gate Hospital Northern ExpansionAir Handling Unit NE, Air Handling Unit 2 (AHU02), Penthouse 1 3-P-1, Mechanical, 3rd Floor, NEAir Handling Unit NE, Air Handling Unit 3 (AHU03), Penthouse 1 3-P-1, Mechanical, 3rd Floor, NEAir Handling Unit NE, Air Handling Unit 4 (AHU04), Penthouse 1 3-P-1, Mechanical, 3rd Floor, NEAir Handling Unit NE, Air Handling Unit 5 (AHU05), Penthouse 1 3-P-1, Mechanical, 3rd Floor, NEAir Handling Unit NE, Air Handling Unit 6 (AHU06), Penthouse 2 3-P-2, Mechanical, 3rd Floor, NEAir Handling Unit NE, Air Handling Unit 7 (AHU07), Penthouse 2 3-P-2, Mechanical, 3rd Floor, NEAir Handling Unit NE, Air Handling Unit 8 (AHU08), Penthouse 3 3-P-3, Mechanical, 3rd Floor, NEAir Handling Unit NE, Air Handling Unit 9 (AHU09), Penthouse 3 3-P-3, Mechanical, 3rd Floor, NEAir Handling Unit NE, Air System 10 Lions Gate Hospital Northern ExpansionAir Handling Unit NE, Air System 11- Satellite Pharmacy Lions Gate Hospital Northern ExpansionAir Handling Unit Rooftop Unit AHU-1 Lions Gate Hospital Northern Expansion TRANE CANADA K06C28440Air Conditioning Unit A/C unit on roof North of OR's Lions Gate Hospital Acute Tower
Air Conditioning UnitAir Conditioner 01 Physio Therapy, Plant Maintenance (AC01) NE, 2nd Floor, Room 2.R.2, Mechanical CARRIER CANADA LTD OT037
Air Conditioning Unit Air Conditioner 01 SPD, Plant Maintenance (AC01) 1-38-9, Sterile, 1st Floor, NE CARRIER CANADA LTD 4804X02705Air Conditioning Unit Air Conditioner 02 SPD, Plant Maintenance (AC02) 1-38-3B, Mechanical, 1st Floor, NE CARRIER CANADA LTD 4804X02703Air Conditioning Unit Air Conditioner 04 SPD, Plant Maintenance (AC04) 1-38-2, Equip. Cleaning, 1st Floor, NE EDPAC 33710-001AAir Conditioning Unit Air Conditioner, DX Cooled, split system, indoor unit Evergreen House South EMJS247996
Page 83

VCH Strategic Energy Management Plan

VCH Strategic Energy Management Plan