
Strategic and Performance Management Updates Quarter 3 2015 …
63
1 Strategic and Performance Management Updates Quarter 3 2015 16 (1st October 2015 to 31 st December 2015)
Transcript of Strategic and Performance Management Updates Quarter 3 2015 …
1
Strategic and Performance
Management Updates Quarter 3 2015 16
(1st October 2015 to 31st December 2015)

2
Introduction
Annually the Council produces a Corporate Plan which sets out its future priorities and
planned activities and actions for achieving its purpose.
The image below shows the Council’s stated Purpose and the five themes which underpin
the Purpose:
The Cabinet reviews progress against the Corporate Plan, on a quarterly basis. This acts as
the key corporate performance monitoring process for the Council.
This document combines both informative data about the Rushmoor area and some more
specific data about the Council as a whole and about individual services. It is provided to
give an enhanced overview to inform Cabinet’s priorities and its monitoring of performance.
This data set is the subject of regular presentations by members of the Council’s Directors’
Management Board to the Cabinet. In Quarter 1 Cabinet is presented with an analysis of the
entire set of data in the document on which it can base a review of Council policy and
strategic thinking. Following this, each quarter, a reduced set of data forms a shorter
performance management reporting set.
Whilst considerable thought has been given to the chosen set of data included in this
document, it is seen as a starting point and it is intended to evolve the items that are
included to best meet the needs of managing the Council.

3
Contents of the 2015 Corporate Plan Page
Section One: Sustainability of place 1. Summary 42. Demographics of our population 53. Deprivation data 54. Crime data 55. Education and skills data 66. Economy data 147. Heath data 19
Section Two: – Corporate sustainability – Rushmoor Fit for the Future
1. Summary 202. Budget and savings process overview 213. The 8 Point Plan 224. Organisational Development 33
Section Three: Key initiatives and service measures
1. Summary 352. People and Communities – Supporting our and communities and meeting
local needs 36
3. Prosperity ‐ Sustaining and developing our local economy 434. Place ‐ Protecting and developing a safe, clean and sustainable
environment 47
5. Leadership ‐ Providing leadership to make Rushmoor the place where our communities want to live and work
53
6. Good Value Services ‐ Ensuring quality services that represent good value for money
57

4
Section One: Sustainability of place
1. Summary
Crime
During Quarter 3 total crime in Rushmoor decreased (‐24%, n342) compared to the
same time last year.
Reports of anti‐social behaviour reduced by 10% (n60).
Education and skills
GCSE results by school location put Rushmoor in the bottom 5% nationally, and only
one (25%) of Rushmoor secondary schools has results above the national average.
As of the 1st of January 2016, eight out of the 34 schools in Rushmoor were graded
Requires Improvement by Ofsted (Cove Secondary, Fernhill Secondary, Connaught
Secondary, Cherrywood Primary, Fernhill Primary, Pinewood Infants, Southwood
Infants and Manor Junior). No schools in Rushmoor were graded Inadequate and
33.3% of primary schools in Rushmoor were graded Outstanding.
Economy
In December 2015 there were 559 Rushmoor residents claiming Job Seeker
Allowance (JSA), this represents 0.9% of Rushmoor’s working age population (16‐64),
this is a slight decrease from 579 claimants at the end of last quarter.
There has been a drop of 275 claims in the past year to 7,267; this can be attributed
to the introduction of our CTS scheme and an improvement in those of working age
finding employment.
According to measures from 2015, there is a difference of £83 in the weekly wages
of those who work in Rushmoor being paid more than those who live in Rushmoor.
The gap has decreased in the last 12 months. Rushmoor residents take home less
than the average for Hampshire, the South East and Great Britain.

5
2. Demographics of our population – no new data
3. Deprivation data – Links with People and Communities Priority – no new data
4. Crime
Community Safety Partnership data
The Rushmoor Community Safety Partnership monitors crime rates in the Borough (please also see Community Safety Partnership under Leadership Priority on page 53).
Yearly 3rd Quarter comparison – 2013/14 v 2014/15 with % difference and 2014/15 v 2015/16 with % difference
2013/14 2014/15 2015/16
2014/15 diff on 2013/14
% diff 2015/16 diff on 2014/15
%diff
1a Homicide 0 0 0 0 0% 0 0%
1b Violence with Injury 141 176 116 34 25% ‐60 ‐34%
1c Violence without Injury
175 203 205 28 16% 2 1%
2a Rape 9 13 9 4 44% ‐4 ‐31%
2b Other Sexual Offences 13 27 22 14 108% ‐5 ‐19%
3a Robbery of Business Property
4 0 0 ‐4 ‐400% 0 0%
3b Robbery of Personal Property
6 11 3 5 83% ‐8 ‐73%
4a1 Burglary in a dwelling
58 44 18 ‐14 ‐24% ‐26 ‐59%
4a2 Burglary in a building other than a dwelling
87 58 33 ‐29 ‐33% ‐25 ‐43%
4b Vehicle Offences 109 90 79 ‐19 ‐17% ‐11 ‐12%
4c Theft from the Person 22 17 11 ‐5 ‐23% ‐6 ‐35%
4d Bicycle Theft 40 28 22 ‐12 ‐30% ‐6 ‐21%
4e Shoplifting 120 178 106 58 48% ‐72 ‐40%
4f All Other Theft Offences
142 153 126 11 8% ‐27 ‐18%
5a Criminal Damage 204 226 182 22 11% ‐44 ‐19%
5b Arson 3 3 2 0 0 ‐1 ‐33%
6a Trafficking of Drugs 8 7 15 1 ‐13% 8 114%
6b Possession of Drugs 90 65 25 25 ‐28% ‐40 ‐62%
7 Possession of Weapons Offences
9 5 7 4 ‐44% 2 40%
8 Public Order Offences 60 107 91 47 78% ‐16 ‐15%
9 Miscellaneous Crimes Against Society
14 26 23 12 86% ‐3 ‐12%
Total 1314 1437 1095 123 9% ‐342 ‐24%
ASB 592 594 534 2 0% ‐60 ‐10% (Source: data from Rushmoor Community Safety Team based on figures from Hampshire Police)

6
Note: Police activity can push up reporting, detection and conviction rates even if the
underlying crime rates are actually unchanged in the short term.
Crime outcomes
The following data is from data.police.uk and shows the crime outcomes in Rushmoor for 2014/15. Crime outcome data in Rushmoor appears to be similar to the outcome data for Hampshire.
Outcome for crimes in Rushmoor 2014/15 Number Rushmoor Hampshire
Investigation complete; no suspect identified 2012 40.7% 43.4%
Unable to prosecute suspect 924 18.7% 18.5%
Suspect charged 801 16.2% 14.3%
Local resolution 202 4.1% 3.8%
Offender fined 147 3.0% 1.9%
Offender given a caution 147 3.0% 3.0%
Offender given community sentence 144 2.9% 2.7%
Offender sent to prison 132 2.7% 2.5%
Offender given a drugs possession warning 83 1.7% 1.5%
Defendant found not guilty 78 1.6% 1.6%
Formal action is not in the public interest 67 1.4% 1.6%
Offender given suspended prison sentence 48 1.0% 1.2%
Offender otherwise dealt with 37 0.7% 0.5%
Offender ordered to pay compensation 35 0.7% 0.4%
Court case unable to proceed 33 0.7% 0.7%
Offender given penalty notice 30 0.6% 0.9%
Offender given conditional discharge 17 0.3% 1.2%
Suspect charged as part of another case 7 0.1% 0.4%
Offender deprived of property 4 0.1% 0.1%
Offender given absolute discharge ‐ ‐ 0.0%
Defendant sent to Crown Court ‐ ‐ 0.0%
Total 4948 100.0 100.0
(Source: data.police.uk https://data.police.uk/ )
5. Education and skills
Ofsted
Ofsted inspects and rates education institutions, into four grades:
Grade 1: Outstanding
Grade 2: Good
Grade 3: Requires Improvement
Grade 4: Inadequate
Rushmoor has 30 primary schools and 4 secondary schools. As of 1st January 2016, 33.3%
of primary schools in Rushmoor are graded Outstanding, 50% are graded Good, 16.7% (five

7
schools) are graded Requires Improvement. The five primary schools that Required
Improvement are: Cherrywood Primary, Fernhill Primary, Pinewood Infants, Southwood
Infants and Manor Junior. All the primary schools that Require Improvement are in
Farnborough. All primary schools in Aldershot are currently graded Good and above.
In regard to secondary schools of 1st January 2016 2015, Wavell secondary school was
graded Good (25%), and Connaught, Cove and Fernhill schools were graded Requires
Improvement (75%).
The following chart shows % of Rushmoor primary and secondary schools in each Ofsted
category as of 1st January 2016.
% of Rushmoor schools in each Ofsted category as of 1st January 2016
(Source: Ofsted http://www.ofsted.gov.uk/)

8
Key stage 2
In December 2015, the Key Stage results were released. The following table shows the
percentage of children at the end of year 6 achieving Level 4 (average level of attainment)
or above in reading, writing and maths, in the 18 schools with Key Stage 2 children.
% achieving Level 4 or above in reading, writing and maths Key: Improved Stayed the same Declined
Green text indicates the results are above the England average School 2012 2013 2014 2015 Cherrywood Primary 75% 76% 87% 72%
Cove Junior 73% 84% 83% 85%
Fernhill Primary 77% 68% 61% 67%
Grange Community Junior 83% 72% 82% 98%
Guillemont Junior 67% 74% 72% 92%
Manor Junior 78% 80% 65% 85%
Newport Junior 84% 80% 88% 87%
Park Primary 47% 69% 68% 63%
South Farnborough Junior 87% 79% 88% 90%
St Bernadette’s Primary 83% 69% 86% 84%
St Joseph’s Primary 90% 87% 97% 97%
St Mark’s CE Primary 86% 79% 81% 93%
St Michael’s CE Junior 77% 70% 78% 82%
St Patrick’s Primary 97% 94% 93% 77%
St Peter’s CE Junior 94% 92% 90% 97%
Talavera Junior 62% 69% 75% 68%
Tower Hill Community 86% 85% 87% 93%
Wellington Community
Primary (opened in 2013)
N/A N/A 93% 94%
Hampshire average 77% 78% 82% 83%
England average 75% 75% 79% 80% (Source: Department for Education http://www.education.gov.uk/)
Between 2014 and 2015, 61% of school results have improved and 72% of the schools have results
above the England average.
Key Stage 4 Results
School reforms
Due to school reforms in 2013‐14 the results between 2013 and 2014 and 2015 are not directly comparable. Some of the changes included in the reforms were to no longer count International GCSE (IGCSE’s) in the results, only a pupil's first attempt at a qualification is included, no qualification counts as larger than one GCSE in size (a BTEC may have previously counted as 4 GCSEs) and counting non‐GCSEs has been capped at two.

9
School results
The school 2015 Key Stage 4 (GCSE) results were released on the 21st January. Only one
school (Wavell) has results above the Hampshire and England averages, and only one school
(Cove) showed an improvement in results between 2014 and 2015.
% achieving 5+ A*‐C GCSEs including Maths and English Key: Improved Stayed the same Declined
Green text indicates the results are above the England average School 2010 2011 2012 2013 2014 2015
Connaught School 40% 42% 44% 36% 48% 29%
Cove School 50% 46% 47% 51% 38% 45%
Fernhill School 57% 48% 42% 43% 46% 40%
Wavell School 54% 60% 58% 44% 62% 61%
Hampshire
average
58.9% 60.8% 58.5% 60% 58.9% 59.7%
England average 53.5% 59% 59.4% 59.2% 53.4% 53.8% (Source: Department for Education http://www.education.gov.uk/)
The borough also contains two independent Catholic schools that cater for secondary
education. These are Farnborough Hill and Salesian College (both have sixth forms). Also,
there is Hawley Place, which is just over the Rushmoor boundary in Hart. All three schools
have excellent exam results with between 93% and 100% of pupils achieving 5+ A*‐C GCSEs
(or equivalent) including English and maths in 2015.
GCSE results by location of pupil residence
The following chart shows the proportion of pupils in Rushmoor, achieving 5 or more GCSEs
at grades A*‐ C including English and mathematics (%), compared to the other districts in
Hampshire and the average for England. At 49.5% Rushmoor has the second lowest result in
Hampshire and is in the bottom 15% of results nationally (ranks 37 out of 326 local
authorities). It should be noted that this data is by location of pupil residence and not all
children in Rushmoor attend Rushmoor secondary schools maintained by Hampshire County
Council.

10
% of pupils at the end of KS4 achieving 5+ A*‐C GCSEs (including English and mathematics)
by location of pupil residence
(Source: Department for Education https://www.gov.uk/government/statistics/revised‐gcse‐and‐equivalent‐results‐in‐england‐2014‐to‐2015 )
Note: Due to school reforms in 2013‐14 the results between 2013 and 2014 are not directly
comparable, and the GCSE results for location of schools has been used for the England
result in 2015‐16 as the result by residence was unavailable.
GCSE results by location of school
The following chart shows the proportion of pupils in Rushmoor state maintained schools
(including academies and City Technology Colleges), achieving 5 or more GCSEs at grades
A*‐ C including English and mathematics (%), compared to the other districts in Hampshire
and the average for England. Maintained schools are funded by central government via the
local authority and do not charge fees to students. Rushmoor has the lowest results in
Hampshire. At 42.7% Rushmoor has the 7th lowest results of the 326 local authority areas in
the Country (in the bottom 5%).

11
% of pupils at the end of KS4 achieving 5+ A*‐C GCSEs (including English and mathematics)
by location of school
(Source: Department for Education https://www.gov.uk/government/statistics/revised‐gcse‐and‐equivalent‐results‐in‐england‐2014‐to‐2015)
Note: Due to school reforms in 2013‐14 the results between 2013 and 2014 are not directly
comparable
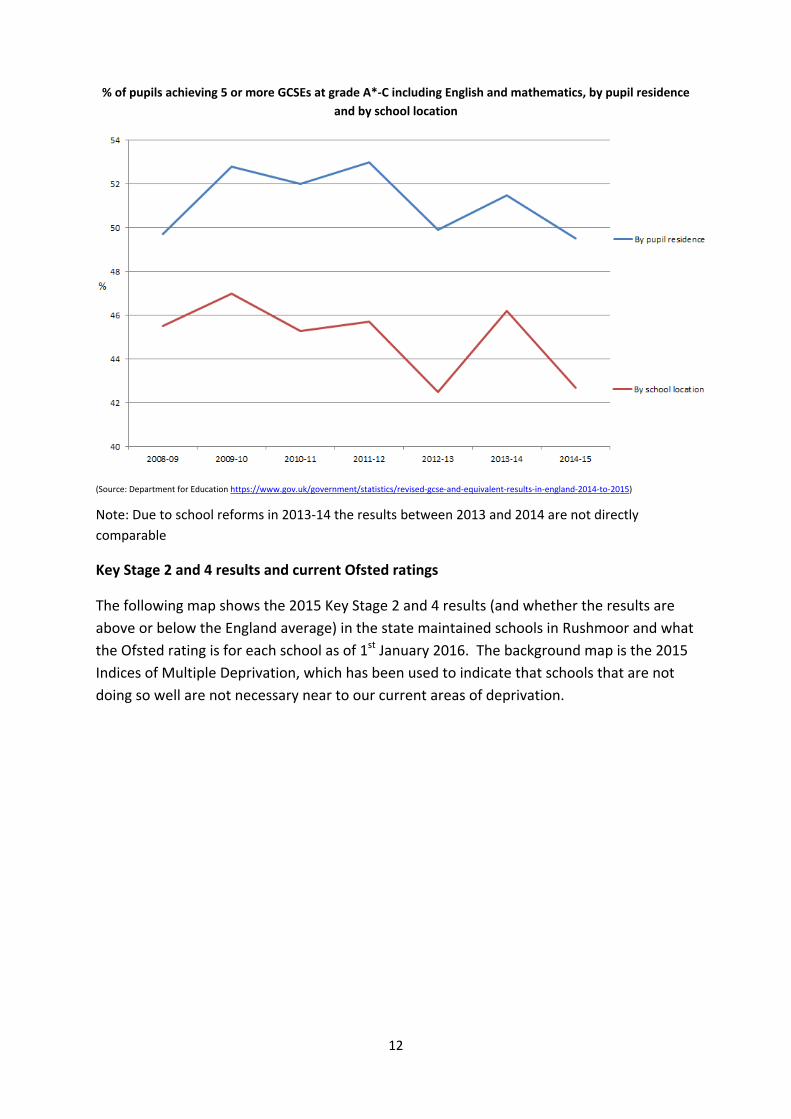
The following chart shows the difference in the results for Rushmoor, by pupil residence and
by school location. The difference is because not all school children who live in Rushmoor
attend state maintained schools in the borough and some pupils attending state maintained
schools will be from outside Rushmoor.
12
% of pupils achieving 5 or more GCSEs at grade A*‐C including English and mathematics, by pupil residence
and by school location
(Source: Department for Education https://www.gov.uk/government/statistics/revised‐gcse‐and‐equivalent‐results‐in‐england‐2014‐to‐2015)
Note: Due to school reforms in 2013‐14 the results between 2013 and 2014 are not directly
comparable
Key Stage 2 and 4 results and current Ofsted ratings
The following map shows the 2015 Key Stage 2 and 4 results (and whether the results are
above or below the England average) in the state maintained schools in Rushmoor and what
the Ofsted rating is for each school as of 1st January 2016. The background map is the 2015
Indices of Multiple Deprivation, which has been used to indicate that schools that are not
doing so well are not necessary near to our current areas of deprivation.

13
2015 results in Rushmoor schools mapped with Ofsted results as of January 2016

14
6. Economy
Universal Credit
Universal Credit is a new benefit for people on a low income or out of work, who are below
pension age. The government is phasing it in nationally between February 2015 and 2019.
This will affect Rushmoor residents from February 2016.
It will replace most means‐tested benefits and tax credits and will include payments for
children and housing costs. We will have to evolve our reporting of benefit and Jobseekers
Allowance data to include Universal Credit.
Job Seeker Allowance analysis
In December 2015 there were 559 Rushmoor residents claiming Job Seeker Allowance (JSA),
this represents 0.9% of Rushmoor’s working age population (16‐64). The following chart
sets out the claimants as a percentage of the working age population. This was the same as
the South East (0.9%), and below the rate for Great Britain (1.5%), but higher than the rate
for Hampshire (0.7%).
All people claiming JSA
Quarter 1: June 2015 Rushmoor: 0.9% Hampshire: 0.7% South East: 1.0% Great Britain 1.7% Quarter 2: Sept 2015 Rushmoor: 0.9% Hampshire: 0.7% South East: 1.0% Great Britain 1.6% Quarter 3: Dec 2015 Rushmoor: 0.9% Hampshire: 0.7% South East: 0.9% Great Britain 1.5%
(Source: Office for National Statistics http://www.nomisweb.co.uk/reports/lmp/la/2038431789/subreports/jsa_time_series/report.aspx?)
15
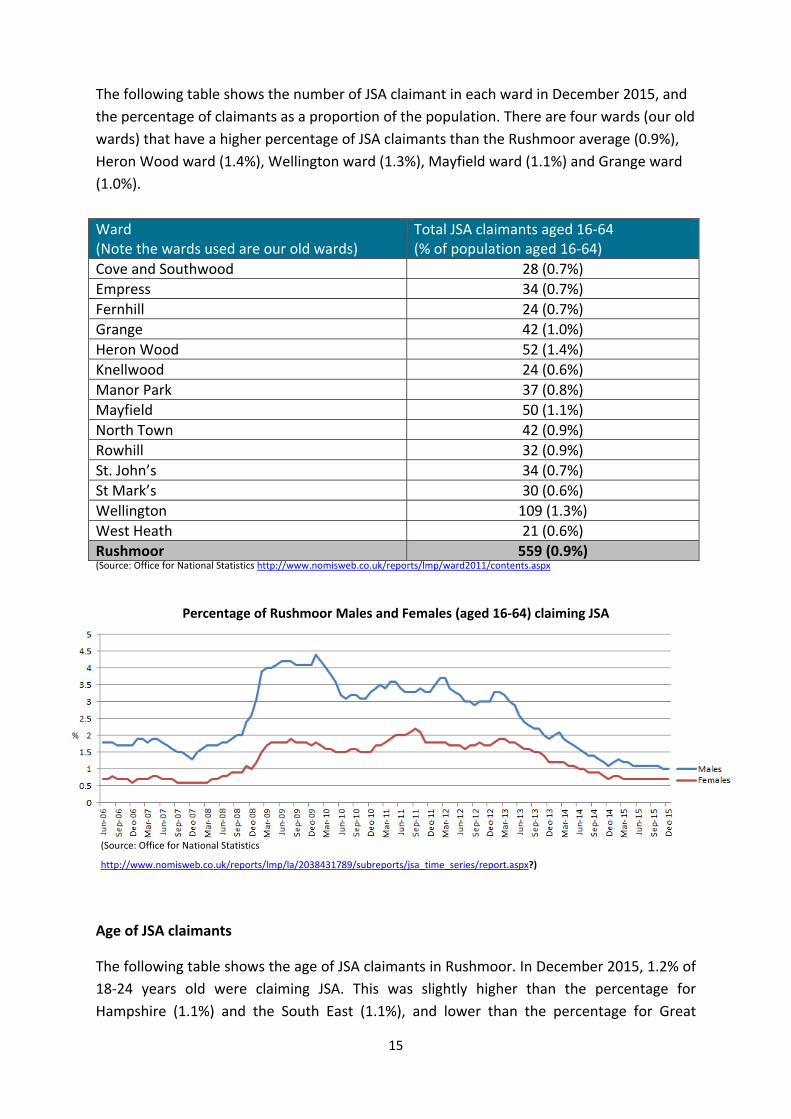
The following table shows the number of JSA claimant in each ward in December 2015, and
the percentage of claimants as a proportion of the population. There are four wards (our old
wards) that have a higher percentage of JSA claimants than the Rushmoor average (0.9%),
Heron Wood ward (1.4%), Wellington ward (1.3%), Mayfield ward (1.1%) and Grange ward
(1.0%).
Ward (Note the wards used are our old wards)
Total JSA claimants aged 16‐64 (% of population aged 16‐64)
Cove and Southwood 28 (0.7%)
Empress 34 (0.7%)
Fernhill 24 (0.7%)
Grange 42 (1.0%)
Heron Wood 52 (1.4%)
Knellwood 24 (0.6%)
Manor Park 37 (0.8%)
Mayfield 50 (1.1%)
North Town 42 (0.9%)
Rowhill 32 (0.9%)
St. John’s 34 (0.7%)
St Mark’s 30 (0.6%)
Wellington 109 (1.3%)
West Heath 21 (0.6%)
Rushmoor 559 (0.9%) (Source: Office for National Statistics http://www.nomisweb.co.uk/reports/lmp/ward2011/contents.aspx
Percentage of Rushmoor Males and Females (aged 16‐64) claiming JSA
(Source: Office for National Statistics
http://www.nomisweb.co.uk/reports/lmp/la/2038431789/subreports/jsa_time_series/report.aspx?)
Age of JSA claimants
The following table shows the age of JSA claimants in Rushmoor. In December 2015, 1.2% of
18‐24 years old were claiming JSA. This was slightly higher than the percentage for
Hampshire (1.1%) and the South East (1.1%), and lower than the percentage for Great

16
Britain as a whole (1.8%). Rushmoor has a slightly higher percentage (1.0%) of 50‐64 year
olds claiming JSA than Hampshire (0.6%), and the South East (0.8%).
JSA by age
September 2015
Number in
Rushmoor
Claimants as a percentage of total age group in area
Rushmoor Hampshire South East Great Britain
Aged 18‐24 105 1.2% 1.1% 1.1% 1.8%
Aged 25‐49 290 0.8% 0.7% 1.0% 1.6%
Aged 50‐64 165 1.0% 0.6% 0.9% 1.3% (Source: Office for National Statistics NOMIS https://www.nomisweb.co.uk/reports/lmp/la/2038431789/report.aspx?town=rushmoor)
Benefit caseload
Dec 2015 – 7,267
Dec 2014 – 7,542
Dec 2013 – 7,727
Dec 2012 – 7,779
There has been a drop of 275 claims in the past year; this can be attributed to the
introduction of our CTS scheme and an improvement in those of working age finding
employment. The number of residents claiming CTS only has decreased by 10% (97) from
Dec 2014 – Dec 2015. In contrast, the number of people claiming Housing Benefit only has
increased 0.9% (21) during this time.
Benefit Caseload

17
National Figures: Housing Benefit Recipients November 2008 – Aug 2015
Wage levels
In 2015, Rushmoor residents on average earned £518 a week (full time median gross weekly
pay). This was £57 less than the average for residents in Hampshire and the South East, and
£12 less than the average for Great Britain residents. The average weekly wage if you
worked in Rushmoor was £601, meaning a difference of £83. The graph below shows
weekly wages for Rushmoor compared to Rushmoor’s surrounding local authorities.
Rushmoor has the lowest average home wage and is the only area to have its work wages
higher than home wages.
It is worth noting that Rushmoor currently has the 13th highest average work wages in the
South East, in 2014 Rushmoor had the fifth highest average work wages in the South East.

18
Average weekly earnings for those who live in and work in Rushmoor compared to surrounding local
authorities (in order of highest work wages to lowest work wages)
(Source: Office for National Statistics NOMIS https://www.nomisweb.co.uk/reports/lmp/la/2038431789/report.aspx?town=rushmoor)
In Hampshire, Rushmoor residents earn £57 less per week than the average for Hampshire
residents. In comparisons to the other districts in Hampshire, Rushmoor has the lowest
average home wage and the second highest average work wage (after Hart).
Average weekly earnings for those who live in and work in Hampshire districts (in order of highest work
wages to lowest work wages)
(Source: Office for National Statistics NOMIS https://www.nomisweb.co.uk/reports/lmp/la/2038431789/report.aspx?town=rushmoor)

19
Time Series
The following chart shows the median weekly wages for those who work in and live in
Rushmoor, Hampshire, the South East and Great Britain. Between 2014 and 2015 both the
average weekly wage for those who work in and live in Rushmoor dropped. The drop in
average weekly wage for those who work in Rushmoor may be due to female wages, which
dropped from £486 a week in 2014 to £463 in 2015. The male average weekly wages for
those who work in Rushmoor rose from £699 in 2014 to £707 in 2015. The drop in average
weekly wage for those who live in Rushmoor may be due to male and female wages, male
resident wages dropped from £590 in 2014 to £539 in 2015, and female resident wages
dropped from £504 in 2014 to £471 in 2015.
The gap between the average weekly wages for those who work in and those who live in
Rushmoor has also dropped from £107 in 2014 to £83 in 2015.
Average weekly earnings for those who live in and work in Rushmoor, Hampshire, the South East
and Great Britain over the past 10 years
(Source: Office for National Statistics NOMIS
https://www.nomisweb.co.uk/reports/lmp/la/2038431789/report.aspx?town=rushmoor)
7. Health – no new data

20
Section Two: – Corporate sustainability –
Rushmoor Fit for the Future
NOTE: This section has been changed from Corporate Health Measures to include the 8 Point Plan
and Organisational Development to reflect the importance of these two initiatives in delivering
future sustainability for the organisation.
1. Summary
• Overview of Budget
The budget summary has been updated with the results of the latest monitoring exercise
carried out during February/March 2016. The position shows an improvement in balances of
around £128,000 compared to the current approved budget. The estimated general fund
revenue balance at the year‐end is £1.606m, falling within the approved range of balances
of £1m ‐ £2m.
• 8 Point Plan
Below is the summary of performance this quarter for the 8 Point Plan. Green indicates that the project is on course, amber flags up that achieving the action or indicator is in question and red shows that we have not been able to achieve elements of our target.
Summary Green Amber Red
This quarter total (%) 46.2% 53.8% 0%
Previous quarter total (%) 68.75% 31.25% 0%
• Organisational Development
The status of Organisational Development is amber again this quarter:
Work on the majority of the OD strategy actions is progressing.
Resourcing issues are continuing to impact in some areas and for the next quarter we will
continue to focus particularly on developing the personnel function, following through the
appraisals process and working on organisational skills.
Three new action learning sets have commenced led by internal facilitators

21
1. Budget and savings process overview
Current Approved Budget
2015/16
Latest Monitoring position
2015/16
£000 £000
Net Service Expenditure 13,240 13,108
Reductions in service costs/income
generation
(387)
Vacancy Monitoring (350)
Interest Receivable (849) (874)
Contributions to/(from)Reserves 4,748 4,835
Collection Fund (Surplus)/Deficit (4,504) (4,504)
Central Government Funding (6,612) (6,707)
Contribution to/(from) balances (160) (32)
Council Tax requirement 5,476 5,476
£M £M
Projected Year‐end balance 1.478 1.606
Comment:
The budget summary above has been updated with the results of the latest monitoring
exercise carried out during February/March 2016. The position shows an improvement in
balances of around £128,000 compared to the current approved budget (Revised budget
approved at Council 25th February 2016 plus any subsequently approved supplementary
estimates). The outstanding savings requirement of £387,000 included in the revised
budget, has been more than achieved largely through significant additional savings in salary
costs, alongside a small increase in interest receivable and additional ‘New Burdens’ grant
from central government.
Within the net cost of services, budget holders have reported major variations in income
streams , both favourable and unfavourable, including upturn in income at the Princes Hall
and downturn in income from parking.
The estimated general fund revenue balance at the year‐end is £1.606m, falling within the
approved range of balances of £1m ‐ £2m. While this is a positive estimate for the close of
2015/16, the next few years ahead are set to be some of the most challenging yet (following
cuts to local authority funding and uncertainty over business rates retention and grants such
as New Homes Bonus). It is therefore key that the Council continues to drive forward its
sustainability plans and reduces its net revenue costs.
The closure of accounts process for 2015/16 is now underway and the provisional outturn
position will be reported to Members in May 2016.

22
2. The 8 Point Plan
The 8 Point Plan is a strategy to ensure financial and service sustainability, by reducing net revenue spending over the medium to long term.
8 Point Plan Overview
Details of projects under each point of the 8 Point Plan
Point 1 ‐ The Workbook
The Workbook – Scope To use the Workbook to identify areas to focus most effort in
terms of: 1. Increasing income generation 2. Service efficiency (Point 2) 3. Opportunities to cease work 4. Short/ long term plans
Timescales: Workbook update to:
Budget Strategy Group 18 January, 2016
Meeting with CORDA 15 January, 2016 Targets – an indication of the potential savings or benefits achievable: Potential savings:

23
This project is seen as a tool to inform and enable reduction in net revenue spend and does not have a specified target
Other benefits:
This work will provide data for Points 2 (Transformation & Efficiency) and 3 (Income Generation) and this will need to be managed accordingly.
Help identify lower priority work that may be stopped.
Useful for planning and managing services (including appraisals) and at corporate level
Enable us to assess if our work and which areas in particular, are making a difference over time
Will be able to identify the work underpinning priorities like recycling, homelessness and educational attainment to help ensure we are directing the right level of resource (not too much or too little) to areas of importance
Assist in considering new bids for additional resources to deliver against the aims
Help identify if our aims are fit for purpose
Will be able to see and make better collective sense of our whole workbook Risks: Potential difficulties:
Acceptable resourcing of challenge in developing proposals
Availability of public and customer feedback to make full sense of the measures
Linking budget information to the workbook items to make sense of the workbook savings
Workbook becoming out of date – if want to continue to use it may need to consider how we keep it up to date. May miss opportunity to embed Workbook in business planning and budget building process
Lack of “target” for total savings for stop work tends to lead to a loss of focus in the organisation
Managing expectations at Budget Strategy Group and Informal Cabinet
Questionable nature of some of the financial information – particularly cashable and non‐cashable savings spilt and accuracy of salary allocations
Q1 Q2 Q3 Q4 Comment:
Meeting of Informal Cabinet discussed Workbook further.
Meeting of Budget Strategy Group agreed to look in more detail at the Community Service element of the Workbook, extract produced and circulated. Group asked to identify how they would like to take process forward. Next meeting 18 January, 2016.
No further work done on 20 potential stop items that were identified. Agreed approach to discuss achievement of sustainable services with HOS
Following meeting and DMB endorsement, further meeting with CORDA scheduled for 15 January, 2016.
Latest position: Work of the Budget Strategy Group

24
which has been progressing the use of the Workbook as part of the preparation of the work to be fed through to the all Member session in September 2016.
This work stream includes two projects: Systems Thinking and Channel Shift
Systems Thinking – Project scope: To improve the delivery of services and reduce costs
by embedding the systems thinking approach into services and the organisation through a blended approach incorporating:
1) Service reviews (Parking and Personnel Services especially) 2) Embedding learning in organisation (including ongoing support to managers in post
review areas) 3) Support to 8 Point Plan initiatives (eg Channel Shift) 4) Identifying material from Workbook suitable for Systems Thinking Support
Timescales: This is an ongoing programme of work.
Targets/Expected Outcomes – To provide an indication of the potential savings or benefits achievable: Some staff savings achieved and further savings to be delivered through changes in the Parking service. The future work‐plan is directly linked to supporting the Council’s managers and services in learning how to use Systems Thinking techniques to improve services. This will be expected to thereafter achieve savings as managers apply learning to remove waste and realise cashable benefits. Risks: Programme is a key enabler to deliver Point 2, and there is a need to balance longer‐term Organisational Development objectives and achieving shorter term savings with the focus being on achieving sustainable service delivery
Q1 Q2 Q3 Q4 Comment: Focus remains on supporting the delivery of further improvements in Parking and driving forward the Channel Shift and Personnel projects.
Channel Shift and Mobile Working – Scope: To provide services in a way that allow customers to interact with the Council in way
and time that suits them.
Streamline processes to meet back office operations which are essential, but should not divert resources away from delivering services to customers.
Make best use of technology to streamline end to end processes to ensure effective service delivery and more efficient use of resources
To deliver modernised services that are accessible and sustainable Phase 1 of the project will deliver
New customer contact platform
Point 2 ‐ Efficiency & Transformation

25
A range of transactional services branding and content linked to new self‐service portal
Mobile working front line staff integration – operational
Decommissioning of legacy systems
Identification of initiatives for Phase 2 development
Phase 2 – web site redesign, electronic post solution and other working being identified linked to process reviews
Timescales:
April 15 – Car Park System live
January 2016 Phase 1 package: including new technology and bulky waste system, delivered – work stopped due to unreliability of platform software “pause”
Mobile working solution for car parking, confirm connect “live” and phased roll‐out underway
Targets/Expected Outcomes – To provide an indication of the potential savings or benefits achievable:
As an indication, from £10m staff costs a 2.5% saving (circa nine posts) would net £250,000 per annum.
Immediate cashable savings will come from decommissioning existing IT systems (CRM). These are currently estimated at £30,000 per annum (achieved).
Further savings will come from resources being released in services.
Risks: None currently identified. Q1 Q2 Q3 Q4 Comment: Supplier failed to deliver reliable system,
programme board decision to stop work with existing supplier (credit note received) and investigate alternative solutions
Point 3 – Income Generation & Investment Opportunities This work stream consists of six projects:
1) Property Investment – Project scope: To consider investing in property, subject to the returns exceeding those being achieved through the Treasury Investment in Property Funds. Timescales: Asset Management Strategy completion – April 2016 Targets – an indication of the potential savings or benefits achievable: Potential savings are currently unscoped, however returns of 7‐8% have been achieved by other authorities

26
Risks:
Costs and risks of this approach will need to be assessed against the return on investment of other options (such as property funds – currently 4‐6%)
Need to consider use of appropriate Prudential Borrowing over the medium term
Impact on revenue budget of Prudential Borrowing
Failure to properly make provision for maintenance and management costs associated with responsible property management would place significant additional risk
Care will however need to be taken to ensure a diverse spread over a range of
sectors. This will minimise risks associated with a concentration on a single sector
Q1 Q2 Q3 Q4 Comment: Scoping complete and development of strategy in progress
2) Housing Initiatives – Project scope: This is an enabling project which will consider options relating to the potential creation of a SPV (Special Purpose Vehicle) which would enable the authority to purchase residential properties for rental purposes.
Timescales: Currently unscoped.
Targets/Expected Outcomes – To provide an indication of the potential savings or benefits achievable:
Risks: Transition to borrowing authority need to be managed. Financial Strategy and Treasury
Management Strategy will start to introduce this.
Lack of resources to carry out research Q1 Q2 Q3 Q4 Comment: Investigations into the potential for the
establishment of an SPV continue
3) Review of Fees and Charges – Project scope: This area of work has expanded to identify all fees and charges charged by the Council and document their charging methodology, levels of income generated, whether the charge is statutory or discretionary and an indication of the cost of providing the service. This will enable a more holistic review of fees and charges to be undertaken and, taken together with the Workbook activity identified above, provide a realistic basis for a review of the level of service provided. The outcome should be clear and transparent charging mechanisms, ease of access to information for the customer, and a format for annual review.
Timescales: October/ November – annual review
Targets/Expected Outcomes – To provide an indication of the potential savings or benefits achievable: 2016/17 ‐ £35k Risks: No risks have been identified yet. Q1 Q2 Q3 Q4 Comment: Annual fee increases agreed by Cabinet
December 2015. However, lack of resources and priority have caused the work to identify all fees and charges to stall during this quarter.

27
4) Shared Building Control – Project scope: To establish a joint Building Control Service for Rushmoor Borough Council and Hart District Council, hosted by Rushmoor.
Timescales: July 2015 Targets/Expected Outcomes – To provide an indication of the potential savings or benefits achievable: £30k per annum Risks: Recruitment of suitably qualified building control staff is proving difficult in the current market. This is resulting in a delay to the formal establishment of the shared service. Q1 Q2 Q3 Q4 Comment: Project closed – completed July 15
5) Creation of new income generating assets – Project scope: To provide decking on Union Street West car park and residential development on Union Street East car park, Farnborough Timescales: Project in initial scoping phase. Targets/Expected Outcomes – To provide an indication of the potential savings or benefits achievable: £67,905 per annum Risks: There are risks relating to development, viability and the ability to let the housing Q1 Q2 Q3 Q4 Comment: Appraisal and viability work advertised
and appointment expected early Quarter 4
6) Income Generation – Digital Advertising – Project scope: The scope of this project will be developed in January 16. In addition to the existing digital monoliths in Aldershot, it will include the feasibility of proceeding with digital advertising on:
Land adjacent to the M3
Bus shelters
Council buildings and assets Timescales: 1 February 2016 – feasibility work on additional digital advertising completed Targets/Expected Outcomes – To provide an indication of the potential savings or benefits achievable: Interactive monoliths in Aldershot will achieve a guaranteed income of £10k pa and indicative additional income of £32k pa Risks: Advertising displays are subject to Business Rates and these will need to be factored into any feasibility work Q1 Q2 Q3 Q4 Comment: Digital monoliths in Aldershot are now
live, and feasibility work to expand digital advertising across the Borough has been commissioned

28
This work stream includes two projects: Consolidation of Assets and Co‐location Programme.
Consolidation of Assets – Project scope: The project is to make better use of our
existing property portfolio and use Council resources more effectively thereby reducing costs
Timescales: Project at feasibility stage. Targets/Expected Outcomes – To provide an indication of the potential savings or benefits achievable: To be confirmed after feasibility. Q1 Q2 Q3 Q4 Comment: Project closed ‐ Approach to be
developed as part of Asset Management Strategy and now encompassed within the Property Investment project
Lido Review – Review scope: With the Task and Finish Group to examine options for the
future use of the site and reduce the net cost of the facility.
Timescales: Validation work on feasibility ongoing. Targets/Expected Outcomes – To provide an indication of the potential savings or benefits achievable: To be identified as part of feasibility. Risks: To be identified as part of feasibility.
Q1 Q2 Q3 Q4 Comment: Project closed ‐ This will form part of the Leisure Contract renewal, which has been brought into the plan so that we can monitor this significant procurement exercise, with its links to town centre master‐planning, civic hub and other strategic priorities.
Co‐location Programme (Phase 2) – Project scope: To create an appropriate and effective working environment which secures significant financial benefit and prepares the Council to meet future changes in services. Timescales:
Jan 16 – Stage 3 complete
March 16 – Stages 2, 4 and 5 complete
April 16 – Stage 6 complete
May 16 – Stage 7 complete
July 16 – Stage 8 complete
Aug 16 – Stage 9 complete
Oct 16 – Stage 10 complete
Point 4 – Better Use of Property & Assets

29
Targets/Expected Outcomes – To provide an indication of the potential savings or benefits achievable:
Additional income of approximately £63k to be received from new tenants Risks:
Timescales are tight and will continued to be reviewed to assess the position and any necessary actions.
Heads of Service leading their teams through the change process is required to help the transition.
Require a link between political and operational decisions relating to Police accommodation strategy.
Assess budgets and make bids where necessary to cover out of scope work on Princes Hall drop in area and Reception improvements.
Job Centres are likely to be co‐located with local authorities sometime in the future.
Q1 Q2 Q3 Q4 Comment: Internal moves continue and development of Workstyle Pilot area and drop in area at Princes Hall agreed
The Financial Strategy will be moved forward in the year and linked with corporate priority setting and the corporate plan. It will bring the MTFF into the strategy document rather than reporting it later in the year. MTFF will be adapted to a more strategic level, using high level estimates to provide a direction of travel rather than a detailed budget position. The strategy will be over‐arching themes rather than detail plans and the actions will flow from the strategy. The budget process itself is being refined and improved alongside a review of the coding structure to better facilitate budget management by budget holders. Reserves, their use and the level of, is also key part of this. Targets – an indication of the potential savings or benefits achievable: £350,000 per annum achieved from revised approach to Treasury Management
Point 6 – Organisational Structure
Organisational Structural Review – Project scope: reviewing the functional and organisational arrangements of Rushmoor Borough Council, identifying a range of possible options for the design of the organisation into the future and the implications attached to them. A new ‘budget challenge; process was introduced last year where Directors reviewed service budgets with Heads of Service, seeking savings and suggesting new ways of working. This will continue this year, with 1:1 meetings with one of the Corporate Directors to set the
Point 5 – Financial Strategy

30
scene, an emphasis in our DMB/HoS appraisals on performance and delivery of sustainability plans and with a request to HoS to compile a list of potential future savings options to be considered by DMB for the medium term. The 1:1 meetings with the Director will aim to establish a common understanding of the financial position and how we see corporate governance and responsibility coming together at a leadership level. Timescales: October: Themes from first round of Heads of Service performance reviews
shared November: Second round of Heads of Service performance reviews commence February/March: Heads of Service identifying options as part of work on sustainable service cost reductions
Targets/Expected Outcomes – To provide an indication of the potential savings or benefits achievable: Estimates yet to be identified. Risks: None identified yet.
Q1 Q2 Q3 Q4 Comment: • Heads of Service currently identifying options as
part of work on sustainable service cost reductions
• DMB considering wider corporate perspective and Director vacancy
Point 7 – Better Procurement
This work stream includes two projects: Future Delivery of Direct Services and Procurement Practices and Policy.
Future Delivery of Direct Services – Project scope : To explore new ways of delivering contracted services (waste, cleansing, grounds) that will deliver improved service standards and reduced cost. Covers the following service areas:
Waste Collection
Street Cleansing
Grounds Maintenance
Public Convenience Cleaning
Timescales:
Council decision on approach to residual waste collection July 2015
Procurement process (competitive dialogue) – July 2015 – September 2016
Contracts awarded – September 2016
Mobilisation of chosen option by April 2017

31
Targets/Expected Outcomes – To provide an indication of the potential savings or benefits achievable: A potential saving of £.5m over the 10 year term of the contract is possible, subject to the impact of the living wage provisions.
Risks: Major risks for project relate to the need for changes to the service and residents’ behaviour to generate savings. Q1 Q2 Q3 Q4 Comment: Tenders for outline solutions received
and short list for second round of competitive dialogue in January 2016 developed
Procurement Practices and Policy – Project scope: The project will focus on: Smarter Procurement Procurement Policies
Timescales: Work programme for 2016/2017 to be agreed by March 2016
Targets/Expected Outcomes – To provide an indication of the potential savings or benefits achievable: It is estimated that a minimum of £25,000 per annum in savings will be achieved.
Risks: There is a need to take a balanced view on price, against organisational quality requirements and standards and potential internal costs of change Q1 Q2 Q3 Q4 Comment:
Point 8 – Effective Taxation Policies
Effective Taxation Policies – Project Scope: Annual review of taxation policies: Tax based forecasting
National Homes Bonus
Council Tax/CTS & Empty Properties
Discounts & exemptions
Support to businesses
Business rates retention
Work is the development of policy through choices and scenario building,
Scenarios will be based on the principle of minimum contribution by all. This will be a single common thread running through the various taxation policies. The scenarios will explore different levels of contribution and model the results those levels will achieve. They will seek to identify the maximum achievable level of contribution before collection costs and defaulters negatively affect levels of income
Timescales: 1 April 2016 – implementation of revised Council Tax Support Scheme Targets/Expected Outcomes – To provide an indication of the potential savings or benefits achievable: Currently no individual projects

32
Risks: This is very much a Member driven and political journey, and it will only be possible to implement changes that politicians support.
Q1 Q2 Q3 Q4 Comment: Review of Council Tax Support Scheme is underway, and consultation complete. Recommendations to be considered by both Cabinet and Council in January 2016.
33
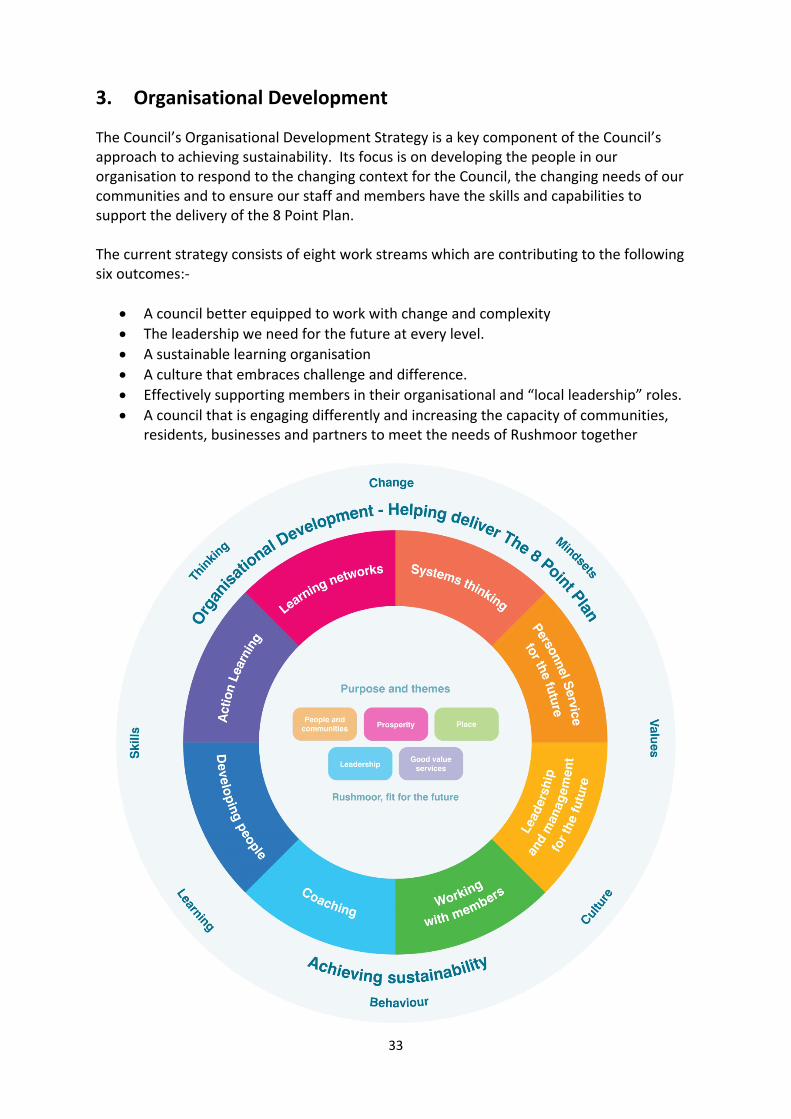
3. Organisational Development
The Council’s Organisational Development Strategy is a key component of the Council’s approach to achieving sustainability. Its focus is on developing the people in our organisation to respond to the changing context for the Council, the changing needs of our communities and to ensure our staff and members have the skills and capabilities to support the delivery of the 8 Point Plan. The current strategy consists of eight work streams which are contributing to the following six outcomes:‐
A council better equipped to work with change and complexity
The leadership we need for the future at every level.
A sustainable learning organisation
A culture that embraces challenge and difference.
Effectively supporting members in their organisational and “local leadership” roles.
A council that is engaging differently and increasing the capacity of communities, residents, businesses and partners to meet the needs of Rushmoor together

34
We still need to develop core success measures for the OD strategy for reporting to members. In the meantime, we are assessing our performance by measuring our progress on key actions within the eight work streams that contribute to our organisational development strategy.
Our key actions for 2015/16 are set out below;
Review and update key personnel policies and processes ‐ determine future arrangements for the Personnel Service
Organisational restructure ‐ embed new roles, responsibilities & relationships and support change to mind‐sets and new ways of working
Organisational restructure ‐ embed new roles, responsibilities & relationships and support change to mind‐sets and new ways of working
Continue the Systems Thinking Learning Programme
Follow up on crucial conversations training, with refresher sessions and wider organisational rollout
Continue new appraisals’ programme and identify supporting behaviours and principles for Council’s simple rules
Maintain the existing two action Learning sets and commence three new sets run by internal facilitators
Establish Digital Learning Network to support taking forward the Council’s new Digital Strategy
Continue to support the members development Group and undertake community leadership meetings with Councillors for each ward and agree follow up work
Support the establishment of a front line staff engagement and learning network Q1 Q2 Q3 Q4 Comment:
Work on the majority of the OD strategy actions is progressing.
Resourcing issues are continuing to impact in some areas and for the next quarter we will continue to focus particularly on developing the personnel function, following through the appraisals process and working on organisational skills.
Three new action learning sets have commenced led by internal facilitators
The organisational development programme will need the flexibility to evolve and over time
it may prove necessary to update the list of key actions, taking into account the Council’s
priorities and financial position.

35
Section Three: Key initiatives and service
measures
This section is the key Initiatives and service measures under each of the Councils priority themes. Below is the summary of performance this quarter against the key initiatives and service measures. Green indicates that the project is on course, amber flags up that achieving the action or indicator is in question and red shows that we have not been able to achieve elements of our target.
Summary Green Amber Red
This quarter total (%) 86.5% 13.5% 0%
Previous quarter total (%) 89.6% 10.4% 0%
Last year’s same quarter total (%) 88.2% 11.3% 0%
PEOPLE AND COMMUNITIES PRIORITY ‐ Supporting our and communities and meeting local needs
Green Amber Red
Key Initiatives 18 1 0
Service Measures 6 5 0
Total (%) 80.0% 20.0% 0%
PROSPERITY PRIORITY ‐ Sustaining and developing our local economy
Green Amber Red
Key Initiatives 15 5 0
Service Measures 4 0 0
Total (%) 79.2% 20.8% 0%
PLACE PRIORITY ‐ Protecting and developing a safe, clean and sustainable environment
Green Amber Red
Key Initiatives 24 1 0
Service Measures N/A N/A N/A
Total (%) 96.0% 4.0% 0%
LEADERSHIP PRIORITY ‐ Providing leadership to make Rushmoor the place where our communities want to live and work
Green Amber Red
Key Initiatives 16 1 0
Service Measures N/A N/A N/A
Total (%) 94.1% 5.9% 0%
GOOD VALUE SERVICES ‐ Ensuring quality services that represent good value for money
Green Amber Red
Key Initiatives N/A N/A N/A
Service Measures N/A N/A N/A
Total (%) N/A N/A N/A

36
Values:
• People should be proud of where they live and who they are • We believe in community influence, involvement, ownership and empowerment • We want to remove barriers and create opportunities for individuals and
communities to have better lives • We want to help support people in need
Aims:
• Understand what matters to communities and what they need and use this to inform service choices and methods of delivery.
• Improve levels of social cohesion and integration • Regenerate priority neighbourhoods by involving the local community and reducing
levels of social and health disadvantage. • Encourage and promote community engagement and volunteering • Tackle inequalities by providing support for the most vulnerable people in our
communities
Key Initiatives
Neighbourhood renewal
Agree the future approach with RSP partners to neighbourhood renewal following an
assessment of the success of existing work and the new indices of multiple
deprivation data which is due to be released in September 2015
Q1 Q2 Q3 Q4 Comment:
Cherrywood
o Implement the 3 year rolling action plan for Cherrywood
Q1 Q2 Q3 Q4 Comment:
o Assist with implementation of Big Local for Prospect Estate Spring 2016
Q1 Q2 Q3 Q4 Comment:
Aldershot Park
o Identify projects to tackle the areas of high priority in Aldershot Park –
Summer 2015
Q1 Q2 Q3 Q4 Comment:
o Implement the Beat the Streets fitness programme in Aldershot Park – Spring
2015
Q1 Q2 Q3 Q4 Comment: Programme completed in Quarter 1

37
o Implement the Active Families programme in Aldershot Park – Spring 2016
Q1 Q2 Q3 Q4 Comment:
North Town –Partnership working with First Wessex to assist North Town Regeneration Programme to deliver more affordable homes during the period 2016/2017
Q1 Q2 Q3 Q4 Comment: Covenant issue is resolved. North Town is no longer an area of Multiple Deprivation
Community cohesion
Implement the Borough cohesion strategy
Q1 Q2 Q3 Q4 Comment:
Deliver the Military Covenant Fund projects including by Spring 2016:
o Conflict resolution o Better together festivals and events o Community communicators o Implement Gurkha Integration Fund proposals
Q1 Q2 Q3 Q4 Comment:
Cultural offer
Support the Friends of the Museum with a bid to the Heritage Lottery for a Heritage Trail for the Borough – Autumn 2015
Q1 Q2 Q3 Q4 Comment: Delayed due to WW1 commemorations – bid anticipated for summer 2016
Implement the programme to commemorate VE day, WW1 and D‐Day.
Q1 Q2 Q3 Q4 Comment:
Develop a design competition and implement a post WW2 monument – Summer
2016
Q1 Q2 Q3 Q4 Comment:
Children and young people
Implement the summer programme to include discounted swimming, free bus travel
for those economically disadvantaged, and street games, art and youth work ‐
Summer 2015
Q1 Q2 Q3 Q4 Comment: Programme complete

38
Work with Hampshire County Council to improve the quality of life for young carers in
the Borough – Spring 2016
Q1 Q2 Q3 Q4 Comment:
Provide Think Safe to every 10/11 year old in Rushmoor – Spring 2016
Q1 Q2 Q3 Q4 Comment: Programme complete
Rushmoor Supporting Families Programme Leading on Rushmoor and Hart supporting families programme. This programme is the new way of doing things; providing practical help to families early on to stop problems getting worse. The programme asks the families about the things that are important to them, about the things that might help and what can be done differently to support them. Although each family is different the programme aims to help those who have issues relating to:
Children in trouble with the police
Children not going to school
Children who need help – pre‐school children who don’t thrive and children going missing
Finding it hard to get a job
Getting the right help and support
Families with health problems
Domestic violence and abuse The aim is not to just fix problem, but to help people discover their own abilities and become more independent Q1 Q2 Q3 Q4 Comment:
Housing
Housing Forum planned for March 2016 as key consultation event for the new
Housing and Homelessness Strategy to be produced in 2016
Q1 Q2 Q3 Q4 Comment:
Support affordable housing development in the borough
o Manage current development programme of 396 units to 2017
o Lettings planning for North Town, Queens gate and Wellesley as new phases
come through
Q1 Q2 Q3 Q4 Comment:
Under occupancy and chain letting initiative being rolled out to support residents
affected by Social Sector Size Criteria (Bedroom tax)
Q1 Q2 Q3 Q4 Comment: We have met with Grainger and First Wessex to develop chain letting between North Town and Maida

39
Increase the supply of temporary accommodation to meet homelessness duty,
partnership working with:
o Oak Housing o Chapter 1 o Wellesley
Q1 Q2 Q3 Q4 Comment: DMB are supportive of seeking additional temporary accommodation schemes
Supporting people cutbacks for socially excluded
o Allocate joint funding to support Hart and Rushmoor’s priorities o Monitor impact of reduced funding
Q1 Q2 Q3 Q4 Comment: Wet hostel viability has been completed, report to Board due on 18th Jan. Night Shelter funded and in place for Q3 & Q4
Service measures
Housing – Homelessness
1. Number presenting 2014‐15 Q1 Q2 Q3 Q4 2015‐16 Comment
116 38 40 33 Compared to the same quarter last year there has been a significant increase in homeless presentations ‐ the main cause of homelessness is parental/relative evictions and loss of private rented accommodation.
2. Number accepted 2014‐15 Q1 Q2 Q3 Q4 2015‐16 Comment
81 21 30 25 As above for numbers presenting as homeless.
3. Number of Homelessness prevention cases (HOTs and Youth Aims figures combined) 2014‐15 Q1 Q2 Q3 Q4 2015‐16 Comment
651 110* 106* 211
* Q1 figures amended from 55 to 110 and Q2 figures amended from 53 to 211, due to additional info from outside agency received late.

40
Homelessness caseload Quarter 1, 2 and 3 – 2011/12 to 2015/16
Housing ‐ Temporary Accommodation – Bed and Breakfast
1. Number in B&B 2014‐15 Q1 Q2 Q3 Q4 2015‐16 Comment
65 Numbers placed throughout the quarter
31 19 25
Numbers as at the end of the quarter still in B&B
8 7 3
2. B&B Cost 2014‐15 Q1 Q2 Q3 Q4 2015‐16 Comment
Gross figure
£172,592 £44,553 £24,723 £29,302
Net figure after HB*
£121,774 £30,588 **
£11,312 £24,456
*Housing Benefit only covers a fraction of the cost of B&B.
** Quarter 1 figure amended
Housing ‐ Temporary Accommodation – Hostels
1. Number in Hostels (placed throughout the quarter) 2014‐15 Q1 Q2 Q3 Q4 2015‐16 Comment
42 8* 7 3
* Please note that the first quarter figure has been amended as it was incorrect

41
2. Hostel Cost 2014‐15
Q1 Q2 Q3 Q4 2015‐16 Comment
0 0 0 £11,015.51 Single void units at Clayton Court caused by no single unit people to place
Housing ‐ Gross Affordable Housing Completions
2014‐15
Target 2015‐16
Q1 Q2 Q3 Q4 2015‐16 Comment
149 (3 year average 98 pa)
Average of 150 new affordable homes p.a. over any 3 yr period
45 0 No housing completions in Q3 There will be no delivery during 2016/17
Housing – Net Affordable Housing Completions
2014‐15 Target 2015‐16
Q1 Q2 Q3 Q4 2015‐16 Comment
29 150 45 0 No housing completions in Q3 There will be no delivery during 2016/17
Housing Allocation Scheme
Band Need Number in band as of December 2015
Number Housed October – December 2015
One Exceptional housing need 8 4
Two Urgent need to move 106 31
Three Identified housing need 530 32
Four A and B Little or no housing need compared to others in the allocation pool
634 1
Total 1278 68
*Households in Band One still need to wait for the right size property to become available
for them.

42
Numbers in the Housing Allocation Pool at the end of each quarter
Note: There was a review of the Housing Allocation Scheme resulting in a reduction in the numbers in the allocation pool in Quarter 2 2014/15.
43
Values: • Rushmoor should have attractive and sustainable neighbourhoods, vibrant town
centres and be a place where businesses can flourish • Residents should have the opportunity to learn the skills to secure local employment
Aims: • Raise the aspirations and levels of attainment and reduce levels of unemployment,
particularly in young people • Drive the regeneration of Aldershot and Farnborough town centres • Maximise the opportunities offered by the Wellesley Development to make the
borough a better place to live and work • Achieve a balanced mix of housing to match existing and future needs • Make the Borough more attractive to business and encourage a more diverse
business mix offering a broader range of local jobs • Maintain and support the growth of our “Blue Chip”/high value business sectors and
their supply chains • Reduce the levels of economic disadvantage in specific areas in the Borough
Key Initiatives
Farnborough Town Centre Regeneration ‐ Civic Quarter ‐ developing a programme and project plan for taking civic quarter forward.
Key stages:
Complete meetings with key stake holders
Negotiate equalisation agreement
Agree overall strategy
Finalise Project Plan
Q1 Q2 Q3 Q4 Comment: Specialist property and financial advice being tendered, due back 18th January
Aldershot Town Centre Regeneration
To work with Allies and Morrison to complete the master planning process for the town centre ready for public consultation in September.
Q1 Q2 Q3 Q4 Comment: Town Centre prospectus amended in light of consultation responses and due for adoption by Cabinet 12th January
To complete the Activation Aldershot Projects Q1 Q2 Q3 Q4 Comment: Work substantially completed

44
Economic development
Finalise the Councils Economic development strategy to be agreed by Council by
September 2015.
Q1 Q2 Q3 Q4 Comment: Draft strategy produced. To be presented to DMB/Cabinet March 2016
Work with Mosaic on Feasibility study to introduce business improvement districts
(contract awarded). Feasibility to start in April 2015 – report back by November with
recommendation on how to proceed
Q1 Q2 Q3 Q4 Comment: Report received with recommendations. To be presented to DMB/Cabinet March 2016
Reviewing future arrangements for TechStart, to be completed by Summer 2015
Q1 Q2 Q3 Q4 Comment: Initial discussions have taken place with Enterprise First leading to a more comprehensive review over the next 12 weeks with report back to partners (First Wessex, JCP, RBC, Rushmoor Schools Plus) in April 2016
Business engagement
Development of the Rushmoor Business Network, 2,500 leaflets going out with NNDR
demands to encourage sign up
Q1 Q2 Q3 Q4 Comment: Action completed in Quarter 1
Localisation of business rates and review– assessment of the implications and issues
Q1
Q2 Q3 Q4 Comment: We have been notified of the changes to Business Rates from 2017 with regard to 100% localisation. We await further guidance during 2016/17.Meanwhile we have planned meetings with the Valuation Office regarding revaluation and other issues affecting local business rates collection
Working with the local Enterprise Partnership
Engage with and take opportunities offered by Enterprise M3 including development of projects for future funding rounds.
Q1 Q2 Q3 Q4 Comment:
Skills and employability
Support the M3 local enterprise partnership with the Skills & Employment
programme
Q1 Q2 Q3 Q4 Comment:
45
Support the Rushmoor employment and skills zone plus the National Skills Academy
for Construction
Q1 Q2 Q3 Q4 Comment:
Identify options to sustain the new Skilled Up programme – Autumn 2015
Q1 Q2 Q3 Q4 Comment:
Encourage additional apprenticeships – Spring 2016
Q1 Q2 Q3 Q4 Comment:
Support partners to develop business plans for local social enterprises including
Source and Vine – Autumn 2015
Q1 Q2 Q3 Q4 Comment:
Educational attainment
Develop and take forward work with partners to help raise aspirations and improve
educational attainment for students attending schools in the borough.
Q1 Q2 Q3 Q4 Comment: The Council is working with partners on a number of projects to support schools:
Mental Health project with Clinical Commissioning Group and Supporting Troubled Families and local secondary schools.
Recruitment Fair January 2016 – HCC
Work Experience Projects with schools and Basingstoke consortium
Moving on Day – Farnborough 6th Form
Volunteer Reading projects with Community Matters Partnership Project
PE training programme for Rushmoor and Hart Primary schools
Supported 30 pupils from Rushmoor secondary schools to attend Teen Tech event in June
Work with the County to help raise aspirations and educational attainment –
placements, mentors, reading buddies and work placed speakers – Autumn 2015
Q1 Q2 Q3 Q4 Comment:
Movement around the Borough
Supporting traffic improvement schemes – Queen’s Roundabout, Minley Link Road
(Junction 4A), Alexandra Road Cycle Way, Barrack Road/Grosvenor Road
improvements and Court Road improvements

46
Q1 Q2 Q3 Q4 Comment:
Develop CCTV parking enforcement around schools (subject to Government review) –
Winter 2015
Q1 Q2 Q3 Q4 Comment: Awaiting findings from review
Supporting town centres and parking income with a new strategy Autumn 2015
Q1 Q2 Q3 Q4 Comment:
Review options for cashless parking – Winter 2015
Q1 Q2 Q3 Q4 Comment:
Replace the ticket machines both on street and off street – Summer 2016
Q1 Q2 Q3 Q4 Comment:
Service measures
Invoices paid on time
Percentage of invoices paid within 30 days
2014/2015 Q1 Q2 Q3 Q4 2015/2016
98.33% 97.15% 98.17% 98.25%
Determination of Planning Applications in a timely manner
Major applications within 13 weeks
2014/2015 Target Q1 Q2 Q3 Q4 2015/2016
83.7% 60% 100% 83.3% 100%
Minor applications within 8 weeks
2014/2015 Target Q1 Q2 Q3 Q4 2015/2016
89.5% 65% 84.8% 84.4% 73.6%
Other applications within 8 weeks
2014/2015 Target Q1 Q2 Q3 Q4 2015/2016
97.1% 80% 97.1% 100% 98.5%
% of appeals allowed against the authority’s decision to refuse
2014/2015 Target Q1 Q2 Q3 Q4 2015/2016
20.66% 40% max 100%* 0% 40%
*Only 1 appeal decision in quarter 1 (KFC 235 Ash Road). No appeal decisions in quarter 2. 5 appeal
decisions in quarter 3.

47
Values:
• The world should be protected for future generations • We should lead by example • A safe, clean and healthy, sustainable and green environment is essential to quality
of life Aims:
• Maintain and improve the cleanliness and quality of the borough’s urban and natural environment
• Work to protect Rushmoor for current and future generations by: – encouraging and enabling people to care about and take more responsibility
for the environment where they live and work – reducing energy use – reducing consumption of non‐renewable resources – tackling flooding and drainage issues
• Work in partnership to reduce crime and anti‐social behaviour and the concerns they create
Key Initiatives
Rushmoor Local Plan ‐ After adopting the Core Strategy to the Rushmoor Plan, Cabinet has
revised our Local Development Scheme (with effect from 1 November 2014) and rather than
preparing a Delivering Development DPD, to include detailed policies to cover the future of
our town centres, employment sites, Farnborough Airport, housing allocations, transport
improvements and green infrastructure, we will now prepare a single Local Plan for
Rushmoor.
Q1 Q2 Q3 Q4 Comment:
Wellesley (Aldershot Urban Extension) project‐ To achieve a successful residential led
development on land to the north of Aldershot
Q1 Q2 Q3 Q4 Comment:
Public Facilities
Finalise plan for the rationalisation of play areas across the Borough – Spring 2016
Q1 Q2 Q3 Q4 Comment:
Develop a new playground for Manor Park, Municipal Gardens and the St Johns
Ward. (£400K) – Spring 2016
Q1 Q2 Q3 Q4 Comment:

48
Carry out a planning for real project to create a vision for the Moor Road Playing
Fields – Summer 2015
Q1 Q2 Q3 Q4 Comment: Consultation completed with vision being finalised
Assist Farnborough Tennis Club to develop their clubroom and grounds (£150k) –
Summer 2015
Q1 Q2 Q3 Q4 Comment: Project completed
Identify options for a new cemetery in the Borough ‐– Spring 2016
Q1 Q2 Q3 Q4 Comment:
Relay the pitches at the Ivy Road Playing Fields in North Town (60k). – Summer 2015
Q1 Q2 Q3 Q4 Comment: Project completed
Produce design for a new changing pavilion at Ivy Road and identify funding options
(£150k) ‐– Spring 2016
Q1 Q2 Q3 Q4 Comment:
Assist Farnborough Rugby Club to develop their clubhouse. (£500k) – Summer 2016
Q1 Q2 Q3 Q4 Comment:
Improve the drainage at the Aldershot park rugby pitches. (£40k) – Winter 2015
Q1 Q2 Q3 Q4 Comment: Programme complete
Review development proposals to enhance the service offered by the Alpine Snow
Sports ‐– Spring 2016
Q1 Q2 Q3 Q4 Comment:
Assist the Rushmoor Gymnastics Academy with their extension (£500k) – Spring 2016
Q1 Q2 Q3 Q4 Comment:
Assist the Southwood Church with the provision of a new church / community
building – Winter 2015
Q1 Q2 Q3 Q4 Comment:
Initiate procurement for a community café in King George V Playing Fields – Spring
2016
Q1 Q2 Q3 Q4 Comment:
Review options to improve changing and develop fitness / Spa offer at Aldershot
Indoor Pools – Spring 2016
Q1 Q2 Q3 Q4 Comment:

49
Assist Brickfields Country Park to develop a vision for improvement of the area and
identify funding sources. – Spring 2016
Q1 Q2 Q3 Q4 Comment:
Arrange the dredging works for the Manor Park Lake – Summer 2015
Q1 Q2 Q3 Q4 Comment: Have engaged specialist conservation consultant to undertake studies of this and other areas in Spring 2016
Increase number of allotment plots in Borough and encourage Allotment self‐help
groups – Spring 2016
Q1 Q2 Q3 Q4 Comment:
Develop action plans to implement the findings from the Playing Pitch Strategy and
the Parks, Sport & Recreation Plan. – Winter 2015
Q1 Q2 Q3 Q4 Comment:
Climate change
Meet the actions and commitments in our Climate Local initiative Q1 Q2 Q3 Q4 Comment: Complete review of progress of all
50+ actions to be carried out in Quarter 1 2016.
Plans to reduce CO2 emissions and fuel poverty through government initiatives and working with partners in accordance with Home Energy Conservation Act – Progress Report 2015)
Q1 Q2 Q3 Q4 Comment: Still no schemes from the government to promote energy efficiency or reduce fuel poverty. However, we are continuing to provide support to our residents with replacing defective boilers under our discretionary Energy Efficiency Grants. We have now received the EPC and Blue Sky data and will be looking at ways that we can use this to target those in fuel poverty.
Complete the phase out of halogen and SON lighting, replacing with energy efficient
LED
Q1 Q2 Q3 Q4 Comment: On schedule to be around 90% complete by Quarter 4. Current projects – King George V and the Municipal Gardens SON lighting phase out to be completed by the end of March 2016. The remaining 10% consist of minor schemes to be completed in 2016/2017.
Completing planned energy efficiency works at the Princes Hall, the Crematorium
and Rectory Road Pavilion

50
Q1 Q2 Q3 Q4 Comment: Planned works for Prospect Centre, Rectory Road Pavilion and Southwood Pavilion completed. Current energy efficiency works at the Princes Hall and the Crematorium: schemes designed and lighting ordered for the Crematorium (external lighting) and Princes Hall – all works on schedule to be completed by the end of February 2016.
Clean
Introduction of a new way of monitoring satisfaction with street cleanliness and work of the enforcement team
Q1 Q2 Q3 Q4 Comment: We will be testing in February 2016
Identify feasibility of providing an interim and longer term depot in Rushmoor for refuse vehicles – Autumn 2015
Q1 Q2 Q3 Q4 Comment: Opportunities still being explored, confident of a resolution in the next few months Recent news: Potential site identified and purchase proceeding, subject to planning permission. Plans in place to deliver operational depot by Summer 2017

51
Service measures
Rubbish and recycling data
Refuse Collection ‐ Residual household waste collected per household (kg) – year to date
figure compared to previous years.
2014‐15 Q1 Q2 Q3 Q4 2015‐16
589.33 145.92 147.63 148 Est
Recycling – Waste Recycled and Composted
.

52
Food Hygiene Ratings Scheme
The national Food Hygiene Ratings Scheme has been successfully implemented following
the launch on 1st November 2011. Businesses are now rated 0‐5 on the scheme, which
can be viewed on the Food Standards Agency web pages.
Summary of scores December 2015
Farnborough Aldershot % for Rushmoor
0 ‐ Urgent improvement necessary 0 2 0.4
1 ‐ Major improvement necessary 5 4 1.6
2 ‐ Improvement necessary 18 9 4.9
3 ‐ Generally satisfactory 38 39 14.0
4 ‐ Good 81 71 27.5
5 ‐ Very good 154 131 51.6
Total 296 256 100
The % of Rushmoor food establishments rated 0 to 5 over time

53
Values:
We care about our community
The public must be able to trust the Council to do the right things
Local people should be engaged in local decisions Aims:
Champion the interests and concerns of the local community
Work with and enable our public, private and voluntary sector partners to achieve better Outcomes for the Borough
Be ambitious for and with local people, businesses and the area
Key Initiatives
RSP ‐ Rushmoor Strategic Partnership – Support the delivery of the Sustainable Community Strategy through 2015/16 and consider future key priorities with the Partnership
Current Key priorities are:
To take a neighbourhood renewal approach to improving Cherrywood, North Town and Aldershot Park
To encourage healthy weight in both children and adults
To improve the level of skills and educational achievement
To encourage community cohesion
To understand and manage mental health problems
To reduce alcohol abuse and related admissions to hospital
To reduce the level of violent crime, acquisitive crime, drug and alcohol related offences and anti‐social behaviour
To support our residents and businesses and enable economic recovery from the recession
Q1 Q2 Q3 Q4 Comment:
Recent news:
At the December RSP meeting partners were given a presentation on the Hampshire Cultural Trust and progress on Devolution in Hampshire
In Brief items included: Autumn Statement; Security; Educational Attainment; Supporting Troubled Families; Local Plan Consultation; Town Centres; Wellesley; Enterprise M3 LEP; Economic Recovery; Illegal Money Lending Campaign
The RSP priority refresh will be reviewed at a workshop on 9th March 2016 with input from partnerships under the RSP umbrella
Community Safety Partnership ‐ Following the creation of the North Hampshire Community
Safety Team , Rushmoor’s, Hart’s and Basingstoke and Deane’s Community Safety
Partnerships are to formally merge.
54
The priorities for North Hampshire in 2015‐16 are:
Antisocial behaviour
Alcohol related violent crime
Vulnerabilities
Substance Misuse
Q1 Q2 Q3 Q4 Comment:
Health & Wellbeing Partnership –Continue to provide leadership, and engagement of health partners to support the public health needs of the Borough. The key health challenges for Rushmoor are categorised under five themes in the Health Improvement Plan (HIP):
Healthy weight (obesity)
Smoking
Drugs and alcohol
Mental health and Dementia
Health Inequalities Q1 Q2 Q3 Q4 Comment: With new Index of Multiple Deprivation
being available, the Partnership heard that many indicators are worsening. An IMD workshop voiced mental health as a continuing priority for the Borough. The Safe Haven Café (providing mental health services locally has proved a great success in reducing A+E attendance in crisis, and the TalkPlus service locally continues to deliver self‐referral services. The Partnership continues to support the HWB Forum of LAs in the County and is preparing to contribute an analysis of local health priorities to the RSP 9th March.
Local Children’s Partnership ‐ Support the development and the delivery of a new Local
Children’s Partnership Plan for 2013/15. The five priorities in the plan are:
Reducing the incidence and impact of poverty on the achievement and life chances
of children and young people
Securing children and young people’s physical, spiritual, social, emotional and
mental health, promoting healthy lifestyles and reducing inequalities
Providing opportunities to learn, within and beyond the school day, that raise
children’s and young people’s aspirations, encourage excellence and enable them to
enjoy and achieve beyond their expectations
Helping children and young people to be safe and feel safe
Promoting vocational, leisure and recreational activities that provide opportunities
for children and young people to experience success and make a positive
contribution
Q1 Q2 Q3 Q4 Comment:

55
Democracy and elections
Holding the Parliamentary and local elections in May 2015 Q1 Q2 Q3 Q4 Comment: Complete in Q1
Complete the introduction of Individual Elector Registration across the Borough Q1 Q2 Q3 Q4 Comment:
Working to reduce the number of void properties on the Electoral Register and to increase the number of registrations amongst harder to reach groups, in particular under 24s and military personnel
Q1 Q2 Q3 Q4 Comment:
Work to identify and provide support mechanisms for Members leading their communities
Q1 Q2 Q3 Q4 Comment:
Continue work to update the Constitution, and review the Scheme of Delegation and the format of the Constitution
Q1 Q2 Q3 Q4 Comment:
Review communication arrangements with Rushmoor’s electors, including a Review of democratic web pages
Q1 Q2 Q3 Q4 Comment:
Responding to Government policy
Welfare reform – Assess the impact of the implementation of welfare reform Q1 Q2 Q3 Q4 Comment: The 2016/17 Council Tax support
scheme proposals are going to Full Council on 27 Jan 2016. Rollout of Universal Credit in Rushmoor is live from 8 February 2016 for new single unemployed job seekers. Numbers with housing costs are expected to be around 300 claims over the period 8 Feb 16 to 31 March 17. We are working with the DWP on the support being provided locally by RBC. Other benefit changes announced in the July and Autumn Budget statements will roll out during 2016/17. We are working with the Members’ Welfare Reform Task and Finish Group on these changes.
Duty to co‐operate and neighbourhood planning ‐ We will respond to the
requirements of the Localism Act where relevant to the planning system, including
the duty to co‐operate and neighbourhood planning
Q1 Q2 Q3 Q4 Comment:

56
Localism Act and Armed Forces Regulations ‐ Review current housing allocation scheme to ensure it meets the priorities of the Localism Act and Armed Forces Regulations
Q1 Q2 Q3 Q4 Comment:
Dealing with the impacts of welfare reform on Housing ‐ This could lead to a possible increase in homelessness, bed and breakfast costs and additional demand on the Housing Options team. Universal Credit for single working aged people (new claimants only) is due to be rolled out in Rushmoor from February 2016. The initial numbers are expected to be low. Housing Team is working with RP partners and other agencies to monitor the impact, allowing us to respond appropriately.
Q1 Q2 Q3 Q4 Comment:
Responding to new emerging polices after the 2015 General Election Q1 Q2 Q3 Q4 Comment:
Working with other local authorities on the development of a devolution prospectus and deal for Hampshire and the Isle of Wight
Q1 Q2 Q3 Q4 Comment:
Engagement, communications and consultation
Public consultation – working with the Borough Services Task and Finish group and the Corporate Services Communications Review Task and Finish Group explore future approaches to public engagement, communications and consultation alongside the development of the Council’s equalities strategy
Q1 Q2 Q3 Q4 Comment: Due to initial meeting being rescheduled the timetable for this work will be re‐considered as part of the Panel’s work programme.
Communications – maintain and develop the council’s website to respond to channel shift programme and increasing demand for access via mobile devices
Q1 Q2 Q3 Q4 Comment:
Service measures
Social media data
Facebook likes
2014/2015 Q1 Q2 Q3 Q4 2015/2016
1,021 1,305 1,581 1,958
Twitter followers
2014/2015 Q1 Q2 Q3 Q4 2015/2016
2,328 2,522 2,685 2,815

57
Values:
• People deserve access to quality, good value services • We will use our limited financial resources well • We want the public to know they can trust us
Aims:
• Continue to maintain a sustainable financial position and target our resources to achieve our aims
• Improve the quality and reduce the costs of the services we support, commission or deliver to our customers
Key Initiatives
***Note: some of the actions, which sat under this section in previous reports, are now
included in Section Two of this report ***
Service measures
Council tax and NNDR collection
2014/ 2015
Q1 Q2 Q3 Q4 2015/ 2016
Council Tax 98.2% 98.91% 96.00% 96.08%
NNDR 98.8% 103.22% 95.74% 92.11%
Staffing absence and turnover
Staffing: Turnover
2014/ 2015
Q1 Q2 Q3 Q4 2015/ 2016
Staff turnover 13.64% 3.37 4.05 3.01
Staffing: Absence
Average number of working days lost due to sickness absence per FTE
2014/ 2015
Q1 Q2 Q3 Q4 2015/ 2016
Working days lost due to sickness absence ‐ BVPI12
10.92 (2833 days)
1.43 (363 days)
1.59 (408 days)
1.79 (462 days)
Working days lost to sickness absence, minus long term sickness ‐ LPI
4.04 (1041 days)
0.53 (136 days)
0.97 (248 days)
0.94 (242 days)
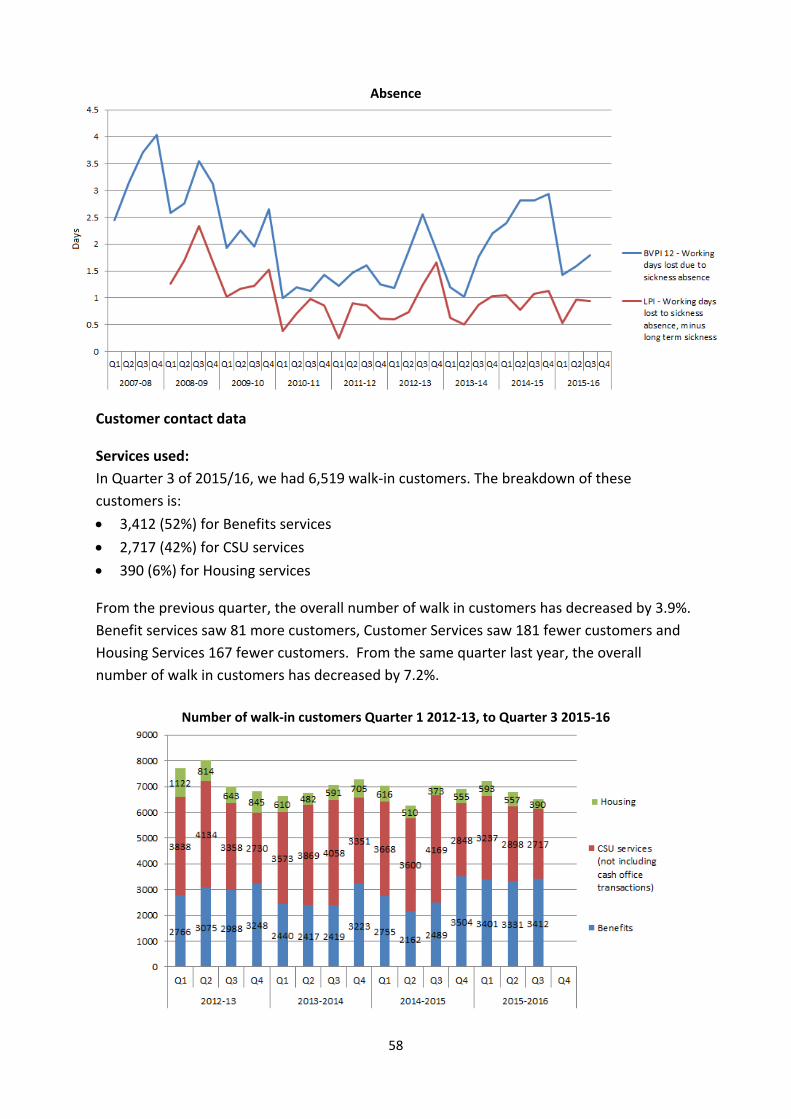
58
Absence
Customer contact data
Services used:
In Quarter 3 of 2015/16, we had 6,519 walk‐in customers. The breakdown of these
customers is:
3,412 (52%) for Benefits services
2,717 (42%) for CSU services
390 (6%) for Housing services
From the previous quarter, the overall number of walk in customers has decreased by 3.9%.
Benefit services saw 81 more customers, Customer Services saw 181 fewer customers and
Housing Services 167 fewer customers. From the same quarter last year, the overall
number of walk in customers has decreased by 7.2%.
Number of walk‐in customers Quarter 1 2012‐13, to Quarter 3 2015‐16

59
CSU Call Statistics: January 2012 –December 2015
In the last quarter, the CSU have answered 11,473 calls. This is a decrease of 3,968 (25%) on
the same period last year.
Oct ‐ Dec 2015 Oct ‐ Dec 2014 Oct ‐ Dec 2013
Calls offered 11,854 16,554 16,831
Calls answered 11,473 15,441 15,968
Calls abandoned 381 1,113 863
Abandoned rate 3% 6% 5%
The abandoned call rate during Quarter 3 2015 is lower than the same period in both 2014
and 2013. This is largely attributable to new staff members who have been recruited and
have undergone significant training so are now ‘operational’.
Also during this period, we have seen an increase again in the number of people making
payments via the automated payment line – requiring no assistance from the Customer
Service Team, an example of positive ongoing Channel Shift.
Payments via the automated payment line Oct ‐ Dec 2015 2,892 (1.7% increase on previous year)
Oct ‐ Dec 2014 2,842 (5% increase on previous year)
Oct ‐ Dec 2013 2,704
Customer Satisfaction
During Quarter 3, 26 customer satisfaction surveys were completed. During this period, 88%
of customers rated our service 10/10.

60
Breakdown of Surveys by Service CSU Staff 14
Benefits Staff 7
Housing Staff 1
Licensing Staff 1
Diya (Nepalese CSA) 1
Allotments Officer 1
Planning Staff 1
Quarter 3 – 2015/16 Customer Satisfaction Survey
Some examples of the feedback received during Quarter 3 include: (+) Nice to be understood and not treated like a stone
(+)Total Professional, very organised and very friendly
(‐) Did everything really well but had a small wait
The following chart shows the percentage of customers who scored the service they
received 10 out of 10 over time. The apparent fall in the percentage of customers scoring
the service 10 out of 10 probably results from a change in survey method, from actively
seeking feedback in quiet times to the “self‐ serve” option, however to increase
representative responses the method to obtain feedback is has changed in Quarter 2.
The percentage of customers who scored the service they received 10 out of 10

61
Web customer contact
Monthly Visitors to the Council Website
Visits
In Quarter 3 of 2015/16 we had 160,083 visits to the website. This is a small decrease of
4,267 visits (‐2.6%) on the previous quarter. There was an increase of 14,930 visits (+10.3%)
on the same quarter from last year.
Up time
Our website is independently monitored by an external company who checks that our
servers are responding and producing content 24/7.
In Quarter 3, we had a total up‐time of 99.93%. This is better than the up time of 99.77% in
Quarter 2.
Visits to the council website by device

62
In Quarter 3 of 2015/16 we had 89,848 visits (56.1% of total visits) to the website by
mobile/tablet. The percentage of total visits by mobile/tablet was 55% in Quarter 2 this year
and 50.8% in Quarter 3 of 2014/15.
Website visitor satisfaction
Every visitor to our website who visits a content page, has the opportunity to provide
feedback about their visit.
We ask after reading down the web page, if they found what they were looking for. The
basis of this question allows us to produce the graph below. This graph shows the
percentage of completed forms that were positive, led to visitors unable to find the
information they were looking for or led them to request a specific service.
In Quarter 3 we had a total of 671 completed feedback forms.
Types of feedback
Page views
Top three page views for content in Quarter 3
1. Bin collections (15,219)
2. Fireworks spectacular (14,775)
3. Hampshire Waste and Recycling Centres (HWRCs) (8,323)
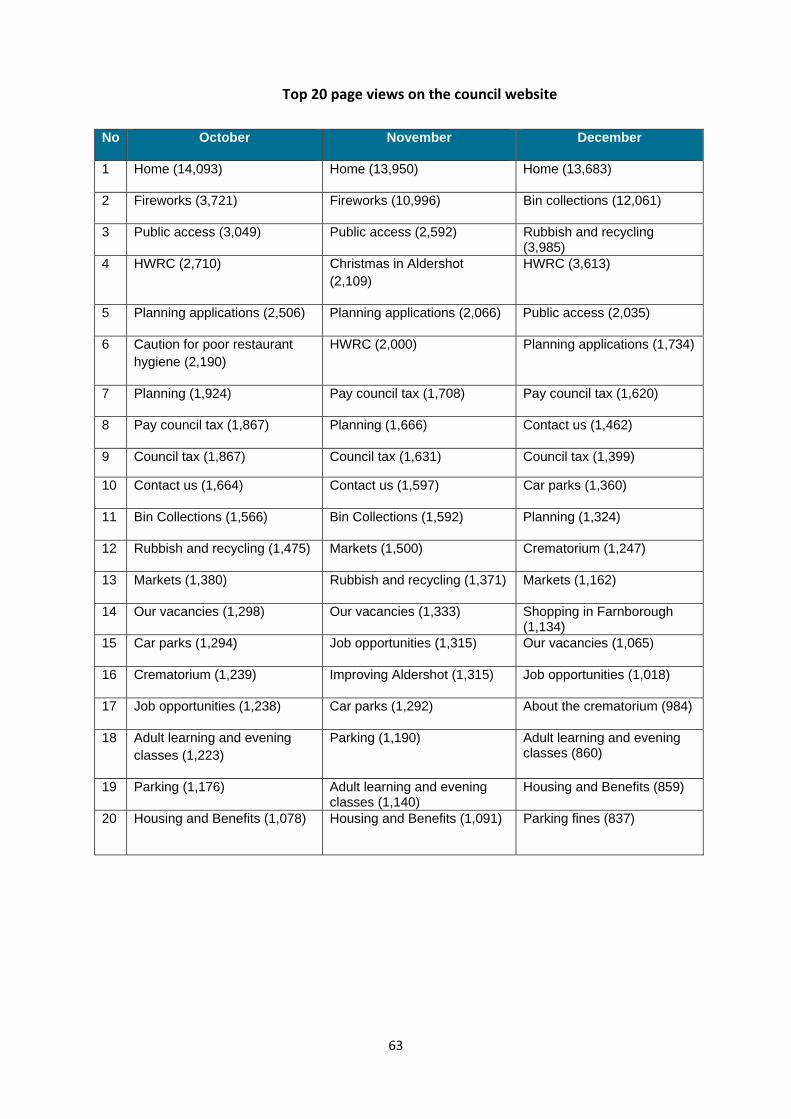
63
Top 20 page views on the council website
No October November December
1 Home (14,093) Home (13,950) Home (13,683)
2 Fireworks (3,721) Fireworks (10,996) Bin collections (12,061)
3 Public access (3,049) Public access (2,592) Rubbish and recycling (3,985)
4 HWRC (2,710) Christmas in Aldershot (2,109)
HWRC (3,613)
5 Planning applications (2,506) Planning applications (2,066) Public access (2,035)
6 Caution for poor restaurant hygiene (2,190)
HWRC (2,000) Planning applications (1,734)
7 Planning (1,924) Pay council tax (1,708) Pay council tax (1,620)
8 Pay council tax (1,867) Planning (1,666) Contact us (1,462)
9 Council tax (1,867) Council tax (1,631) Council tax (1,399)
10 Contact us (1,664) Contact us (1,597) Car parks (1,360)
11 Bin Collections (1,566) Bin Collections (1,592) Planning (1,324)
12 Rubbish and recycling (1,475) Markets (1,500) Crematorium (1,247)
13 Markets (1,380) Rubbish and recycling (1,371) Markets (1,162)
14 Our vacancies (1,298) Our vacancies (1,333) Shopping in Farnborough (1,134)
15 Car parks (1,294) Job opportunities (1,315) Our vacancies (1,065)
16 Crematorium (1,239) Improving Aldershot (1,315) Job opportunities (1,018)
17 Job opportunities (1,238) Car parks (1,292) About the crematorium (984)
18 Adult learning and evening classes (1,223)
Parking (1,190) Adult learning and evening classes (860)
19 Parking (1,176) Adult learning and evening classes (1,140)
Housing and Benefits (859)
20 Housing and Benefits (1,078) Housing and Benefits (1,091) Parking fines (837)