STRATEGIC ADAPTATION, AMBIDEXTERITY, AND...
192
STRATEGIC ADAPTATION, AMBIDEXTERITY, AND COMPETITIVENESS in Hungary between 1992 and 2010 PhD Thesis Work Roland Zsolt SZABO Budapest, 2010 PhD Program in Business Administration
Transcript of STRATEGIC ADAPTATION, AMBIDEXTERITY, AND...
STRATEGIC ADAPTATION,
AMBIDEXTERITY, AND
COMPETITIVENESS
in Hungary between 1992 and 2010
PhD Thesis Work
Roland Zsolt SZABO
Budapest,
2010
PhD Program in Business Administration

1
Corvinus University of Budapest
Institute of Management
Department of Strategic Management
H-1093 Budapest, Fővám tér 8.
Supervisor: Prof. Károly Balaton, DSc
© Roland Zsolt SZABO, 2010.
2
CONTENT
Figures ___________________________________________________________________ 6
Tables ____________________________________________________________________ 7
Acknowledgement ___________________________________________________________ 8
1 Introduction to the investigation of strategic adaptation __________________________ 10
1.1 The conceptual framework for strategic adaptation,
ambidexterity and competitiveness ________________________________________ 12
1.1.1 Strategic adaptation ___________________________________________________________ 12
1.1.2 Ambidexterity _______________________________________________________________ 12
1.1.3 Competitiveness _____________________________________________________________ 13
1.2 The justification of the dissertation and the most important results _____________ 14
2 Theoretical foundation of the research _____________________________________ 16
2.1 The roots in strategic management ________________________________________ 16
2.1.1 The Schools of Thought in strategic management and strategic adaptation ________________ 16
2.1.2 Choosing between the strategic schools based on thematic fit and
my previous research experiences _______________________________________________ 20
2.1.3 The Configurational School ____________________________________________________ 22
2.2 Environmental changes and uncertainty ____________________________________ 24
2.2.1 The changing macro environment and the sources of uncertainty _______________________ 24
2.2.2 Changes and uncertainty derived from industrial and organisational growth _______________ 27
2.3 Perception and influence of environmental changes___________________________ 31
2.3.1 A single dimensional approach to the environmental adaptation ________________________ 32
2.3.2 Proactiveness as a characteristic of entrepreneurial behaviour __________________________ 34
2.3.3 A multi dimensional approach to the environmental adaptation _________________________ 37
2.3.4 Comparing different strategic adaptation archetypes _________________________________ 41
2.4 The strategies followed and the rise of ambidexterity _________________________ 42
2.4.1 The strategies followed by the enterprises _________________________________________ 42
2.4.2 The adaptation paradox ________________________________________________________ 43
2.4.3 Renewal and the sustainable corporate growth ______________________________________ 45
2.4.4 Managing changes ____________________________________________________________ 49
2.4.5 Ambidextrous organisations ____________________________________________________ 55
2.5 Identifying strategic configurations based on firm performance ________________ 57
2.6 Hypotheses based on the explored theoretical conceptions _____________________ 61

3
3 Research methodology __________________________________________________ 63
3.1 Steps of the empirical examinations ________________________________________ 63
3.2 Background – The “In Global Competition’ research program _________________ 65
3.3 Databases and sample characteristics ______________________________________ 67
3.3.1 Used databases and variables ___________________________________________________ 67
3.3.2 The characteristics of the single surveys’ samples ___________________________________ 68
3.3.3 Characteristics of the collective sample, introduction of control/descriptive variables _______ 71
4 Results of the empirical examinations ______________________________________ 80
4.1 Environmental uncertainty _______________________________________________ 80
4.1.1 The concrete appearance of the variable in the VKK database __________________________ 80
4.1.2 Characteristics and description of the variable ______________________________________ 80
4.1.3 The evolution of the assessment uncertainty through the surveys________________________ 81
4.1.4 Do we estimate the past less uncertain than the present? ______________________________ 83
4.1.5 Control variable’s relation to the variable __________________________________________ 85
4.2 The firm’s relation to the environmental changes ____________________________ 88
4.2.1 The concrete appearance of the variable in the VKK database __________________________ 88
4.2.2 Characteristics and description of the variable ______________________________________ 88
4.2.3 Control variable’s relation to the variable __________________________________________ 89
4.3 The strategy followed ____________________________________________________ 90
4.3.1 The concrete appearance of the variable in the VKK database __________________________ 90
4.3.2 Characteristics and description of the variable ______________________________________ 90
4.3.3 Control variable’s relation to the variable __________________________________________ 94
4.4 Competitive performance of the firms ______________________________________ 95
4.4.1 The concrete appearance of the variable in the VKK database __________________________ 95
4.4.2 Characteristics and description of the variable ______________________________________ 96
4.4.3 Managing of missing values ____________________________________________________ 97
4.4.4 Exploration of the latent dimensions of the performance evaluation _____________________ 98
4.4.5 Dimensions of performance evaluation ___________________________________________ 100
4.4.6 Changes in the dimensions of performance evaluation during the four surveys ____________ 102
4.4.7 Control variable’s relation to the dimensions of performance evaluation _________________ 103
4.5 Performance configurations _____________________________________________ 105
4.5.1 Identifying performance configurations with clustering ______________________________ 105
4.5.2 Identifying clusters between 2 and 10 ____________________________________________ 106
4.5.3 Identifying clusters between 10 and 120 __________________________________________ 109
4.5.4 Changes in performance configurations through the 4 surveys _________________________ 115
4.5.5 Control/descriptive variables’ connection to the performance configurations _____________ 117

4
4.6 Testing hypotheses related to firms, the connection between environment, strategy
and performance _____________________________________________________________ 119
4.6.1 H1individual __________________________________________________________________ 119
4.6.2 H2individual __________________________________________________________________ 120
4.6.3 H3individual __________________________________________________________________ 120
4.6.4 H4 _______________________________________________________________________ 122
4.6.5 H5 _______________________________________________________________________ 122
4.6.6 H6 _______________________________________________________________________ 123
5 Discussion and summary of the empirical results ___________________________ 124
5.1 Summary of the quantitative research _____________________________________ 124
5.1.1 A broad view of strategic adaptation, ambidexterety and competitiveness ________________ 124
5.1.2 The results of hypotheses testing ________________________________________________ 126
5.2 Value cration for the Hungarian and international research cummunity ________ 127
5.2.1 Value creation with 4 actions __________________________________________________ 127
5.2.2 Questioning the Contingency Theory ____________________________________________ 128
5.2.3 Few additional interesting conclusions ___________________________________________ 129
5.3 The practical meaning and value of the results ______________________________ 131
5.3.1 Methodology of the qualitative survey ___________________________________________ 131
5.3.2 Definition of the unit of analysis, population, and sample ____________________________ 132
5.3.3 The script of the qualitative research ____________________________________________ 133
5.3.4 First impressions and the Big Picture, recognizing Mintzberg’s elephant ________________ 135
5.3.5 What are the sources of environmental uncertainty for CEOs?_________________________ 136
5.3.6 What are the strategies followed by firms? ________________________________________ 137
5.3.7 What kind of performance goals does the enterprise have? ___________________________ 139
5.3.8 About what they avoided to talk… ______________________________________________ 140
5.3.9 Summary of the qualitative research results _______________________________________ 141
5.4 Assignment of further research questions and related disciplines ______________ 142
5.4.1 The linkage of the dissertation to other disciplines __________________________________ 142
5.4.2 Ambidexterity and growth ____________________________________________________ 143
References _______________________________________________________________ 146
6 Appendecies _________________________________________________________ 165
6.1 Changes in the Consumer Price Index _____________________________________ 166
6.2 Perception of environmental uncertainty __________________________________ 167
6.3 The strategies followed _________________________________________________ 168

5
6.4 Corporate performance _________________________________________________ 169
6.4.1 Descriptive statistics _________________________________________________________ 169
6.4.2 Test of normality before replacing missing values __________________________________ 170
6.4.3 Test of normality after replacing missing values____________________________________ 171
6.4.4 Histogram of missing values of corporate performance variables without the logistics variable 172
6.4.5 MDS running parameters _____________________________________________________ 173
6.4.6 Stress and fit measures between 1 and 7 dimensions ________________________________ 173
6.4.7 Correlation between corporate performance variables and dimensions __________________ 176
6.4.8 Stress and fit measures in 7 dimension in 1996, 1999, 2004, and 2009 __________________ 181
6.4.9 Correlated variables with performance dimensions, 2009 ____________________________ 182
6.4.10 Correlated variables with performance dimensions, 2004 __________________________ 183
6.4.11 Correlated variables with performance dimensions, 1999 __________________________ 184
6.4.12 Correlated variables with performance dimensions, 1996 __________________________ 185
6.4.13 Correlation between the dimensions based on the total sample and the subsample of 1996 186
6.4.14 Correlation between the dimensions based on the total sample and the subsample of 1999 186
6.4.15 Correlation between the dimensions based on the total sample and the subsample of 2004 187
6.4.16 Correlation between the dimensions based on the total sample and the subsample of 2009 187
6.4.17 Quintiles and other descriptors of the dimensions of corporate performance ___________ 188
6.5 Correlation between the perception of environmental uncertainty and
firm performance ______________________________________________________ 189

6
FIGURES
FIGURE 1: The Basic Research Model _______________________________________ 11
FIGURE 2: The linkages of competitiveness in macro and micro level approaches _____ 13
FIGURE 3: The research model based on the Configurational School _______________ 23
FIGURE 4: The levels of the external environment and related strategic tools _________ 24
FIGURE 5: The change of Hungarian GDP between 1987 and 2009 ________________ 25
FIGURE 6: The dimensions of the macro environmental analysis – PESTEL __________ 26
FIGURE 7: Industrial life cycle model ________________________________________ 27
FIGURE 8: Organisational growth phases ____________________________________ 28
FIGURE 9: Comparison of the adaptation strategies ____________________________ 41
FIGURE 10: Sustainable corporate growth _____________________________________ 47
FIGURE 11: The research model and the hypotheses _____________________________ 61
FIGURE 12: Sample size of the single surveys ___________________________________ 69
FIGURE 13: Size by Full-time employement (FTE) categories ______________________ 72
FIGURE 14: Size by revenue categories (at price levels on 2008. 12. 31.) _____________ 73
FIGURE 15: Size by assets categories (at price levels on 2008. 12. 31.) ______________ 74
FIGURE 16: The distribution of the sample by export rate _________________________ 75
FIGURE 17: The distribution of the sample by the type of the majority proprietor ______ 77
FIGURE 18: The distribution of the sample by the main line of business ______________ 78
FIGURE 19: The distribution of the sample by territorial position ___________________ 79
FIGURE 20: Sources of uncertainty ___________________________________________ 81
FIGURE 21: Changes in sources of uncertainty _________________________________ 82
FIGURE 22: How much do we perceive the present more uncertain than the past? ______ 84
FIGURE 23: Similar distribution of the firms’ adaptation ability
between periods 1992-1995 and 2005-2008__________________________ 89
FIGURE 24: The strategy followed ___________________________________________ 91
FIGURE 25: Consciously followed strategies 1992-2009 __________________________ 92
FIGURE 26: Level of firm performance compared to the main competitors ____________ 96
FIGURE 27: Explained variance of clusters and elbows in case of 2-10 solutions ______ 106
FIGURE 28: Explained variance of clusters and elbows in case of 10-120 solutions ____ 109
FIGURE 29: The connection between efficiency, effectiveness and growth ___________ 145

7
TABLES
TABLE 1: The possible advantages, disadvantages of the adaptation strategies ________ 34
TABLE 2: Evolutionary theories _____________________________________________ 38
TABLE 3: Corporate strategies based on the innovation and entrepreneurial orientation 40
TABLE 4: Connection between corporate life cycles and innovation strategies _________ 46
TABLE 5: Classification of change types _______________________________________ 51
TABLE 6: A matrix of strategy content research _________________________________ 57
TABLE 7: Strategic factors based on the surveys of 1996, 1999 and 2004 _____________ 59
TABLE 8: Strategy types based on the surveys of 1996, 1999 and 2004 _______________ 60
TABLE 9: Categories pertaining to the present major proprietor of the firm ___________ 76
TABLE 10: Relation between the judgment of present and past ______________________ 83
TABLE 11: Adaptation ability of the firms between 1992 and 2009 ___________________ 88
TABLE 12: Followed strategy in the past 3-4 years _______________________________ 91
TABLE 13: Followed strategy in the last 3-4 years ________________________________ 93
TABLE 14: Suitability of fitting in case of different dimensions ______________________ 99
TABLE 15: Correlated variables with performance dimensions _____________________ 101
TABLE 16: 6 performance configuration (strategy type) __________________________ 107
TABLE 17: 21 performance configuration (strategy type) _________________________ 110
TABLE 18: Distribution of the 6 cluster-grouping at the single surveys _______________ 115
TABLE 19: Distribution of clusters with more than 10 cases _______________________ 117
TABLE 20: Ambidexterity in the level of population ______________________________ 124
TABLE 21: A broad view of strategic adaptation from 1992 to 2010 _________________ 125
TABLE 22: The results of hypotheses testing ____________________________________ 126
TABLE 23: Value creation with 4 actions ______________________________________ 127
TABLE 24: The script of the qualitative research ________________________________ 134

8
ACKNOWLEDGEMENT
I am grateful to Professor Károly Balaton, who had trust in me, helped me to start and
supported me along the way to becoming a scientific researcher and to those who helped me
in this process with their constructive critics and with many other pieces of advice.
The thesis proposal was an important milestone in this process where the constructive critics
of the reviewers and the committee helped me to find the proper focus of my dissertation. The
committee has also pointed out an important fact that defending the dissertation is not the
final goal of the doctoral candidates; the defence is only the first serious watershed in the
scientific work.
I would like thank to the Institute of Management at Corvinus University of Budapest and its
director Professor Miklós Dobák who have inspired me and have ensured the appropriate
environment for creating my dissertation.
Special thanks to the Institute of Business Economics and to the Competitiveness Research
Centre at Corvinus University of Budapest and their leaders: Professor Attila Chikán,
Professor Erzsébet Czakó and Professor Zita Zoltay Paprika who have launched and
continued the ‘In Competition with the World’ research program. I have used the results of
this program that have been generated in the last 15 years.
Hereby, I would like to express my gratitude to OTKA (National Scientific Research Found),
TÁMOP-4.2.1.B-09/1/KMR-2010-0005 project, BKTE Foundation and many company
managers that they have supported my researches.
Finally, I would like to thank the patience and understanding of my family.

9

10
1 INTRODUCTION TO THE INVESTIGATION OF STRATEGIC ADAPTATION
I couldn’t have chosen a worse time for writing my PhD dissertation focusing on corporate
strategy and environmental adaptation, because it is a time of a global financial and economic
crisis, with an extremely sensible influence on Hungary. It is excrescent to investigate
corporate strategy, since it is recession and the enterprises need to focus on survival.
I couldn’t have chosen a better time for writing my PhD dissertation, because it is a time of a
crisis and everyone is looking for a way out. It is indispensable to investigate environmental
adaptation, since it is recession and the enterprises need to focus on survival hence good
decisions worth even more. Reducing expenditures is not a solution for everything; revoking
investments from long term growth opportunities will lead to bankruptcy after the crises.
This is not a paper about the crises, but I’d like to make the best of this opportunity and cross
the borders of the frameworks of traditional management theories. Pettigrew (1985, 1987)
pointed out, that higher level strategic and organisational changes are related to economic
recession.
The dissertation is about strategic adaptation, ambidexterity and competitiveness of the firm
from the point of view of the Configurational School of Strategic Management. My basic
assumption is, that the winners, or survivors are the ones who determine the flow of history,
therefore those organisations that are unable to adapt to the environmental changes, over
perform their competitors, or grow, just slack, show the indications of crises (Angyal, 2003).
Another reason why excellent performance in existing business is important is that in case of
unfavourable changes in the environment, it provides a post to retreat to, or even a base for
transformation. Exaggerated exploitation though comes at a price; it might lead to straining
the business model, losing the organisational support, exploiting the market, losing the
flexibility, and therefore the viability of the company as well. (Adizes, 1992) Therefore it is
important for the sustainable competitiveness to explore new possibilities and to find the
balance between the exploitation and exploration (ambidexterity).
There are a lot of unanswered question in connection with the strategy and performance: (1)
Do the environmental conditions clearly define the right strategy and the corporate
configurations’ competitiveness? (2) How does the change of environmental conditions affect
the strategy and performance? (3) Does the corporate configuration influence the
environment?
11
The sub segments of classic management and organisational sciences have not been able to
answer these questions on their own so far. Strategic management has reached its boundaries
regarding these topics; there is excessive focus on the current performance and weak
connection to the future. Entrepreneurship on its own is neither capable of answering the
question, there is a strong focus on searching for opportunities while efficiency is kept back.
However, with merging the two areas, new perspectives open up in entrepreneurial researches
(Hills et al., 2001, Schendel and Hitt, 2007).
Those enterprises, that are unable to give up their earlier practices and routines when reacting
to the changes of the environment, are likely to drop behind their successfully changing
competitors in performance and in growth as well, and finally even drop out from the
competition. That’s why the question is not about whether change and adaptation are
necessary, but rather how it is achievable to attain a better position through the configuration
processes (Mintzberg et al., 1998). How can everything be kept, which was good in the
previous configuration, and gain and exploit all, which appears as an opportunity in the new
configuration and in the transformation itself?
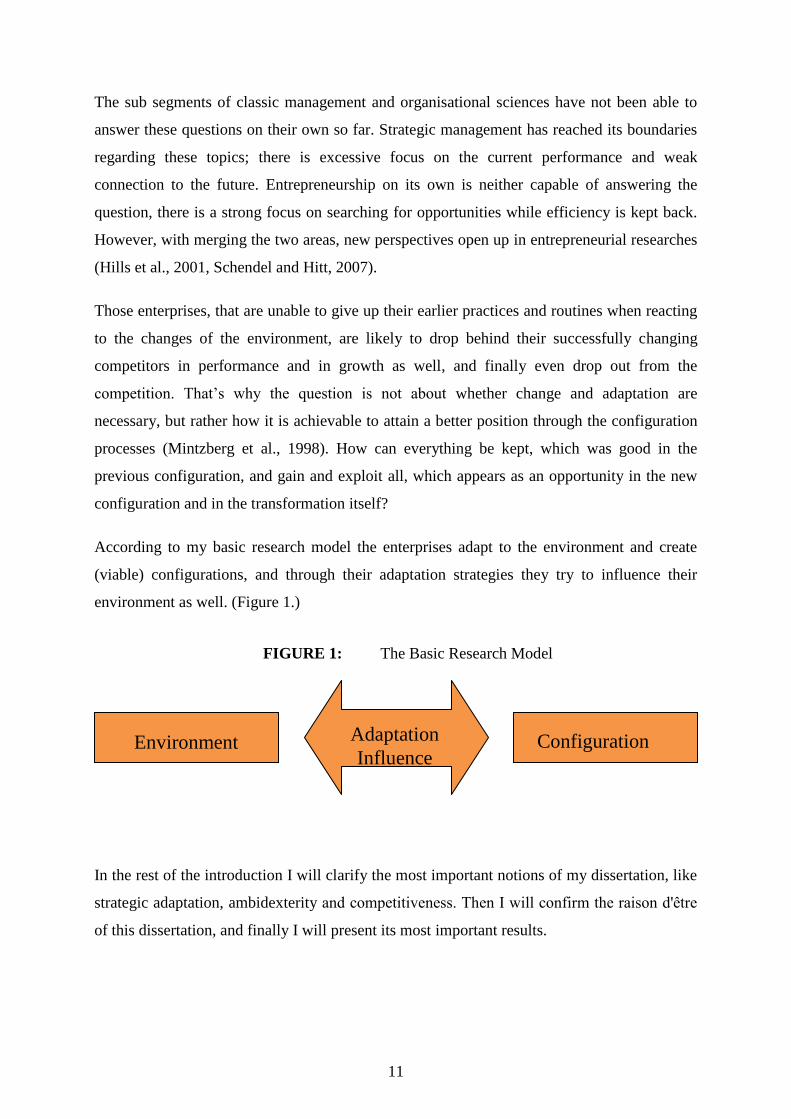
According to my basic research model the enterprises adapt to the environment and create
(viable) configurations, and through their adaptation strategies they try to influence their
environment as well. (Figure 1.)
FIGURE 1: The Basic Research Model
In the rest of the introduction I will clarify the most important notions of my dissertation, like
strategic adaptation, ambidexterity and competitiveness. Then I will confirm the raison d'être
of this dissertation, and finally I will present its most important results.
Environment Adaptation
Influence Configuration

12
1.1 The conceptual framework for strategic adaptation, ambidexterity and competitiveness
1.1.1 Strategic adaptation
Adaptation is the answer of the companies to environmental challenges. Companies basically
either recognise or don’t recognise (in time) the environmental changes. In case they
recognise them, they either find an appropriate adaptation form, configuration to them or
don’t. Moreover some companies are capable of influence their operating environment
actively.
In the dissertation I use two interpretations of strategic as an attribute: on the one hand, it
refers to strategic thinking, at which for example we can think about the will to overcome the
competitors, on the other hand, it refers to strategic management, which incorporates the areas
of planning (analysis and selection) – realization – monitoring – feedback (Balaton et al.,
2007, Balaton et al., 2010). Nevertheless, I take Mintzberg’s 5P (Mintzberg, 1994) as
fundamental, which says that strategy can be a plan, a ploy, a pattern, a perspective or a
position. During the dissertation, I put more emphasis on interpreting the pattern and the
position aspects when examining corporate archetypes, configurations and adaptation
strategies.
Among the strategic schools I use the frameworks of the configuration one, which says that
strategy is nothing else, but the sum of the conversion processes. Within this framework, the
dissertation follows the practice preferred by researchers, so it aims to describe the
configurations formed by different environmental circumstances. On the other hand though,
after carrying out the empirical research, it intends to draw useful results for practicing
managers as well: how to lead changes.
1.1.2 Ambidexterity
A company can be successful on its existing operational areas and can exploit them. In this
case, the company achieved growth in quantitative terms: the sales, the number of employees
and the available tools of the company increase. However growth can be a quality term; and
the quality change is also needed for the maintenance or enhancement of a given level of
performance. The most qualitative change indicates that not only the quantities change, but a
progressive change takes place (Penrose, 1959: 1).

13
Lipitt and Schmitt (1967) emphasise that the company's position in the lifecycle is not
determined by the organisational size, or the number of employees, or the market share, but it
is rather determined by how the leaders face the various organisational crises.
When solving crises the successful embracement of new possibilities has a key role without
the destruction of the existing areas. Companies meet a lot of “creative destruction’
(Schumpeter, 1980) ideas during their explorative activities; however the real challenge for
them is not the pure implementation of these ideas, but the successful running and
construction of the existing and new fields at the same time.
Summarizing the concept of ambidexterity, it ensures success for a company on its existing
fields (exploiting) and on its new business fields (exploring) at the same time.
1.1.3 Competitiveness
The concept of competitiveness is defined by Chikán and Czakó (2009) in two major levels:
macro and micro levels. The connections of the macro and micro approaches are shown by
Figure 2.
FIGURE 2: The linkages of competitiveness in macro and micro level approaches
Increasing social welfare
Dual value creation:
consumer satisfaction + profit
Increasing productivity
Organisational
capabilities
Factors of production; Demand factors;
Corporate strategies, Structures,
Comptetition; Related and supporting sectors
Government
Social normsMacroeconomic
policies
Social
institutions,
civil society
Glo
bal com
peti
tion
Glo
bal c
om
petitio
n
Source: Chikán and Czakó, 2009: 80

14
On macro level “the competitiveness of a national economy is that it can create, use and
between the frames of the global competition sell products and services and this way the
welfare of its citizens and the increment of its own production factor grows in a sustainable
manner.’ (Chikán and Czakó, 2009: 77)
On micro level “the competitiveness of companies is that they offer products [goods and
services and ‘solutions’ included both of them] to the consumers with the compliance of
social norms, and the consumers are willing to pay a more profitable price to the company
than to the competitors. This implies that the company should be able to adapt to the external
and internal environmental changes, and get a better fit to the new regulations than the
competitors.’ (Chikán and Czakó, 2009: 78)
The key element of the definition is the adaptation of the companies which is analysed by the
“In competition with the World’ research program in 4 areas: (1) strategy, (2) leadership and
decision-making, (3) value creation and (4) inter-company relations. In my dissertation I am
focusing on the first dimension, namely the strategic adaptation.
1.2 The justification of the dissertation and the most important results
The research of the strategic adaptation and the configurations of the organisations are well
established, although several research questions are still needed to be answered in the
relations between the environment, strategy and performance: (1) Is the environment
determines the strategy, and the competitiveness of the configurations? (2) How do the
environmental changes influence the strategy and the performance of the organisation? and
(3) Can the configuration of an organisation influence its environment?
Based on that literature review the question may rises in the reader whether is it possible to
discover new element by examining this phenomenon any further? Is it still timely to develop
the field? I believe that the answer is yes for both questions mainly because it is time to
change:
from static to dynamic approaches,
from short term focus to longitudinal researches with extreme environmental
situations,
from the examination of bi-variant relations of firm characteristics in order to
understand the complex configurations as a whole phenomenon,

15
from US base researches to the research of emerging markets (like Hungary),
from simple description of firm behaviour to theory development by hypotheses
development and testing,
from replicatory studies and principle component analysis to up-to-date research
design and methodology (like multidimensional scaling).
Summarising it, in my dissertation I make an attempt to study thoroughly the strategic
adaptation of the Hungarian companies between 1992 and 2010 with an up-to-date
multivariate research design with the aim of providing answers to the above mentioned
research questions. In particular, I examine the following elements in detail:
the environmental changes and the sources of environmental uncertainty,
the perception of environmental changes and the capability to influence the
environment,
the deliberative strategies followed by the organisations,
the performance of the organisations compare to their main competitors, and from that
the latent performance dimensions and configurations, and
the relations between the above mentioned variables, hypotheses.
I believe that my research makes three main contributions for scholars, practitioners and
policy makers. The main contributions of the the dissertation are the following:
Examination of the strategic adaptation phenomeon on a relatively wide range of
litereature. Hypotheses were formulated on the basis of deductive methodology. The
hypotheses were tested, 6 got approved, 2 got modified, and one got denied.
Critical assessment of the literature and former research made on strategic adaptation
led to the formulation of an up-to-date and integrated research design.
Development of theory by providing answers to the main research questions: (1) In a
given environment not only on, but more configurations are viable, (2) but in different
environmental circumstances different configurations are dominant. Moreover (3)
companies with larger financial, market and lobby power, and with higher
organisational capabilities, network position and lower product orientation are more
capeable to influence their environment.

16
2 THEORETICAL FOUNDATION OF THE RESEARCH
2.1 The roots in strategic management
2.1.1 The Schools of Thought in strategic management and strategic adaptation
Mintzberg et al. (1998) identified 10 schools of strategic management (10 Schools of
Thought). They differentiate between two categories in this regard: the one is the prescriptive
schools (the Design, the Planning, the Positioning and partially the Configurational school),
which attempt to identify directions for action on the part of the corporate strategy based on
an assessment of the company’s current situation and that of the environment within which it
operates. The second one is the descriptive schools, which simply attempt to understand the
historical reasons why a given company is where it is at a particular point in time. As such,
the descriptive schools (the Design, the Planning, the Positioning and partially the
Configurational school) endeavour to describe the creation of the strategy as extensively as
possible, and leave the decisions to the strategists.
In the forthcoming part a short introduction about the schools of strategic management will
come based on the works of Mintzberg et al. (1998), Elfring and Volberda (1997), and
Volberda and Elfring (2001). I will attempt to interpret each of them in terms of their
relevance to adaptation. In the course of introducing adaptation I also present my own
interpretation that incorporates my earlier published research results as well.
According to the Design School strategy is a result of a conscious, monitored, easily
perspicuous, nevertheless merely formalized designing process. Strategy is unique; it covers
the questions of what and how. The creation and the realization of the strategy differ in time,
adaptation evolves through the evaluation, selection and realization processes of strategy.
In the case of the Planning school, unlike the previously described one, strategy creation is a
strictly and fully regulated process. It’s characterized by the SWOT and the portfolio matrix,
in theory, the responsibility is in the hands of the top management, practically it is taken by
the planning staff, who divides the strategic goals into actions. The adaptation strategy is
formulated in the course of detailed calculations, and the path leading to the organisational
goal is also planned.
At the Positioning School the aim of the strategy creation is to define the position of the
company on the market. Based on a detailed analysis, the conscious formation of the goals
comes to the front, while the way leading there is pushed into the background. The adaptation

17
strategy is formulated in the course of detailed calculations, and is related to the market
positions, primarily on the level of the strategic groups. The representatives of the Positioning
School have worked out a detailed methodology to identify the archetypes of strategic
adaptation, which has been elaborated by the representatives of the configurational school.
Based on the Entrepreneurial School, strategy is the result of conscious and spontaneous
vision-creation processes. Strategy is the vision of the leader, the organisation acts upon that.
Strategy only builds partially on consciousness, rather on experience, experimental learning
and intuition, which is accompanied by the personal commitment of the leader. The focus of
the growth is either the vision or the mission of the company. The changes mostly occur in
turnaround strategies. It is important to note that the representatives of the Entrepreneurial
School presume that corporate leaders are not only able to accept the challenges of the
environment, but to influence this environment under proactive behaviour as well. I also build
on this fundamental assumption and I analyse it in details in my dissertation (the middle
element of the research core model – Figure 1).
In the perception of the Cognitive School, strategy is created in the process of getting to know
the environment exploring and handling strategy. This process is highly dependent on the
personality of the leader and the already existing strategy is difficult to change. Therefore
adaptation capability is either a natural characteristic of the strategist, or there is a need for a
change in the strategist’s profile.
The followers of the Learning School create their strategy as a result of a collective, constant
learning process, based on the assumption, that the environment is complex and
unpredictable. The task of the leadership is to foster the process (socialization,
externalization, combination, internalization) of learning. Adaptation is an important issue of
the Learning School, but not necessarily in a form that is measurable with (financial)
performance indicators, rather through the ability of gaining, storing and recalling individual
and organisational knowledge.
The Power School considers the creation of strategy as a bargaining process between the
power forces, the different interest-groups of the company (shareholders and stakeholders).
Persuasion, conviction, blackmail, obedience, coalition and confrontation each take a role in
shaping the strategy. In the Power School, strategic adaptation can often be connected to the
dominant coalition.

18
The Cultural School shows similarities with the Learning and Cognition Schools, but it puts
the emphasis on the collective and cooperative processes. The signals coming from the
environment are decoded by the whole community. Besides personality, organisational
culture gets a prominent role in building a strategy. The stabilization of the organisational
culture however, often triggers inertness and leads to stagnation. It is a great leadership
challenge to ‘regularly vivify’ the organisation, that is to build such an organisational culture
in which change is permanent.
The Environmental School is based on the assumption, that the enterprises are totally
vulnerable to the environment. The strategy creation happens during a selection process and
could be regarded as a reactive process. The task of the leader is to foster the adaptation. The
positions remain the same as long as the environmental situation ‘allows’, therefore strategy is
nothing else, but subsequently justified luck. In this interpretation good organisational
performance is only a consequence of the favourable environmental circumstances.
The Configurational school approaches strategy formation as a process of transformation. On
the one hand, strategy creation depends on the organisational configuration, on the other hand
though, strategy is a transformational process aimed at altering the configurations. In this
interpretation the task of the leadership is to find and lead the organisation into the –
environmentally – appropriate configuration. During growth, life cycle stages can be
identified, among which the evolution stages require quantitative changes, while the
revolution stages require qualitative alterations.
As I previously wrote in point of Positioning School, the representatives of the school have
worked out a detailed methodology for identifying the archetypes of strategic adaptation,
which has been brought to perfection by the representatives of the configurational school. In
the practical part of my dissertation I build upon this methodology and I discuss it in details in
the methodological part.
Mintzberg et al. (2005: 407) argue for taking the strategic schools into consideration
simultaneously when creating a strategy, because the schools on their own are not able to
provide a complex picture of the observed phenomenon. The authors see the unification of the
strategic schools in the Configurational school (2005: 407) which arranges the diversified
literature.

19
Elfring and Volberda (1997) found the division of Mintzberg too fragmented, and since there
are significant connections and similarities between the certain schools, they suggested a
three-part division: (1) the Boundary School, (2) the Dynamic Capability School and the (3)
Configurational School.
The Boundary School examines two main issues: (a) where can the boundaries of an
organisation are drawn and (b) how should be managed across the divide with other firms?
Regarding the last one, the trust between the participants and the analysis of the strategic
alliances get a significant role. This school shows similarities with the Positioning, the
Cognitive, the Cultural and the Power School of Thought of Mintzberg.
The main questions of the Dynamic Capability School are: (1) how and with whom do the
companies compete, and (2) how do they sustain competitive advantage over time? Its special
research results appear in the formation of modular products and organisational structure and
in the proof for the competition generating effect of organisational learning. It shows
coherency with the Design, the Entrepreneurial, the Learning and the Environmental School
among the Schools of Thought Mintzberg.
The Configurational School concentrates on identifying the archetypes of organisations and
strategies, and to understand the transition between the separate types. Its important areas are
the researches about the enterprise life cycle stages, and driving incremental and quantum
(radical) changes. Mintzberg et al. themselves pointed out, that this school has connection to
almost all Schools of Thought, but the strongest relations stand with the Power, the
Environmental, the Learning, the Cognitive and the Entrepreneurial School.
It is important to note, that I don’t question the equity of the grouping of the Mintzberg
schools, but during my research I would like to draw attention to its deficiency, namely, that it
doesn’t place strategic adaptation appropriately in the literature. In this chapter I gave a short
review about the connection of the strategic schools and the picture formed about growth, and
later on I intend to reveal even deeper connections with reference to the Configurational
School.

20
2.1.2 Choosing between the strategic schools based on thematic fit and my previous
research experiences
Kieser (1995) in Organisation Studies and Scherer (2002) draws attention to the fact how
important it is, that the researches determine on which school they would like to base their
standpoint. Making the choice unambiguous helps the understanding and the possibility of
giving constructive feedback as well.
I defined two aspects for choosing between the schools: (1) how suitable it is for examining
the topic and (2) how much it is supported by my earlier knowledge and competence.
According to the first aspect, the Configurational School has the most potential, because on
the one hand it especially examines the question of strategic adaptation on the strategic
archetypes, and through the configurations, and on the other hand, it manages the statements
of the other schools jointly. In order to answer the second question it is worth reviewing my
earlier publications relevant to this topic.
I’ve started my doctoral studies at the PhD Program in Business Administration at Corvinus
University of Budapest under the supervision of Prof. Károly Balaton, in strategic
management specialisation in 2005. At the same time, I have started to work at the Institute of
Management under the leadership of Prof. Miklós Dobák. I have been involved in teaching
various courses as well as in participating in scientific research projects led by Prof. Dobák
and Prof. Balaton. Therefore it is beyond doubt that both had a significant influence on my
PhD research. Both professors have inspired my continued devotion to the learning process,
helped on the way of discovery, and provided early critiques on my work. Thank you for your
sincere guidance and continued support in all ways.
Of course, long discussions with my colleagues at the Institute of Management also had great
impact on my work. Among others (in alphabetical order) I owe acknowledgement to Ádám
Angyal (general and crisis management), Gyula Bakacsi (organisational behaviour), Lilla
Hortoványi (entrepreneurial management), Sándor Kovács (organisation studies) and Ernő
Tari (strategic alliances).
In the past few years I have been involved in several major research projects, where I gained
significant experience and managed to publish individually and with co-authors. The research
projects with the greatest impact on my personal development were (going backwards in
time):

21
from 2010, ‘Knowledge based economy in Hungary’ TÁMOP-4.2.1.B- 09/1/KMR
thematic research, research coordinator in ‘Innovation in the SME sector’ subproject,
head of research: Prof. Károly Balaton
from 2007, ‘Effective business strategies in different corporate life cycles’, OTKA
thematic research, researcher: CUB Institute of Management, head of research: Prof.
Miklós Dobák
2006-2008, ‘Regional role and innovation activity of Hungarian centred and governed
enterprises in order to increase competitiveness’, OTKA thematic research, researcher:
CUB Institute of Management, head of research: Prof. Károly Balaton
from 2005, ‘In competition with the World’ research program, CUB Competitiveness
Research Centre (CRC), researcher: CUB CRC, head of research: Prof. Attila Chikán
2004-2005, ‘Corporate learning and strategy formulation at SMEs’, researcher: SZE
Department of Marketing and Management, head of research: Ilona Papp, PhD
2004, ‘Influencing factors in entrepreneurial activity and growth’, researcher: SZE
Department of Finance and Accounting, head of research:, Szilveszter Farkas, PhD,
PTE Department of Business Economics and Accounting, head of research: László
Szerb, PhD
Because of the limits of the dissertation I will not specify the results of each research, but I
will build in the relevant parts of them in the theoretical and practical parts of my dissertation.
Due to individual and common interest, I have had the privilege to carry out research in the
framework of each and every schools of strategic management connecting the empirical
results with other local and national findings:
Design School and Planning School – Szabó and Hortoványi 2005, Szabó 2005a, 2006
Positioning School – Szabó 2005b, Hortoványi and Szabó 2006b, Hortoványi et al.
2006, Szabó and Vida 2009
Entrepreneurial School – Hortoványi and Szabó 2006a and c, 2007, 2008a, Szabó et
al. 2009, Hortoványi et al. 2009, 2010
Cognitive and Environmental School – Szabó 2008
Learning and Cultural School – Hortoványi and Szabó 2006e
Power School – Balaton et al. 2010
Configurational School – Balaton et al. 2010, Szabó 2008, Hortoványi and Szabó
2006b and d, Szabó and Dobák 2009

22
Although my involvement as a researcher was dispersed, my interest turned gradually towards
the in-depth study of Configurational School. Exploiting fortunate situation that my
professional and my personal interest had met in the very same research focus, over time my
enquiry became absorbed in this field. In the following I will introduce the basic ideas of the
Configurational School and later on I will build my arguments on this foundation.
2.1.3 The Configurational School
According to the starting point of the school, the strategy and the organisation form a stable
configuration dependant on the context. With the change of the context, for example the
growth or the crisis of the industry or the enterprise, various other (new) configurations can be
regarded stable. There is a transition process between the different stability phases, which
generate significant rise (Miller, 1985). The patterns of the configuration transformations are
more or less regular; these can easily be demonstrated with life cycle models (cf. Greiner,
1972).
The task of strategic management is to drive changes during maintaining equilibrium and
achieving stability. The process and the content (plan, ploy, pattern, perspective, position) of
the appropriate adaptation strategy depends on the environment, hence each configuration can
be right depending on the context.
The Configurational School can be divided into two main areas. On the one hand it describes,
that the strategies and the organisations adapt to the environment, and they take up a position
according to that. On the other hand it assesses the successful alteration strategies between the
transitions (Mintzberg et al., 2005: 328-377).
A good example for the examination of the Configurational School could be the appearance
of a new product, technology or business model that could significantly alter the existing
market structure or might bring new industries to life. These phenomena are worth examining
on strategic level (Klepper and Graddy, 1990). Both the international (cf. Miles and Snow,
1978, Porter, 1993) and the Hungarian (cf. Antal-Mokos and Kovács, 1998, Antal-Mokos and
Tóth, 2001, Hortoványi and Szabó, 2006b) strategic researchers have been concerned about
the environmental adaptation and strategic behaviour of enterprises for a long time. I consider
it important to specify the previously discussed basic research model, which shows the trinity
of environment – adaptation – configuration (Figure 1), to be able to continue the analyses.

23
Under environment I mean environmental changes and the sources of environmental
uncertainty. Under adaptation I mean the perception and the ability to influence
environmental changes. I interpret configurations as strategy patterns, performance
configurations and strategic archetypes.
At first in the dissertation I examine the changes of each factor between 1992 and 2010, and
then I enlighten the linkages among these factors. The created research model based on the
Configurational school is shown by Figure 3.
FIGURE 3: The research model based on the Configurational School
Environmental
changes and
uncertainty
Perception and
influence of the
environmental
changes
The strategy
followedPerformance
configurations
I go through hereunder the discussion of the theoretical part of the dissertation based on the
elements of the research model on the order of (1) the environmental changes and uncertainty,
(2) the perception and influence of environmental changes, (3) the strategies followed and (4)
the performance configurations.

24
2.2 Environmental changes and uncertainty
2.2.1 The changing macro environment and the sources of uncertainty
Strategic management examines the external environment on three levels: macro
environment, industrial environment and direct competition environment. The internal
environment is determined by the resources and abilities. There are existing analyzing
methods for each level which are demonstrated on Figure 4.
FIGURE 4: The levels of the external environment and related strategic tools
Source: Balaton et al. (2007)
The more proactive an enterprise is, the better it can cut itself adrift from the external
environment. However a global crisis affects almost everything and generates a significant
change in the structure of the industry as well. In the middle of the 1970’s the global economy
showed the sign of the large corporate structure not being the primary factor in facilitating
development. Cornelius et al. (2006) suppose that two consecutive oil crises caused the
increase of the role of the small enterprises.
PESTEL model
Porter’s diamond model
Strategy group analysis
Competitor analysis
Porter’s 5 forces
Industry life cycle
Macro environment
Industry environment
Direct competition
Organisation

25
Several large enterprises were strike by serious economic difficulties and unemployment
became one of the main problems of the western societies. Besides that, the large corporations
seemed to be more inflexible and slower during the adaptation to the new market conditions
and in exploiting breakthrough innovations.
Carlsson (1992) found two major explanations why the researchers turned their attention
towards smaller enterprises: on the one hand the change of the global economy (in connection
with the strengthening of the global competition, the increase of uncertainty and the
fragmentation of the markets), on the other hand the change of the characteristics of the
technological processes. The global financial crises that burst out in 2008 and the demand
crises following that drew the attention again to the macro environment and environmental
adaptation in the significant industries.
The global crises didn’t avoid Hungary either, moreover the researchers say that it even stroke
Hungary harder because of its defencelessness (MKT, 2009). The effect of the crisis on the
GDP is shown on Figure 5.
FIGURE 5: The change of Hungarian GDP between 1987 and 2009
Source: data of the national accounts (KSH) and quoted the prognosis of the Hungarian National
Bank (MKT, 2009)
Hungarian enterprises had time to prepare for the economic crisis because –as Szabó and
Zetkó (2005) have found – the local economy follows the economic cycles of the USA with a
delay from of half to one year.
Period of Transformation
Battle for Survivor
Stabilization
New Growth path
Crisis
% change (previous year=100)

26
The preparation for the changes of the external environment is well supported by strategic
planning methods, like the PESTEL analysis. The main factors of the method are
demonstrated on Figure 6.
FIGURE 6: The dimensions of the macro environmental analysis – PESTEL
Source: Balaton et al. (2007)
The ones emphasising the role of the external environment think that the other researchers pay
too much attention on the individual characteristics, personality of the entrepreneurs and they
don’t put enough emphasis on the external structural opportunities and pressures. Byers et al.
(1997) for example criticized the studies about entrepreneurship because their authors often
praised highly the founders and top managers, if the business proved to be successful. Several
studies dealing with the establishment and early stage of the innovative organisations showed
tight connection with the environmental conditions and the evolvement of the new
organisation (cf. Kimberly, 1979).
Organisation
Political
Economic Legal
Technological
Social Environmental
Political stability
Taxation policy
Commercial Agreements
… Property law
Labour law
Antitrust legislation
…
GDP grow
Inflation
GNI
…
Technological level
Innovations
The speed of technology
transfer
…
Consumer behaviour
Norms and values
Social mobolity
…
Recycling policy
Green organisations
Energy consumption
…

27
Moreover referring to those discussed previously at the Environmental School, every
company is fully vulnerable to their environment and hence above-average corporate
performance is only the consequent of favourable environmental conditions and the proper
adaptation to them.
2.2.2 Changes and uncertainty derived from industrial and organisational growth
The examination of the industrial life cycle aroused the attention of several scientists (cf.
Klepper and Graddy, 1990, Gort and Klepper, 1982). Richard N. Foster’s (1986) publication
was the first where the adapted version of the life cycle appeared: “the S curve of the
industrial life cycle’ in which the industries dynamically change similarly to the products. The
four stages (Figure 7): (1) the initiative attempts, (2) boom and consolidation, (3) maturity and
(4) obsolescence and decline.
FIGURE 7: Industrial life cycle model
Source: personal edition based on Foster (1986) and Davidsson (2004)
Several researchers dealt narrowly with the issue of corporate growth, one of the most popular
ones is the classical model of Larry E. Greiner (1972 and 1998) which stood the test of time.
Greiner stated that the enterprises usually go through the same development phases during
their growth. Moreover, each phase can be divided into two parts: the lingering evolutionary
start phase, which after reaching a critical mass turns into a revolutionary phase (Figure 8).

28
FIGURE 8: Organisational growth phases
Source: personal edition based on Greiner (1998)
While the evolutionary phase is characterized by stable and balanced growth, the
revolutionary phase that replaces the previous one is characterized by chaos, uncertainty and
changes. Calm days and stable growth don’t mean that the company doesn’t have to take an
effort to maintain growth. According to Greiner the word evolution ‘describes’ best that the
company is in constant growth, although growth stands for small scale development,
incremental changes. The gradual growth is interrupted with rebellions in all cases: the earlier
management practices become inadequate. The transformation pressure ripples across the
whole company: the organisation has to go through a change covering almost everything.
Those enterprises that are unable to give up their earlier practices and routines are likely to
drop behind their successfully changing competitors in performance and in growth as well
and finally even drop out from the competition. The growth phases are demonstrated on
Figure 8.
Greiner modelled the career of the enterprises depending on two factors, the age of the
enterprises and their number of employees. Time is not the only determining factor of the
structure for him: those enterprises whose size doesn’t grow can keep their leadership
characteristics, governing and organisational tools on the long term without crises. The
summary of the statements of Greiner is the following:

29
Growing organisations go through typical phases, which have unique characteristics,
systems and leadership.
Calm and critical periods follow each other during the career of the company. Each
life-cycle stage starts with a balanced evolutionary phase and ends with a
revolutionary phase full of changes concerning the significant characteristics of the
organisation.
The management of the revolutionary phase determines the further development of the
organisation: if the leader can change and cancel the malfunctioning practices of the
past and introduce palatial leadership and organisational alterations, the company
steps into the next stage, development phase, if he can’t, the performance of the
company presumably decreases, it gets into crises and with time it either ends or gets
acquisitioned.
The ones solving change successfully arrive into a calmer evolutionary phase again.
The findings of Burgelman (1991) partially contradict the statements of Greiner, saying that
the more complex a company the more complicated the creation, understanding and the
acceptance of strategy and the assurance of internal coherence are. Examining from Greiner’s
aspect, realizing the growth strategy and effectively defeating the obstacles of growth are not
possible if the complexity of the organisational structure is not in correspondence with the
growth phase of the company. It is the configuration of the organisational structure
corresponding the maturity level that ensures the accomplishment of the strategy.
As it is demonstrated on Figure 8, the critical task for the leaders in the revolutionary phases
is to find those new methods that create the next evolutionary phase. Paradoxically the
emerge of the next revolutionary phase is the result of the changes carried out to answer the
challenges of the earlier revolutionary phase – for example choosing delegation indicates the
control crisis. Development crises thus can be predicted.
This statement is extremely important from the aspects of leadership and strategy because the
critical periods are predictable and repetitive so leadership can prepare for the problems and
take steps for prevention. In this way the revolutionary phases can probably be prevented or at
least shortened.

30
The growth phases have a strong connection with the external environment of the company:
the evolutionary phases are relatively shorter in rapidly growing industries, while they are
much longer in the mature or more slowly growing industries. Merging this line of thoughts
with the ideas of Balaton (2005a) we can assign shorter phases to the transformation and
emerging markets as well.
Péter Szirmai (2002b) mentions three levels of the observation of the development phases: the
macro level (bird’s eye view), where the development phases are defined on the analogy of
human age (infancy, youth, maturity, old-age), the mezzo level, which he calls the researcher
level and defines as the researcher description of the development career of the company, and
finally the micro level, where various phases follow each other at the certain companies.
Szirmai states, that the interesting question during the examination of the development career
is how to lengthen, higher or moderate decline or what interventions might help in avoiding
the radical turns.
This question is also examined by the entrepreneurial management and corporate
entrepreneurship theories, where the study of the constant renewing ability of the company is
significant (cf. Barringer and Bluedorn, 1999, Burgelman, 1984, 1983a and b).
Entrepreneurship and corporate entrepreneurship are such behaviours, or corporate behaviours
that generally appear in looking for new opportunities and revealing new advantages.
Building on the ideas of Herbert Simon as well, entrepreneurial orientation comes to the front
at the birth and maturity phase of the enterprises, because the establishment of a new
enterprise means the introduction of a new economic activity, which generates change in the
industry (Davidsson, 2004). Entrepreneurship thus generates radical changes – as Davidsson
emphasises – “leads the market processes’. So entrepreneurial growth is not a quantitative
change, but such a new supply that results in a quantum leap, that’s why it is typical at the
initial attempts that generate the formation of an industry and at the renewal of mature
industries (Figure 7).
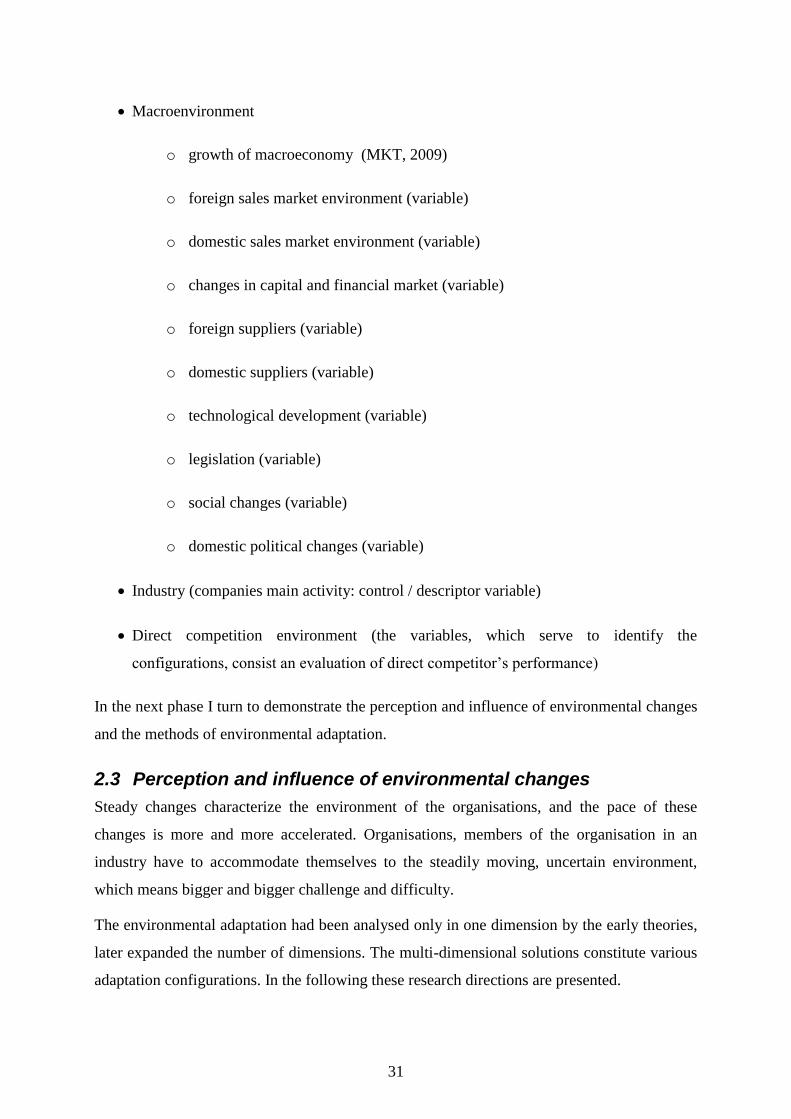
In the theoretical and empirical part of my dissertation I examine the following elements of
environmental changes and uncertainty of their own and according to their temporal evolution
and connections to the other variables.
31
Macroenvironment
o growth of macroeconomy (MKT, 2009)
o foreign sales market environment (variable)
o domestic sales market environment (variable)
o changes in capital and financial market (variable)
o foreign suppliers (variable)
o domestic suppliers (variable)
o technological development (variable)
o legislation (variable)
o social changes (variable)
o domestic political changes (variable)
Industry (companies main activity: control / descriptor variable)
Direct competition environment (the variables, which serve to identify the
configurations, consist an evaluation of direct competitor’s performance)
In the next phase I turn to demonstrate the perception and influence of environmental changes
and the methods of environmental adaptation.
2.3 Perception and influence of environmental changes
Steady changes characterize the environment of the organisations, and the pace of these
changes is more and more accelerated. Organisations, members of the organisation in an
industry have to accommodate themselves to the steadily moving, uncertain environment,
which means bigger and bigger challenge and difficulty.
The environmental adaptation had been analysed only in one dimension by the early theories,
later expanded the number of dimensions. The multi-dimensional solutions constitute various
adaptation configurations. In the following these research directions are presented.
32
2.3.1 A single dimensional approach to the environmental adaptation
Based on the contingence theory, a proper strategy, structure and behaviour can be found to
the given situation, which results in maximum output (Dobák and Antal, 2009). Chandler
(1962) pointed out that the environment of the firm determines the strategy, which is followed
by the structure. Chandler supposed that there is a casual connection between the growth
strategy and the managing structure of the enterprises: the structure follows the strategy.
The thesis of Chandler can be made perceptible as a linear sequence of the events: new
strategy beginning of managerial problems decrease in economic performance (at least
falling behind the possible) developing the new structure return to the suitably profitable
level. (Antal-Mokos et al., 1997)
Burns and Stalker (1961) examined the environment of the enterprises and the organisational
support of the innovation, and came to the conclusion that in static environment the
mechanical structures, but in dynamic environment the organic structures are efficient.
Based on previous results Lawrence and Lorsch (1967) came to the conclusion that, the
different subsystems of the organisation are exposed to different environmental effects, whose
dynamics are also different. While the R&D faces typically dynamic, the production and the
business operation face typically static environmental conditions, accordingly the efficient
organisation structures of the certain functions are also different. So there can be both organic
and mechanic organisational units in one organisation. The important task of the management
is to coordinate efficiently the different systems.
Child (1972) changed the reactive picture about the environmental adaptation. He pointed out
that not only the environment can have influence on the firm, but the enterprise can also
influence its environment. The top managers of the firm, who has influence on the strategy
and structure (dominant coalition) of the enterprise, have a chance to choose, and if the
environmental conditions are soft enough even to maintain the strategy and structure that is
advantageous for them.
In the dynamic world the international, macro, industrial and micro level changes bring
continuously an effect on the enterprises. The firms can give answers for these challenges in
different ways (Child, 1972, Dobák, 1997, Hortoványi and Szabó, 2006b):

33
Isolation: The enterprise doesn’t follow the environmental changes, it recognizes these
late, and doesn’t react on them consciously.
Legging behind: The enterprise tries to recognize the major environmental changes,
but often gives inadequate answers for these challenges.
Late follower (reactive adaptation): The enterprise often recognizes the major
environmental changes and follows typically a reactive strategy that responds to the
environmental challenges afterwards
Fast follower (preactive adaptation): The enterprise is usually able to forecast the
major environmental changes, and follows a preceding, preparing on time behaviour.
Trend setter (proactive influence): The enterprise is able to forecast the major
environmental changes, prepares itself for those in time and adapts itself to them with
proper responses; it even endeavours consciously to influence the environmental
conditions.
The organisational inertia (the ambition of the organisations not to change their accepted
behaviour without external constraint) is the characteristic of almost all organisations
(Bakacsi, 1996). The endeavour to stability and security rise from the depth of the life of man.
Because of the constraint from the changing environment only those dynamic organisations
will be viable, which are able to prove their maintenance through steady adaptation.
We can consider instinctively that there is an order among the adaptation strategies and the
bigger, more experienced enterprises with more resources endeavour to proactively influence,
while starter companies have to follow the strategies of following or isolation.
But the adaptation strategy followed by the firm, ensues only partly from the possibilities of
the enterprise (how big is the company, which experience does it possess, which resources are
available for it etc.), on the other hand it is a result of a conscious selection. This last one can
be explained by saying that every adaptation strategy has its advantages as well as
disadvantages – however weird it may seem at first reading. I demonstrate some examples for
the advantages and disadvantages of the single strategies in Table 1:
34
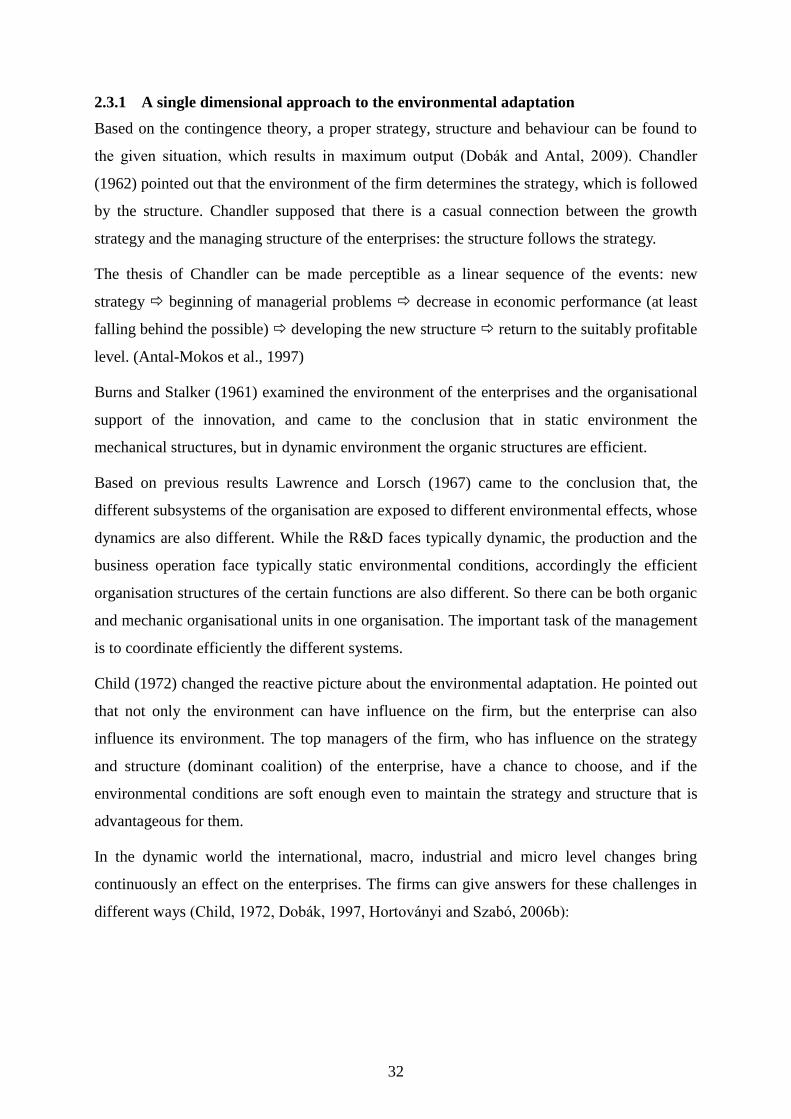
TABLE 1: The possible advantages, disadvantages of the adaptation strategies
Possible advantages Potential disadvantages
Isolation Maintenance of stable
operating conditions
Not following the changes
can have deflation of the
business content as a
consequence.
Legging behind ‘The last become the first’ Legging behind can result in
a lasting dependent relation
Late follower
The acceptance of developed
technologies decreases the
technological risks of those
launching
The late follower can be often
realized at lower profit rate
Fast follower
The imitator spares the costs
and the risk of the
experimental development
(attacker’s advantage)
At entering the market it often
is late for the skimming
possibility
Trend setter ‘The first carries everything’
(first mover advantage)
Developments and the
defender fights are costly and
risky
Source: Balaton et al. (2007)
The complete isolation is a rare event in the business life, nevertheless those enterprises, who
determine the trends are a small, often changing group of the organisations. The typical
strategy is: some kind of following. The proactive strategy is very risky, the return of the
invested time, money, and energy holds out promises with high profit rate, but the return and
profitability isn’t proved at all. The followers step into a more stable, predictable
environment, which is favourable to strategic planning, because the underlying inputs of the
planning are more reliable (their volatility is smaller). The most important advantage of the
imitators is that they avoid several risks, as well as their risk can be managed better.
2.3.2 Proactiveness as a characteristic of entrepreneurial behaviour
Entrepreneurial activity means pursuit of opportunity irrespective to the level and nature of
resources currently controlled (Stevenson, 1983) and as such, it is basically a change and
growth oriented phenomenon.
Entrepreneurs are essential members of the society, but not because of their existence, but
because they are able to create value for the enterprise and the society as well (Low and
MacMillan, 1988: 142). The entrepreneurial activity supports the maintenance of the
company’s competitiveness through value creation, therefore ‘it is critical for the long term
viability of the economy’ (Stevenson, 1983: 3).

35
Entrepreneurial Orientation is an easily identifiable premise of the long term growth of the
enterprise; it is a necessary but not sufficient premise of constant growth (Penrose, 1959: 7)
Most of the entrepreneurs don’t succeed in establishing a company that is self-supporting
(Dess et al., 1997) or capable of potential growth (Vecsenyi, 2003, Ács et al. 2001, 2004).
I examine the concept of entrepreneurship along five factors, which show strong connection
with the topic of strategic adaptation, ambidexterity and competitiveness: innovation,
proactiveness, willingness to handle risk (Knight, 1921, Knight, 1967, Covin and Slevin,
1991, Miller and Friesen, 1983), autonomy and the aggressive competitive behaviour against
the rivals (Lumpkin and Dess, 1996). These five factors determine entrepreneurial orientation.
The last dimension has been criticized because it had been said that the content of competitive
behaviour is completely the part of proactiveness. According to Hortoványi (2010)
competitive aggressiveness is separate from proactiveness and the process of entrepreneurship
is accompanied by definite growth objectives. In the followings I interpret the 5 dimensions in
regard of the perception and influence of environmental changes.
Innovation
In the interpretation of Schumpeter (1912, 1934, 1980) innovation is a significant element of
entrepreneurship. Innovation refers to the creation of new products, services, processes,
technologies and business models (Chikán, 2002). Knight (1967) interprets innovation as the
ability of an enterprise to support creativity and experimenting in order to overcome the
frequent consumer problems. Innovation is not only generating creative ideas, but placing
them on new foundations and launching them on a new growth line.
Proactiveness
Proactiveness refers to the deliberate action orientation, which materializes in activities that
focus on future demands (Covin and Slevin, 1989, Lumpkin and Dess, 1996). Proactive
companies are constantly looking for new opportunities; they are willing to be initiators in
discovering and patronizing new value creating methods (Foss et al., 2006). Proactive leaders
intend to influence the environment, define trends. Proactive leaders generally don’t stick to
conventions and they significantly build on their employee’s creativity (Knight, 1967,
Stevenson and Jarillo, 1990). The proactive behaviour of a company depends on the
entrepreneurial orientation of the leader and the company and therefore it is independent of
the external environmental conditions.
36
Risk-taking
Taking risk refers to the willingness to use significant resources for exploiting such
opportunities that include the risk of expensive failures. The risk and the potential profit or
growth opportunities are proportional (Damodoran, 2007). Sandberg (1992) pointed out, that
entrepreneurs prefer moderate risk taking, so thus they try to avoid both the low and the high
risk situations. They avoid the first, because the easily attainable success usually doesn’t have
significant results, and the later, because its outcome is the question of luck, not the effort.
Entrepreneur leaders endeavour to reach the division of the beforehand estimated risks
(Hortoványi and Szabó, 2006a).
Autonomy
Autonomy refers to the individual or collective independence in the realization of an idea or
theory. Generally it means the ability and will to realize an opportunity. In order to encourage
growth, managers have to provide significant autonomy to their employees on the lower
levels of the hierarchy as well (Szabó, 2005a). Mostly the decentralized organisational
structure and the consumer oriented, open culture are the ones, that enable the company to be
up to the challenge set by the exploration and formation of the application areas of the new
opportunities (Nyström, 1979, 1990).
Aggressive competition and growth orientation
Bojár (2005) named the competitive spirit as the most important indicator of the commitment
to establishing an enterprise or being an entrepreneur. In his research dealing with the types of
entrepreneurs, Vesper (1980) realised that a lot of the leaders are not intended to expand their
enterprises further than they think the controllable size is. Glueck (1980) came to the
conclusion that it is important to make a conceptual differentiation between the
entrepreneurial manager and the founder of a family business. Family businesses principally
build their strategies according to the needs and preferences of the family. Glueck found that
in case of a conflict the demands of the family come to the front against the demands of the
business. Contrarily, the entrepreneurial manager decides to exploit the opportunity for the
sake of the firm and stated growth objectives (Davidsson et al,, 2002, 2006, Carland et al.,
1984, 1988).

37
Based on our experiences, the moderate growth expectations are more common (Hortoványi
and Szabó, 2006a, 2008a) which suit the observation, that the entrepreneurial managers are
cautiously brave so they gradually test the realization possibility of the opportunities.
2.3.3 A multi dimensional approach to the environmental adaptation
The organisations shape configurations as a combined effect of the external and internal
environment, as a consequence of the strategic adaptation. The configuration can’t be
identified based on one factor; the common effects of more elements have to be considered.
Galbraith and Nathanson (1979) pointed out the determining role of the environment in the
necessity of the harmony between strategy and structure, and the importance of the power
structure.
Mintzberg (1989) determined the configuration of the power and the structure in seven
archetypes: (1) the entrepreneurial organisation, (2) the machine organisation, (3) the
professional organisation, (4) the diversified organisation, (5) the adhocracy organisation, (6)
the missionary organisation and (7) the political organisation.
The characteristics of the entrepreneurial organisation are the small team, the fast movement
and the evasion of bureaucracy. The mechanical organisation supports typically mass-
production. The characteristic of the professional organisation is that it doesn’t have middle
management, why its work isn’t controllable. In the diversified organisation more units can be
identified. In the adhocratic organisation the professionals govern, while the missionary
organisation is kept together by common interests and beliefs. The political organisation
exploits the absence of another organising principle and build on the conflicts so without
external constraint it can be stable.
Every environment possesses limited resources, with ‘given capacity’ (Mintzberg et al., 1998:
292). When the industry begins to be ‘saturated’, the fight for resources excludes the less
suitable organisations from the competition. The suitability criteria are determined by the
environment. The consequences of several papers support the ‘power of the environment’
(e.g. Zahra, 1993, Miller and Friesen, 1983).
Evolutionary economy uses the model of natural selection in connection with the appearance,
subsistence and rootedness of the variations in the economic population, emphasising the
evolutionary dynamics of the processes, which influence the variety of the organisations
(Singh and Lumsden, 1990).
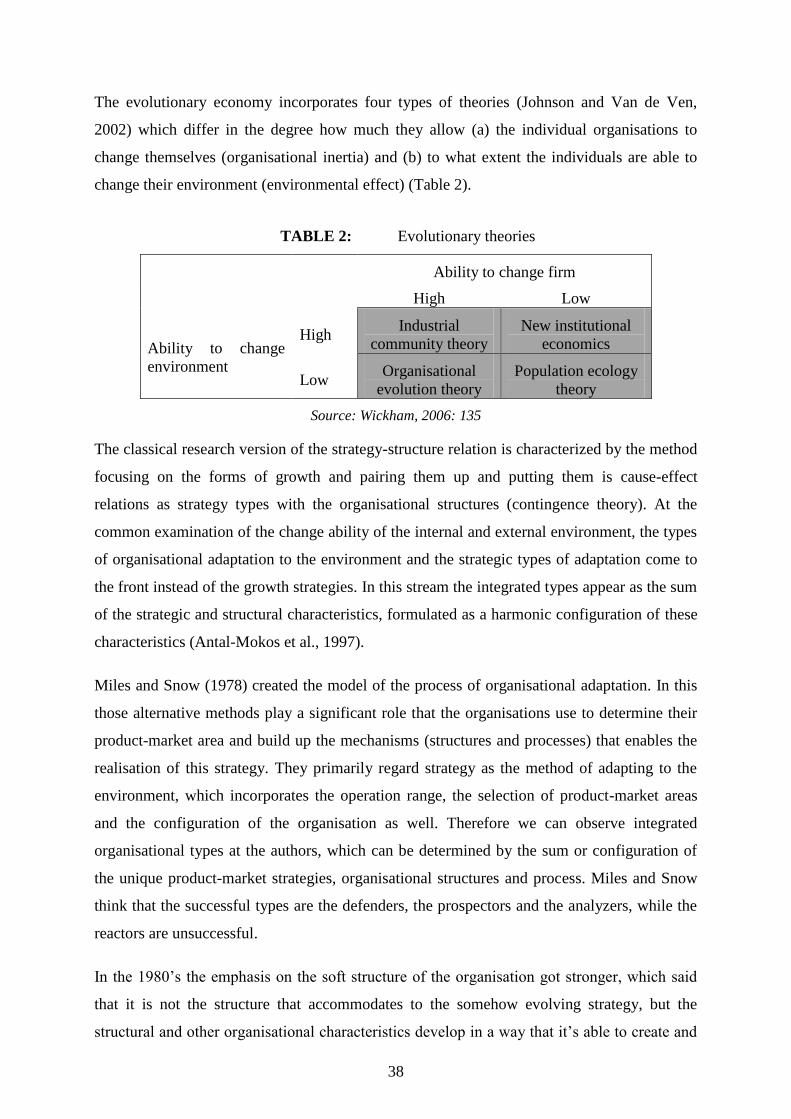
38
The evolutionary economy incorporates four types of theories (Johnson and Van de Ven,
2002) which differ in the degree how much they allow (a) the individual organisations to
change themselves (organisational inertia) and (b) to what extent the individuals are able to
change their environment (environmental effect) (Table 2).
TABLE 2: Evolutionary theories
Ability to change firm
High Low
Ability to change
environment
High Industrial
community theory
New institutional
economics
Low Organisational
evolution theory
Population ecology
theory
Source: Wickham, 2006: 135
The classical research version of the strategy-structure relation is characterized by the method
focusing on the forms of growth and pairing them up and putting them is cause-effect
relations as strategy types with the organisational structures (contingence theory). At the
common examination of the change ability of the internal and external environment, the types
of organisational adaptation to the environment and the strategic types of adaptation come to
the front instead of the growth strategies. In this stream the integrated types appear as the sum
of the strategic and structural characteristics, formulated as a harmonic configuration of these
characteristics (Antal-Mokos et al., 1997).
Miles and Snow (1978) created the model of the process of organisational adaptation. In this
those alternative methods play a significant role that the organisations use to determine their
product-market area and build up the mechanisms (structures and processes) that enables the
realisation of this strategy. They primarily regard strategy as the method of adapting to the
environment, which incorporates the operation range, the selection of product-market areas
and the configuration of the organisation as well. Therefore we can observe integrated
organisational types at the authors, which can be determined by the sum or configuration of
the unique product-market strategies, organisational structures and process. Miles and Snow
think that the successful types are the defenders, the prospectors and the analyzers, while the
reactors are unsuccessful.
In the 1980’s the emphasis on the soft structure of the organisation got stronger, which said
that it is not the structure that accommodates to the somehow evolving strategy, but the
structural and other organisational characteristics develop in a way that it’s able to create and

39
realize the appropriate strategy. According to Peters and Waterman (1982) the success of the
organisation depends on the extent to which they are able to manage the soft organisational
factors. This way the primary success criterion is not the strategy, but the existence of such an
organisation that is able to constantly adapt to the environment.
Peters (1984) finally got to the point where he said that strategy follows structure. According
to his standpoint the organisations develop such differentiating abilities during their long term
operation, in which they create a deeply rooted repertoire and based on that, the way of
adaptation develops from the inside of the organisation derived from the behavioural norms of
the management and the employees, the traditions of the organisation and the informal values.
This opinion in essence shows similarities with Mintzberg’s ideas, who interpreted strategy as
the behavioural pattern appearing in the sequence of decisions and actions (Mintzberg, 1978,
quoted by Antal-Mokos, 1997)
The adaptations are worth to be further examined from the aspect of the connections between
strategy and innovation orientation, which is of significant importance regarding the
definition and following of the trends. Nyström (1983) differentiated two extremes regarding
the environmental adaptation and the innovation intention and ability: the innovative and the
positional organisation, and he also identified the latent innovative/ positional group of
enterprises between them. A positional company has neither the desire nor ability to change
whereas an innovative company will have both the will and desire.
Making further observations in the context of innovation and environmental adaptation based
on the results of the research ‘In competition with the World’ (Chikán et al., 2004), three
groups of enterprises can be identified (Hortoványi and Szabó, 2006a): (a) Entrepreneur
(active), (b) Offensive (active) and (c) Defensive (passive) enterprises (see Table 3).
As we can see from Table 3 focusing on high risk project is more typical of the Entrepreneur
enterprises than of the other two groups, though it doesn’t mean that the companies belonging
to that group are irresponsible. The entrepreneur companies are ‘cautiously brave’: they work
on more than one project at the same time hence decreasing the risk of their portfolio and they
only proceed in small steps - aware of new information, constantly learning - during realizing
their ideas. Since their commitment is lower, their loss is also smaller if an idea doesn’t meet
the expectations and hopes set earlier.

40
TABLE 3: Corporate strategies based on the innovation and entrepreneurial
orientation
Entrepreneur Offensive Defensive
The introduction of the new products
at the company Regular Regular Occasional
The innovation Prominently
important Important Not important
The role of the innovation in the
corporate strategy for the employees
Unambiguously
defined Defined
Ambiguously
defined
Risk-taking orientation High Medium Low
Is the executive leadership able to
tolerate failure? Yes No No
Does the marketing view prevail
significantly in innovation? Yes Yes No
Source: Balaton et al. (2007)
At the members of the Offensive group similarly to the case of Entrepreneur companies, the
endeavour for innovation can be observed, but along basically conservative values. The
introduction of new products, innovation or the role of marketing is usually less important for
the Offensive enterprises than for the Entrepreneur ones. The toleration showed in regard of
failure is also lower at the Offensive enterprises than as we have observed at the Entrepreneur
companies. Regarding that we might suppose that learning from own mistakes is a less
embedded part of the organisational culture. At the Offensive companies – on the contrary of
the previously discussed ones – it often happens that there is ‘no time’ for innovation which
shows similarity with the third type of companies, the Defensive ones.
The main characteristic of the Defensive companies is the following, lagging and adapting
philosophy. The Defensive companies usually don’t have time for innovation, and perhaps
that’s why the role of the marketing view and the introduction of new products are
insignificant and the introduction of new products can be regarded incremental development.
The companies belonging to that group don’t prefer projects with high risk. It is worth
emphasising that the influence of the executive leadership is dominant in the creation of the
strategy. Comparing the certain strategies reveals that the Offensive and Defensive strategies
mainly differ from the Entrepreneur ones in the way of the leadership tolerating failures and
the importance of innovation.

41
2.3.4 Comparing different strategic adaptation archetypes
The typology of Miles and Snow shows several similarities with the adaptation strategies
created based on innovation skills and entrepreneurial orientation and the earlier described
proactive-reactive classification. Though the certain types of strategies do not correspond
totally with each other, there are still similarities between them, which are demonstrated on
Figure 9 on the example of long-distance sound communication.
FIGURE 9: Comparison of the adaptation strategies
Source: personal interpretation based on Balaton et al. (2007)
Reviewing the configurations evolving as the effect of the external and internal environment,
my assumption – in accordance with the ideas of the configurational school – that all the
strategic schools and configurations have their appropriate time and place got confirmed.
That’s why it is reasonable to longitudinally examine the relation between structure and
strategy. The development and improvement of the enterprises are important from the
everyday management’s point of view as well.
It is a basic question for the leadership intended to adapt to the environment that how they
should do it. The real question in the relation of strategy and structure: which one has to
change first? The management can work out the concept of the strategic change, then realize
it and finally develop the structure corresponding with the new strategy, ‘break in’ the new
organisational processes, build up the communication channels etc. if the pace of the
environmental changes is relatively slow.
In a rapidly changing, turbulent environment it is possible that by the time that the new
strategy evolves and the new processes are working smoothly another, newer strategy is
needed, so there is no time to enjoy the fruits of that strategy (Antal-Mokos et al, 1997).
42
A question that arises is what kind of adaptation strategies can be considered viable along
different environmental conditions? I will return to answer this question when I formulate my
hypotheses, because it is important to get to know first the followed strategies and the
performance configurations.
I will use in the one-dimensional, 5 point scale for measuring the perception and influence of
the environmental changes, but I will use the methodology of creating multi-dimensional
configurations in the forming of the performance configurations.
2.4 The strategies followed and the rise of ambidexterity
2.4.1 The strategies followed by the enterprises
Mintzberg et al. (1998) divided the corporate strategies into five categories: intended,
deliberate and unrealized, emergent and realized strategies. In this context the followed
strategies belong to the deliberate category, namely they are realized strategies which were
contemplated and executed by the leaders. In some cases they can be emergent strategies, but
it is very important that the leaders are aware of the strategy (pattern) followed by the
company.
During my research I analyse the under mentioned followed strategies:
a) The company followed withdrawal strategy: it concentrated its resources on defensible
positions
b) The company followed defending strategy: it concentrated its resources to defend
existing positions
c) The company followed stability strategy: it concentrated its resources to strengthen
existing positions
d) The company followed growth strategy: it concentrated its resources to build new
strategic positions
e) The company followed offensive strategy: it concentrated its resources to both build
new strategic positions and weaken competitors’ positions
f) The company followed focusing strategy: it concentrated its resources on a given
narrow market segment
g) The company doesn’t follow any consequent strategy.

43
James G. March (1991) named exploration and exploitation as the two main strategies
followed. The above mentioned strategies can be classified into these categories by the
following way: (1) Exploitation: defending, withdrawal, stability and focusing; (2)
Exploration: growth and offensive.
2.4.2 The adaptation paradox
We meet the adaptation paradox in the course of strategy creation related to the industry
change (Burgelman, 1991). In the interpretation of the adaptation paradox, the adaptation to
the environment is very important, but the constant adaptation to the existing factors
decreases the future ability of adaptation.
According to Burgelman the change carried out in the strategy is always smaller than the
change happening in the environment, therefore the alterations mainly concern the peripheries
of the strategy, and there is no change on the core areas. Hence during the reorientation the
companies facing the competition rather strengthen the already existing activities instead of
looking for new ones. This leads to the hypothesis that in case of crises the companies
typically follow exploiting (defending, withdrawal, stability or focusing) strategies.
Based on Burgelman’s argument the renewal of the strategy usually happens through an
autonomous strategic process, the internal experiments and the strategy selection helps the
long term adaptation of the enterprise to the environment.
The evolutionist view is often connected with the functionalist view: those activities that
serve the best the interest of a group or society, get confirmation, while the others get selected
through a process that can be divided into three parts. The first phase is the emergence of new
variations. It doesn’t matter whether these are intentional or involuntary. What’s important is
that a natural selection process evolves among the several initial alternative solutions, ‘initial
attempts’ born in the abovementioned way: certain variations are confirmed and retained,
while others disappear.
Child (1972) pointed out that the view, which says that the organisational structure is
unambiguously determined by the environmental factors, technological level and other
external factors is not correct. The decision makers of the company actively contribute to the
manipulation of their own environment, in order to achieve the goals they have set. They
either ignore the changes happening in the environment or they alter the organisation.
44
Child’s ideas were affirmed and further developed by Kuwada (1998). According to his
researches the process of strategic behaviour has the following steps: (1) the organisation
creates an environment for itself (frameworks, factors), (2) defines the problem and its own
situation (relations between the factors), (3) builds up a rational planning process, and (4)
recognizes the action opportunities and interprets its results.
Thus the relation between the environment and the organisation is variable. We should have a
look at the relation between the organisation and performance. In this case Child (1972) gets
to the conclusion that organisational structure has a limited effect on performance. He names
the dominant coalition as the cause of the appearance of the organisational variations. The
alterations of the goals set by them cause changes in size, technology or position. In this
interpretation the proactive behaviour of the company is determined by the leader or dominant
coalition.
Child’s idea overlaps the results of Rumelt (1974: 149) saying that ‘structure follows fashion
as well’. Rumelt confirmed the theory of Chandler (1962) on a big sample in which he stated
that the companies usually go through four stages during their growth: (1) initial acquisition
of resources, build up of the distribution channels, (2) more efficient use and co-ordination of
resources, (3) entering new markets after the saturation of the existing ones, (4) developing
divisions. Furthermore he detected the changes between 1949 and 1969 showing that the large
enterprises diversified even without any strategic concept. Based on our current knowledge
Mintzberg et al. (1998) would add focusing on core competencies as the fifth element which
is a very fashionable suggestion nowadays, and was also pointed out by Szabó and Vida
(2009) in connection with outsourcing and shared service centres.
Contradicting Child’s view, Burgelman (1991) represents the view that strategy is based on
the current technology, economic and cultural factors and adapting to these, the task of the
leader is to create such a strategy that enables the organisation to attain further success.
Therefore the organisational structure defines the competencies of the organisation and
determines its aims. Strategy consists of technical, economic and cultural regulations. These
regulations serve the purpose of maintaining the character of the organisation. He uses the
theory of population ecology for strategy building. During the selection, the participants on
different levels perceive strategy differently therefore variations appear. The objectives set in
the strategy cannot be achieved without internal selection systems.

45
Thus the primary task of the top management is managing the administrative tools (strategic
planning, control system, incentive systems), developing cultural (behavioural norms)
mechanisms and selection systems.
Based on earlier experiences, organisations rather create variations than build up completely
new activities; moreover as the company grows, sooner or later the appearance of autonomous
strategies is inevitable. The autonomous strategies can evolve on all levels in regard of the
fact that certain individuals, groups are ready to start activities that exceed the borders of the
current strategy. These autonomous initiatives are based on the totality of the competencies of
the organisation. They can be derived from any level, but – based on the researches of
Burgelman – mainly from those levels which have connection with new technological
developments or financial resources.
The effect of the management’s cognitive patterns is significant at the selection mechanism. If
previously the management have created only a few regulations, during the selection process
they prefer personal interaction and accept the autonomous initiatives as part of the
organisation if they find it successful (viable) (Mintzberg et al., 1998). Thus retention can
happen if it is proved itself that the autonomous strategy will get the appropriate resources in
the future as well (it is subjective, because as Child (1972) has also pointed out, the dominant
groups have an influence on the decision). The retention mechanism, which enables the
maintenance and renewal of the ‘positively chosen variations’, strictly determines the
‘optimal choice from the unambiguously defined set of opportunities’ through routine
processes of the organisations.
Besides that, the realization of the autonomous strategic process is difficult, because as a
result of the autonomous initiatives, precious groups might separate from the organisation if
they feel they have missed an opportunity. Nevertheless most of the organisations rather use
the inducted strategic process because of the expenses, since the existing strategy doesn’t
need extra (sunk) costs.
2.4.3 Renewal and the sustainable corporate growth
The most exciting question of the strategic management is the renewal, or specifically the
strategic and organisational realization of the continuous renewal. The configurational school
is about change, but its main point is continuity.

46
If a strategy is made for change, it will also stabilize both the process and the developing
state. ‘… describes the relative stability of the strategy within the given state, which is
renewed occasionally through quite dramatic jumps.’ (Mintzberg et al, 2005: 328).
The growth and growth ability of the organisations sustainable on the long run depend
considerably on the enterprises’ ability to renew and their entrepreneurial behaviour. The
ability to renew and the conscious entrepreneurial activity – also at established organizations
(Garud and Van De Ven, 1992) – have to become part of the strategy of the enterprise, and
the strategy formulation processes.
Therefore both the induced and autonomous strategic processes are necessary, – using the
categories of Burgelman– the selection process has to be directed in a top-down and a bottom-
up way. This contributes to the reorientation of the strategy, and through it to the reorientation
of the whole company (the strategy determines the structure – Chandler, 1962). According to
Hurst (1995) the role of the charismatic leader is acquiring resources and leading across the
death-valley period while maintaining stability as well. Moore (2005) discusses the
connection between the life cycle and the innovation strategy of the enterprise (Table 4).
TABLE 4: Connection between corporate life cycles and innovation strategies
Life phase Innovation strategy of the organisation
Early market Fragmentation innovation
Abyss -
Bowling alley Application innovation
Tornado Product innovation
Early main street Process innovation
Mature main street Experiment and marketing innovation
Declining main street New business models and structural
innovation
Breakpoint -
End of the life cycle -
Source: Based on Moore 2005: 176 and Hoffer and Iványi 2008: 54
Serious empiric examinations stand in the background of the theories presented in the
dissertation. The researches that examine the growth obstacles using quantitative,
questionnaire data acquisition methodology and mathematical-statistical analysis are the
following for example: Lumpkin and Dess 1996, Stopford and Baden-Fuller 1994
(Davidsson, 2004). At its appearance each of the researches marked a new direction of the
examined field.

47
The explorative behaviour of the enterprises provides possibility for the enterprise to leave the
‘sinking ship’ in time, when the industry turns into a rapid decline. Proactive behaviour makes
possible changing the industry, and reduces the costs and risks of it. As the result of the
conscious balance between exploitation and exploration the enterprise becomes capable for
sustainable growth (Figure 10).
According to Lipitt and Schmitt (1967) growth is almost steady within each phase, but after a
critical size operating disorders manifest themselves in the organisation, when the
management has to answer new questions in order to continue growth. They emphasise that
the crisis situations appearing in each phase can emerge in other periods as well (e.g. an
enterprise in the maturity stage might face a new competitor, its market can collapse), but the
maturity refers to the way how the leaders face the different organisational crises. According
to Galbraith (1982) if a problem in the development stage isn’t handled, it will be a more
difficult problem in the further stages.
FIGURE 10: Sustainable corporate growth
According to Greiner (1972) it is determinant how the organisation solved its former
problems. He found that evolution and revolution phases follow each other during the growth
of the organisation. In the evolutionary phase the development is unbroken, undisturbed, in
the following revolutionary phase problems emerge, the organisation struggles with locks.
The development of the enterprise depends on whether the management finds the answer to
the challenges of the revolution phase or not, because getting into the next evolution phase is
only possible this way.

48
The validity of the early development phase of Greiner’s model was examined by Salamonné
(2006) in the Hungarian context. She pointed out that the model is valid, but during the
improvement it is not certain that each phase manifests itself, leaping over them is possible at
every enterprise.
Miller (1976, 1979) dealt with archetypes – strategy, structure, situation, processes and the
transition between them. He regarded the changes of strategy and structure as quantum-leaps,
not a constant process (Miller and Friesen 1982). A lot of things change at the same time in
case of a strategic revolution. If several factors change at the same time and within a short
interval, the configuration doesn’t change in the strategy-structure-systems order.
According to Quinn and Rohrbaugh (1983), as well as Quinn and Cameron (1983) corporate
growth is the focus on external and internal problems, the solutions gave to them and the
sequence of the changes between flexibility and control. In Mintzberg’s (1989) opinion
growth can be regarded a form of power reorganisation. In order to grow a new power
structure has to be rooted in the enterprise as well.
Audretsch and Ács (1990) are of the opinion that most of the start-ups are of very small size –
in most cases they are too small to remain in the industry. According to the authors the
explanation of the survival of the small firms is in their learning strategy. The firms can
survive and grow by conscious learning and adaptation, even if their size doesn’t reach the
optimal value. Miller (1985) writes about the creation and exploitation process of knowledge
in connection with learning and life cycles. High qualified professionals are needed to exploit
knowledge, while by the establishment of the routines lower-qualified people can take over
the tasks gradually. In contrast of Miller’s interpretation Mintzberg et al. (1998) shows that
the former prominence is – in changed environmental conditions – the basis of the failure.
The most often occurrences:
The focusing trajectory: Technological focus – the best in technology, but has no real
value for the consumers;
The venturing trajectory: Growth orientation in any way, they also jump into
something which they aren’t good at;
The inventing trajectory: they spend the money of the world for moping researches
The decoupling trajectory: The overuse of the previously valuable brand name by poor
quality products.

49
There are some, who will always be small (Vecsenyi, 2003). The life cycle of the family
businesses can connect with the life cycle of their founders (Szirmai, 2002b). On the contrary
in the forced growth model of A. T Kearney (2009) the enterprises are intended to be set on a
conscious growth path. The model consists of four steps, whose succession proves the growth
of the organisation: (1) fundamental business processes, understanding and arranging the
activities, (2) organisation and organisational culture shaped for growth, (3) strategic
marketing activities and (4) stretching, during which the previously formed systems are
induced to continuous renewal
From the empirical examination point of the dissertation it is important to mention the life-
cycle determined by the Hungarian market and operation environment (Szabó József, 2008).
Large corporations sunk to the deepest point in 1996, then grew, mainly through multinational
companies. Medium-size companies grew until 1995, and then suddenly stopped. Small
companies have been developing starting from a low level. To sum it up: deepest point in
1995, then continuous development until 2007. The total performance barely reaches the 1980
level.
2.4.4 Managing changes
Change is a continuous phenomenon both nowadays and throughout history, but the pace of
the change seems to accelerate. Change is an unavoidable result of innovations, whose effect
and impact are often unimaginable and underestimated by many people, included those
individuals and organisations, too, from whom the innovation derives. Managers want to
govern this process better and more proactively, but there are still several unanswered
questions (Schendel and Hitt, 2007):
How can and has to be change consciously (actively) managed, while one enterprise
innovates, and perceives the innovations in the industry?
How can the effect of innovations be tracked (e.g.: in case of organisational structure
and business model)?
What are the primary tasks in the preparation of the enterprise for the changes?
What change forms are reasonable and effective?
What obstacles might change run into and how can these obstacles be avoided or how
can we overcome them?

50
The literature of strategy, entrepreneurship and change management offers different solution
alternatives for the efficient know-how for leading change (Kotter, 1999, Dobák, 1999,
Bakacsi et al., 2005, Balaton et al., 2010, Zoltayné Paprika and Kiss, 1988), the collective
application of those make the organisation both efficient and effective. Change management
is a consciously managed activity, during which the enterprise gets from a configuration to
another. The recognition of the strategic changes and finding the adequate answer to those
bring the members of the change management team into an especially hard task. The
corporate environment supposes the continuous revision of the strategy and the operation,
which has a significant effect on the stakeholders of the organisation.
During the change management processes, the proper combination of the strategies, the
creation of the favourable reception of changes and the freezing of the results are critical
factors.
For a good change manager it isn’t enough to know the separated effects of the single
organisational factors, but they need to have a complex knowledge about what change
management is, what change types, characters and dimensions are existent, what the external
and internal causes of the strategic changes are. Moreover he/she has to possess knowledge
about the characteristics of the directed organisational changes and the process of the problem
solving. He/she has to know why it is necessary to create enough sense of urgency, and which
factors hinder its development, what the success factors of the successful change management
are. Moreover it is necessary to select a change management style and team which is suitable
for the situation. A good change management team can apply several change management
strategies, communicates all of its actions and endeavours to preserve the results permanently
(Balaton et al., 2010).
The start and the maintenance of the changes is not an easy task, because for this the
(artificial) maintenance of the creative tension is needed in the organisation. In order to
maintain the creative tension, the vision has to be utilized, learning has to be directed and
planning has to be given power (Mintzberg et al. 2005: 373). Hindering factors in the
recognition of the necessity of changes and in the creation of sense of urgency (Kotter, 1999):
absence of a major and visible problem or crisis,
too much happy talk of the senior management,
low overall performance standards,
performance measurement system focusing on wrong metrics,
abundant resources,

51
operating in silos with organisational structures that focus employees on narrow
functional goals, and the underestimation of the power for denial that turns a blind eye
to problems
not aware of how suppliers and customers actually view performance,
low confrontational culture.
Further significant challenge of changes is that at least one major factor of the system changes
(morphogenetic) (Dobák, 1999, Csath, 2001).
The degree of relative change can be different, the reorganisation is at the highest degree,
during which the current, unfavourable state of the enterprise require urgent and fundamental
changes. The turnaround is smaller, in regard which the redefinition of the enterprise
fundaments happens in the interest of the future competitiveness of the enterprise. The
adaptation is at a lower degree, which refers to the small-scaled but continuous responses to
external challenges, without which the enterprise would get into a competition disadvantage.
Tuning is the smallest scale of change, in this case there is no immediate constraint for
change, but the enterprise looks into the future proactively, and thus it is committed to the
continuous top-ranking developments (Table 5).
TABLE 5: Classification of change types
Continuity of change
Step-by-step,
continuous
Strategic,
not continuous
Time horizon of
change
Foreseeing Tuning Turnaround
Reactive Adaptation Reorganisation
Source: Balaton et al. (2010)
Pettigrew (1985, 1987) reckons change as a range of episodes. He examined the changes
between 1969 and 1986 (which two periods included two oil crisis), and came to the
conclusion that changes are not continuous and gradual, but sometimes a pattern of radical
changes appears, which high level changes are connected to economic recession. The
revolutionary changes induce change in the management, too, but opposed to Chandler the
internal systems change (structure) first and it is followed by the change of the consumer
focus of the organisation only afterwards. This practically corresponds to Burgelman’s
thought about the adaptation paradox.

52
According to Clemmer (1995) changing and managing are precluding concepts and changes
don’t have to be controlled manually, but the frameworks have to be set, and then change
proceeds by it. Change can be ignored, resisted, reacted, exploited or induced, and the
necessary frameworks and configurations have to be developed accordingly.
During change it is important, that it is very difficult to change everything at the same time,
and it is not advisable either. Based on the recommendation of Mintzberg et al. (1998) we
look for the best among the new, and keep the most useful among the old. The change
strategy of Dickhout et al. (1995) is much more pragmatic than this general recommendation:
1. Evolutionary/institutional building: line managers direct the continuous change,
2. Jolt and refocus: change of the management is necessary,
3. Follow the leader: cutting the side-activities in order to have fast results,
4. Multifront focus: fast results stabilize the organisation, that can be followed by the
multifront focus, changing many factors at the same time,
5. Systematic redesign: ad hoc workgroups, but planned change,
6. Unit-level mobilizing: the incorporation of the ideas of the middle management and
the workers.
Changes can be induced top-down or bottom-up. Example for the top-down induced change is
the drama of Tichy and Sherman (1993) in three acts, during which the prologue is the
development of the new global playing field, and the acts are the processes of the
organisation: (1) awakening, (2) envisioning and (3) rearchitecturing. The epilogue refers to
the stability of changes, that history repeats itself.
Beatty and Ulrich 1991, as well as later Stopford and Baden-Fuller viewed the starting point
of successful changes in the top-down enterprises: (1) committed top-team (2) simplification
(3) development of new capabilities (4) maintain momentum and stretch the advantages.
Doz and Thanhaiser (1996) regarded the transformations more efficient, in which: (1) internal
efficiency, then external expansion (new possibility) (2) top initiative, then lower levels
gradually take over the management (3) interpreting the new strategy concept for the
divisions of the organisation, emotional acceptance and continuous learning.

53
Kotter (1995: 61, 1999) gives a more detailed guidance for the implementation of top-down
changes:
1. Establish a Sense of Urgency
2. Form a Powerful Guiding Coalition
3. Create a Vision
4. Communicate that Vision
5. Empower Others to Act on the Vision
6. Plan for and Create Short-Term Wins
7. Consolidate Improvements and Keep the Momentum for Change Moving
8. Institutionalize the New Approaches
Beer et al. (1990) examined, why change programs aren’t productive. They found the problem
in starting changes form too high above. Successful changes were typically started by a local
manager, which was supported from the top management in order to achieve success. The
successful elements were spread throughout the whole firm:
1. the common diagnosis of business problems helps the commitment to change,
2. common vision,
3. consensus and resources,
4. expansion of revitalization (as possibility),
5. rooting,
6. monitor the revitalization and correct the mistakes.
Kaplan and Norton (2004, 2005) explained the configurations and changes as the problem of
harmonization of the development and realization of strategy, and the short and long term
efficiency. The question is how are immaterial goods transformed into financial benefits?
They worked out a balanced score card (BSC) for supporting the performance focus, which
they further used for introducing the strategic orientated organisation and the alignment.
They identified 5 principles of becoming strategic oriented, which also serves to lead along
changes in the organisation:
54
translate the strategy to operational terms,
align the organisation to the strategy,
make strategy everyone’s everyday job,
make strategy a continual process,
mobilize change through executive leadership.
Kaplan and Norton (2005: 314) advice the concept of the progress from outside into inside as
the proper schedule of managing changes, whereas the first task is value creation, and then
comes the realization of the strategy. They understand 3 factors by value creation: (a)
costumer focus (understand the consumer), (b) the innovation (suggest new ways) and (c)
show results for consumers and shareholders. The realization of the strategy consists of four
elements: (a) understanding the strategy: mission, vision, (b) reliability and predictability, (c)
open communication and (d) teamwork: cooperation across organisational borders.
The BSC concept can be used excellently for start-ups and fast growing businesses as well,
but in these cases there is a special emphasis on defining the differences of interests of the
stakeholders, on the consumer value, on scheduling the results, on the strategic value
processes, on immaterial goods, on actions and their financing Kaplan and Norton (2005:
423).
The change management recommendations presented up to this point are based on the idea
that change has to be started immediately and carried out effectively. What happens if change
management is about preparing for possible changes? What happens if we don’t want to carry
out a change in 6 days, 6 months or 6 years, but we have unlimited possibilities, or at least a
few centuries for that? The changes of the history of the church serve as a good pattern of
changes last for several centuries.
Mintzberg and Westley (1992) worked out three patterns of the changes of world religions
lasting for centuries. In the frameworks of (1) enclaving the Church is open for any change,
but separates these innovation plexuses. In case of a crisis, low support turns over and the new
will be spread in the whole organisation. During (2) the cloning the aim is to make a new
subunit on the model of the old one, but filled with individual interpretations. The unification
can be ensured by trainings, during which the central ‘confession’ is agreed on. During (3) the
uprooting the innovators are sent away. The new tenets fight with each other until in case of
the success of a tenet the stabilization comes again.

55
Winter and Szulanski (2001) also pointed out the success of the cloning strategy, where the
development and then the replication can be an extremely efficient business strategy in a big
amount of the simple but best formula in the industry (e.g. the McDonalds.)
Donaldson (1996) judged the description of the configurations and change processes for being
over-simplified. In his opinion presenting the extremes doesn’t help in everyday life since it
isn’t prescriptive enough. Moreover he calls the attention to the change processes also being
stable during the transition otherwise the change is not realizable.
Whitehead (Mintzberg, 1998: 347) composes even more extremely: ‘Seek simplicity and
distrust it’. On the contrary Hopewell (2002) points out that configuration archetypes and
their explanations influenced more the management thinking than the most of the deep
analyses.
2.4.5 Ambidextrous organisations
The topic of ambidextrous organisations is more and more popular among researchers who
deal with strategy. The key question of it is the joint treatment of efficiency (exploitation) and
effectiveness (exploration). (Tushman and O'Reilly (1996, 2002), O'Reilly and Tushman
(2004), Raisch et al, 2009).
The ambidextrous organisations are able to manage successfully their existing activities and
new products, services and processes at same time. The ambidextrousness can be realized in
several organisational structures, in functional, cross-functional, spinout or ambidextrous
structures, too (O'Reilly and Tushman, 2004)
Interpreting the growth model of Greiner (1972) I found that corporate growth is practically a
sequence of external, market and internal, organisational management focus changes, which I
identify as an initial concept of the ambidextrous organisations. In this model the
ambidextrousness, the efficiency and effectiveness is realized through a sequential process.
The model of Cameron and Quinn (1983) says more, because in their view four model plays a
role in the life of the enterprise at the same time, but different models will be dominant. The
ambidextrousness of the organisation can be interpreted as a ‘rotation’. Using the model of
Miller (1985) the ambidextrousness can be ensured through the proper rate of specific and
general, and high-qualified and less-qualified professionals.
The majority of the enterprises struggle for the balance of the efficiency and innovation. The
enterprises can gain efficiency in short term, if they replace their costly and unforeseeable
activities by cheap routine processes. Though this exchange is extremely dangerous, because

56
the organisation loses its long term adaptation ability. The more routine processes there are,
the less flexible the organisation will be. Therefore sometimes based on strategic
consideration, disturbance needs to be created artificially in the organisation maintaining the
creative tension (Raisch et al, 2009).
The trigger of the creative tension might be the open business model in which the innovations
are come from inside as well as from outside of the traditional organisational boarders. At the
same time, there is the possibility to spin off those innovations that are not realizable in the
parent organisation, but are viable/profitable otherwise (Chesbrough, 2002, 2006).
In economics János Kovács and Ildikó Virág in 1987 and 1988 proved with mathematic
calculations that the cyclical growth results in bigger growth than the steady growth (Lukács,
2009). Is this statement verifiable also in management sciences that the sequences of
exploitation and exploration result a better performance? How to determine the optimal cycles
of exploitation and exploration?
The questions broaden the focus of research that the performance of every single company
doesn’t matter, but it is the performance of corporate population that has to be judged. This
aspect meets the questions of Charles Darwin (1872) that it’s not the individuals but the
examination of species’ competitiveness that is important. In 1869 Herbert Spencer created
the expression “Survival of the Fittest’ and in 1871 Charles Darwin used the word “evolution’
for the first time in his book “Descent of Man’. In the sixth issue of “Origin of Species’ both
words are included, the former is in the 4th, the latter is in the 7th, 8th, 10th. and 15th.
chapters (Kampis, 1998).
The word “fittest’ in the terms of Darwin doesn’t refer to that whether one individual is the
strongest or smartest within species or not but to how can they adapt to the environmental
conditions and spread. Moreover, the primary subject of analysis is not the individual, but
with the spreading of the most suitable unique attributes to the environmental conditions, it is
the competitiveness of the species that matters.
Based on the presented theoretical models I consider those companies as ambidextrous
organisations that:
follow both explorative and exploitative strategies at the same time, or
followed both explorative and exploitative strategies by turns during a 4-year period.
Furthermore I analyse the changes of ambidexterity of corporate population between 1992
and 2010 besides the ambidexterity of each company.

57
2.5 Identifying strategic configurations based on firm performance
The identification and description of the strategic adaptation archetypes and the clarification
of its relation to the environment are the focus of the empirical research. I plan to identify and
describe the archetypes of the adaptation strategies by using the methodology of the
configuration school which was presented in the first part of the dissertation. This fits into the
literature of strategic management, where configuration is described by researchers (follow
the path of the game), while the transformation is mainly practiced by managers and
described by consultants (set a trap) (Mintzberg et al., 1998).
Researchers are divided on the question of the classification of variables. The first stream is
constituted by ‘splitters’, who take very small, highly differentiated units, use continuous
measurement scales, and then correlate pairs of variables. According to them, sub-samples are
significantly different in key ways which justifies the separation of variables in different
classes in the model. Opposed to that, ‘lumpers’ argue that differences are not as important as
signature similarities. One advantage of lumping is that neat categories simplify complexity
hence it is easier to understand. That makes lumping to be more useful in practice, but not
necessarily more accurate. Nevertheless, a certain style of leadership is efficient in a particular
organisational form; hence the fit between the factors is important. In my opinion the
examination of the variables in pairs – as suggested by ‘splitters’ – doesn’t provide us with
the whole picture of the configurations because we would lose the joint effect of factors.
Moreover, Khandawalla (1970) argues that organisational efficiency isn’t determined by
single factors on their own, but determined by the connections between these factors. The
organisation is efficient because complementary factors are matched with one another. Based
on my previous findings I also share this point of view and follow the ‘lumping’ method in
classifying variables.
TABLE 6: A matrix of strategy content research
Single factors Clusters of factors
Static
conditions
Linking particular strategies to
particular conditions (e.g.,
diversification to industry maturity)
Delineating clusters of strategies
(e.g., strategic groups) and/or
clusters of conditions (e.g., generic
industries) and their linkages
Dynamic
conditions
Determining particular strategic
responses (e.g., turnarounds,
signalling) to external changes (e.g.,
technological threats, competitive
attacks)
Tracking sequences of clusters of
strategies and/or conditions over
time (e.g., industry life cycles)
Source: Mintzberg et al., 1998: 107

58
During the development of the research frame the real content of the strategies are brought
into focus instead of strategy creation process. The four main trends in content research are
summed up in Table 6.
My choice of research methodology – taking into consideration the possibilities demonstrated
on Figure 2 – is the dynamic conditions research with clusters of factors. In order to overcome
the weakness of positioning school – namely extensive use quantifiable economic factors in
measuring strategy – qualitative factors are also taken into consideration. In my opinion, the
strategies which are embodied in the behaviour patterns of Hungarian enterprises also can be
divided into strategic groups. Members of the same group – cluster – invest in very similar
factor-combinations during their adaptation to their environment. Consequently, they are well
separable from members of another strategic group. Different range of the empirical research
can be differentiated in the field; the difference is attributed to the difference in their
typological bases.
The empiric researches of Miles and Snow (1978) resulted in nowadays one of the best-
known strategic classification in four industries (textbook publishing, food processing, health
care, and electronics). The strategy types cover the possible organisational responses to the
new environmental challenges: innovation (prospector), consolidation (defender), seek
balance (analyser), not having strategy (reactor). Miles and Snow’s strategic typology is
intensively present in the scientific literature and a great number of researches were built on
this classification (Antal-Mokos and Kovács, 1998, Hambrick, 1983 and 1984, McDaniel and
Kolari, 1987, McKee et al., 1989, Shortell and Zajac 1990, Webster, 1992).
Most of the empirical research done in the field had a focus on the connection between
strategy types and performance in relation to the competitive strategies. Some researchers
apply the industrial organisation (IO) approach for the analysis of the competition in
connection with the business strategies (Hatten and Schendel, 1977, Cool and Schendel,
1987). Other researches examine the clustering in single industries through developing the
theory of the strategic groups, which show similar connections regarding strategic key-
variables. Other attempts (Dess and Davis, 1984 or Miller and Friesen 1986) are aimed at
creating a strategic set of concepts, such as Porter’s generic strategies.
Although the strategic variables are partially different in the literature, for today those
variables are formed which are included in a quite standard way in the empirical examinations
of the strategy types (Doty and Glick, 1994, Galbraith and Schendel, 1983, Miller and Roth,
1994, Morrison and Roth, 1995).
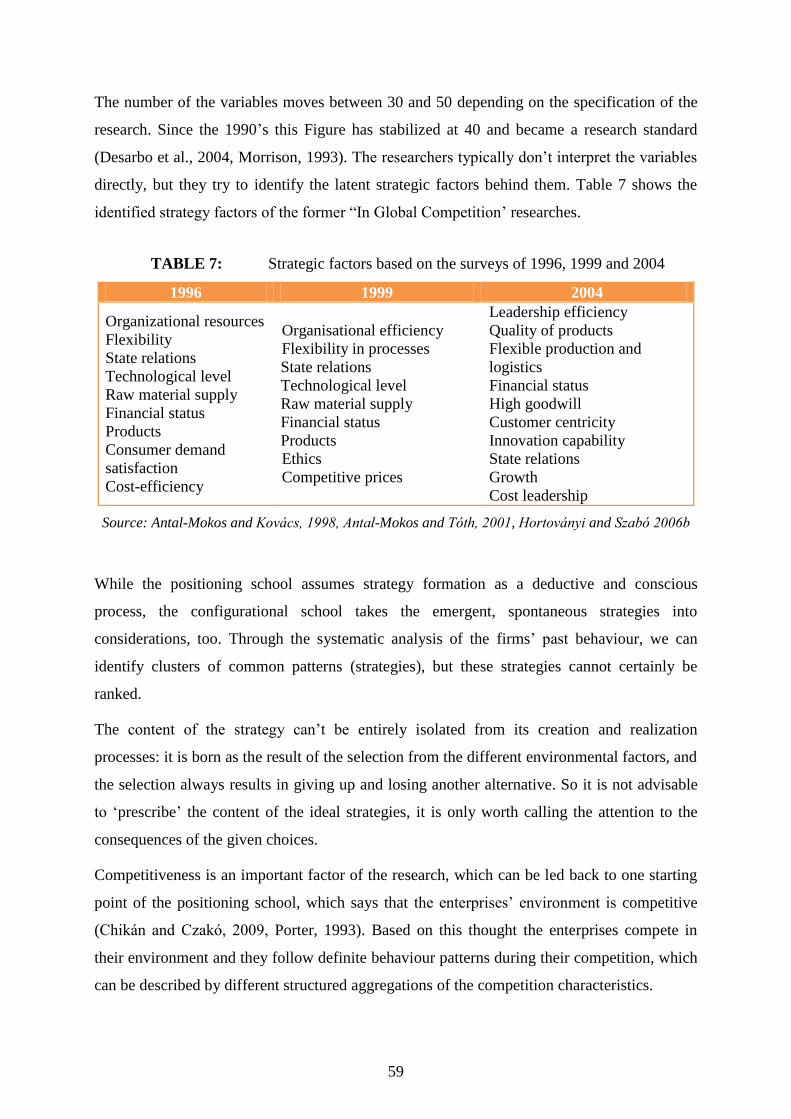
59
The number of the variables moves between 30 and 50 depending on the specification of the
research. Since the 1990’s this Figure has stabilized at 40 and became a research standard
(Desarbo et al., 2004, Morrison, 1993). The researchers typically don’t interpret the variables
directly, but they try to identify the latent strategic factors behind them. Table 7 shows the
identified strategy factors of the former “In Global Competition’ researches.
TABLE 7: Strategic factors based on the surveys of 1996, 1999 and 2004
1996 1999 2004
Organizational resources
Flexibility
State relations
Technological level
Raw material supply
Financial status
Products
Consumer demand
satisfaction
Cost-efficiency
Organisational efficiency
Flexibility in processes
State relations
Technological level
Raw material supply
Financial status
Products
Ethics
Competitive prices
Leadership efficiency
Quality of products
Flexible production and
logistics
Financial status
High goodwill
Customer centricity
Innovation capability
State relations
Growth
Cost leadership
Source: Antal-Mokos and Kovács, 1998, Antal-Mokos and Tóth, 2001, Hortoványi and Szabó 2006b
While the positioning school assumes strategy formation as a deductive and conscious
process, the configurational school takes the emergent, spontaneous strategies into
considerations, too. Through the systematic analysis of the firms’ past behaviour, we can
identify clusters of common patterns (strategies), but these strategies cannot certainly be
ranked.
The content of the strategy can’t be entirely isolated from its creation and realization
processes: it is born as the result of the selection from the different environmental factors, and
the selection always results in giving up and losing another alternative. So it is not advisable
to ‘prescribe’ the content of the ideal strategies, it is only worth calling the attention to the
consequences of the given choices.
Competitiveness is an important factor of the research, which can be led back to one starting
point of the positioning school, which says that the enterprises’ environment is competitive
(Chikán and Czakó, 2009, Porter, 1993). Based on this thought the enterprises compete in
their environment and they follow definite behaviour patterns during their competition, which
can be described by different structured aggregations of the competition characteristics.
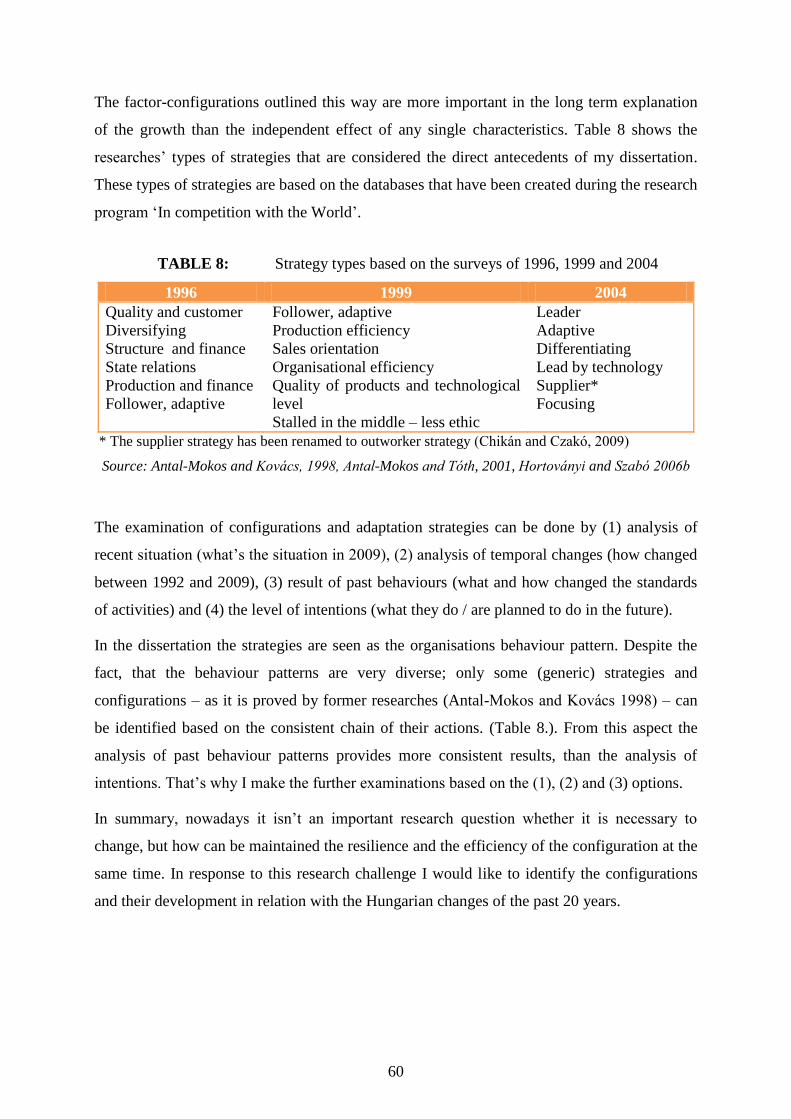
60
The factor-configurations outlined this way are more important in the long term explanation
of the growth than the independent effect of any single characteristics. Table 8 shows the
researches’ types of strategies that are considered the direct antecedents of my dissertation.
These types of strategies are based on the databases that have been created during the research
program ‘In competition with the World’.
TABLE 8: Strategy types based on the surveys of 1996, 1999 and 2004
1996 1999 2004
Quality and customer
Diversifying
Structure and finance
State relations
Production and finance
Follower, adaptive
Follower, adaptive
Production efficiency
Sales orientation
Organisational efficiency
Quality of products and technological
level
Stalled in the middle – less ethic
Leader
Adaptive
Differentiating
Lead by technology
Supplier*
Focusing
* The supplier strategy has been renamed to outworker strategy (Chikán and Czakó, 2009)
Source: Antal-Mokos and Kovács, 1998, Antal-Mokos and Tóth, 2001, Hortoványi and Szabó 2006b
The examination of configurations and adaptation strategies can be done by (1) analysis of
recent situation (what’s the situation in 2009), (2) analysis of temporal changes (how changed
between 1992 and 2009), (3) result of past behaviours (what and how changed the standards
of activities) and (4) the level of intentions (what they do / are planned to do in the future).
In the dissertation the strategies are seen as the organisations behaviour pattern. Despite the
fact, that the behaviour patterns are very diverse; only some (generic) strategies and
configurations – as it is proved by former researches (Antal-Mokos and Kovács 1998) – can
be identified based on the consistent chain of their actions. (Table 8.). From this aspect the
analysis of past behaviour patterns provides more consistent results, than the analysis of
intentions. That’s why I make the further examinations based on the (1), (2) and (3) options.
In summary, nowadays it isn’t an important research question whether it is necessary to
change, but how can be maintained the resilience and the efficiency of the configuration at the
same time. In response to this research challenge I would like to identify the configurations
and their development in relation with the Hungarian changes of the past 20 years.

61
2.6 Hypotheses based on the explored theoretical conceptions
To conclude the theoretical elaboration of the dissertation, I formulate research hypotheses
based on the explored theoretical conceptions. I formulate hypotheses in respect of the
connections of the main 4 research elements, namely the (1) environmental changes and
uncertainty, the (2) the perception and influence of the environmental changes, the (3)
strategies followed and the (4) performance configurations, which are summed up in Figure
11. It is to be noted that in respect of the environmental changes and uncertainty I resolve
further the certain hypotheses and interpret the connections for population and individual
firms, too.
FIGURE 11: The research model and the hypotheses
Environmental
changes and
uncertainty
Perception and
influence of the
environmental
changes
The strategy
followedPerformance
configurations
H1 H2 H3
H4H5
H6
Based on the introduced theories in chapters 2.2. and 2.4. of the paper:
H1population: The economic growth on the macro level fosters exploration while recession
retains exploitation.
H1indvidual: The exploitative firms perceive environmental uncertainty higher than explorative
firms.

62
Based on the introduced theories in chapters 2.2. and 2.3. of the paper:
H2population: The perception of the environmental changes and the capability to influence them
is independent from the external environment.
H2indvidual: The proactive firms perceive their environment less uncertain than reactive firms.
Based on the introduced theories in chapters 2.2. and 2.5. of the paper:
H3population: In a given environment more performance configuration is viable.
H3indvidual: The sources of environmental uncertainty have different impact on the
configurations.
Based on the introduced theories in chapters 2.3. and 2.4. of the paper:
H4: The explorative firms are able to recognize the environmental changes better then the
exploitative firms.
Based on the introduced theories in chapters 2.3. and 2.5. of the paper:
H5: The better a firm performs, the better it can perceive and influence the environmental
changes.
Based on the introduced theories in chapters 2.4. and 2.5. of the paper:
H6: Exploration and exploitation are typical to different performance configurations.
63
3 RESEARCH METHODOLOGY
3.1 Steps of the empirical examinations
International methodology to identify strategic configurations was replicated 3 different point
in time by Hungarian researchers: Antal-Mokos and Kovács (1998), Antal-Mokos and Tóth
(2001), and Hortoványi and Szabó (2006b). The above mentioned researchers examined
nearly identical variables (in the last two cases the variables were completely identical),
analyzed samples with similar composition (all of them used the actual database of the
Hungarian competitiveness research program). Interestingly, however, they discovered
different (only partially overlapping) strategies even though they used identical research
frameworks. It made the comparison of the strategy types to be very difficult accross years. In
order to overcome this barrier, in my dissertation I have introduced a new methodology
instead: an integrated analysis of the samples. The advantage of the replication of analysis
with integrated research methodology over the aggregation of previous results is that we can
get a reliable, comparable picture of the strategic adaptation ability, ambidexterity and
competitiveness of Hungarian (middle-size and large) firms. At the determination of the
analysis steps I have adjusted the methodology to the expectations of our days, which most
important cornerstones are: the introduction of a novel methodology (MDS), the enhancement
of the transparency of the analyses, and through these the increase of research reliability.
The steps of the research were (in italics new steps compared to previous research are
highlighted):
Formulation of the research question
Overview of the existing literature
Extension of the interpretation of strategic adaptation, exploring different adaptation
possibilities and more thorough examination of the environmental context;
Formulation of hypotheses on the basis of the existing theory;
Choice of research methodology to the examined phenomenon;
Examination of the changes in the macro environment based on the GDP growth
Joining the “In Global Competition’ research program and the selection of variables;

64
Making an uniform and cleaned database based on the questionnaire surveys
collected in 1996, 1999, 2004 and 2009 as part of the “In Global Competition’
research program
Analysis of the summed-up sample
Comparison of results with the results of the preceding surveys;
Examination of the composition and the representativeness of the examined firm
sample with reference to the thematic working papers of the “In Global Competition’
research programme;
Description of the examined sample characteristics;
Descriptive analysis of variables and control variables;
Further filtering of the variables’ data and preparing them for deeper analysis;
Analysis of variables through the single surveys’ subsamples over time;
Testing the hypotheses relating to the population on the basis of the development of
the variables over time;
Exploration the connections between the research and control/descriptive variables;
Compression of the variables’ data with multidimensional scaling;
Identification of performance configurations (strategy types) with clustering;
Examination of the explanatory force of the results with different cluster numbers and
based on these, determination of the ideal number of clusters;
Examination of the connection between control/descriptive variables with crosstabs;
Test of hypotheses with association and correlation coefficients and crosstabs
Interpretation of the results and qualitative cross-check of results through managerial
interviews.
Further on I introduce briefly the “In Global Competition’ research program which serves as a
base of the empirical researches.

65
3.2 Background – The “In Global Competition’ research program
The database is made up of Hungarian enterprises, the data was collected in part of the
research program called ‘In competition with the World’ in 1996, 1999, 2004 and 2010 (cf.
Chikán et al., 2004, Chikán and Czakó 2005, 2009). Each year around 300-300 enterprises
provided data for the research. The representativeness according to firm size (full time
employees) and location had major part in the data selection.
As it was mentioned before, each survey contained almost the same questionnaire, in app.
90% of the very same questions. The 10% difference was due to the differences in their focus
which was adjusted to the particular socio- and economic conditions of the year of data
collection. For example, the main research questions was in
1996: Do the Hungarian firms employ the solutions which were widespread in market
economies?
1999: How have the operation and the operating environment of the Hungarian firms
changed in brief 3 years?
2004: How has joining the EU influenced the competitiveness of the Hungarian firms,
and what operation development have the Hungarian firms reached?
2009: In which situation has the global financial market and demand crisis reached the
Hungarian firms, and how has it influenced their operation?
‘The research program was started in 1995 with the purpose to study the Hungarian economy
going through a transition in order to dissolve the contradiction of having high performers at
micro-level and disappointing results at macro-level. The research program was launched
with the comprehensive initial hypothesis, that in the microsphere are much more factors
which are give rise to optimism than what the statistic data show at national economy level.
Our aim was to explore these factors and to evaluate them in an international comparison. The
subject of the research was the competitiveness of the microsphere, which was investigated
several years earlier in the United States in research projects by several “business schools’’
(Chikán and Czakó, 2005: 8). The approach of the US Competitiveness Council served as the
model of the surveys, whereas it tried to explore the environmental factors, which influence
the competitiveness of microsphere, the operating and strategic characteristics of the national
enterprises with eight research projects. One of the most important statement of the research
program was in the middle of 1997, that the economic transition was over, so the operation of
the enterprises were essentially influenced by the limits and principles of the market economy
(Chikán and Czakó, 2005).
66
In the course of the research, 4 different but partially overlapping questionnaires were
submitted to each respondent enterprise. Besides the CEO of the firm, the production, the
commercial and the financial manager were asked to fill in a questionnaire tailored to their
functions. Thus, the database I was using for my analysis is consisted of more than 4,800
respondents.
The ‘self-assessment’ method is the suitable survey method for the research of the examined
phenomenon, because Hambrick (1981), just as Hambrick and Mason (1984) verified it
empirically, that the top managers are fully aware of their firm’s weaknesses and strength, and
they follow continually the alteration of these factors. The results of Chandler and Hanks
(1994) confirmed it too, that the assessment of the top managers and the archived sales results
correlate with each other. Consequently, the data is assumed to provide reliable information
for the analysis.
“In the course of ‘In Global Competition’ research program an own business competitiveness
definition was defined: business competitiveness is an ability of the firm, that the enterprise
can provide such products and services to the customers permanently, beside keeping the
norms of social responsibility, which the customers rather buy beside the profit ensuring
conditions than the competitors’ products (services). The condition of this competitiveness is
that the enterprise has to be able to detect the environmental changes and the changes within
the enterprise and to conform to them, with the accomplishment of permanently more
advantageous competitive requirements than the competitors’ (Chikán and Czakó, 2005).
The key part of the definition is the adaptation of the enterprises, which is examined in the
competitiveness research in four fields: (1) strategy, (2) management and decision making, (3)
value creation, (4) inter-organisational connections. In my dissertation I’m focusing on the
first dimension on the dimension of strategic adaptation.
In connection with the research program ‘In Global Competition’, on the occasion of the
single surveys, the research results are published in the working paper series. A research plan
comes before the working paper, which determines research subplans. Final working papers
are made as the closing of each subplans from which the final working paper of the research
program is gathered. As the direct base of my researches I list the following working papers,
which base the context of my dissertation:

67
working paper connected with the determination of research framework (Chikán and
Czakó, 2005)
flash reports (Czakó et al, 1999, Chikán et al, 2004 and 2010)
working papers connected with the introduction of the sample and the control
variables (Lesi, 2005, Wimmer and Csesznák, 2005, Könczöl 2007 and 2008)
working paper(s) connected with strategic adaptation, subproject final working papers
and published articles (Antal-Mokos et al, 1997, Antal-Mokos and Kovács, 1998,
Antal-Mokos and Tóth, 2001, Balaton, 2006, Hortoványi et al., 2006, Hortoványi and
Szabó, 2006b)
final working papers, reports, and published books (Chikán, 1997, Czakó et al, 2000,
Chikán et al, 2002 and 2006, Chikán and Czakó, 2009)
3.3 Databases and sample characteristics
3.3.1 Used databases and variables
For the empirical examinations I used the within the scope of the Competitiveness Research
Center of Corvinus University of Budapest’s competitiveness firm survey (hereunder called:
VKK) in 1996, 1999, 2004, and in 2009 made data acquisitions and databases, namely:
vezer.sav (data acquisition in 2009, last modified at: 2009.12.03),
vkvez2004 új változókkal050704.sav (data acquisition in 2004, last modified at:
2005.07.04),
VEZ99J.sav (data acquisition in 1999, last modified at: 1999.07.05), and
96VEZERIG.sav (data acquisition in 1996, last modified at: 1996.07.19).
Before using the database, unification of the data was necessary. As main rule I held the
structure of the database in 2009, except for the dichotomous variables type yes or no I
employed the earlier coding practice (0=no, 1=yes in contradiction to the 2=no, 1=yes
practice in 2009).
In the course of the empirical research, in line with the research model introduced in Figure 3
and 11, I examine the following phenomenon with the variables found in the databases:

68
estimation of the environmental uncertainty,
the strategy followed,
relation to the environmental changes of the firms (proactivity),
firm activity level (performance dimensions and configurations),
examination of the connections between variables.
Employed control variables through the examinations (They are described at the introduction
of the sample characteristics in the following sections):
size by number of staff, size by revenue, size by assets,
export rate,
proprietary structure,
main line of business (industry), and
territorial position.
3.3.2 The characteristics of the single surveys’ samples
It derives from the characteristics of the questionnaire(s),that we are curious to the answers of
the four top managers on the occasion of the surveys and the statements are related to mostly
the medium-size and big enterprises according to the number of staff. The most important
reason of this is that the fragmented organisation structure is only formed above a certain size
of the enterprise. In the consequence of this, during the first three surveys the examined firms
had more than fifty employees and they were independent legal entity enterprises, but this
criterion decreased to 10 people relating to the survey in 2009.
In the course of the surveys the firms were chosen from the enterprises who has already taken
part in the questionnaire surveys and from the Hungarian Central Statistical Office (KSH)
databases, with the aspiration that the sample has to be representative on the basis of staff
number and size of the population of fragmented structured Hungarian enterprises. In the
databases of competitiveness surveys relating to certain dates, the variables of questionnaire
sets filled by about 300 enterprises (detailed distribution in Figure 12) are included which
allow to create and describe subsamples based different firm features (e.g. size, property
structure) (Chikán and Czakó, 2005).

69
FIGURE 12: Sample size of the single surveys
1996
326
26%
1999
300
24%
2004
301
24%
2009
314
26%
Source of data: Calculated values based on VKK CEO databases 1996-2009
The in 1996, 1999 and 2004 surveyed firms are representative according to size categories for
middle-size and big firms. Related to the property structure firms in public and foreign
property are over- while firms in domestic property are underrepresented. Based on territorial
position enterprises in Budapest and Pest county are at a lower proportion in the database, but
firms from other regions have a higher proportion in the sample than in the population (Lesi,
2005). Related to the sample in 2009 the leading researchers of the “In Global Competition’
program don’t underline the representativeness of the sample, but they emphasize its certain
characteristics (Chikán et al, 2010):
3.8% of the general partnerships with more than 10 employees operating in Hungary
in 2009 belong to the big firm category with employees above 250 people; 13.2%
operate with more than 50 but less than 250 employees; and 83% can be classified as
small business. Based on this the sample is overrepresented in the middle-size (65.6%)
and big firm categories (15.2%), while it is underrepresented in the small business
category (19.2%). Compared to the survey in 2004 the proportion of small businesses
has increased significantly, the proportion of the middle-sized increased mildly while
the proportion of big firms decreased. So the sample examined by size has come
closer to the proportions in the population, but the middle-size and big firms are still
overrepresented.

70
On the basis of revenue and assets categories the KSH doesn’t report distribution data
proper for comparison, however compared to the earlier survey the proportion of
micro and small businesses decreased almost by 14 %, they are almost entirely
substituted by middle-size firms, while the proportion of big enterprises changed
scarcely. The distribution of firms included in the survey is similar to the proportions
in 2004 based on both assets and revenue, except firms in the largest category.
According to the industrial distribution the sample is different from the composition of
the Hungarian Ltd-s, Plc-s and co-operatives in that it contains proportionally more
enterprises from the manufacturing industry at an expense of trade, service and
community service industries.
At firms included in the sample 5.6% of the entire property is in governmental, 16.2%
is in foreign and 65.4% is in domestic property. The share proportion of local
authorities is similar to the state’s and foreign individuals’.
The sample contains at a smaller rate firms in Budapest and Pest County (Middle-
Hungary), than the population, similar to firms in Lowland. A smaller part of firms in
Transdanubia gave information. North-Hungary is mildly overrepresented in the
database, but not at a similar scale as the Lowland region.
On the whole the composition of the samples of the 4 surveys according to industries is the
similar to the composition of the Hungarian firms with a number above 50 employees,
however the samples in 2004 and 2009 contain firms from the manufacturing, energy and
community service industry in a higher proportion, and organisations from trade, construction
industry and non-community service sector are underrepresented.
In papers which compare industries there is a need for the checking measuring evenness,
since the relative importance of starting and operating businesses alters from industry to
industry significantly (for example the small business rate is higher in the service sector than
in the manufacturing industry). There is a further problem with employment changes, since
the taxation considerations can distort the unemployment and self employment ratio. A
similar reliability problem occurs in relation to the usage of the balance-sheet footing and the
profit. Finally the characteristics of the industries have to be checked, because manufacturing
industries are more capital-intensive, and service industries need more (Hortoványi, 2008).
71
The sample introduction of the single surveys is discussed in flash reports (Czakó et al, 1999,
Chikán et al, 2004 and 2010), and certain papers (Lesi, 2005, Wimmer and Csesznák, 2005,
Könczöl 2007) in details, further on I introduce the characteristics of the collective sample of
the 4 surveys in details.
3.3.3 Characteristics of the collective sample, introduction of control/descriptive
variables
I examine the collective sample of the 4 surveys by firm size, export activity, majority owner,
industry and geographical position. The firm size is examined by number of staff, assets and
revenue, because these are the basic firm size descriptive in the most entrepreneur researches
(Davidsson, 2004).
At the comparison of the single databases I experienced that the number of staff, assets and
revenue were questioned at the surveys in 1999, 2004 and 2009 as an accurate value, so they
are continuous variables, while at the first survey in 1996 categories were used. So I came to a
decision point, whereas:
A. I leave out the survey in 1996
B. The categorical variables of the survey in 1996 I recode to ratio/interval scale (e.g.:
replacement with category centres)
C. I recode the continuous variables of the following 3 survey into categorical variables
I decided on using solution C, because this is a monotonous transformation with low
distortion and the results of each survey can be interpreted. At creating the categories I take
the categories in 1996 for starting point, which although doesn’t match the later EU and
Hungarian legislation at separating small and middle-size businesses, it is in a better harmony
with the Anglo-Saxon researches which serve as a base of the competitiveness researches.
Figure 13 illustrates the distribution of the sample by number of staff categories in details.

72
FIGURE 13: Size by Full-time employment (FTE) categories
1-49 FTE
877% 50-99 FTE
35029%
100-299 FTE
35230%
300-499 FTE
14112%
500-999 FTE
13211%
1000+ FTE
13611%
Source of data: Calculated values based on VKK CEO databases 1996-2009
Three-fifth of the sample is from firms with a staff number between 50 and 300, so the ratio
of middle-size enterprises is dominant. Besides firms with above 300 employees are one-third
of the sample, and below 50 employees there are only 87 firms from the 1198 respondents.
At the assets and revenue categories the time value of money is a further problem. According
to this I converted every data to the price level at 31st December 2008 based on the MNB
(2010) consumer price level changes (appendix 6.1.). So the categories in 1996 have also
changed (320.1311% is the consumer price level at the end of 2008 instead of the end 1995),
namely (in order to simplicity round to ten million Ft, but the coding happened based on the
accurate data):
below 100 mHUF instead below 320mHUF
between 100 mHUF and 500 mHUF instead between 320mHUF and 1600mHUF
between 500 mHUF and 1000 mHUF instead between 1600 mHUF and 3200 mHUF,
and
above 1000 mHUF instead above 3200 mHUF.

73
In relation to the data I had to pay attention not only to the recoding, but also to that only the
data of the survey in 2004 were corrected from the 3 following surveys. Significant
proportion of the data in the other two surveys was in million Ft instead of thousand Ft, so
these have to be corrected before recoding.
After data cleaning and recoding the distributions of the sample by revenue and assets were
evolved, which are introduced in Figures 14 and 15. Examining the connections between
assets and revenue it can be stated that there is a positive strong significant relation between
the two categories (Spearman ρ value is 0.794, confidence is above 99%). Besides it is typical
that the assets are bigger than the revenue.
FIGURE 14: Size by revenue categories (at price levels on 2008. 12. 31.)
under 320
mHUF131
12%
320-1600
mHUF394
36%1600-3200
mHUF152
14%
over 3200
mHUF415
38%
Source of data: Calculated values based on VKK CEO databases 1996-2009
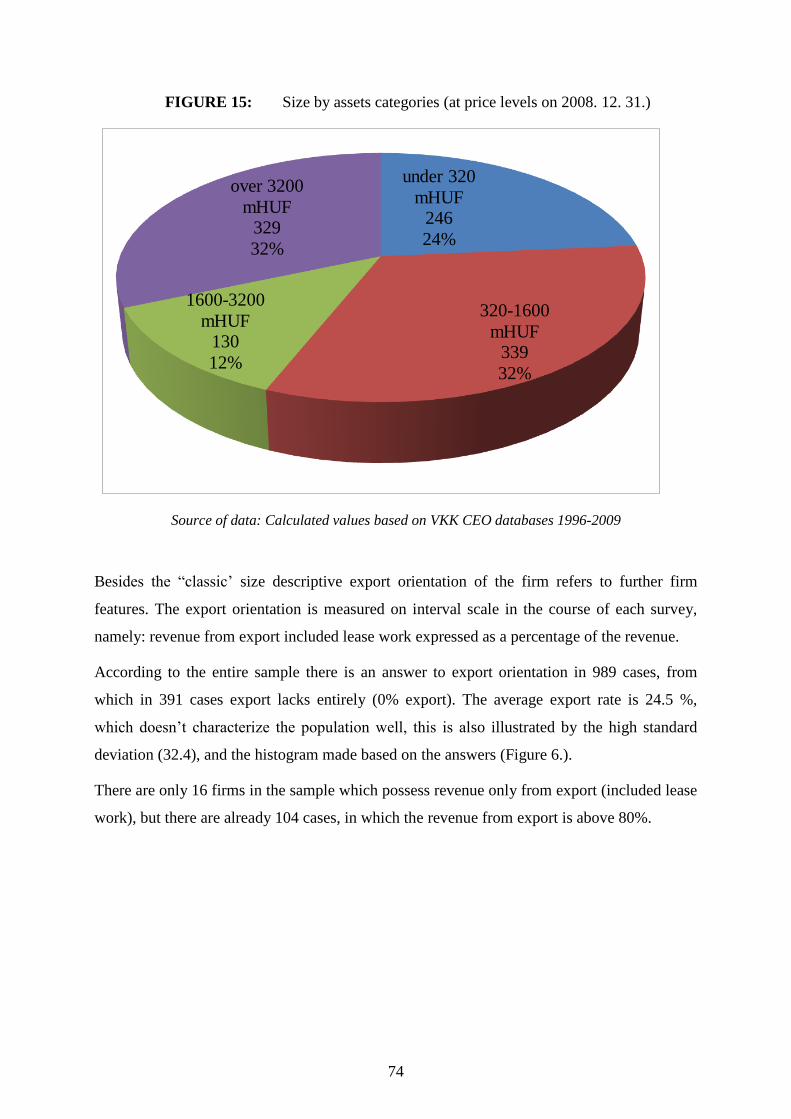
74
FIGURE 15: Size by assets categories (at price levels on 2008. 12. 31.)
under 320
mHUF246
24%
320-1600
mHUF339
32%
1600-3200
mHUF130
12%
over 3200
mHUF329
32%
Source of data: Calculated values based on VKK CEO databases 1996-2009
Besides the “classic’ size descriptive export orientation of the firm refers to further firm
features. The export orientation is measured on interval scale in the course of each survey,
namely: revenue from export included lease work expressed as a percentage of the revenue.
According to the entire sample there is an answer to export orientation in 989 cases, from
which in 391 cases export lacks entirely (0% export). The average export rate is 24.5 %,
which doesn’t characterize the population well, this is also illustrated by the high standard
deviation (32.4), and the histogram made based on the answers (Figure 6.).
There are only 16 firms in the sample which possess revenue only from export (included lease
work), but there are already 104 cases, in which the revenue from export is above 80%.

75
FIGURE 16: The distribution of the sample by export rate
Source of data: Calculated values based on VKK CEO databases 1996-2009
To characterize the owners of the firms were classified by property structure and the
ownership proportion of different property groups. The signals changed through the single
surveys, which are summarized in Table 9. At the single owners the proper ratio had to be
given in 1996, 1999 and 2004. To 2009 the variable has changed and the dominant owner was
signed directly, instead of the division of 100% among the single owners.
For the classification I followed the methodology of Wimmer and Csesznák (2005), I made
by reduction ownership categories: (1) state, (2) domestic individual and (3) foreign
ownership. At the classification it caused problems, that at the former 3 surveys at some firms
the sum of the given ownership proportions were bigger or smaller than 100%. It has to be
marked that related to the surveys in 1996, 1999 and 2004 the examined categories don’t
show if the firm has a dominant owner or how many owner possess the organisation.
Belonging to a certain firm category show what type of owner possesses the majority of the
enterprise, if there is such a characteristic form. I ranked a certain firm into one of the
ownership categories if the summed share of the examined types exceeds the 50%.
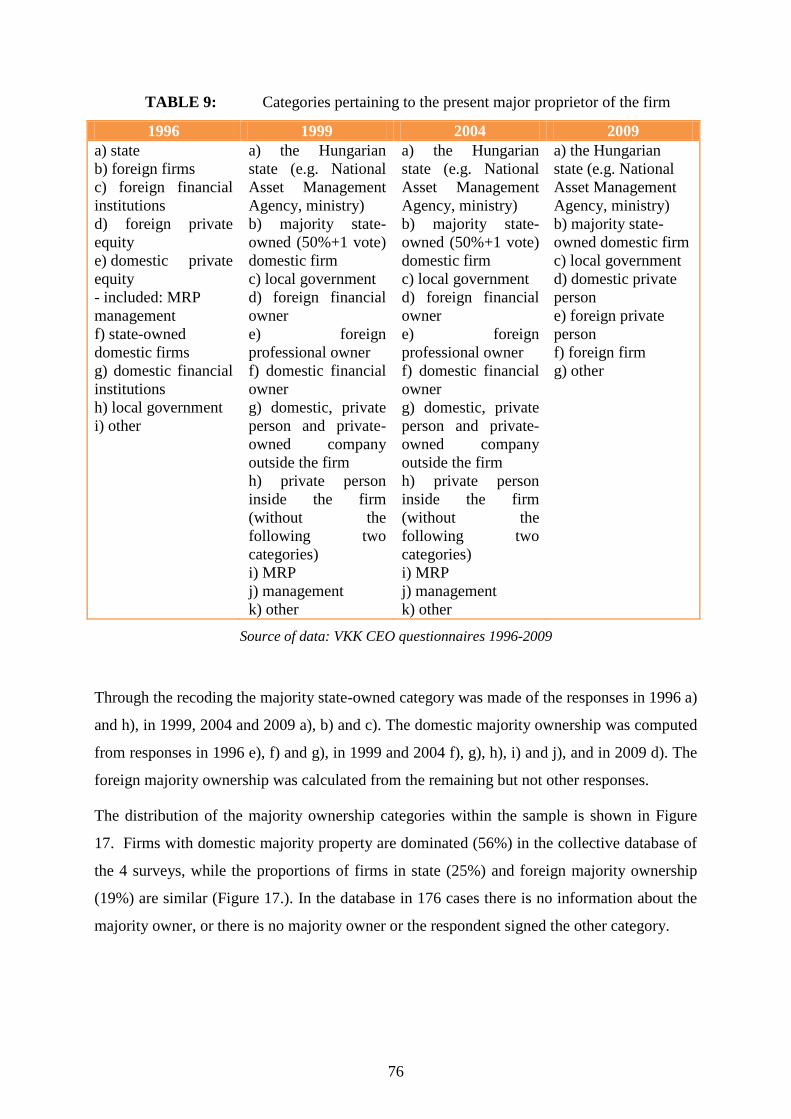
76
TABLE 9: Categories pertaining to the present major proprietor of the firm
1996 1999 2004 2009
a) state
b) foreign firms
c) foreign financial
institutions
d) foreign private
equity
e) domestic private
equity
- included: MRP
management
f) state-owned
domestic firms
g) domestic financial
institutions
h) local government
i) other
a) the Hungarian
state (e.g. National
Asset Management
Agency, ministry)
b) majority state-
owned (50%+1 vote)
domestic firm
c) local government
d) foreign financial
owner
e) foreign
professional owner
f) domestic financial
owner
g) domestic, private
person and private-
owned company
outside the firm
h) private person
inside the firm
(without the
following two
categories)
i) MRP
j) management
k) other
a) the Hungarian
state (e.g. National
Asset Management
Agency, ministry)
b) majority state-
owned domestic firm
c) local government
d) domestic private
person
e) foreign private
person
f) foreign firm
g) other
Source of data: VKK CEO questionnaires 1996-2009
Through the recoding the majority state-owned category was made of the responses in 1996 a)
and h), in 1999, 2004 and 2009 a), b) and c). The domestic majority ownership was computed
from responses in 1996 e), f) and g), in 1999 and 2004 f), g), h), i) and j), and in 2009 d). The
foreign majority ownership was calculated from the remaining but not other responses.
The distribution of the majority ownership categories within the sample is shown in Figure
17. Firms with domestic majority property are dominated (56%) in the collective database of
the 4 surveys, while the proportions of firms in state (25%) and foreign majority ownership
(19%) are similar (Figure 17.). In the database in 176 cases there is no information about the
majority owner, or there is no majority owner or the respondent signed the other category.

77
FIGURE 17: The distribution of the sample by the type of the majority proprietor
state
268
25%
domestic
595
56%
foreign
201
19%
Source of data: Calculated values based on VKK CEO databases 1996-2009
It is worth examining beyond the ownership background the main activity of the firms. I had
difficulties because the databases of the different surveys contain different classifications.
Related to this the database from 1996 is the most simple, while the respondent had to choose
from 7 opportunities. After this they had to sign the 3 most important scopes of activities.
I made up the industrial classification by using the methodology of Wimmer and Csesznák
(2005), based on the categories of the sample in 2004. I recoded the existing TEÁOR (I used
versions from ’98 and’08) numbers into 8 categories in case of the samples in 1999 and 2009,
in case of the sample in 1996 I matched clearly the 7 categories to the uniform categories.
Based on this the clearly classification of the sample elements has evolved, which distribution
is illustrated in Figure 18.
There are firms from the manufacturing industry (53%) in majority in the sample, but there is
enough service enterprise in the sample which enables to compare industries of different basic
characters. Beyond the classification of the sample along main activity, it is also a suitable
field to research the territorial positions of the headquarters of the enterprises.
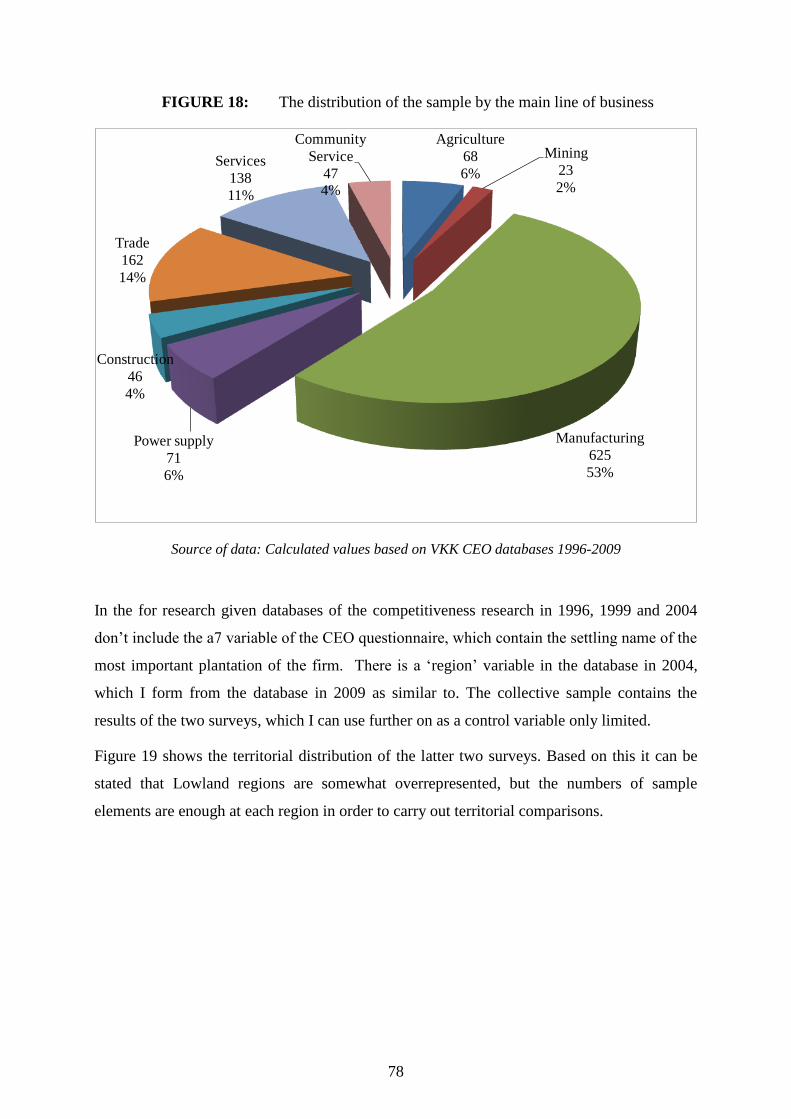
78
FIGURE 18: The distribution of the sample by the main line of business
Agriculture
68
6%
Mining
23
2%
Manufacturing
625
53%
Power supply
71
6%
Construction
46
4%
Trade
162
14%
Services
138
11%
Community
Service
474%
Source of data: Calculated values based on VKK CEO databases 1996-2009
In the for research given databases of the competitiveness research in 1996, 1999 and 2004
don’t include the a7 variable of the CEO questionnaire, which contain the settling name of the
most important plantation of the firm. There is a ‘region’ variable in the database in 2004,
which I form from the database in 2009 as similar to. The collective sample contains the
results of the two surveys, which I can use further on as a control variable only limited.
Figure 19 shows the territorial distribution of the latter two surveys. Based on this it can be
stated that Lowland regions are somewhat overrepresented, but the numbers of sample
elements are enough at each region in order to carry out territorial comparisons.

79
FIGURE 19: The distribution of the sample by territorial position
Central Hungary
188
34%
Central
Transdanubia
438%
Western
Transdanubia
478%
Southern
Transdanubia
478%
Northern Hungary
50
9%
Northen Plain
84
15%
Southern Plain
98
18%
Source of data: Calculated values based on VKK CEO databases 1996-2009
To sum it up the foregoing in this chapter it can be determined that the research of the
examined problem is attainable with the databases of the “In Global Competition’ research.
In this chapter I determined the research methodology and the sample characteristics in
details. After the explanation of the theoretical and methodological scopes I come to the
introduction of the examination results.
In the next chapter the results of the quantitative research will be introduced. The summary,
the interpretation and the wider arrangement in the literature of the results are coming in the
chapter afterwards.
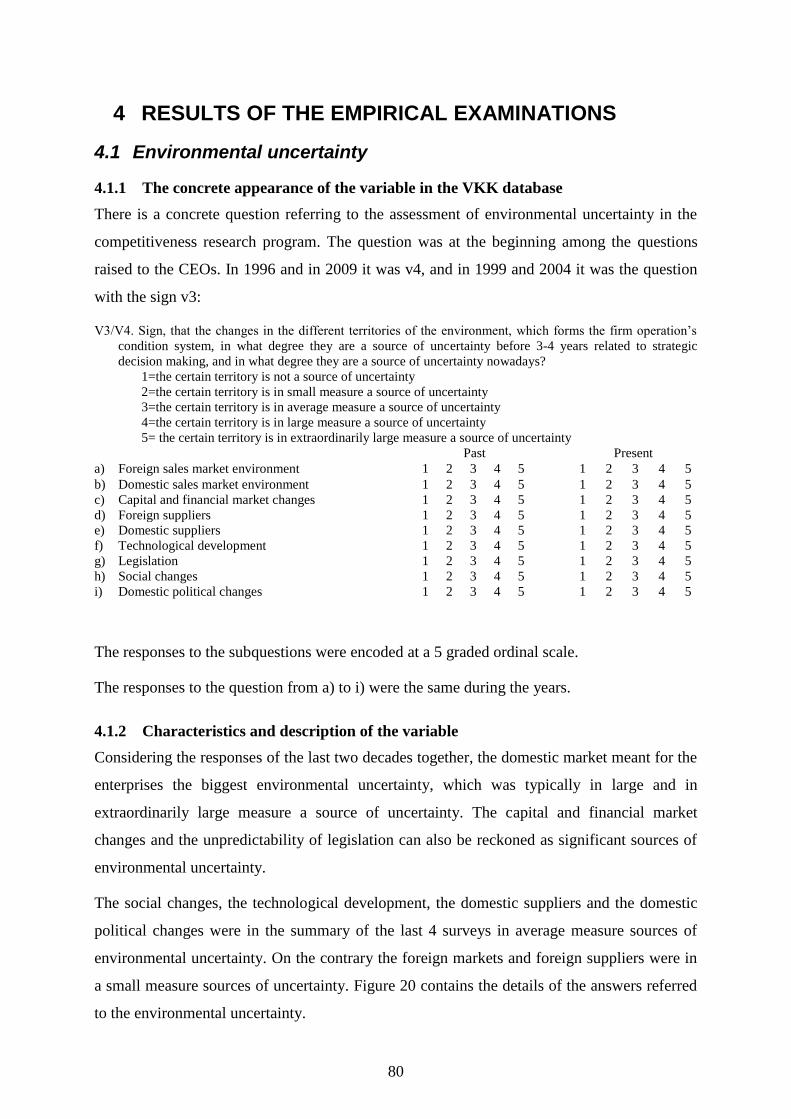
80
4 RESULTS OF THE EMPIRICAL EXAMINATIONS
4.1 Environmental uncertainty
4.1.1 The concrete appearance of the variable in the VKK database
There is a concrete question referring to the assessment of environmental uncertainty in the
competitiveness research program. The question was at the beginning among the questions
raised to the CEOs. In 1996 and in 2009 it was v4, and in 1999 and 2004 it was the question
with the sign v3:
V3/V4. Sign, that the changes in the different territories of the environment, which forms the firm operation’s
condition system, in what degree they are a source of uncertainty before 3-4 years related to strategic
decision making, and in what degree they are a source of uncertainty nowadays?
1=the certain territory is not a source of uncertainty
2=the certain territory is in small measure a source of uncertainty
3=the certain territory is in average measure a source of uncertainty
4=the certain territory is in large measure a source of uncertainty
5= the certain territory is in extraordinarily large measure a source of uncertainty
Past Present
a) Foreign sales market environment 1 2 3 4 5 1 2 3 4 5
b) Domestic sales market environment 1 2 3 4 5 1 2 3 4 5
c) Capital and financial market changes 1 2 3 4 5 1 2 3 4 5
d) Foreign suppliers 1 2 3 4 5 1 2 3 4 5
e) Domestic suppliers 1 2 3 4 5 1 2 3 4 5
f) Technological development 1 2 3 4 5 1 2 3 4 5
g) Legislation 1 2 3 4 5 1 2 3 4 5
h) Social changes 1 2 3 4 5 1 2 3 4 5
i) Domestic political changes 1 2 3 4 5 1 2 3 4 5
The responses to the subquestions were encoded at a 5 graded ordinal scale.
The responses to the question from a) to i) were the same during the years.
4.1.2 Characteristics and description of the variable
Considering the responses of the last two decades together, the domestic market meant for the
enterprises the biggest environmental uncertainty, which was typically in large and in
extraordinarily large measure a source of uncertainty. The capital and financial market
changes and the unpredictability of legislation can also be reckoned as significant sources of
environmental uncertainty.
The social changes, the technological development, the domestic suppliers and the domestic
political changes were in the summary of the last 4 surveys in average measure sources of
environmental uncertainty. On the contrary the foreign markets and foreign suppliers were in
a small measure sources of uncertainty. Figure 20 contains the details of the answers referred
to the environmental uncertainty.

81
FIGURE 20: Sources of uncertainty
40%
37%
36%
32%
17%
16%
15%
15%
14%
13%
13%
13%
10%
8%
12%
9%
8%
6%
22%
22%
13%
9%
21%
19%
23%
22%
25%
21%
24%
20%
19%
17%
18%
15%
13%
8%
23%
21%
19%
18%
30%
25%
33%
31%
36%
31%
33%
29%
35%
28%
36%
29%
27%
20%
10%
13%
19%
22%
20%
24%
21%
22%
19%
25%
20%
24%
25%
30%
24%
31%
29%
34%
6%
7%
13%
19%
12%
17%
7%
9%
6%
10%
9%
14%
11%
17%
9%
16%
23%
32%
0% 20% 40% 60% 80% 100%
Foreign suppliers - past 3-4 years
Foreign suppliers - present
Foreign sales market environment - past 3-4 years
Foreign sales market environment - present
Domestic political changes - past 3-4 years
Domestic political changes - present
Domestic suppliers - past 3-4 years
Domestic suppliers - present
Technological development - past 3-4 years
Technological development - present
Social changes - past 3-4 years
Social changes - present
Legislation - past 3-4 years
Legislation - present
Capital and financial market changes - past 3-4 years
Capital and financial market changes - present
Domestic sales market environment - past 3-4 years
Domestic sales market environment - present
it is not a source of uncertainty it is in small measure a source of uncertainty
it is in average measure a source of uncertainty it is in large measure a source of uncertainty
it is in extraordinarily large measure a source of uncertainty
Source of data: Calculated values based on VKK CEO databases 1996-2009
After the summarized interpretation it is worth examining the temporal development of
environmental uncertainty too. Within it I discuss in detail the separation of two effects: (1)
through the single surveys which value was the most frequent answer (mode), and (2) how
much the respondent takes the environment in the present as more uncertain than the past.
4.1.3 The evolution of the assessment uncertainty through the surveys
Through the examination of the temporal development of uncertainty I analyze the evolution
of the single factors’ most frequent responses (mode), because this is the appropriate method
in order to compare the central tendency of the variables measured on ordinal scale.
To demonstrate the temporal development I interpreted from 1-1 survey 2-2 variables,
whereas the values in 1996, 1999, 2004 and 2009 are concerned to the present responses of
the given survey, and the inter-values are referred to the past responses of the given survey.
Figure 21 demonstrates this temporal development.
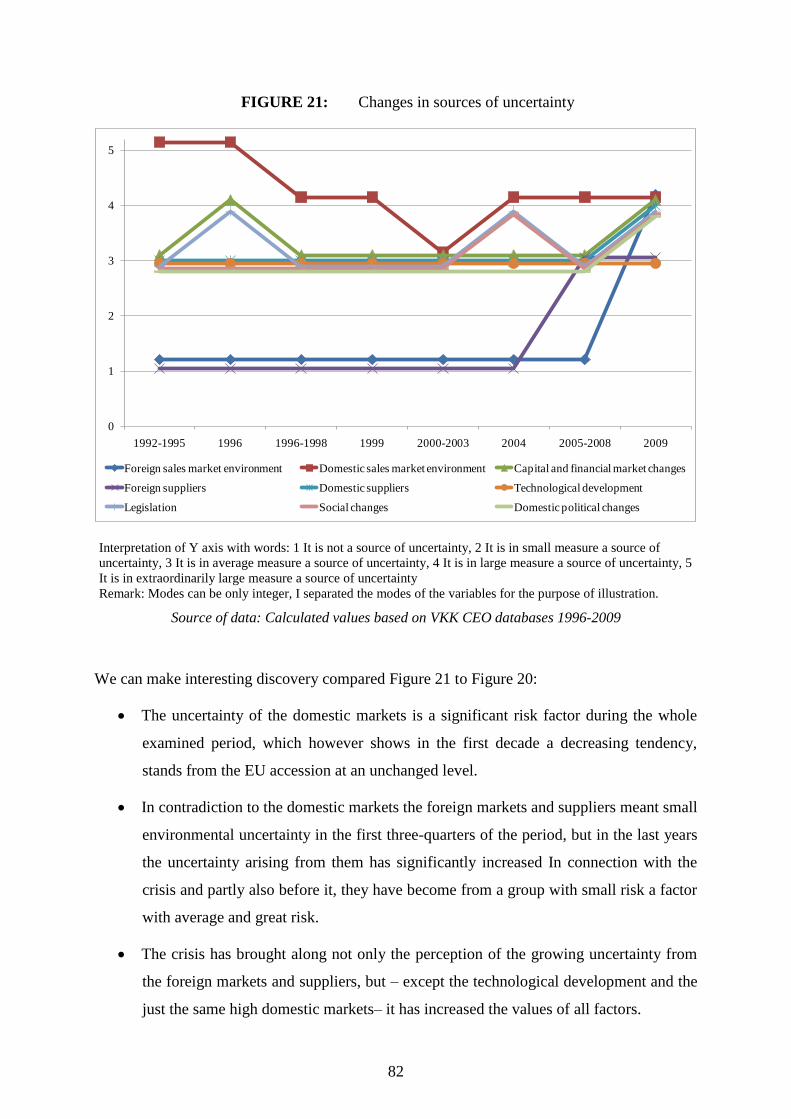
82
FIGURE 21: Changes in sources of uncertainty
0
1
2
3
4
5
1992-1995 1996 1996-1998 1999 2000-2003 2004 2005-2008 2009
Foreign sales market environment Domestic sales market environment Capital and financial market changes
Foreign suppliers Domestic suppliers Technological development
Legislation Social changes Domestic political changes
Interpretation of Y axis with words: 1 It is not a source of uncertainty, 2 It is in small measure a source of
uncertainty, 3 It is in average measure a source of uncertainty, 4 It is in large measure a source of uncertainty, 5
It is in extraordinarily large measure a source of uncertainty
Remark: Modes can be only integer, I separated the modes of the variables for the purpose of illustration.
Source of data: Calculated values based on VKK CEO databases 1996-2009
We can make interesting discovery compared Figure 21 to Figure 20:
The uncertainty of the domestic markets is a significant risk factor during the whole
examined period, which however shows in the first decade a decreasing tendency,
stands from the EU accession at an unchanged level.
In contradiction to the domestic markets the foreign markets and suppliers meant small
environmental uncertainty in the first three-quarters of the period, but in the last years
the uncertainty arising from them has significantly increased In connection with the
crisis and partly also before it, they have become from a group with small risk a factor
with average and great risk.
The crisis has brought along not only the perception of the growing uncertainty from
the foreign markets and suppliers, but – except the technological development and the
just the same high domestic markets– it has increased the values of all factors.
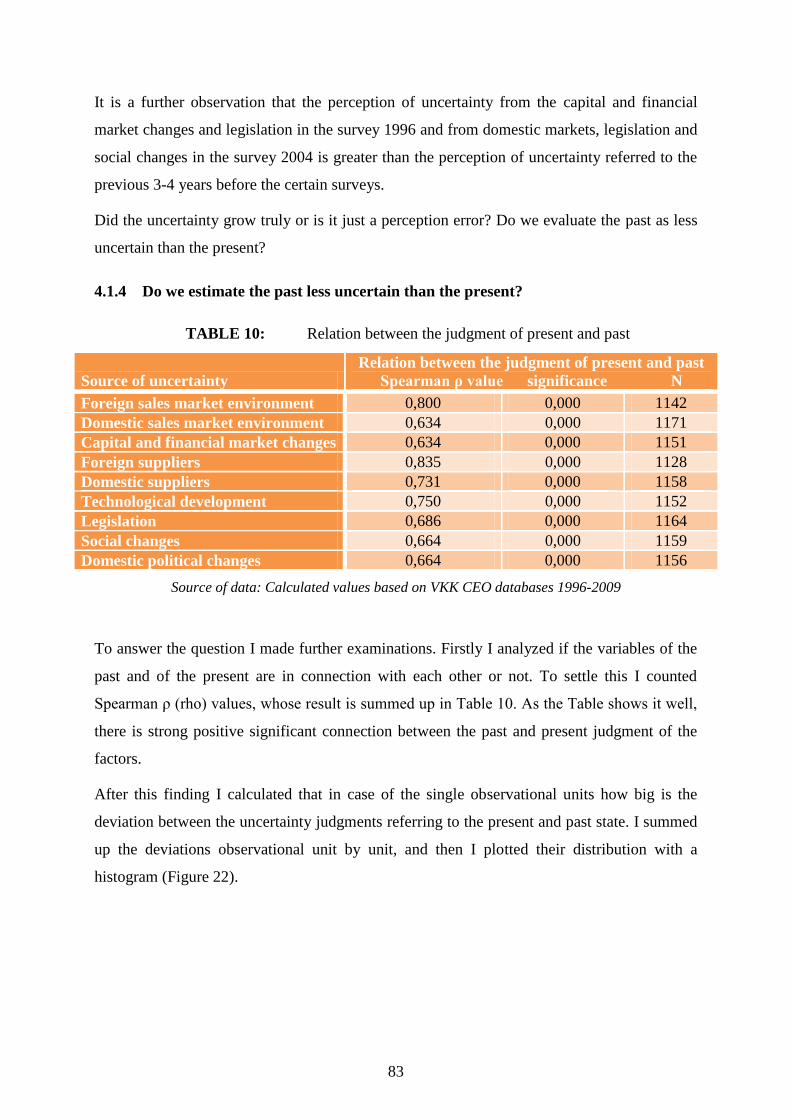
83
It is a further observation that the perception of uncertainty from the capital and financial
market changes and legislation in the survey 1996 and from domestic markets, legislation and
social changes in the survey 2004 is greater than the perception of uncertainty referred to the
previous 3-4 years before the certain surveys.
Did the uncertainty grow truly or is it just a perception error? Do we evaluate the past as less
uncertain than the present?
4.1.4 Do we estimate the past less uncertain than the present?
TABLE 10: Relation between the judgment of present and past
Source of uncertainty
Relation between the judgment of present and past
Spearman ρ value significance N
Foreign sales market environment 0,800 0,000 1142
Domestic sales market environment 0,634 0,000 1171
Capital and financial market changes 0,634 0,000 1151
Foreign suppliers 0,835 0,000 1128
Domestic suppliers 0,731 0,000 1158
Technological development 0,750 0,000 1152
Legislation 0,686 0,000 1164
Social changes 0,664 0,000 1159
Domestic political changes 0,664 0,000 1156
Source of data: Calculated values based on VKK CEO databases 1996-2009
To answer the question I made further examinations. Firstly I analyzed if the variables of the
past and of the present are in connection with each other or not. To settle this I counted
Spearman ρ (rho) values, whose result is summed up in Table 10. As the Table shows it well,
there is strong positive significant connection between the past and present judgment of the
factors.
After this finding I calculated that in case of the single observational units how big is the
deviation between the uncertainty judgments referring to the present and past state. I summed
up the deviations observational unit by unit, and then I plotted their distribution with a
histogram (Figure 22).

84
FIGURE 22: How much do we perceive the present more uncertain than the past?
Interpretation of 1 unit: In case of the 9 potential factors the respondent valued in one instance the environment
with one grade more uncertain at the moment of the response than 3-4 years ago. So, if a respondent signed the
past uncertainty small in case of every factor and the present one extraordinarily large, the value of the scale will
be 36, and in reversed case -36.
Source of data: Calculated values based on VKK CEO database 1996-2009
Figure 22 shows with the introduced connections in Table 10 well that the perception of the
past and present uncertainty is interdependent. At third part of the managers (445) for the
manager the level of uncertainty coming from all resultants doesn’t differ in the present and in
the last 3-4 years.
Besides, in average the uncertainty is in a small measure higher in the present than in the past
which is marked by the mean: 1.89 and standard deviation: 5.218. We get similar distributions
by examining the phenomenon along yearly subsamples which are in appendix 6.2. in details.
The deviation on the average in 1996 was 2.29, in 1999 was 1.95, in 2004 was 1.76, and in
2009 was 2.48, according to that the present is more uncertain than the past.

85
The standard deviation value alters form year to year, its values is in 2004 the lowest (3.906),
and in 1996 the highest (6.318) (In 1999 the standard deviation value is 4.83, in 2009 it is
5.306).
On the whole the perception of the past uncertainty was at every survey higher than the
perception of present uncertainty; however its degree is low, so it doesn’t distort basically the
uncertainty perception of the inter-periods.
4.1.5 Control variable’s relation to the variable
At 99.99% confidence level the perception of the environmental uncertainty is independent
from the organisation size variables according to number of staff, assets and revenue. Beyond
this, there is no provable connection between the territorial position (region) and perception of
uncertainty.
There is a provable significant connection at 99.99% level between the export orientation and
the perception of several factors of the environmental uncertainty, namely:
for enterprises with higher export rate the foreign market environment means a more
significant uncertainty factor (Spearman ρ value is 0.581 for the past and 0.547 for the
present)
for enterprises with higher export rate the domestic sales environment means a lower
uncertainty factor (Spearman ρ value is -0.169 for the past and -0.257 for the present)
for enterprises with higher export rate the foreign suppliers mean a more significant
uncertainty factor (Spearman ρ value is 0.245 for the past and 0.213 for the present)
for enterprises with higher export rate the domestic suppliers mean a lower uncertainty
factor (Spearman ρ value is -0.112 for the past (99.9% confidence level) and -0.160
for the present)
for enterprises with higher export rate the perception of uncertainty from legislation
and social changes is lower in the present (Spearman ρ value is -0.165 for the and -
0.200 both for the present)
The uncertainty from the domestic political changes affects enterprises with higher
export rate less (Spearman ρ value is -0.144 for the past and -0.227 for the present)

86
The type of the majority owner is in connection with several environmental uncertainty
factors. The type of the owner is a categorical (nominal) variable, so I analyzed the relations
with crosstabs and φ (phi) value. There is a connection at 99.9% confidence level between the
type of the owner and:
the foreign sales market environment (φpast=0.240, φpresent=0.241). Typically firms in
majority state property take the foreign markets for a source of uncertainty not or in
small measure (65.8% past, 58.4% present); on the contrary enterprises in majority
foreign property take them for a source of uncertainty in large or extraordinarily large
measure (42.6% past, 52.9% present). The opinion of firms in majority domestic
property is between these two.
the present evaluation of the domestic sales environment (φpresent=0.183). The state-
owned firms reckon the domestic markets as a great or extremely great uncertainty
factor (63.2%) as well as enterprises in majority domestic property (69.3%).
Enterprises in majority foreign property take domestic markets for less an uncertainty
factor.
the past uncertainty of the capital and financial market changes (φpast=0.221). Firms in
private ownership were influenced to a larger extent through the uncertainty from the
capital and financial markets than state-owned firms.
the foreign suppliers (φpast=0.261, φpresent=0.249). For the majority of the state-owned
organisations foreign suppliers didn’t mean (92.7%) and don’t mean (90.5%) an
uncertainty factor above the average, while for domestic and foreign firms is this
group more uncertain, but the proportion of the group with high or extremely high
uncertainty is also not bigger than 25%.
The main activity of the enterprises and certain sources of environmental uncertainty are also
not independent from each other. We can state at 99.9% confidence that there is a connection
between the main activity of the firm and:

87
the perception of foreign sales environmental uncertainty (φpast=0.410, φpresent=0.411).
The uncertainty factor is of a low degree in the extractive industry, energy industry
construction industry, trade, services and in community services. It is average or high
in agriculture and manufacturing industry.
the domestic market sales environment at the time of the surveys (φpresent=0.248). The
uncertainty factor is high or extremely high in agriculture, manufacturing industry,
construction industry, trade, service and community services. In the extractive
industry and energy industry the domestic market environment is a source of
uncertainty in an average measure.
the perception of uncertainty from capital and financial markets in the past
(φpast=0.273). The perception of uncertainty is average or high in agriculture,
manufacturing industry, and trade. It is average in the extractive industry, construction
industry and average or low in case of services and community services and low in the
energy industry.
the uncertainty from foreign suppliers (φpast=0.293, φpresent=0.264). Foreign suppliers
are not or in a small measure a source of uncertainty in agriculture, extractive industry,
energy industry, construction industry, services and community services. It is low or
average in the manufacturing industry and trade.
the domestic suppliers (φpast=0.250, φpresent=0.229). Uncertainty from domestic
suppliers is at an average degree in agriculture, extractive industry, manufacturing
industry, construction industry and trade. It is at a low or average level in energy
industry, service and community services.
the uncertainty from legislation at the time of the surveys (φpresent=0.240). It is average
or extremely high in agriculture, energy industry and trade. It is average or high in the
manufacturing industry, construction industry, services and community services.
There are no or just a low degree of uncertainty in the extractive industry.

88
4.2 The firm’s relation to the environmental changes
4.2.1 The concrete appearance of the variable in the VKK database
The firm’s relation to the environmental changes is measured by the questions v5 (1996, 1999
and 2009), and v4 (2004) of the CEO questionnaire.
V4/V5. Describe comprehensively, how your company set itself against the environmental changes in the period
between 1992-1995/1995-1998/2000-2003/2005-2008. Which characterization does best describe the
behaviour of the firm?
My enterprise in the period between 1992-1995/1995-1998/2000-2003/2005-2008
a) recognized the major environmental changes always late b) recognized the major environmental changes, but was not able to find the proper responses to the
challenges
c) recognized the major environmental changes and followed typically a reactive strategy that responded
to the environmental challenges afterwards
d) was usually able to forecast the major environmental changes, and followed preceding preparing on
time behaviour
e) was usually able to forecast the major environmental changes, prepared itself for those in time and
adapted itself to them with proper responses, it even endeavoured consciously to influence the
environmental conditions
The variables were encoded to dichotomy variables subquestions by subquestions.
The variable was in content the same during the years.
4.2.2 Characteristics and description of the variable
The relation of the firms to the environmental changes shows an unaltered picture (Table 11.
and Figure 23.), altogether one tenth of the enterprises are able to go to meet changes and
influence its environment.
TABLE 11: Adaptation ability of the firms between 1992 and 2009
The changes were by the firm 1996 1999 2004 2009
recognized late 2.2% 1.3% 2.9% 3.1%
recognized in time,
but it didn’t find a proper solution to them 12.3% 9.1% 11.3% 9.7%
recognized in time, but it reacted on them later 36.5% 38.1% 37.0% 43.8%
forecasted, it was prepared in time 37.3% 40.7% 37.3% 34.8%
forecasted and it influenced them 11.7% 10.7% 11.6% 8.6%
Source of data: VKK CEO databases 1996-2009. Remark: the data sets are signed at the date of the
survey, but go for the former 3-4 years.
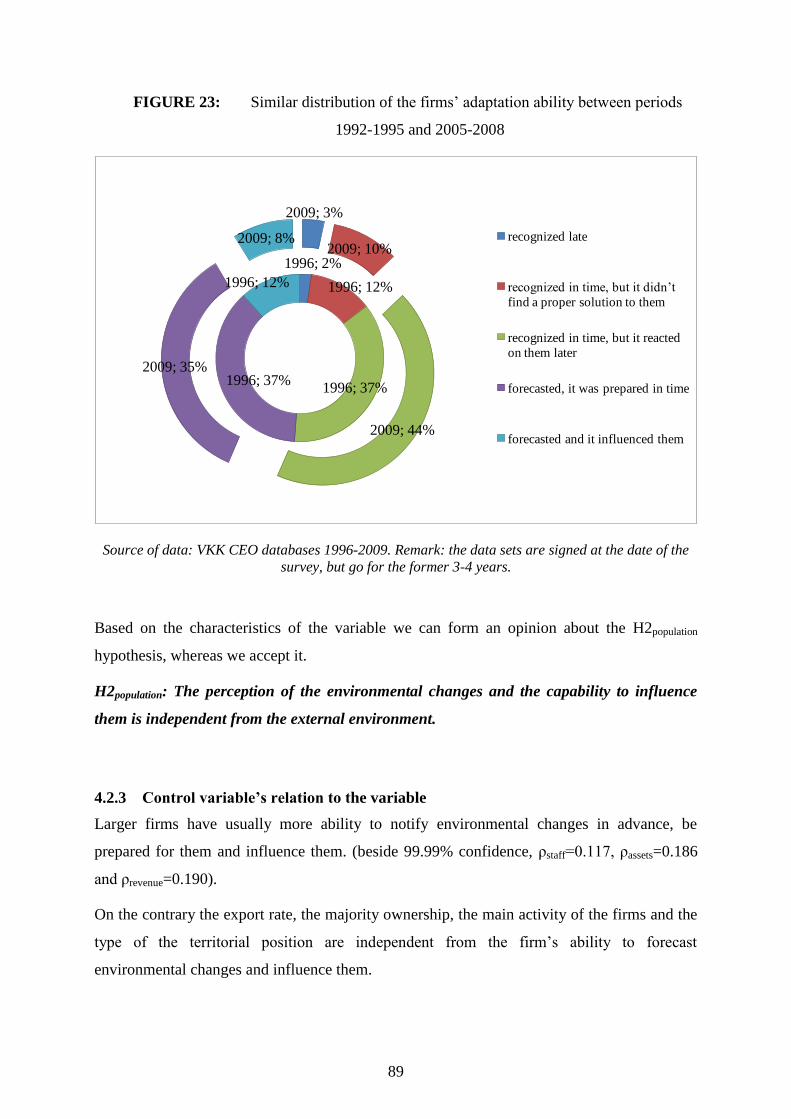
89
FIGURE 23: Similar distribution of the firms’ adaptation ability between periods
1992-1995 and 2005-2008
1996; 2%
1996; 12%
1996; 37%1996; 37%
1996; 12%
2009; 3%
2009; 10%
2009; 44%
2009; 35%
2009; 8% recognized late
recognized in time, but it didn’t
find a proper solution to them
recognized in time, but it reacted
on them later
forecasted, it was prepared in time
forecasted and it influenced them
Source of data: VKK CEO databases 1996-2009. Remark: the data sets are signed at the date of the
survey, but go for the former 3-4 years.
Based on the characteristics of the variable we can form an opinion about the H2population
hypothesis, whereas we accept it.
H2population: The perception of the environmental changes and the capability to influence
them is independent from the external environment.
4.2.3 Control variable’s relation to the variable
Larger firms have usually more ability to notify environmental changes in advance, be
prepared for them and influence them. (beside 99.99% confidence, ρstaff=0.117, ρassets=0.186
and ρrevenue=0.190).
On the contrary the export rate, the majority ownership, the main activity of the firms and the
type of the territorial position are independent from the firm’s ability to forecast
environmental changes and influence them.

90
4.3 The strategy followed
4.3.1 The concrete appearance of the variable in the VKK database
There is a concrete question referring to the strategy followed in the competitiveness research
program. The question was at the beginning among the questions raised to the CEOs. In all
survey it was the question v2:
V2. Sign, which characterization describes best your firm’s followed strategy in the last 3-4 years! If there was a
significant change in the strategy during the signed period, sign more squares and write down next to it the year
in which the strategy was characteristic!
My firm in the period between 1992-1995/1995-1998/2000-2003/2005-2008 typically Year
a) followed withdrawal strategy: concentrated its resources to defensible positions …...
b) followed defending strategy: concentrated its resources to defence of existing positions …...
c) followed stability strategy: concentrated its resources to strengthen its existing positions …...
d) followed growth strategy: concentrated its resources to build up new strategic positions …...
e) followed attacking strategy: concentrated its resources to build up new strategic positions and to
weaken the competitors’ positions …...
f) followed focusing strategy: concentrated its resources to a certain niche market segment …...
g) followed no consistent strategy. ......
The answers by subquestions were put into 2 variables, into a dichotomy variable as a
function of the certain question was selected or not, and, if it was selected, into another
variable which contained the year too.
During the years there were 2 important changes in the question:
Since 2004 the (f) focusing strategy was got into the question, which was not included
in the former surveys
In 2009 the strategy referred to the year 2009 appeared in a separate question, which
got extra attention under the influence of the crisis
4.3.2 Characteristics and description of the variable
The variable contains data about the in the previous 3-4 years followed strategy of the firms
from 1992 to 2009. The four surveys contain 1240 observations. From these there are 1131
cases with an answer to this question.
It can be proved based on the summary of the 1925 response-elements to this question (Table
12.) that the stability (34.75%) and the growth (29.19%) strategies are the two most frequent
ones examining the 4 surveys aggregately. It comes up as a question that what is the
proportion of the single strategies in the single periods?
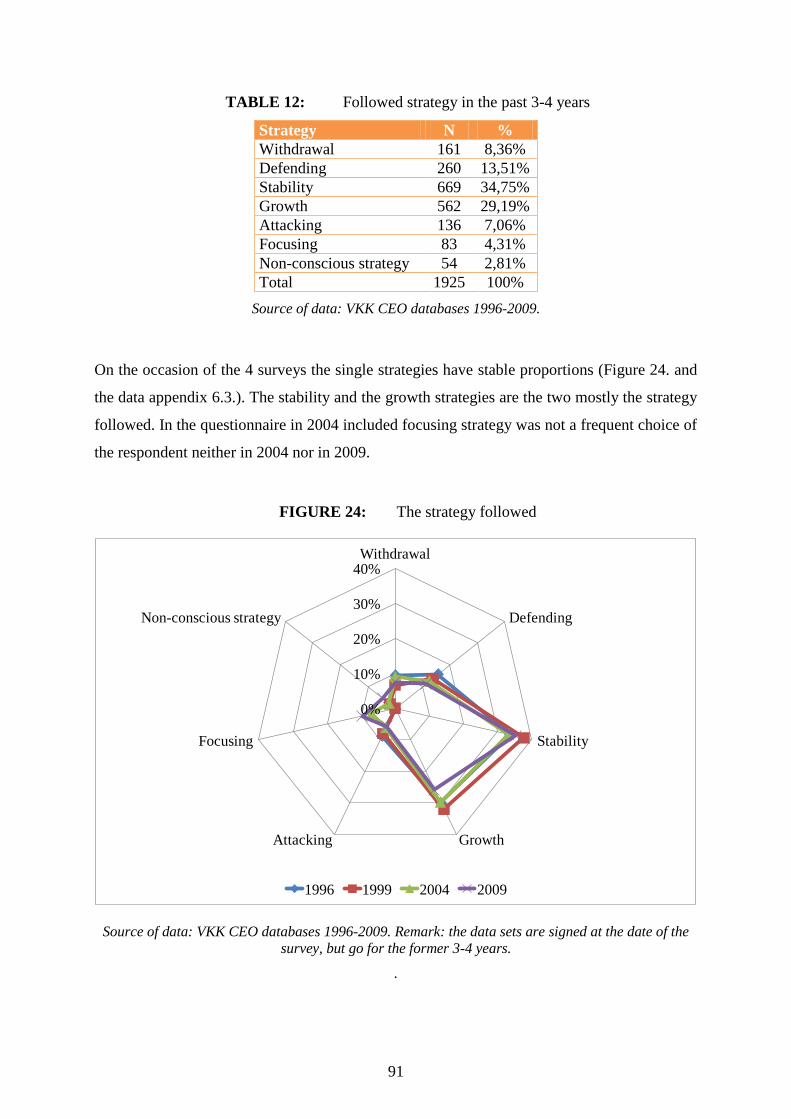
91
TABLE 12: Followed strategy in the past 3-4 years
Strategy N %
Withdrawal 161 8,36%
Defending 260 13,51%
Stability 669 34,75%
Growth 562 29,19%
Attacking 136 7,06%
Focusing 83 4,31%
Non-conscious strategy 54 2,81%
Total 1925 100%
Source of data: VKK CEO databases 1996-2009.
On the occasion of the 4 surveys the single strategies have stable proportions (Figure 24. and
the data appendix 6.3.). The stability and the growth strategies are the two mostly the strategy
followed. In the questionnaire in 2004 included focusing strategy was not a frequent choice of
the respondent neither in 2004 nor in 2009.
FIGURE 24: The strategy followed
0%
10%
20%
30%
40%Withdrawal
Defending
Stability
GrowthAttacking
Focusing
Non-conscious strategy
1996 1999 2004 2009
Source of data: VKK CEO databases 1996-2009. Remark: the data sets are signed at the date of the
survey, but go for the former 3-4 years.
.
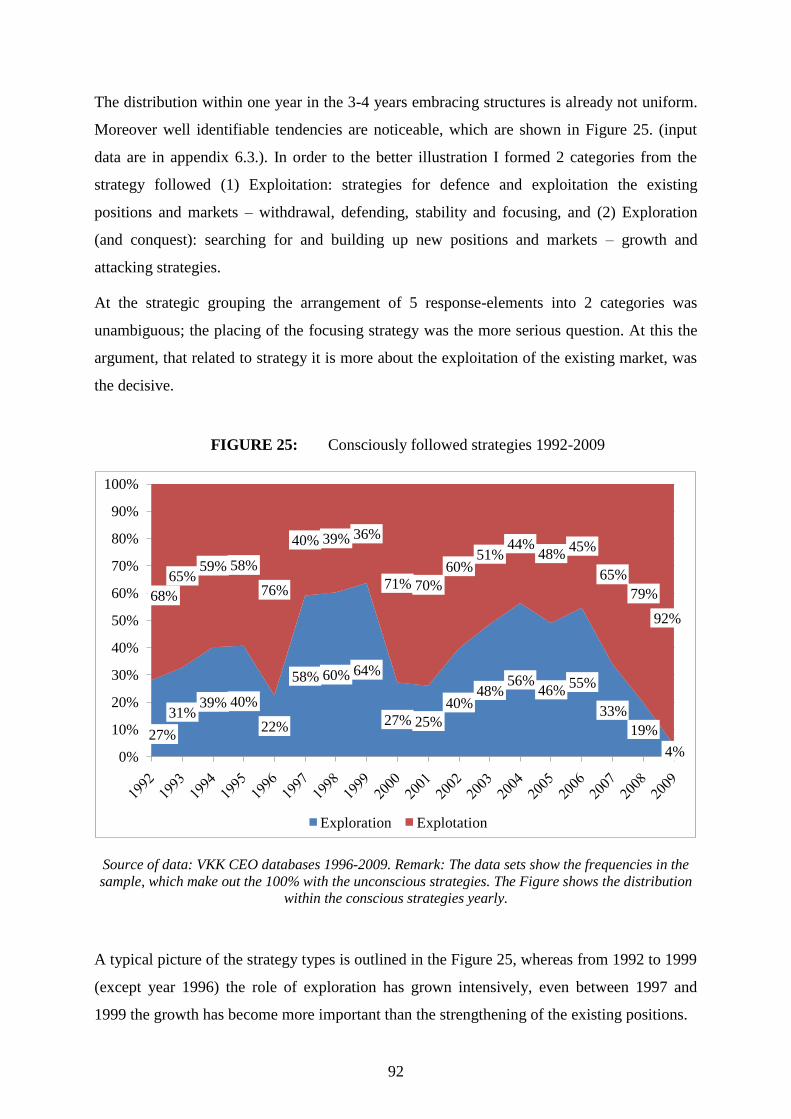
92
The distribution within one year in the 3-4 years embracing structures is already not uniform.
Moreover well identifiable tendencies are noticeable, which are shown in Figure 25. (input
data are in appendix 6.3.). In order to the better illustration I formed 2 categories from the
strategy followed (1) Exploitation: strategies for defence and exploitation the existing
positions and markets – withdrawal, defending, stability and focusing, and (2) Exploration
(and conquest): searching for and building up new positions and markets – growth and
attacking strategies.
At the strategic grouping the arrangement of 5 response-elements into 2 categories was
unambiguous; the placing of the focusing strategy was the more serious question. At this the
argument, that related to strategy it is more about the exploitation of the existing market, was
the decisive.
FIGURE 25: Consciously followed strategies 1992-2009
27%
31%39% 40%
22%
58% 60% 64%
27% 25%
40%48%
56%46%
55%
33%
19%
4%
68%
65%59% 58%
76%
40% 39% 36%
71% 70%
60%51%
44%48%
45%
65%
79%
92%
0%
10%
20%
30%
40%
50%
60%
70%
80%
90%
100%
Exploration Explotation
Source of data: VKK CEO databases 1996-2009. Remark: The data sets show the frequencies in the
sample, which make out the 100% with the unconscious strategies. The Figure shows the distribution
within the conscious strategies yearly.
A typical picture of the strategy types is outlined in the Figure 25, whereas from 1992 to 1999
(except year 1996) the role of exploration has grown intensively, even between 1997 and
1999 the growth has become more important than the strengthening of the existing positions.

93
In 2000 after the consolidation, when the firms were focusing again on the stabilization of the
positions, to 2006 the proportion of the exploration strategies has grown again, but it was
slower than in the earlier decade. After this the rate of the exploration strategies decreases
constantly, which fell from 55% in 2006 to 4% in 2009.
By the comparison between the found results and the earlier (Figure 5) examined
macroeconomic situation there is a possibility to analyze the H1population hypothesis, whereas I
accept the hypothesis.
H1population: The economic growth on the macro level fosters exploration while recession
retains exploitation.
After the interpretation of the aggregated data it is worth analyzing the individual strategies of
the firms. 1240 observations are identifiable, from which 931 answered the question and from
these 877 followed at least one strategy. This number compared with the 1925 responses and
the 1871 consciously the strategy followed refers to that the enterprises which followed a
strategy altered on average on one occasion strategy during 3-4 years. It is a question that the
firms remained in the same type of adaptation strategy (exploration, exploitation), or changed
that?
Based on the sample 588 firms followed 1, 1337 firms followed 2, 130 firms followed 3, 38
firms followed 4, 5 firms followed 5 and 3 firms followed 6 kind of strategies in the previous
3-4 years of the surveys. From enterprises, which followed more strategies (513), 389
followed explorative and 483 exploitative strategy. 154 firms followed exclusively
explorative or exclusively exploitative strategy, as against the 359 enterprises which followed
both explorative and exploitative strategy during the examined periods.
Entirely from the 1101 firms which followed some kind of consciously defined strategy, 359
(32.6%) is the number of the firms which changed the explorative and exploitative strategy
within 3-4 years or followed them simultaneously. These firms are ambidextrous
organisations. The distribution of ambidextrous enterprises shows a similar picture at the
surveys in 1996 and 2009 and in 1999 and 2004 (Table 13).
TABLE 13: Followed strategy in the last 3-4 years
1996 1999 2004 2009 Total
Non- ambidextrous 253 197 196 235 881
Ambidextrous 73 103 105 78 359
Total 326 300 301 313 1240
Source of data: Calculated values based on VKK CEO databases 1996-2009

94
4.3.3 Control variable’s relation to the variable
I examine the control variables on the formed variables and not on the original ones, namely
whether the firm followed an explorative and/or an exploitative strategy in the last 3-4 years.
Simultaneously I analyze the ambidexterity’s relation to the control variables.
We can state with 99.9% confidence that there is a relation between every examined category
of the firm’s size and the explorative strategy (ρstaff=0.123, ρassets=0.112 and ρrevenue=0.161),
whereas the bigger enterprises follow explorative (growth or attacking) strategy at a higher
probability than smaller firms. On the contrary in case of the exploitative strategy we can state
only at the revenue and assets (ρassets=-0.108 and ρrevenue=-0.121), that it is characteristic more
for smaller firms than bigger enterprises, because there is no significant connection between
the number of staff category and the exploitation.
The ambidexterity is neither a function of the firm’s size nor the export rate from the revenue.
This latter feature is true for both the exploitative and explorative strategies, whereas there is
no significant connection between the strategies and the export rate.
The type of the majority owner has an influence on the followed strategy of the firms (99.9%
confidence, φexploitative=0.155, φexplorative=0.116) but not on the ambidexterity. 75.7% of the
state-owned firms, 68.1% of the firms in domestic majority ownership and 53.7% of the firms
in foreign majority ownership follow exploitative strategy. As opposed to this 45.5% of the
state-owned firms, 48.7% of the domestic and 62.2% of the foreign firms follow explorative
strategy.
There is no significant connection between the strategy followed, the ambidexterity and the
main activity of the organisations. There is a significant relation between the region and the
exploitative activity at 99.9% confidence (φexploitative=0.211), whereas firms of the Middle-
Hungarian Region follow an exploitative activity less than the firms in other regions, but the
exploitation is true for 57.4% of the firms, however it is a lower value compared to the
average 68.8%.

95
4.4 Competitive performance of the firms
4.4.1 The concrete appearance of the variable in the VKK database
V7/8/14/16 Which level has the firm reached at the following fields which characterize its performance
compared to its strongest competitors in the last 2-3 years? If the enterprise operates in more than one
industry, please answer referring to the major industry! If the firm doesn’t have domestic competitors,
compare your enterprise to the characteristic level of the foreign leading firms of the industry!
Our performance is compared to the major
competitors:
much
worse
basically the
same
much
better
Cost efficiency 1 2 3 4 5
Market share 1 2 3 4 5
Technology level 1 2 3 4 5
Product quality 1 2 3 4 5
Range of product lines 1 2 3 4 5
Competitive prices 1 2 3 4 5
Delivery accuracy 1 2 3 4 5
Customisation readiness 1 2 3 4 5
Flexibility of production system 1 2 3 4 5
Efficiency of logistics system 1 2 3 4 5
Short delivery deadlines 1 2 3 4 5
Speed of adaptation to changing consumer needs 1 2 3 4 5
Manufacturing quality 1 2 3 4 5
Strategic alliances with major partners 1 2 3 4 5
Corporate image 1 2 3 4 5
Organisation of distribution channels 1 2 3 4 5
Creditability 1 2 3 4 5
Level of receivables 1 2 3 4 5
Solvency 1 2 3 4 5
Consumer service level 1 2 3 4 5
Lobby capacity 1 2 3 4 5
Sales to state or publicly financed institutions 1 2 3 4 5
Ability to forecast market changes 1 2 3 4 5
Export activity 1 2 3 4 5
Ethical behaviour 1 2 3 4 5
Environmental (ecological) awareness 1 2 3 4 5
Introduction of proper quality raw materials 1 2 3 4 5
Reliable raw material suppliers 1 2 3 4 5
Capacity utilisation 1 2 3 4 5
Qualification of employees 1 2 3 4 5
Application of innovative sales promotion methods 1 2 3 4 5
Highly qualified, professional managers 1 2 3 4 5
Up-to-date decision making/operation systems 1 2 3 4 5
Level of R+D expenditures 1 2 3 4 5
Launch of new products 1 2 3 4 5
Efficiency of organisational structure 1 2 3 4 5
Integrated enterprise information system 1 2 3 4 5
Level of management information system 1 2 3 4 5
Integration of business administration functions 1 2 3 4 5
More direct relation to consumers 1 2 3 4 5
Adequate stocks 1 2 3 4 5
Profitability 1 2 3 4 5
The responses to the subquestions were encoded at a 5 graded ordinal scale.
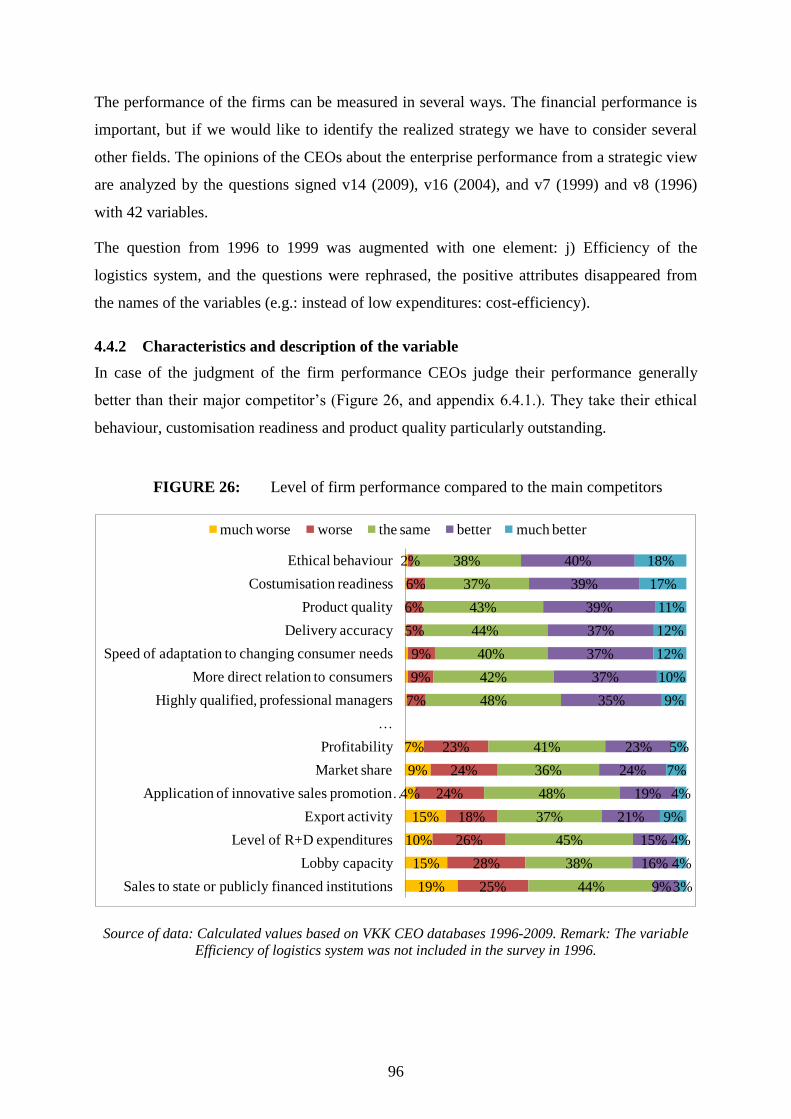
96
The performance of the firms can be measured in several ways. The financial performance is
important, but if we would like to identify the realized strategy we have to consider several
other fields. The opinions of the CEOs about the enterprise performance from a strategic view
are analyzed by the questions signed v14 (2009), v16 (2004), and v7 (1999) and v8 (1996)
with 42 variables.
The question from 1996 to 1999 was augmented with one element: j) Efficiency of the
logistics system, and the questions were rephrased, the positive attributes disappeared from
the names of the variables (e.g.: instead of low expenditures: cost-efficiency).
4.4.2 Characteristics and description of the variable
In case of the judgment of the firm performance CEOs judge their performance generally
better than their major competitor’s (Figure 26, and appendix 6.4.1.). They take their ethical
behaviour, customisation readiness and product quality particularly outstanding.
FIGURE 26: Level of firm performance compared to the main competitors
19%
15%
10%
15%
4%
9%
7%
25%
28%
26%
18%
24%
24%
23%
7%
9%
9%
5%
6%
6%
2%
44%
38%
45%
37%
48%
36%
41%
48%
42%
40%
44%
43%
37%
38%
9%
16%
15%
21%
19%
24%
23%
35%
37%
37%
37%
39%
39%
40%
3%
4%
4%
9%
4%
7%
5%
9%
10%
12%
12%
11%
17%
18%
Sales to state or publicly financed institutions
Lobby capacity
Level of R+D expenditures
Export activity
Application of innovative sales promotion …
Market share
Profitability
…
Highly qualified, professional managers
More direct relation to consumers
Speed of adaptation to changing consumer needs
Delivery accuracy
Product quality
Costumisation readiness
Ethical behaviour
much worse worse the same better much better
Source of data: Calculated values based on VKK CEO databases 1996-2009. Remark: The variable
Efficiency of logistics system was not included in the survey in 1996.
97
There are only 7 from the examined 42 elements in which according to several firms the
major competitors are better than worse, namely; (1) profitability, (2) market share, (3)
application of innovative sales promotion methods, (4) export activity, (5) level of R+D
expenditures, (6) lobby capacity and (7) sales to state or publicly financed institutions.
4.4.3 Managing of missing values
At the 42 variables from the 1240 observation there are only 585 cases which contain every
data. One reason for this is that the questions are partly completed, another is that the survey
in contained with one variable less variables. Here was a decision point in the research,
whereas:
A. Shall I lose the data of the survey in 1996? (326 cases)
B. Shall I lose cases which contain only few missing data?
At question A) the possible prize is that, with the dropping out only one variable I will get
739 cases instead of 585, which new cases come mostly from the survey in 1996. It is a loss
that I lose the information content of the variable. Because the variable was judge as
significantly divergent from the average only by few managers (altogether 7%!), and the
intended measuring content of the variable is substituted by several variables (shortness of
delivery deadline, delivery accuracy, elasticity of production system, elasticity of satisfying
customer needs, flexible response to the changes of consumer needs), so I decide to drop up
the variable and integrate the results of the survey in 1996.
Related to question B) I have these possibilities:
There is no replacement,
Missing values are replaced with the variable’s mean,
Missing values are replaced with the variable’s mode,
Missing values are replaced with cluster-centres
Dropping out variables, which has too much missing values and which can be replaced
by other variables
The first case misses too many cases, by which 15-20% of the data are lost, so this is
rejectable. At the second one replacing with mean is hard to interpret in cases of data
measured on ordinal scale – without mean –, it is better to replace with the most frequent
value (mode) which is the third possibility. This means in 2 cases (customer need and ethical
behaviour) replacement with value 4, and in the other 39 case a replacement with value 3.
98
The forth possibility, which is a prospectively statistically good replacement way, doesn’t
meet the requirement that I want to use data directly for forming latent contents.
The fifth possibility is also rejected, because in all cases ca. 1000 observation can be
identified. I accept it based on the professional practice, so there are no more variables
dropped out, but the missing character of the variables has to be considered at every
interpretation.
So I decided at question B) on the replacement with mode, but only related to cases where the
number of missing observations are not higher than 6 (15%). This number came from the
elbow analysis of the missing values, whereas after dropping out the logistics variable there
are 118 firms with 1 missing value, 54 with 2, 40 with 3, 25 with 4, 22 with 5, 11 with 6
missing values. After this there are entirely 1009 enterprises for the further examinations,
which is 81.4% of the potential sample. Above this adding a new variable has returns under
the threshold value (appendix 6.4.4.).
4.4.4 Exploration of the latent dimensions of the performance evaluation
However the performance of the CEOs was measured by 42/41 variables, the latent content
behind these can be reduced to significant less dimensions. For dimension reduction, instead
of the in literature earlier used factor analysis and cluster analysis (Antal-Mokos and Kovács,
1998, Antal-Mokos and Tóth, 2001, Hortoványi and Szabó, 2006b) I chose multidimensional
scaling (MDS). In the course of choice I take into consideration the recommendations of
Kovács (2006) and Hortoványi (2010), connected to this the 2 most important arguments are:
the variables don’t have normal distribution in pairs (appendix 6.4.2 and 6.4.3.), so
don’t meet the basis condition of factor analysis. This can be attributable among other
to the (low degree) ordinal measuring scale. In case of variables measured on ordinal
scale the mean and standard deviation cannot be interpreted and we can’t speak about
correlation.
in practice through factor analysis altogether 50-60% of the phenomenon was
explained with relatively numerous factors. By earlier researches for this level 10
factors were needed. The multidimensional scaling strives for a significant better
fitting at a level above 95%, at a lower number of factors.
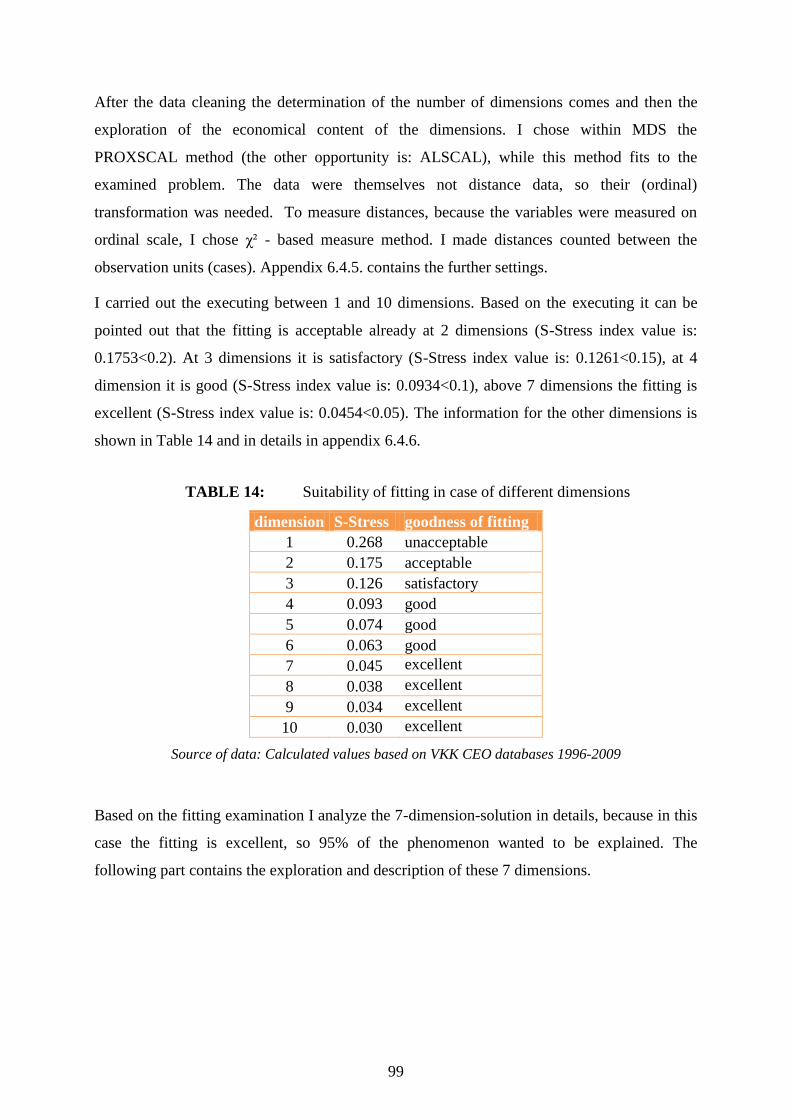
99
After the data cleaning the determination of the number of dimensions comes and then the
exploration of the economical content of the dimensions. I chose within MDS the
PROXSCAL method (the other opportunity is: ALSCAL), while this method fits to the
examined problem. The data were themselves not distance data, so their (ordinal)
transformation was needed. To measure distances, because the variables were measured on
ordinal scale, I chose χ² - based measure method. I made distances counted between the
observation units (cases). Appendix 6.4.5. contains the further settings.
I carried out the executing between 1 and 10 dimensions. Based on the executing it can be
pointed out that the fitting is acceptable already at 2 dimensions (S-Stress index value is:
0.1753<0.2). At 3 dimensions it is satisfactory (S-Stress index value is: 0.1261<0.15), at 4
dimension it is good (S-Stress index value is: 0.0934<0.1), above 7 dimensions the fitting is
excellent (S-Stress index value is: 0.0454<0.05). The information for the other dimensions is
shown in Table 14 and in details in appendix 6.4.6.
TABLE 14: Suitability of fitting in case of different dimensions
dimension S-Stress goodness of fitting
1 0.268 unacceptable
2 0.175 acceptable
3 0.126 satisfactory
4 0.093 good
5 0.074 good
6 0.063 good
7 0.045 excellent
8 0.038 excellent
9 0.034 excellent
10 0.030 excellent
Source of data: Calculated values based on VKK CEO databases 1996-2009
Based on the fitting examination I analyze the 7-dimension-solution in details, because in this
case the fitting is excellent, so 95% of the phenomenon wanted to be explained. The
following part contains the exploration and description of these 7 dimensions.

100
4.4.5 Dimensions of performance evaluation
To explore the given 7 dimensions I carried out correlation analysis between the calculated
coordinates of the single dimensions and the original variables. During the correlation
analysis I calculated Spearman ρ value, because I examined connections between variables
measured on ordinal scale. At 99.99999999999999999 % (p<10-19
) confidence level there is a
connection (ρ value is in absolute value more than 0.283) in the signed cases in Table 15. and
in appendix 6.4.7. (in appendix I signed with colours the highlighted connections in the
Table).
The fitting of the 7-dimension-solution is also excellent at the subsamples of the single
surveys: the S-Stress index value is 0.036; 0.044; 0.036 and 0.036 of the subsamples in the
survey in 1996, 1999, 2004 and 2009. Except the survey in 1999, in the other cases the fitting
is also excellent at 6 dimensions, but in order to have a uniform examination framework I
evaluate the 7-dimension-solution. Appendix 6.4.13-16. introduces the significant connections
between the dimension of the single subsamples and the originally used variables.

101
TABLE 15: Correlated variables with performance dimensions
Dimension Variable related to the dimension*
Market and lobby force
D1
market share
technology level
customisation readiness (opposite)
strategic alliance with major partners
corporate image
organisation of distribution channels
creditability
lobby capacity
sale to state and publicly financed institutions
ability to forecast market changes
export activity
application of innovative sales promotion methods
level of R+D expenditures
launch of new products
integrated enterprise information system
level of management information system
Financial force
D2
cost efficiency
creditability
level of receivables
solvency
profitability
Organisational efficiency
D3
application of innovative sales promotion methods
up-to-date decision making/operating systems
efficiency of organisational structure
integrated enterprise information system
level of management information system
integration of business administration functions
Market orientation
D4
export activity
sales to state and governmental institutions (opposite)
Product orientation
D5
range of product lines
Network position
D6
market share
strategic alliance with major partners
corporate image
organisation of distribution channels
Provisional competitive
advantage
D7
cost efficiency
range of product lines
capacity utilization
profitability
* With a confidence of 99.99999999999999999 % (p<10-19
) the connection can be exhibited (ρ value
is in absolute value bigger than 0.283)
102
4.4.6 Changes in the dimensions of performance evaluation during the four surveys
The performance evaluation dimensions of the single periods can be explored comparing the
appeared large structure, which manages the 4 surveys as a unit, to the subsamples of the
single surveys. The dimensions show the contemporary competitive advantages. The
description of the dimensions was made by the usage of the results shown in Table 15 and
appendix 6.4.9-12. (In the Tables I signed connections at a 99.99999999% confidence level
with colour. In order to take easier the interpretation of some variables, in comparison with
the correlation data Tables, I made in certain Tables monotonous transformation.)
The D1 – Market and lobby force dimension’s components are extremely stable during the
single surveys. It seems robust related to the latent content in the managers’ mind that what
characterize a firm with market and lobby force. The most important feature is the high lobby
and market force which is coupled with high technology quality level and R+D activity. It can
forecast and influence market conditions well. Related to markets it is active on export and
also on governmental markets, applies innovative sales promotion methods too. Its
organisation possesses integrated and up-to-date information systems. It is tend to and
because of its inertia is obliged to misuse its market force which can result in lower
customisation readiness.
The D2 – Financial force’s content, and the influencing factors changed significantly during
the years. At the survey in 1996 the financial efficiency and the sales to state were opposites
in the same dimension. In 1999 and in 2004 the financial efficiency was coupled with
structural efficiency. To 2009 the situation has remarkably changed, and firms show
significant financial force which can be more flexible and besides are able to push new
products through the sales channels.
The D3 – Organisational efficiencies content has also changed at the single surveys. In 1996
the up-to-date and efficient structure is in contradiction with sales to state. To 1999 efficient
structure can be interpreted not only within the firm, but also in a position in a (international)
value creation chain, along strategic alliances with all of its advantages and disadvantages. In
2009 the efficient organisational structure is rather determined by the sales challenges.
The D4 – Market orientation’s two ends are the intensive presence on the export markets and
the sales to state or publicly financed institutions. As the interpretation of the survey in 1996
the market orientation is correlated with the high product quality, technology and
manufacturing level. This “elitist’ view is perceptible in the survey in 1999 too, but then the
up-to-date organisational structure already appears with the export orientation, which is

103
connected to premium pricing. It is already characteristic in 2004 that the export market sales
are accompanied by higher product quality, but the accuracy and shortness of delivery
deadline are also revealed. In 2009 this variable is also determined by the sales constraint,
which underlines the importance of innovative sales promotion methods and new markets.
The D5 – Product orientation is at the surveys in 2004 and in 1999 particularly important. In
1999 the economies of scale determines this variable. In 2004 cost efficiency is accompanied
by the economies of scope, so the capacity utilization is realized by taking into consideration
the synergies from the range of product lines.
The D6 – Network position can be taken for a new phenomenon which is connected with the
network economy. Networks are important, and raise new opportunities to enterprises (Boari,
2001). As for its content it includes market share, strategic alliance, corporate image and
organisation of distribution channels. The 5 identified dimensions in the survey 1999 serve as
a base of this dimension, which draws attention to the ethical behaviour and solvency. These
two elements create mostly trust at the start of cooperation. To 2004 the network position is
supplemented with the more directed relation to consumers. In 2009 the speed adaptation to
changing consumer needs, the shortening of delivery deadlines and creditability strengthen.
The D7 - Provisional competition position dimension changes most during the surveys.
Generally the cost efficiency, the range of product lines, the capacity utilization and the
profitability characterize it, but from time to time another element is dominated. The
alteration from 1996 to 2009 is especially drastic, because in the earlier time the provisional
competitive advantage comes from the range of product lines and the competitive prices, now
resilience is the most important characteristic of a firm. Besides, the role of the export
markets is especially important.
4.4.7 Control variable’s relation to the dimensions of performance evaluation
Larger enterprises have larger market and lobby force than the smaller firms (99.99%
confidence, ρstaff=0.178, ρassets=0.242 and ρrevenue=0.219). There are no significant connection
between the firm size and the other dimensions.
The export orientation is in connection with several dimensions at a 99.99% confidence level.
There is a positive connection between the export rate and the market orientation (ρ=0.320),
which reflects the consistency of the questionnaire. There is also a positive connection
between the export rate and the provisional competitive advantage (ρ=0.206), which refers to
that the firms with higher export rate possess competitive advantage as opposed to firms with
lower export rate.

104
There is a negative connection between the export rate and organisational efficiency (ρ=-
0.236), and product orientation (ρ=-0.171). The first connection relates to that the lowest
degree of internationalism means serious organisational challenges; while the second refers to
that the higher export rate can be realized with fewer products. The export rate shows with the
other dimensions no significant connection.
I recoded the performance evaluation scale with monotonous transformation into an ordinal
scale with 5 degrees in order to examine the connection with crosstabs between the type of
majority owner, the main activity of the firms, the territorial position and the dimensions of
performance evaluations. This procedure enabled that there will be enough elements in the
cells and the connection index-number will be accurate. I used the quintiles of the single
dimensions for recoding, which are introduced besides the descriptive statistics in appendix
6.4.17.
There is a connection at 99.99% confidence level between the majority owner and the market
and lobby force (φ=0.189), and the financial force (φ=0.195). The market and lobby force of
firms in state or foreign majority ownership is somewhat higher than firm’s which are in
domestic majority property, but this means also more favourable financial situation only for
firms in foreign majority ownership.
The industry is not independent from the market and lobby force (φ=0,255) at a similar high
confidence (99,99%) level, whereas the market and lobby force is lower at organisations in
agriculture, mining and manufacturing industry, while it is typically higher at entities in
power supply, trade, service or community services.
There is no significant connection at 99.99% confidence level between the type of majority
owner, the main activity of the firms, the territorial position and the non-mentioned
dimensions of the performance evaluation.
105
4.5 Performance configurations
4.5.1 Identifying performance configurations with clustering
The identified performance evaluation dimensions are orthogonal to each other, so they are
independent form each other based on the method of multidimensional scaling which was
used for exploring the latent content. So in order to understand precisely the performance
configuration of a firm, its coordinates are needed after every dimension. The coordinates
were identified to 1009 firms in the common database of the 4 surveys. On basis of the
derived coordinates dense points can be determined in space which provides an opportunity to
form homogenous enterprise groups, clusters.
I used cluster analysis to create groups which possess homogenous features along the
performance configurations (strategy types). Firstly I carried out hierarchical cluster analysis
in order to determine the number of clusters, to limit the recommended interval of the number
of clusters.
In case of the hierarchical cluster analysis firstly I used based on the recommendations of
Anderberg (1973) the Ward method, I examined the agglomeration schedule, in it the
coefficient column, from which it is proved, that I can’t use the elbow criterion, because there
aren’t proper growth in homogeneity, and the 50% rule will result in unreal too much clusters.
I continue clustering with non-hierarchical cluster analysis. Relying on the suggestions of
Lehmann (1985) the practical cluster number falls somewhere between N/30 and N/60,
because there are 1009 cases in the sample, the recommended cluster number can be between
16 and 34. This number is considerably higher than the determined cluster number in most
former researches in this topic, which move between 3 and 10 (Campell-Hunt, 2000), but
there is an example for research too which examines similarly high cluster numbers (Wright
et al., 1991). The high number of clusters in latter case sprang from that researches didn’t use
factor analysis previously; they carried out cluster analysis directly on the variables.
Based on these there are 2 possible ways to continue the research:
1) I analyze the ideal number of clusters between 2 and 10 building upon the traditions of
the determining researches in this field
2) I determine the ideal number of clusters which explains satisfactorily high percentage
of the examined phenomenon.

106
4.5.2 Identifying clusters between 2 and 10
Firstly I analyzed the explanation force of clusters formed by k-means method between 2 and
10. I tested with Means execution the distribution of the cases in case of different cluster
numbers, because it isn’t worth analyzing a cluster number where the number of cases in the
single clusters is too low. It is also important that within the single groups the standard
deviation won’t be bigger than 1, because we used standardized variables whose average
standard deviation is 1.
Further on it was possible to interpret the results of the non-hierarchical (k-means) cluster
analysis in order to determine the accurate cluster centres and to subject the different cluster
numbers to further examination.
FIGURE 27: Explained variance of clusters and elbows in case of 2-10 solutions
5%
10%
15%
20%
25%
30%
35%
40%
2 3 4 5 6 7 8 9 10
Ex
pla
ined
va
rien
ce
Number of clusters
Source of data: Calculated values based on VKK CEO databases 1996-2009
Firstly I determined the ideal number of clusters by the elbow method. Examining clusters
between 2 and 10 two elbows can be defined, at 6 and at 9 clusters. The explaining force of
the 6-cluster-solution is significantly lower (29%), than by the 9-cluster-solution (37%)
(Figure 27.).

107
The forming of clusters step by step ascending and the analysis of the changes in the distances
of cluster centres that in case of six clusters the decrease in distance was pretty little compared
to the previous level, but at the further level this distance was bigger. Through the forming of
clusters step by step ascending and the logical analysis of the groups (grouping examined with
crosstabs) the analysis of the case number of the clusters confirmed that after the sixth step a
relative stabilization starts, so I examine in the following the 6-cluster-solution (Table 16.).
The case number of clusters is between 65 and 296 which is a fivefold difference, but this
value isn’t too high, so it can be considered at clustering as balanced. Besides along the
dimensions of the performance evaluation the clusters can be separated from each other well,
it is possible to understand the single configurations. It is important to notice that based on the
ANOVA analysis, every dimension had a significant role in the clustering.
TABLE 16: 6 performance configuration (strategy type)
C1 C2 C3 C4 C5 C6
Market and lobby force ,479 ,351 -,117 -,553 -,495 -,756
Financial force -,107 ,104 -,228 -,337 ,568 ,530
Organisational efficiency ,577 -,389 ,078 -,779 -,083 ,323
Market orientation -,328 -,060 1,092 -,955 ,485 ,038
Product orientation -,012 -,204 ,364 ,433 ,384 -2,016
Network position -,068 -,384 ,791 ,540 -1,251 ,381
Provisional competitive
advantage
-,188 1,118 ,148 -,493 -,738 -,509
Count of cases 296 201 177 151 119 65
Distribution 29,3% 19,9% 17,5% 15,0% 11,8% 6,4%
Source of data: Calculated values based on VKK CEO databases 1996-2009. The strongly positive
values are highlighted with green, the neutrals with yellow, and the strongly negative values with red.
In Table 16 there are 6 cluster centres along the single performance evaluation dimensions.
Colour scale helps the easier interpretation in the Table. The strongly positive values are
signed with green, the neutral with yellow and the strongly negative values with red.
The high positive value refers to high value according to the certain dimension, on the
contrary the negative one shows that there are firms with low values in that group according
to the certain dimension. I identified the single groups based on the most characteristic and
non-characteristic features.

108
Firms with high market force and organisational efficiency make up the largest cluster. On the
contrary the market orientation of these firms is low which refers to that these enterprises tend
to misuse their market and lobby force at the consumer’s expense. Their financial force and
provisional competitive advantage are slightly negative, their product orientation and network
position are neutral. Based on these facts, these firms got the title: C1-’Protectors of a strong
market and lobby position’.
The group with the second-most cases contains firms with also high market and lobby force,
but these firms are characterized mostly by the grabbing of provisional competitive
advantages. Due to it they possess good financial force, despite the less efficient organisation
and less favourable network position. Besides they are characterized by lower product
orientation and almost neutral market orientation Based on these facts, these firms got the
title: C2- ‘Builders of a strong market and lobby position’.
The third largest group of firm towers above their industrial competitors in market orientation,
network position and product orientation, and the provisional competitive advantage is above
average. These are at the expense of the market and lobby position, so if someone wants to
consider the interests of every stakeholder it will have worse financial position. Based on
these facts, these firms got the title: C3- ‘International satellite companies’.
The forth group is made up from firms with high product orientation and favourable network
position, but they have lower market orientation, organisational efficiency, provisional
competitive advantages, financial and market and lobby force. Based on these facts, these
firms got the title: C4- ‘Domestic satellite companies’.
The fifth group contains firms with high market and product orientation and financial force.
By their self assessments their network positions are very low, they don’t strive for grabbing
provisional competitive advantages, and they haven’t significant market and lobby force.
They are average according to organisational efficiency. Based on these facts, these firms got
the title: C5- ‘Independent and financially successful’. The most characteristic feature of the
smallest group is the very low product orientation and the low provisional competitive
advantage, market and lobby force. As opposed to these they possess the second-high
financial force from the groups and they have also favourable network positions and
organisational efficiency. Related to market orientation they are neutral. Based on these facts,
these firms got the title: C6- ‘ Linked in and financially successful’.
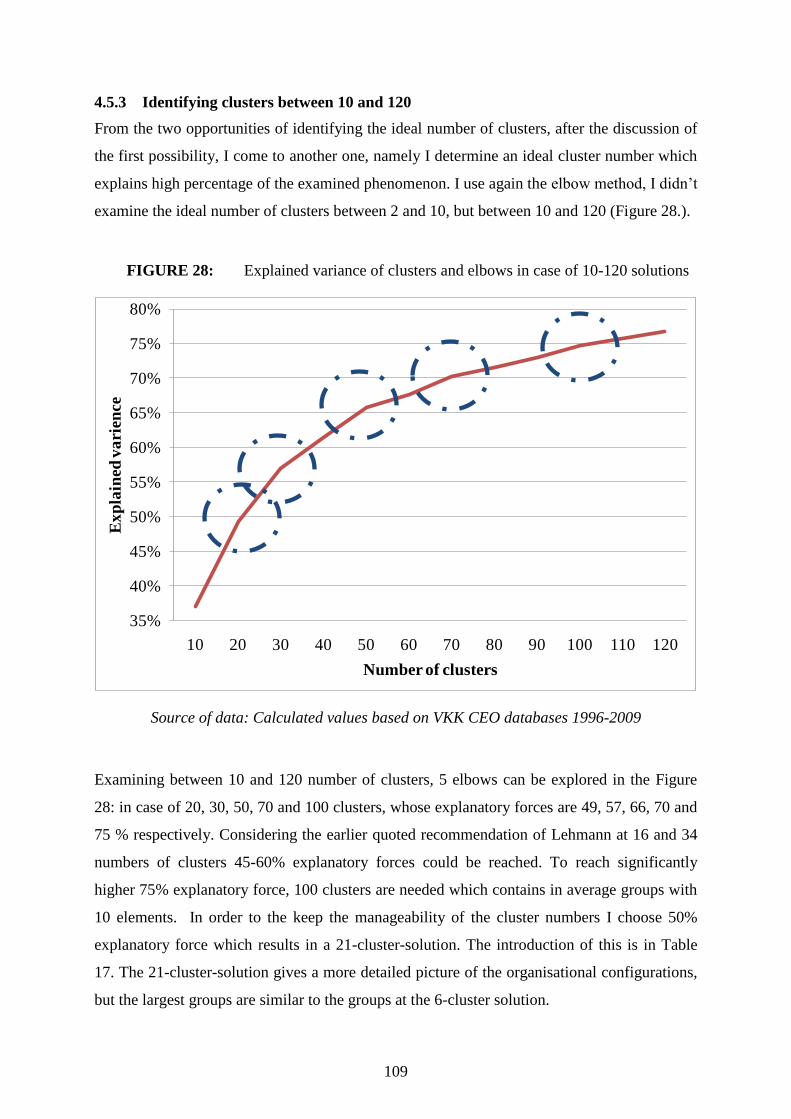
109
4.5.3 Identifying clusters between 10 and 120
From the two opportunities of identifying the ideal number of clusters, after the discussion of
the first possibility, I come to another one, namely I determine an ideal cluster number which
explains high percentage of the examined phenomenon. I use again the elbow method, I didn’t
examine the ideal number of clusters between 2 and 10, but between 10 and 120 (Figure 28.).
FIGURE 28: Explained variance of clusters and elbows in case of 10-120 solutions
35%
40%
45%
50%
55%
60%
65%
70%
75%
80%
10 20 30 40 50 60 70 80 90 100 110 120
Ex
pla
ined
va
rien
ce
Number of clusters
Source of data: Calculated values based on VKK CEO databases 1996-2009
Examining between 10 and 120 number of clusters, 5 elbows can be explored in the Figure
28: in case of 20, 30, 50, 70 and 100 clusters, whose explanatory forces are 49, 57, 66, 70 and
75 % respectively. Considering the earlier quoted recommendation of Lehmann at 16 and 34
numbers of clusters 45-60% explanatory forces could be reached. To reach significantly
higher 75% explanatory force, 100 clusters are needed which contains in average groups with
10 elements. In order to the keep the manageability of the cluster numbers I choose 50%
explanatory force which results in a 21-cluster-solution. The introduction of this is in Table
17. The 21-cluster-solution gives a more detailed picture of the organisational configurations,
but the largest groups are similar to the groups at the 6-cluster solution.

110
TABLE 17: 21 performance configuration (strategy type)
Market
and
lobby
force
Financial
force
Organisa
tional
efficiency
Market
orientati
on
Product
orientati
on
Network
position
Provisional
competitiv
e
advantage
N %
K1 ,474 ,007 ,277 -,174 -,102 ,317 ,095 216 21%
K2 ,522 ,139 -,096 ,053 -,099 -,458 1,268 114 11%
K3 ,048 ,236 ,077 ,342 -,531 -1,143 -,447 107 11%
K4 1,011 ,110 -,355 ,977 ,681 ,161 -,463 89 9%
K5 -,445 ,201 ,296 1,232 ,148 ,773 ,357 79 8%
K6 ,225 ,199 -,151 -,917 ,376 ,934 -1,250 64 6%
K7 ,007 -,274 -1,101 -,774 -,672 -,450 ,410 61 6%
K8 -,612 ,054 ,574 -,793 ,866 -,781 -,922 58 6%
K9 -1,321 -1,740 -1,120 1,013 ,286 ,221 ,099 38 4%
K10 -1,396 ,113 -1,156 -,596 -,302 ,916 ,205 34 3%
K11 -,728 -1,692 1,776 -,116 ,598 -,672 ,377 28 3%
K12 -1,422 1,753 -,575 -,377 1,559 -,237 ,177 28 3%
K13 -1,509 1,367 ,972 -,540 ,011 ,812 ,550 26 3%
K14 ,790 -1,779 -,734 -1,475 ,252 -,005 -,741 26 3%
K15 -1,259 -,700 1,912 -,600 -1,266 ,246 -,004 19 2%
K16 -,800 ,906 ,167 1,729 -2,735 ,204 -1,478 12 1%
K17 1,798 1,710 -,081 -,521 -3,458 1,853 -,544 4 0%
K18 -,868 -,235 ,366 -,879 -5,221 ,585 -1,011 3 0%
K19 2,486 -,612 ,562 4,913 3,257 2,777 1,126 1 0%
K20 1,521 -,192 -2,597 -1,236 -1,220 -3,329 7,766 1 0%
K21 ,204 1,074 -,440 2,328 1,156 -7,261 -2,961 1 0%
Source of data: Calculated values based on VKK CEO databases 1996-2009
In the following I interpret the first 16 configurations, because the K17-K21 clusters are too
small. Each cluster can be characterized by the method used at the 6-cluster-solution.
Further on the 16-cluster-solution which classifies 999 firms opens up an opportunity to
answer questions beyond the foregoing researches. If a firm is over performing in a certain
dimension what are the consequences to the other dimensions?
It wouldn’t be possible to reply to this question on the basis of the environmental school of
Mintzberg, because the single dimensions are independent form each other, so we will get a
tautological response, e.g. in order to reach better financial force the enhancement of the
financial position is needed. On the contrary based on the configurational school, which I
chose, at the interpretation of the real life configurations there is a possibility to display
common occurrences (clusters), which allows understanding the phenomenon as a whole. So
the given answers can serve as useful content, whereas for example strengthening the
financial position is possible by enhancing the focus on products which can result in
provisional competitive advantages, but this damages typically the market and lobby force,
the organisational efficiency, the market orientation and the network position of the firm. So
the alignment is particularly important (Kaplan and Norton, 2006).

111
How can a firm have outstanding market and lobby force? (In case of the strategies I sign
between brackets on which cluster based on the statement, and I move on from the more often
occurrences to the less ones at the introduction of the strategies.)
Strategy What is needed? (high value) At the expense of what? (low value)
A
(K4)
Market orientation
Product orientation
Provisional competitive advantages
Organisational efficiency
B
(K14)
Product orientation Financial force
Market orientation
Provisional competitive advantage
Organisational efficiency
C
(K2)
Provisional competitive advantages Network position
D
(K1)
Network position
It is worth highlighting the strategy C, whose lesson is that firms which are less embedded in
different networks are able to transform provisional competitive advantages to better market
and lobby force. So several weak connections help them in grabbing possibilities which state
agrees with the results of Hite (2005) explored by qualitative methods.
How can a firm have outstanding financial force?
Strategy What is needed? (high value) At the expense of what? (low value)
A (K12) Product orientation Market and lobby force
Organisational efficiency
Market orientation
B
(K13)
Organisational efficiency
Network position
Provisional competitive advantage
Market and lobby force
Market orientation
C
(K16)
Market orientation
Product orientation
Provisional competitive advantages
Market and lobby force
I highlight strategy A, whereas firms can reach very favourable financial position by
incremental product dumping, which tallies with research results of Hortoványi et al. (2009).
Strategy C opposed to strategy A suggest that focusing on markets can significant improve the
financial force instead of focusing on products, according to the lesson of the survey this is
characteristic for 12 firms, against the 28 firms with product focus.

112
How can a firm have outstanding organisational efficiency?
Strategy What is needed? (high value) At the expense of what? (low value)
A (K15) Market and lobby force
Product orientation
Financial force
Market orientation
B
(K11)
Product orientation
Provisional competitive advantages
Financial force
Market and lobby force
Network position
C
(K13)
Financial force
Network position
Provisional competitive advantage
Market and lobby force
Market orientation
D
(K1)
Product orientation Provisional competitive advantage
Market orientation
Network position
Market and lobby force
Strategy A and D describes the phenomenon of the organisation inability, that organisations
strive for accumulating new resources, while it isn’t justified by their market situation
(Bakacsi, 1996). This phenomenon is similar to the (late) bureaucracy defined by Adizes
(1992). In contrast, strategy B refers to the life situation of start-up businesses.
How can a firm have outstanding market orientation?
Strategy What is needed? (high value) At the expense of what? (low value)
A (K16) Financial force Provisional competitive advantage
Market and lobby force
B
(K5)
Network position
Provisional competitive advantage
Market and lobby force
C
(K9)
Financial force
Market and lobby force
Organisational efficiency
D
(K4)
Market and lobby force
Product orientation
Provisional competitive advantage
Organisational efficiency
E
(K3)
Network position
Product orientation
Provisional competitive advantage
It is an interesting observation that in case of A, B and C strategies the high market
orientation accompanies the lower market and lobby force, which can refer to those firms
with lower bargaining power are rather obliged to costumer centrality. D strategy is an
exception of this which relates to that it is possible to reach better market and lobby force
with the high market and product orientation.

113
This latter idea can be connected to the growth conception of Ansoff (1965), whereas
diversification means the novelty of both markets and products, and this strategy is rather the
challenge of the larger, stronger enterprises.
How can be the product orientation outstanding?
Strategy What is needed? (high value) At the expense of what? (low value)
A (K12) Financial force Market and lobby force
Organisational efficiency
Market orientation
B
(K8)
Organisational efficiency Provisional competitive advantage
Market orientation
Network position
Market and lobby force
C
(K4)
Market and lobby force
Market orientation
Provisional competitive advantage
Organisational efficiency
D
(K6)
Network position Provisional competitive advantage
Market orientation
Product orientation is a significant pledge of the firm which constraints its provisional
competitive advantages, ability to grab opportunities. This refers to administrative behaviour
which is the opposite of entrepreneurial behaviour (Stevenson, 1983). Besides market
orientation and product orientation are the opposites of each other in case of 3 strategies, in
one case they are complementary which give back the empirical picture of Ansoff growth
strategies.
How is it possible to reach an outstandingly high network position?
Strategy What is needed? (high value) At the expense of what? (low value)
A
(K6)
Product orientation Provisional competitive advantage
Market orientation
B
(K10)
Market and lobby force
Organisational efficiency
Market orientation
Product orientation
C
(K13)
Financial force
Organisational efficiency
Provisional competitive advantage
Market and lobby force
Market orientation
D
(K6)
Market orientation
Provisional competitive advantage
Market and lobby force
E
(K1)
Market and lobby force

114
The connection between network position and market and lobby force has double meaning.
On the one hand the high network embeddedness can mean a central (E strategy), on the other
hand also a satellite role (B, C and D strategies). The strong relationships help basically to
exploit opportunities, but too much strong relations can be a dam of the firm’s development
(Hite, 2005).
How can the provisional competitive advantages be grabbed?
Strategy What is needed? (high value) At the expense of what? (low value)
A
(K2)
Market and lobby force Network position
B
(K13)
Financial force
Organisational efficiency
Network position
Market and lobby force
Market orientation
C
(K7)
Organisational efficiency
Market orientation
Product orientation
Network position
D (K11) Organisational efficiency
Product orientation
Financial force
Market and lobby force
Network position
E
(K5)
Market orientation
Network position
Market and lobby force
Strategy A refers to those firms with stronger market and lobby force that are able to exploit
provisional comparative advantages better, which is in line with Penrose (1959). Strategies B,
D and E contradict to this, they relate to that grabbing provisional competitive advantages are
more typical for firms with lower bargaining power.

115
4.5.4 Changes in performance configurations through the 4 surveys
There is a significant connection between the year and the performance configurations
(φ6=0.262 p<10-8
and φ16=0.328 p<10-6
). The distributions of the single groups are shown by
years in Table 18 and 19.
TABLE 18: Distribution of the 6 cluster-grouping at the single surveys
Clusters 1996 1999 2004 2009 Total
C1 51 59 69 117 296
C2 56 60 44 41 201
C3 63 39 36 39 177
C4 35 43 50 23 151
C5 22 36 31 30 119
C6 15 10 24 16 65
Total 242 247 254 266 1009
Source of data: Calculated values based on VKK CEO databases 1996-2009
As it is seen in Table 18, all groups appear through the single surveys, but creating groups are
dominant in certain years. While at the survey in 1996 C3 was the most frequent (and C2 and
C1 appeared at almost similar level), in 1999 C2 was already the most frequent (C1 was at
almost similar level, but the frequency of C3 fell). From 2004 C1 is the most frequent;
moreover in 2009 44% of the firms included in the survey were in this group.
It is a further phenomenon that the significance of C4 has increased constantly from 1996 to
2004, at which Hortoványi and Szabó (2006b) pointed previously. Furthermore 2004 was
particularly favourable for C6.
By continuing the examinations of the 16-cluster-solution based on the 21-cluster-grouping,
whose distribution by year is introduced in Table 19, similar states can be concluded:
K1 is the most frequent in every sample, but its frequency has doubled in the sample
of 2009, moreover K8 is a special group of the survey in 2009. So in 2009 (1) beside
firms with high market and lobby force (2) firms with high organisational efficiency
and product orientation but simultaneously low market and lobby force, market
orientation and provisional competitive advantage are overrepresented through the
survey. The conclusion is from the comparison of the two types that firm population
has polarized according to network positions and market and lobby force. Besides the
most frequent strategy has strengthened.

116
Through the survey in 2004 the summed proportion of the less frequent groups in the
sample is higher: the K6, K9, K10 and K14 are significantly more frequent during this
period than at the earlier or later surveys. The interpretation of the configurations is:
(1) high network position and product orientation, low provisional competitive
advantage and market orientation, (2) high market orientation, low financial, market
and lobby force and organisational efficiency, (3) high network position, low market
and lobby force, organisational efficiency market and product orientation and (4) high
market and lobby force, low financial force, organisational efficiency and market
orientation. Based on the comparison of configurations it is observable that favourable
environmental conditions give free range to the creation of (strategic) variations.
K2, which is able to grab provisional competitive advantages, among the surveys is in
1999 the most frequent. Further on K3 and K9 can be considered as configurations
more frequent than the average. In details: (1) grabbing provisional competitive
advantages and market and lobby force against less favourable network positions, (2)
high market orientation, low network position, product orientation and provisional
competitive advantages, and (3) high market orientation, low financial and lobby force
and organisational efficiency. We can have a consequence as a lesson that the
environment offered several provisional competitive advantages, which one part of the
firms could exploit also without alliances.
Looking back to the survey in 1996 the frequencies of K4, K5 and K7 configurations
are above the average. So, (1) favourable market and lobby force at the expense of
high product and market orientation, organisational efficiency and provisional
competitive advantages, (2) high market orientation, network position and provisional
competitive advantages, beside low market and lobby force, and (3) exploitation of
provisional competitive advantages at the expense of organisational efficiency, market
and product orientation, beside low network position. This latter configuration set an
example of how a firm can cover up its weaknesses with its opportunities.
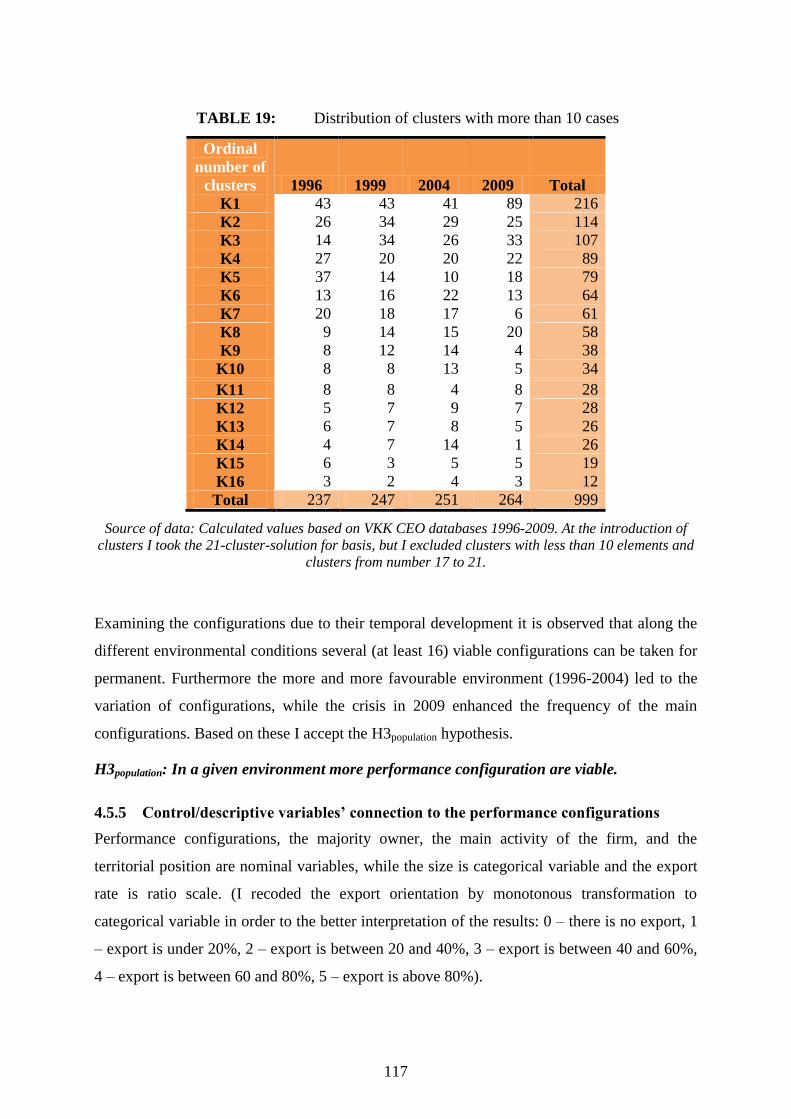
117
TABLE 19: Distribution of clusters with more than 10 cases
Ordinal
number of
clusters 1996 1999 2004 2009 Total
K1 43 43 41 89 216
K2 26 34 29 25 114
K3 14 34 26 33 107
K4 27 20 20 22 89
K5 37 14 10 18 79
K6 13 16 22 13 64
K7 20 18 17 6 61
K8 9 14 15 20 58
K9 8 12 14 4 38
K10 8 8 13 5 34
K11 8 8 4 8 28
K12 5 7 9 7 28
K13 6 7 8 5 26
K14 4 7 14 1 26
K15 6 3 5 5 19
K16 3 2 4 3 12
Total 237 247 251 264 999
Source of data: Calculated values based on VKK CEO databases 1996-2009. At the introduction of
clusters I took the 21-cluster-solution for basis, but I excluded clusters with less than 10 elements and
clusters from number 17 to 21.
Examining the configurations due to their temporal development it is observed that along the
different environmental conditions several (at least 16) viable configurations can be taken for
permanent. Furthermore the more and more favourable environment (1996-2004) led to the
variation of configurations, while the crisis in 2009 enhanced the frequency of the main
configurations. Based on these I accept the H3population hypothesis.
H3population: In a given environment more performance configuration are viable.
4.5.5 Control/descriptive variables’ connection to the performance configurations
Performance configurations, the majority owner, the main activity of the firm, and the
territorial position are nominal variables, while the size is categorical variable and the export
rate is ratio scale. (I recoded the export orientation by monotonous transformation to
categorical variable in order to the better interpretation of the results: 0 – there is no export, 1
– export is under 20%, 2 – export is between 20 and 40%, 3 – export is between 40 and 60%,
4 – export is between 60 and 80%, 5 – export is above 80%).
118
Further on I introduce the results of the association in which it is explored whether there is a
significant connection between the single performance configurations and several descriptive
variables.
There is a connection between size and performance configurations at a 95% confidence level
(φstaff=0.200 p<0.034, φassets=0.189 p<0.009 and φrevenue=0.173 p<0.027), however it doesn’t
mean that bigger or smaller firms are more dominant in one of the categories. For example in
each category number of employees between 50 and 300 are the more frequent, besides in
case of C3 30.8% of the firms of the group are between 300 and 999 employees instead of the
22% expected value. In case of assets and revenue in all groups the small, middle-size and big
organisations are typical too.
In relation to the export rate there is a connection to performance configurations at a
confidence level above 99% (φ=0.378 p<10-13
). Most of the C1 has no export and the export
rate is also low at C4. C2, C3 and C6 show even distribution according to the categories of
export rate, while in case C5 both very high and very low export activity is typical at the same
time.
There is a connection between the majority owner and the configuration at a confidence level
above 99% (φ=0.192 p<10-3
). The domestic majority ownership is typical for at least the half
of the firms in each group, but there are more significant deviations at the appearance of the
foreign and state majority owned firms in the groups. The frequency of state majority owned
firms us above the average in the case of C1, C4 and C5, while the foreign majority
ownership is overrepresented at C2 and C3. Group C6 contains of domestic majority owned
firms in more than two-thirds ratio.
There is also an association between the single clusters and the main activity of the firms
(φ=0.192 p<10-3
). Compared to the sample in case of C1 different service enterprises are
over-, firms in manufacturing industry are underrepresented (although this is the most
frequent industry with its 40%). Groups C2 and C3 are dominated by firms of manufacturing
industry with a two-third majority (64.1% and 68.7%). In case of C4 and C5 agricultural and
manufacturing industry firms are over- and traders are underrepresented. C6 includes firms of
the construction industry and trade above the average, but their summed proportion is further
on low (21.6% instead of the expected 16%).
There are no connections between the territorial position and the performance configurations
at/above the 95% confidence level.
119
The results of the 6-cluster-solution are strengthened further by the examination of the 16-
cluster-solution, at which there is a connection at 99% confidence level between performance
configurations and the firm size, the export rate and the type of the majority owner, but there
is no significant connection to the territorial position.
At the same time at the 16-cluster-examinations the rule of thumb has to be considered that at
least 5 cases are needed in each cell of the crosstabs in order to get reliable results According
to this the 16-cluster-solution has to be narrowed down to 6-10 clusters. This generates
significant distortion, so I didn’t use these results, but at big samples this solution is
recommended. According to the foregoing I examine the connections of the 6-cluster-solution
in the next part.
4.6 Testing hypotheses related to firms, the connection between environment, strategy and performance
4.6.1 H1individual
H1indvidual: The exploitative firms perceive environmental uncertainty higher than
explorative firms.
At 95% confidence level (estimated significance level in brackets) there is a connection
between the following strategies and the environmental factors:
1) Exploitative strategy and the
a) domestic sales market at the present (p<0.005)
b) foreign suppliers opposite direction in the past (p<0.008), at the present (p<0.030)
c) domestic suppliers at the present (p<0.045)
d) technological development at the present (p<0.014)
e) social changes at the present (p<0.023)
f) domestic political changes in the past (p<0.037), at the present (p<0.015)
2) Explorative strategy and the
a) domestic suppliers opposite direction in the past (p<0.038), at the present (p<0.006)
b) social changes opposite direction at the present (p<0.006)
The ambidexterity doesn’t show connection to the sources of environmental uncertainty at a
confidence level 95%.

120
Testing the hypothesis shows a dual picture, so it can be accepted with modifications, that
exploitative firms evaluate primarily the uncertainty from domestic environmental factors as
higher.
4.6.2 H2individual
H2indvidual: The proactive firms perceive their environment less uncertain than reactive
firms.
At 99% confidence level there is no connection between the two factors. At 95% level it can
be determined that firms which are able to influence environmental changes better, perceive
the foreign sales environment (ppast<0.038, ppresent<0.051), and the domestic suppliers less
uncertain (ppast<0.021, ppresent<0.002).
Based on the weak results and the low significance I reject the hypothesis. The results refer to
that proactive firms perceive their environment also uncertain.
4.6.3 H3individual
H3indvidual: The sources of environmental uncertainty have different impact on the
configurations.
There are several relations between the former determined performance evaluation
dimensions and the perception of environmental uncertainty. I analyzed the connections at
99.9% (appendix 6.5. yellow highlight) and 99% (appendix 6.5. red highlight) confidence
level with Spearman correlation coefficients. Based on this I got these results:
Firms with better financial force, more effective organisation, and higher product
orientation perceive foreign sales environment less uncertain, while higher market
orientation and higher provisional competitive advantage are accompanied by higher
environmental uncertainty from foreign sales markets.
Enterprises with more effective organisation and high product orientation perceive the
domestic sales market environment more uncertain at the time of the surveys, as
opposed to the firms with high market orientation and provisional competitive
advantage, which evaluate as lower this uncertainty factor.
Firms with higher financial force evaluate as lower the uncertainty from capital and
financial market changes than enterprises with lower financial force.
The uncertainty from foreign suppliers affects more firms with higher market
orientation than firm with lower market orientation.

121
According to the technological development and the legislation there are no
connections to the variables at the given significance levels.
Firms with more effective organisation perceived social uncertainty at the time of the
survey more uncertain, while firms with provisional competitive advantages evaluated
it as lower.
Firms with more effective organisation evaluate domestic political changes as more
uncertain, while firms with high market orientation and provisional competitive
advantage less uncertain.
Enterprises with effective organisation (with modern decision marking and
information systems) perceive the present more uncertain than the past, while firms
with provisional competitive advantages perceive the present less uncertain than the
past.
There are several connections between the former determined performance configurations and
the perception of environmental uncertainty. I examined the relations at a confidence level
above 99.9% (p<0.001) with φ and crosstabs. I obtained these results:
In cases of C1, C4 and C6 the foreign sales market environment is less a source of
uncertainty, in groups C3 and C5 the distribution is even, while at C2 the foreign sales
environment is typically in a large measure an uncertainty source at the present as well
as in the past.
Examining at 99.9% confidence level uncertainty from domestic sales market
environment shows relation to the single groups at the present. In 5 groups (C1, C3,
C4, C5 and C6) the proportion of those, who perceive this factor in a large or
extremely large measure as an uncertainty source is above 65%, while in case of C2
the proportion of these firms is below 40%. It is characteristic, that they take this
uncertainty factor for of medium size. Furthermore at C6 15.6% (expected value
5.7%) of the firms in the group don’t take this factor for an uncertainty source.
There are no connections at 99.9% confidence level between the single group and the
uncertainty perception from capital and financial market changes, foreign and
domestic supplier, technological development, legislation and social changes.

122
The uncertainty from domestic political changes affect at the present in middle or
large or extremely large measure group C1, in small, medium, or large measure groups
C2 and C4, no or in small or medium measure the group C3, and in relative even
distribution the groups C5 and C6.
Based the results I accept the hypothesis.
4.6.4 H4
H4: The explorative firms are able to recognize the environmental changes better then the
exploitative firms.
It can be stated at 99% confidence level that firms following exploitative strategy recognize
environmental changes less (p<0.000), than enterprises following explorative strategy
(p<0.000), or ambidextrous organisations (p<0.013). Based on this I accept the hypothesis.
4.6.5 H5
H5: The better a firm performs, the better it can perceive and influence the environmental
changes.
Several dimensions of the performance evaluation are connected to the perception and the
influence ability of environmental changes of the firms at 99% and 95% confidence level.
Typically firms with higher market and lobby force (p<0.001), financial force (p<0.000),
organisational efficiency (p<0.001), lower product orientation (p<0.001), and more
favourable network position (p<0.015) are able to recognize and influence changes better.
Based on these results I accept the hypothesis.
There is no significant connection between the perception and influence ability of the
environmental changes and the performance configurations at 95% confidence level. The
proactive influence is an exception of the rule, while C1 and C2 firms were able to notify
important environmental changes in advance, prepare of them in time and employ proper
responses to them, even they strive for influencing consciously the environmental changes
(p<0.003) in a measure above (15.6% and 13.4%) the average (11.1%), C3 and C6 (10.8%
and 10.9%) around the average, while C4 and C5 firms (6.0% and 3.4%) below the average.

123
4.6.6 H6
H6: Exploration and exploitation are typical to different performance configurations.
There are several relations between the strategy followed and the different dimensions of
performance evaluation at 95% confidence level:
exploitative firms possess less provisional competitive advantages (p<0.012);
explorative firms have typically stronger financial force (p<0.011) network position
(p<0.010) and provisional competitive advantage (p<0.034) than the others who
doesn’t follow such strategy;
there is no significant connection between ambidexterity and the configurations.
The configurations given based on the strategy followed and the performance evaluation can’t
be matched entirely, but explorative strategies are more frequent in case of certain
performance configurations (p<0.045). The explorative strategy is above the average (51.1%)
in case of C3, C4 and C5 groups (60.5%, 54.3% and 52.1%); while in the other 3 cases it is
below the average. The difference is significant only at C3.
The exploitative strategy is characteristic for the two-third of the firms (68.4%), and the
groups aren’t different significantly, it is typical for each. On the contrary ambidexterity is
manifested at a smaller proportion (29.2%) of the firms, but there is no significant difference
between the groups. The 16-cluster-solution can be also interpreted in these cases, the
conclusion is that there is a significant connection between the explorative strategy and the
single clusters (p<0.017), while at the other two alternatives – in line with the above stated -
there is no connection. It is 20% more frequent than the average in cases of K4, K5 and K12
(60.7%, 69.6% and 60.7%); while at the same percentage of the firms it is below the average,
in cases of K8, K10 and K11 (36.2%, 38.2%, and 32.1%).
So, not the exploitation, but the exploration makes a real difference between the firms. The
exploitation in itself isn’t a source of competitive advantage, it could stop competitive
disadvantage, while the exploration can be source of a competitive advantage for the firms.
Based on this I accept the hypothesis modified, whereas only exploration and non-exploration
are typical to different performance configurations.
In this chapter I introduced the quantitative research and its results in details. The following
chapter contains the interpretation of the results and its wider position in literature.
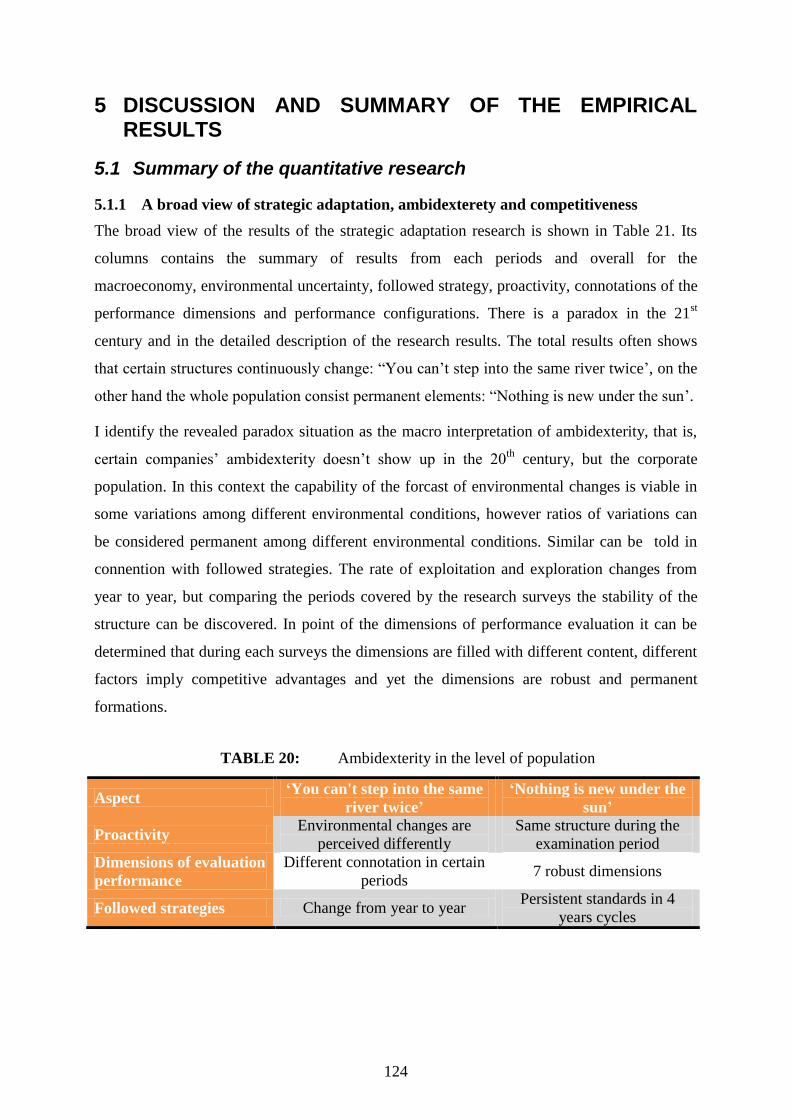
124
5 DISCUSSION AND SUMMARY OF THE EMPIRICAL RESULTS
5.1 Summary of the quantitative research
5.1.1 A broad view of strategic adaptation, ambidexterety and competitiveness
The broad view of the results of the strategic adaptation research is shown in Table 21. Its
columns contains the summary of results from each periods and overall for the
macroeconomy, environmental uncertainty, followed strategy, proactivity, connotations of the
performance dimensions and performance configurations. There is a paradox in the 21st
century and in the detailed description of the research results. The total results often shows
that certain structures continuously change: “You can’t step into the same river twice’, on the
other hand the whole population consist permanent elements: “Nothing is new under the sun’.
I identify the revealed paradox situation as the macro interpretation of ambidexterity, that is,
certain companies’ ambidexterity doesn’t show up in the 20th
century, but the corporate
population. In this context the capability of the forcast of environmental changes is viable in
some variations among different environmental conditions, however ratios of variations can
be considered permanent among different environmental conditions. Similar can be told in
connention with followed strategies. The rate of exploitation and exploration changes from
year to year, but comparing the periods covered by the research surveys the stability of the
structure can be discovered. In point of the dimensions of performance evaluation it can be
determined that during each surveys the dimensions are filled with different content, different
factors imply competitive advantages and yet the dimensions are robust and permanent
formations.
TABLE 20: Ambidexterity in the level of population
Aspect ‘You can't step into the same
river twice’
‘Nothing is new under the
sun’
Proactivity Environmental changes are
perceived differently
Same structure during the
examination period
Dimensions of evaluation
performance
Different connotation in certain
periods 7 robust dimensions
Followed strategies Change from year to year Persistent standards in 4
years cycles

125
TABLE 21: A broad view of strategic adaptation from 1992 to 2010
1992-1995 1996-1999 2000-2004 2005-2009 Sum
Macro-
environment
Stability New growth
path
Top
performance
Decline 1 economic
cycle
Environmental
uncertainty
Extreme
high in
internal
markets
Low in
external
markets
High in
internal
markets
Low in
external
markets
Moderate/
high in
internal
markets
Low in
external
markets
High - all
sources of
uncertainty
Internal
markets
seems to be
more
uncertain
then external
markets
Followed
strategy
Exploration
is increasing
to 40%
Exploration
is increasing
to 64%
At the
beginning of
the period
exploration
is more
common
(71%), then
Exploration
is increasing
to 56%
At the
beginning of
the period
exploration
and
exploration
are balanced,
but from
2007
exploration
decreases
In a 3-4 year
period the
pattern of
the strategies
followed by
the
companies
are the same
Proactivity The pattern of the capability of influencing the environment is the same on
each period.
Connotations
of the
performance
dimensions
Public
relations are
negative
Export
means
excellence
Competitive
advantage
comes from
economies
of scope and
low prices
Public
relations are
negative
Export
means
excellence
Financial
power is
connected
structural
efficiency
High
product
orientation
Export
means
excellence
Financial
power is
connected
structural
efficiency
High
product
orientation
Networking
increases
Financial
power and
structural
efficiency is
connected
flexibility
Networking
increases
Competitive
advantage
comes from
flexibility
7 robust
dimensions
Performance
configurations
Many
strategic
variables
The role of
networking
is low
Many
strategic
variables
Grabbing the
short term
opportunities
The role of
networking
is low
The most
strategic
variables
The role of
networking
is increasing
Retention of
fewer
strategies
The role of
networking
is increasing
6 and 16
cluster
solutions.
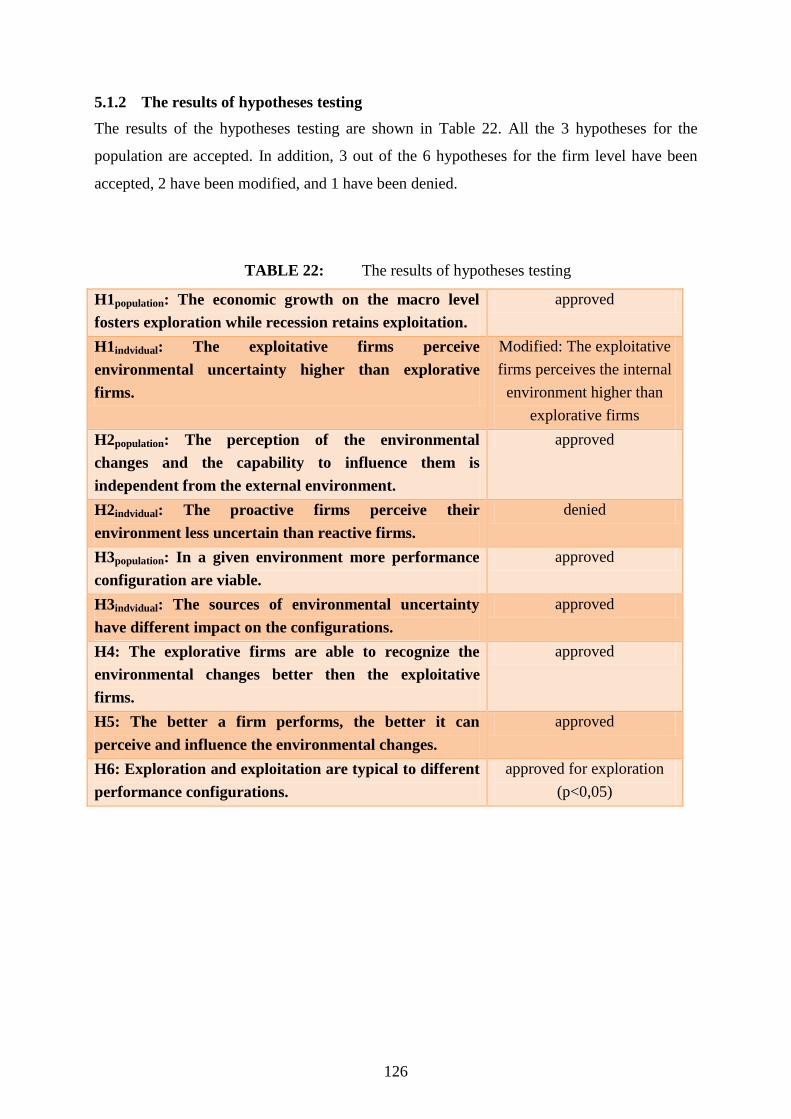
126
5.1.2 The results of hypotheses testing
The results of the hypotheses testing are shown in Table 22. All the 3 hypotheses for the
population are accepted. In addition, 3 out of the 6 hypotheses for the firm level have been
accepted, 2 have been modified, and 1 have been denied.
TABLE 22: The results of hypotheses testing
H1population: The economic growth on the macro level
fosters exploration while recession retains exploitation.
approved
H1indvidual: The exploitative firms perceive
environmental uncertainty higher than explorative
firms.
Modified: The exploitative
firms perceives the internal
environment higher than
explorative firms
H2population: The perception of the environmental
changes and the capability to influence them is
independent from the external environment.
approved
H2indvidual: The proactive firms perceive their
environment less uncertain than reactive firms.
denied
H3population: In a given environment more performance
configuration are viable.
approved
H3indvidual: The sources of environmental uncertainty
have different impact on the configurations.
approved
H4: The explorative firms are able to recognize the
environmental changes better then the exploitative
firms.
approved
H5: The better a firm performs, the better it can
perceive and influence the environmental changes.
approved
H6: Exploration and exploitation are typical to different
performance configurations.
approved for exploration
(p<0,05)

127
5.2 Value cration for the Hungarian and international research cummunity
5.2.1 Value creation with 4 actions
The dissertation’s primary aim was to add and improve our understanding gained from
previous studies (Antal-Mokos and Kovács, 1998, Antal-Mokos and Tóth, 2001, Hortoványi
et al, 2006 and Hortoványi and Szabó, 2006b) and as such, to highlight formerly hidden
attributes. To achieve this, the four actions suggested by Kim and Mauborgne (2006: 46) were
introduced (see Table 23).
TABLE 23: Value creation with 4 actions
Eliminate
Principal Component Analysis
Counting the average of variables measured on an ordinal scale
Reduce
Control variables (7 instead of 10)
Examine the central tendency
Data reduction
Raise
The international foundation of the research
The use of former studies
Longitudinal approach
Cross references
Research scope
Research design and methodology
Transparency
Subsamples
Description of the control variables and the sample
Missing Value Analysis
Understanding the phenomenon
Create
Integrated research platform
Simultaneous examination of the macro and the micro economy
Multidimensional Scaling
7 robust performance dimensions
Hypothesis development and testing
Identification and description of Explorative, Exploitative and Ambidextrous strategies
Differentiation of larger, more stable and smaller, more changing structures
Recognition of ambidexterity on micro and on macro level
128
5.2.2 Questioning the Contingency Theory
In my earlier research (Szabó, 2008) I interpreted the possible adaptation strategies of the
participants of the bio-ethanol industry in regard of the changes induced by the evolving
industry itself. My researches covered the following areas: (1) Interpretation of the
environmentally conscious and innovative business opportunities in the oil industry, which
appear as environmental challenges, and then (2) Integration of most important categories of
strategic answers given to the environmental challenges found in the literature. Finally (3) the
interpretation of the adaptation strategies based on the example of the participants of the bio-
ethanol industry could take place.
Summarizing the learning points of the adaptation strategies found in the bio-ethanol industry
made it possible to disprove the standpoint of the contingency theory, which states that there
is only one appropriate (organisational) and efficient solution to a certain environmental
conditions (Dobák and Antal, 2009). Contrary, I managed to confirm the supposition of the
Configurational School, which states that more than one integral adaptation strategy, strategic
archetype can be efficient and successful depending on the context and the organisation
(Miller and Friesen, 1977, Miles and Snow, 1978).
Beyond that, I could also point out that all the existing adaptation strategies can be viable in
certain stages of the life cycle. The justification of this hypothesis, revealed by qualitative
methods, has not happened yet with quantitative tools, which I compensated in the empirical
researches of the dissertation. My results justify that firms can respond to the challenges of
the external environment with different but still viable strategies and configurations.
Beyond the cross sectional, same time analysis of the environmental conditions it is worth
shifting to the longitudinal analyses covering more periods of time. It is an interesting
question regarding that, whether the same strategy types would be dominant in different
environmental conditions as well. Hungarian researchers, for example Antal-Mokos and
Kovács (1998), Antal-Mokos and Tóth (2001), and Hortoványi and Szabó (2006b) has
already tried to answer the question partially.
The above mentioned researchers examined nearly identical variables (in the last two cases
the variables were completely identical), analyzed samples with similar composition (all of
them used the current database of the Hungarian competitiveness research program) and
although they used identical research frameworks, they created different (only partially
overlapping) strategies.

129
It makes the longitudinal comparison of the strategy types more difficult, which I dissolved in
my dissertation and suggest a new and integrated methodology instead of the analysis of
fragmented samples.
The integrated application gives an opportunity for examining whether the different strategies
appear in the same ratio or not at different environmental conditions. The assumptions of
Configurational school that different configurations and strategy types suit successfully the
different environmental conditions was also proved by my empirical study presented in details
in my dissertation.
Furthermore, my results also confirmed the assumption of Burgelman (1991), Pettigrew
(1985, 1987) and Dickhout et al. (1995) that firms during crisis tend to concentrate on the
strengthening their existing position and their exploitative activities, and hence, the most
frequent strategy types will be retained. In contrast, under favourable conditions new strategy
variations emerge and the ones with lower performance are also proven to be viable.
5.2.3 Few additional interesting conclusions
At the empirical examinations I examined configurations and adaptation from a top
management point of view. The “self-importance’ of the top managers and the production
viewpoint were the most frequent in the sample 1999. It is an interesting coincidence that this
period was the most prosper economic environment compared to the former period. Moreover
the production viewpoint from 1999 was basically transformed by the economic crisis, and
resilience would be the most important competitive advantage.
The role of the single firm activities has significantly changed during the years. Export
activity was during the first two surveys separate competitive dimension, competitive factor,
but now the lack of export activity is considered as a competitive disadvantage. It is to be
remarked that while in 1990 the export activity was inseparable from the high product quality
and technological quality level, now it doesn’t refer to special excellence.
The role of the state and the judgment of governmental relations have changed a lot during the
almost two decades. Sales to state meant in 1996 a negative, a backwardness attributive, it
was accompanied by backward structure and financial force, which is emphasized a lot by,
Bojár (2005) too.
Nowadays sales to state and lobby activity contributes to the financial force of a firm,
however is further on under discussion that how much “easy money incomes’ distort the
competitiveness of the economy and the firms.
130
It is important to underline that in case of firms with high market and lobby force the level of
customer need satisfaction fell typically during the survey, which can refer back to the
inability of the firms and the misuse with superior strength.
The conversion between the performance dimensions is an important question at every
configuration. Typically firms aren’t able to dominate their competitors along every factor, so
it is necessary to find certain primness focuses. Within it is an important result that it isn’t
recommended to primarily endeavour to have organisational efficiency, because it is
accompanied by low performance related to the other dimensions. There is also exception,
when the efficient organisation helps in grabbing the provisional competitive advantages, but
it is important to know the common occurrence of the single dimensions during formulating
winner strategy.
Where does cost-efficiency come from? The different surveys have different answers to this
question. While in the 1990’s economies of scale and economies of scope played the major
role, then to the middle of the period the up-to-date and efficient information systems
(economies of speed) had this role. For today cost-efficiency comes clearly from the
flexibility and resilience (economies of speed, competence and learning) (I categorized
economies based on Zahn, 2000).
Larger firms follow explorative strategy (growth or attacking) with higher probability than
smaller firms, which is in line with the concept of Penrose (1959): larger firms possess
advantage in advance while growth raises new growth opportunities.
In case of the perception of environmental uncertainty, the uncertainty of foreign markets in
certain industries (manufacturing industry and agriculture) is higher, which refers indirectly to
that these industries more interlinked in international circulation.
Related to the methodology it is a worth to notice, that the multidimensional scaling explains
at least 95% of the examined variables besides excellent fitting, while the principal
component analysis explains through the former researches typically only 50-60%
(Eigenvalue above 1). This methodological difference results in significant improvement in
the reliability of the research results.
By enlarging the sample the potential number of clusters raises proportionally. The
phenomenon is described by a large extent some well-defined archetypes.
131
5.3 The practical meaning and value of the results
The committee of the thesis proposal recommended interpreting my empirical results by
practicing professionals, corporate managers, because this can enrich the value of the
researches. In the course of the defence they suggested 8-10 managerial interviews or 1 focus
group to further examine certain part of the dissertation.
Taking the recommendation, I consulted practicing professionals, and then I recorded 41
managerial opinions in connection with the results of three fields of the research: (1)
assessment of the environmental uncertainty, (2) the strategies followed, ambidexterity,
exploitative and explorative activity of the organization, and (3) competitive performance
goals and configurations.
In the following part I present the methodology and the results of the qualitative research and
I compare them with the results of the quantitative research.
5.3.1 Methodology of the qualitative survey
According to Miles and Huberman (1994: 6) “qualitative research is conducted through an
intense and/or prolonged contact with a ‘field’ or life situation. The researcher’s role is to gain
a “holistic’ (systematic, encompassing, integrated) overview of the context under study: its
logic, its arrangements and its explicit and implicit rules’.
Through the qualitative research the researcher attempts to collect data “on the perceptions of
local actors “from the inside’ through a process of deep attentiveness, of empathetic
understanding, and of suspending “bracketing’ preconceptions about the topics under
discussion. The researcher can isolate certain topics and expressions, which can be reviewed,
but they have to be preserved in their original form through the research.
The qualitative research methods provide understanding of the problem setting and are based
on small samples. The qualitative research methods can be divided into two groups. On the
basis of whether the respondents know the research objectives we can differentiate direct and
indirect methods (Malhotra, 2008).
In the course of the techniques employing a direct approach, the respondent knows the
objective of the research, and answers in consciousness of that, while the projective
(association, completion, construction, expression) techniques, which are used in case of
indirect approaches, encourage the respondent to express his/her motivations, opinions,
attitudes or feelings in connection to a certain topic without being influenced by the objective
of the research.

132
I rejected the usage of the latter, although this technique is exceedingly suitable for attitude
research, in case of the present research the required information are of the different type, so
the employment of this technique can lead to significant distortions. Moreover the required
information were obtainable by a direct method, there was no need for hidden questioning.
The two most frequently applied way of the direct qualitative research methods are the focus
group and the depth interview. Focus group is an unstructured and direct interview, where a
skilled moderator talks to a small group of respondents. The members of the group usually are
homogenous. Its advantages are the group synergy, which allows deeper insight into a certain
topic than single answers, new ideas arise easier, and more people can be questioned at the
same time (Malhotra, 2008).
The depth interview differentiates from the focus group mostly in that; the questioner speaks
with only one interviewee. Naturally in case of paired interviews or triads there 2-3
respondents, but in case of single or expert interviews there is one respondent. Compared to
the focus group the interview is able to explore a certain problem, single answers and cases
deeply, its further advantage is that the respondent doesn’t feel social pressure on indentifying
on the group opinion. At professional questioning, deeper problem exploring, and sensitive
topic it is highly recommended to use this technique (Malhotra, 2008).
Due to the presented advantages and disadvantages I chose putting in the centre single
opinions compared to the group technique, and tried to minimize the disadvantages of the
method. The most important disadvantage of the interviewing is that the answers can depend
on the questioner. To reduce this factor, I fixed the main line of the interview in advance, so I
burdened the fields, which I take for important to explore during the interviews. On the other
hand during the interpretation of the results I treated the results of the quantitative research as
my presumptions, so I tried to estimate my effect on the answers, and I drew up my opinion in
the light of these (Gelei, 2002).
5.3.2 Definition of the unit of analysis, population, and sample
During the case study research the unit of analysis is needed to be determined (Gelei, 2002:
169). In case of this research it equals to the population definition used in marketing research.
The population is the aggregation of those elements, which have a common characteristic and
meet the objectives of the research problem (Malhotra, 2008:364). In this case the units of
analysis are Hungarian enterprises, firms, that are lesser or greater affected by environmental
changes, or they are able to influence them.

133
The sample is selected from the population. During qualitative research the sampling is not
statistical, but primarily theoretical. As opposed to the statistical sampling, the qualitative
sampling is characterized by (Miles and Huberman, 1994; Gelei, 2002: 169-170):
small sample and context specific (as opposed to the big sample, and ignoring the
context);
on purpose and expediently selected sample (as opposed to the random sample
selection);
theoretically oriented sample (as opposed to the representativeness);
continuously, step-by-step evolving sample (as opposed to the in advance defined
sample.
In case of the present research the emphasis is not on drawing the conclusions which are true
for the whole population, after the examination of the sample. So there is no need for
representative sample, and it isn’t a requirement also to select the cases random (Malhotra,
2008), so the sample wasn’t selected by random selection method. At sampling I endeavoured
to get a sample which is different from as much as possible points of view. I employed
judgmental sampling using the control variables from the quantitative research (especially
size and industry).
A drawback of the diversity of the sample, that it is more difficult to find common points
between the opinions and ways of thinking of the respondents. This drawback can be
eliminated or reduced by that during the interpretation process the researcher tries to find
those points which can be connected to each other from some point of view, ranked side by
side, or which aren’t connected exclusively to one respondent and it is worth questioning
them from other population elements through a further research.
5.3.3 The script of the qualitative research
The questioner and the data analyst have significant effect on the interviewing process and the
interpretation of the interviews. In order to reduce the distortion, I used the same script for
surveying the managers’ opinion, from which I didn’t depart or only in a small measure at the
single cases. Table 24 shows the steps of the collection and interpretation of the managers’
views.

134
TABLE 24: The script of the qualitative research
Data survey
Preliminary The context examination of organizations included in the research
0-10
minutes
Introduction of the general results and objectives of the research
General and executive introduction of the organization
10-30
minutes
Introduction of the quantitative research results in relation to environmental
uncertainty
Executive interpretation of the sources of environmental uncertainty,
exploration of its own uncertainty factors and life situation
30-55
minutes
Introduction of the quantitative research results in relation to the strategies
followed
Managers interpret exploitation and exploration and their connection for their
own firms
They assess what kind of opportunities the global crisis opened up for the firm
55-70
minutes
Introduction of the quantitative research results in relation to performance
configurations and goals
CEOs present their own performance goals and then rank the 7 performance
goals
Introduction of strategies recommended in order to reach outstanding
performance
70-75
minutes
Conclusion, reflection on survey
Data
recording
Before
survey
Making notes based on online and personal sources
During
survey
Handmade notes
Directly
after survey
Completion of handmade notes, digital recording
Data
analysis
After all
surveys
I analyzed data summarized and not after the single surveys
Determination of methodology for data analysis
During data analysis looking for, collecting opinions that harmonize with the
quantitative research results, that are interpret or complement them, or depart
from them, perhaps disprove them.
The analysis of the surveyed data during the qualitative research differentiates form the
quantitative researches, because there are many ways to start, tell the truth it is the
researcher’s task and responsibility at the same time, which method he/she chooses (Ryan and
Bernard, 2003, Strauss and Corbin, 1990, Miles – Huberman, 1994, Maxwell, 1996). It is
advisable to develop a unique model for every research, than to squeeze the interpretation
process into the frames of another research. As the primary objective of my qualitative
research is the interpretation of the quantitative research results, it was done based on this:

135
1. Mapping my first impressions and defining the Big Picture
2. Functional analysis of the given answers related to the single topics, assembling the
“puzzle’, defining topics.
3. About what they avoided to talk…
5.3.4 First impressions and the Big Picture, recognizing Mintzberg’s elephant
During reading the notes I tried to work through the text from several points of view, and
determine topics connected to them, or taboos. These viewpoints were the “what happened’,
“what was done’, “how they felt’, “what they suggested’, “how the environment reacted’, and
‘about what they avoided to talk’. The viewpoints bring partly the same topics up, but in
different interpretations. I felt little so as the blinds in Mintzberg et al. (2005) Strategy Safari,
who want to describe a whole elephant so each of them touch a different part of it, but don’t
see the whole elephant. No wonder that their picture about the elephant can differ very much
from each other.
Considering being lost in the details, I endeavoured to determine one idea in the umpteenth
reading, what strategic adaptation and ambidexterity mean for the interviewees. The
respondents pointed at that the strategic adaptation is an effort to grab an opportunity (or even
threat), which has novelty content compared to the competitors, and with its help the firm is
able to survive. The interviewees expressed the certain parts of the definition so:
“The more new products I bring to the market and the more customers I am able to convince
of using these, the more my turnover increases.’ (3. respondent)
“Due to the continuous innovation we could improve our position compared to our
competitors.’ (11. respondent)
“Penetrating the places of several hotels went bankruptcy. Novelty, special offer.’ (15.
respondent)
“For a Hungarian developer, producer firm, which has own products, the biggest uncertainty
despite the crisis is that, when its product range is “attacked’ by a Chinese manufacturer.
Unfortunately it already occurs at special products too.’ (22. respondent)
“Many competitors, who focused not on quality, rather on easy money-making have
disappeared. Their customer base got free. Who now survives, deserves more trust – this is a
purifying process.’ (37. respondent)

136
“Everybody offers the same on the market, so the big difference can be in the how.’ (38.
respondent)
After defining the Big Picture the identification of the puzzle elements could come, which
serves also for the controlling of the picture. Moreover these topics specify the further
practical interpretations of the quantitative research results. The examined key topics are:
What are the sources of environmental uncertainty for CEOs?
What are the strategies followed by firms?
What kind of performance goals does the enterprise have?
5.3.5 What are the sources of environmental uncertainty for CEOs?
The following categories were evolved through the qualitative surveys (numbers of the
mentioning are in the brackets):
Markets (65)
Finance (45)
State/EU regulation and politics (44)
Managing the enterprise (35)
People (31)
Suppliers and partnerships (25)
Competition (18)
Technology (14)
Others (weather, situation of SME-s, traffic, education system)
The markets, finance and regulation, and suppliers and technology are directly analyzed
categories also through the quantitative research, the competition is through performance
configurations indirectly examined factor, but the managing the enterprise and the people
draw our attentions to a new field.
The following quotes illustrate well, that the uncertainty – beyond the employed at the
quantitative research – can be emerged not only from the external environment of the firm,
but internal elements can be also dominated.

137
“The basis of the operation and economy of the whole investment is that we find 30-40
manager colleagues.’ (24. respondent)
“Our enterprise is still in the research and development phase, so the “inventor’ has an
important role in the progress, whose state of mind is very unstable. His careless declarations
in the press (which are pushed off from reality in a huge measure) harm the judgment of the
project by economic and political leaders a lot.’ (36. respondent)
“From 4 women colleagues 3 are engaged, they may have a baby within 1-2 years.’ (41.
respondent)
In the people category the owners, the managers and key employees and the attitudes and
abilities of the employees appear. The managing the enterprise is a more complex category,
which basically refers to that the managing the enterprise is uncertain for itself, it contains
several uncertainty factors the business idea, the business model, the organizational structure
etc. and those viability. The people and the managing the enterprise categories are able to be
matched in this interpretation to the soft and hard parts of the management and leadership. So
the source of the internal uncertainty is related to the managers and the level of management.
Briefly summed up, based on the practicing professionals’ picture of environmental
uncertainty it can be determined that the reason for existence of the through the quantitative
surveys employed factors are strengthened and completed by the internal environmental
uncertainty of the firm, which can be led back primarily to the quality of the firm’s
management.
5.3.6 What are the strategies followed by firms?
Within this question the analysis of two questions comes to the front: (1) What is the
connection between the exploitative and explorative activities, and (2) How did the global
crisis influence the business strategy?
In relation to the first question, all 41 managers explained the exploitative and explorative
activities in the operation of his/her enterprise. There were managers who give more details
about the exploitation and who give more details about the exploration, but both
phenomenons can be interpreted in every firm.
138
“The resources which we save by removing certain activities we use for development of old
and new products.’ (9. respondent)
“We wanted to introduce one of our existing services in a new export market, but for this
additional development was needed, which further strengthened our position on our existing
market too.’ (11. respondent)
“We can plan; complete our new products by using our existing services. We can estimate the
market by using our existing connections.’ (31. respondent)
The qualitative research pointed out that ambidexterity, the coexistence of exploration and
exploitation at the same time refers to the proper operation of the firm, but it can be declared
based on the results of the quantitative research, that only a smaller proportion of the firms are
able to find the proper balance between the two factors.
The duality appears remarkably in relation to the crisis. The global crisis was for one part of
the firms an obstacle, for the others a favourable opportunity.
“After the crisis people were unsure what the real value is. Our service gives an internal,
eternal value, which will be always there if it is needed. Nobody will be able to take it away.
‘(1. respondent)
“There weren’t any new opportunities, because the demand for the marketable products and
the ability to pay has reduced.’ (3. respondent)
“It was an opportunity to take over the markets of the less effective, due to the crisis quickly
capitulating competitors.’ (13. respondent)
“The clients are more opened for switching service providers, so it is easier to attain the
offer.’ (16. respondent)
“The price reductions in the constructive industry made investment cheaper.’ (23.
respondent)
Based on the opinion of the interviewees those firms were able to grab the opportunities in
connection to the crisis (e.g.: decrease in competitors), which possessed from the beginning a
stable financial model or were able to balance the finance of the firm in the earlier part of the
crisis, primarily by efficient cost-reduction programs. The in advanced planned and properly
prepared growth or investment strategy was mentioned as additional success factor, because
markets can be attacked easier and investments are can be executed cheaper.

139
5.3.7 What kind of performance goals does the enterprise have?
To answer the question I used the quantitative research results as a base and ask for the
respondents to rank the identified 7 performance goals. On the basis of the answers the
performance motivations of the firms differentiate significantly, nearly there aren’t same
orders of ranks. Besides market and lobby force, the organizational effectiveness and the
market orientation are typically important. The network position and the instant competitive
position are typically not important; the assessment of product orientation is neutral. The
financial force divides the opinions of the respondents; it is important for several respondents,
but it is also not so important for other several respondents.
It can be an interesting statement that those firms signed the financial force as an important
performance goal, which possess very weak financial structure and feel financial uncertainty
significant. Firms in better financial position typically would like to upgrade primarily the
market and lobby force and market orientation or the organizational effectiveness and not the
enhancement of the financial force.
It is an important lesson of the quantitative survey that those firms which committed
themselves to one idea are less financially successful than those who committed themselves to
entrepreneurship. The financially more stable enterprises reported that they had several
opportunities during the realization of the original idea, which proved to be further more
mature on business, so they altered the original idea or even gave it up.
Besides the firms expressed their performance goals colourfully, which can be led back to the
identified basic categories. Here are some examples:
“We basically aimed the growth and it worked. More concentrate sales and new fields,
strengthening certain branches of business.’ (7. respondent) (market and lobby force, and
market orientation)
“The global crisis influences the life of great part of people significantly. We offered solutions
for stress situations coming from this.’ (34. respondent) (market and product orientation)
“Establishing a new organisational form.’ (35. respondent) (provisional competitive
advantage and organisational efficiency)

140
5.3.8 About what they avoided to talk…
There are some uncharted sensitive topics, which managers didn’t speak gladly or spoke
rather indirectly about. In relation to the environmental uncertainty a former hidden
dimension has turned up and has become identifiable through the analysis of the strategy
followed and the performance goals.
For managers it was a source of uncertainty that employees didn’t do work properly, truly
there aren’t proper employees in the labour market, on the other hand the firm is founded on a
very good idea, but the market doesn’t value it in accordance with the expectations, further on
the business structures or the attitude of the partners aren’t suitable.
Several managers said that his/her firm didn’t have adequate income and cost structure
namely its finance model wasn’t in order. However upgrading the financial performance is an
important aim for these enterprises; they aren’t able to work out a proper construction
referring to this. It damages further their prospects that by their own admissions they aren’t
able to rely on external partners, so they aren’t able to invoke external ‘help’, which isolates
them both form consultants and investors.
On second thought the respondent didn’t go around something else, than the basic managerial
functions; planning, organizing, leading and controlling. Namely the manager describes the
inadequacy of the managerial functions, gives an account of his/her managerial uncertainty,
which leads to cognitive dissonance. In so far the espoused theory and the theory-in-use differ
from each other, the aspirations to resolve the resulting cognitive dissonant situation can have
different outcomes (Bakacsi, 1996).
We obtain several beliefs which express not only conclusions of the connections between the
things and features, but also express evaluative statements – form a judgment of good and
bad, positive and negative. So values are basic beliefs which reflect our choices and
preferences referred to the final aims of human life (self-actualization, liberty etc.) or the
widely understood way of life (honesty, friendship, bravery). So at the determinant decisions
of our lives, in choice situation we prefer always the same aims and situations to others.
As values are mostly irrational – although we tend to consider ours rational – and they mostly
don’t form a consistent value system – it is possible that we have to follow contradictory
values – so it isn’t also surprising that it occurs that people express something else than what
they truly follow. When this happens we act against our espoused theory and there will be a
contradiction between our behaviours, internal tension arises in ourselves.

141
We have a strong urge to reduce tension; we try to justify, explain our behaviour. We do it in
order to have again consistent thoughts, feelings.
We can resolve the cognitive dissonance before the current act, if we can convince ourselves
that the planned act “serves a good end and so justifies the means’. At many times we act too
fast to consider our every single act and compare them to our value system. Then we have
only a possibility to dissolve our “guilty conscience’ after acting.
We can differentiate three basic “strategies’ for resolving the cognitive dissonant situation:
(1) reception, internalization of objective reality; (2) neglecting of objective reality; and (3)
reducing the contradictory character by introduction of new reference points.
So there are three opportunities to resolve the managerial uncertainty of the respondents: (1)
the manager recognizes and accepts that he/she isn’t a professional, but an instinctive
manager (reception of objective reality), or (2) the manager holds the environment responsible
for the inadequate results (neglecting of objective reality), or (3) he/she doesn’t take it for a
problem, because the every actor of the industry acts in a similar way (introducing new
reference point).
5.3.9 Summary of the qualitative research results
In course of the qualitative analyses I set sights on the examination the three major fields of
my quantitative results (uncertainty, strategy, performance), and the practical interpretation of
the results. On one hand the qualitative surveys acknowledged the results of the quantitative
researches; on the other hand they enriched the results of the dissertation, whereas:
It is also important to take into account the internal uncertainty primarily coming from
management, beside the external uncertainty factors
Firms can act during their daily routine exploitative and explorative too, but the
proportion of these is significantly different at the single firms, based on that they can
be classified along the categories compatible with the quantitative research.
The performance goals of the firms shift to strengthening the organizational force,
after reaching proper financial stability (market and lobby force, organizational
effectiveness).
142
5.4 Assignment of further research questions and related disciplines
5.4.1 The linkage of the dissertation to other disciplines
The investigation of strategic adaptation, ambidexterity and competitiveness is based on the
foundation of management science that puts the environmental adaptation and influence of
enterprises and their population into the centre. It investigates the connections between the
internal and external environment from the perspective of the management, according to the
philosophy for which the scientific background of the Institute of Management of Corvinus
University of Budapest stands for: in Environment – Strategy – Structure – Behaviour –
Performance dimensions (Antal-Mokos et al., 1997, Bakacsi, 1996, Balaton et al., 2007,
Dobák, 1997, Dobák and Antal, 2009).
Strategic adaptation which investigates environmental adaptation and influence is not an
individual scientific area; however, partially it is also the aim of this dissertation to deliver
valuable results to other economic and organisational scientific areas, more accurately within
the management and organisational sciences, and to show possible connections to them.
The framework of the dissertation is not wide enough for introducing all potential
connections, but I raise the attention to some common questions. The investigation of
strategic adaptation, ambidexterity and competitiveness shows strong connection to the
following areas (in alphabetical order):
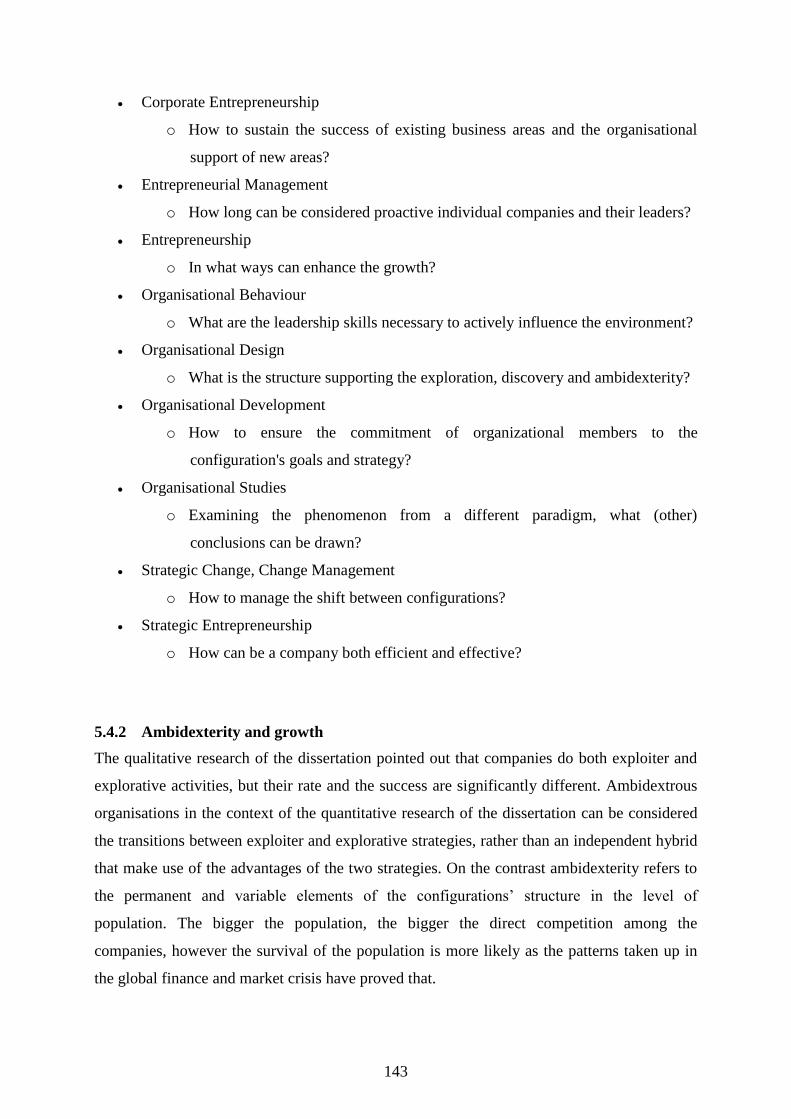
143
Corporate Entrepreneurship
o How to sustain the success of existing business areas and the organisational
support of new areas?
Entrepreneurial Management
o How long can be considered proactive individual companies and their leaders?
Entrepreneurship
o In what ways can enhance the growth?
Organisational Behaviour
o What are the leadership skills necessary to actively influence the environment?
Organisational Design
o What is the structure supporting the exploration, discovery and ambidexterity?
Organisational Development
o How to ensure the commitment of organizational members to the
configuration's goals and strategy?
Organisational Studies
o Examining the phenomenon from a different paradigm, what (other)
conclusions can be drawn?
Strategic Change, Change Management
o How to manage the shift between configurations?
Strategic Entrepreneurship
o How can be a company both efficient and effective?
5.4.2 Ambidexterity and growth
The qualitative research of the dissertation pointed out that companies do both exploiter and
explorative activities, but their rate and the success are significantly different. Ambidextrous
organisations in the context of the quantitative research of the dissertation can be considered
the transitions between exploiter and explorative strategies, rather than an independent hybrid
that make use of the advantages of the two strategies. On the contrast ambidexterity refers to
the permanent and variable elements of the configurations’ structure in the level of
population. The bigger the population, the bigger the direct competition among the
companies, however the survival of the population is more likely as the patterns taken up in
the global finance and market crisis have proved that.

144
During the analysis of ambidexterity the explorative activity has gone hand in hand with
bigger performance in finance power, network position and momentary competition positions.
These imply that it is necessary to find the profitable business model first, and after that can
come the growth of the company. In the further examination of ambidexterity I focus on the
quantitative changes as well, unlike the majority of strategic management researches where
the dependent variable of strategic management is only short term quantitative change (Hitt et
al, 2001: 29).
The phenomenon of entrepreneurship has been researched for a long time, but it still doesn’t
have commonly accepted foundations (Aldrich, 2005, Aldrich and Baker, 1997). The biggest
accordance appears in connecting, almost identifying the concepts of growth and
entrepreneurship, though they are not equal (Davidsson, 2004). In the literature of
entrepreneurial theory, growth is derived from the exploitation of the opportunity and aimed
at efficient, innovative changes. Contrarily, entrepreneurship research deals only a little with
efficiency, therefore it is worth combining strategy with entrepreneurship (Schendel and Hitt,
2007).
In the last sentences of the dissertation I realize the junction of strategy and entrepreneurship
through the pattern of growth, hence it is not the concept of strategic entrepreneurship that I
use, but that of strategic growth management which emphasises more the common linking
points between them. Strategic growth management indicates the necessity of efficiency and
effectiveness at the same time. Efficiency principally refers to the quality of the realization of
the strategy, while effectiveness refers to the quality of the growth strategy, that is how much
an organisation influence (through their products and services) the costumers’ habits, to what
extent it shapes the consciousness and the behaviour. The relationship between efficiency,
effectiveness and growth is demonstrated on Figure 29 which was inspired by the pioneer
research by March (1991).

145
FIGURE 29: The connection between efficiency, effectiveness and growth
Revealing the connection between efficiency, effectiveness and growth for example might
happen with the help of utility graphs similarly to the utility term used in economy. The graph
like representation might help to understand how much efficiency and effectiveness can be
regarded substitutes or complements in regard of the contribution to the growth of the
enterprise. During the dissertation I suppose that if a company can realize both on a high level
then the growth orientation will be higher as well. The exact exploration of the relation of
efficiency, effectiveness and growth exceed the borders of this dissertation.
* * *
Summerizing it, the dissertation was born as a result of (2+)5 years of scientific preparation
and research. I belive that the research questions in focus are important and timely, the
research design and methodologies used are proper and up-to-date, and the contributions are
valueable for scholars, practitioners and policy makers on a national and international level.

146
REFERENCES
Ács, Z - Szerb L - Ulbert J - Varga A (2001): GEM 2001 Magyarország: Vállalkozások
Magyarországon globális összehasonlításban. Pécsi Tudományegyetem,
Közgazdaságtudományi Kar, Pécs
Ács, Z - Szerb L - Varga A - Ulbert J - Bodor É (2004): Új vállalakozások gazdaságra
gyakorolt hatásainak vizsgálata nemzetközi összehasonlításban. Papers on
Entrepreneurship, Growth and Public Policy, #2404
Adizes, I (1992): Vállalatok életciklusai. HVG: Budapest
Adizes, I (1999): Managing Corporate Lifecycles. Prentice Hall Press, Paramus, NJ
Aldrich, HE - C Zimmer (1986): Entrepreneurship through social networks. In Sexton, D - R
Smilor (eds): The Art and Science of Entrepreneurship, Ballinger: New York, pp: 3-23.
Aldrich, HE – T Baker (1997): Blinded by the cites? Has there been progress in
entrepreneurship research. In DL Sexton - RW Smilor (eds): Entrepreneurship 2000,
Upstart, Chicago, pp: 377-401.
Aldrich, HE (2005) Entrepreneurship. In Swedberg, R – N Smelser (eds.): Handbook of
Economic Sociology. Princeton University Press and Russell Sage Foundation, Princeton,
pp: 451–477
Anderberg, MR (1973): Cluster analysis for applications. New York: Academic Press
Angyal Á (2003): Vállalati kormányzás. Aula Kiadó, Budapest
Ansoff, H. I. (1965): Corporate Strategy: An analitic approach to business policy for growth
and expansion. McGraw-Hill, New York
Antal-Mokos Z – Balaton K – Drótos Gy – Tari E (1997): Stratégia és szervezet,
Közgazdasági és Jogi Könyvkiadó, Budapest
Antal-Mokos Z - Kovács P (1998): Magyar vállalati stratégiák az 1990-es évek első felében –
taxonómia. Vezetéstudomány, (2)
Antal-Mokos Z – Tóth K (2001): Vállalati stratégiák Magyarországon 1990-es évtizedben.
Vezetéstudomány, (1)
Antal-Mokos Z et al (1997): Vállalati stratégiák és stratégiai menedzsment a magyar
gazdaságban. ‘Versenyben a világgal’ kutatási program. BKE Versenyképesség Kutató
Központ, Budapest

147
Arrow, KJ (1974): The Limits of Organization. Norton, New York
AT Kearney (2009): Eröltetett növekedési modell.
http://www.iveybusinessjournal.com/article.asp?intArticle_ID=777
Audretsch, D - Z Ács (1990): The entrepreneurial regime, learning and industry turbulence.
Small Business Economics, 2(2): 119-128
Bakacsi Gy – Balaton K – Dobák M (eds) (2005): Változás és vezetés. AULA, Budapest
Bakacsi Gy (1996): Szervezeti Magatartás. Közgazdasági és Jogi Könyvkiadó, Budapest
Balaton K - Hortoványi L - Incze E - Laczkó M - Szabó ZsR - Tari E (2007): Stratégiai és
üzleti tervezés. Aula Kiadó, Budapest
Balaton K - Hortoványi L - Incze E - Laczkó M - Szabó ZsR - Tari E (2010): Stratégiai
menedzsment. Aula Kiadó, Budapest
Balaton K (ed) (2006): Vállalati stratégiák az EU-csatlakozás időszakában. ‘Versenyben a
világgal’ kutatási program. BCE Versenyképesség Kutató Központ, Budapest
Balaton Károly (2005a): Vállalati stratégiák és szervezetek a rendszerváltást követően.
AULA Kiadó, Budapest
Balaton, K (2005b): Attitude of Hungarian companies towards challenges created by EU-
accession. Journal for East European Management Studies, 10, pp: 247-258
Bantel, KA - SE Jackson (1989): Top management and innovations in banking: Does the
composition of the top team make a difference? Strategic Management Journal, 10: 107–
124.
Baron, RA (1998): Cognitive mechanisms in entrepreneurship: why and when entrepreneurs
think differently than other people. Journal of Business Venturing, 14(4): 275-294
Barringer, BR - AC Bluedorn (1999): The Relationship between Corporate Entrepreneurship
and Strategic Management. Strategic Management Journal, 20: 421-444
Beatty, RW – DO Ulrich (1991): Re-energizing the Mature Organization. Organizational
Dynamics, (summer): 16-31
Beer, M – RA Eisenstat – B Sceptor (1990): Why Change Proframs Don’t Produce Change.
Harvard Business Review, (6): 158-166
Boari, C (2001): Industrial Clusters, Focal Firms, and Economic Dynamism: A Perspective
from Italy. Word Bank Institute, Washington.

148
Bojár G (2005): The Graphi-story. HVG Kiadói Rt, Budapest.
Burgelman, RA (1983a): A model of the interaction of strategic behavior, corporate context,
and the concept of strategy. Academy of Management Review, 8: 61-70.
Burgelman, RA (1983b): A process model of internal corporate venturing in the diversified
major firm. Administrative Science Quarterly, 28: 223-244.
Burgelman, RA (1984): Designs for corporate entrepreneurship in established firms.
California Management Review
Burgelman, RA (1991): Intraorganizational Ecology of Strategy Making and Organizational
Adaption: Theory and Field Research. Organizational Science, (2): 239-262
Burns, T – GM Stalker (1961): The Management of Innovation. Tavistock, London
Byers, T – H Kist - RI Sutton (1997): Characteristics of the Entrepreneur: Social creatures,
not solos heroes. In Dorf, RC (ed): The Handbook of Technology Management, CRC
Press: Boca Raton, FL
Bygrave DW – A Zacharakis (2004): The Portable MBA in Entrepreneurship. John Wiley &
Sons, Inc., Hoboken, NJ
Campell-Hunt, C (2000): What We have Learned Abaout Generic Competitive Strategy. A
Meta-analysis. Strategic Management Journal, 21: 127-154
Carland, JW – F Hoy - JAC Carland (1984): Differentiation entrepreneurs from small
business owners: a conceptualization. Academy of Management Review, 9(2): 345-359
Carland, JW – F Hoy - JAC Carland (1988): Who is an entrepreneur is a question worth
asking. American Journal of Small Business, 12(4): 33-39
Carlsson, B (1992): The rise of small business: Causes and consequences. In Adams, William
James (ed): Singular Europe: Economy and polity of the European community after 1992,
University of Michigan Press, Ann Arbor, MI
Chakravarthy, BS – Y Doz (1992): Strategy Process Research: Focusing on Corporate Self-
Renewal. Strategic Management Journal, 13(1): 5-14
Chandler, AD (1962): Strategy and Structure: Chapters in the history of the American
industrial enterprize. MIT Press, Chambridge

149
Chandler, GN - SH Hanks (1998): An examination of the substitutability of founders’ human
and financial capital in emerging business ventures. Journal of Business Venturing, 13:
353–369
Chesbrough, W (2002): Open Innovation: The new imperative for creating and profiting from
technology. Harvard Business School Press: Boston, MA
Chesbrough, W (2006): Open business models: How to thrive in the new innovation
landscape. Harvard Business School Press: Boston, MA
Chikán A - Czakó E – Kazainé Ónodi A (eds) (2006): Zárótanulmány. ‘Versenyben a világgal
2004-2006 - Gazdasági versenyképességünk vállalati nézőpontból’ című kutatási
program. BCE Versenyképesség Kutató Központ, Budapest
Chikán A – Czakó E – Zoltayné Paprika Z (eds) (2002) Vállalati versenyképesség a
globalizálódó magyar gazdaságban. Akadémiai Kiadó, Budapest. (angol nyelvű
megjelenés: National Competitiveness in the Global Economy. The Case of Hungary.
Akadémiai Kiadó, Budapest)
Chikán A - Czakó E – Zoltayné Paprika Z (eds) (2004): Fókuszban a verseny – Gyorsjelentés
a 2004. évi kérdőíves felmérés eredményeiről. ‘Versenyben a világgal 2004-2006 -
Gazdasági versenyképességünk vállalati nézőpontból’ című kutatás. BCE
Versenyképesség Kutató Központ, Budapest
Chikán A - Czakó E – Zoltayné Paprika Z (eds) (2010): Vállalati versenyképesség
válsághelyzetben – Gyorsjelentés a 2009. évi kérdőíves felmérés eredményeiről.
‘Versenyben a világgal’ kutatási program. BCE Versenyképesség Kutató Központ,
Budapest
Chikán A - Czakó E (eds) (2005): Kutatási tervtanulmány. ‘Versenyben a világgal 2004-2006
- Gazdasági versenyképességünk vállalati nézőpontból’ című kutatás. 1.
műhelytanulmány, BCE Versenyképesség Kutató Központ, Budapest
Chikán A – Czakó E (eds) (2009) Versenyben a világgal – Vállalataink versenyképessége az
új évezred küszöbén. Akadémiai Kiadó, Budapest.
Chikán A – Czakó E. (eds) (2005): Kutatási tervtanulmány, ‘Versenyben a világgal 2004-
2006 – Gazdasági versenyképességünk vállalati nézőpontból’ című kutatás 1. sz.
műhelytanulmány, BCE, Budapest

150
Chikán A (1997): Jelentés a magyar vállalati szféra nemzetközi versenyképességéről. BKE
Versenyképesség Kutató Központ, Budapest
Chikán A (2002): Vállalatgazdaságtan. Aula Kiadó, Budapest
Child, J (1972): Organizational structure, environment and performance: the role of strategic
choice. Sociology, 6: 2-22
Christensen, CM (2003): The Innovator’s Dilemma, Harper Business Essentials: New York
Churchill, NC (1997): The Six Key Phases of Company Growth. In Birley, S – D Muzyka:
Mastering Enterprise, Pitman Publishing, London
Clemmer, J (1995): Pathways to Performance: A Guide to Transforming Yourself, Your
Team, and Your Organization. Macmillan Canada, Toronto
Cool, KO – D Schendel (1987): Strategic group formation and performance: the case of the
U.S. pharmaceutical industry. Management Science
Cooper, AC (1979): Startegic management: New ventures and small businesses. In Schendel,
DE - C Hofer (eds): Strategic Management, pp:316-327, Little, Brown: Boston
Cornelius, B – H Landström – O Persson (2006): Entrepreneurial studies: the dynamic
research front of a developing social science. Entrepreneurship Theory and Practice,
30(3): 375-398
Covin, JG - DP Slevin (1989): Strategic management of small firms in hostile and benign
environments. Strategic Management Journal, 10, pp: 75-87.
Covin, JG - DP Slevin (1991): A conceptual model of entrepreneurship as firm behavior.
Entrepreneurship Theory and Practice, 16(1): 7-25.
Czakó E – Wimmer Á – Zoltayné Paprika Z (eds)(1999): Arccal a piac felé - Gyorsjelentés az
1999. évi kérdőíves felmérés eredményeiről. ‘Versenyben a világgal’ kutatási program,
BCE Versenyképesség Kutató Központ, Budapest
Czakó E – Wimmer Á – Zoltayné Paprika Z (eds)(2000): Jelentés a magyar vállalati szféra
versenyképességéről az 1999. évi kérdőíves felmérés eredményei alapján. ‘Versenyben a
világgal’ kutatási program, BCE Versenyképesség Kutató Központ, Budapest
Csath, M (2001): Stratégiai változtatás menedzsment, Aula, Budapest
Daily, CM – DR Dalton (1992). The relationship between governance structure and corporate
performance in entrepreneurial firms. Journal of Business Venturing, 7: 375-386
151
Daily, CM – DR Dalton (1993). Board of directors leadership and structure: Control and
performance implications. Entrepreneurship Theory and Practice, 17(3): 65-81
Damodoran, A (2007): Strategic Risk Taking: A Framework for Risk Management. Wharton
School Publishing, Pennsylvania
Darwin, CR (1872). On the Origin of Species. London: John Murray. 6th edition. (Magyar
nyelvű fordítása: A fajok eredete, fordította Kampis György (1998). Letöltve: 2010. augusztus
10. http://mek.niif.hu/05000/05011/html/darwin0002.html)
Davidsson, P – F Delmar – J Wiklund (2006): Entrepreneurship and the growth of firms.
Edward Elgar, Cheltenham
Davidsson, P – F Delmar – J Wiklund. (2002), Entrepreneurship as growth, growth as
entrepreneurship, in Hitt, MA – DR Ireland – MS Camp – DL Sexton (eds): Starategic
Entrepreneurship. Creating new mindset, Blackwell Publishing, Malden, MA, pp.: 328-42.
Davidsson, P (2004): Researching entrepreneurship. Springer: Boston.
Deans, GK – F Kroeger (2004) Stretch! How Great Companies Grow In Good Times And
Bad. Wiley&Sons, New York
Desarbo, WS – A Di Benedetto – M Song – I Sinha (2005): Revisting the Miles and Snow
framework: uncovering interrelationships between strategic types, capabilities, environmental
uncertainty, and firm performance. Strategic Management Journal, pp. 47-74.
Dess, G – PS Davis (1984): Porter's (1980) Generic strategies as determinants of strategic
group membership and organizational performance. Academy of Management Journal,
pp: 467-488.
Dess, GD, GT Lumpkin, - JE McGee (1999): Linking CE to strategy, structure, and process:
Suggested research directions. Entrepreneurship Theory and Practice, 23(3): 85-102.
Dickhout, R – M Denham – N Blackwell (1995): Designing Change Programs: Thant Won’t
cost You Your Job. The McKinsey Quartely, 4: 101-116
Dobák M – Antal Zs (2009): Vezetés és szervezés 1-2. Aula Kiadó, Budapest
Dobák M (1997): Szervezeti formák és vezetés, Közgazdasági és Jogi Könyvkiadó, Budapest
Dobák, M (1999): Folyamatok fejlesztése és változásvezetés. Harvard Business Manager,
1(3): 2-20.

152
Donaldson, L (1996): For Cartesianism: Against Organizational Types, and Quantum Jumps In:
For Positivist Organozation Theory: Providing the Hard Core. Sage, London, pp: 108-129
Doty, DH – WH Glick (1994): Typologies as a unique form of theory building: Toward
improved understanding and modeling, Academy of Management Journal, pp. 230-251.
Doz, YL – H Thanhaiser (1996): Embedding Transformation Capabilitiy. INSEAD,
Fontainebleau
Duma L – Erdős Sz (2008): A jövő intellingens technológiai és menedzsmentkérdései- avagy
semmilyen szél nem jó annak, aki nem tudja milyen kikötőbe tart. Vezetéstudomány,
39(12): 60-68
Elfring, T – Volberda (1997): Schools of Thought in Strategic Management Fregmantation,
Integration or Synthesis? Strategic Management Journal, 18
Elfring, T - W Hulsink (2003): Networks in Entrepreneurship: The case of high-technology
firms. Small Business Economics, 21: 409-422
Elfring, T - W Hulsink (2007): Networking by Entrepreneurs: Patterns of Tie Formation in
Emerging Organizations. Organization Studies, 28(10)
Ensley, M – JW Carland - JC Carland (1998): The Effect of Entrepreneurial Team Skill
Heterogeneity and Functional Diversity on New Venture Performance. Journal of
Business and Entrepreneurship, 10: 1–11.
Evald, MR – K Klyver - SG Svendsen (2006): The changing importance of the strength of ties
throughout the entrepreneurial process. Journal of Enterprising Culture, 14(1): 1-26
Evans, DS (1987): Test of alternative theories of firm growth. Journal of Political Economy,
9(4): 657-674
Filatochev I – M Wright (eds) (2005). The Life Cycle of Corporate Governance. Edward
Elgar, Northantom, MA
Flamholtz, EG – Y Randle (2000): Growing Pains: Transitioning from an Entrepreneurship
to a Professionally Managed Firm. Jossey-Bass, San Francisco
Floyd, SW - B Wooldridge (1999): Knowledge creation and social networks in corporate
entrepreneurship: The renewal of organizational capability. Entrepreneurship Theory and
Practice, 23(3): 123-143
Foss, K – NJ Foss - PG Klein (2006): Original and Derived Judgment: An entrepreneurial
theory of economic organization, CEMS reading list

153
Foster, RN (1986): The Attacker’s Advantage. Summit Books, New York
Freeser H – G Willard (1990): Founding strategy and performance: A comparison of high and
low growth high-tech firms. Strategic Management Journal, 11: 367-386
Füstös et al. (2004): Alakfelismerés, Új Mandátum Könyvkiadó, Budapest
Galbraith, CS – D Schendel (1983): An empirical analysis of strategy types. Strategic
Management Journal, pp. 153-173.
Galbraith, JK (1982): Strategy and organizational planning. Human resource management, 22:
63-77
Galbraith, JR – DA Nathanson (1979): The Role of Organizational Structure and Process in
Strategy Implementation, In: Schendel, D.A. and Hofer, C.W.: Strategic Management.
Little, Brown and Co., Boston
Gartner, WB (1990): What are we talking about when we talk about entrepreneurship?
Journal of Business Venturing, 5(1): 15–23
Garud, R. – Van De Ven, A. (1992): An Empirical Evaluation of the Internal Corporate
Venturing Process, Strategic Management Journal, 13(1): 93-109.
Gedajlovic, E - MH Lubatkin – WS Schulze.(2004) Crossing the Threshold from Founder
Management to Professional Management: A Governance Perspective. Journal of
Management Studies, 41(5): 899- 912
Gelei A (2002): A szervezeti tanulás interpretatív megközelítése: a szervezetfejlesztés esete.
Doktori (PhD) értekezés, Budapesti Corvinus Egyetem, Gazdálkodástani Doktori Iskola
Glueck, WF (1980): Business policy and strategic management. McGraw-Hill: New York.
Gort, M – S Klepper (1982): Time paths in the diffusion of product innovations. Economic
Journal, pp: 630-653
Göblös, Á – Gömöri K (2004): A vállalati életciklus-modellről. Vezetéstudomány, 35(10): 41-50
Granovetter, M (1973): The strength of weak ties. American Journal of Sociology, 78: 1360-1379
Greiner, LE (1972): Evolution and revolution as organizations grow, Harvard Business
Review, 50: 37-46
Greiner, LE (1998): Evolution and revolution as organizations grow, Harvard Business
Review, 76(3)

154
Hajdu O. (2003): Többváltozós statisztikai számítások. KSH, Budapest
Hambrick, DC - PA Mason (1984): Upper echelons: The organization as a reflection of its top
managers. Academy of Management Review, 9: 193-206
Hambrick, DC (1981): Strategic awarness within top management teams. Strategic
Management Journal, 2: 263-279
Hambrick, DC (1983): Some tests of the effectiveness and functional attributes of Miles and
Snow’s strategic types. Academy of Management Journal, pp. 5-25.
Hambrick, DC (1984): Taxonomic approaches to studying strategy: some conceptual and
methodological issues. Journal of Management, pp. 27-41.
Harper, SC (1995): The McGraw-Hill guide to managing growth in your emerging business.
McGraw-Hill: New York.
Hatch, NW - JH Dyer (2004): Human capital and learning as a source of sustainable
competitive advantage. Strategic Management. Journal, 25: 1155–1178
Hatten, KJ – D Schendel (1977): Heterogeneity within an industry: firm conduct in the U.S.
brewing industry 1952-71. The Journal of Industrial Economics, pp. 97-113.
Héjj T – Matuz J – Héjj R (2008): Tanuljunk könnyen, gyorsan ‘klaszterül’!, Harvard
Business Review, (5): 48-58
Hisrich, RD - MP Peters (1991): Vállalkozás. Akadémiai Kiadó, Budapest
Hite, J (2005): Evolutionary processes and paths of relationally embedded network ties in
emerging entrepreneurial firms. Entrepreneurship Theory and Practice, 29: 113-144.
Hitt MA – RD Ireland – M Camp (2001): Strategic Entrepreneurhip: Entrepreneurial
Strategies for Wealth Creation. Strategic Management Journal, 22: 479-491
Hitt, MA – DR Ireland – MS Camp – DL Sexton (eds) (2002): Starategic Entrepreneurship.
Creating new mindset, Blackwell Publishing, Malden, MA
Hoffer I- Iványi ASz (2008): Gondolatok az innováció működési mechanizmusáról.
Vezetéstudomány, 39(4)
Hopewell, B (2002): Rethink Strategy. Book Reviews and Review Brief. Long Range
Planning, 35: 325-328

155
Hortoványi L – Dobák M – Szabó ZsR (2009): Entrepreneurial Management Practices: An
Empirical Investigation of Alertness to Opportunity. 2009 Babson College
Entrepreneurship Research Conference. 5th June, Babson Park, Massachusetts, USA.
Hortoványi L – Dobák M – Szabó ZsR (2010): Test of entrepreneurial orientation construct in
emerging market. 7th AGSE International Entrepreneuship Research Exchange, 4th
February, Coluun
Hortoványi L – Laczkó M – Szabó ZsR (2006): Stratégiatípusok napjainkban. ‘Versenyben a
világgal 2004-2006 - Gazdasági versenyképességünk vállalati nézőpontból’ című kutatás.
25. műhelytanulmány, BCE Versenyképesség Kutató Központ, Budapest
Hortoványi L – Szabó ZsR (2006a): Pillanatfelvétel a magyarországi közép- és nagyvállalatok
vállalkozási hajlandóságáról. ‘Versenyben a világgal 2004-2006 - Gazdasági
versenyképességünk vállalati nézőpontból’ című kutatás. 27. műhelytanulmány. BCE
Versenyképesség Kutató Központ, Budapest
Hortoványi L – Szabó ZsR (2006b): Vállalati stratégiák az EU-csatlakozás idején
Magyarországon. Vezetéstudomány (10): 11-23.
Hortoványi L – Szabó ZsR (2006c): Versenyképesebb-e a vállalkozó vállalat? A magyar
gazdaság versenyképessége konferencia. Február, Budapest.
http://www.kgt.bme.hu/doktori/res/bme_gszdi_phd_konf_2006.pdf
Hortoványi L – Szabó ZsR (2006d): Future Path Dependent or Undetermined? Reflection on
Corporate Growth Potential. BABSON College Entrepreneurship Research Conference.
2006 június, Bloomington.
Hortoványi L – Szabó ZsR (2006e): Knowledge and Organization: A Network Perspective.
Society and Economy, 28(2): 165-179.
Hortoványi L – Szabó ZsR (2007): Advancing Strategic Entrepreneurship Research:
Methodological Considerations and Empirical Test. New Frontiers in Entrepreneurship:
Strategy, Governance, and Evolution. 2007 május, Catania, Olaszország.
Hortoványi L – Szabó ZsR (2008a): The impact of management practices on industry level
competitiveness in transition economies. In: Milé Terziovski (ed): Energizing
Management through Innovation and Enrepreneurship. Routledge, London and New
York, pp: 55-71

156
Hortoványi L – Szabó ZsR (2008b): Knowledge brokering in Emerging High-Technology
Clusters. 24th EGOS Colloquium. July, Amsterdam
Hortoványi L (2008): Vállalkozó vezetés. Tézis tervezet, BCE Gazdálkodástani Doktori
Iskola, Budapest
Hortoványi L (ed) (2009): The entrepreneurial growth of the firm. 23rd RENT Conference:
18-20 November, Budapest, proceedings. Aula Kiadó, Budapest.
Hortoványi, L (2007): Revising Barringer and Bluedorn Strategy Framework. In: XXVIII.
Országos Tudományos Diákköri Konferencia, Doktorandusz Konferencia, Kiemelt
minősítést elnyert dolgozatok, Miskolci Egyetem, Miskolc
Hurst, DK (1995): Crisis & Renewal: Meeting the Challange of Organizational Change.
Harvard Business School Press, oston
ISS (2009): Intuitive Software Solutions’ Business Growth Model. http://www.intuitive-
software-solutions.co.uk/index.php
Jackson, SE – JF Brett – VI Sessa – DM Cooper – JA Julin – K Peyronnin (1991): Some
differences make a difference: Individual dissimilarity and group heterogeneity as
correlates of recruitment, promotion and turnover. Journal of Applied Psychology, 79(5):
675–689.
Johnson, S - A Van de Ven (2002): A framework for entrepreneurial strategy. In Hitt, MA -
RD Ireland – SM Camp - DL Sexton (eds): Strategic entrepreneurship: Creating a new
mindset. Blackwell: Oxford.
Kampis Gy (1998): Bevezető tanulmány a fajok eredetéhez. Letöltve: 2010. augusztus 10.
http://mek.niif.hu/05000/05011/html/darwin0001.html
Kaplan RS – DP Norton (2004). Strategy Maps. Harvard Business School Publishing, Boston
Kaplan RS – DP Norton (2005) Stratégiai térképek. Panem, Budapest
Kaplan RS – DP Norton (2006). Alignment. Harvard Business School Publishing, Boston
Kay, J (1993): Foundations of corporate success: How corporate strategies add value.
Oxford University Press, Oxford.
Khandawalla, PN (1970): The effect of the Environment on the Organizational Structure of
Firm. PhD thesis, Carnegie-Mellon University
Kieser, A (1995): Szervezetelméletek. Aula Kiadó, Budapest

157
Kim, WC – Mauborgne, R (2006): Kék óceán stratégia: A verseny nélküli piaci tér. Park
Kiadó, Budapest
Kimberley, JR (1979): Issues in the creation of organizations: Initiation, innovation, and
institutionalization. Academy of Management Journal, 22: 437-457
Klepper, S – E Graddy (1990): The evolution of new industries and the determinants of
market structure. Rand Journal of Economics, 21(1): 27-44
Knight, FH (1921): Risk, uncertainty and profit. Houghton Mifflin Company: Boston, MA.
http://www.econlib.org/LIBRARY/Knight/knRUP.html
Knight, KE (1967): A descriptive model of the intra-firm innovation process. Journal of
Business, 40(4): 478-496
Kotter, JP (1995): Leading Change: Why Transformation Efforts Fail. Harvard Business
Review, (2): 59-67
Kotter, JP. (1999): Változások irányítása. Kossuth Kiadó, Budapest
Kovács E. (2006): Pénzügyi adatok statisztikai elemzése. BCE, Budapest
Könczöl E (2007): A középvállalati szektor szerkezeti és működési sajátosságai. ‘Versenyben
a világgal 2004-2006 - Gazdasági versenyképességünk vállalati nézőpontból’ című
kutatás. 87. műhelytanulmány, BCE Versenyképesség Kutató Központ, Budapest
Könczöl E (2008): A középvállalatok stratégiai céljainak vizsgálata. ‘Versenyben a világgal
2004-2006 - Gazdasági versenyképességünk vállalati nézőpontból’ című kutatás. 96.
műhelytanulmány, BCE Versenyképesség Kutató Központ, Budapest
Kuwada, K (1998): Strategic Learning: The Continous Side of Discontinous Strategic
Change, Organization Science 9(6)
Lawrence, PR – JW Lorsch (1967): Organization and Environment. Harvard University
Press, Boston
Lehmann, DR (1985): Market research and analysis. R.D. Irwin, Homewood, Ilinois
Lesi M (2005): A 2004-es versenyképesség kutatás vállalati mintájának alapjellemzői és
reprezentativitása. ‘Versenyben a világgal 2004-2006 – Gazdasági versenyképességünk
vállalati nézőpontból’ című kutatás 2. sz. műhelytanulmány, BCE, Budapest
Lippitt, GL – WH Schmidt (1967): Crisis in a developing organization, Harvard Business
Review, 45(6): 102-112

158
Low, MB - IC MacMillan (1988): Entrepreneurship: Past Research and Future Challenges,
Journal of Management, 14(2): 139-161
Lukács, B (2009): Krízishelyzetben. In: Hajduska M – Lukács B – Mérő L – Popper P:
Krízishelyzetben: A válság, mint esély. Jaffa Kiadó, Budapest, pp: 63-96
Lumpkin, GT - GG Dess (1996): Clarifying entrepreneurial orientation construct and linking
it to performance. Academy of Management Review, 21(1): 135-172
Lumpkin, GT (2009): The Entrepreneurial Growth of the firm. Keynote presantation at the
23rd RENT Conference, 20th November, Budapest
Lynall MD – BR Golden – AJ Hillman (2003): Board composition from adolescence to
maturity: A multitheoretic view. Academy of Management Review, 28(3): 416-431
Malhotra, NK (2008): Marketingkutatás, Akadémiai Kiadó, Budapest
March, JG (1991): Exploration and Exploitation in Organizational Learning, Organization
Science, 2(1): 71–87
Marris, R (1964): The Economic Theory of ’Managerial’ Capitalism. MacMillan, London
Maxwell, JA (1996): Qualitative Research Design: An interactive approach. Sage: Thousand
Oaks, CA
McDaniel, SW – JW Kolari (1987): Marketing strategy implications of the Miles and Snow
strategic typology. Journal of Marketing, pp: 21-35.
McGahan, AM – N Argyres – JAC Baum (2004): Context, Technology and Strategy: Forging
new perspectives on the industry life-cycle. Advances in Strategic Management 21
McKee, DL – PR Varadarajan – WM Pride (1989): Strategic adaptability and firm
performance: a market-contingent perspective. Journal of Marketing, pp: 21-35.
Mészáros, T (1984): A sikeres vállalati tervezés szervezési feltételei. Közgazdasági és Jogi
Könyvkiadó: Budapest
Miles, MB – Huberman, MA (1994): Qualitative data analysis. Sage, London
Miles, R - C Snow (1978): Organizational strategy, structure, and process. McGraw-Hill:
New York
Miller, D - PH Friesen (1977): Strategy-Making in Context: Ten Empitical Archetypes.
Journal of Management Studies, 14: 253-279

159
Miller, D - PH Friesen (1982): Innovation in conservative and entrepreneurial firms. Strategic
Management Journal, 3: 1-25.
Miller, D - PH Friesen (1983): Strategy making and environment: The third link. Strategic
Management Journal, 4: 221-235.
Miller, D (1976): Strategymaking in Context: Ten Empirical Archetypes. PhD thesis, McGill
University, Toronto
Miller, D (1979): Strategy, Structure, and Environment: Context Influences upon same
Bivariate Associations. Journal of Management Studies 16: 294-316
Miller, D. – PH Friesen (1986): Porter's (1980) Generic strategies and performance: an
empirical examination with American data. Part 1: Testing Porter. Organization Studies,
pp. 37-55.
Miller, GH (1985): Educational Focuses on Organisational Life Cycle. Journal of European
Industrial Training, 9(6): 23-26
Miller, JG – AV Roth (1994): A taxonomy of manufacturing strategies. Management Science,
pp. 285-304.
Mintzberg, H – B Ahlstrand – J Lampel (1998): Strategy Safari, Prentice Hall, London
Mintzberg, H – B Ahlstrand – J Lampel (2005): Stratégiai szafari. HVG, Budapest
Mintzberg, H – F Westley (1992): Cycles of Organizatonal Change. Strategic Management
Journal, 13(1): 39-59
Mintzberg, H – JB Quinn (1991): The Strategy Process. Prentice Hall, New Jersey
Mintzberg, H (1978): Patterns in Strategy Formation. Management Science, 24(9): 934-948
Mintzberg, H (1989): Mintzberg on Management: Inside Our Strange World of
Organizations. Free Press, New York
Mintzberg, H (1994): The rise and fall of strategic planning: Reconceiving roles for planning,
plans, planners. Free Press, New York and Toronto
MKT (2009): A magyar gazdaság lehetséges és sikeres reagálásának útja a mai globális
világ kihívására. MKT, Budapest
MNB (2010): Fogyasztói árindex változása. MNB, Budapest. Letöltés ideje: 2010.08.30.
http://www.mnb.hu/Statisztika/statisztikai-adatok-informaciok/adatok-idosorok
Moore, GA (2005): Inside the Tornado. HarperCollins Publisher, New York

160
Morrison, AJ – K Roth (1995): A taxonomy of business-level strategies in global industries,
Strategic Management Journal, pp. 399-417.
Morrison, EW (1993): Newcomer information seeking exploring types, modes, sources, and
outcomes. Academy of Management Journal, pp. 557-589.
Murray, AI (1990): Top Management Group Heterogeneity and Firm Performance. Strategic
Management Journal, 10(summer special issue): 125-141
Nagy, A (1996): A vállalkozások stabilizációs előfeltételei. Ipargazdasági Szemle, 27, pp: 15-21
Norušis, MJ (2003): SPSS 12.0 Statistical Procedures Companion, Prentice Hall, p. 382.
Nyström, H (1979): Creativity and Innovation, John Wiley and Sons, West Sussex
Nyström, H (1983): Kreativitás és innováció. Közgazdasági és Jogi Könyvkiadó, Budapest
Nyström, H (1990): Technological and market innovation: Strategies for product and
company development. John Wiley and Sons, Chichester, England
O'Reilly, CA - ML Tushman (2004): The Ambidextrous Organization. Harvard Business
Review 82(4): 74-81
Papp, I (2005): The Value Of Intellectual Capital In Hungarian SMEs. Strategic Management
Society - 25h Annual International Conference. Orlando, USA
Papp, I (2006): Tanulás és stratégiaalkotás kis- és középvállalatoknál. PhD disszertáció,
BMGE, Budapest.
Penrose ET (1959): The Theory of the Growth of the Firm. Basil Blackwell: Oxford
Peters, T. J. (1984): Strategy Follows Structure: Developing distinctive skills. California
Management Review, 3
Peters, TJ – RH Waterman (1982): In Search of Excellence. Lessons from America’s Best-Run
Companies. Harper and Row, New York
Pettigrew, AM (1985): The awekening Giant: Continuity and Change in Imperial Chemical
Industies. Basil Blackwell, Oxford
Pettigrew, AM (1987): Context, and Action in Transformation of the Firm. Journal of
Management Studies, 24: 649.670
Porter, ME (1993): Versenystratégia, ipari ágak és versenytársak elemzési módszerei.
Akadémiai Kiadó, Budapest
161
Priem, RL (1990): Top management team group factors, consensus, and firm performance.
Strategic Management Journal, 11: 469–478.
Quinn, RE – J Rohrbaugh (1983): A Spatial Model of EffectivenessCriteria: Towards a
Competing Values Approach to Organizational Analysis. Management Science 29(3):
363-377
Quinn, RE – K Cameron (1983): Organizational life cycles and shifting criteria of
effectiveness: some prelimenary evidence. Management Science, 29(1): 33-51
Raisch, S – J Birkinshaw – G Probst – M Tushman.(2009): Organizational Ambidexterity:
Balancing Exploitation and Exploration for Sustained Performance. Organization Science
20(4): 685-695
Rumelt, RP (1974): Strategy, Structure, and Economiv Performance. Harvard Business
School Press, Boston
Ryan, GW – Bernard, HR (2003): Technigues to Identify Thames. Field Methods 15(1): 85-109.
Salamonné Huszty, A (2002): Magyarországi kis- és középvállalkozások életútjának
modellezése. Competitio, március: 2-18
Sandberg, WR (1992): Strategic management’s potential contribution to a Theory of
Entrepreneurship. Entrepreneurship Theory and Practice, 16(1): 73-90
Sathe, V (2003): Corporate Entrepreneurship: Top Managers and New Business Creation.
Cambridge University Press, Cambridge, UK
SBS (2009): Strategic Bussiness Sales Growth Model. Staffordshire, United Kingdom
http://strategicbusinesssales.co.uk/business-growth-model
Schendel DE – MA Hitt (2007): Introduction to volume 1. Strategic Entrepreneurship
Journal 1 (1): 1-6
Scherer, A. G. (2002): Szervezetkritika vagy szervezett kritika? – Tudományelméleti
megjegyzések kritikus alkalmazásához. Fordítási kézirat, BKÁE Vezetés és szervezés
tanszék, Budapest
Schumpeter, JA (1912): Theorie der Wirtschaftlichen Entwicklung. Dunker and Humblot,
Berlin
Schumpeter, JA (1934): Theory of economic development: An inquiry into profits, capital,
credit, interest, and the business cycle. Harvard University Press, Boston

162
Schumpeter, JA (1980): A gazdasági fejlődés elmélete, KJK Kiadó, Budapest
Sexton, DL – RW Smilor (eds.)(1997): Entrepreneurship 2000. Upstart Publishing, Chicago.
Shortell, SM – EJ Zajac (1990): Perceptual and archival measures of Miles and Snow’s
strategic types: a comprehensive assessment of reliability and validity. Academy of
Management Journal, pp. 817-832.
Singh, J - CJ Lumsden (1990): Theory and Research in Organizational Ecology. Annual
Review of Sociology, 16: 161-195
Stevenson, HH - JC Jarillo (1990): A paradigm of entrepreneurship: Entrepreneurial
management. Strategic Management Journal, 11: 17-27
Stevenson, HH (1983): A perspective on entrepreneurship. Harvard Business School Working
Paper, 9-384-131.
Stopford, JM - CWF Baden-Fuller (1994): Creating corporate entrepreneurship. Strategic
Management Journal, 15: 521-536.
Strauss, A., & Corbin, J. (1990). Basics of qualitative research: Grounded theory procedures
and techniques. Sage Publications, Inc: Newbury Park, CA
Szabó J (2008): A magyar vállalatok fejlődési fázisai. Vezetéstudomány, 39(10): 2-10
Szabó ZsR – Dobák M (2009): Strategic Entrepreneurship and the Growth of Firms:
determinants of how firms expand. 23rd RENT Conference. 19 November, Budapest.
Szabó ZsR – Hortoványi L – Dobák M (2009): Growth as Entrepreneurship: An Empirical
Study of Entrepreneurial Orientation. The 13th World Multi-Conference on Systems,
Cybernetics and Informatics: Management Science, Engineering and Informatics (MEI).
12th July, Orlando, Florida, USA.
Szabó ZsR – Hortoványi L (2005): Hogyan döntsünk stratégiai kérdésekben? - A színek
tükrében. Kórház, december, pp: 6-7.
http://www.weborvos.hu/adat/korhaz/2005dec/korhazdec_6-7.pdf
Szabó ZsR – Vida G (2009): Szolgáltató központok Magyarországon. Vezetéstudomány 40(4):
28-42
Szabó ZsR – Zetkó K (2005): Az EU-USA gazdasági kapcsolatrendszere – Növekvő forgalom,
élesedő viták a bilaterális kereskedelemben. XXVII. OTDK. 2005. április, Sopron.
163
Szabó ZsR (2005a): A stratégiaalkotás folyamata, ‘Versenyben a világgal 2004-2006 –
Gazdasági versenyképességünk vállalati nézőpontból’ című kutatás, 13.
műhelytanulmány, BCE Versenyképesség Kutató Központ, Budapest
Szabó ZsR (2005b): A gazdasági versenyképesség innovatív fejlesztése – Ipari parkok az
innovációs stratégiában. XXVII. OTDK. 2005. április, Sopron.
Szabó ZsR (2006): Versenyképes stratégiaalkotás és tervezési módszerek. A magyar gazdaság
versenyképessége konferencia. Február, Budapest.
http://www.kgt.bme.hu/doktori/res/bme_gszdi_phd_konf_2006.pdf
Szabó ZsR (2008): Adaptációs stratégiák a kialakuló bioetanol-iparágban. Vezetéstudomány
39(11): 54-63
Szirmai, P (2002a): A kisvállalkozások fejlődési szakaszai és a kormányzati beavatkozás
lehetséges területei. Műhelytanulmány. BKÁE Kisvállalkozás-fejlesztési Központ,
Budapest
Szirmai, P (2002b): Fejlődési szakaszok és szakaszváltások Magyarországon a kis- és
középvállalkozások körében. Zárótanulmány. BKÁE Kisvállalkozás-fejlesztési Központ,
Budapest
Tichy, NM – S Sherman (1993): Control Your Destiny or Someone Else Will: How Jack
Welsch Is Making General Electric the World’s Most Competitive Corporation.
Doubleday, New York
Timmons, J (1994): New Venture Creation. (4th edition) Irwin, Burr Ridge, IL
Tushman, ML - CA O’Reilly (1996): Ambidextrous organizations: Managing evolutionary
and revolutionary change. California Management Review, 38(4): 12-18.
Tushman, ML - CA O'Reilly (2002): Winning through Innovation: A Practical Guide to
Leading Organizational Change and Renewal. Harvard Business School Press, Boston
Ucbasaran, D, P Westhead - M Wright (2001): The Focus of Entrepreneurial Research:
Contextual and Process Issues. Entrepreneurship: Theory and Practice, 25(1): 57-80.
Utterback, JM (1994): Mastering the Dynamics of Innovation. Harvard Business School
Press, Boston
Vecsenyi J (2003): Vállalkozás – Az ötlettől az újrakezdésig. Aula, Budapest
Vesper, K. H. (1983). Entrepreneurship and national policy. Walter E. Heller, Chicago

164
Vesper, KH (1980): New venture strategies. Prentice Hall: Englewood Cliffs, NJ
Vohora, A - M Wright – A Lockett (2004): Critical junctures in the growth in university high-
tech spinout companies. Research Policy, 33: 147-175
Volberda, HW – T Elfring (2001): Rethink Strategy. Sage, London
Webster, FE (1992): The changing role of marketing in the corporation. Journal of Marketing,
pp. 1-17.
Wickham, PA (2006): Strategic Entrepreneurship. Prentice Hall: Harlow, England
Wimmer Á – Csesznák A (2005): Vállalati jellemzők és összefüggéseik az EU csatlakozás
idején. ‘Versenyben a világgal 2004-2006 - Gazdasági versenyképességünk vállalati
nézőpontból’ című kutatás. 3. műhelytanulmány, BCE Versenyképesség Kutató Központ,
Budapest
Winter, SG – G Szulanszki (2001): Replication as Strategy. Organization Science, 12(6): 730-743
Wright, P – A Nazemzadeh – J Parnell – A Lado (1991): Comparing Three Different Theories
of Competitive Strategies. Industrial Management 33(6): 12-16
Zahn E (2000): Erfolgsstrategien für den Wandel. Schäffer- Poschel- Verlag, Stuttgart
Zahra, SA – JG Covin (1995): Contextual influences on the corporate entrepreneurship-
performance relationship: A longitudinal analysis. Journal of Business Venturing, 10: 43-58
Zahra, SA (1993): A conceptual model of entrepreneurship as firm behavior: A critique and
extension. Entrepreneurship Theory and Practice, 17(4): 259-285
Zenger, TR - BS Lawrence (1989): Organizational demography: The differential effects of
age and tenure distributions on technical communication. Academy of Management
Journal, 32: 353–376.
Zoltayné Paprika Z - Kiss R (1988): A változás menedzselése mint fogalmi keret.
Vezetéstudomány 19(12): 14-18.

165
6 APPENDECIES
6 Appendecies _________________________________________________________ 165
6.1 Changes in the Consumer Price Index _____________________________________ 166
6.2 Perception of environmental uncertainty __________________________________ 167
6.3 The strategies followed _________________________________________________ 168
6.4 Corporate performance _________________________________________________ 169
6.4.1 Descriptive statistics _________________________________________________________ 169
6.4.2 Test of normality before replacing missing values __________________________________ 170
6.4.3 Test of normality after replacing missing values____________________________________ 171
6.4.4 Histogram of missing values of corporate performance variables without the logistics variable 172
6.4.5 MDS running parameters _____________________________________________________ 173
6.4.6 Stress and fit measures between 1 and 7 dimensions ________________________________ 173
6.4.7 Correlation between corporate performance variables and dimensions __________________ 176
6.4.8 Stress and fit measures in 7 dimension in 1996, 1999, 2004, and 2009 __________________ 181
6.4.9 Correlated variables with performance dimensions, 2009 ____________________________ 182
6.4.10 Correlated variables with performance dimensions, 2004 __________________________ 183
6.4.11 Correlated variables with performance dimensions, 1999 __________________________ 184
6.4.12 Correlated variables with performance dimensions, 1996 __________________________ 185
6.4.13 Correlation between the dimensions based on the total sample and the subsample of 1996 186
6.4.14 Correlation between the dimensions based on the total sample and the subsample of 1999 186
6.4.15 Correlation between the dimensions based on the total sample and the subsample of 2004 187
6.4.16 Correlation between the dimensions based on the total sample and the subsample of 2009 187
6.4.17 Quintiles and other descriptors of the dimensions of corporate performance ___________ 188
6.5 Correlation between the perception of environmental uncertainty and
firm performance ______________________________________________________ 189
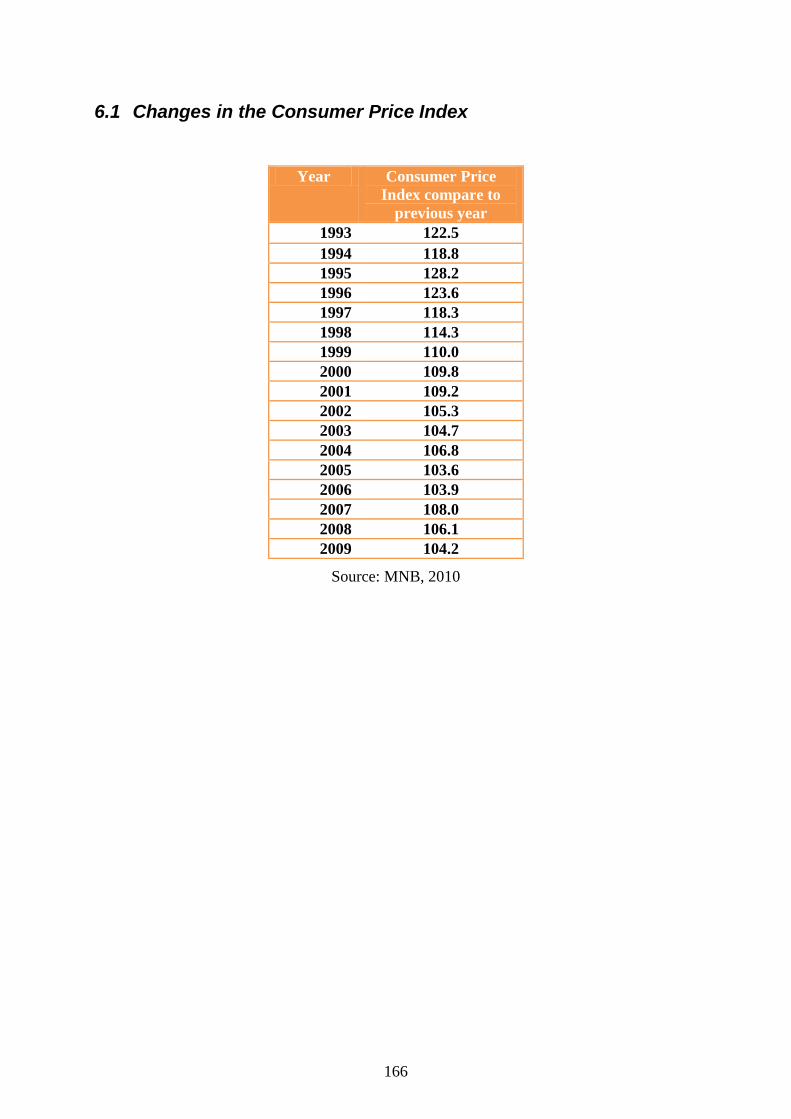
166
6.1 Changes in the Consumer Price Index
Year Consumer Price
Index compare to
previous year
1993 122.5
1994 118.8
1995 128.2
1996 123.6
1997 118.3
1998 114.3
1999 110.0
2000 109.8
2001 109.2
2002 105.3
2003 104.7
2004 106.8
2005 103.6
2006 103.9
2007 108.0
2008 106.1
2009 104.2
Source: MNB, 2010

167
6.2 Perception of environmental uncertainty
1996
1999
2004
2009
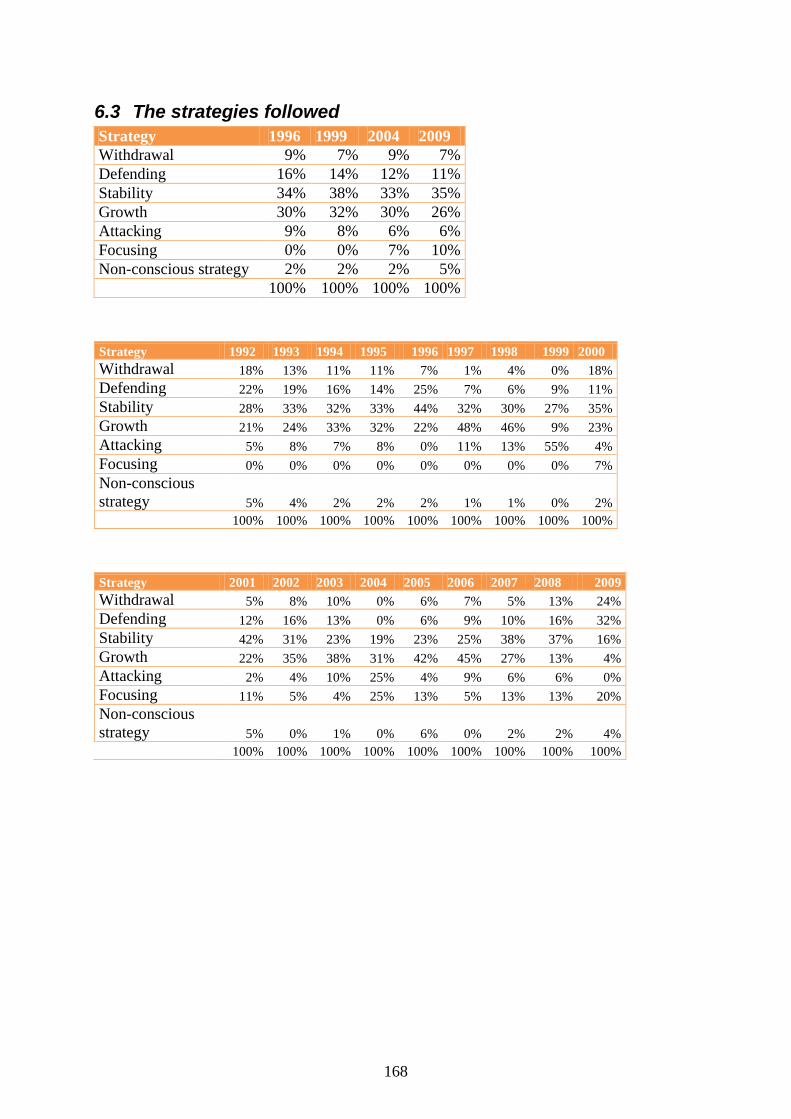
168
6.3 The strategies followed
Strategy 1996 1999 2004 2009
Withdrawal 9% 7% 9% 7%
Defending 16% 14% 12% 11%
Stability 34% 38% 33% 35%
Growth 30% 32% 30% 26%
Attacking 9% 8% 6% 6%
Focusing 0% 0% 7% 10%
Non-conscious strategy 2% 2% 2% 5%
100% 100% 100% 100%
Strategy 1992 1993 1994 1995 1996 1997 1998 1999 2000
Withdrawal 18% 13% 11% 11% 7% 1% 4% 0% 18%
Defending 22% 19% 16% 14% 25% 7% 6% 9% 11%
Stability 28% 33% 32% 33% 44% 32% 30% 27% 35%
Growth 21% 24% 33% 32% 22% 48% 46% 9% 23%
Attacking 5% 8% 7% 8% 0% 11% 13% 55% 4%
Focusing 0% 0% 0% 0% 0% 0% 0% 0% 7%
Non-conscious
strategy 5% 4% 2% 2% 2% 1% 1% 0% 2%
100% 100% 100% 100% 100% 100% 100% 100% 100%
Strategy 2001 2002 2003 2004 2005 2006 2007 2008 2009
Withdrawal 5% 8% 10% 0% 6% 7% 5% 13% 24%
Defending 12% 16% 13% 0% 6% 9% 10% 16% 32%
Stability 42% 31% 23% 19% 23% 25% 38% 37% 16%
Growth 22% 35% 38% 31% 42% 45% 27% 13% 4%
Attacking 2% 4% 10% 25% 4% 9% 6% 6% 0%
Focusing 11% 5% 4% 25% 13% 5% 13% 13% 20%
Non-conscious
strategy 5% 0% 1% 0% 6% 0% 2% 2% 4%
100% 100% 100% 100% 100% 100% 100% 100% 100%

169
6.4 Corporate performance
6.4.1 Descriptive statistics
Variable
much
worse worse same better
much
better valid modus median
Cost efficiency 39 219 528 269 68 1123 3 3
Market share 100 262 397 264 79 1102 3 3
Technology level 59 183 495 301 76 1114 3 3
Product quality 4 65 468 434 122 1093 3 4
Range of product lines 23 134 501 301 122 1081 3 3
Competitive prices 20 154 505 345 82 1106 3 3
Delivery accuracy 7 60 483 408 127 1085 3 3
Customisation readiness 7 71 409 433 185 1105 4 4
Flexibility of production system 13 114 486 321 96 1030 3 3
Efficiency of logistics system 15 131 387 209 43 785 3 3
Short delivery deadlines 11 77 558 306 99 1051 3 3
Speed of adaptation to changing consumer
needs 11 104 436 409 130 1090 3 3
Manufacturing quality 19 100 507 297 70 993 3 3
Strategic alliances with major partners 54 220 450 261 75 1060 3 3
Corporate image 35 178 424 324 124 1085 3 3
Organisation of distribution channels 28 174 584 195 46 1027 3 3
Creditability 64 178 414 286 148 1090 3 3
Level of receivables 44 185 516 260 76 1081 3 3
Solvency 39 144 461 314 134 1092 3 3
Consumer service level 16 94 561 325 77 1073 3 3
Lobby capacity 158 292 399 165 37 1051 3 3
Sales to state or publicly financed
institutions 186 250 445 87 28 996 3 3
Ability to forecast market changes 26 210 541 250 47 1074 3 3
Export activity 145 180 369 205 94 993 3 3
Ethical behaviour 11 20 417 441 200 1089 4 4
Environmental (ecological) awareness 8 67 545 330 102 1052 3 3
Introduction of proper quality raw materials 13 53 561 301 82 1010 3 3
Reliable raw material suppliers 13 83 589 255 78 1018 3 3
Capacity utilisation 27 194 428 332 84 1065 3 3
Qualification of employees 8 98 533 376 87 1102 3 3
Application of innovative sales promotion
methods 38 254 503 204 42 1041 3 3
Highly qualified, professional managers 6 75 529 392 97 1099 3 3
Up-to-date decision making/operation
systems 18 181 518 306 53 1076 3 3
Level of R+D expenditures 101 266 462 153 43 1025 3 3
Launch of new products 52 209 466 255 59 1041 3 3
Efficiency of organisational structure 19 176 538 297 44 1074 3 3
Integrated enterprise information system 45 224 470 262 70 1071 3 3
Level of management information system 37 190 451 335 61 1074 3 3
Integration of business administration
functions 15 130 623 252 30 1050 3 3
More direct relation to consumers 12 96 459 395 113 1075 3 3
Adequate stocks 10 126 574 267 59 1036 3 3
Profitability 72 251 454 256 58 1091 3 3

170
6.4.2 Test of normality before replacing missing values
Kolmogorov-Smirnova Shapiro-Wilk
Statistic df Sig. Statistic df Sig.
Cost efficiency .257 585 ,000 ,879 585 ,000
Market share .201 585 ,000 ,912 585 ,000
Technology level .250 585 ,000 ,876 585 ,000
Product quality .257 585 ,000 ,836 585 ,000
Range of product lines .264 585 ,000 ,881 585 ,000
Competitive prices .276 585 ,000 ,865 585 ,000
Delivery accuracy .266 585 ,000 ,851 585 ,000
Customisation readiness .237 585 ,000 ,874 585 ,000
Flexibility of production system .238 585 ,000 ,883 585 ,000
Efficiency of logistics system .271 585 ,000 ,870 585 ,000
Short delivery deadlines .298 585 ,000 ,841 585 ,000
Speed of adaptation to changing consumer needs .218 585 ,000 ,884 585 ,000
Manufacturing quality .283 585 ,000 ,853 585 ,000
Strategic alliances with major partners .223 585 ,000 ,903 585 ,000
Corporate image .231 585 ,000 ,900 585 ,000
Organisation of distribution channels .300 585 ,000 ,840 585 ,000
Creditability .198 585 ,000 ,910 585 ,000
Level of receivables .261 585 ,000 ,879 585 ,000
Solvency .238 585 ,000 ,889 585 ,000
Consumer service level .304 585 ,000 ,833 585 ,000
Lobby capacity .221 585 ,000 ,902 585 ,000
Sales to state or publicly financed institutions .253 585 ,000 ,879 585 ,000
Ability to forecast market changes .258 585 ,000 ,872 585 ,000
Export activity .202 585 ,000 ,910 585 ,000
Ethical behaviour .242 585 ,000 ,837 585 ,000
Environmental (ecological) awareness .300 585 ,000 ,831 585 ,000
Introduction of proper quality raw materials .327 585 ,000 ,803 585 ,000
Reliable raw material suppliers .331 585 ,000 ,814 585 ,000
Capacity utilisation .224 585 ,000 ,894 585 ,000
Qualification of employees .283 585 ,000 ,852 585 ,000
Application of innovative sales promotion methods .255 585 ,000 ,880 585 ,000
Highly qualified, professional managers .275 585 ,000 ,849 585 ,000
Up-to-date decision making/operation systems .254 585 ,000 ,875 585 ,000
Level of R+D expenditures .249 585 ,000 ,894 585 ,000
Launch of new products .233 585 ,000 ,897 585 ,000
Efficiency of organisational structure .279 585 ,000 ,862 585 ,000
Integrated enterprise information system .250 585 ,000 ,892 585 ,000
Level of management information system .233 585 ,000 ,886 585 ,000
Integration of business administration functions .322 585 ,000 ,813 585 ,000
More direct relation to consumers .237 585 ,000 ,867 585 ,000
Adequate stocks .311 585 ,000 ,838 585 ,000
Profitability .226 585 ,000 ,900 585 ,000
a. Lilliefors Significance Correction
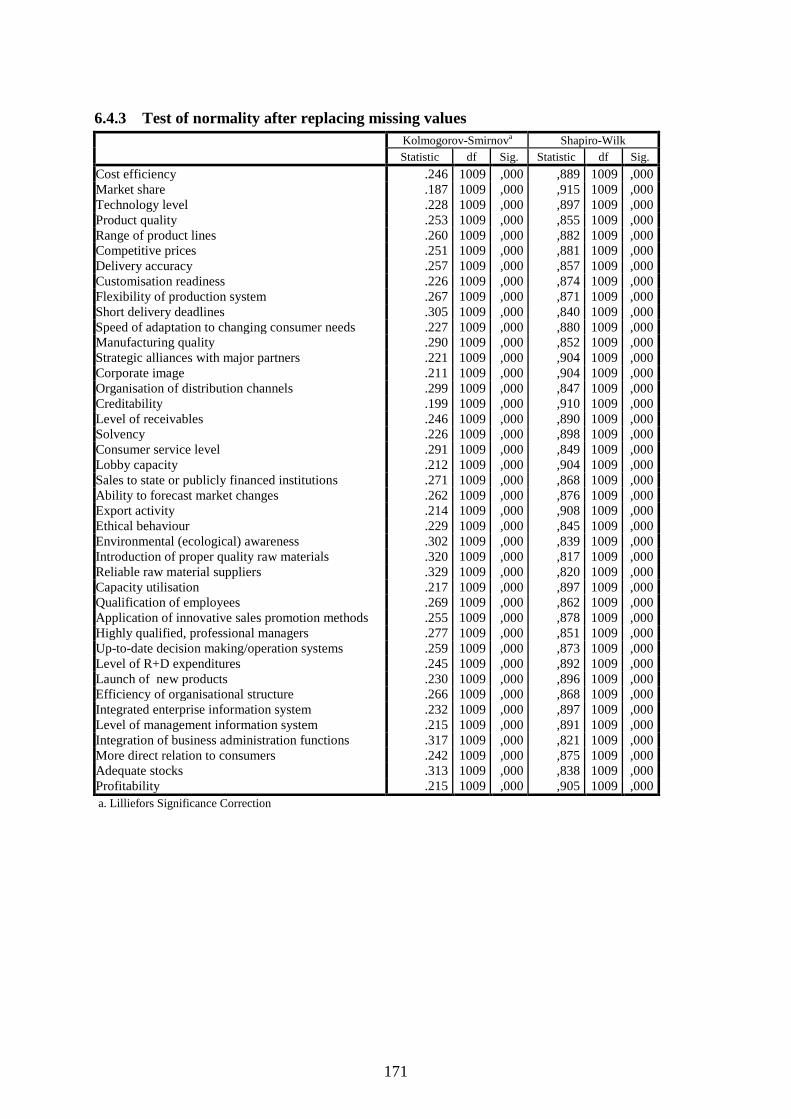
171
6.4.3 Test of normality after replacing missing values
Kolmogorov-Smirnova Shapiro-Wilk
Statistic df Sig. Statistic df Sig.
Cost efficiency .246 1009 ,000 ,889 1009 ,000
Market share .187 1009 ,000 ,915 1009 ,000
Technology level .228 1009 ,000 ,897 1009 ,000
Product quality .253 1009 ,000 ,855 1009 ,000
Range of product lines .260 1009 ,000 ,882 1009 ,000
Competitive prices .251 1009 ,000 ,881 1009 ,000
Delivery accuracy .257 1009 ,000 ,857 1009 ,000
Customisation readiness .226 1009 ,000 ,874 1009 ,000
Flexibility of production system .267 1009 ,000 ,871 1009 ,000
Short delivery deadlines .305 1009 ,000 ,840 1009 ,000
Speed of adaptation to changing consumer needs .227 1009 ,000 ,880 1009 ,000
Manufacturing quality .290 1009 ,000 ,852 1009 ,000
Strategic alliances with major partners .221 1009 ,000 ,904 1009 ,000
Corporate image .211 1009 ,000 ,904 1009 ,000
Organisation of distribution channels .299 1009 ,000 ,847 1009 ,000
Creditability .199 1009 ,000 ,910 1009 ,000
Level of receivables .246 1009 ,000 ,890 1009 ,000
Solvency .226 1009 ,000 ,898 1009 ,000
Consumer service level .291 1009 ,000 ,849 1009 ,000
Lobby capacity .212 1009 ,000 ,904 1009 ,000
Sales to state or publicly financed institutions .271 1009 ,000 ,868 1009 ,000
Ability to forecast market changes .262 1009 ,000 ,876 1009 ,000
Export activity .214 1009 ,000 ,908 1009 ,000
Ethical behaviour .229 1009 ,000 ,845 1009 ,000
Environmental (ecological) awareness .302 1009 ,000 ,839 1009 ,000
Introduction of proper quality raw materials .320 1009 ,000 ,817 1009 ,000
Reliable raw material suppliers .329 1009 ,000 ,820 1009 ,000
Capacity utilisation .217 1009 ,000 ,897 1009 ,000
Qualification of employees .269 1009 ,000 ,862 1009 ,000
Application of innovative sales promotion methods .255 1009 ,000 ,878 1009 ,000
Highly qualified, professional managers .277 1009 ,000 ,851 1009 ,000
Up-to-date decision making/operation systems .259 1009 ,000 ,873 1009 ,000
Level of R+D expenditures .245 1009 ,000 ,892 1009 ,000
Launch of new products .230 1009 ,000 ,896 1009 ,000
Efficiency of organisational structure .266 1009 ,000 ,868 1009 ,000
Integrated enterprise information system .232 1009 ,000 ,897 1009 ,000
Level of management information system .215 1009 ,000 ,891 1009 ,000
Integration of business administration functions .317 1009 ,000 ,821 1009 ,000
More direct relation to consumers .242 1009 ,000 ,875 1009 ,000
Adequate stocks .313 1009 ,000 ,838 1009 ,000
Profitability .215 1009 ,000 ,905 1009 ,000
a. Lilliefors Significance Correction

172
6.4.4 Histogram of missing values of corporate performance variables without the
logistics variable
118
54
40
2522
111110 9 9 93
9
15
1 3 5 3 3 3 1 3 2 3 41 3
0 1 2 1 3 3 3
20
7
0 0 0
90
0
20
40
60
80
100
120
140
1 3 5 7 9 11 13 15 17 19 21 23 25 27 29 31 33 35 37 39 41
Nu
mb
er o
f ca
ses
Number of missing values within a case

173
6.4.5 MDS running parameters
PROXSCAL
/MATRIX=IN('C:\Users\Corvinus\AppData\Local\Temp\spss4464\spssprxs.tmp')
/INITIAL=SIMPLEX
/TRANSFORMATION=ORDINAL(UNTIE)
/ACCELERATION=NONE
/CRITERIA=DIMENSIONS(1,10) MAXITER(100) DIFFSTRESS(.0001)
MINSTRESS(.0001)
/PRINT=STRESS
/PLOT=STRESS.
Credit
Proxscal
Version 1.0
by
Data Theory Scaling System Group (DTSS)
Faculty of Social and Behavioral Sciences
Leiden University, The Netherlands
Case Processing Summary
Cases 1009
Sources 1
Objects 1009
Proximities Total Proximities 508536a
Missing Proximities 0
Active Proximitiesb 508536
a. Sum of all strictly lower-triangular proximities.
b. Active proximities include all non-missing
proximities.
6.4.6 Stress and fit measures between 1 and 7 dimensions
Stress and Fit Measures
Dimensionality:1
Normalized Raw Stress .14998
Stress-I .38728a
Stress-II .56368a
S-Stress .26797b
Dispersion Accounted For (D.A.F.) .85002
Tucker's Coefficient of Congruence .92196
PROXSCAL minimizes Normalized Raw Stress.
a. Optimal scaling factor = 1.176.
b. Optimal scaling factor = .946.
Stress and Fit Measures
Dimensionality:2
Normalized Raw Stress .07762
Stress-I .27860a
Stress-II .50707a
S-Stress .17525b
Dispersion Accounted For (D.A.F.) .92238
Tucker's Coefficient of Congruence .96041
PROXSCAL minimizes Normalized Raw Stress.
a. Optimal scaling factor = 1.084.
b. Optimal scaling factor = .953.

175
Stress and Fit Measures
Dimensionality:3
Normalized Raw Stress .04983
Stress-I .22323a
Stress-II .46998a
S-Stress .12610b
Dispersion Accounted For (D.A.F.) .95017
Tucker's Coefficient of Congruence .97477
PROXSCAL minimizes Normalized Raw Stress.
a. Optimal scaling factor = 1.052.
b. Optimal scaling factor = .964.
Stress and Fit Measures
Dimensionality:4
Normalized Raw Stress .03444
Stress-I .18557a
Stress-II .43200a
S-Stress .09338b
Dispersion Accounted For (D.A.F.) .96556
Tucker's Coefficient of Congruence .98263
PROXSCAL minimizes Normalized Raw Stress.
a. Optimal scaling factor = 1.036.
b. Optimal scaling factor = .972.
Stress and Fit Measures
Dimensionality:5
Normalized Raw Stress ,02584
Stress-I .16076a
Stress-II .40418a
S-Stress .07419b
Dispersion Accounted For (D.A.F.) .97416
Tucker's Coefficient of Congruence .98699
PROXSCAL minimizes Normalized Raw Stress.
a. Optimal scaling factor = 1.027.
b. Optimal scaling factor = .977.
Stress and Fit Measures
Dimensionality:6
Normalized Raw Stress .02105
Stress-I .14510a
Stress-II .39103a
S-Stress .06346b
Dispersion Accounted For (D.A.F.) .97895
Tucker's Coefficient of Congruence .98942
PROXSCAL minimizes Normalized Raw Stress.
a. Optimal scaling factor = 1.022.
b. Optimal scaling factor = .980.
Stress and Fit Measures
Dimensionality:7
Normalized Raw Stress .01549
Stress-I .12445a
Stress-II .35083a
S-Stress .04536b
Dispersion Accounted For (D.A.F.) .98451
Tucker's Coefficient of Congruence .99223
PROXSCAL minimizes Normalized Raw Stress.
a. Optimal scaling factor = 1.016.
b. Optimal scaling factor = .985.

176
6.4.7 Correlation between corporate performance variables and dimensions
Spearman ρ D1 D2 D3 D4 D5 D6 D7
Cost efficiency Correlation Coefficient .046 .352 .045 .080 -.179 -.020 .332
Sig. (2-tailed) .148 .000 .150 .011 .000 .532 .000
N 1009 1009 1009 1009 1009 1009 1009
Market share Correlation Coefficient .417 -.015 .084 .100 -.004 .307 .198
Sig. (2-tailed) .000 .638 .008 .001 .900 .000 .000
N 1009 1009 1009 1009 1009 1009 1009
Technology level Correlation Coefficient .307 .000 .009 .280 -.132 .232 .042
Sig. (2-tailed) .000 .998 .775 .000 .000 .000 .183
N 1009 1009 1009 1009 1009 1009 1009
Product quality Correlation Coefficient .049 -.100 -.114 .227 .012 .131 -.013
Sig. (2-tailed) .121 .001 .000 .000 .702 .000 .686
N 1009 1009 1009 1009 1009 1009 1009
Range of product lines Correlation Coefficient .129 -.188 .084 .136 .303 .225 .295
Sig. (2-tailed) .000 .000 .008 .000 .000 .000 .000
N 1009 1009 1009 1009 1009 1009 1009
Competitive prices Correlation Coefficient -.179 .003 .140 -.023 -.077 -.151 .247
Sig. (2-tailed) .000 .930 .000 .467 .015 .000 .000
N 1009 1009 1009 1009 1009 1009 1009
Delivery accuracy Correlation Coefficient -.245 .004 .128 -.038 -.172 .217 -.027
Sig. (2-tailed) .000 .890 .000 .225 .000 .000 .396
N 1009 1009 1009 1009 1009 1009 1009
Customisation readiness Correlation Coefficient -.327 -.024 .216 -.040 -.215 .187 -.005
Sig. (2-tailed) .000 .438 .000 .204 .000 .000 .866
N 1009 1009 1009 1009 1009 1009 1009
Flexibility of production system Correlation Coefficient -.176 .015 .163 -.047 -.273 .034 .075
Sig. (2-tailed) .000 .626 .000 .134 .000 .285 .017
N 1009 1009 1009 1009 1009 1009 1009

177
Spearman ρ D1 D2 D3 D4 D5 D6 D7
Short delivery deadlines Correlation Coefficient -.228 .014 .131 -.064 -.141 .088 .030
Sig. (2-tailed) .000 .648 .000 .043 .000 .005 .333
N 1009 1009 1009 1009 1009 1009 1009
Speed of adaptation to changing
consumer needs
Correlation Coefficient -.209 -.005 .239 -.061 -.123 .135 .057
Sig. (2-tailed) .000 .876 .000 .051 .000 .000 .072
N 1009 1009 1009 1009 1009 1009 1009
Manufacturing quality Correlation Coefficient .156 -.019 -.016 .172 -.064 .109 .015
Sig. (2-tailed) .000 .538 .616 .000 .044 .000 .640
N 1009 1009 1009 1009 1009 1009 1009
Strategic alliances with major partners Correlation Coefficient .323 .024 .171 -.021 -.061 .292 .107
Sig. (2-tailed) .000 .438 .000 .514 .052 .000 .001
N 1009 1009 1009 1009 1009 1009 1009
Corporate image Correlation Coefficient .348 .043 .115 .173 -.010 .457 .039
Sig. (2-tailed) .000 .171 .000 .000 .748 .000 .216
N 1009 1009 1009 1009 1009 1009 1009
Organisation of distribution channels Correlation Coefficient .326 .139 .192 .096 -.019 .315 .193
Sig. (2-tailed) .000 .000 .000 .002 .544 .000 .000
N 1009 1009 1009 1009 1009 1009 1009
Creditability Correlation Coefficient .283 .602 -.058 .134 .090 .214 .118
Sig. (2-tailed) .000 .000 .064 .000 .004 .000 .000
N 1009 1009 1009 1009 1009 1009 1009
Level of receivables Correlation Coefficient .093 .526 -.262 .095 .076 .046 .045
Sig. (2-tailed) .003 .000 .000 .003 .016 .141 .157
N 1009 1009 1009 1009 1009 1009 1009

178
Spearman ρ D1 D2 D3 D4 D5 D6 D7
Solvency Correlation Coefficient .134 .623 -.132 .101 .093 .200 -.013
Sig. (2-tailed) .000 .000 .000 .001 .003 .000 .673
N 1009 1009 1009 1009 1009 1009 1009
Consumer service level Correlation Coefficient .090 .046 -.003 .077 -.065 .231 -.115
Sig. (2-tailed) .004 .141 .934 .015 .039 .000 .000
N 1009 1009 1009 1009 1009 1009 1009
Lobby capacity Correlation Coefficient .692 -.057 -.040 -.261 -.181 -.007 .043
Sig. (2-tailed) .000 .070 .206 .000 .000 .814 .177
N 1009 1009 1009 1009 1009 1009 1009
Sales to state or publicly financed
institutions
Correlation Coefficient .699 -.107 -.076 -.366 .003 -.121 .003
Sig. (2-tailed) .000 .001 .016 .000 .914 .000 .914
N 1009 1009 1009 1009 1009 1009 1009
Ability to forecast market changes Correlation Coefficient .379 .014 .116 .105 -.067 .182 .205
Sig. (2-tailed) .000 .646 .000 .001 .033 .000 .000
N 1009 1009 1009 1009 1009 1009 1009
Export activity Correlation Coefficient .301 -.187 -.233 .617 -.212 -.052 .251
Sig. (2-tailed) .000 .000 .000 .000 .000 .100 .000
N 1009 1009 1009 1009 1009 1009 1009
Ethical behaviour Correlation Coefficient -.091 .047 .007 .189 .259 .166 -.183
Sig. (2-tailed) .004 .134 .833 .000 .000 .000 .000
N 1009 1009 1009 1009 1009 1009 1009
Environmental (ecological) awareness Correlation Coefficient .116 -.039 .039 .176 .202 .070 -.168
Sig. (2-tailed) .000 .213 .211 .000 .000 .026 .000
N 1009 1009 1009 1009 1009 1009 1009

179
Spearman ρ D1 D2 D3 D4 D5 D6 D7
Introduction of proper quality raw
materials
Correlation Coefficient .056 -.100 -.002 .179 .119 .058 -.047
Sig. (2-tailed) .076 .001 .944 .000 .000 .066 .140
N 1009 1009 1009 1009 1009 1009 1009
Reliable raw material suppliers Correlation Coefficient .096 .023 .015 .138 .120 .038 .052
Sig. (2-tailed) .002 .464 .629 .000 .000 .225 .097
N 1009 1009 1009 1009 1009 1009 1009
Capacity utilisation Correlation Coefficient .059 .210 .136 .032 -.225 -.157 .297
Sig. (2-tailed) .062 .000 .000 .317 .000 .000 .000
N 1009 1009 1009 1009 1009 1009 1009
Qualification of employees Correlation Coefficient .246 .075 .152 .207 -.104 .055 -.194
Sig. (2-tailed) .000 .017 .000 .000 .001 .083 .000
N 1009 1009 1009 1009 1009 1009 1009
Application of innovative sales
promotion methods
Correlation Coefficient .342 .062 .362 .142 -.165 .171 .079
Sig. (2-tailed) .000 .047 .000 .000 .000 .000 .012
N 1009 1009 1009 1009 1009 1009 1009
Highly qualified, professional managers Correlation Coefficient .245 .095 .256 .189 -.110 .144 -.220
Sig. (2-tailed) .000 .003 .000 .000 .000 .000 .000
N 1009 1009 1009 1009 1009 1009 1009
Up-to-date decision making/operation
systems
Correlation Coefficient .279 .122 .418 .242 -.132 .051 -.134
Sig. (2-tailed) .000 .000 .000 .000 .000 .109 .000
N 1009 1009 1009 1009 1009 1009 1009
Level of R+D expenditures Correlation Coefficient .440 .107 .268 .117 .021 -.102 -.213
Sig. (2-tailed) .000 .001 .000 .000 .508 .001 .000
N 1009 1009 1009 1009 1009 1009 1009

180
Spearman ρ D1 D2 D3 D4 D5 D6 D7
Launch of new products Correlation Coefficient .302 -.082 .231 .079 .209 .090 .074
Sig. (2-tailed) .000 .010 .000 .012 .000 .004 .019
N 1009 1009 1009 1009 1009 1009 1009
Efficiency of organisational structure Correlation Coefficient .189 .247 .378 .190 .015 -.088 .045
Sig. (2-tailed) .000 .000 .000 .000 .624 .005 .157
N 1009 1009 1009 1009 1009 1009 1009
Integrated enterprise information system Correlation Coefficient .367 .210 .459 .273 .090 -.031 -.035
Sig. (2-tailed) .000 .000 .000 .000 .004 .330 .272
N 1009 1009 1009 1009 1009 1009 1009
Level of management information
system
Correlation Coefficient .323 .225 .480 .272 .060 .008 .014
Sig. (2-tailed) .000 .000 .000 .000 .059 .798 .653
N 1009 1009 1009 1009 1009 1009 1009
Integration of business administration
functions
Correlation Coefficient .272 .166 .308 .180 -.038 -.010 .040
Sig. (2-tailed) .000 .000 .000 .000 .233 .752 .200
N 1009 1009 1009 1009 1009 1009 1009
More direct relation to consumers Correlation Coefficient -.134 -.020 .250 -.109 .077 .206 -.042
Sig. (2-tailed) .000 .525 .000 .001 .015 .000 .187
N 1009 1009 1009 1009 1009 1009 1009
Adequate stocks Correlation Coefficient .023 .010 .088 .041 .123 .102 .011
Sig. (2-tailed) .461 .762 .005 .194 .000 .001 .732
N 1009 1009 1009 1009 1009 1009 1009
Profitability Correlation Coefficient .235 .338 .122 .045 -.134 -.124 .342
Sig. (2-tailed) .000 .000 .000 .154 .000 .000 .000
N 1009 1009 1009 1009 1009 1009 1009
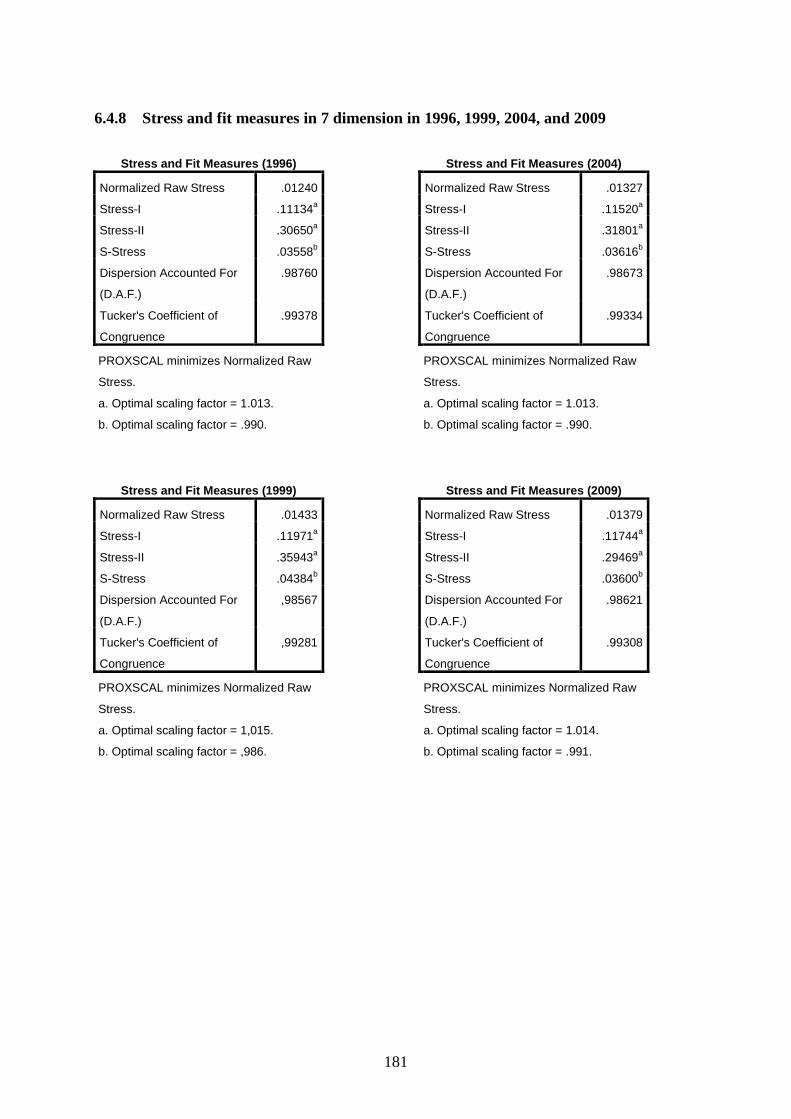
181
6.4.8 Stress and fit measures in 7 dimension in 1996, 1999, 2004, and 2009
Stress and Fit Measures (1996)
Normalized Raw Stress .01240
Stress-I .11134a
Stress-II .30650a
S-Stress .03558b
Dispersion Accounted For
(D.A.F.)
.98760
Tucker's Coefficient of
Congruence
.99378
PROXSCAL minimizes Normalized Raw
Stress.
a. Optimal scaling factor = 1.013.
b. Optimal scaling factor = .990.
Stress and Fit Measures (1999)
Normalized Raw Stress .01433
Stress-I .11971a
Stress-II .35943a
S-Stress .04384b
Dispersion Accounted For
(D.A.F.)
,98567
Tucker's Coefficient of
Congruence
,99281
PROXSCAL minimizes Normalized Raw
Stress.
a. Optimal scaling factor = 1,015.
b. Optimal scaling factor = ,986.
Stress and Fit Measures (2004)
Normalized Raw Stress .01327
Stress-I .11520a
Stress-II .31801a
S-Stress .03616b
Dispersion Accounted For
(D.A.F.)
.98673
Tucker's Coefficient of
Congruence
.99334
PROXSCAL minimizes Normalized Raw
Stress.
a. Optimal scaling factor = 1.013.
b. Optimal scaling factor = .990.
Stress and Fit Measures (2009)
Normalized Raw Stress .01379
Stress-I .11744a
Stress-II .29469a
S-Stress .03600b
Dispersion Accounted For
(D.A.F.)
.98621
Tucker's Coefficient of
Congruence
.99308
PROXSCAL minimizes Normalized Raw
Stress.
a. Optimal scaling factor = 1.014.
b. Optimal scaling factor = .991.

182
6.4.9 Correlated variables with performance dimensions, 2009
Dimension Correlated variable*
D1_2009 market share
strategic alliances with major partners
corporate image
organisation of distribution channels
creditability
level of receivables
lobby capacity
sales to state or publicly financed institutions
ability to forecast market changes
export activity
launch of new products
D2_2009 customisation readiness
flexibility of production system
short delivery deadlines
speed of adaptation to changing consumer needs
export activity
D3_2009 technology level
range of product lines
corporate image
application of innovative sales promotion methods
up-to-date decision making/operation systems
launch of new products
D4_2009 short delivery deadlines
speed of adaptation to changing consumer needs
strategic alliances with major partners
corporate image
organisation of distribution channels
creditability
D5_2009 level of R+D expenditures
D6_2009 cost efficiency
integrated enterprise information system
level of management information system
D7_2009 -
*Correlation significant at 99.9999% confidence level

183
6.4.10 Correlated variables with performance dimensions, 2004
Dimension Correlated variable*
D1_2004 cost efficiency, profitability
market share
technology level
customisation readiness (negative)
corporate image
organisation of distribution channels
creditability
lobby capacity
sales to state and publicly financed institutions
ability to forecast market changes
export activity
application of innovative sales promotion methods
up-to-date decision making/operation systems
level of R+D expenditures
launch of new products
efficiency of organisational structure
integrated enterprise information system
level of management information system
integration of business administration functions
D2_2004 cost efficiency
creditability
level of receivables
solvency
sales to state or publicly financed institutions (negative)
efficiency of organisational structure
integrated enterprise information system
level of management information system
profitability
D3_2004 product quality
range of product lines
sales to state or publicly financed institutions (negative)
export activity
D4_2004 cost efficiency
capacity utilisation
integrated enterprise information system (negative)
D5_2004 delivery accuracy
short delivery deadlines
D6_2004 market share
strategic alliances with major partners
corporate image
organisation of distribution channels
more direct relation to consumers
D7_2004 application of innovative sales promotion methods
launch of new products
more direct relation to consumers
*Correlation significant at 99.9999% confidence level

184
6.4.11 Correlated variables with performance dimensions, 1999
Dimension Correlated variable*
D1_1999 market share
technology level
corporate image
organisation of distribution channels
creditability
lobby capacity
sales to state or publicly financed institutions
ability to forecast market changes
application of innovative sales promotion methods
qualification of employees
highly qualified, professional managers
up-to-date decision making/operation systems
level of R+D expenditures
customisation readiness (negative)
delivery accuracy (negative)
customisation readiness (negative)
D2_1999 strategic alliances with major partners
export activity (negative)
integrated enterprise information system
level of management information system
integration of business administration functions
D3_1999 cost efficiency
organisation of distribution channels
creditability
level of receivables
solvency
capacity utilisation
efficiency of organisational structure
profitability
D4_1999 competitive prices (negative)
export activity
up-to-date decision making/operation systems
integrated enterprise information system
D5_1999 solvency
ethical behaviour
capacity utilisation (negative)
D6_1999 -
D7_1999 speed of adaptation to changing consumer needs
ability to forecast market changes
more direct relation to consumers
*Correlation significant at 99.9999% confidence level

185
6.4.12 Correlated variables with performance dimensions, 1996
Dimension Correlated variable*
D1_1996 market share
technology level
competitive prices (negative)
strategic alliances with major partners
corporate image
organisation of distribution channels
creditability
solvency
lobby capacity
sales to state or publicly financed institutions
ability to forecast market changes
application of innovative sales promotion methods
up-to-date decision making/operation systems
level of R+D expenditures
integrated enterprise information system
level of management information system
profitability
D2_1996 cost efficiency
creditability
level of receivables
solvency
sales to state or publicly financed institutions (negative)
D3_1996 market share
technology level
product quality
manufacturing quality
sales to state or publicly financed institutions (negative)
export activity
D4_1996 sales to state or publicly financed institutions (negative)
up-to-date decision making/operation systems
efficiency of organisational structure
integrated enterprise information system
integration of business administration functions
D5_1996 market share
customisation readiness (negative)
short delivery deadlines (negative)
introduction of proper quality raw materials (negative)
D6_1996 range of product lines
competitive prices
D7_1996 application of innovative sales promotion methods
launch of new products
more direct relation to consumers
*Correlation significant at 99.9999% confidence level
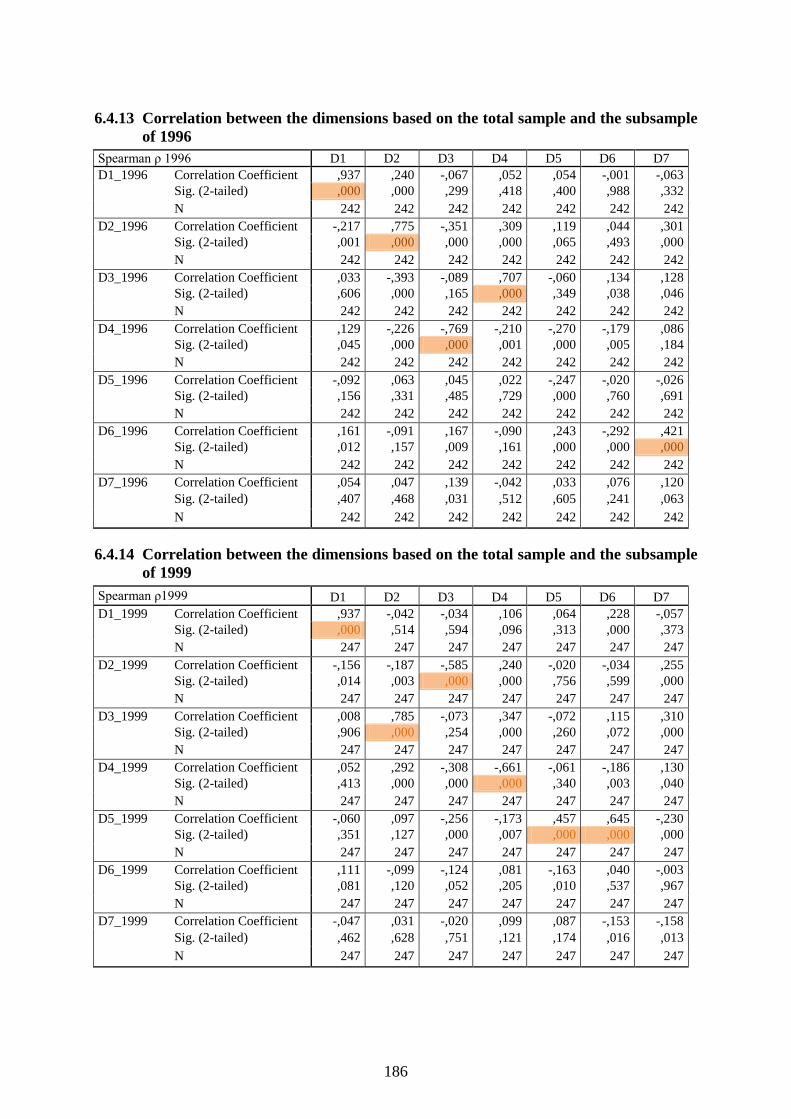
186
6.4.13 Correlation between the dimensions based on the total sample and the subsample
of 1996
Spearman ρ 1996 D1 D2 D3 D4 D5 D6 D7
D1_1996 Correlation Coefficient ,937 ,240 -,067 ,052 ,054 -,001 -,063
Sig. (2-tailed) ,000 ,000 ,299 ,418 ,400 ,988 ,332
N 242 242 242 242 242 242 242
D2_1996 Correlation Coefficient -,217 ,775 -,351 ,309 ,119 ,044 ,301
Sig. (2-tailed) ,001 ,000 ,000 ,000 ,065 ,493 ,000
N 242 242 242 242 242 242 242
D3_1996 Correlation Coefficient ,033 -,393 -,089 ,707 -,060 ,134 ,128
Sig. (2-tailed) ,606 ,000 ,165 ,000 ,349 ,038 ,046
N 242 242 242 242 242 242 242
D4_1996 Correlation Coefficient ,129 -,226 -,769 -,210 -,270 -,179 ,086
Sig. (2-tailed) ,045 ,000 ,000 ,001 ,000 ,005 ,184
N 242 242 242 242 242 242 242
D5_1996 Correlation Coefficient -,092 ,063 ,045 ,022 -,247 -,020 -,026
Sig. (2-tailed) ,156 ,331 ,485 ,729 ,000 ,760 ,691
N 242 242 242 242 242 242 242
D6_1996 Correlation Coefficient ,161 -,091 ,167 -,090 ,243 -,292 ,421
Sig. (2-tailed) ,012 ,157 ,009 ,161 ,000 ,000 ,000
N 242 242 242 242 242 242 242
D7_1996 Correlation Coefficient ,054 ,047 ,139 -,042 ,033 ,076 ,120
Sig. (2-tailed) ,407 ,468 ,031 ,512 ,605 ,241 ,063
N 242 242 242 242 242 242 242
6.4.14 Correlation between the dimensions based on the total sample and the subsample
of 1999
Spearman ρ1999 D1 D2 D3 D4 D5 D6 D7
D1_1999 Correlation Coefficient ,937 -,042 -,034 ,106 ,064 ,228 -,057
Sig. (2-tailed) ,000 ,514 ,594 ,096 ,313 ,000 ,373
N 247 247 247 247 247 247 247
D2_1999 Correlation Coefficient -,156 -,187 -,585 ,240 -,020 -,034 ,255
Sig. (2-tailed) ,014 ,003 ,000 ,000 ,756 ,599 ,000
N 247 247 247 247 247 247 247
D3_1999 Correlation Coefficient ,008 ,785 -,073 ,347 -,072 ,115 ,310
Sig. (2-tailed) ,906 ,000 ,254 ,000 ,260 ,072 ,000
N 247 247 247 247 247 247 247
D4_1999 Correlation Coefficient ,052 ,292 -,308 -,661 -,061 -,186 ,130
Sig. (2-tailed) ,413 ,000 ,000 ,000 ,340 ,003 ,040
N 247 247 247 247 247 247 247
D5_1999 Correlation Coefficient -,060 ,097 -,256 -,173 ,457 ,645 -,230
Sig. (2-tailed) ,351 ,127 ,000 ,007 ,000 ,000 ,000
N 247 247 247 247 247 247 247
D6_1999 Correlation Coefficient ,111 -,099 -,124 ,081 -,163 ,040 -,003
Sig. (2-tailed) ,081 ,120 ,052 ,205 ,010 ,537 ,967
N 247 247 247 247 247 247 247
D7_1999 Correlation Coefficient -,047 ,031 -,020 ,099 ,087 -,153 -,158
Sig. (2-tailed) ,462 ,628 ,751 ,121 ,174 ,016 ,013
N 247 247 247 247 247 247 247
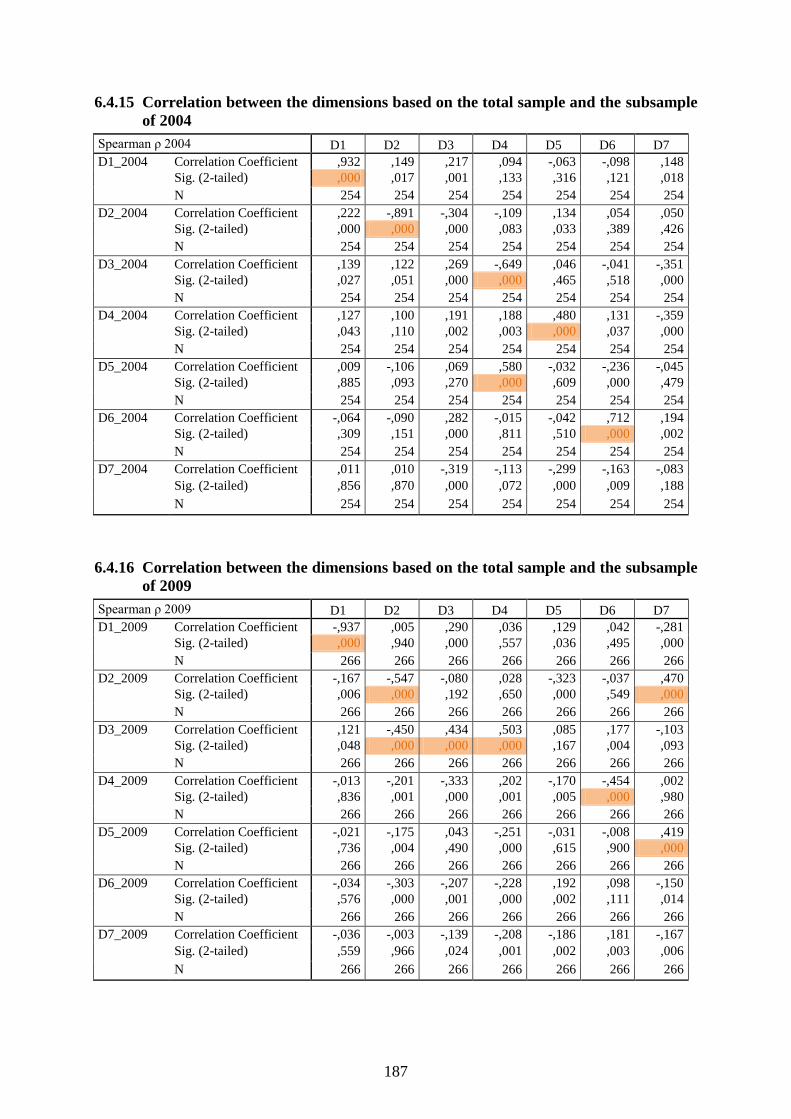
187
6.4.15 Correlation between the dimensions based on the total sample and the subsample
of 2004
Spearman ρ 2004 D1 D2 D3 D4 D5 D6 D7
D1_2004 Correlation Coefficient ,932 ,149 ,217 ,094 -,063 -,098 ,148
Sig. (2-tailed) ,000 ,017 ,001 ,133 ,316 ,121 ,018
N 254 254 254 254 254 254 254
D2_2004 Correlation Coefficient ,222 -,891 -,304 -,109 ,134 ,054 ,050
Sig. (2-tailed) ,000 ,000 ,000 ,083 ,033 ,389 ,426
N 254 254 254 254 254 254 254
D3_2004 Correlation Coefficient ,139 ,122 ,269 -,649 ,046 -,041 -,351
Sig. (2-tailed) ,027 ,051 ,000 ,000 ,465 ,518 ,000
N 254 254 254 254 254 254 254
D4_2004 Correlation Coefficient ,127 ,100 ,191 ,188 ,480 ,131 -,359
Sig. (2-tailed) ,043 ,110 ,002 ,003 ,000 ,037 ,000
N 254 254 254 254 254 254 254
D5_2004 Correlation Coefficient ,009 -,106 ,069 ,580 -,032 -,236 -,045
Sig. (2-tailed) ,885 ,093 ,270 ,000 ,609 ,000 ,479
N 254 254 254 254 254 254 254
D6_2004 Correlation Coefficient -,064 -,090 ,282 -,015 -,042 ,712 ,194
Sig. (2-tailed) ,309 ,151 ,000 ,811 ,510 ,000 ,002
N 254 254 254 254 254 254 254
D7_2004 Correlation Coefficient ,011 ,010 -,319 -,113 -,299 -,163 -,083
Sig. (2-tailed) ,856 ,870 ,000 ,072 ,000 ,009 ,188
N 254 254 254 254 254 254 254
6.4.16 Correlation between the dimensions based on the total sample and the subsample
of 2009
Spearman ρ 2009 D1 D2 D3 D4 D5 D6 D7
D1_2009 Correlation Coefficient -,937 ,005 ,290 ,036 ,129 ,042 -,281
Sig. (2-tailed) ,000 ,940 ,000 ,557 ,036 ,495 ,000
N 266 266 266 266 266 266 266
D2_2009 Correlation Coefficient -,167 -,547 -,080 ,028 -,323 -,037 ,470
Sig. (2-tailed) ,006 ,000 ,192 ,650 ,000 ,549 ,000
N 266 266 266 266 266 266 266
D3_2009 Correlation Coefficient ,121 -,450 ,434 ,503 ,085 ,177 -,103
Sig. (2-tailed) ,048 ,000 ,000 ,000 ,167 ,004 ,093
N 266 266 266 266 266 266 266
D4_2009 Correlation Coefficient -,013 -,201 -,333 ,202 -,170 -,454 ,002
Sig. (2-tailed) ,836 ,001 ,000 ,001 ,005 ,000 ,980
N 266 266 266 266 266 266 266
D5_2009 Correlation Coefficient -,021 -,175 ,043 -,251 -,031 -,008 ,419
Sig. (2-tailed) ,736 ,004 ,490 ,000 ,615 ,900 ,000
N 266 266 266 266 266 266 266
D6_2009 Correlation Coefficient -,034 -,303 -,207 -,228 ,192 ,098 -,150
Sig. (2-tailed) ,576 ,000 ,001 ,000 ,002 ,111 ,014
N 266 266 266 266 266 266 266
D7_2009 Correlation Coefficient -,036 -,003 -,139 -,208 -,186 ,181 -,167
Sig. (2-tailed) ,559 ,966 ,024 ,001 ,002 ,003 ,006
N 266 266 266 266 266 266 266

188
6.4.17 Quintiles and other descriptors of the dimensions of corporate performance
N Medi
an
Minim
um
Maxim
um
Percentiles
Va-
lid
Miss-
ing
20 40 60 80
Market and
lobby force
1009 231 .057 -1.068 .982 -.261 -.025 .117 .249
Financial
force
1009 231 .006 -1.083 1.000 -.205 -.046 .056 .213
Organisa-
tional
efficiency
1009 231 .007 -.904 1.146 -.196 -.047 .053 .194
Market
orientation
1009 231 -.006 -1.014 1.260 -.195 -.054 .047 .219
Product
orientation
1009 231 -.002 -1.484 1.007 -.157 -.043 .042 .164
Network
position
1009 231 .004 -1.579 .650 -.167 -.039 .053 .172
Provisional
competitive
advantage
1009 231 .006 -.766 1.634 -.165 -.043 .041 .170

189
6.5 Correlation between the perception of environmental uncertainty and firm performance
Spearman ρ Market
and lobby
force
Finan-
cial
force
Organisational
efficiency
Market
orientation
Product
orientation
Network
position
Provisional
competitive
advantage
Foreign sales
market
environment -
past 3-4 years
Correlation
Coefficient
-.024 -.124 -.123 .195 -.115 -.066 .153
Sig. (2-
tailed)
.452 .000 .000 .000 .000 .039 .000
N 969 969 969 969 969 969 969
Foreign sales
market
environment -
present
Correlation
Coefficient
-.073 -.100 -.092 .224 -.123 -.066 .089
Sig. (2-
tailed)
.023 .002 .004 .000 .000 .039 .006
N 975 975 975 975 975 975 975
Domestic sales
market
environment -
past 3-4 years
Correlation
Coefficient
-.059 -.051 .038 -.081 .091 .056 -.016
Sig. (2-
tailed)
.066 .107 .235 .011 .004 .078 .606
N 983 983 983 983 983 983 983
Domestic sales
market
environment -
present
Correlation
Coefficient
-.051 -.039 .101 -.090 .111 .044 -.109
Sig. (2-
tailed)
.107 .216 .001 .005 .000 .170 .001
N 990 990 990 990 990 990 990
Capital and
financial
market changes
- past 3-4 years
Correlation
Coefficient
-.067 -.086 .028 .050 -.008 -.040 .070
Sig. (2-
tailed)
.037 .007 .387 .118 .808 .217 .029
N 977 977 977 977 977 977 977
Capital and
financial
market changes
- present
Correlation
Coefficient
-.076 -.125 .075 .070 -.013 -.020 -.050
Sig. (2-
tailed)
.018 .000 .019 .029 .675 .526 .120
N 980 980 980 980 980 980 980
Foreign
suppliers - past
3-4 years
Correlation
Coefficient
.049 -.079 -.003 .113 -.053 -.042 .057
Sig. (2-
tailed)
.124 .014 .915 .000 .101 .196 .079
N 968 968 968 968 968 968 968
Foreign
suppliers -
present
Correlation
Coefficient
.031 -.061 .057 .084 -.019 -.037 .036
Sig. (2-
tailed)
.329 .058 .075 .009 .547 .246 .265
N 971 971 971 971 971 971 971
Domestic
suppliers - past
3-4 years
Correlation
Coefficient
-.026 -.005 .071 -.024 .009 .037 .011
Sig. (2-
tailed)
.423 .870 .027 .452 .789 .243 .723
N 980 980 980 980 980 980 980
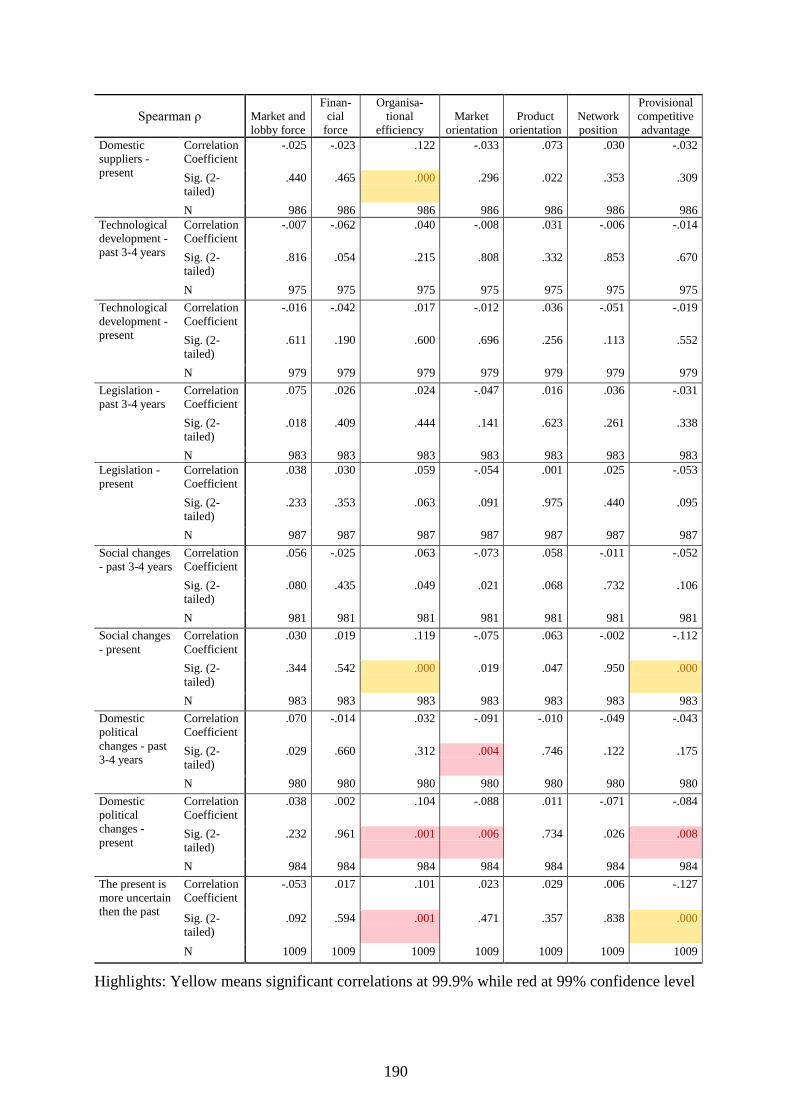
190
Spearman ρ Market and
lobby force
Finan-
cial
force
Organisa-
tional
efficiency
Market
orientation
Product
orientation
Network
position
Provisional
competitive
advantage
Domestic
suppliers -
present
Correlation
Coefficient
-.025 -.023 .122 -.033 .073 .030 -.032
Sig. (2-
tailed)
.440 .465 .000 .296 .022 .353 .309
N 986 986 986 986 986 986 986
Technological
development -
past 3-4 years
Correlation
Coefficient
-.007 -.062 .040 -.008 .031 -.006 -.014
Sig. (2-
tailed)
.816 .054 .215 .808 .332 .853 .670
N 975 975 975 975 975 975 975
Technological
development -
present
Correlation
Coefficient
-.016 -.042 .017 -.012 .036 -.051 -.019
Sig. (2-
tailed)
.611 .190 .600 .696 .256 .113 .552
N 979 979 979 979 979 979 979
Legislation -
past 3-4 years
Correlation
Coefficient
.075 .026 .024 -.047 .016 .036 -.031
Sig. (2-
tailed)
.018 .409 .444 .141 .623 .261 .338
N 983 983 983 983 983 983 983
Legislation -
present
Correlation
Coefficient
.038 .030 .059 -.054 .001 .025 -.053
Sig. (2-
tailed)
.233 .353 .063 .091 .975 .440 .095
N 987 987 987 987 987 987 987
Social changes
- past 3-4 years
Correlation
Coefficient
.056 -.025 .063 -.073 .058 -.011 -.052
Sig. (2-
tailed)
.080 .435 .049 .021 .068 .732 .106
N 981 981 981 981 981 981 981
Social changes
- present
Correlation
Coefficient
.030 .019 .119 -.075 .063 -.002 -.112
Sig. (2-
tailed)
.344 .542 .000 .019 .047 .950 .000
N 983 983 983 983 983 983 983
Domestic
political
changes - past
3-4 years
Correlation
Coefficient
.070 -.014 .032 -.091 -.010 -.049 -.043
Sig. (2-
tailed)
.029 .660 .312 .004 .746 .122 .175
N 980 980 980 980 980 980 980
Domestic
political
changes -
present
Correlation
Coefficient
.038 .002 .104 -.088 .011 -.071 -.084
Sig. (2-
tailed)
.232 .961 .001 .006 .734 .026 .008
N 984 984 984 984 984 984 984
The present is
more uncertain
then the past
Correlation
Coefficient
-.053 .017 .101 .023 .029 .006 -.127
Sig. (2-
tailed)
.092 .594 .001 .471 .357 .838 .000
N 1009 1009 1009 1009 1009 1009 1009
Highlights: Yellow means significant correlations at 99.9% while red at 99% confidence level
191
CORVINUS UNIVERSITY OF BUDAPEST FACULTY OF BUSINESS ADMINISTRATION INSTITUTE OF MANAGEMENT DEPARTMENT OF MANAGEMENT AND ORGANIZATION
1093 Budapest, Fővám tér 8. : 1311 Budapest Pf. 58. E-mail: [email protected]
PERSONAL DETAILS
Name: Roland Zsolt SZABÓ
Current position: Assistant Professor
EDUCATION
2005-2008 Full time Ph.D. Student Corvinus University of Budapest, Supervisor: Prof. Balaton, Karoly
Specialization: Corporate Strategy
Comprehensive Exam: January 2008 (Summa Cum Laude)
Defence of the Thesis Proposal: June 2010 2003-2005 Master of Science in Business Administration (honours degree)
Széchenyi István University, Győr
Major in Finance and Insurance 1999-2003 Bachelor of Science in Business Administration
Budapest Business School
Major in International Business and Economics
Major in European Studies LANGUAGES Advanced Business English, Intermediate Business German RESEARCH INTEREST Strategic Adaptation, Growth of the Firm, Entrepreneurship, Networks, Change management RESEARCH ACTIVITY
2010- TÁMOP-4.2.1.B- 09/1/KMR-2010-0005 ‘The knowledge-based economy in Hungary, the conditions of the growing innovative approach and the increase of R&D performance’ (4. sub-project research) ‘Innovation of the SME sector’ working group, research coordinator, CUB
2007- ‘Effective business strategies in different corporate life cycles’, OTKA thematic research, research fellow, CUB
2006-2008 ‘Regional role and innovation activity of Hungarian centred and governed enterprises in order to increase competitiveness’, OTKA thematic research, researcher, CUB
2005- Research Centre of Strategic and International Management, research fellow, CUB 2005- Member of the Corvinus’ Competitiveness Research Center’s research project called
“Competing with the World’, CUB 2004-2005 ‘Corporate learning and strategy formulation at SMEs’, research fellow, SZE
2004 ‘Influencing factors in entrepreneurial activity and growth’, research fellow, SZE, PTE SEMINARS ABROAD
2009 May 25th Price-Babson SEE, Babson College, MA, USA 2007 February ‘Intensive Doctoral Seminar in Entrepreneurship’ CEMS PhD course, Université Catholique de
Louvain, Belgium 2006 June Organizational Learning, Networks, and Communities: Innovations in the emerging strategic
entrepreneurship field, EUDOKMA seminar, Vrije University, Amsterdam, Holland 2006 April Qualitative Data Analysis in Business and Management Research, EUDOKMA seminar,
Kingston University, UK

192
MAJOR CONTESTS 2005 27th National Scientific Student Conference
Integration, Globalization, World Economy track: Sopron, Hungary – second prize award Strategic Management track: Sopron, Hungary – third prize award
2004 5th MTA-VEAB Regional Scientific Student Conference Management track: Győr, Hungary – first prize award European Union track: Győr, Hungary – first prize award
SCHOLARSHIPS
2005-2008 Full-time PhD scholarship 2001-2002, 2004-2005 Scholarship of the Hungarian Republic
2004 Graboplast Co. internship and grant (3 months)
PARTICIPATION IN EXCHANGE PROGRAM
2002/2003 Erasmus Scholarship: Hochschule Mittweida, Germany (5 months)
ORGANISATION OF SCIENTIFIC CONFERENCES
2009 23th RENT Conference, organiser 2006- Scientific Student Conference, CUB, track chair
Strategic management track General management and Managerial accounting track
MEMBERSHIP IN INTERNATIONAL SCIENTIFIC COMMUNITIES
2009- EIASM 2008- European Group for Organizational Studies 2006- Strategic Management Society 2006- European Academy of Management 2006- EDAMBA and EUDOKMA