Stranded Assets and Scenarios - Discussion Paper - … · Stranded Assets and Scenarios Discussion...
22
Authors: Ben Caldecott | James Tilbury | Christian Carey Stranded Assets and Scenarios Discussion Paper January 2014
-
Upload
phungthuan -
Category
Documents
-
view
232 -
download
2
Transcript of Stranded Assets and Scenarios - Discussion Paper - … · Stranded Assets and Scenarios Discussion...
Authors: Ben Caldecott | James Tilbury | Christian Carey
08 Fall
Stranded Assets and Scenarios Discussion Paper January 2014

Stranded Assets Programme Discussion Paper – January 2014
2
About the Stranded Assets Programme ‘Stranded assets’ are assets that have suffered from unanticipated or premature write-downs, devaluations or conversion to liabilities. They can be caused by a range of environment-related risks and these risks are poorly understood and regularly mispriced, which has resulted in a significant over-exposure to environmentally unsustainable assets throughout our financial and economic systems. Current and emerging risks related to the environment represent a major discontinuity, able to profoundly alter asset values across a wide range of sectors. Some of these risk factors include:
• Environmental challenges (e.g. climate change, water constraints) • Changing resource landscapes (e.g. shale gas, phosphate) • New government regulations (e.g. carbon pricing, air pollution regulation) • Falling clean technology costs (e.g. solar PV, onshore wind) • Evolving social norms (e.g. fossil fuel divestment campaign) and consumer behaviour (e.g. certification
schemes) • Litigation and changing statutory interpretations (e.g. changes in the application of existing laws and
legislation)
The Stranded Assets Programme at the University of Oxford’s Smith School of Enterprise and the Environment was established in 2012 to understand these risks in different sectors and systemically. We test and analyse the materiality of stranded asset risks over different time horizons and research the potential impacts of stranded assets on investors, businesses, regulators and policymakers. We also work with partners to develop strategies to manage the consequences of stranded assets. The Programme is currently being supported through donations from the Ashden Trust, Aviva Investors, Bunge Ltd, Craigmore Sustainables, the Generation Foundation, the Growald Family Fund, HSBC Holdings plc, the Rothschild Foundation and WWF-UK. Our non-funding partners currently include Standard & Poor’s, the Carbon Disclosure Project, Trucost, Ceres, the Carbon Tracker Initiative, Asset Owners Disclosure Project, 2° Investing Initiative and RISKERGY.
Disclaimer The Chancellor, Masters and Scholars of the University of Oxford are not investment advisers, and make no representations and provide no warranties in relation to any aspect of this publication, including regarding the advisability of investing in any particular company or investment fund or other vehicle. A decision to invest in any such investment fund or other entity should not be made in reliance on any of the statements set forth in this publication. While we have obtained information believed to be reliable, neither the University, nor any of its employees, students or appointees, shall be liable for any claims or losses of any nature in connection with information contained in this document, including but not limited to, lost profits or punitive or consequential damages.
Stranded Assets Programme Discussion Paper – January 2014
3
Table of Contents ABOUT THE STRANDED ASSETS PROGRAMME 2
DISCLAIMER 2
1 INTRODUCTION 4 1.1 PREFERRED FRAMEWORK 4
2 ANALYSIS 6 2.1 SELECTION OF SCENARIOS 6 2.2 ENVIRONMENT-‐‑RELATED FACTORS 7 2.3 LEVEL OF GRANULARITY 8 2.4 USE OF QUANTITATIVE DATA 10 2.5 TIME HORIZONS 12 2.6 SECTORIAL COVERAGE 14 2.7 COMPREHENSIVENESS OF EXISTING SCENARIOS 16 2.8 ANALYSIS OF SELECTED SCENARIOS 16
3 CONCLUSION 19
4 REFERENCES 20
Stranded Assets Programme Discussion Paper – January 2014
4
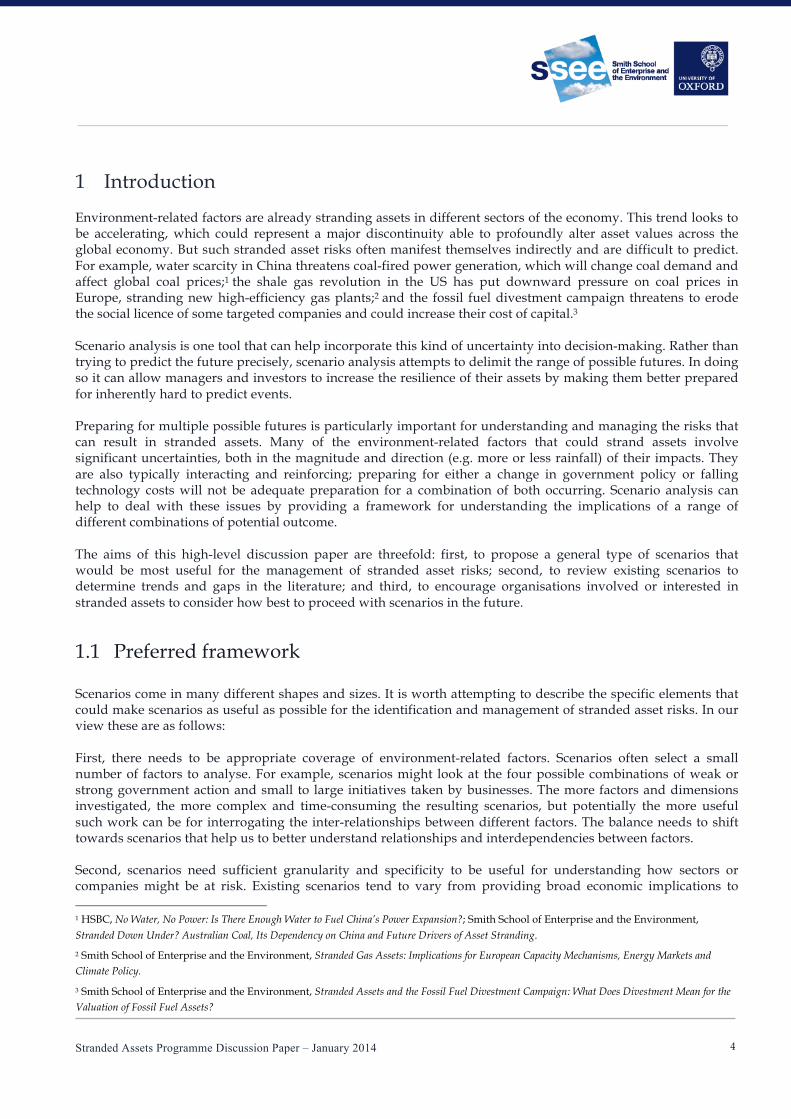
1 Introduction
Environment-related factors are already stranding assets in different sectors of the economy. This trend looks to be accelerating, which could represent a major discontinuity able to profoundly alter asset values across the global economy. But such stranded asset risks often manifest themselves indirectly and are difficult to predict. For example, water scarcity in China threatens coal-fired power generation, which will change coal demand and affect global coal prices;1 the shale gas revolution in the US has put downward pressure on coal prices in Europe, stranding new high-efficiency gas plants;2 and the fossil fuel divestment campaign threatens to erode the social licence of some targeted companies and could increase their cost of capital.3 Scenario analysis is one tool that can help incorporate this kind of uncertainty into decision-making. Rather than trying to predict the future precisely, scenario analysis attempts to delimit the range of possible futures. In doing so it can allow managers and investors to increase the resilience of their assets by making them better prepared for inherently hard to predict events. Preparing for multiple possible futures is particularly important for understanding and managing the risks that can result in stranded assets. Many of the environment-related factors that could strand assets involve significant uncertainties, both in the magnitude and direction (e.g. more or less rainfall) of their impacts. They are also typically interacting and reinforcing; preparing for either a change in government policy or falling technology costs will not be adequate preparation for a combination of both occurring. Scenario analysis can help to deal with these issues by providing a framework for understanding the implications of a range of different combinations of potential outcome. The aims of this high-level discussion paper are threefold: first, to propose a general type of scenarios that would be most useful for the management of stranded asset risks; second, to review existing scenarios to determine trends and gaps in the literature; and third, to encourage organisations involved or interested in stranded assets to consider how best to proceed with scenarios in the future.
1.1 Preferred framework
Scenarios come in many different shapes and sizes. It is worth attempting to describe the specific elements that could make scenarios as useful as possible for the identification and management of stranded asset risks. In our view these are as follows: First, there needs to be appropriate coverage of environment-related factors. Scenarios often select a small number of factors to analyse. For example, scenarios might look at the four possible combinations of weak or strong government action and small to large initiatives taken by businesses. The more factors and dimensions investigated, the more complex and time-consuming the resulting scenarios, but potentially the more useful such work can be for interrogating the inter-relationships between different factors. The balance needs to shift towards scenarios that help us to better understand relationships and interdependencies between factors. Second, scenarios need sufficient granularity and specificity to be useful for understanding how sectors or companies might be at risk. Existing scenarios tend to vary from providing broad economic implications to 1 HSBC, No Water, No Power: Is There Enough Water to Fuel China’s Power Expansion?; Smith School of Enterprise and the Environment, Stranded Down Under? Australian Coal, Its Dependency on China and Future Drivers of Asset Stranding.
2 Smith School of Enterprise and the Environment, Stranded Gas Assets: Implications for European Capacity Mechanisms, Energy Markets and Climate Policy.
3 Smith School of Enterprise and the Environment, Stranded Assets and the Fossil Fuel Divestment Campaign: What Does Divestment Mean for the Valuation of Fossil Fuel Assets?
Stranded Assets Programme Discussion Paper – January 2014
5
identifying specific companies that are at risk. For investors concerned with the issue of stranded assets, we believe that more granularity can be better. Third, scenarios should have quantitative projections underpinning them. This enables users to interrogate and flex scenarios for their own purposes, and to incorporate scenarios into the valuation and stress-testing models that they use. This is not to say that we believe that accurate quantitative projections exist for most factors, especially over the longer term. But the reality is that for most users in finance and business, data points are required to underpin qualitative analysis and for scenarios to be integrated in business cases, credit analysis and due diligence processes. Finally, the time horizons covered by scenarios are important. Scenarios 100 years into the future have limited relevance for most decision-makers who won’t be around to see their impacts, while scenarios one year into the future will show too little difference to be of much use. There must be a balance struck between these extremes and we would suggest that 5–15 years is a good compromise for most stakeholders interested in the issue of stranded assets.
Stranded Assets Programme Discussion Paper – January 2014
6
2 Analysis
2.1 Selection of scenarios
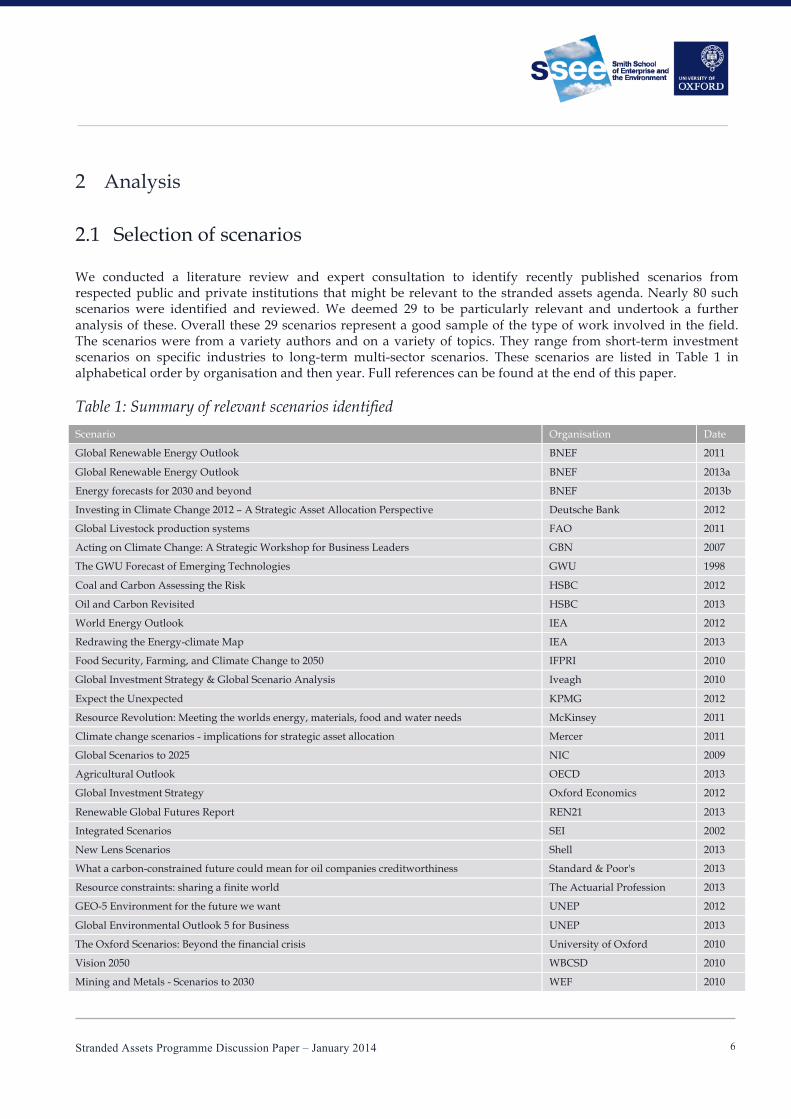
We conducted a literature review and expert consultation to identify recently published scenarios from respected public and private institutions that might be relevant to the stranded assets agenda. Nearly 80 such scenarios were identified and reviewed. We deemed 29 to be particularly relevant and undertook a further analysis of these. Overall these 29 scenarios represent a good sample of the type of work involved in the field. The scenarios were from a variety authors and on a variety of topics. They range from short-term investment scenarios on specific industries to long-term multi-sector scenarios. These scenarios are listed in Table 1 in alphabetical order by organisation and then year. Full references can be found at the end of this paper.
Table 1: Summary of relevant scenarios identified
Scenario Organisation Date
Global Renewable Energy Outlook BNEF 2011
Global Renewable Energy Outlook BNEF 2013a
Energy forecasts for 2030 and beyond BNEF 2013b
Investing in Climate Change 2012 – A Strategic Asset Allocation Perspective Deutsche Bank 2012
Global Livestock production systems FAO 2011
Acting on Climate Change: A Strategic Workshop for Business Leaders GBN 2007
The GWU Forecast of Emerging Technologies GWU 1998
Coal and Carbon Assessing the Risk HSBC 2012
Oil and Carbon Revisited HSBC 2013
World Energy Outlook IEA 2012
Redrawing the Energy-climate Map IEA 2013
Food Security, Farming, and Climate Change to 2050 IFPRI 2010
Global Investment Strategy & Global Scenario Analysis Iveagh 2010
Expect the Unexpected KPMG 2012
Resource Revolution: Meeting the worlds energy, materials, food and water needs McKinsey 2011
Climate change scenarios - implications for strategic asset allocation Mercer 2011
Global Scenarios to 2025 NIC 2009
Agricultural Outlook OECD 2013
Global Investment Strategy Oxford Economics 2012
Renewable Global Futures Report REN21 2013
Integrated Scenarios SEI 2002
New Lens Scenarios Shell 2013
What a carbon-constrained future could mean for oil companies creditworthiness Standard & Poor's 2013
Resource constraints: sharing a finite world The Actuarial Profession 2013
GEO-5 Environment for the future we want UNEP 2012
Global Environmental Outlook 5 for Business UNEP 2013
The Oxford Scenarios: Beyond the financial crisis University of Oxford 2010
Vision 2050 WBCSD 2010
Mining and Metals - Scenarios to 2030 WEF 2010
Stranded Assets Programme Discussion Paper – January 2014
7
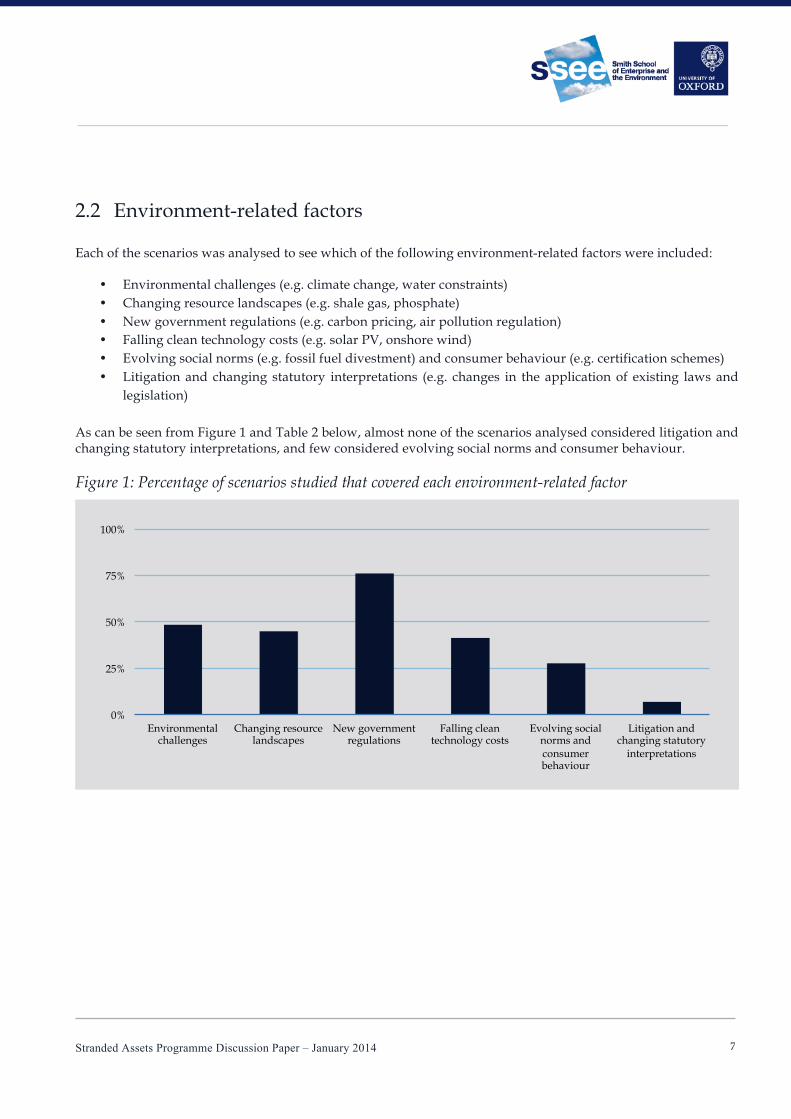
2.2 Environment-related factors
Each of the scenarios was analysed to see which of the following environment-related factors were included:
• Environmental challenges (e.g. climate change, water constraints) • Changing resource landscapes (e.g. shale gas, phosphate) • New government regulations (e.g. carbon pricing, air pollution regulation) • Falling clean technology costs (e.g. solar PV, onshore wind) • Evolving social norms (e.g. fossil fuel divestment) and consumer behaviour (e.g. certification schemes) • Litigation and changing statutory interpretations (e.g. changes in the application of existing laws and
legislation) As can be seen from Figure 1 and Table 2 below, almost none of the scenarios analysed considered litigation and changing statutory interpretations, and few considered evolving social norms and consumer behaviour.
Figure 1: Percentage of scenarios studied that covered each environment-related factor
0%
25%
50%
75%
100%
Environmental challenges
Changing resource landscapes
New government regulations
Falling clean technology costs
Evolving social norms and consumer behaviour
Litigation and changing statutory
interpretations
Stranded Assets Programme Discussion Paper – January 2014
8
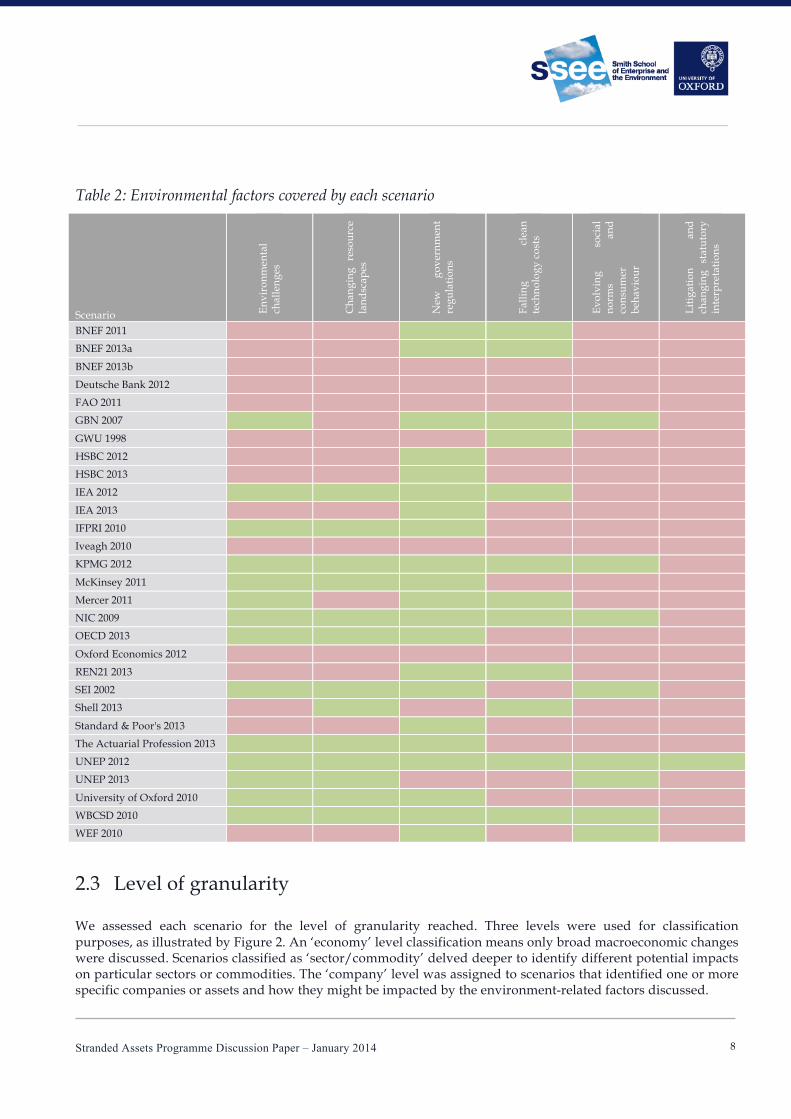
Table 2: Environmental factors covered by each scenario
Scenario Envi
ronm
enta
l ch
alle
nges
Cha
ngin
g re
sour
ce
land
scap
es
New
go
vern
men
t re
gula
tion
s
Falli
ng
clea
n te
chno
logy
cos
ts
Evol
ving
so
cial
no
rms
and
cons
umer
be
havi
our
Liti
gati
on
and
chan
ging
st
atut
ory
inte
rpre
tati
ons
BNEF 2011
BNEF 2013a
BNEF 2013b
Deutsche Bank 2012
FAO 2011
GBN 2007
GWU 1998
HSBC 2012
HSBC 2013
IEA 2012
IEA 2013
IFPRI 2010
Iveagh 2010
KPMG 2012
McKinsey 2011
Mercer 2011
NIC 2009
OECD 2013
Oxford Economics 2012
REN21 2013
SEI 2002
Shell 2013
Standard & Poor's 2013
The Actuarial Profession 2013
UNEP 2012
UNEP 2013
University of Oxford 2010
WBCSD 2010
WEF 2010
2.3 Level of granularity
We assessed each scenario for the level of granularity reached. Three levels were used for classification purposes, as illustrated by Figure 2. An ‘economy’ level classification means only broad macroeconomic changes were discussed. Scenarios classified as ‘sector/commodity’ delved deeper to identify different potential impacts on particular sectors or commodities. The ‘company’ level was assigned to scenarios that identified one or more specific companies or assets and how they might be impacted by the environment-related factors discussed.

Stranded Assets Programme Discussion Paper – January 2014
9
Figure 2: Classification of levels of detail covered by each scenario analysed
Figure 3: Number of scenarios that analysed to each level of depth
0%
20%
40%
60%
Economy Sector/Commodity Company
Level of depth analysed to
1) Economy
2) Sector/Commodity
3) Company
Stranded Assets Programme Discussion Paper – January 2014
10
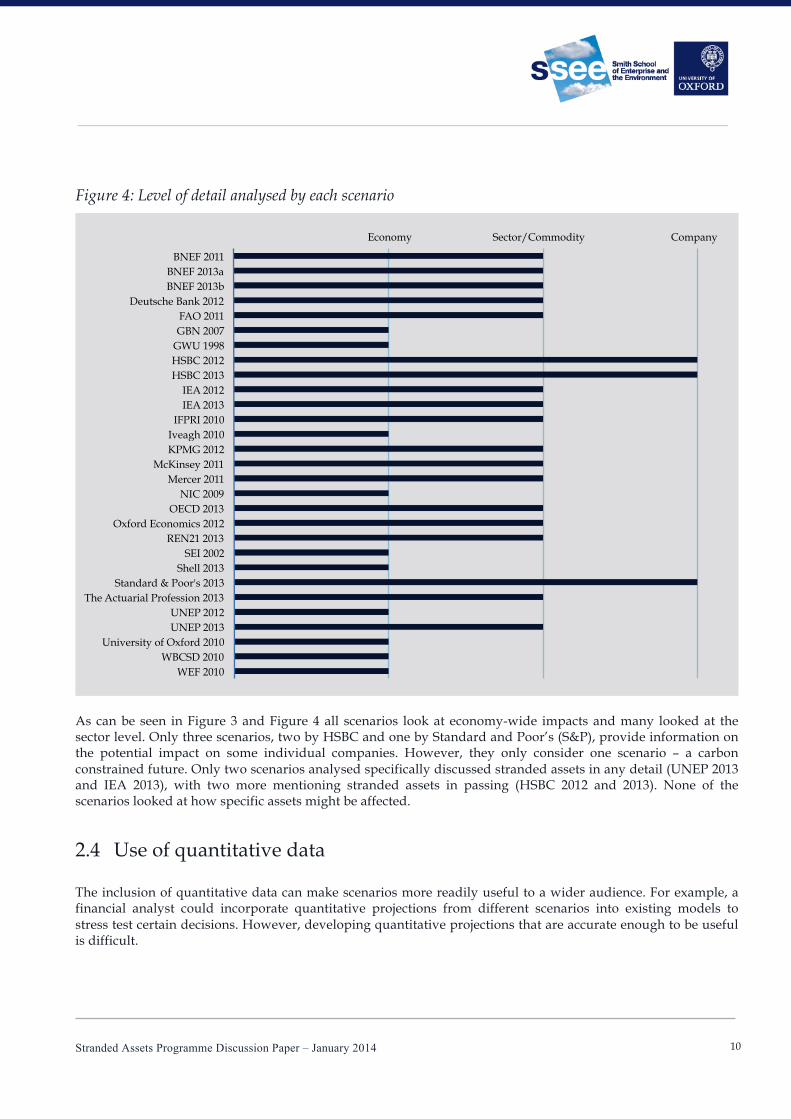
Figure 4: Level of detail analysed by each scenario
As can be seen in Figure 3 and Figure 4 all scenarios look at economy-wide impacts and many looked at the sector level. Only three scenarios, two by HSBC and one by Standard and Poor’s (S&P), provide information on the potential impact on some individual companies. However, they only consider one scenario – a carbon constrained future. Only two scenarios analysed specifically discussed stranded assets in any detail (UNEP 2013 and IEA 2013), with two more mentioning stranded assets in passing (HSBC 2012 and 2013). None of the scenarios looked at how specific assets might be affected.
2.4 Use of quantitative data
The inclusion of quantitative data can make scenarios more readily useful to a wider audience. For example, a financial analyst could incorporate quantitative projections from different scenarios into existing models to stress test certain decisions. However, developing quantitative projections that are accurate enough to be useful is difficult.
BNEF 2011 BNEF 2013a BNEF 2013b
Deutsche Bank 2012 FAO 2011 GBN 2007
GWU 1998 HSBC 2012 HSBC 2013
IEA 2012 IEA 2013
IFPRI 2010 Iveagh 2010 KPMG 2012
McKinsey 2011 Mercer 2011
NIC 2009 OECD 2013
Oxford Economics 2012 REN21 2013
SEI 2002 Shell 2013
Standard & Poor's 2013 The Actuarial Profession 2013
UNEP 2012 UNEP 2013
University of Oxford 2010 WBCSD 2010
WEF 2010
Economy Sector/Commodity Company
Stranded Assets Programme Discussion Paper – January 2014
11
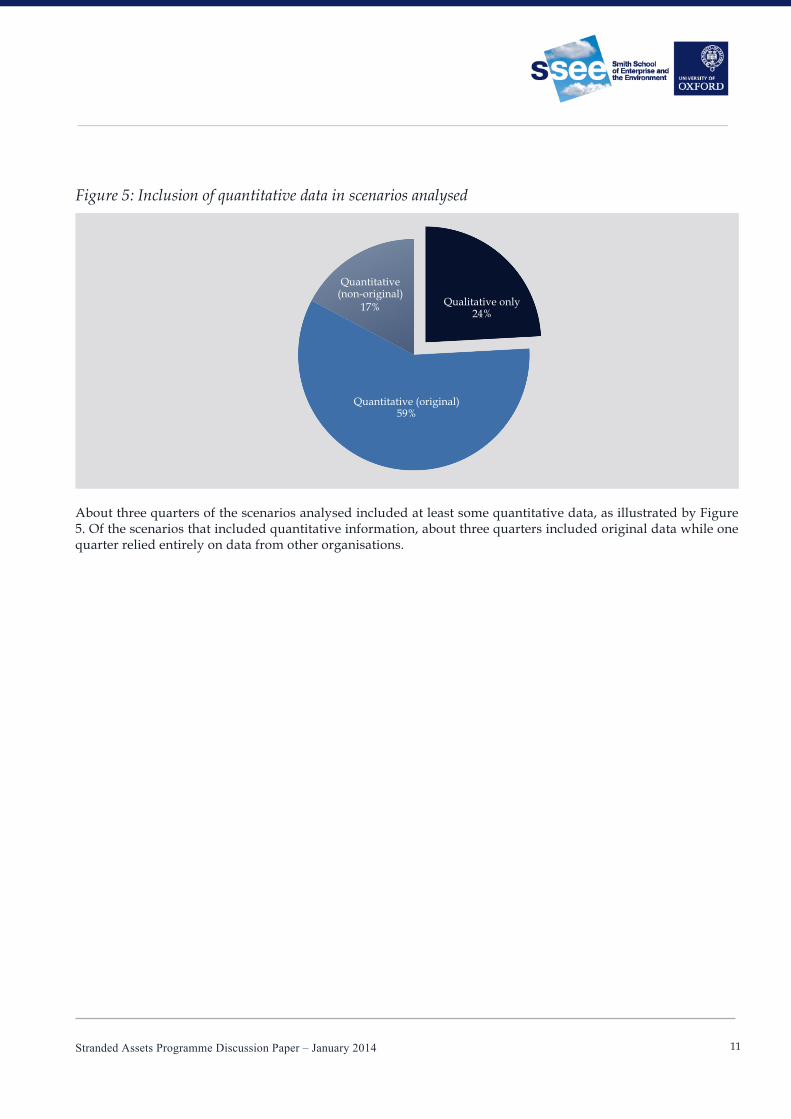
Figure 5: Inclusion of quantitative data in scenarios analysed
About three quarters of the scenarios analysed included at least some quantitative data, as illustrated by Figure 5. Of the scenarios that included quantitative information, about three quarters included original data while one quarter relied entirely on data from other organisations.
Qualitative only 24%
Quantitative (original) 59%
Quantitative (non-original)
17%
Stranded Assets Programme Discussion Paper – January 2014
12
2.5 Time horizons
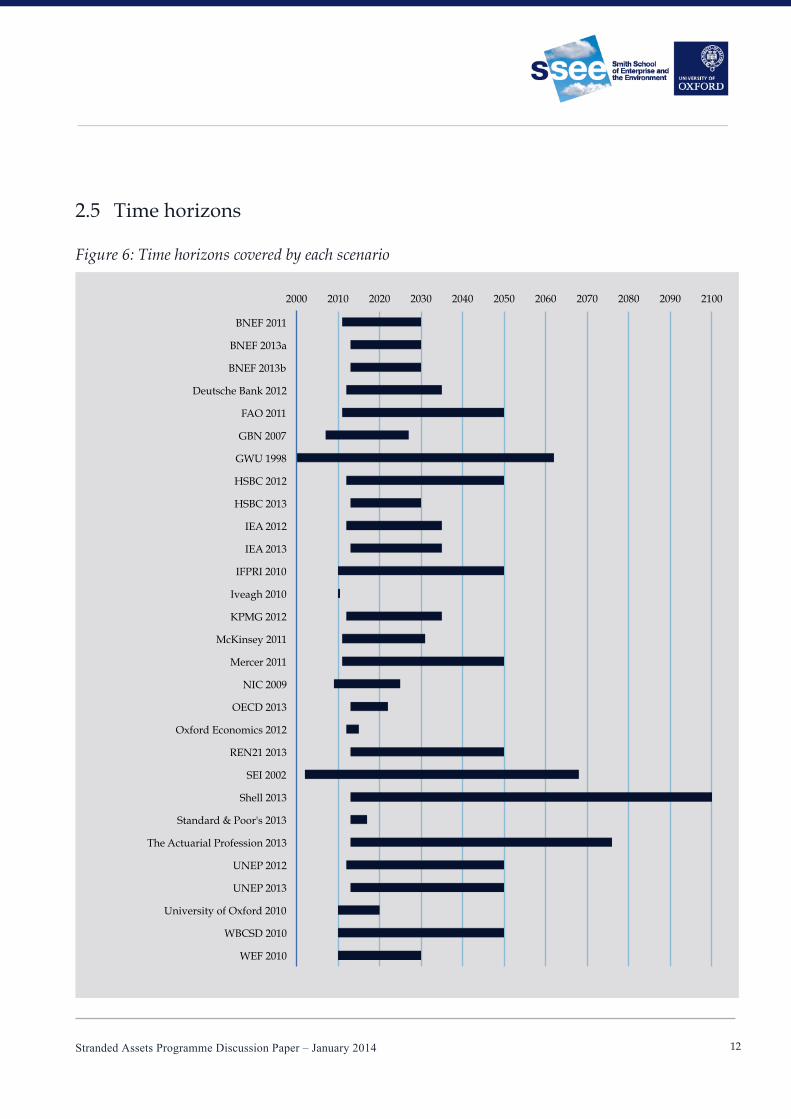
Figure 6: Time horizons covered by each scenario
2000 2010 2020 2030 2040 2050 2060 2070 2080 2090 2100
BNEF 2011
BNEF 2013a
BNEF 2013b
Deutsche Bank 2012
FAO 2011
GBN 2007
GWU 1998
HSBC 2012
HSBC 2013
IEA 2012
IEA 2013
IFPRI 2010
Iveagh 2010
KPMG 2012
McKinsey 2011
Mercer 2011
NIC 2009
OECD 2013
Oxford Economics 2012
REN21 2013
SEI 2002
Shell 2013
Standard & Poor's 2013
The Actuarial Profession 2013
UNEP 2012
UNEP 2013
University of Oxford 2010
WBCSD 2010
WEF 2010
Stranded Assets Programme Discussion Paper – January 2014
13
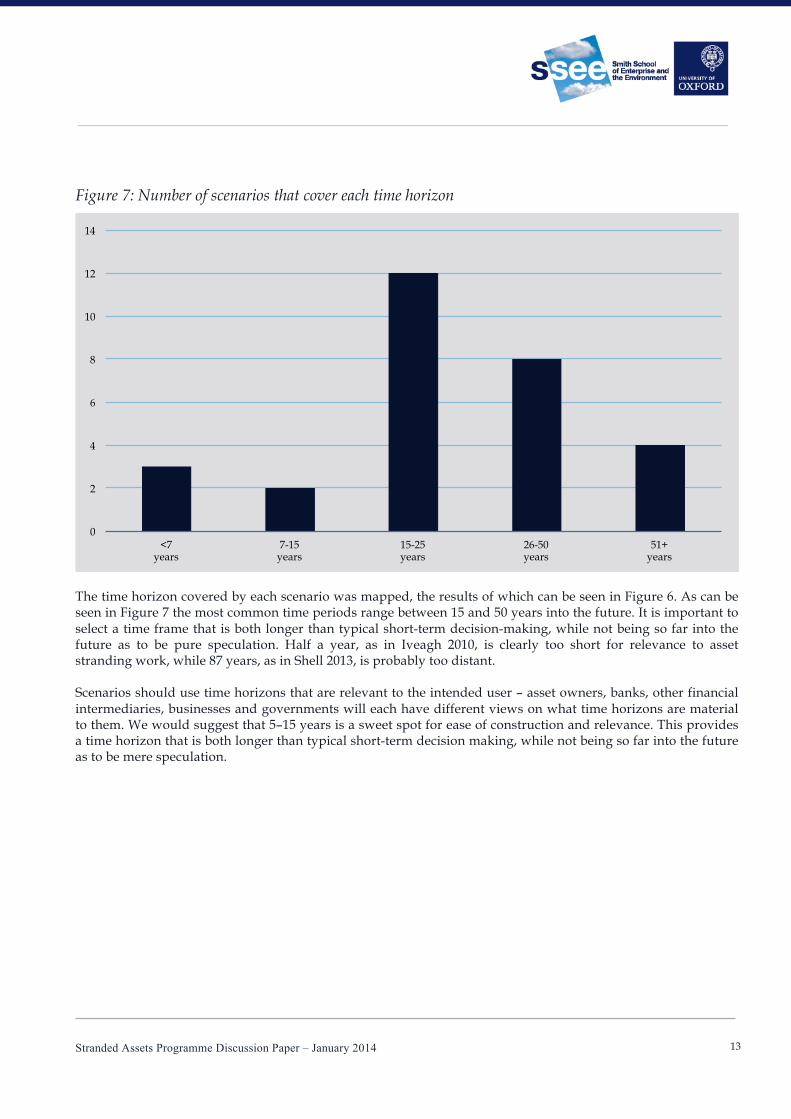
Figure 7: Number of scenarios that cover each time horizon
The time horizon covered by each scenario was mapped, the results of which can be seen in Figure 6. As can be seen in Figure 7 the most common time periods range between 15 and 50 years into the future. It is important to select a time frame that is both longer than typical short-term decision-making, while not being so far into the future as to be pure speculation. Half a year, as in Iveagh 2010, is clearly too short for relevance to asset stranding work, while 87 years, as in Shell 2013, is probably too distant. Scenarios should use time horizons that are relevant to the intended user – asset owners, banks, other financial intermediaries, businesses and governments will each have different views on what time horizons are material to them. We would suggest that 5–15 years is a sweet spot for ease of construction and relevance. This provides a time horizon that is both longer than typical short-term decision making, while not being so far into the future as to be mere speculation.
0
2
4
6
8
10
12
14
<7 years
7-15 years
15-25 years
26-50 years
51+ years
Stranded Assets Programme Discussion Paper – January 2014
14
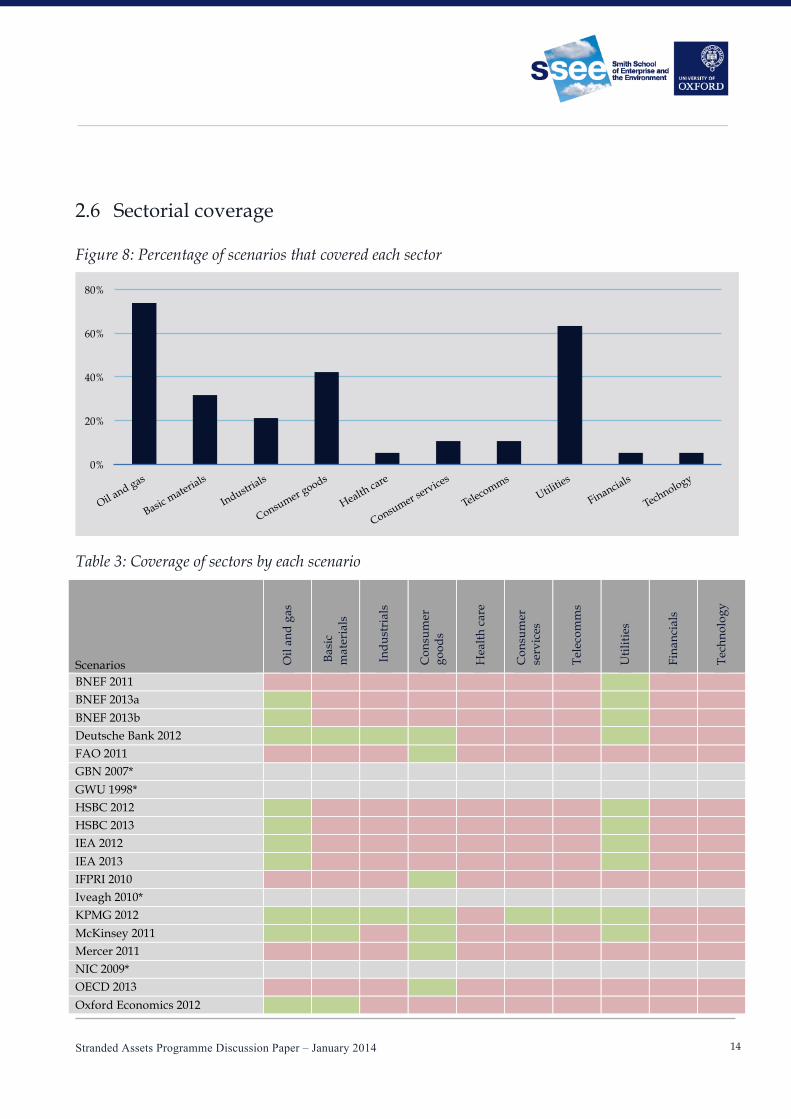
2.6 Sectorial coverage
Figure 8: Percentage of scenarios that covered each sector
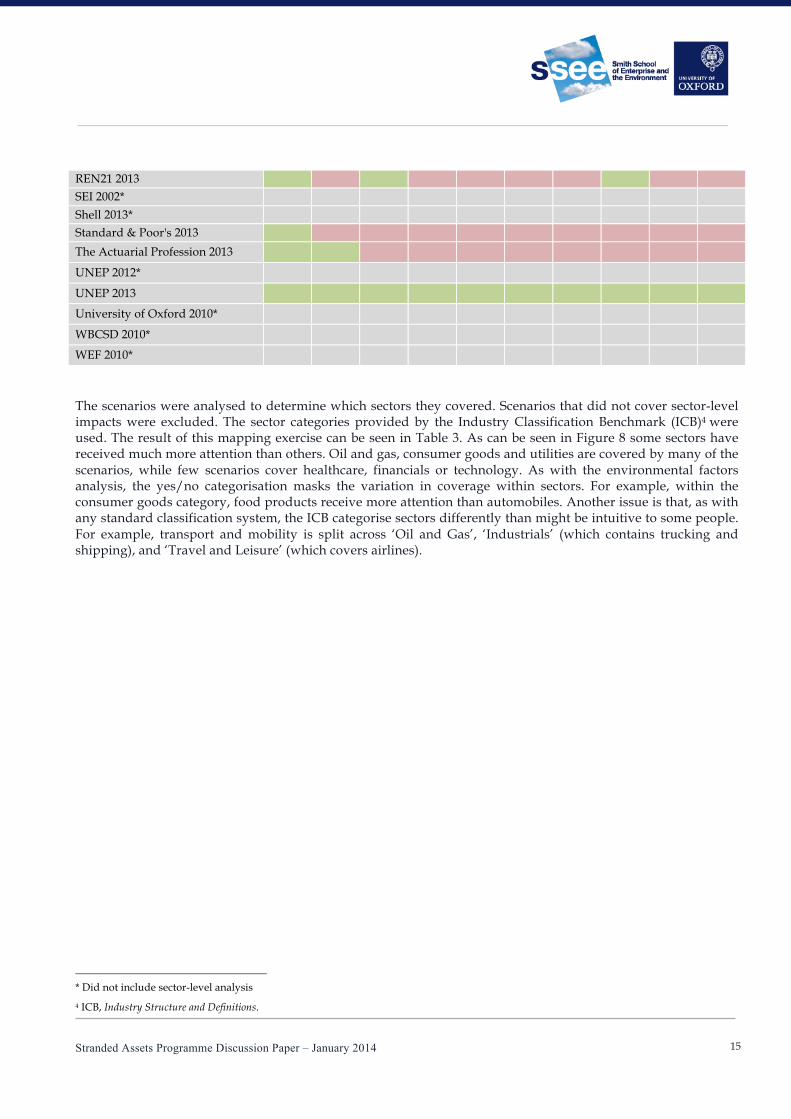
Table 3: Coverage of sectors by each scenario
Scenarios Oil
and
gas
Bas
ic
mat
eria
ls
Indu
stri
als
Con
sum
er
good
s
Hea
lth
care
Con
sum
er
serv
ices
Tele
com
ms
Uti
litie
s
Fina
ncia
ls
Tech
nolo
gy
BNEF 2011 BNEF 2013a BNEF 2013b Deutsche Bank 2012 FAO 2011 GBN 2007* GWU 1998* HSBC 2012 HSBC 2013 IEA 2012 IEA 2013 IFPRI 2010 Iveagh 2010* KPMG 2012 McKinsey 2011 Mercer 2011 NIC 2009* OECD 2013 Oxford Economics 2012
0%
20%
40%
60%
80%
Stranded Assets Programme Discussion Paper – January 2014
15
REN21 2013 SEI 2002* Shell 2013* Standard & Poor's 2013
The Actuarial Profession 2013
UNEP 2012*
UNEP 2013
University of Oxford 2010*
WBCSD 2010*
WEF 2010*
The scenarios were analysed to determine which sectors they covered. Scenarios that did not cover sector-level impacts were excluded. The sector categories provided by the Industry Classification Benchmark (ICB)4 were used. The result of this mapping exercise can be seen in Table 3. As can be seen in Figure 8 some sectors have received much more attention than others. Oil and gas, consumer goods and utilities are covered by many of the scenarios, while few scenarios cover healthcare, financials or technology. As with the environmental factors analysis, the yes/no categorisation masks the variation in coverage within sectors. For example, within the consumer goods category, food products receive more attention than automobiles. Another issue is that, as with any standard classification system, the ICB categorise sectors differently than might be intuitive to some people. For example, transport and mobility is split across ‘Oil and Gas’, ‘Industrials’ (which contains trucking and shipping), and ‘Travel and Leisure’ (which covers airlines).
* Did not include sector-level analysis
4 ICB, Industry Structure and Definitions.

Stranded Assets Programme Discussion Paper – January 2014
16
2.7 Comprehensiveness of existing scenarios
Figure 9: Comprehensiveness of existing scenarios
Existing scenarios offer some value for the identification of potential stranded assets, but leave much to be desired. Many scenarios use a time horizon appropriate for stranded assets analysis and most scenarios include at least some quantitative data. However, many sectors that could be at risk of stranded assets are not covered in sufficient detail. As can be seen in Figure 9, scenarios tend to score well on either depth or coverage, but not both. The largest number of scenarios covered a limited number of environment-related factors and provided analysis for only some sectors.
2.8 Analysis of selected scenarios
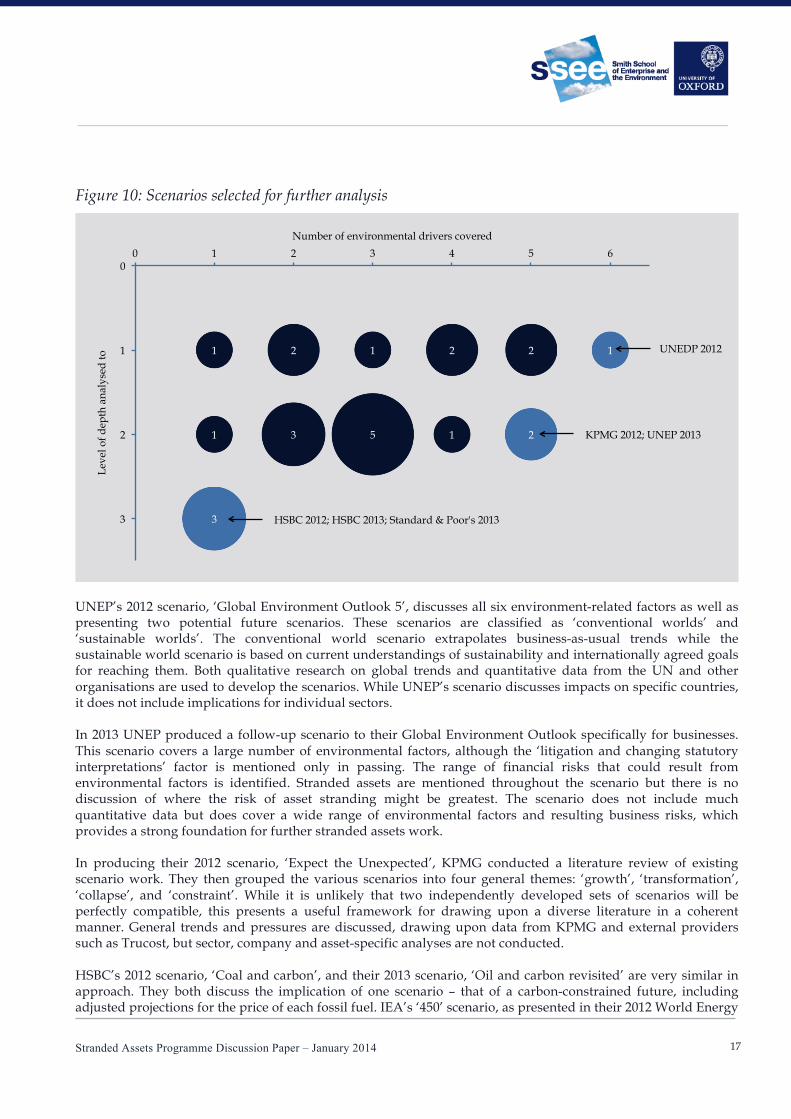
Six scenarios were chosen for further investigation (see Figure 10). For each scenario the core assumptions, contextual framing, data sources and implications were examined.
5
2 2 1 1
2
1 2
1
3
1 3
0
1
2
3
0 1 2 3 4 5 6
Leve
l of d
epth
ana
lyse
d to
Number of environmental drivers covered
Less comprehensive
More comprehensive
Key Number of reports
Stranded Assets Programme Discussion Paper – January 2014
17
Figure 10: Scenarios selected for further analysis
UNEP’s 2012 scenario, ‘Global Environment Outlook 5’, discusses all six environment-related factors as well as presenting two potential future scenarios. These scenarios are classified as ‘conventional worlds’ and ‘sustainable worlds’. The conventional world scenario extrapolates business-as-usual trends while the sustainable world scenario is based on current understandings of sustainability and internationally agreed goals for reaching them. Both qualitative research on global trends and quantitative data from the UN and other organisations are used to develop the scenarios. While UNEP’s scenario discusses impacts on specific countries, it does not include implications for individual sectors. In 2013 UNEP produced a follow-up scenario to their Global Environment Outlook specifically for businesses. This scenario covers a large number of environmental factors, although the ‘litigation and changing statutory interpretations’ factor is mentioned only in passing. The range of financial risks that could result from environmental factors is identified. Stranded assets are mentioned throughout the scenario but there is no discussion of where the risk of asset stranding might be greatest. The scenario does not include much quantitative data but does cover a wide range of environmental factors and resulting business risks, which provides a strong foundation for further stranded assets work. In producing their 2012 scenario, ‘Expect the Unexpected’, KPMG conducted a literature review of existing scenario work. They then grouped the various scenarios into four general themes: ‘growth’, ‘transformation’, ‘collapse’, and ‘constraint’. While it is unlikely that two independently developed sets of scenarios will be perfectly compatible, this presents a useful framework for drawing upon a diverse literature in a coherent manner. General trends and pressures are discussed, drawing upon data from KPMG and external providers such as Trucost, but sector, company and asset-specific analyses are not conducted. HSBC’s 2012 scenario, ‘Coal and carbon’, and their 2013 scenario, ‘Oil and carbon revisited’ are very similar in approach. They both discuss the implication of one scenario – that of a carbon-constrained future, including adjusted projections for the price of each fossil fuel. IEA’s ‘450’ scenario, as presented in their 2012 World Energy
5
2 2 1 1
2
1 2
1
3
1 3
0
1
2
3
0 1 2 3 4 5 6
Leve
l of d
epth
ana
lyse
d to
Number of environmental drivers covered
UNEDP 2012
KPMG 2012; UNEP 2013
HSBC 2012; HSBC 2013; Standard & Poor's 2013
Stranded Assets Programme Discussion Paper – January 2014
18
Outlook, is adopted. This scenario assumes that governments will meet their international commitments to limit the concentration of greenhouse gases in the atmosphere to 450 parts per million, resulting in a 50% chance of limiting global warming to 2°C. Much of the analysis is based on the idea of ‘unburnable carbon’ recently taken forward by the Carbon Tracker Initiative and drawing on the ‘carbon budget’ work originally conducted by Krause et al (1989).5 According to the Carbon Tracker Initiative less than 40% of existing proven fossil fuel reserves can be burnt if there is to be a 50% chance of limiting warming to 2°C.6 HSBC draws heavily upon internal intelligence as well as data from Wood Mackenzie to identify the exposure of different companies to the risk of unburnable carbon and lower fossil fuel prices. Standard & Poor’s 2013 scenario, ‘What A Carbon-Constrained Future Could Mean For Oil Companies' Creditworthiness’ also analyses the single scenario of concerted climate change mitigation, including what that means for the price of oil. While S&P too refer to the IEA’s 450 scenario, it is less emphasised than in the HSBC work. While the HSBC scenario focused on the implications for the valuation of companies, the S&P scenario focuses on potential impacts on credit ratings of oil and gas companies.
5 Krause, Bach, and Koomey, Energy Policy in the Greenhouse.
6 Carbon Tracker, Unburnable Carbon: Australia’s Carbon Bubble.
Stranded Assets Programme Discussion Paper – January 2014
19
3 Conclusion Environment-related factors are already stranding assets in different sectors of the economy. This trend looks to be accelerating, which could represent a major discontinuity, able to profoundly alter asset values across the global economy. Scenario analysis can help a variety of stakeholders, including investors, firms, regulators and policy makers, to understand how this might happen and it can help them develop strategies to manage risk and grasp potential opportunities. In this high-level discussion paper we have suggested four elements that could make scenarios analysis more relevant for understanding the environment-related factors that could strand assets over time. These are four-fold: appropriate coverage of environment-related factors; greater granularity and specificity; a sound quantitative foundation; and time horizons relevant to the end-user. While it is the case that trade-offs will have to be made in any scenario analysis, especially between the coverage of factors and the level of granularity, from our review of the current literature we find that very few existing scenarios get the balance right. As new scenarios are commissioned that aim to incorporate stranded asset risks it will be critically important for this to be addressed. We hope that the framework set out here provides commissioners with some of the concepts and guidance necessary to help ensure this is done effectively.
Stranded Assets Programme Discussion Paper – January 2014
20
4 References Bloomberg New Energy Finance (BNEF). Energy Forecasts for 2030 and beyond, 2013. ———. Global Renewable Energy Outlook, 2011. ———. Global Renewable Energy Outlook, 2013. Carbon Tracker. Unburnable Carbon 2013: Wasted Capital and Stranded Assets, 2013. Deutsche Bank. Investing in Climate Change 2012 – A Strategic Asset Allocation Perspective, 2012. Food and Agriculture Organization of the United Nations (FAO). Global Livestock Production Systems, 2011. George Washington University (GWU). The GWU Forecast of Emerging Technologies, 1998. Global Business Network (GBN). Acting on Climate Change: A Strategic Workshop for Business Leaders, 2007. HSBC. Coal and Carbon, 2012. ———. No Water, No Power: Is There Enough Water to Fuel China’s Power Expansion?, September 2012. ———. Oil and Carbon Revisited, 2013.
ICB. Industry Structure and Definitions, 2012. http://www.icbenchmark.com/ICBDocs/Structure_Defs_English.pdf.
IEA. Redrawing the Energy-Climate Map, June 10, 2013. http://www.iea.org/publications/freepublications/publication/WEO_RedrawingEnergyClimateMap.pdf.
———. World Energy Outlook, 2012. http://www.worldenergyoutlook.org/publications/weo-2012/. International Food Policy Research Institute (IFPRI). Food Security, Farming, and Climate Change to 2050, 2010. Iveagh. Global Investment Strategy & Global Scenario Analysis, 2010. KPMG. Expect the Unexpected, 2012. Krause, Florentin, Wilfrid Bach, and Jon Koomey. Energy Policy in the Greenhouse: From Warming Fate to Warming
Limit. Routledge, 2013. http://www.law.stanford.edu/publications/from-warming-fate-to-warming-limit-benchmarks-to-a-global-climate-convention.
McKinsey Global Institute. Resource Revolution: Meeting the World’s Energy, Materials, Food, and Water Needs, 2011.
Mercer, Carbon Trust, and International Finance Corporation. Climate Change Scenarios – Implications for Strategic Asset Allocation, 2011.
National Intelligence Council (NIC). Global Scenarios to 2025, 2009.
Organisation for Economic Co-operation and Development (OECD), and Food and Agriculture Organization (FAO). Agricultural Outlook, 2012.
Oxford Economics. Global Investment Strategy, 2012. REN21. Renewable Global Futures Report. Paris, 2013. Royal Dutch Shell. New Lens Scenarios, 2013.
Smith School of Enterprise and the Environment. Stranded Assets and the Fossil Fuel Divestment Campaign: What Does Divestment Mean for the Valuation of Fossil Fuel Assets?, 2013.
———. Stranded Down Under? Australian Coal, Its Dependency on China and Future Drivers of Asset Stranding, 2013.
Standard & Poor’s Financial Services. What a Carbon-Constrained Future Could Mean for Oil Companies Creditworthiness, 2013.
Stockholm Environment Institute (SEI). Integrated Scenarios, 2002. The Actuarial Profession. Resource Constraints: Sharing a Finite World, January 17, 2013. United Nations Environment Programme (UNEP). GEO-5 Environment for the Future We Want, 2012.
Stranded Assets Programme Discussion Paper – January 2014
21
———. Global Environmental Outlook 5 for Business, 2013. University of Oxford. The Oxford Scenarios: Beyond the Financial Crisis, 2010.
Wilkinson, Angela, Roland Kupers, and Diana Mangalagiu. ‘How Plausibility-Based Scenario Practices Are Grappling with Complexity to Appreciate and Address 21st Century Challenges.’ Technological Forecasting and Social Change 80, no. 4 (May 2013): 699–710. doi:10.1016/j.techfore.2012.10.031.
World Business Council for Sustainable Development (WBCSD). Vision 2050, 2010. World Economic Forum (WEF). Mining and Metals - Scenarios to 2030, 2010.