STRAND ASSOCIATES STUDY - semspub.epa.gov · city of eau claire, wisconsin pilot process studies...
54
-•- 141 STRAND ASSOCIATES. INC R N G I . J IT T H ia 91O West Wingra Drive Madiscn, Wisconsin 53715 (6O8) 251-4843 July 10, 1985 City of Eau Claire City Hall Eau Claire, WI 54701 Attention: Mr. Michael T. Cousino, P.E. Director of Public Works RE: Eau Claire Report on Pilot Process Studies for Water Treatment Alternatives Dear Mr. Cousino: With this letter, we are submitting Volumes 1 and 2 of the report, "Pilot Process Studies for Water Treatment Alternatives". These documents describe the results of the pilot process studies which were performed in the fall and winter of 1984. Volume 1 pertains to the removal of volatile organic compounds, in Eau Claire's drinking water; Volume 2 pertains to the removal of iron and manganeese. We wish to express our appreciation to members of the city staff who assisted in the work, especially to Don Goshaw and Ron Clish who operated the pilot plant and collected data. We would be happy to meet with you to discuss these reports at your convenience Sincerely, STRAND ASSOCIATES, INC. Philip E. Budde, P.E. PHB/AC/tam Enclosure
Transcript of STRAND ASSOCIATES STUDY - semspub.epa.gov · city of eau claire, wisconsin pilot process studies...

- • - 1 4 1STRANDASSOCIATES. INCR N G I . J IT T H ia
91O West Wingra DriveMadiscn, Wisconsin 53715(6O8) 251-4843July 10 , 1985
City of Eau Cla i r eCity Ha l lEau Cla i r e , WI 54701Attent ion: Mr. Michael T. Cous i no , P .E .Director of Publ i c WorksRE: Eau Cla i r e Report on Pilot Process Studies
for Water Treatment Alternat ivesDear Mr. Cous i no :With this letter, we are submitt ing Volumes 1 and 2 of the report, "PilotProcess Studies for Water Treatment Al ternat ive s " . These documents describethe results of the pilot process studies which were performed in the falland winter of 1984. Volume 1 pertains to the removal of volat i le organiccompounds, in Eau Cla i r e ' s dr ink ing water; Volume 2 pertains to the removalof iron and manganeese.We w i s h to express our appreciat ion to members of the city staff who ass istedin the work, especial ly to Don Goshaw and Ron Cl i s h who operated the pilotplant and collected data.We would be happy to meet with you to discuss these reports at your convenienceSincerely,STRAND ASSOCIATES, INC.
Phi l i p E. Budde, P . E .PHB/AC/tamEnclosure

CITY OF EAU CLAIRE , W ISCONS INPILOT PROCESS STUDIES FOR WATER TREATMENT ALTERNATIVES
VOLUME 1: FACILITIES FOR VOLATILE ORGANIC COMPOUNDS REMOVAL
STRAND ASSOCIATES, INC .Consul t ing Engineers910 West Wingra Dr iveMadison, Wiscons i n 53715
JULY , 1985

TABLE OF CONTENTS
Page No.SECTION 1 - DESCRIPT ION OF PILOT STUDY
1 .01 I N T R O D U C T I O N . . . . . . . . . . . . . . . . . . . . . . . . . . . . . . . . . . . . . . . . . . . . . 1 - 11 .02 DESCRIPTION OF AERATION T O W E R . . . . . . . . . . . . . . . . . . . . . . . . . . . . 1-1
SECTION 2 - DESIGN Of; EXPERIMENT2.01 TOWER H Y D R A U L I C S . . . . . . . . . . . . . . . . . . . . . . . . . . . . . . . . . . . . . . . . . 2- 12.02 GOAL OF E X P E R I M E N T . . . . . . . . . . . . . . . . . . . . . . . . . . . . . . . . . . . . . . . 2-1
SECTION 3 - RESULTS OF THE PILOT STUDY3.01 RAW D A T A . . . . . . . . . . . . . . . . . . . . . . . . . . . . . . . . . . . . . . . . . . . . . . . . . 3-13.02 ACTUAL TOWER O P E R A T I O N . . . . . . . . . . . . . . . . . . . . . . . . . . . . . . . . . . . 3-23.03 HENRY 'S LAW CONSTANTS AND MASS TRANSFER COEFF IC I ENTS . . . . . 3-33.04 TOWER SCALE-UP AND E C O N O M I C S . . . . . . . . . . . . . . . . . . . . . . . . . . . . . 3-43.05 STAGE 4 T E S T I N G . . . . . . . . . . . . . . . . . . . . . . . . . . . . . . . . . . . . . . . . . . 3-63.06 MEETING HEALTH ADVISORY L IM I TS . . . . . . . . . . . . . . . . . . . . . . . . . . . 3-63 .07 C H L O R O F O R M . . . . . . . . . . . . . . . . . . . . . . . . . . . . . . . . . . . . . . . . . . . . . . . 3 -6
SECTION 4 - RECOMMENDATIONS FOR TOWER D E S I G N . . . . . . . . . . . . . . . . . . . . . . . . .4-1
APPENDIX A - PILOT STUDY DATA
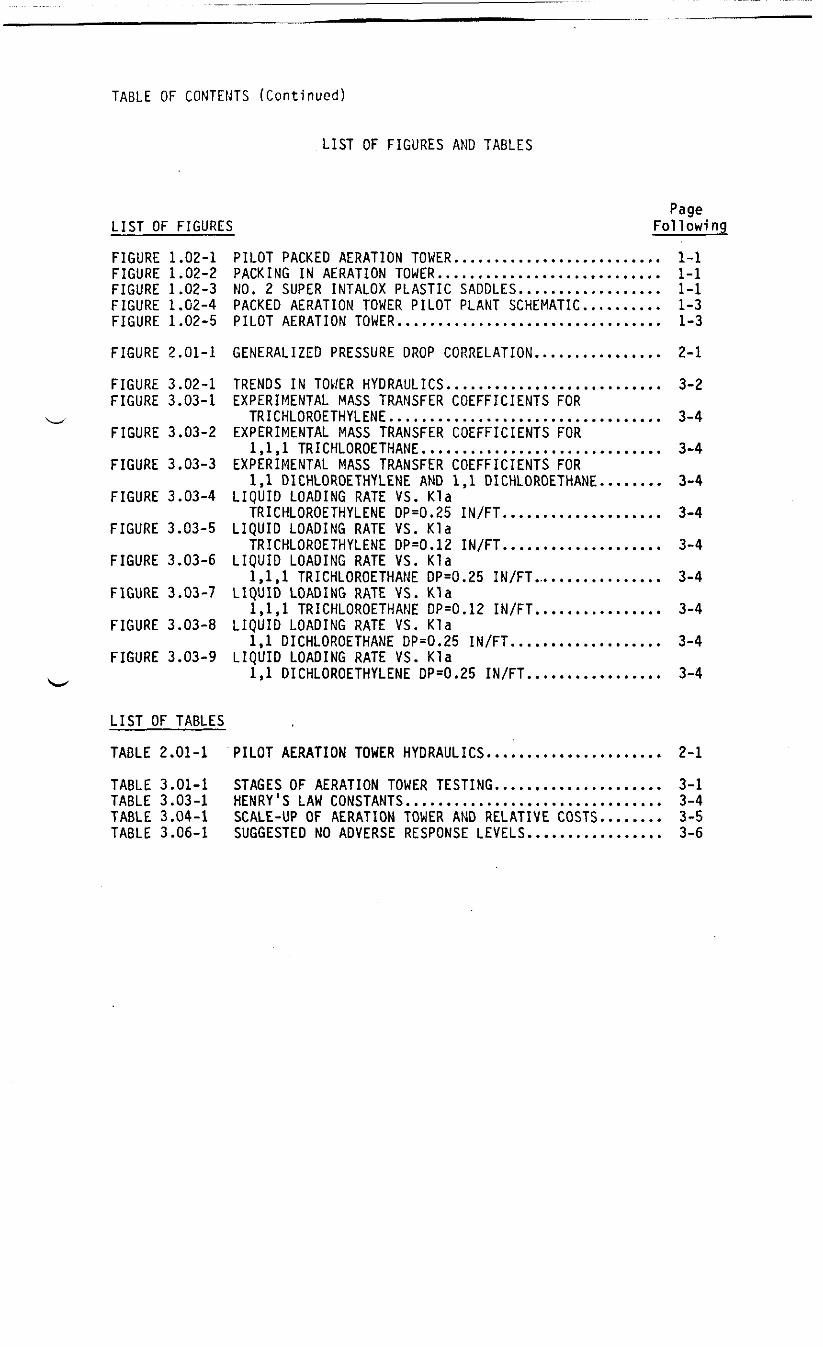
TABLE OF CONTENTS (Con t i n u ed )
LIST OF FIGURES AND TABLES
LIST OF F IGURESPageFollowing
FIGURE 1 .02-1 PILOT PACKED AERATION T O W E R . . . . . . . . . . . . . . . . . . . . . . . . . . 1-1F IGURE 1 .02-2 PACKING IN AERATION T O W E R . . . . . . . . . . . . . . . . . . . . . . . . . . . . 1 - 1FIGURE 1 .02-3 NO. 2 SUPER INTALOX PLASTIC S A D D L E S . . . . . . . . . . . . . . . . . . 1 - 1FIGURE 1 .02-4 PACKED AERATION TOWER PILOT PLANT SCHEMAT IC . . . . . . . . . . 1-3FIGURE 1 .02-5 PILOT AERATION T O W E R . . . . . . . . . . . . . . . . . . . . . . . . . . . . . . . . . 1 -3FIGURE 2 .0 1 - 1 GENERALIZED PRESSURE DROP C O R R E L A T I O N . . . . . . . . . . . . . . . . 2- 1FIGURE 3 .02- 1 TRENDS IN TOWER H Y D R A U L I C S . . . . . . . . . . . . . . . . . . . . . . . . . . . 3-2FIGURE 3 .03-1 EXPERIMENTAL MASS TRANSFER COEFFICIENTS FOR
T R I C H L O R O E T H Y L E N E . . . . . . . . . . . . . . . . . . . . . . . . . . . . . . . . . . 3-4FIGURE 3 .03-2 EXPERIMENTAL MASS TRANSFER COEFFICIENTS FOR
1 , 1 , 1 T R I C H L O R O E T H A N E . . . . . . . . . . . . . . . . . . . . . . . . . . . . . . 3-4FIGURE 3 .03-3 EXPERIMENTAL MASS TRANSFER COEFFICIENTS FOR
1,1 DICHLOROETHYLENE AND 1,1 D ICHLOROETHANE . . . . . . . . 3-4FIGURE 3 .03-4 L IQU ID LOADING RATE VS. Kla
TRICHLOROETHYLENE DP =0 .25 I N /FT . . . . . . . . . . . . . . . . . . . . 3-4FIGURE 3 .03-5 L IQU ID LOADING RATE VS. K la
TRICHLOROETHYLENE DP =0 . 1 2 I N /FT . . . . . . . . . . . . . . . . . . . . 3-4FIGURE 3 .03-6 L IQUID LOADING RATE VS. Kla
1 , 1 , 1 TRICHLOROETHANE DP=0 .25 I N /FT . . . . . . . . . . . . . . . . . 3-4FIGURE 3.03-7 LIQUID LOADING RATE VS. Kla
1 , 1 , 1 TRICHLOROETHANE DP =0 . 12 I N / F T . . . . . . . . . . . . . . . . 3-4FIGURE 3 .03-8 L IQU ID LOADING RATE VS. K la
1 , 1 DICHLOROETHANE DP=0 .25 I N / F T . . . . . . . . . . . . . . . . . . . 3-4FIGURE 3 .03-9 L IQU ID LOADING RATE VS. Kla
1 , 1 DICHLOROETHYLENE DP=0 .25 I N/FT . . . . . . . . . . . . . . . . . 3-4
LIST OF TABLESTABLE 2 .01- 1 PILOT AERATION TOWER H Y D R A U L I C S . . . . . . . . . . . . . . . . . . . . . . 2-1TABLE 3 .01- 1 STAGES OF AERATION TOWER T E S T I N G . . . . . . . . . . . . . . . . . . . . . 3-1TABLE 3 .03- 1 HENRY'S LAW C O N S T A N T S . . . . . . . . . . . . . . . . . . . . . . . . . . . . . . . . 3-4TABLE 3.04-1 SCALE-UP OF AERATION TOWER AND RELATIVE C O S T S . . . . . . . . 3-5TABLE 3 .06- 1 SUGGESTED NO ADVERSE RESPONSE L E V E L S . . . . . . . . . . . . . . . . . 3-6

1- 1SECT ION 1
DESCR IPT ION OF P I LOT STUDY
1 .01 INTRODUCTION
In response to the discovery of vo lat i l e organic compounds (VOCs ) in thedr ink ing water supply of Eau Cla i r e , a pi lot study for the treatment of thewater was performed dur ing the Fa l l of 1984. The treatment process chosenfor the removal of VOCs was a packed aerat ion tower. This process was selectedafter a l i t erature search and theoretical design proved it to be the mosteconomical and best suited technology out of all fully developed technologiesava i lab l e for VOC removal. A d i scuss ion is found in the May, 1984, report,"City of Eau Claire: Report on Water Treatability" by Strand Associates.
1 .02 DESCRIPTION OF AERATION TOWER
The aeration tower and accessory equipment were rented from the General FilterCompany of Ames, Iowa. The tower was or ig inal ly designed by General Fi l terto remove carbon dioxide or hydrogen sulfide by aeration. For the removal ofVOCs , Strand Assoc iates and General F i l t er worked together to modify theequipment. Tower features that wil 1 be discussed in this sect ion aredisplayed in Figure 1 .02-1 .
The tower was constructed of 3/16 inch thick aluminum. It had an overallheight of 14 feet and a 21 inch square cross-sect ion.
The tower packing was chosen to be 2" polypropylene Super Inta lox Saddlesfrom the Norton Company (Figure 1 .02-2 ) . It was felt that th is pack ing wouldbest fit Eau Cla i r e ' s s ituat ion of needing to remove relatively low concentra-t ions of VOCs from a great quant ity of water. In th i s case, the l iquidloading rate takes on greater importance than the removal efficiency. Figure1 .02-3 represents the character ist ics of the saddles with data provided bythe Norton Company. Depth of pack ing in the tower was 9 feet 4 inches.
Since a h igh l iqu id load ing rate was expected, a l iquid d i s tr ibutor wasrequi red to carry a relatively large fl ow. General Filter provided four

over
AEXAWff SIDE SMEtt,21 MCN $0(/A#£ tffttf SSCCr/Qtf, /* /*•£?•#/£#
SftMftC 7XPWDXC$SM*£ T( TTf> OFS)
2TCX.WQPnE.NESADDLES.C&M£CT€£> TV
/. ' I
^**- Bt&CHM
,-^ Ot/TtETFQX/XQZZMOVA
FIGURE 1 .02-1EAU CLAIRE VOC REMOVAL
PILOT PACKED AERATION TOWERSTRAIMO

FIGURE 1 .02 -2EAU CLAIRE VOC REMOVAL
PACKING IN AERATION TOWER
PlasticSUPER INTALOX®
NORTON COMPANY

FIGURE 1 .02 -3EAU CLAIRE VOC REMOVAL
NO. 2 SUPER INTALOX PLASTIC SADDLES
Column diameter. . . . . . . .30 inchesPacking h e i g h t . . . . . . . . 10 feetPacking factor. . . . . . . .2 1Liquid rate. . . . . . . . Ibs./ft.3/hr. as parameterGas rate. . . . . . . .900 lbs./ft.3/hr.Gas c o n c e n t r a t i o n . . . . . . . . Ln mean 1 %Liquid concentration. . . . . . . .4% NaOHLiquid temperature. . . . . . . .75°FCarbonate content. . . . . . . .25%Pressure drop. . . . . . . . Inches water/ft, packing
PRESSURE DROP VS GAS RATE
40O 6OO MXX) 2000A« MASS VELOCITY-LSS/FT.'. HH.
4.000 6.00O
011000 5,000 10.000
LWWO RATE—LBS/FT* .HR.50000 £0.000 1.000 5,QOO
LOUD MTf - LBS ./ 'T ' , HN.10,000 to.ooo
SOURCE: NORTON COMPANY

1 -2
nozz l e s pos i t ioned at ob l i que ang les to a p ipe above the pa c k i n g . The inf luentl ine teed into the center of this l i near d i s t r ibutor . Tower in terna l s thatwere not modif ied from the ex i s t i ng tower were an a luminum media support tray,baffles on two sides of the tower projecting 2 1/2 inches into the media andspaced every 2 feet, a mist e l iminator above the l iqu id d i s tr ibutor , and airbaffles below the med ia .
Sample taps were pos it ioned along the tower at the bottom of the pack i ng , atthe top of the packing, and at three equally spaced positions between. Thetaps cons i s ted of a threaded connector and stop cock with a teflon tubing con-nect ion . Another stop cock was located at the end of the tub ing to thrott lethe sample flow and prevent air from enter ing . A funnel at the center ofthe tower with in the media was attached to the connector at each samplepoint.
Pressure taps were a lso placed at the sample tap pos i t ions . They a lsocons isted of a stop cock and connect ing tub ing . Here, the tubing looped intoa manometer fi l led with antifreeze. The manometer could be connected to anytwo taps at a time in order to record the differential pressure between thosepoints in the pack ing .
The air blower was located on a platform at the side of the aerator. Ac ircular duct connected the blower to the top of the tower. A flow meterwas positioned to indicate the air flow rate through the duct.
Two pumps were avai lable to service the tower. One pump was situated in theNorth clarlfier at the exist ing Iron and manganese removal plant where waterfrom the North well field was obtained. South well field water was obta inedfrom a pump located in the influent well of the existing South clarifier.Flows from the North, South, or combined well fields were measured by a meteron the tower's inf luent l ine and by a rotameter on the discharge l ine of theSouth well f ie ld pump. The p ip ing conf igurat ion ' i s shown 1n Figure 1 .02-4. Itis also seen that the tower is connected upstream of an iron and manganeseremoval pilot plant, a study which went on simutaneously to the aeration study.

FIGURE 1 .02-4EAU CLAIRE VOC REMOVAL
PACKED AERATION TOWER PILOT PLANT SCHEMATIC
SLOW M£T£#
-f&0r
MOXTtj
O
O Z
n
TO
BTRAIMOABBOClATtB IMC

1 - 3
Water samples were analyzed u s i ng a gas chroroatograph owned by the City ofEau Cla i re .
A photograph of the pi lot aeration tower is shown in Figure 1 .02 -5 .

SECTION 2DESIGN OF EXPERIMENT
2 .01 TOWER HYDRAULICS
The des ign of the tower and of the tests to be run on the tower were based onhydraulic cons iderat ions. From literature, suitable ranges of air pressuredrop over the packing and air to water ratios are known. For pressure drop,the most economical operation of an aeration tower in most cases is at 0 . 2 5inches of water per foot of packing; in some cases, it is 0 . 5 0 . Effect iveand economic volumetric air to water ratios for VOC removal are found to bebetween 10 and 30. With these parameters in mind, the generalized pressuredrop correlation shown in Figure 2 .0 1 ^ 1 was uti l ized. This correlation wasfirst developed in 1938 and later modif ied in the 1950 ' s . It has become astandard tool for packed towers in the chemical process industry. The graphrelates gas and l iquid loading rates, gas and l iquid densit ies, l iquid viscos-ity, air pressure drop, and an empirical factor representing the character-ist ics of the packing. From this graph, air and water flowrates a long withcorresponding air pressure drop are obtained. Table 2.01- 1 lists thesepoints of interest derived from the graph. Flowrates for an air pressuredrop of 0 . 1 2 inch of water per foot of packing are also shown in this tablebecause they were used in the actual experiment.
2 .02 GOAL OF EXPERIMENT
The goal of the overall experiment was to gather data in order to calculatethe mass transfer coefficients of VOC removal at each point of hydraulicinterest. With mass transfer coefficients, a full scale tower can be definedat each point and compared to the other hydraulic s ituat ions. In this way,an optimum tower design in terms of effic iency and economics can be defined.

FIGURE 2 .0 1 - 1EAU CLAIRE VOC REMOVAL
GENERALIZED PRESSURE DROP CORRELATION
a.c-r><"b
o
Approximate/ Hooding
0.002
0.0010.01
Figure 634 Flooding and pressure drop in random-packed towers. For SI units gc «• I, C, frorrTable 6.3, and use J * 1. For (/' - lb/ft2 • h, p - lb/ft3, - cP, gc - 4.18 X I08, Cf from Table6.3, and use J =• 1.502. [Coordinates of Eckert [38], Chemical Process Products Division, Norton Co.]
SOURCE: TREYBAL, MASS TRANSFER OPERATIONS. 1 9 8 0

TABLE 2 .0 1 - 1EAU CLA IRE VOC REMOVAL
PILOT AERATION TOWER HYDRAUL ICS
* * * A/W(VOL/VOL)
1015202530
0 . 12
*278/203326/163386/144431/ 130455/1 14
* *AIR DP( IN H20/FT)
0 .25
338/253415/207489/183565/169588/147
0 .50
346/259484/242588/221653/196692/173
* CFM AIR/GPM WATERBased on a CROSS-SECTIONAL AREA of 3 .063 sq ft
* * AIR PRESSURE drop In Inches of water per foot of pack ing depth*** A/W = volumetr ic air to water rat io

3- ]
SECT ION 3RESULTS OF THE PILOT STUDY
3.01 RAW DATA
Table 3 .0 1 - 1 descr ibes the parameters used in four stages of aerat ion towertests. Raw data from these stages are shown in Appendix A. The data, arrangedby VOC, i n c l ude s :
a. 1,1 Dichloroethyleneb. 1 , 1 Dich loroethanec. 1 , 1 , 1 Trichloroethaned. Trich loroethylenee. Chloroform
Information essential to each test includes:a. Stage and date of test ingb. Taps sampledc. Run Numberd. Water flowrate in gpme. Air flowrate in cfmf. Air to water volumetric ratio in CFM air flow to CFM water flowg. Air pressure drop over the pack ing in inches of water per foot
of packing derived from the pressure drop correlation,h. Influent concentrat ion of VOC in ppbi. Effluent concentration of VOC in ppbj. Percent removal of VOC
The influent water temperature for all tests ranged between 9 and 10 deg. C.Change in water temperature through the tower was not significant.
Ambient air temperature ranged between 5 and 7 deg. C for November 6, 7 and1 1 . 5 deg. C for Nov 7, 3 to 10 deg. C for November 24, 5 to 7 deg. C forDecember 28, and -4 deg. C for January 24.
Wells in operation to the tower for Stages 1 ,2 , and 3 were the North FieldWe l l s of 11 , 15, 17. For Stage 4, some tests were run w i th an add i t iona lflow from the South Field Wel l s of 4, 12, and 13.

cTABLE 3.01- 1
EAU CLAIRE VOC REMOVALSTAGES OF AERATION TOWER TESTING
Stage DateAir Pressure
Drop ( I n .H20/ft ) Vol . A/W Sample Taps Well Field Purpose1 11/6/84 0.25 5,10,15,20,25 Influent Pipe (0) North
Base of Packing (5)
1 11/7/84 0.25 5,10, 15,20,25 Below Top of Packing (2) NorthBase of Packing (5)
Start-upPrel iminary
Test ing
Prel iminaryTest ing
11/7/84 0. 12 ,0 .25 15 ,20,30,35 Below Top of Packing (2)Base of Packing (5)
North Collect Datato find
Optimum Poi nt
12/28/84 0 . 12 ,0 .25 10 , 15 ,20 ,30 ,35 Below Top of Packing (2) NorthBase of Pack ing (5)
ConfirmPreviousTests
01/24/85 0.25 20 All Taps except at top Northof packing (0, 2, 3, 4, South5)
Test OptimumCond i t ion at Var i ou s
Flow Schemes ;Obta i n VOC
ConcentrationProf i l e s

3-2
3 .02 ACTUAL TOWER OPERAT ION
A. Hydraul ics
In the operat ion of the pi lot tower, the manometer showed a h igher pres suredrop over the pack ing than expected from the genera l ized pressure dropcorrelation. Consultation with standard chemical engineering textbooks andwith the Norton Company, who suppl ied the pack ing , confirmed that the genera l-ized pressure drop corre lat ion can be used with conf idence with in about 10%.It was conf irmed that th is increase in pressure drop was caused by the baf-f l ing on the sides of the tower used for short-c i r cu i t i ng prevent ion. Thesebaffles take up 24% of the cross-sect ional area in four places . Sampleco l lect ion funnels placed in the media a lso decrease the cross-sect iona larea . Therefore, the difference between the measured pressure drop and theexpected pressure drop is the pressure drop due to the baffles and otheri n terna l s dispersed in the pack ing . Tests showed that this pressure drop isa linear function of the air mass flow for each liquid loading rate. Figure3.02- 1 is a plot of Stage 2 hydraul ics . Here it is seen that the excesspressure drop increases l i nearly with increas i ng air mass flow. It a lsoincreases with increas ing l iqu id load ing rate. In -th i s way, the manometerreading was broken down into its components and the genera l i zed pressure dropcorre lat ion was used with some conf idence .
There was a lso more pressure drop than expected created by the air pas s i ngthe l iqu id distr ibutor in operation and other interna l s . This caused theblower to back up on Its curve and reduce its output. The system was unableto achieve greater than 0 .25 inches of water/foot of packing and plans totest 0 . 5 0 in fact were changed. Instead, points along the 0 . 1 2 in/ft curvewere tested.
B. Air Flow Meter
Because of freezing weather, the air flow meter quite often plugged wi thfrozen condensate. For Stages 1 to 3, the ice p lug was blown out and the

UJt-o cc5 oo z3 5., <• o
cc-ar-
o-6Vm
cocoV_lC
U.dCOmCMencoCMn
CCX
\
ooo
ooo>
ooCO
ccXu.dm
OLLCOCO
ooCD
OO OCO o(D O
d
amoCMd
oo
ui u_CO 3 OCO CO CMUJ CO Q- XO ff UJ O .x = a c ziu < a a c;
FIGURE 3.02-1EAU CLAIRE VOC REMOVAL
TRENDS IN TOWER HYDRAULICSSTRAIN; a• ft C. I >. t f ••• 9

3-3
meter returned to service when this happened. For Stage 4 when the ambientair temperature was -4°C, the air meter became inoperable . At this stage,however, only one particular air to water ratio was desired for all tests.After setting the desired l iquid flowrate, the air flowrate was set by thedesired manometer reading.
C. Sampling Procedure
In des ign ing a funnel system for collecting samples, the goal was to preventloss of VOCs in the sampl ing process. The funnel allowed for a reservoir ofsample to bui ld up over the entrance to the teflon collection tubing and toprevent air from entering the l ine. The tubing then ran down the side of thetower where a stop cock throttled the flow to completely fill the tubing.
This worked we! Vat all sampling points except for Sample Point No. 1 at thetop of the packing. The funnel was not below the packing far enough toprevent air from entering the l ine. When ' t h i s was discovered at startup of thetower, it was decided to sample from Sample Tap No. 2, about 2 feet below thetop of the packing instead. Data should, therefore, be read as the removalof VOCs over 6 feet of packing.
Another problem was freezing of the sample line. At times when this happened,a sample was taken directly at the sample tap on the side of the tower.
3 .03 HENRY 'S LAW CONSTANTS AND MASS TRANSFER COEFFICIENTS
The data for Stages 1, 2, and 3 were used to calculate the mass transfercoeffic ients (K la ) for each VOC. This is the parameter which describes themovement of the VOC molecules between the gas and l iquid phases.
Another important parameter is the Henry's Law Constants ( H ) . Henry's LawConstants describe, for each VOC, the ratio of VOC molecules between the gasand liquid phases at equilibrium. It is necessary to know the equilibriumsituation before calcu lat ing Kla for the dynamic situation. The higher the

3-4
Henry ' s Law Con s t a n t , the eas ier a VOC is to s t r ip from the water and transferto the a ir . Table 3 .03- 1 displays Henry's Law Constant s .
The Kla for each data point was ca lcu lated us ing the Mass Transfer Methodfrom s tandard chemical eng ineer ing texts but best descr ibed in the paper,"Des i gn of Aerat ion Towers to Str ip Vo la t i l e Contaminant s from Dr i n k i n gWater" , by Kavanaugh and Trusse l l , JAWWA (De c . , 1980) . The results areplotted in Figures 3 .03- 1 through 3. The focus of these data points aredescr ibed as l ines by l inear regress ion ,
Mass transfer coeff ic ients were a lso ca lcu lated us ing theoret ical empir icalre lat ionsh ips to compare wi th pilot study resu l t s . Two methods, the Sherwood-Holloway method and the Onda method as descr ibed in Perry ' s Chemical Engineer-ing Handbook, were used. Resu l t s are shown in F igures 3 .03-4 through 9. Thefocus of the Eau Claire data falls between the mass transfer coefficientspredicted by Sherwood and those by Onda . There was no corre lat ion for 1,1Dichloroethane and 1,1 Dichloroethylene because so few data points wereobtained for these VOCs . The data from Stage 4 test ing (Append ix A) showsthat 1,1 Dichloroethylene was removed below detection limits before it reachedthe tower pack ing . The VOC, 1,1 dichloroethane, only showed up in a fewsamples .
3 .04 TOWER SCALE-UP AND ECONOMICS
Aeration towers were designed for the ful l-scale facil ity at the air towater volumetric ratios of 10, 15, 20, 25, and 30. The air pressure drops ,0 .50 , 0 .2& and 0 . 12 inch of water per foot of pack ing , were looked at separ-ately. It was found that at an air pressure drop of 0 . 1 2 in/ft , a lower1 iquid loadi ng rate is necessary and the tower diameter for the maximumflowrate becomes too large. Thirteen foot diameter is the l imit on shop-fabr i cat ing and sh ipp ing a tower. For a greater diameter, a decis ion must bemade between field erection of one large tower or two shop-fabricated smallertowers. At an air pressure drop of 0 .50 in/ft, the tower pack ing height isgreater. Therefore, by practical tower dimensions alone, the air pressuredrop of 0 .25 in/ft should be used as a des ign point .

TABLE 3 .03 - 1EAU CLAIRE VOC REMOVALHENRY ' S LAW CONSTANTS
H 8 20°C H @ 9 .5 °CVQC . (atm) (atm)1 ,1 Dichloroethylene 8 ,340 No data
Trichloroethylene 541 328
1 , 1 , 1 Trich loroethane 387 217. '
1 , 1 Dich loroethane 238 137
Sources: 1 . Kavanaugh and Trusse l l , JAWWA, Dec. 1980.2. Love, Mi l tner , E i l e r s , & Fronk-Le i s t , Treatment of
Volat i le Organic Compounds In Dr i n k i ng Water , EPA-600/8-83-019, May, 1983.


NC J R - I C TIDE ARM10 X ID Pf *JCH
DIE :N rr 3RA1M*(/ U . « .A .
"Li.rir1r
.11.
k-H-H-' r^-~tnf-j" .- ..; .
|_!-i- • T T -
-Kla4 (Sej— , ...- r - - r-M -r:±lf-—-1
. . .
•.——I
-4-- .4-— - 4 - -. i
_ -r-
.J ^
tf; ii •
rlT-p£
IS_;_-!_itilW-T-r|-^T"i *~c-1)
1 - - 1, ' T^
.^4U_i_1 1 , '•i . i .-r r f •--T±^_.uowj t-
J . i _ . J _"]_
jr'._ T"^tr! jT i1
-4 ^ :•* . . .
^-
4-1--.v-l-,--L ,- 11 i—^j.t
~t~rir;A;iR"j J^ t T~]
-U-~*L
-
~
--
d-i:,-.-t.~-.—r4-
. — .i r-±:
~\tiIT_uJ_— *—-
J __ ,
-
i
~_^
f1—— -
-! : L
44+4TT "XPER-Hf
--
P
-M
-
R
^
-4-^
--— * ——
I .
-
K3-— i
U
E
H
-1:-...--
11
-X
. . .„ .-h:H-"-
f_u
-
11C
41 1. i.L; ;
! !rfEIS. - 1 . -4 _j_: : "5
r-~-- LJ
. . . j
--
-
-
-
p «
r
T-'i^r*i
-
a
2-=1f -i - -<_^x
-
-
--
_J_
--t-i1 -
LOA
' ,
_
-
*
-
I^t
!
-—-
^-
-
-
t]i
-;
-
5H
-
TO
-
rDIN
V
0
-
>
3-:--
)
G
---
^-*\i-
"L-
-i**
-
-F
- (
-3-•
J^f
-
^
)
n
0
,*•
1^4
•
AT
.
'
-
n*
I
--
E
<T^F-
-tC-
C
<
5"
)
>
-
. . .<>
-Et
:
-/^f
-i
-I
!^
-
>
-
**
-
r~o^
--f-V.
-r-
(Kmi
j-
i riiuuntCLAIRE \PER-H+-
t:
-
Q!
a-
C
1
.-
--/
•
-
>J"
-
.
±- ~
_x.m
--
.
-
-
2
Ci
---
-
C
-
-
-
-
~:s
--
"I
-
c-
-
i
>E
-
i
-
3
^
,
-
-- -
o.woi ^- T TrOC;REM6
...
-
-KI_i...
-
_..
--
--
<; =-
-
T
- -4-
--
laBe
—
-
-1i
--
-
.
r-1
-
^
JTS" i t !-
'--
-C
-
a
-
---
H
..
i-
\j-
-,
35
-
-
-
-
-
rrrAL:<?F
. j-
-i
!ii-,t]r- - - 1
-i
*
-.-—
-
. . .
-
- .
i
1-
R----1
-
'-
-
L
--
1t:u-i-]1r^J
it-H
-
-
l <
-i• - E_ ;_
-
-
-
-
_
i
-:
-
-
1
.
-
-
-
C
J-HT™->!
5SU.Ft ,
±
-
u
-
-
_
H-
_ .L
-
/;/£
- iH
E-
.. .
-
-1))
- -
*-
L_)
-•C. -*10— t—
DRO*f-
-
/
'
i
(
/
1— 1--rr
4
2
€
^
.C
IN
^-
^
1-().
C i
1-E1r-
~T '
4ji-iH<. 1 .- i
P f
- - -L-MLr_j —:
<•-
-t~--i-
rrJ-1
-^
-^
/
1TF»(
/
. _
\
\
),
— i—
S*
-
/
-
TTE
-N
--i
_i_-hE-nt - -1 firr j
-|t
H-"•"
-
inIi"^^
4?1_ . : _*•
- •i —4
±__.1
/
---
^
-<-- •
;(
;i
K
-
^tm
- - 4_ _ttH,
- 7 *
I !! '
,
!
tl14-1-i -*
J^-i i- r -
n1
: . . . " ! j 1- L--\: ::: : .
>P/FT. ;
-T. ! \ . '..',-rt i - •: -
- I - : - } : : ;- r ' 4 - •- -_ . . . . . ( ,
-4 1
- f '-i-iiji- "• -
fi i.L,-L..•-Hf r
—- .~i-l
, • [! ! ,- - - - - -
\ ~\
:-_!_:_.- : : . : : i :: rf t
£-t!1;.
, .. i . .
• - ~T ; -
'. - '
- f E~ - , -_J1 STilATxjn; * : . ' . ; . • . -..
3l/m2 s )

•4~: j *•4-
1"-i--4-
1
— -—-
— —— '
--
TJ
J 1--
#-pf--4- r •-r--! -_j— . .:r;.:-Ir
ntl--4- ' "-t~
-4-
..!_
•~ t--|-
-i~• r -
-T"T
1-f.i-±.i±t-*. -+---H--h. t-i.. . i
=4T-r- ' " -
_: Kla _;"I [Sec"
tff4 " , . --ftt j'
_. _" • - •. 4——
\-
* *
— — *-— — •----*• — *- •-M-XI'.- 4-j
tli !
! •i '; '
1 >
J j- ; - .., . . . ,! i = :
1-"o.--"—
-- •- _
"!
tj
-*• -i-~-j.-, .
. - J-D5~H—-:i.|
-]-{'H-i !H!t« *r*
-
-•--
-r
-
-:-_
• -T-—l^
^
4d1
NO R - 1 D ZBEt 1 DIE N C 1 RATID X ID PEP -NCH "*oc o. . . * .
I-f:!-:- f -
d-;
•--
.1
P
;|- •<——
H,— -— t
.,
DICIR; P
-, •-4i- 4 ! i -;-r--—it--JJ-~
ir-
~r-^
-
L:' ;
u.0
-1—
--
.-—C-
^
)•
•
L
—
J
"1
F?
M--
H-
-
I---
•'ri"-7-::rj
-
Hio•"J 'ESSl- r - :
•t- - -T- -31:-j-J j
^.
i
"
<
- _._~'
ATA
-
3
— -
V.
-
— t - —UIC
4-
1
h-
\
--
ROCJRE--: r
a. !-rfi
^>i
-
.1-iJ— i
-
:J
-f_--- -- -•
-4
--; r
J.".iL-C)
-
5
'
-
*
4-I""
q
r
}3;'tlEfii_ -
THytfiw-'
. j
*
c
VrCf!f .:
---
—
--
- r'J-
H-
-
H
-- -
„.-
- ...
--
t> j fv
-t
-~
-- -
tIG
-j-pt --fi
iP
-T. .LIKfH
!
C-lIkC .
4n
Bl
A"
1
J
—-
r
- f-yL
- -
5i::
J
-
r
^
=1N
-
d
u.a"/!-
.. ^ .
-
-
-
-
(Kr
L
--
-C-
LK
-
FJ1
-
-
• <A
-
:
- - ii 7
T!
---
i
- -
t1
-
-
-
!4:>!'
:
-
r
•rH
-
-
-
,
3UFIREssI-
•
-
i--
-\-
~.
-
-
".
- -
.-_
—
-
--. . .-
^E;VT
^K-
"I
-
- '
-
'-
-
-
I-
-
-
~
-
-
4h-f-2s)i
3.0-3-3H<R:>/
-
--
.
-ir
C REM<(NS4 1 -
i .-
-
<
-
^1
-
_.
-
a|.[Se-4--
-
__ ...-:
-
--
-
--
-I--T-
J-.
-
-
. . .
1:*i
F
--
-
-
3:ER• - H\1:
-\.~-^
jq-
-
--
-
"
t_ .
•
-
0
-
-
-
-4-
-\
H
/J_
1i"
--
-
H-Ii-VAL ^COEFF
i t )1 i - f 1
'
-— -_~
Tl 1
:
-
:
7
"
-. .
-- •-
"fH-— i—,4
N
--
-
c
-
--f
-
H
.
r'H
:.
-. -
"C.
"-j
h
±5 ff-14-fJ-4r-
felCHLR PR.ES
'-
-
:-
• -
_
--
..
6
-
- 31-I-}::i
: f i1:^
-
1-4-_ . . .
01
-
|!LIpUIC
itNT!•!!+-r5
Ttt7ii
—
;!i-1
-i- ...
--- — —7-
i "
irH-f-Tf
-4-;_-."~._ — -
r _ . .Jrf-
:
-
":ORO^THANSUR-^>
i.L.
.4-^
-
. _ > _ . _
-
JR
--
C
--1'r -
-=
-
"*H— r-
-
-__
-
iL9
4P"Ll" r ; "uTti--M^j
4 1
i *r-It-:- j L - . --L-i-4--i-1-E-- 1-•— 1 •
pRoeriPT^tir-- H
,-
±T±
--
A
_
4-
r4^-11
L-
p[i"~"l'
, ..
^
"
PINJ3
J- 4
4":iT
tI- -f-
JTSV,T1j
- : - t11^
-1- - i1 : 'R4
1 2 3 a n 1 o
!.
— —
I
1
-1,— •
7
--.
:.i---~• t-
:-- *-!
- - 1-!1-*-- t - - -1 1.
-•-.1— .j-
•T r <•25;;
- --t-L
-J—
t!-i—FL.
YE
-
fT
^--
—
-J-t- .
in >-T-f-ij- ±--'
-t—
J
-, r-
.-
---
-r;i
F-
Q-:.
IE.:•>:
•E
--"--(
-:,H:--oet
-rT '
Kr
-i.4_i_ ; - ._: ...1 , , . P ;p ' l ' • " • • ; "
J^-JT - - -.J-- r j -4 i - ' - : - - !tfu : :rr"~-H — 4— ~—L- .TT --T 1
- •- —— l 4 ; - • . j-
i r l i j : : : *t i .; j ; . .. _ . , .T: i : I ; ^ ; '.2O/FT. : : :- r t - r r - iT*" r ; - - T -• - • ' - ? — ; r ' - x •J p M - - -'tr;_; ! : ; : : .
• r r : r} - ' - [
i :- j r.:..i • • - - ,i • ; ' 1 ; r
I 1 *~ * "~^ '1 . . _J • '
:?4 ± ; : : ; : :tri ' T
h ^ : - : ! ; :Ti r t - i . : - ; • ; "i i _ •
t "i t ' " *
U>"" iSTF3A»JD4. - i • • • • • .'
io !/m £s ). . - ,•3 -^

Kla
0. 15
0. 12
0.09
0.06
0.03
FIGURE 3.03-4EAU CLAIRE VOC REMOVAL
TRICHLOROETHLYENE DP-0.25 IN/FT,
EXPEFPILOT
THEORETICAL cSHERWOOD'S M
IMENTAISTUDY
I-"1*. CURVEAT EAU
FROMCLAIRE
URVE UETHOD
i/~~;,-— ~—.'. **>vh~
SING-\sbXlSga~+->
-—'"""'"""
»4~-s
.--
^^ml~
1 "•"1"'";^^«.~ir>^-THEO
ONDA
---*
_ — S
..,.». TM^I-
?ETICAlSJ^ETh
CURVEOD
USING
0 0.80 1.60 2.40LIQUID LOADING RATE
3.20 4.00 ST *-!.•-"• .'

Kla
FIGURE 3.03-5EAU CLAIRE VOC REMOVAL
TRICHLOROETHYLENE DP =0 . 12 IN/FT.0 . 15
0 . 12
0.09
0.06
0.03
0
THEOSHER
THECOND4
RETICAIWOOD'S
RETICAI'S METI
u CURVEMETHC
— — "jaRgaj. CURVI4OD
USING *D
^\ USING
f--i
->l' ' '
^4-~H^'™ 7
**lm*^ r*f"
-,"•"
-H*XPERIMIILOT SIaj^ff^ssma!,r"11"
ENTAL CUDY Al
1 1 »• •iii->••*• ••••»• im
URVE FEAU C
ROM-AIRE
0 0.80 1 .60 2.40LIQUID LOADING RATE
3.20 4.00

Kla(S-1)
0.15
0. 12
0.09
0.06
0.03
0
FIGURE 3.03-6EAU CLAIRE VOC REMOVAL
111 TRICHLOROETHANE DP = 0.25 IN/FT.
EXPERTPILOT 5
THEORONDA'S
CENTALTUDY A
£— "~
ETICALMETHO
CURVET EAU (
«"**i™*
CURVED
^ROM -;LAIRE££ .iasis«r-
•If-'""'
JSING -i- —
—————
\^q?*3^
v*-
•w^"^"^ *™
•
_~f-~~-THEORISHERW"•""" 'I '-""U-iwl>iJ*"
—— —— 1
_--f•
TICAL <OOD'S 1jgtmKuJIa—
JIB a i a. «a • *•
5URVE IMETHOD
SING
0.80 1 .60 2.40LIQUID LOADING RATE
3.20 4.00 E.r. ,STFl

Kla(S-1)
0.15
0. 12
0.09
0.06
0.03
0
FIGURE 3.03-7EAU CLAIRE VOC REMOVAL
111 TRICHLOROETHANE DP=0. 12 IN/FT.
FHEORESHERW'
•i
I"""
EXPERPILOT
'1TICAL C:>OD'S H
iT "
-i4-;*— B™T 1
IMENTAlSTUDY ,! * * • .iMi.ua «aiMi
URVE UIETHOD
•.i,-- *""•• *•• • * ft
.—•"•^K*1"
CURVE\T EAU
SING-\
MW^uSiC
J™1
•
••"*
.-^"
^.tW™"1™**
FROM-CLAIRE
--* ..-"^jr*
-•f
\l<jT
\-THEORETltAL CUFONDA'S METHOD
VE USI^JG
0.80 1.60 2.40 3.20 4.00LIQUID LOADING RATE
/(/• „- _ i /_ O \

Kla
0.15
0.12
0.09
0.06
0.03
0 0
FIGURE 3.03-8EAU CLAIRE VOC REMOVAL
11 DICHLOROETHANE DP = 0.25 IN/FT.
EXPERIPILOT 5
NOTE:
THEORSHERtt
THEORUSING I
CENTALTUDY A
^^^^**
CURVET EAU <r-MH i™—" ™
3NLY FOUR DAVERE O^TAINEl^
ETICAL CURVE IOOD'S METHOI
=TICAL)NDA'S
^URVEMETHOI
FROM -iLAIRE|»itirE!aEJ™™^ n AF*SIHM'
'A POINTS_JSING -»
^
> f - "
V-4--*~
--*"""
m-Jrf*
-.-"""I
, : i t i
„_— 4
-
0.80 1 .60 2.40LIQUID LOADING RATE
3.20 4.00 EL-

Kla(S' 1)
0. 15
0.12
0.09
0.06
0.03
0
FIGURE 3.03-9EAU CLAIRE VOC REMOVAL
11 DICHLOROETHYLENE DP = 0.25 IN/FT.
THEOSHER
THEOONDA
RETICAWOOD'S
RETICAi'S METI-
NOT
. CURVfiMETHO
. CURVIOD
E: NO D
USINGD
: USING
ATA PO
f""
-N.-
INTS WE
*w4H"to™,.,..
„-*_-*••-"
RE OBT
. — -*-.-^K"
— ".f^
AINED.
nr-ci-
«.-!
0 0.80 1 .60 2,40LIQUID LOADING RATE
3.20 4.00 EV .. .>SVKA'* iC3

3-5
Towers were sca led up for 99% removal of 1 , 1 , 1 trichloroethane, the mostconservat ive des ign. Another design assumed 99% removal of 1,1 dichloroethy-lene, the most volat i le component. For both VOCs , mass transfer coeffic-ients predicted by Onda were used. Five feet of tower height was added tothe calculated packing height to take into account space required by othertower internals. The towers were designed to treat 10 mgd of water whichwas estimated in the May, 1984, report for the present maximum flow from theNorth Well Fie ld .
Table 3 .04-1 lists the tower des igns at the various air to water ratios.Costs are also developed for comparison purposes in this table. These costsare not intended to reflect an actual estimate of installing an aerationtower; only the following variable items are considered.
1. Cost of tower packing based on volume2. Cost of the tower shell; internals are not considered.3. Cost of the energy needed to pump water to the top of the packing;
other losses not considered4. Cost of the energy needed to pull air through the packing; other
losses not considered.
All capital costs in Table 3.04-1 are annuall ized over 20 years at 10%interest.
Table 3.04-1 shows that the costs to move the air through the tower is themost significant cost. As the air to water ratio increases, so does thevolume of air to be mbved and therefore the energy costs increase. Despitethe lowest cost occuring at 10/1 air to water ratio, the tower height is great.
For 99% removal of 1,1 dlchloroethylene, a 15/1 air to water ratio translatesinto a reasonable tower size and lowest annual costs. The tower dimensionsare 29 .5 feet high and 1 1 .5 feet in diameter. In a tower this size, 1 , 1 , 1trichloroethane would be removed by 67.5 percent.
For the most conservative tower, 99% removal of 1 , 1 , 1 trichloroethane, theoptimum design centers around a 20/1 air to water ratio with a 37 .5 foot talltower of 12 .5 foot diameter.

TABLE 3 .04- 1EAU CLAIRE VOC REMOVAL
SCALE-UP OF AERATION TOWERAMD RELATIVE COSTS
I. 1 ,1 ,1 Trlchloroethane, 99% RemovalA. A1r to Water Ratio 10 15 20 25 30B. Tower Height (ft) 58.0 42 .5 37 .5 35.0 33.0C. Tower Diameter (ft) 10 .5 1 1 .5 12 .5 13 .0 14 .0D. Relat ive Annual1zed
Cost of Pack ing $3,200 $2,800 $2,800 $2,800 $3,000E. Relative Annual1zed
Cost of Tower Shell $6,500 $5,600 $5,400 $5,300 $5,400F. Relative Annual Energy
Cost for Pumping $10,000 $7,800 $6,900 $6,500 $6,000G. Relative Annual Energy
Cost for Blower $58,000 $71 ,000 $73,000 $78,000 $78,000H. Total Relative Annual
Cost $77,700 $87,200 $88,200 $92,600 $92,400
II. 1,1 Dichloroethylene, 99% RemovalA. Air to Water Ratio 10 15 20 25 - 30B. Tower Height (ft) 31 .0 29 .5 28.5 28.0 27 .0C. Tower Diameter (ft) 10.5 1 1 .5 12 .5 13.0 14 .0D. Relative AnnualIzed
Cost of Packing $1 ,600 $1 ,800 $2,000 $2,100 $2,400E. Relat ive AnnualIzed
Cost of Tower Shell $4,300 $4,400 $4,600 $4,600 $4,700F. Relative Annual Energy
Cost for Pumping $5,700 $5,400 $5,200 $5, 100 $5,000G. Relative Annual Energy
Cost for Blower $31,000 $42,000 $57,000 $68,000 $73,000H. Total Relative Annual
Cost $42,600 $53,600 $68,000 $79,900 $85, 100

3-6
Further d i s cus s ion of tower scale-up is presented in Section 4.
3 .05 STAGE 4 TESTING
A fourth stage of testing was performed to run the tower at a 20 : 1 air towater ratio. A flow from the North well field and a combined flow from Northand South well fields were tested. For each test, a complete concentrationgradient was analyzed. Other analyses included pH and dissolved oxygenmeasurements. Data 1s tabulated in Appendix A.
The data shows that a signif icant amount of VOCs were removed at the top ofthe tower before the water contacted the packing. This was especially truefor the very volati le 1,1 Dichloroethylene. This phenomenon 1s termed the"end effects" of the tower and must be considered separately from the masstransfer occuring 1n the packing.
3 .06 MEETING HEALTH ADVISORY LIMITS
Table 3 .06-1 l ists the Suggested No Adverse Response Levels (SNARLS) acknow-ledged by the Wiscons in Department of Natural Resources. Only 1,1 dlchloro-ethylene is over the SNARL at the present time.
3.07 CHLOROFORM
Data 1n Appendix A shows that the concentration of chloroform Increasedthrough the tower. The water was chlorinated before entering the tower andthe agitation 1n the tower with some trihalomethane precursors may have causedthis increase even while using a technique that 1s sometimes used to removechloroform from water. The effluent concentration of chloroform from thetower with its maximum around 10 ppb 1s far below the limits for totaltrihalomethane concentration of 100 ppb.

TABLE 3 .06- 1
EAU CLAIRE VOC REMOVAL
SUGGESTED NO ADVERSE RESPONSE LEVELS
SNARLVOC . (ppb)
1 , 1 , 1 Trich loroethane 1 ,000
1,1 Dichloroethane . 300
1, 1 Dichloroethylene 0 .34
Tri chloroethylene 21

SECTION 4RECOMMENDATIONS FOR TOWER DES IGN
The fol lowing are recommendations for tower des ign at Eau Cla i r e :
A. In this report, two tower des igns have been presented. One is a designthat would remove 99% of 1,1 dlchloroethylene, the most volatile component.The tower would be 29 .5 feet high and 1 1 . 5 feet in diameter. In a tower thissize, 1 , 1 , 1 trichloroethane, the least volat i le component, would be removedby 6 7 . 5 percent.
The second design is to remove 99% of 1 , 1 , 1 trichloroethane, and therebyremove virtually all of the more volati le compounds. This tower would be3 7 . 5 feet tall with a diameter of 12 .5 feet.
Because of changing Federal Dr ink ing Water Standards which may in the futurebecome more stringent, and because it is unknown whether the concentrationsof contaminants wil l increase in the wells, it is recommended that the towerbe designed to remove 99% of the least volati le component.
B. Even though it is concluded that the tower be designed for the leastvolati le component, the VOC, 1,1 dichloroethylene, needs to be addressed.This is the only compound over the Suggested No Adverse Response level . Itis also greatly more volatile then the other contaminants found in the City ' swater.
From this pilot study, two conflicting ideas have been developed. First, 1,1dichloroethylene was over 99% removed by the turbulence of the l iquiddistributor before the water contacted the packing. On the other hand, thetheoretical mass transfer coefficient as calculated by Onda ' s equation indi-cates that approximately 25 feet of packing and a 15/1 air to water ratio isnecessary to remove 99% of this VOC. It is very possible that the Onda ' sempirical equation does not apply to this compound with such a high volatil ity.This would be a topic to be resolved in a research paper.

4-2
However, for the City of Eau C l a i r e , some s imple exper imentat ion can beperformed on this matter assuming that the 3 7 . 5 foot tall tower is bu i l t . Ifthe Federal regulat ions are such that only the removal of 1,1 dichloroethyleneis of concern, water can be run through the tower without turning the airblower on. Whi l e operat ing the tower in this manner, samples of the towerinfluent and effluent should be taken. If the ultimate removal is adequateto meet health standards, then much money can be saved in energy costs, ifthe removal is still not adequate, the air flow can be increased a smallamount and more samples taken until a point of minimum air flow for requiredremoval is found.
C. The packed aeration tower should be s ized to treat 10 mgd of water at anair pressure drop of 0 .25 inches of water per foot of packing.
D. When less than 10 mgd, the design flow, requires treatment, the towershould be operated at an air pressure drop of 0 . 12 inches of water per footof packing in order to save on energy costs.
E. The data from this pilot study is only valid for towers using 2-inchSuper Intalox Saddle packing. If other packing is used in a full scalefacility, attention should be given to achieving high l iquid loading rates.
F. The aeration tower should be induced draft so as to prevent carry over ofoil and dirt into the drinking water.
G. The pressure drop through the tower Internals, packing, and operatingl iquid distributor should be confirmed by the manufacturers before sizing theblower so that the tower can operate at its expected maximum capacity.
H. The liquid distributor should be designed with an appropriate turn downratio in mind so that the tower can operate under low flow.
I. Iron precipitation onto the tower packings should be a major designconcern. The Super Intalox saddles were chosen 1n the pilot study becausethey cannot interlock with each other and can be removed from the tower forcleaning is necessary. Simi lar saddles from other manufacturers have spiked

4-
project ions which can catch on ne ighbor ing saddles . In a fu l l-sca le fac i l i ty,the operator must be able to either clean the packing in place by pumping aweak acid such as acetic acid through the tower or to remove the pack ing forc lean ing in a separate tank.
J. Finally, it is suggested that two 10 mgd capacity towers be built . Thesecond tower can be used as standby should the first tower be out of servicefor maintenance. The second tower would also be able to handle the projectedyear 2000 maximum north well field flow and/or south well field flow shouldthat water become contaminated.
K. An overall view of the proposed aeration facilities 1s as follows:
Water would be pumped from the affected wel l s into the top of the tower ifthe hydraulic characteristics of the exist ing pumps al low. Water would flowover the packings with air pulled counter-current to Its flow by a blower.The second tower would be standby unless a flow greater than 10 mgd wasneeded. Both towers would sit over a wet well where the water would berepumped to the Iron and manganese removal plant. Alternative hydraulicswould have the affected wells discharge to a wet well , with water pumped tothe towers. With the tower bases elevated appropriately, gravity flow to thesettl ing basins would be accommodated.
Annual costs for this facility could be between $0.08 and $0.15 per 1,000gallons treated. For an average flow of 5.5 mgd, this translates into $150,000to $300,000 per year. This high annual cost is different from other strippingtowers 1n the state because Instead of treating 0.5 to 1 mgd, Eau Cla i re ' stowers must treat an average of 5.5 mgd and a maximum 10 mgd.

APPENDIX AEAU CLAIRE VOC REMOVAL
PILOT STUDY DATA

EAU CLAIRE VOC REMOVAL P I LOT STUDY DATASTAGE 1
NOV. 6 . 1 9 8 4 SAMPLE TAPS 0,51 , 1 DICHLQROETHYL.ENE
RUN WATER AIR A/W AIR INFLUENT EFFLUENT PERCENTFLOW FLOW VOL DP VOC VOC REMOVAL
GPM CFM IN/FT PPB PPB OF VOC
12i
59
101 112
250315150240180210250190
2701 50
. 52030044041028 0450
a4
279
18158
18
0.0.0.0.0.0.0.0.
252525j&hJ
25252525
0.o.o.0.0.0.0."?
0000007700oo0031
0.0.0.0.0.0.0.0.
0000oo100000oo10
0.0.o.
87.0.0.0.
96.
00OO000000000000

P«t.ae No. 104/23/83
EAU CLAIRE VOC REMOVAL P ILOT STUDY DmOSTAGE 1
NOV. 6 , 1 984 SAMPLE TAPS 0,51. ,1 DICHLOROETHANE
UN WATER-FLOW
GPM
12359
101 112
250315150240180210250190
AIRFLOW
CFM
270150520300440410280450
A/WVOL.
84
279
18158
18
AIR INFLUENT EFFLUENTDP VOC VOC
IN/FT PPB PPB
0.250 .250.250.250.250 .250.250.25
0.571 . 3 40.380.570 .760.570.570.38
0.380.020. 190.020.020 . 1 90. 190 . 19
PERCENTREMOVAL
OF VOC
33.0099.0050.0096.0097.0067.0067.0050.00

Paae No. 104/23/05
EAU CLAIRE.-: VDC REMOVAL P ILOT STUDY DATASTAGE 1
NOV. 7 , 1984 SAMPLE TAPS 2,51 . 1 DICHLOROETHANE
RUN WATER AIR A/W AIR INFLUENT EFFLUENT ' PERCENTFLOW FLOW VOL DP VOC VOC REMOVAL
GPM CFM IN/FT PPB PPB OF VOC
I23456789
101 11213141516
25031OISO310240250150240180210250190210190250180
27015054015031028053032045039027043O410450270470
a4
274
108
261019148
1715IB8
20
0.0,0.0.0.0.0.0.0.0.0.0.0.0.0.0.
25252525252525252525252525252525
0.0.0.0.0.0.0.0.0.0.0.0.0.0.0.0.
44440067462300237322550000000000
0.0.0.0.0.0.0.0.0.0.0.0.0.0.0.0.
02440002230200020202020000OO00OO
95.0.0.
97.50.91 .
0.91 .97.91.96.0.0.0.0.0.
00OO0000000000000000000000OO0000

Pane No. .104/23/bS
EAU CLAIRE VOC REMOVAL P ILOT STUDY DATASTAGE 1
NOV. 6 . 1 9 3 4 SAMPLE TAPS 0,51 , 1 , 1 TRICHLOROETHANE
RUN WATER AIR A/W AIR INFLUENT EFFLUENT PERCENTFLOW FLOW VOL DP VOC VOC REMOVAL
6PM CFM IN/FT PPB PPB OF VOC
1 250 270 8 0 . 2 5 9 .33 1 .33 86 . 002 315 150 4 O.25 9 .55 2 .44 74.003 150 520 27 0 .25 9 .55 0.67 93.005 240 300 9 0 .25 10 .44 1 . 1 1 89.009 180 440 18 0. 25 8. 89 0. 49 94. 00
10 210 410 15 0 .25 9 .88 O. 99 90.0011 250 280 8 0.25 9 ,88 0.98 90.0012 190 450 18 0 .25 9 . 1 4 0 .99 89.00

No.04/23/85
EAU CLAIRE VOC REMOVAL PILOT STUDY DATASTAGE 1
NOV. 7 , 1984 9AMPLE TAPS 2,51 , 1 . 1 TRICHLOROETHANE
UN WATERFLOW
GPM
123456789
10111213141516
250310150310240250150240180210250190210190250ISO
AIRFLOW
CFM
270150540150310280530320450390270430410450270470
A/WVOL
84
274
103
261019148
1715IS8
20
AIR INFLUENT EFFLUENTDP VOC VOC
IN/FT PPB PPB
0.250.2S0.250.250.250.250.250.250.250.250.250.250.250.250.250.25
7.067 .844 .7 19.025 .8 16 . 1 35. 166.774.004.626. 154.284 .284 .282.501 .67
1 .573.530.064.712.581 .6 10 .972.261 .022.311 .540.060.060.061. 101. 10
PERCENTREMOVAL
OF VOC
78.0055.0099.0048.0056.0074.0081 .0067.0074.0050.0075.0099.0099.0099.0056.0034.00

05/ 1 5 /OS EAU CLAIRE vuc rir i- iovAL. P ILOT STUDY DATASTAGE 2
NOV , 2 4 , 1 984 SAMPLE TAPS 2 , 5
RUN WATERFLOW
GPH
1jt.3456789
101 112
1451 151651 00180155145210145100145210
AIRFLOW
CFM
550440300 .47546033039040039045O380400
1 , 3 , 1 TRICHLQRQETHANEA/W AIR INFLUENT EFFLUENTVOL DP VOC VOC
IN/FT PPB FPB
2829143619J.6201420192014
0.250. 120, 120. 120.250. 120 . 1 20.250.250.250. 120.25
2 .691 . 603. 921 .961 . 503.753. 302 .561 .691 . 286.921 . 33
1 .540.531 .960.980, 131 .251 . 650 . 1 30. 130. 130.870. 10
PERCENTREMOVAL
OF VQC
42.7566.8850.0050. 009 1 .3366.6750. OO94.9292 .3 189.8487.4392.75

Paae No-04/23/85
CLAIRE VOC REMOVAL. P ILOT STUDY DATASTAGE 3
DEC. 28, 1984 SAMPLE TAPS 2,51 , 1 , 1 TRICHLOROETHANE
RUN WATER AIR A/W AIR INFLUENT EFFLUENT PERCENTFLOW FLOW VOL DP VOC VOC REMOVAL
GPM CFM IN/FT PPB PPB OF VOC
VI;
1234567&9
101 112
1431651401052151401 10175220145165195
360335380520415530425445310390350420
2915203715282919102O1616
0.0.0.0.0.0.0.0.0.0.0.0.
251212122525122525121225
0.1 .1 .0.1 .0.0.1 .0.0.0.0,
836730322500002826515151
0.0.0.0.0.0.0.0.0.0.
1 0.0.
101O10161600001313131313
87.94.92.50.87.0.0.
89.50.74.74.74.
950175002000008400515151

Pane No. 104/23/85
EAU CLAIRE VOC REMOVAL PILOT STUDY DATASTAGE 1
NOV. A', 1984 SAMPLE TAPS 0,5TRICHLOROETHYLENE
RUN WATER AIR A/W AIR INFLUENT EFFLUENT PERCENTFLOW FLOW VOL DP VOC VOC REMOVAL
GPM CFM IN/FT PPB PPB OF VOC
12359
1O1112
"250315150240180210250190
270150520300440410280450
84
279
IB15
. 8
18
0,0,0.0.0.0.0.0.
2525252525252525
3-3.4.4.4.3*3.3.
7728101310616161
0.1.0.0.0.1 .0,0,
8264499849509882
78.50.88.76.88.58.73.77.
OO0000000000OO00

Paae No. i04/23/85
EAU CLAIRE VOC REMOVAL PILOT STUDY DATASTAGE 1
NOV. 7 , 1 984 SAMPLE TAPS 2,5TRICHLOROETHYLENE
RUN WATER AIR A/W AIR INFLUENT EFFLUENT PERCENTFLOW FLOW VOL DP VOC VOC REMOVAL
6PM CFM IN/FT PPB PPB OF VOC
123456789
101 11213141516
250310150310240250150240180210250190210190250180
27015054015031O280530320450390270430410450270470
84
274
108
261019148
171518B
20
0.0.0.0.0.0.0.0.o.0.0.0.0.0.0.0.
25252525252525252525252525252525
3.3.2.3.2.2.1 .2.1.1.2.2.2.2.1.2.
06061660225688918282731010105810
1.1 .0.2.1.1 .0.1.0.0.0.o.0.0.0.0.
44985416030351206060916953696942
53.35.75.40.54.60.73.59.67.67.67.67.75.67.56.80.
oo000000000000000000000000000000

F«?.oe No. 104/23/85
EAU CLAIRE VOC REMOVAL PILOT STUDY DATASTAGE 2
NOV .24 , 1984 SAMPLE TAPS 2,5TRICHLOROETHYLENE
RUN WATER AIR A/W AIR INFLUENT EFFLUENT PERCENTFLOW FLOW VOL DP VOC VOC REMOVAL
GPM CFM IN/FT PPB PPB OF VOC
123456789
101112
1451 15165100180155145210145180145210
550440300475460330390400390450380400
282914361916201420192014
0.0.0.0.0.0.0.0.0.0.0.0.
251212122512122525251225
0.0.1 .0.0.0.0.1 .0.0.0.1 .
616139618383832756855632
0.0.0.0.0.0.0.0.0.0.0.o.
040437043316161709172941
93.93.73.93.60.8O.80.86.85.80.48.68.
444438442472726171002194

Paae Mo.04/23/85
RUN WATERFLOW
GPM
123456789
101112
1451651401052151401 10175220145165195
iI'AU CLA
DEC
AIRFLOW
CFM
560335
. 380520415530425445310390350420
A/WVOL
291520371528291910201616
IRE VGC REMOVAL PILOT STUDY DATASTA3E 3
. 2 8 , 1 9 8 4 SAMPLE TAPS 2,5TR I CHLOROETHYLENE
AIR INFLUENT EFFLUENTDP VOC VOC
IN/FT PPB PPB
0.250. 120. 120. 120.250.250 - 1 20.250.250 . 120 . 1 20.25
0.991 .091 ,240.470.590.480.240.980.980.650.490.78
0.540.660.830.060.060.060.060.050 . 106.050.05O.O5
PERCENTREMOVAL
OF VOC
45.4339.4533.0687.2389.8387.5075.0094.9089.8092.3189.8093.59

No. 104/23/85
EAU CLAIRE VOC REMOVAL PILOT STUDY DATASTAGE 1
NOV. 6 , 1 984 SAMPLE TAPS 0,5CHLOROFORM
RUN WATER AIR A/'W AIR INFLUENT EFFLUENT PERCENTFLOW FLOW VOL DP VOC VOC REMOVAL
GPM CFM IN/FT PPB PPB OF VOC
12359
101 112
250315150240180210250190
270150520300440410280450
84
279
1815
818
0.0.0.0.0.0.0.0.
2525252525252525
0.0.0-1 .0.0.0.0.
9988881 164538564
0.0.0.0.0.1 .1.1 .
8888887785O64906
1 1 .0.0.
31 .—33.
-100.-75.-66.
00OO0000000000OO

Paae No.04/23/05
RUN WATERFLOW
GPM
123456789
101 11213141516
250310150310240250150240180210250190210190250ISO
\EAU CLAIRE VOC REMOVAL PILOT STUDY DATA
STAGE 1NOV. 7, 1964 SAMPLE TAPS 2,5
CHLOROFORMAIR
FLOWCFM
270150540150310280530320450390270430410450270470
A/WVOL
84
274
108
261019148
1715188
20
AIR INFLUENT EFFLUENTDP VOC, VOC
IN/FT PPB PPB
0.250.250.250.250.250,250.250.250.250.250.250.250.250.2S0.250.25
O.360.360.710.480.901 .030.640.770.643.870.861 .5 13.021 . 131 .070.47
0.360 . 120.360.951. 151 .672.44i.030.971 .290.641 .891 .513. 022 . 141 .43
PERCENTREMOVAL
OF VOC
0.0067. OO49.00
-98.00-28.00-62.00
-281.00-34.0O-52.00
67.0026.00
-25.0050.00
-167. OO-100.00-204.00

Paae No. 104/23/95
EAU CLAIRE VOC REMOVAL PILOT STUDY DATASTAGE 2
NOV.24 , 1984 SAMPLE TAPS 2,5CHLOROFORM
RUN WATER AIR A/W AIR INFLUENT EFFLUENT PERCENTFLOW FLOW VOL DP VOC VOC REMOVAL
BPM CFM IN/FT PPB PPB OF VOC
123456789
101112
14511516510O180155145210145180145210
5504403004754603303904003904503804OO
282914361916201420192014
0.0.0.0.0.0.0.0.0.0.0.0.
251212122512122525251225
9.9.8.6.6.7.4.4.2.2.2.1.
680339772044137276763685
8.9.9.9.8.7.4.3.3.3.3.1 .
396803032685549467781567
13.-7.-7.
— O»J •
-33.-5.-9.16.
-32.""36.-33.
9.
332063382351935397964773

Pace No. 104/23/85
EAU CLAIRE VOC REMOVAL PILOT STUDY DATASTAGE 3
DEC.28, 1984 SAMPLE TAPS 2,5CHLOROFORM
UN WATERFLOW
GPM
123456789
101112
145165140105215140110175220145165195
AIRFLOW
CFM
560335380520415530425445310390350420
A/WVOL
291520371528291910201616
AIR INFLUENT EFFLUENTDP VOC VOC
IN/FT PPB PPB
0.250.120.120. i20.250.250.120.250.250. 120.120.25
2.512.091.952.053.083.082.462.521 .682.021.681.34
2.512.791.953.084 . 104 . 103.083.532.522.352.352.10
PERCENTREMOVAL
OF VOC
0.00-33.49
O.OO-50.24-33.12-33. 12-25.20-40.08-50.00-16.34-39.88-56.72

Sample 1,1Port Dichlorethylene
(ppb)I. Test 1:180 gpm North*0 2.131
2 0.693 <0.054 <0.055 <0.05
II. Test 2:180 gpm North*0 1 .5912 <0.053 <0.054 <0.055 <0.05III. Test 3:
110 gpm North70 gpm South .*0 1 .061
2 <0.053 <0.054 <0.055
IV. Test 4:110 gpm North
70 gpm South*0 1 . 131
2 <0.043 <0.044 <0.045
1,1Dichlorethane(ppb)
0.9S0.490.49
<0.010.25
0.860.490.160.16
<0.01
0.620.370.160. 12
0.510.26
<0.01<0.01
EAU CLAIRE VOC REMOVALSTAGE 4 TESTING
AIR TO WATER = 20 : 1 ; AIR PRESSURE DROP = 0 .25 in/ft1 , 1 , 1 Bromodi- Di s so lvedTrichloroethane Trichloroethylene Chloroform chloromethane pH Oxygen(ppb) (ppb) (ppb) (ppb) (S .U . ) (ppm)
10 .73.463.322.88
Out o
2.45
9.42
4.46rice2.021 .62<0 .01
1 .22
3.92Out of Service4 .35 2 .21
3232
1 .74
9.56
1 .411 .211 .01
3.42Out of Service1 1 .06 2 .012.09 1 .61
2.32 1 .41Out of Service
9.60 3 .30Out of Service
4.48 2 .062.56 1 .441.60 0.82
Out of Service
10 .710 .21 1 .310.012 .0
6.848.367.607.608 .67
1 1 .415 .015.016.6
12 .012 .314.13 .2
6 .593 .293.29
<0 .022.82
2.822.821.881 .881.88
1 .882 .352.353 .29
2 . 132 . 132 . 132 . 13
6 .67 5 .056.72
7.01 7 .4
6 .55 5 .806.69
6 .92 7 . 7 5
6.606 .70
6.806 .98
5 .35
5 .45
Influent Pipe