Straightforward transparent banking - … · Annual Report & Accounts 2017 Straightforward...
194
Annual Report & Accounts 2017 Straightforward transparent banking The Group enters 2018 well positioned to deliver substantial progress.
Transcript of Straightforward transparent banking - … · Annual Report & Accounts 2017 Straightforward...

Annual Report & Accounts 2017
Straightforward transparent banking
The Group enters 2018 well positioned to deliver substantial progress.

Contents
* Pages 2 to 56 form the Strategic report. It includes our Strategy and business model, Financial review, Principal risks and uncertainties and a Business review for each of the lines of business. Pages 98 to 101 form the Directors’ report.
1 Introduction
Strategic report*2 Strategy and business model4 Chairman’s statement6 Chief Executive’s statement14 Financial review20 Capital, leverage and liquidity
22 Business review: 22 Business Finance28 Consumer Finance34 Consumer Mortgages38 Savings
42 Principal risks and uncertainties52 Going concern and viability53 Corporate responsibility
Corporate governance report57 Chairman’s introduction58 Board of Directors61 Corporate governance statement66 Risk management69 Nomination Committee report72 Audit Committee report78 Risk Committee report82 Remuneration Committee report86 Directors Remuneration Report for 201794 Summary remuneration policy98 Directors’ report102 Directors’ responsibility statement103 Independent Auditor’s report
Financial statements110 Consolidated statement of
comprehensive income111ꢀConsolidatedꢀstatementꢀofꢀfinancialꢀ
position112ꢀCompanyꢀstatementꢀofꢀfinancialꢀposition113 Consolidated statement of changes
in equity114 Company statement of changes in equity115ꢀConsolidatedꢀstatementꢀofꢀcashꢀflows116ꢀCompanyꢀstatementꢀofꢀcashꢀflows117ꢀNotesꢀtoꢀtheꢀconsolidatedꢀfinancialꢀ
statements
182 Five year summary183 Appendix to the Annual Report187 Glossary190 Corporate contacts and advisers

Strategic Report Corporate Governance Report
Financial Statements
1www.securetrustbank.co.uk
Introduction
Total assets2016: £1.5 billion
£1.9bn
Profit before tax from continuing operations2016: £19.4 million
£25.0mSecure Trust Bank PLC (‘the Bank’) is an established, well-funded and capitalised UK retail bank.The Bank was founded in 1952, was admitted to AIM in November 2011 and, in October 2016, successfully moved to the Main Market of the London Stock Exchange. The Bank and its subsidiaries are referred to as ‘the Group’.
Our History
Excellent and efficient service, I would definitely use them again.
2017Secure Trust Bank launches into the Consumer Mortgages market in March
2014Secure Trust Bank’s Business Finance offer is developed with Commercial Finance and Asset Finance being formed as divisions within the Group
2013The Real Estate Finance division is formed to support SMEs in providing finance principally for residential development and investment
The V12 Finance Group is acquired and subsequently the Group’s existing Retail Finance business is merged with the V12 business
The Debt Managers Services business is acquired
2012The Everyday Loans Group is acquired
2011Secure Trust Bank lists on the Alternative
Investment Market in November
2008 Secure Trust Bank’s Motor Finance
business begins lending under the Moneyway brand providing hire purchase lending products
to a wide range of customers1985Secure Trust Bank becomes part of the Arbuthnot Banking Group
1952Secure Trust Bank is founded
2016Secure Trust Bank Group is awarded
Investors In People Gold in December
Secure Trust Bank Group steps up into the Main Market of the London Stock
Exchange in October
Arbuthnot Banking Group reduces its shareholding in Secure Trust Bank Group
to 18% in June
The Everyday Loan Group is sold in April

Secure Trust Bank PLC Annual Report & Accounts 2017 Straightforward transparent banking
2
Strategy and business model
This section of the Annual Report and Accounts contains the Strategic Report required by the Companies Act 2006 to be prepared by the directors of the Bank. It describes the component parts of the Group’s business; the principal risks and uncertainties; the development and performance of the business during the financial year; and the position of the business at the end of the year.
Financial and other key performance indicators (“KPIs”) are used where appropriate. A summary of the KPIs is set out on page 19 of this Financial Review. Definitions of the KPIs, their calculation and the reasons for their use can be found in the Appendix to the Annual Report on page 183.
Our Strategic Themes
Risk Aware Understanding of risk keeps our customers and us safe and secure.
Change OrientatedEmbracing change and implementing good ideas gives us a competitive advantage.
Customer FocusedGood customer outcomes are at the heart of everything we do.
Performance DrivenSecure Trust Bank will only become one of the best banks in Britain by each employee taking personal accountability for their performance.
TeamworkCompanies achieve more when staff work well together.
Ownership Personal responsibility and taking tasks through to completion benefits the individual as well as customers.
Strategic Themes Our Values
Group StrategyThe Group’s strategy is to build on its current position as an established UK retail bank through a focus on carefully selected and attractively priced segments of the consumer and business markets, prudent underwriting and a prudent approach to capital and liquidity.
The Group intends to continue growing its business through responsible lending across its lending divisions, funded by customer deposits and backed by the Group’s strong capital base. It continually monitors and manages its portfolio of assets in line with its risk appetite.
The strategy is underpinned by three strategic themes and six values, which are embedded within the Group’s culture and are used to evaluate each employee’s personal performance:
GrowTo maximise shareholder value through strong lending growth by delivering great customer outcomes in both our existing and new markets.
SustainTo protect the reputation, integrity and sustainability of the Bank for all of our customers and stakeholders via prudent balance sheet management, investment for growth and robust risk and operational control. Controlled growth is one of the top strategic priorities for the Bank.
LoveTo ensure that the fair treatment of customers is central to corporate culture and that the Bank is a highly rewarding environment for all staff and one where they can enjoy progressive careers.

Strategic Report Corporate Governance Report
Financial Statements
3www.securetrustbank.co.uk
The Group’s diversified lending portfolio currently focuses on three sectors:
• Business Finance: Real Estate Finance, Asset Finance and Commercial Finance divisions
• Consumer Finance: Motor Finance and Retail Finance divisions
• Consumer Mortgage Finance.
The Group intends to use its strong capital base to develop a broad based portfolio, balanced in the longer term across these sectors.
Lending is primarily funded by customer deposits ranging from instant access to seven year bonds, augmented by modest levels of Bank of England scheme funding. Deposit accounts are promoted to meet funding needs and to broadly match the maturity profiles of loans and deposits. Through carefully targeted lending products, the absence of large fixed overheads in the form of a branch network and a policy of not cross-subsidising loss making products with profitable ones, the Group is able to offer competitive deposit interest rates and has been successful in attracting deposits from a wide range of customers.
The Group operates principally from its head office in Solihull, West Midlands, and had 747 employees (full-time equivalent) as at 31 December 2017. Lending business is sourced primarily through carefully selected business partners and through online channels. The Consumer Finance division utilises underwriting technology to make lending decisions quickly, resulting in high customer satisfaction scores, while exercising strong risk management to minimise losses through bad debts. Business Finance lending decisions are made on an individual transaction basis, using expert judgement and assessment against criteria set out in the lending policies.
Our DivisionsBusiness Model
Business Finance
Business Finance’s divisions include Real Estate Finance, Asset Finance and Commercial Finance
2017 Total Business Finance lending
£824.0mIncrease in Business Finance lending
31%
Consumer Finance
Consumer Finance’s divisions include Retail Finance, Motor Finance and Personal Lending.
Increase in Consumer Finance lending
29%2017 Total Consumer Finance lending
£726.9m
Savings
The Group undertakes its funding primarily via retail savings; attracting balances with competitive rates of interest
Increase in total customer deposits
29%2017 Total customer deposits
£1,483.2m
Consumer Mortgages
Launched on the 20th March 2017. The division supports residential customers who are underserved by the traditional high street lenders.
2017 Total Mortgage lending
£16.5m
Page 22 to read more about Business Finance.
Page 28 to read more about Consumer Finance.
Page 34 to read more about Consumer Mortgages.
Page 38 to read more about Savings.

Secure Trust Bank PLC Annual Report & Accounts 2017 Straightforward transparent banking
4
Chairman’s statement
The Group ceased originating sub-prime motor finance and medium term unsecured personal loans and in December we sold the legacy unsecured personal loan portfolio. This year we will continue to run down the legacy sub-prime motor book.
2018 begins with a lower risk balance sheet and our largest ever pipeline in real estate and commercial finance. Since being acquired by the Group five years ago our retail finance company, V12, has grown strongly and is expected to continue to do so. The investment in our invoice finance business is also expected to make an important contribution. A new and highly experienced leadership team is tasked with growing and diversifying our motor lending operation and our nascent mortgage operation is fully operational and writing business.
2017 was also the first full year in which the Group was listed on the main market of the London Stock Exchange. The new enlarged Board is working well and we will continue to strengthen our governance and respond to the changes proposed to the UK Corporate Governance Code. I am grateful for the extensive work which has been undertaken by the chairs of all our Board committees. During 2017 the Remuneration Committee implemented the remuneration policy approved at the 2017 Annual General Meeting.
Last year we launched our first ever all employee share save scheme and over 41% of eligible staff subscribed. I was delighted and encouraged by such a high level of participation. I am impressed too with our colleagues who have given their support to local and national charities. STB has a matching funding scheme which the Board agreed to enhance in 2017 and the busy charity committee has coordinated more than 900 hours of volunteering. It was a great privilege to visit the St Mary’s Hospice in Birmingham to see for myself the work and care which has been enthusiastically supported by so many of our staff.
Our business is heavily regulated and we continue to invest in the resources required to satisfy the requirements of the FCA and PRA.
The Board is proposing a final dividend of 61 pence per share. This, when added to the interim dividend of 18 pence, would mean a full year dividend of 79 pence per share. If approved, the final dividend will be paid on 25 May 2018 to shareholders on the register as at 27 April 2018.
Finally, the members of the Board would like to express their thanks to all of our colleagues across the Group for their continued dedication and commitment.
I look forward with confidence to another year of growth building on the hard work done in 2017.
Lord Forsyth Chairman
21 March 2018
Last year was the 65th anniversary of the foundation in 1952 of the Secure Trust Group. It has been a year of significant change and the Group enters 2018 well positioned to deliver substantial progress. Throughout 2017 there has been a considerable repositioning of our balance sheet.

Strategic Report Corporate Governance Report
Financial Statements
5www.securetrustbank.co.uk
The Group enters 2018 well positioned to deliver substantial progress.

Secure Trust Bank PLC Annual Report & Accounts 2017 Straightforward transparent banking
6
Chief Executive’s statement
The Group’s operating income grew by 21% to a record level.

Strategic Report Corporate Governance Report
Financial Statements
7www.securetrustbank.co.uk
I am pleased to be able to report that on a continuing operations basis Secure Trust Bank (‘STB’) increased statutory profit before tax in 2017 by 28.9% to £25.0 million (2016: £19.4 million) with the Group delivering further loan book growth of 27% to c.£1.6 billion (2016: £1.3 billion). Underlying profit before tax on a continuing basis was £27.0 million (2016: £27.3 million).
Inclusive of continuing and discontinued operations statutory profit before tax increased by 6.5% to £29.3 million (2016: £27.5 million) and underlying profits on this basis were £31.3 million (2016: £32.9 million). This profit growth was achieved notwithstanding the very significant strategic repositioning of the Bank’s balance sheet away from higher margin / higher risk, consumer unsecured and sub-prime motor lending and a substantial investment in launching a new mortgage division and a new deposit IT platform.
All of this took place whilst continuing to deliver positive outcomes for customers and sustaining very high levels of customer satisfaction.
Having largely completed the majority of the Bank’s balance sheet repositioning, the Group entered 2018 with robust capital and liquidity positions, no direct or indirect exposures to sub-prime unsecured personal lending and a reducing exposure to sub-prime motor finance. With new business pipelines in our SME operations at record highs and continued good momentum in the consumer business lines, we are well positioned in a number of attractive lending classes and expect good progress to be made in meeting our goals over the coming periods.
Profitable growth on a rebalanced loan bookThe sale of the unsecured loan portfolio in December requires the accounts to be presented to take account of continuing and discontinued activities. Comparisons with 2016 are complicated by the substantial one off profit generated by the disposal of Everyday Loans in 2016.
Continuing operations generated statutory pre-tax profits for 2017 of £25.0 million which are 29% higher than the prior year of £19.4 million. This growth has been achieved notwithstanding the rundown of the higher risk consumer portfolios, the growth in lower margin / lower risk new business, and the ongoing investment in the business model, especially in the mortgage operations and the new customer deposit platform.
Excluding discontinued operations, the Group’s operating income grew by 21% to a record level of £129.5 million (2016: £107.0 million) whilst operating costs rose 10.9% to £71.3 million from £64.3 million in 2016.
Excluding discontinued operations, loan impairments of £33.5 million (2016: £23.3 million) rose by 43.8% reflecting growth in the continuing loan portfolios, an increase in the levels of provisions held against the sub-prime motor book that is in run off, and an increase in the levels of interest bearing balances written in Retail Finance.
Despite substantial investment to support future growth, costs continue to be robustly managed as reflected in the cost to income ratio of 55.1% (2016: 60.1%).

Secure Trust Bank PLC Annual Report & Accounts 2017 Straightforward transparent banking
8
Chief Executive’s statementcontinued
Prudent balance sheet and risk management Our ongoing priority is to safeguard the reputation and sustainability of STB through prudent balance sheet management, investment for long-term sustainable growth and robust risk and operational controls.
Over the last couple of years we have been investing in a new deposit platform which went live in the final quarter of 2017. This was a major IT programme which, as previously disclosed, is expected to confer several benefits for the Group, enhancing the offering, providing internet banking, and improving efficiency and risk controls while providing flexibility to introduce new products. The new technology is also enhancing our customer service proposition whilst providing much greater scalability than the previous platform.
STB seeks to limit exposure to short term wholesale funding and interbank markets and broadly match fixed term fixed rate customer lending with customer deposits of the same tenor and interest rate basis. This helps us to minimise maturity transformation and interest rate basis risk. The new deposit platform will allow us to fund our very short term lending activities, such as Invoice Finance and some Retail Finance, with lower cost shorter duration deposit products thereby enhancing our competitive positioning without diverging from our historic approach of matching assets and liabilities.
Our year end loan to deposit ratio was 107.8% (2016: 109.0%). Customer demand for our deposit products remains very strong, and I am pleased to note that the majority of customers with maturing medium term savings bonds chose to reinvest their funds into deposit products with us.
Usage of the Bank of England’s (BoE) Funding for Lending and Term Funding Schemes remains a nominal 7% of total lending balances and as a result we will not have big refinancing risks to manage as these schemes are repaid over the next four years. I expect that the closure of the schemes will alter competitive dynamics in the market. The implication for STB is that market pricing, particularly in mortgages, should move closer to where we have priced lending without the benefit of the cheap BoE money and thus our competitive position should strengthen. We have already seen some specialist mortgage lenders increasing their pricing albeit I expect it will take a number of months for the effects of the closure of the schemes to work through in terms of market dynamics.
Strong capital ratios and modest leverageOur year end CET1 capital levels are robust with a CET1 ratio of 16.5% comparing to the 2016 year end position of 18.0%. The total capital ratio was 16.8% and STB’s leverage ratio was 12.3% (2016: 14.5%) as at 31 December 2017. This ratio is comfortably ahead of minimum requirements and demonstrates capacity to continue growing customer lending balances in 2018. The year on year movement is a function of the investment of capital to support the strong growth in the loan portfolios and an increase in the buffers all banks are being required to hold by regulation.
Throughout 2017, the Bank of England has, via the Financial Policy Committee and the PRA, expressed concerns about the UK Consumer Credit market. The Financial Conduct Authority (FCA) has echoed many of these. Both regulators have subsequently taken steps to address their concerns and it seems increasingly possible that the FCA will intervene in some lending markets. Our assessment is that Secure Trust Bank continues to operate in line with regulatory expectations and as a result we would not expect to be negatively impacted by any regulatory changes with regard to product or conduct.
In the recent past I have highlighted my views that risk is being mispriced in a number of lending markets in the UK. Our early recognition of what we regard as unsustainable market dynamics and assessment of the economic outlook has informed the strategic repositioning of the Group’s business model over the last two years which culminated in the sale of the legacy unsecured personal loans portfolio in December 2017. In an understandable move to cool over exuberant consumer lending the Bank of England decided to increase the UK countercyclical capital buffer rate to 0.5% (of risk weighted assets) from 0%. This is scheduled to increase further to 1% in November 2018. It is very frustrating that this buffer applies to all banks and does not distinguish between those like Secure Trust Bank, which have exited overheating parts of the consumer credit markets, and others.

Strategic Report Corporate Governance Report
Financial Statements
9www.securetrustbank.co.uk
Customer lending activities Strong double digit percentage growth was achieved across the Group’s loan portfolio in 2017 notwithstanding the increasingly cautious stance taken as the year progressed, the decisions to cease new business origination in unsecured personal lending and sub-prime motor in the first quarter and the repayment of the vendor loan provided to Non Standard Finance PLC in connection with their purchase of Everyday Loans.
Total annual new business lending volumes exceeded the £1 billion mark for the first time and grew 16.4% to £1,077.1 million (2016: £925.3 million) which translated to an increase of 27.3% in overall balance sheet lending assets to £1,598.3 million (2016: £1,255.5 million for continuing operations).
Consumer FinanceTotal consumer lending in 2017 increased 29% to £726.9 million (2016: £562.1 million). Our Consumer Finance lending strategy during 2017 was centred on running off higher margin / higher risk unsecured personal loan and sub-prime motor portfolios, which have been historically profitable, and allocating capital to support the continued growth in Retail Finance, which is shorter term in duration and prime in nature, and higher quality new business in Motor Finance. As noted, we ceased originating new sub-prime motor finance and unsecured personal loans in Q1 2017. Given the ongoing regulatory focus in the unsecured personal loan and high cost credit markets, I feel our retrenchment from these markets was well timed even if the repositioning has created a drag on profit growth.
The Retail Finance point of sale business, net of provisions, grew strongly as intended, with balances at 31 December 2017 increasing 38.8% to £452.3 million (2016: £325.9 million). Our Retail Finance business has continued to evolve as we have grown into one of the largest participants in this market. We are writing a broader spectrum of business including increased levels of interest bearing lending. This lending has higher levels of impairments compared to interest free finance and this is factored into our pricing to ensure we achieve our targeted risk adjusted return. The impairments and risk adjusted returns in 2017 have been in line with our expectations.
ꢀ3ꢁ.ꢁꢂ2ꢁ17
ꢀ27.5ꢂ2ꢁ16 ꢀ36.5ꢂ2ꢁ15
ꢃꢄoꢅꢆt ꢇeꢅoꢄe taꢈ
ꢀ32.ꢁꢂ2ꢁ17
ꢀ32.9ꢂ2ꢁ16 ꢀ26.7ꢂ2ꢁ15
ꢃꢄꢅeꢆlꢇꢈꢄꢉ ꢊꢆoꢋꢈt ꢌeꢋoꢆe taꢍꢎ
ꢀ137.5ꢁ2ꢂ17
ꢀ129.3ꢁ2ꢂ16 ꢀ132.5ꢁ2ꢂ15
ꢃꢄeꢅatꢆꢇꢈ ꢆꢇꢉoꢁe
ꢀ1ꢁ891.6ꢂ2ꢃ17
ꢀ1ꢁ51ꢃ.ꢃꢂ2ꢃ16 ꢀ1ꢁ247.4ꢂ2ꢃ15
Total assets
16.5ꢀ2ꢁ17
17.4ꢀ2ꢁ16 13.6ꢀ2ꢁ15
ꢂoꢃꢃoꢄ ꢅꢆꢇꢈtꢉ Tꢈeꢊ 1 ꢋꢌꢂꢅT1ꢍꢎ ꢏaꢐꢈtal ꢊatꢈo
1ꢀ7.8ꢁ2ꢀ17
1ꢀ9ꢁ2ꢀ16
1ꢀ4ꢁ2ꢀ15
ꢂoaꢃ to ꢄeꢅosꢆt ꢇatꢆo
* Underlying profit is the profit attributable to continuing operations, adjusted for items that are outside of the Group’s normal recurring business activities. A reconciliation of underlying profit before tax to statutory profit before tax is provided on page 14.
Financial Highlights
Earnings per share
128.8p2016: 754.1p 2015: 157.8p
Secure Trust Bank PLC Annual Report & Accounts 2017 Straightforward transparent banking
10
Business FinanceThe Group’s SME lending operations have grown strongly, as targeted, and I expect further positive progress in 2018 given we started the year with a new business pipeline which is higher than it has ever been. Total business lending in 2017 increased 31% to £824.0 million (2016: £631.0 million). Real Estate Finance lending balances increased by 28.8% to £580.8 million as at 31 December 2017 (2016: £451.0 million).The bias of this portfolio is 70% weighted in favour of residential investment finance. We have continued to adopt a cautious stance towards Central London house building finance. Outside of Central London demand for property development finance has remained robust and the units we have financed have continued to sell well, in a number of cases faster and for higher values than originally expected. The average LTV across the whole portfolio remains less than 60%.
Secure Trust Bank Commercial Finance, the invoice finance division of the Bank, has had a good year and has now funded over £1 billion of customers’ invoices. Excluding the systemic banks, by size we are now the 5th largest operator in the invoice finance market but given the fragmented nature of the market we have substantial opportunities to continue to grow very strongly in this sector. This is evidenced by customer lending balances, which net of provisions grew 101% to £126.5 million at 31 December 2017 (2016: £62.8 million). I continue to believe we have one of the most capable teams of invoice financiers in the UK, supported by a scalable modern IT platform. This, coupled with Group management’s experience in SME and corporate lending, gives STB a distinct advantage when it comes to structuring transactions and responding rapidly to opportunities.
In Asset Finance we continued to enjoy a good strategic partnership with Haydock Finance during 2017. I disclosed within the CEO’s statement in the 2017 interim accounts that we had adopted a more cautious risk appetite in Asset Finance. Customer lending balances, originated by Haydock Finance Limited but written by STB and fully conforming to STB’s credit policies have remained flat over the last year at £116.7 million compared to £117.2 million a year ago. In December 2017 it was announced that manager owners of Haydock had sold a controlling stake to funds managed by Apollo Global Management. This transaction completed in January 2018. We are in discussion with Haydock about the effect of the change of control on our relationship.
We made significant progress in repositioning the motor book. During 2017 all lenders operating in the sub-prime market reported a trend of increasing impairments. These trends would appear to vindicate our decision to exit sub-prime motor finance after we identified warning signs in this part of the market during the second half of 2016. Notwithstanding the cessation of new sub-prime loan origination, STB has been able to achieve strong lending with lending balances, net of provisions, growing 16.3% to £274.6 million at 31 December 2017 (2016: £236.2 million). The vast majority of motor finance business now being written is in our two highest quality categories and is performing in line with our expectations. The proportion of lending written in these categories in the final quarter of 2017 was almost double that in the same period in 2016. The average loan to value of this lending is materially lower than has historically been the case. This change in the new business mix is driving a significant shift in the quality of the overall portfolio which should over time drive higher returns. Recognising the run off nature of the sub-prime motor book we have increased the level of provision coverage held which has driven an increase in impairments in this portfolio.
As previously announced, the unsecured personal loan (UPL) portfolio was sold in December 2017. STB has a large amount of experience in the UPL market, having been active in that market since STB’s formation in 1952, but at times has elected to reduce its exposure, for instance substantially reducing our UPL activity in 2006-08, in response to an unattractive competitor pricing environment at the time. We intend to re-enter the UPL market once the risk adjusted yields available become more attractive.
We started the year with a new business pipeline which is higher than it has ever been.
Chief Executive’s statementcontinued

Strategic Report Corporate Governance Report
Financial Statements
11www.securetrustbank.co.uk
Customer base continues to increase and customer satisfaction levels remain very positive Across our chosen markets we are serving a record number of customers (989,528), an increase of 33% on the total customer base of 742,974 as at 31 December 2016, excluding discontinued operations.
Customer satisfaction is measured in a number of ways. It is reassuring, that 2017 has once again seen us consistently achieve customer satisfaction ratings in excess of 90% across all of our products as measured by FEEFO. We also use Net Promoter Scores to assess our customer service and these scores exhibit similar positive trends to those derived from FEEFO.
I am delighted to confirm that for the fifth year running we have retained the Customer Service Excellence standard. This standard was introduced by the Cabinet Office in 2010 to replace the Kite Mark. This indicates our customer service has been judged to meet Government standards of excellence which are benchmarked against high-performing organisations. The final report made particular reference to the professionalism of our staff, commenting on their openness and positivity about working for STB, as well as citing the work we do for our vulnerable customers and the initiatives we have implemented during 2017 to improve our customer experience. I heartily congratulate my colleagues on this fantastic achievement and echo the Chairman in thanking all of our colleagues for their customer focus and professionalism during a year of very significant change.
Fee based accountsAs expected, the legacy OneBill product which closed for new business in 2009, continues to see customer numbers decline over time. Customer numbers fell to 18,963 by 31 December 2017 compared to 19,995 a year earlier.
Debt Managers Services (‘DMS’)The markets for those debt collection agencies fully authorised by the Financial Conduct Authority improved further in 2017 as more operators exited the market or were consolidated within larger entities. These attributes translated into more opportunities for DMS in the third party debt collection and portfolio acquisition spaces during 2017. Overall, the profit before tax of £0.6 million in 2017 was well above the £0.2 million recorded for the prior year.
Loans & Advances to Customers:
Real Estate Finance £580.8m
Asset Finance £116.7m
Commercial Finance £126.5m
Retail Finance £452.3m
Motor Finance £274.6m
Consumer Mortgages £16.5m
Other £30.9m
Total: £1,598.3m
New Business Volumes:
Real Estate Finance £286.5m
Asset Finance £50.9m
Commercial Finance £52.6m
Retail Finance £520.0m
Motor Finance £142.8m
Consumer Mortgages £16.4m
Other £7.9m
Total: £1,077.1m
Operational Highlights
Loans & Advances to Customers
£1,598.3m2016: £1,321.0m2015: £1,074.9m

Secure Trust Bank PLC Annual Report & Accounts 2017 Straightforward transparent banking
12
Competitive and regulatory environmentIn my annual statement last year I was optimistic about the potential that action by regulators could help to improve the competitive positioning of smaller banks in the UK. I am therefore pleased to say that the changes to the capital regulations announced by the Basel Committee on Banking Supervision in December 2017 are welcomed by the Group. The primary changes relate to a) the introduction of more risk sensitivity into the risk weights used in the standardised approach (the approach usually adopted by smaller banks) and b) the imposition of a capital floor whereby the outputs generated by larger banks using the Internal Ratings Based approach will be floored at 72.5% of the risk weights used under the standardised approach.
To put the scale of these changes into context, I should note that as matters currently stand the differing capital approaches allow IRB banks to hold significantly less capital than a smaller competitor for taking the exact same risks. These differences can be 500%+ and are most pronounced in the residential mortgage market and to a lesser extent the Buy to Let (BTL) market. It is evident that the revisions announced, once fully implemented will largely remove the substantial capital advantages enjoyed by the systemic banks in certain lending classes. This is especially so in the mortgage markets referred to above.
At the macro level it is apparent that the regulatory direction of travel is to reduce the capital differentials between the systemic and non-systemic firms which should ultimately bode well for smaller banks. It should also benefit consumers and SMEs by fostering competition thereby creating more innovation and choice and reducing the risks that the taxpayer will need to fund the bail out of failed banks in the future.
Chief Executive’s statementcontinued
Our long-term ambition remains to grow a broad based portfolio, balanced across consumer finance, SME finance and residential mortgage lending.
Strategic prioritiesThe benefits of the Group’s three strategic priorities of: (i) organic growth, (ii) diversification and (iii) M&A activity were very clear last year. The broad based diversification in the lending portfolios ensured that we were able to undertake a significant strategic repositioning of our risk profile while increasing the overall customer lending balances year on year by 21% and growing statutory pre-tax profits by 32% (on a continuing basis).
The focus for 2018 is on
1. Organic growth in responsible lending across a diverse portfolio of attractive segments
2. Continued investment in broadening our product offerings to customers
3. Pursuing M&A activity on an opportunistic basis
4. Optimising our capital and liquidity strategies
5. Continuing to target delivering profit growth in the medium term to create shareholder value
Our long-term ambition remains to grow a broad based portfolio, balanced across consumer finance, SME finance and residential mortgage lending.
We will continue to grow our Retail Point of Sale (V12) and Motor propositions in the Consumer Finance sector. V12 has delivered five years of record balance sheet and profit growth since being acquired in January 2013. Whilst now a top five player it has a modest market share and considerable potential to continue growing our lending balances which are relatively short term in duration and prime in nature. In addition to writing loans on our own account, V12 will extend the number of retailer relationships benefitting from the dual lending panel scheme which was initially launched with AO.com in Q3 2017.
The market for Motor Finance in the UK is nearly £20 billion. This is a highly fragmented and competitive space where we have a £0.25 billion share predominantly in non-prime lending. This is an important and profitable line of business for us. We see opportunities to continue to grow our non-prime lending. However we also wish to extend our proposition to target the prime section of the market served by other specialist lenders which we estimate is several £bn in scale. It is readily apparent that the lenders in this space enjoy attractive returns on equity. In January 2018 the new Managing Director and Finance Director for our Motor Finance business commenced their roles and they have been tasked with improving the profitability of the near prime motor business whilst developing our strategy to enter the prime market and grow a sizable business in this space over the next 3-5 years.

Strategic Report Corporate Governance Report
Financial Statements
13www.securetrustbank.co.uk
We remain committed to supporting the Government policy of building more new homes. Our activities in this space in 2017 were negatively impacted by the 50% increase in the risk weights applied to the capital requirements imposed on all small banks in December 2016. The need to increase lending margins to offset the higher capital costs dampened borrower demand for our development finance loans in 2017. We are exploring ways to address these dynamics. Our Loan to Gross Development Value limits will remain modest to ensure that the borrower has hard equity in any deal and to provide a buffer lest market values fall.
The UK invoice finance and asset finance markets are large, fragmented and growing markets of around £20 billion each. We are pleased with the progress made by STB Commercial Finance. We see significant future growth potential and would be interested in acquiring businesses in these spaces if the risk profile and economics of any transaction are attractive.
The mortgage market is exhibiting greater pricing pressures at the moment which I attribute to many lenders seeking to maximise utilisation of the TFS scheme prior to its closure for new lending in February 2018. As we progress through 2018 I expect pricing pressures will ease which will allow us to compete more effectively. As previously disclosed the creation of this new business operation involves up-front investment and attractive returns on equity will take time to materialise whilst we work through the front book: back book dynamic that is a prominent feature of mortgage lending. The Basel Committee changes referred to above should, in time, have a positive effect on returns for lower LTV lending undertaken by smaller banks.
We are seeking to negate the ‘J’ curve effect via acquisition of existing mortgage lenders and/or portfolios which offer acceptable risk and economic profiles. During 2017 we engaged in a number of discussions relating to inorganic business opportunities but these did not progress to a conclusion that was acceptable to us. Our previous M&A activities have generated considerable shareholder value due in part to the discipline that we apply. We will continue to be disciplined in our approach to opportunities. It is noteworthy that many of the portfolios currently available relate to second charge lending. This is an area where some market practices have drawn regulatory focus and is not a part of the market we wish to operate in.
The Board reviews the Group’s capital structure on an ongoing basis and will explore options to optimise the capital base, which could include the raising of Alternative Tier 1 or Tier 2 capital, subject to market conditions and the Board determining that it is advantageous to do so. The Group’s ongoing strategy is to significantly grow its lending operations.
Current trading and outlook We are pleased with the new business momentum which has continued to build as the first quarter progressed and there has been no material change to the underlying performance of the business in the early months of 2018. All of the leading indicators suggest the changes made during 2017 in respect of motor finance credit underwriting and policy will deliver the expected improvements in impairments going forward. As such, we continue to see potential to grow our lending portfolio in line with our ambition.
I am pleased with the revisions made by the Basel Committee in respect of the capital requirements of smaller lenders relative to the systemic firms. Whilst it will take time for the benefits of these changes to be realised, it bodes well for smaller firms.
On one hand the UK faces a period of heightened economic uncertainty with weak consumer confidence and reduced levels of business investment. On the other hand current UK economic fundamentals are solid and the economy is benefiting from the rising tide being created by stronger growth in the US, Asia and Europe. With record employment levels and the prospect of inflation levels subsiding as the effects of the recent appreciation of sterling against the dollar begin to flow through, there are certainly grounds for optimism. It seems likely that the catalyst for a rebound in consumer and business confidence which will drive higher GDP growth will be a positive outcome in the negotiations for the UK’s exit from the EU.
Our approach to the market reflects evolving economic conditions and our credit appetite will be kept under review. The benefits of our strategic repositioning should be more visible as we progress through 2018 as the drag effects of the run off sub-prime motor book and the investment in new business operations such as mortgages and the deposit platform ease whilst the SME activities continue to grow.
Our long term strategic objective is to be active in Consumer Credit, SME Finance and Mortgage Lending. This enables flexibility to restrict lending in areas which may be overheating as demonstrated in 2017 and instead allocate capital for more sustainable risk adjusted returns. Notwithstanding the current uncertain economic outlook, I believe there remains considerable scope to pursue our strategic priorities by developing the business model organically and pursuing attractive acquisition opportunities.
Paul Lynam Chief Executive Officer
21 March 2018

Secure Trust Bank PLC Annual Report & Accounts 2017 Straightforward transparent banking
14
Financial review
Summarised income statement
Underlying profit reconciliation
2017Continuing operations
£million
2017Discontinued
operations£million
2017 Total
£million
2016Continuing operations
£million
2016Discontinued
operations£million
2016 Total
£million
Interest, fee and commission income 157.3 8.0 165.3 135.1 22.4 157.5Interest, fee and commission expense (27.8) – (27.8) (28.1) (0.1) (28.2)
Operating income 129.5 8.0 137.5 107.0 22.3 129.3Impairment losses (33.5) (3.4) (36.9) (23.3) (7.0) (30.3)Operating expenses (71.3) (0.3) (71.6) (64.3) (7.2) (71.5)Profit on sale of NSF shares 0.3 – 0.3 – – –
Profit before tax 25.0 4.3 29.3 19.4 8.1 27.5Underlying adjustments to profit (see below) 2.0 – 2.0 7.9 (2.5) 5.4
Underlying profit before tax (including PLD) 27.0 4.3 31.3 27.3 5.6 32.9Discontinued operations - PLD – (4.3) (4.3) – (5.6) (5.6)
Total underlying adjustments to profit 2.0 (4.3) (2.3) 7.9 (8.1) (0.2)
Underlying profit before tax 27.0 – 27.0 27.3 – 27.3Underlying tax (5.5) – (5.5) (6.7) – (6.7)
Underlying profit after tax 21.5 – 21.5 20.6 – 20.6
Underlying basic earnings per share (pence) 116.4 – 116.4 113.0 – 113.0
Statutory resultsProfit before tax 25.0 4.3 29.3 19.4 8.1 27.5Tax (5.1) (0.8) (5.9) (5.2) (1.6) (6.8)
Profit after tax 19.9 3.5 23.4 14.2 6.5 20.7Gain recognised on disposal after tax – 0.4 0.4 – 116.8 116.8
Profit for the period 19.9 3.9 23.8 14.2 123.3 137.5
Basic earnings per share (pence) 107.7 21.1 128.8 77.9 676.2 754.1
Underlying adjustments to profitFair value amortisation 0.9 – 0.9 0.9 – 0.9Share based incentive scheme – – – (0.7) – (0.7)Net Arbuthnot Banking Group management recharges – – – 0.2 – 0.2Transformation costs 0.8 – 0.8 3.4 – 3.4Costs of moving to Main Market – – – 1.4 – 1.4Bonus payments made in respect of ELG sale – – – 3.5 – 3.5Other bonus payments 0.6 – 0.6 – – – Other items relating to ELG sale – – – (0.8) – (0.8)Profit on sale of NSF plc shares (0.3) – (0.3) – – – Discontinued operations - ELG – – – – (2.5) (2.5)
Underlying adjustments to profit 2.0 – 2.0 7.9 (2.5) 5.4

Strategic Report Corporate Governance Report
Financial Statements
15www.securetrustbank.co.uk
Basis of preparationThe Group uses underlying profit for planning and reporting purposes, as it improves the comparability of information between reporting periods. The underlying adjustments to profit relate to non-controllable items or other items that fall outside of the Group’s core business activities, as explained further below:
Fair value amortisation relates to the acquisition of V12 Finance Group. The acquisition accounting required identifiable assets and liabilities to be adjusted to their fair value, and these adjustments are subject to amortisation.
The share based incentive scheme movements have been driven primarily by market conditions, specifically the volatility of UK share prices, rather than factors controllable by the Group. In prior years, this charge related primarily to directors and was not considered to be part of the Group’s core business activities. Since the launch of a number of new share schemes during 2017, these are now more widely spread across the employees of the Group, and therefore are now considered to be part of core business activities, and therefore are not adjusted for in underlying profit.
The adjustment in 2017 in respect of other bonus payments relates to a long term incentive plan that was set up for a small number of employees on the creation of the Commercial Finance business. The scheme is based on profits earned by that business up to the end of 2019, and is payable in 2020.
Arbuthnot Banking Group management charges will no longer be levied following the sale of their controlling interest in the Group, so the adjustment of these items from underlying profit aids comparability.
Transformation costs comprise the costs of setting up the Group’s Consumer Mortgage operation and of closing the current account and unsecured personal lending products.
The move to the Main Market, bonus payments, profit on sale of Non-Standard Finance plc (NSF) shares and discontinued activities also represent non-core activities, which have therefore been adjusted for to derive underlying profit.

Secure Trust Bank PLC Annual Report & Accounts 2017 Straightforward transparent banking
16
Financial reviewcontinued
Unsecured personal loan portfolio: profit before tax
Profit before tax as
announced £million
Non-core items added
back £million
Internal cost of funds
added back£million
Internal attributable
costs added back
£million
Statutory profit
before tax£million
Tax£million
Statutory profit
after tax£million
Year ended 31 December 2017 2.4 – 1.5 0.4 4.3 (0.8) 3.5Six months ended 30 June 2017 1.3 – 0.8 0.3 2.4 (0.5) 1.9Year ended 31 December 2016 2.1 (0.3) 2.2 1.6 5.6 (1.1) 4.5
Discontinued operationsOn 13 April 2016 the Group completed the sale of its branch based non-standard consumer lending business, the EveryDay Loans Group (ELG), to NSF generating a gain on disposal of £116.8 million. Results relating to ELG have therefore been analysed as discontinued operations throughout these Annual Report and Accounts.
On 21 December 2017 the Group sold a portfolio of legacy unsecured personal loans (PLD) to Alpha Credit Solutions 8 S.à.r.l., a company owned by AnaCap Credit Opportunities III LP. Results relating to the portfolio of unsecured personal loans have therefore been analysed as discontinued operations throughout these Annual Report and Accounts. The profit before tax relating to the unsecured personal loan portfolio announced shortly after its sale for the year ended 31 December 2016 and six months ended 30 June 2017, together with its results for the year ended 31 December 2017 on a similar basis, has been adjusted for statutory purposes in the table at the foot of this page.
Unless otherwise stated, the analyses that follow relate to continuing operations, which represents all of the Group’s divisions, excluding ELG and PLD.
Key performance indicators (KPIs)A summary of the KPIs is set out on page 19 of this Financial Review. Definitions of the KPIs, their calculation and the reasons for their use can be found in the Appendix to the Annual Report on page 183.
For this reporting period, underlying profit before tax (including PLD) is also presented as, since PLD was disposed of close to the 2017 year end, this aids comparability with the prior year.
Interest, fee and commission incomeInterest, fee and commission income is made up of interest receivable, which is predominantly earned on loans and advances to customers, and fee and commission income, which consists principally of weekly and monthly fees from the OneBill, Commercial Finance and Retail Finance products, and commissions earned on debt collection activities in DMS.
Interest receivable from continuing operations was £141.3 million for 2017, increasing by £22.5 million (18.9%) on 2016, which was driven by the growth of the Group’s loan books over the year.
Fee and commission income from continuing operations was £16.0 million for 2017, reducing by £0.3 million (1.8%) on 2016. The fee income relating to OneBill has continued to decrease year on year, and no fees were earned on the current account product during 2017, as these products have been closed to new business; OneBill in 2009 and current account in 2015. This income has been replaced by increasing levels of fees earned on Commercial Finance and Retail Finance lending, as these books continue to grow.
Interest, fee and commission expenseInterest, fee and commission expense is made up of interest expense in respect of deposits from customers, and fee and commission expense, comprising mainly fees and commissions on the Commercial Finance and Motor products, and commissions paid on debt collection activities in DMS.
Interest expense was £26.7 million for 2017, increasing by £0.4 million (1.5%) on 2016. The cost of funding reduced from 2.5% for 2016 to 1.9% for 2017. This reflects the market for funding, in which the Group has continued to be able to replace maturing term deposits with new deposits of the same tenor, but at a lower rate. In addition a greater proportion of new fixed bonds have a lower tenor and this has resulted in the reduction in interest rates of fixed rate products in the deposit book.
The Group’s net interest margin reduced from 8.7% in 2016 to 8.1% in 2017 as a result of the repositioning to lower risk lower return lending, partially offset by the reduction achieved in funding costs.
Fee and commission expense has fallen by £0.7 million (38.9%). In 2016, this consisted primarily of fees and commissions relating to the current account product, which have ceased following the closure of this product.

Strategic Report Corporate Governance Report
Financial Statements
17www.securetrustbank.co.uk
Summarised balance sheet2017
£million2016
£million
Assets Cash and balances at central banks 226.1 112.0Debt securities held-to-maturity 5.0 20.0Loans and advances to banks 34.3 18.2Loans and advances to customers 1,598.3 1,321.0Other assets 27.9 38.8
1,891.6 1,510.0
Liabilities Due to banks 113.0 70.0Deposits from customers 1,483.2 1,151.8Other liabilities 46.3 52.2
1,642.5 1,274.0
Operating income Operating income increased by 21% to £129.5 million.
The net revenue margin for 2017 was 9.1% compared with 10.0% for 2016. The gross revenue margin for 2017 was 11.1% compared with 12.7% for 2016. The reductions in these margins are due to the factors referred to above.
Impairment lossesImpairment losses during the year were £33.5 million (2016: £23.3 million). This increase is due to the growth of the business and consequent increase in the size of loans and advances to customers, and additional impairment provision in respect of the performance of certain elements of the Motor Finance back book. This performance is expected to improve in future years as better quality assets replace these elements.
The cost of risk for 2017 was 2.4%, compared with 2.2% for 2016. Further analysis of the Group’s loan book and its credit risk exposures is provided in Notes 10, 12 and 29.
Operating expensesOperating expenses from continuing operations have increased, reflecting the investments made in the infrastructure and staff resources of the Group to achieve growth targets, from £64.3 million in 2016 to £71.3 million in 2017. The Group’s cost to income ratio reduced to 55.1% from 60.1% for 2016.
Underlying profitOn a continuing operations basis, underlying profit before tax was £27.0 million (2016: £27.3 million). When results for PLD are included, underlying profit before tax is down 4.9% to £31.3 million (2016: £32.9 million).
TaxationThe effective underlying tax rate has fallen to 20.4% (2016: 24.5%). The effective rate in 2016 was impacted by a prior period adjustment of £1.8 million. The new Bank Corporation tax surcharge of 8%, which is effective from 1 January 2016, would apply to any future taxable profits of Secure Trust Bank PLC company that were in excess of £25.0 million.
Distributions to shareholdersThe directors recommend the payment of a final dividend of 61 pence per share which, together with the interim dividend of 18 pence per share paid on 29 September 2017, represents a total dividend for the year of 79 pence per share (2016: 75 pence per share, excluding a special dividend of 165 pence per share paid following completion of the sale of ELG).
Earnings per shareDetailed disclosures of earnings per ordinary share are shown in Note 8 to the financial statements. Basic earnings per share increased by 38.3% to 107.7 pence per share (2016: 77.9 pence), as a result of the increase in profit after tax. The underlying basic earnings per share increased by 3.0% to 116.4 pence per share (2016: 113.0 pence per share).
Summarised balance sheetThe assets of the Group increased by 25.3% to £1,891.6 million, primarily driven by the growth in the Group’s loan portfolios and overall cash balances.
The Group measures returns against average assets, average equity and required equity as set out in the KPIs table on page 19. These ratios have all fallen in comparison to the prior year. This is as expected as the Group continues to reposition its lending towards lower risk segments.
The liabilities of the Group increased by 28.9% to £1,642.5 million, primarily driven by the increase in deposits from customers, providing funding for the Group’s lending activities.
Secure Trust Bank PLC Annual Report & Accounts 2017 Straightforward transparent banking
18
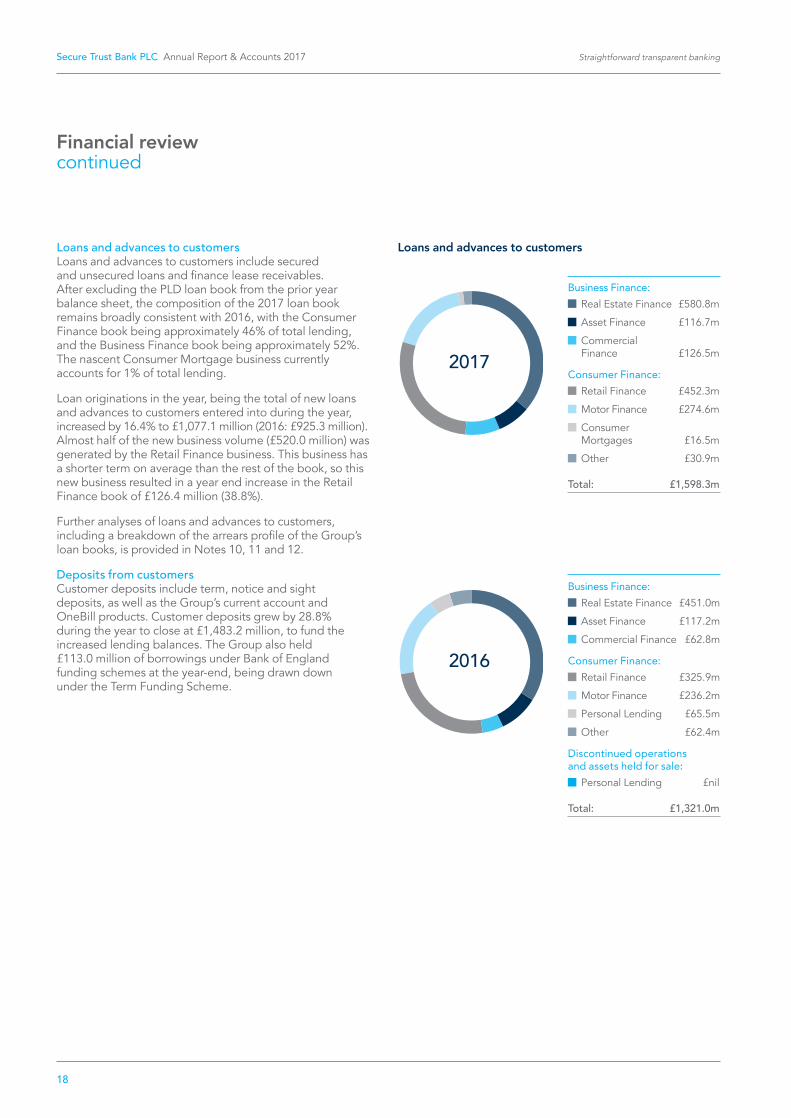
Loans and advances to customers Loans and advances to customers include secured and unsecured loans and finance lease receivables. After excluding the PLD loan book from the prior year balance sheet, the composition of the 2017 loan book remains broadly consistent with 2016, with the Consumer Finance book being approximately 46% of total lending, and the Business Finance book being approximately 52%. The nascent Consumer Mortgage business currently accounts for 1% of total lending.
Loan originations in the year, being the total of new loans and advances to customers entered into during the year, increased by 16.4% to £1,077.1 million (2016: £925.3 million). Almost half of the new business volume (£520.0 million) was generated by the Retail Finance business. This business has a shorter term on average than the rest of the book, so this new business resulted in a year end increase in the Retail Finance book of £126.4 million (38.8%).
Further analyses of loans and advances to customers, including a breakdown of the arrears profile of the Group’s loan books, is provided in Notes 10, 11 and 12.
Deposits from customersCustomer deposits include term, notice and sight deposits, as well as the Group’s current account and OneBill products. Customer deposits grew by 28.8% during the year to close at £1,483.2 million, to fund the increased lending balances. The Group also held £113.0 million of borrowings under Bank of England funding schemes at the year-end, being drawn down under the Term Funding Scheme.
Business Finance: Real Estate Finance £451.0m
Asset Finance £117.2m
Commercial Finance £62.8m
Consumer Finance: Retail Finance £325.9m
Motor Finance £236.2m
Personal Lending £65.5m
Other £62.4m
Discontinued operations and assets held for sale:
Personal Lending £nil
Total: £1,321.0m
Business Finance: Real Estate Finance £580.8m
Asset Finance £116.7m
Commercial Finance £126.5m
Consumer Finance: Retail Finance £452.3m
Motor Finance £274.6m
Consumer Mortgages £16.5m
Other £30.9m
Total: £1,598.3m
Loans and advances to customers
2017
2016
Financial reviewcontinued

Strategic Report Corporate Governance Report
Financial Statements
19www.securetrustbank.co.uk
Key Performance Indicators2017 2016
Financial KPIs:
Margin ratiosNet interest margin 8.1% 8.7%Net revenue margin 9.1% 10.0%Gross revenue margin 11.1% 12.7%
Cost ratiosCost of risk 2.4% 2.2%Cost of funds 1.9% 2.5%Cost to income ratio 55.1% 60.1%
Underlying profitUnderlying profit before tax £27.0 million £27.3 millionUnderlying profit (including PLD) £31.3 million £32.9 million
Return ratiosUnderlying return on average assets 1.3% 1.6%Underlying return on average equity 8.9% 9.8%Underlying return on required equity 13.5% 17.1%
Funding ratiosLoan to deposit ratio 107.8% 109.0%Total funding ratio 115.5% 110.4%
Non-Financial KPIs: Customer FEEFO ratings (mark out of 5 based on star rating from 608 reviews (2016: 400 reviews)) 4.7 4.5Employee survey engagement score (based on 2017 all staff survey) 78% 85%Environmental intensity indicator (tonnes carbon dioxide per £1 million group income) 4.2 5.4
Debt Managers (Services) LimitedDebt Managers (Services) Limited (DMS) is the Bank’s debt collection business. DMS collects debt on behalf of a range of clients as well as for group companies. It also selectively invests in purchased debt portfolios from fellow subsidiary undertakings and external third parties. DMS was purchased by the Bank in January 2013, since when it has grown its number of debts under management to over 300,000.
In 2017 DMS performed well with revenue increasing by 24% from £4.6 million to £5.7 million and profit before tax increasing significantly from £0.2 million to £0.6 million. This was achieved through the development of relationships with new and existing clients and a broadening of service offerings.
Key performance indicatorsThe following key performance indicators, stated for continuing operations, are the primary measures used by management to assess the performance of the Group:
The Remuneration Report, starting on page 82, sets out how executive pay is linked to the assessment of key financial and non-financial performance metrics.

Secure Trust Bank PLC Annual Report & Accounts 2017 Straightforward transparent banking
20
Capital2017
£million2016
£million
Capital CET1 capital 238.9 227.4Total Tier 2 capital 4.4 5.3
Total capital 243.3 232.7
Total Risk Exposure 1,446.1 1,264.0
2017 %
2016 %
CRD IV ratiosCET1 capital (group consolidated) 16.5 18.0Leverage Ratio 12.3 14.5
Capital, leverage and liquidity
CapitalThe Group’s capital management policy is focused on optimising shareholder value over the long-term. Capital is allocated to achieve targeted risk adjusted returns whilst ensuring appropriate surpluses are held above the minimum regulatory requirements. The Board reviews the capital position at every Board meeting.
The Group’s regulatory capital is divided into:
• CET1 which comprises shareholders’ funds, after deducting intangible assets and deferred tax assets which have arisen due to losses.
• Tier 2 capital which comprises the collective allowance for impairment. Under IFRS 9, there is no longer a collective allowance, and therefore at 1 January 2018 the Group will not hold any Tier 2 capital.
The Group’s Individual Capital Adequacy Assessment Process (“ICAAP”) includes a summary of the capital required to mitigate the identified risks in its regulated entities and the amount of capital that the Group has available. All regulated entities within the Group have complied during the financial year with all of the externally imposed capital requirements to which they are subject.
The Group operates the standardised approach to credit risk, whereby risk weightings are applied to the Group’s on and off balance sheet exposures. The weightings applied are those stipulated in the Capital Requirements Regulation.
An analysis of CET1 capital can be found in Note 32 to the financial statements.
Total Risk Exposure has increased by 14.4% to £1,446.1 million reflecting the significant growth in both Business Finance and Consumer Finance Lending, and the increase in the risk weights applied to residential development lending activities from 100% to 150% as advised by the Bank of England in December 2016.
The CET1 capital ratio is the ratio of CET1 capital divided by the Total Risk Exposure. The Group has maintained a robust CET1 capital ratio and this provides a significant capital buffer for continued growth.
LeverageThe Basel III framework introduced a relatively simple, transparent, non-risk based leverage ratio to act as a supplementary measure to the risk-based capital requirements. The leverage ratio is intended to restrict the build-up of leverage in the banking sector to avoid destabilising deleveraging processes that can damage the broader financial system and the economy, whilst reinforcing the risk-based requirements with a complementary simple, non-risk based ‘backstop’ measure.
The Basel III leverage ratio is defined by the Capital Requirements Regulation as Tier 1 capital divided by on and off balance sheet asset exposure values, expressed as a percentage. The UK leverage ratio framework sets a minimum ratio of 3.0%, which increased to 3.25% on 1 January 2018.
As shown in the table below, the Bank has a leverage ratio at 31 December 2017 of 12.3% (31 December 2016: 14.5%), comfortably ahead of the minimum requirement.

Strategic Report Corporate Governance Report
Financial Statements
21www.securetrustbank.co.uk
Liquid Assets2017
£million2016
£million
Liquid Assets:Aaa – Aa3 231.1 132.0A1 – A3 29.3 13.2Unrated 5.0 5.0
Liquidity Exposures 265.4 150.2
LiquidityThe Group continues to manage its liquidity on a conservative basis by holding High Quality Liquid Assets and utilising predominantly retail funding from customer deposits. In December 2012, Secure Trust Bank was admitted as a participant in the Bank of England’s Sterling Money Market Operations under the Sterling Monetary Framework, to participate in the Discount Window Facility. From July 2013, the Group was permitted to draw down facilities under the Funding for Lending Scheme. Funding for Lending Scheme monies were maintained as a liquidity buffer, above that required to support lending. During 2017, these borrowings were repaid by the Group, and exposure to the Funding for Lending Scheme ended. Subsequently, funds were redrawn for a similar purpose under the new less expensive Term Funding Scheme.
At 31 December 2017 and throughout the year, the Group had significant surplus liquidity over the minimum requirements due to its stock of High Quality Liquid Assets, in the form of the Bank of England Reserve Account and UK Treasury Bills. As shown in the table below, total liquid assets increased by 77% from £150.2 million to £265.4 million, with the High Quality Liquid Assets balance being £231.1 million.
The Group has no liquid asset exposures outside of the United Kingdom and no amounts that are either past due or impaired.
The Group’s Liquidity Coverage Ratio (“LCR”), and other measures used by management to manage liquidity risk, are described in the Principal Risks and Uncertainties section of the Strategic Report.

22
Straightforward transparent bankingSecure Trust Bank PLC Annual Report & Accounts 2017
Real Estate FinanceReal Estate Finance was formed as a division within the Group in 2013. The division supports SMEs in providing finance principally for residential development and residential investment.
Asset FinanceAsset Finance was formed as a division within the Group in December 2014.
Commercial FinanceCommercial Finance was formed as a division within the Group in 2014.
Business Finance

23www.securetrustbank.co.uk
Strategic Report – Business Review Corporate Governance Report
Financial Statements
2017 Total Business Finance Lending
£824.0mThe Group’s SME lending operations have grown strongly.
Increase in Business Finance Lending (2016 – £631.0m)
31%

Secure Trust Bank PLC Annual Report & Accounts 2017 Straightforward transparent banking
24
Business reviewBusiness Finance
Real Estate Finance
Secure Trust Bank has continued to support The Dorchester Group with the phased development of Heyford Park in Oxfordshire.
What we do
Residential DevelopmentThe Group lends to enable the development of new build property, commercial to residential conversions (including those with permitted development rights) and refurbishment projects.
Residential InvestmentThe Group lends on portfolios of residential property where the rental income will repay the underlying borrowing over a term period. This excludes the regulated buy to let mortgage sector.
Other lendingThe Group has limited appetite for commercial lending (either development or investment) and has limited exposure to mixed development schemes.
How we do itFinancing is typically provided over a term of up to five years with prudent loan to value targets, with a 60% Loan to Gross Development Value to residential house builders. More restrictive policies are implemented from time to time as required; for instance the Group reduced its financing of residential developments in Central London in 2015. The Group’s Loan to Gross Development Value / Loan to Value (“LTV”) ratios average 58% across all lending areas.
The Real Estate Finance team is staffed by experienced bankers with proven property lending expertise. The team provides full support to customers and introducers over the life of the products.
Growth has continued to be concentrated on Investment business.

Strategic Report – Business Review Corporate Governance Report
Financial Statements
25www.securetrustbank.co.uk
Revenue and lending performance vs prior years
2017 performanceThe Group has continued to grow its Real Estate Finance business during 2017, with balances up 29% in the year. Growth has continued to be concentrated on Investment business, which grew by 47%, whilst Development lending fell by 2% in the year. This reflected repayments on a number of high-value developments in London, all of which repaid in full, and the impact of higher capital requirements on Development lending, which has limited the amount of new lending the Group was prepared to write. The lower yielding Investment book now represents 72% of the overall portfolio, and this change in product mix explains the lower level of growth in lending revenues in the year compared to balance growth. The increase in balances has not been at the expense of credit quality, with the overall LTV ratio reducing by 1% in the year. No specific losses have occurred, enabling the Group to reduce the overall level of provisions by £0.2 million compared to 2016.
Looking forwardThe business remains committed to growing the book further in 2018, but remains cautious around credit policy, especially in the light of more uncertain market conditions. Appetite for Development business remains and opportunities to mitigate the capital impact are being investigated, whilst the business will continue to seek to diversify its geographic and product mix to bring further balance to the book.
ꢀ32.3ꢁ2ꢂ17
ꢀ28.4ꢁ2ꢂ16 ꢀ2ꢂ.3ꢁ2ꢂ15
ꢃeal ꢄstate ꢅꢆꢇaꢇꢈe leꢇꢉꢆꢇꢊ ꢋeꢌeꢇꢍe
ꢀ58ꢁ.8ꢂ2ꢁ17
ꢀ451.ꢁꢂ2ꢁ16 ꢀ368.ꢁꢂ2ꢁ15
ꢃeal ꢄstate ꢅꢆꢇaꢇꢈe leꢇꢉꢆꢇꢊ ꢋalaꢇꢈe at 31 ꢌeꢈeꢂꢋeꢍ
ꢀꢁꢂ.2ꢃꢄ2ꢂ17
ꢀꢂ.1ꢄ2ꢂ16 ꢀꢅꢆl2ꢂ15
ꢇeal ꢈstate ꢉꢆꢅaꢅꢊe ꢆꢄꢋaꢆꢌꢄeꢅt ꢁꢍaꢆꢅsꢃꢎlosses

Secure Trust Bank PLC Annual Report & Accounts 2017 Straightforward transparent banking
26
Revenue and lending performance vs prior years
Asset Finance What we doThe Asset Finance business provides funding to support SME businesses in acquiring commercial assets, such as building equipment, commercial vehicles and manufacturing equipment.
How we do itThe Asset Finance business is operated via a strategic partnership with Haydock, a well-established asset finance company operating across the UK. Haydock provides a full business process outsourcing service to the Group and also assists the Group in sourcing new business and providing support to the Group’s clients on an ongoing basis. All of the lending written fully conforms to the Group’s credit policies, risk appetite or other specific authorisations.
The current route to market is via introducers. The Group offers hire purchase and finance lease arrangements with terms of up to five years.
2017 performanceThe business took the decision in the second half of 2016 to limit its exposure to some SME markets. Accordingly, the level of new business written in 2017 was lower than in 2016, with the overall lending ending broadly flat against the prior year. Income was 9% higher reflecting higher average balances over the year. The business saw lower overall yields in 2017, reflecting the impact of market conditions.
Impairment losses increased by £0.4 million in the year. The overall book quality remained strong, with arrears balances reducing to 2.5% of the book at 31 December 2017 compared to 4.3% at 31 December 2016.
Looking forwardThe Asset Finance division has operated through a partnership with Haydock Finance to date. With the sale of the Haydock business confirmed on 31 January 2018, the business is currently assessing future options.
Business reviewBusiness Finance
ꢀ8.5ꢁ2ꢂ17
ꢀ7.8ꢁ2ꢂ16 ꢀ2.4ꢁ2ꢂ15
ꢃsset ꢄꢅꢆaꢆꢇe leꢆꢈꢅꢆꢉ ꢊeꢋeꢆꢌe
ꢀ116.7ꢁ2ꢂ17
ꢀ117.2ꢁ2ꢂ16 ꢀ7ꢂ.7ꢁ2ꢂ15
ꢃsset ꢄꢅꢆaꢆꢇe leꢆꢈꢅꢆꢉ ꢊalaꢆꢇe at 31 ꢋeꢇeꢁꢊeꢌ
ꢀ1.ꢁꢂ2ꢁ17
ꢀꢁ.6ꢂ2ꢁ16 ꢀꢃꢄl2ꢁ15
ꢅsset ꢆꢄꢃaꢃꢇe ꢄꢂꢈaꢄꢉꢂeꢃt losses

Strategic Report – Business Review Corporate Governance Report
Financial Statements
27www.securetrustbank.co.uk
Revenue and lending performance vs prior years
Commercial Finance What we doThe division specialises in providing a full range of invoice financing solutions to UK businesses including invoice discounting and factoring.
Invoice discounting services provide access to funding and release typically up to 90% of the value of qualifying invoices, in confidence and allowing clients to stay in control of sales ledger management.
Factoring services, where the sales ledger management is passed onto the Group, may also provide access to funding of typically up to 90% of the value of qualifying invoices and often results in the Group managing credit control, cash allocation, statement and reminder letter distribution.
Other assets can also be funded either long or short term and for a range of loan to value ratios alongside other facilities.
How we do itCommercial Finance complements the broader SME lending proposition which has been developed by the Group. The business also provides SME commercial owner occupiers with finance to buy the property they trade from in conjunction with other financing facilities.
The division has built a strong team of proven business development, credit and operational professionals who have delivered a robust and compliant operational model.
2017 performanceThe Commercial Finance business continued to drive strong growth, with lending balances more than doubling in the year. Income also grew strongly against a marginal increase in costs. Impairment losses continue to be minimal.
Alongside this excellent performance, the business has continued to focus on its infrastructure. The recruitment of a number of high calibre people has led to a significant strengthening of the team.
Looking forwardThe team has built a reputation for high quality service, particularly within the market sectors that the Group is focusing on. As a result, the prospects for future growth are encouraging. To augment this, Commercial Finance is intending to develop a regional footprint which will provide the Group with a more scalable business model.
Lending balances more than doubling in the year.
ꢀ7.2ꢁ2ꢂ17
ꢀ4.6ꢁ2ꢂ16 ꢀ1.6ꢁ2ꢂ15
ꢃoꢁꢁeꢄꢅꢆal ꢇꢆꢈaꢈꢅe leꢈꢉꢆꢈꢊ ꢄeꢋeꢈꢌe
ꢀ126.5ꢁ2ꢂ17
ꢀ62.8ꢁ2ꢂ16 ꢀ29.3ꢁ2ꢂ15
ꢃoꢁꢁeꢄꢅꢆal ꢇꢆꢈaꢈꢅe leꢈꢉꢆꢈꢊꢋalaꢈꢅe at 31 ꢌeꢅeꢁꢋeꢄ
ꢀꢁ.1ꢂ2ꢁ17
ꢀꢁ.2ꢂ2ꢁ16 ꢀꢁ.3ꢂ2ꢁ15
ꢃoꢂꢂeꢄꢅꢆal ꢇꢆꢈaꢈꢅe ꢆꢂꢉaꢆꢄꢂeꢈt losses

28
Straightforward transparent bankingSecure Trust Bank PLC Annual Report & Accounts 2017
Retail Finance Retail Finance includes lending products for in-store and online retailers to enable consumer purchases.
Motor FinanceFinance is arranged through motor dealerships and brokers and involves fixed rate, fixed term hire purchase arrangements, predominantly on used cars.
Consumer Finance
29www.securetrustbank.co.uk
Strategic Report – Business Review Corporate Governance Report
Financial Statements
2017 Total Consumer Finance lending
£726.9m
Increase in Consumer Finance lending (2016 – £562.1m excluding Personal Lending)
29%
Running off higher margin/ higher risk portfolios.

Secure Trust Bank PLC Annual Report & Accounts 2017 Straightforward transparent banking
30
What we doThe Bank’s Retail Finance business provides unsecured, prime lending products to the UK customers of its retail partners to facilitate the purchase of a wide range of consumer products across in-store, mail order and online channels. This business is now driven by V12 Retail Finance, which was acquired in 2013 and has provided finance in cooperation with its retail partners for more than 20 years. The V12 point of sale system is used by the Group’s retail partners and Retail Finance is administered in V12 Retail Finance’s offices in Cardiff.
Retail Finance products are unsecured, fixed rate and fixed term loans of up to 84 months in duration with a standard maximum loan size of £25,000. The average new loan is for £1,000 over a 24 month term. Lending is restricted to UK residents who have a good credit history and can demonstrate that they can afford to repay the loan.
The finance products are either interest bearing or have promotional credit subsidised by retailers, allowing customers to spread the cost of purchases into more affordable monthly payments.
How we do itThe Group operates an online eCommerce service to retailers, providing finance to customers through an online paperless processing system. This includes allowing customers to digitally sign their credit agreements, thereby speeding up the pay-out process, and removing the need to handle and copy sensitive personal documents through electronic identity verification.
The Group serves retailers across a broad range of retail sectors including cycle, music, furniture, outdoor/leisure, electronics, dental, jewellery, home improvements and football season tickets.
The Group provides finance to customers of a large number of retailers including household names such as Evans Cycles, AO.com, Jessops, Halfords, DFS, Sofology and Watchfinder.
Retail Finance
Business reviewConsumer Finance
The Group plans continued growth in Retail Finance during 2018.
The Group serves retailers across a broad range of retail sectors.

Strategic Report – Business Review Corporate Governance Report
Financial Statements
31www.securetrustbank.co.uk
Revenue and lending performance vs prior years
2017 performanceThe Retail Finance business has continued to grow strongly, with new gross lending volumes increasing to £520.0 million (an increase of 31% on the previous year). This has driven a further significant increase in lending assets, which during the year rose to £452.3 million (December 2016: £325.9 million).
Each of the three largest sub-markets for the business (sports and leisure, furniture and consumer electronics) have contributed to this growth, which as in previous years has been achieved through a combination of gaining increased market share and sector growth. In addition, Furniture and Jewellery finance have seen positive new business levels influenced by the introduction of new retailers into the Retail Finance portfolio.
Lending revenue increased by 38% to £50.7 million (2016: £36.7 million). Impairment losses were well controlled at £13.8 million (2016: £9.5 million).
Looking forwardThe Group plans continued growth in Retail Finance during 2018 with the focus on acquiring increased market share across its target markets including cycle, music, furniture, outdoor/leisure, electronics, dental, jewellery, home improvements and football season tickets.
To underpin the continued growth, the Group continues to invest in initiatives to further enhance its systems capabilities, to ensure that quality of service to both retailers and customers is maintained or improved. This includes the continued expansion of its Retail Finance workforce.
ꢀetaꢁl ꢂꢁꢃaꢃꢄe leꢃꢅꢁꢃꢆ ꢇeꢈeꢃꢉe
ꢊ5ꢋ.7ꢌ2ꢋ17
ꢊ36.7ꢌ2ꢋ16 ꢊ24.2ꢌ2ꢋ15
ꢀ452.3ꢁ2ꢂ17
ꢀ325.9ꢁ2ꢂ16 ꢀ22ꢂ.4ꢁ2ꢂ15
ꢃetaꢄl ꢅꢄꢆaꢆꢇe leꢆꢈꢄꢆꢉ ꢊalaꢆꢇe at 31 ꢋeꢇeꢁꢊeꢌ
ꢀ13.8ꢁ2ꢂ17
ꢀ9.5ꢁ2ꢂ16 ꢀ5.2ꢁ2ꢂ15
ꢃetaꢄl ꢅꢄꢆaꢆꢇe ꢄꢁꢈaꢄꢉꢁeꢆt losses

Secure Trust Bank PLC Annual Report & Accounts 2017 Straightforward transparent banking
32
Lending performance vs prior years
Motor Finance What we doThe Group’s Motor Finance business began lending in 2008 under the Moneyway brand and provides hire purchase lending products to a wide range of customers including those who might otherwise be declined by other finance companies. This helps the Group’s customers to gain the freedom and flexibility that motoring gives to their lives as well as helping introducers to sell more cars.
Motor Finance agreements are secured against the vehicle being financed.
As the Group is lending into the near-prime market the majority of vehicles financed are predominantly volume franchise used cars.
How we do itThe Bank distributes its Motor Finance products via UK motor dealers, brokers and internet introducers. New dealer relationships are established and managed by our UK-wide Motor Finance sales team with all introducers subject to a strict vetting policy, which is reviewed on a regular basis.
The technology platform used allows Moneyway to receive applications online from its introducers, to provide an automated decision, document production through to pay-out to dealer and ongoing in-life management.
Motor lending is administered in the Group head office in Solihull; however the UK motor dealers and brokers are UK-wide.
2017 performanceThe Motor Finance business saw a reduction in new business volume from £146.8 million in 2016 to £142.8 million in 2017. The business narrowed its credit parameters during 2017 in order to reduce potential future impairment losses. During the period the business stopped offering a product in the prime market sector; however the business is examining ways of repositioning a prime offer in the future.
Impairment losses for the year increased from £14.6 million to £20.8 million reflecting the performance of the sub-prime motor lending discontinued during 2017. The Motor Finance leadership has increased levels of resource and delivered process improvement throughout 2017 within the Collections and Recoveries teams.
Lending assets to customers increased by 16% during the year and lending revenue grew by 16% to £47.1 million.
Shift in business mix towards lower risk lending.
ꢀotoꢁ ꢂꢃꢄaꢄꢅe leꢄꢆꢃꢄꢇ ꢁeꢈeꢄꢉe
ꢊ47.1ꢋ2ꢌ17
ꢊ4ꢌ.5ꢋ2ꢌ16 ꢊ33.3ꢋ2ꢌ15
ꢀotoꢁ ꢂꢃꢄaꢄꢅe leꢄꢆꢃꢄꢇ ꢈalaꢄꢅe at 31 ꢉeꢅeꢊꢈeꢁ
ꢋ274.6ꢊ2ꢌ17
ꢋ236.2ꢊ2ꢌ16 ꢋ165.7ꢊ2ꢌ15
ꢀ2ꢁ.8ꢂ2ꢁ17
ꢀ14.6ꢂ2ꢁ16 ꢀ7.3ꢂ2ꢁ15
ꢃotoꢄ ꢅꢆꢇaꢇꢈeꢆꢂꢉaꢆꢄꢂeꢇt losses
Business reviewConsumer Finance

Strategic Report – Business Review Corporate Governance Report
Financial Statements
33www.securetrustbank.co.uk
ꢀeꢁsoꢂal ꢃeꢂꢄꢅꢂꢆ ꢁeꢇeꢂꢈe
ꢉ8.ꢊꢋ2ꢊ17
ꢉ11.2ꢋ2ꢊ16 ꢉ17.2ꢋ2ꢊ15
ꢀeꢁsoꢂal ꢃeꢂꢄꢅꢂꢆ ꢇalaꢂꢈe at 31 ꢉeꢈeꢊꢇeꢁ
ꢋꢂꢅl2ꢌ17
ꢋ65.5ꢊ2ꢌ16 ꢋ74.3ꢊ2ꢌ15
ꢀ3.4ꢁ2ꢂ17
ꢀ4.4ꢁ2ꢂ16 ꢀ4.8ꢁ2ꢂ15
ꢃeꢄsoꢅal ꢆeꢅꢇꢈꢅꢉ ꢈꢁꢊaꢈꢄꢁeꢅt losses
Revenue and lending performance vs prior years
Personal Lending
Personal unsecured loans are fixed rate, fixed term products with payments received monthly in arrears. Loan terms are between 12 months and 60 months with advances varying from £1,000 to £15,000. Loans were provided to customers for a variety of purposes including home improvements, personal debt consolidation and for the purchase of vehicles.
In January 2017, the Group announced its intention to cease originating new personal loans and this segment closed to new business. On 21 December 2017, the Group sold the remaining loan portfolio to Alpha Credit Solutions.
2017 performanceLending revenue declined as expected given the run-off of the book. A profit before tax of £0.5 million was generated on the sale of the portfolio.
Looking forwardThe Group continued to administer the portfolio in the early part of 2018, until the completion of the migration of the portfolio to a third party administrator appointed by the purchaser. The market will continue to be monitored and the Group will consider re-entering it once returns are better aligned with risk.
Looking ForwardThe Motor Finance business is developing initiatives to enhance system capabilities and to deliver a broader range of products. This is expected to improve the credit quality of the portfolio and drive business growth.
Alongside these initiatives, the business will continue to focus on the non-prime market sector through its existing introducer channel. Following the narrowing of its credit parameters in 2017 the shift in business mix towards lower risk lending is expected to continue driving improvements in overall portfolio quality.
To further support strategic development, the business has made some key appointments to the Motor management team and will continue to strengthen the depth and experience of the team as the business expands.

34
Secure Trust Bank PLC Annual Report & Accounts 2017 Straightforward transparent banking
• .
Consumer Mortgages was launched on 20 March 2017. The division supports residential customers who are underserved by the traditional high street lenders.Consumer
Mortgages

35www.securetrustbank.co.uk
Strategic Report – Business Review Corporate Governance Report
Financial Statements
• .
2017 Total Mortgage lending
£16.5mCompliant, scalable business with excellent customer service.

Secure Trust Bank PLC Annual Report & Accounts 2017 Straightforward transparent banking
36
Business reviewConsumer Mortgages
What we doThe Group lends to individuals who wish to purchase a property or remortgage their current property.
Revenue and lending performance vs prior years
How we do itThe UK has approximately 4.6 million self-employed and contract workers. In addition, there is a growing population of individuals with complex income and recently restored credit history. These potential customers have been underserved by traditional high street lenders whose operating models are based on high volumes of simple, straight forward cases. Consumer Mortgages provide, through intermediaries, competitive fixed rate mortgage products to people whose personal circumstances do not fit the norm but are still credit worthy individuals with good affordability.
Financing is typically provided over a term of up to 35 years with fixed interest rate periods of 2, 3 and 5 years. The Group’s purchase and remortgage products currently have a maximum loan to value of 85% and a maximum loan size of £2 million.
The Consumer Mortgage team is staffed by experienced mortgage and banking individuals with proven property lending expertise and underwriting skills. The team provides full support to customers and introducers over the life of the products.
ꢀoꢁsꢂꢃeꢄ ꢅoꢄtꢆaꢆes ꢇeꢁꢈꢉꢁꢆ ꢄeꢊeꢁꢂe
ꢋꢌ.1ꢃ2ꢌ17
ꢋꢁꢉl2ꢌ16 ꢋꢁꢉl2ꢌ15
ꢀoꢁsꢂꢃeꢄ ꢅoꢄtꢆaꢆes leꢁꢇꢈꢁꢆꢉalaꢁꢊe at 31 ꢋeꢊeꢃꢉeꢄ
ꢌ16.5ꢃ2ꢍ17
ꢌꢁꢈl2ꢍ16 ꢌꢁꢈl2ꢍ15
ꢀꢁꢂl2ꢃ17
ꢀꢁꢂl2ꢃ16 ꢀꢁꢂl2ꢃ15
ꢄoꢁsꢅꢆeꢇ ꢈoꢇtꢉaꢉesꢂꢆꢊaꢂꢇꢆeꢁt losses
Strategic Report – Business Review Corporate Governance Report
Financial Statements
37www.securetrustbank.co.uk
2017 performanceSince launch the business has grown steadily whilst testing systems and processes to ensure they are resilient. The 2017 emphasis on building a compliant scalable business with excellent customer service has put the Group in a good position to grow the business in 2018.
Looking forwardConsumer Mortgages has steadily built out its distribution partners and the plan is to continue to expand through 2018; in January 2018 the business launched with Legal and General, the largest mortgage club in the UK. Additionally the Group is looking to extend its product range and proposition to customers that are underserved and who are aligned to STB’s target market.
The Group is looking to extend its product range and proposition to customers that are underserved and who are aligned to STB’s target market.

38
Secure Trust Bank PLC Annual Report & Accounts 2017 Straightforward transparent banking
The Group undertakes its funding primarily via retail savings; attracting balances with competitive rates of interest advertised on best buy tables and applied for and serviced online with UK based telephone support.
Savings

39www.securetrustbank.co.uk
Strategic Report – Business Review Corporate Governance Report
Financial Statements
2017 Total customer deposits
£1,483.2m
Increase in total customer deposits (2016 – £1,151.8m)
29%
The Group is able to offer competitive rates and has been successful in attracting high volumes of deposits.

Secure Trust Bank PLC Annual Report & Accounts 2017 Straightforward transparent banking
40
Business reviewSavings
What we do The Group’s retail savings consist primarily of notice accounts and fixed term savings, with a small proportion of instant access accounts, available to individuals as well as private businesses. Individuals and business accounts are separately priced to reflect differences in the operational risks and costs.
Accounts are simple in design with savings covered by the UK Financial Services Compensation Scheme up to the specified limits.
The key terms of accounts that are usually offered from time to time are summarised below:
• Mixture of products ranging from 90 to 180 day notice periods and one to five year fixed term savings.
• Minimum balance of £1,000.
• Maximum balance of £1 million for sole account holders and £2 million for business and joint accounts.
• Annual interest on fixed term accounts, quarterly on notice accounts, with the option to capitalise onto the existing account or pay away for income.
The OneBill account had been in operation for many years and was designed to aid customers with their household budgeting and payments process. Customers provided the Group with details of their annual bills (including rent, utility bills, insurance and telephone line rental) which the Group aggregated and then calculated a fixed weekly or monthly payment schedule to ensure the bills were paid on time.
This enabled customers to spread the cost of their bills throughout the year in addition to receiving direct debit discounts and all supplier contact being handled by the Group. The Group charges a monthly fee for this service. The product was closed to new customers in 2009.
How we do itBy virtue of the absence of a branch network, a policy of not cross-subsidising loss making products with profitable ones and an operational model based on digital self-service, the Group is able to offer competitive rates and has been successful in attracting high volumes of deposits, particularly in short timescales, from a wide range of customers. This provides a funding profile which gives additional financial security to the business.
The Group enters the market for deposits as and when it is necessary and maintains a funding strategy of broadly matching the term and tenor of its customer savings to the desired maturity profiles of the Group which are primarily determined by the interest rates and terms offered on loans and advances to customers. This strategy seeks to help mitigate maturity transformation and interest basis risks.
The marketing methods employed include providing information about the savings accounts offered on price comparison websites (for example Moneysupermarket), newspaper best buy tables and articles and via online endorsement (for example Money Saving Expert). In addition to attraction based on interest rate, customers choose Secure Trust Bank based on its financial standing, UK based operation and high standards of cyber and operational security.
Customers choose Secure Trust based on its financial standing, UK based operations and strong cyber and operational security.
The Group successfully implemented a new IT platfrom.

Strategic Report – Business Review Corporate Governance Report
Financial Statements
41www.securetrustbank.co.uk
Savings balances vs prior years
The Group is able to adjust the mix of interest rate offered and term or notice period in a manner that allows it to raise funding quickly. As part of this funding strategy, the Group may only offer savings accounts for limited periods of time and, from time to time, may not offer new products to customers at all. The Group will cease offering products when the Group’s need for funding at that time has been satisfied.
2017 performance2017 saw the Group further grow its savings balances by £331.4 million, 28.8%, through a period of strong demand for its competitive notice and bond products available to new customers and retention offers to existing customers whose loyalty it intends to continue to reward with long term competitive rates.
In October 2017, the Group successfully implemented a new IT platform onto which all existing savings customers were migrated. This new platform enables the Group to further diversify its product range with the future development of ISAs and limited access products, offer customers the ability to self-service their accounts via online banking with the associated cost and efficiency savings and enhance its risk control framework against broader cyber and financial crime risks. At the point of publishing, the Group has already raised over £67 million on this new platform.
Looking forwardThe Group expects competition for savings balances to heighten through 2018 and into 2019 with the end of the Bank of England’s Term Funding Scheme, with those institutions that have relied on this source of funds as a primary method of funding growth in recent years re-entering the market for retail funding and increasing the cost of funds. As such, the Group is continuing to invest in diversification and development of its savings function.
With the successful delivery of the new savings IT platform, the Group is now undertaking a period of gradual development with new capability being rolled out in a controlled manner. This has commenced with the launch of new product options such as capitalised interest and internet banking for new customers.
The next steps will be to further roll out the capability of the new platform to respond to customer feedback and demand. In particular, internet banking will be made available to existing customers and the ability to self-serve accounts introduced. This will include applying for new accounts and providing maturity instructions online, and contacting the Group’s UK based customer service team by secure messaging.
The Group also intends to widen its product range, including the launch of Cash ISAs and limited access accounts. These products will lower the Group’s interest expense over time as volumes grow.
ꢀ455.3ꢁ2ꢂ17
ꢀ373.8ꢁ2ꢂ16 ꢀ4ꢂ4.9ꢁ2ꢂ15
ꢃaꢄꢅꢆꢇs ꢈotꢅꢉe ꢊeꢋosꢅts
ꢀ1ꢁꢂ13.4ꢃ2ꢂ17
ꢀ762.8ꢃ2ꢂ16 ꢀ588.7ꢃ2ꢂ15
ꢄꢅꢆeꢇ Teꢈꢃ ꢉaꢊꢅꢋꢌs
ꢀ14.5ꢁ2ꢂ17
ꢀ15.2ꢁ2ꢂ16 ꢀ39.5ꢁ2ꢂ15
ꢃꢄꢅꢆtꢇꢈꢉstaꢉt ꢊꢋꢋess
ꢀ1ꢁ483.2ꢂ2ꢃ17
ꢀ1ꢁ151.8ꢂ2ꢃ16 ꢀ1ꢁꢃ33.1ꢂ2ꢃ15
ꢄaꢅꢆꢇꢈs Total ꢉalaꢇꢊes

Secure Trust Bank PLC Annual Report & Accounts 2017 Straightforward transparent banking
42
On an ongoing basis, the Directors carry out a robust assessment of the principal risks facing the group, including those that would threaten its business model, future performance, solvency or liquidity. The following are considered to be the principal risks facing the Group:
Credit RiskThe risk that a counterparty will be unable to pay amounts in full when due.
Liquidity RiskThe risk that the Group will encounter difficulty in meeting obligations associated with its financial liabilities that are settled by delivering cash or another financial asset.
Operational RiskThe risk of direct or indirect loss arising from a wide variety of causes associated with the Group’s processes, personnel, technology and infrastructure, and from external factors other than the risks identified above.
Capital RiskThe risk that the Group will have insufficient capital resources to support the business.
Market RiskThe risk that the value of, or revenue generated from, the Group’s assets and liabilities is impacted as a result of market movements, predominantly interest rates.
Conduct RiskThe potential for customers (and the business) to suffer financial loss or other detriment through the actions and decisions made by the business and its staff.
Regulatory RiskThe risk that the Group fails to be compliant with all relevant regulatory requirements.
Notes 28 to 32 to the financial statements provide further analysis of certain financial risks.
Further details of the principal risks, the changes in risk profile during the 2017 financial year and the Group’s risk management framework are given in the following tables:
Principal risks and uncertainties
Improved
Stable
Deteriorating
Description Mitigation
Credit Risk
Credit risk is the risk that a counterparty will be unable to satisfy their debt servicing commitments when due. Counterparties include the consumers to whom the Group lends on an unsecured basis and the SMEs to whom the Group lends on a secured basis as well as the market counterparties with whom the Group deals.
The Group manages credit risk through internal controls and through a three lines of defence model. The first line is the business operation team with the credit risk team being second line and internal audit being the third line. The Board Risk Committee oversees the Consumer Credit Risk Committee and SME Credit Committee, which are the monitoring committees for credit risk. The Board Risk Committee also approves lending authorities in respect of SME lending.Each consumer lending product has a credit risk committee which reviews business performance from new application metrics through to loss performance by business type and introducer. Policy and scorecard changes are approved at this committee.The Group has pre-determined limits laid down by the Board Risk Committee that reflect the Bank’s appetite for volume and quality of business by sector and introducer. For Real Estate Finance and Commercial Finance, lending decisions are made on an individual transaction basis, using expert judgement and assessment against criteria set out in the lending policies. Asset Finance lending is outsourced to Haydock, who operate in line with the Group’s credit policies and risk appetite.
The Group’s employees based in Haydock’s premises assess this lending for compliance with policy. Exposure to credit risk is also managed in part by obtaining security. Motor Finance loans are secured against motor vehicles. Mortgages are secured against land/property and Real Estate Finance and Asset Finance loans are secured against property and tangible assets respectively. Commercial Finance advances are secured against a debtor book, inventory or property if a commercial mortgage is provided.Management monitors the ratings of the counterparties in relation to the Group’s loans and advances to banks. There is no direct exposure to the Eurozone and peripheral Eurozone countries.
ForbearanceThe Group does not routinely reschedule contractual arrangements where customers default on their repayments. It may offer the customer the option to reduce or defer payments for a short period, in which cases the loan will retain the normal contractual payment due dates and will be treated the same as any other defaulting cases for impairment purposes.
Change – Improved Consumer Finance Credit RiskThe Group ceased making unsecured personal loans to consumers in January 2017, as a result of the competitive landscape and concerns over general over-indebtedness in the market place. The remaining portfolio was sold in December 2017, as set out in Note 37.The Group continues to grow its Retail Finance lending book through interest free, interest bearing and Buy Now Pay Later propositions. Pricing for each of these product types is set to ensure that the expected return for each product is achieved. Pricing meetings are held monthly to review performance against pricing expectations for the top 30 introducers. Application trends, arrears and loss trends are monitored monthly by the Credit Risk Team. A new scorecard, built by industry risk modelling experts, was implemented in December 2017 and is expected to ensure further measured growth and improved loss performance in 2018.The Group’s Motor Finance business has continued to grow in 2017. The last two years have seen increased competition in the motor finance arena with several companies competing in the same segments of the market. This resulted in the Group receiving poorer quality customers and higher than expected impairments last year. The Group is expecting 2018 to be challenging for Motor Finance consumers as the UK witnesses historic high levels of consumer credit for individuals. Secure Trust Bank has taken the decision to de-risk its business and has stopped lending in the three highest risk tiers of business. The Group has implemented a new scorecard which is providing the expected improvement in bad debt rates and an improved distribution of customer quality across lower risk tiers of business. Further improved performance is expected in 2018 as the business written on the higher risk tiers runs off replaced with better quality higher scoring business.The Group is strengthening the experience of the Motor management team, including the appointment of a new Managing Director and Finance Director. The business is developing its
system capabilities and product set, in order to improve the credit quality of the portfolio and drive business growth.Secure Trust Bank entered the Consumer Mortgage market in 2017. The Group offers basic fixed term mortgage and re-mortgage products for those good quality customers with non-straightforward circumstances that struggle to meet the requirements of high street lenders. All loans are secured on the applicant’s property. The Group is making a cautious entry into the market, with lending balances of £16.5 million at 31 December 2017.
Business Finance Credit RiskLending to this sector has continued to grow, with continued application of robust risk governance, credit appetite and lending policies, alongside the significant experience within the lending teams. This has served the Group well to date as it continues to assess the potential impacts of the UK’s decision to leave the European Union, particularly in the Central London Real Estate Market, where risk appetite remains substantially reduced and lending has been pared back. A programme to develop probability of default modelling for each of the Business Finance portfolios commenced in 2015 and now following successful testing and calibration has been adopted in full from December 2017. Business Finance impairments and arrears have remained minimal to date. Management continues to closely monitor the portfolios and the external events and environment that could impact on each of them.
Concentration RiskManagement assesses the potential concentration risk from geographic, product and individual loan concentration. Due to the well diversified nature of its lending operations, the Group does not consider there to be a material exposure arising from concentration risk.

Strategic Report Corporate Governance Report
Financial Statements
43www.securetrustbank.co.uk
Description Mitigation
Credit Risk
Credit risk is the risk that a counterparty will be unable to satisfy their debt servicing commitments when due. Counterparties include the consumers to whom the Group lends on an unsecured basis and the SMEs to whom the Group lends on a secured basis as well as the market counterparties with whom the Group deals.
The Group manages credit risk through internal controls and through a three lines of defence model. The first line is the business operation team with the credit risk team being second line and internal audit being the third line. The Board Risk Committee oversees the Consumer Credit Risk Committee and SME Credit Committee, which are the monitoring committees for credit risk. The Board Risk Committee also approves lending authorities in respect of SME lending.Each consumer lending product has a credit risk committee which reviews business performance from new application metrics through to loss performance by business type and introducer. Policy and scorecard changes are approved at this committee.The Group has pre-determined limits laid down by the Board Risk Committee that reflect the Bank’s appetite for volume and quality of business by sector and introducer. For Real Estate Finance and Commercial Finance, lending decisions are made on an individual transaction basis, using expert judgement and assessment against criteria set out in the lending policies. Asset Finance lending is outsourced to Haydock, who operate in line with the Group’s credit policies and risk appetite.
The Group’s employees based in Haydock’s premises assess this lending for compliance with policy. Exposure to credit risk is also managed in part by obtaining security. Motor Finance loans are secured against motor vehicles. Mortgages are secured against land/property and Real Estate Finance and Asset Finance loans are secured against property and tangible assets respectively. Commercial Finance advances are secured against a debtor book, inventory or property if a commercial mortgage is provided.Management monitors the ratings of the counterparties in relation to the Group’s loans and advances to banks. There is no direct exposure to the Eurozone and peripheral Eurozone countries.
ForbearanceThe Group does not routinely reschedule contractual arrangements where customers default on their repayments. It may offer the customer the option to reduce or defer payments for a short period, in which cases the loan will retain the normal contractual payment due dates and will be treated the same as any other defaulting cases for impairment purposes.
Change – Improved Consumer Finance Credit RiskThe Group ceased making unsecured personal loans to consumers in January 2017, as a result of the competitive landscape and concerns over general over-indebtedness in the market place. The remaining portfolio was sold in December 2017, as set out in Note 37.The Group continues to grow its Retail Finance lending book through interest free, interest bearing and Buy Now Pay Later propositions. Pricing for each of these product types is set to ensure that the expected return for each product is achieved. Pricing meetings are held monthly to review performance against pricing expectations for the top 30 introducers. Application trends, arrears and loss trends are monitored monthly by the Credit Risk Team. A new scorecard, built by industry risk modelling experts, was implemented in December 2017 and is expected to ensure further measured growth and improved loss performance in 2018.The Group’s Motor Finance business has continued to grow in 2017. The last two years have seen increased competition in the motor finance arena with several companies competing in the same segments of the market. This resulted in the Group receiving poorer quality customers and higher than expected impairments last year. The Group is expecting 2018 to be challenging for Motor Finance consumers as the UK witnesses historic high levels of consumer credit for individuals. Secure Trust Bank has taken the decision to de-risk its business and has stopped lending in the three highest risk tiers of business. The Group has implemented a new scorecard which is providing the expected improvement in bad debt rates and an improved distribution of customer quality across lower risk tiers of business. Further improved performance is expected in 2018 as the business written on the higher risk tiers runs off replaced with better quality higher scoring business.The Group is strengthening the experience of the Motor management team, including the appointment of a new Managing Director and Finance Director. The business is developing its
system capabilities and product set, in order to improve the credit quality of the portfolio and drive business growth.Secure Trust Bank entered the Consumer Mortgage market in 2017. The Group offers basic fixed term mortgage and re-mortgage products for those good quality customers with non-straightforward circumstances that struggle to meet the requirements of high street lenders. All loans are secured on the applicant’s property. The Group is making a cautious entry into the market, with lending balances of £16.5 million at 31 December 2017.
Business Finance Credit RiskLending to this sector has continued to grow, with continued application of robust risk governance, credit appetite and lending policies, alongside the significant experience within the lending teams. This has served the Group well to date as it continues to assess the potential impacts of the UK’s decision to leave the European Union, particularly in the Central London Real Estate Market, where risk appetite remains substantially reduced and lending has been pared back. A programme to develop probability of default modelling for each of the Business Finance portfolios commenced in 2015 and now following successful testing and calibration has been adopted in full from December 2017. Business Finance impairments and arrears have remained minimal to date. Management continues to closely monitor the portfolios and the external events and environment that could impact on each of them.
Concentration RiskManagement assesses the potential concentration risk from geographic, product and individual loan concentration. Due to the well diversified nature of its lending operations, the Group does not consider there to be a material exposure arising from concentration risk.

Secure Trust Bank PLC Annual Report & Accounts 2017 Straightforward transparent banking
44
Principal risks and uncertaintiescontinued
Improved
Stable
Deteriorating
Description Mitigation
Liquidity Risk
Governance of liquidity risk management
Risk toleranceThe Group’s Board has agreed a liquidity risk appetite to ensure that adequate liquidity resources are held to meet its Overall Liquidity Adequacy Rule (OLAR) and to meet the minimum Liquidity Coverage Ratio (LCR).
The Group assesses and formally demonstrates the adequacy of its liquidity through the Internal Liquidity Adequacy Assessment Process (ILAAP). As part of the ILAAP, the Group conducts regular and comprehensive liquidity stress testing to ensure compliance with OLAR.
The liquidity requirements of the Group are mainly met by maintaining funds in its Bank of England reserve account to cover any short-term net outflow requirements. Longer term funding is also in place for structural liquidity and funding requirements.
The Group is required to meet daily cash flow requirements arising from maturing deposits and loan draw-downs, and maintains significant cash resources to meet all of these needs as they fall due.
Structure and responsibilities for liquidity risk managementThe Group has a formal governance structure in place to manage and mitigate liquidity risk on a day to day basis. The Board sets and approves the Group’s liquidity risk management strategy. The ALCO, comprising senior management and executives of the Group, meets monthly to review liquidity risk against set thresholds and risk indicators including early warning indicators, liquidity risk tolerance levels and ILAAP metrics. These metrics are managed on a day-to-day basis by the Group’s treasury function.
The Risk Function is responsible for ensuring that appropriate risk management processes and controls are in place, and that they are sufficiently robust, so as to ensure that key risks are identified, assessed, monitored and mitigated.
Internal liquidity reportingLiquidity metrics are monitored daily through daily liquidity reporting and monthly through ALCO. Metrics are also included in the Monthly Information pack tabled at the Group’s Executive Committee (Exco), Board Risk Committee and the Board.
The primary measure used by management to assess the adequacy of liquidity is the Overall Liquidity Adequacy Rule (OLAR), which is the Board’s own view of the Group’s liquidity needs as set out in the Board approved ILAAP.
Communication of liquidity risk strategy, policies and practices across business lines and with the BoardThe Group’s ALCO is responsible for implementing and controlling the liquidity risk appetite established by the Board. ALCO monitors compliance with the Group’s policies and oversees the overall strategy, guidelines and limits so that the Group’s future plans and strategy can be achieved within risk appetite.
The Group’s approach to managing liquidity is to ensure, as far as possible, that it will always have sufficient liquidity to meet its liabilities when due, under both normal and stressed conditions, and can fund its assets at reasonable cost and without incurring unacceptable losses or risking damage to the Group’s reputation through a failure to meet its obligations.
Funding strategyThe Group’s funding risk appetite is to ensure that the Group has access to stable funding markets and is not reliant on any single source of funding. The Group is mainly funded by capital and customer deposits. The Group also has limited borrowings under Bank of England funding schemes but does not have other direct exposures to wholesale markets. Funding strategy is managed centrally.
The Group maintains at all times liquidity resources which are adequate, both as to amount and quality, to ensure that there is no significant risk that its liabilities cannot be met as they fall due. The Group maintains a buffer of unencumbered High Quality Liquid Assets (HQLA) that is available to meet its liquidity requirements.

Strategic Report Corporate Governance Report
Financial Statements
45www.securetrustbank.co.uk
Description Mitigation
Liquidity Risk continued
Liquidity risk mitigation techniques
The Group seeks to mitigate liquidity risk through a number of strategies and processes: • The diversification of its deposit and loan products;• Offering depositors competitive interest rates to reduce
churn and volatility;• Contractual repayment term matching of a monitored
proportion of its loan and deposit book;• Acquiring funding through lower value, higher volume
deposits;• Monthly ALCO meetings reviewing early warning indicators
and tolerances of all relevant balance sheet items;• Access to Bank of England liquidity schemes;• Holding adequate levels of High Quality Liquid Assets with
a high proportion of cash in the Group’s Bank of England reserve account.
The Group’s liquidity risk appetite is to ensure that adequate liquidity resources are held to withstand all known reasonable combinations of idiosyncratic and market risks for up to 60 days.The aim is not to measure liquidity with a single metric but rather a range of principles and metrics which, when taken together, helps ensure that the Company’s liquidity risk is maintained at an acceptable level.
Stress testing
The key risk drivers identified in the Group’s Individual Liquidity Adequacy Process as being applicable to the Group are:• Retail Funding: the responsiveness of customer deposits to
changes in a bank’s credit worthiness;• Intraday Liquidity Risk: changes in liquidity intraday, for which
additional liquidity is held;• Pipeline Risk: exposure to undrawn loan commitments.
An integral component of the approach to liquidity risk management is stress testing, some of which is prescriptive using very detailed rules and guidance issued within prudential regulations and reported within regulatory returns.
The Group uses various short and medium term forecasts to monitor future liquidity requirements and these include stress testing assumptions to identify the required levels of liquidity. Stress testing is typically performed on a daily basis and levels of liquidity under stress are forecast regularly and monitored by ALCO.
In addition to the regulatory prescribed stress testing, the Group undertakes its own stress tests. The Board approves limits against both regulatory and internal stress testing requirements.
Contingency funding plans
If for reasons which may be beyond the business’ control, the Group were to encounter a significant and sustained outflow of deposits or other stress on the Group’s liquidity resource, a Liquidity Contingency Plan (LCP) is maintained to ensure the Group is able to maintain sufficient liquidity to remain a viable independent financial institution following a severe liquidity stress event.
The Liquidity Contingency Plan (LCP) forms part of the Group’s risk management framework, linking the Group’s Internal Liquidity Adequacy Assessment Process (ILAAP) to the Recovery Plan and Resolution Plan on a consistent basis. The integration of the LCP to the Recovery Plan, Resolution Plan, ILAAP and ICAAP is achieved through the use of consistent early warning indicators and invocation trigger points that are regularly monitored and reported against.
Change – STABLE The Group has continued to attract new fixed and variable rate deposits to broadly match the term lending by the Group. Continuity of funding was not impacted by the transition to the new deposits platform, which is now in place and will broaden the funding options available.The Group held liquidity which allowed it to exceed its OLAR and LCR requirements throughout the year. The Funding to Loans ratio at 31 December 2017 was 115.5% (2016: 110.4%).

Secure Trust Bank PLC Annual Report & Accounts 2017 Straightforward transparent banking
46
Improved
Stable
Deteriorating
Principal risks and uncertaintiescontinued
The improvement of the status of this risk is driven by the Group’s continued investment in resources, expertise and systems.
Description Mitigation
Operational Risk
Operational Risk is the risk that the Group may be exposed to direct or indirect loss arising from inadequate or failed internal processes, personnel, technology/ infrastructure, or from external factors.
The scope of Operational Risk is broad and includes Business Process, Business Continuity, Third Party, Financial Crime, Change, Human Resources, Information Security and IT Risk, including Cyber Risk.
The Group has adopted an Operational Risk Policy and Framework designed in accordance with the ‘Principles for the Sound Management of Operational Risk’ issued by the Basel Committee on Banking Supervision.
The approach ensures appropriate governance is in place to provide adequate and effective oversight of the Group’s operational risk. The governance framework includes the Board Risk Committee and Group Operational Risk Committee.
The Group has a defined set of qualitative and quantitative operational risk appetite measures. Quantitative measures cover operational losses, complaints, key operational risks, systems availability and information security. The appetite measures are reported and monitored on a monthly basis.
Change – IMPROVED The improvement of the status of this risk is driven by the Group’s continued investment in resource, expertise and systems to support the Operational Risk Framework and Policy. This Framework defines and facilitates the following activities:
• A biannual Risk and Control Self Assessments process to identify, assess and mitigate risks across all business units through improvements to the control environment.
• The Governance arrangements for managing and reporting these risks.
• All risk appetite measures and associated thresholds and metrics.
• An incident management process that defines how incidents should be managed and associated remediation, reporting and root-cause analysis.
Key Risk themes of Operational Risk focus in 2017 include:
• Supplier management – The Group uses a number of third parties to support its IT and operational processes. The Group recognises that it is important to effectively manage these suppliers and has throughout 2017 introduced a suite of standard controls for all its material suppliers to reduce the risk of operational impacts on these critical services.
• IT resilience – Having adequate and effective servers, networks and storage systems. The Group tested its disaster recovery and business continuity processes in 2017 and further improved the processes of identifying, assessing and managing its critical IT assets and processes.
• Information security and cyber risk – The Group has maintained focus on ensuring the effective management of risks arising from a failure or breach of its information technology systems that could result in customer exposure, business disruption, financial losses, or reputational damage.
Cyber risk continues to evolve and is covered in more detail in the ‘Strategic and emerging risks’ section on page 50.
Capital Risk
Capital risk is the risk that the Group will have insufficient capital resources to meet minimum regulatory requirements and to support the business. The Group adopts a conservative approach to managing its capital and at least annually assesses the robustness of the capital requirements as part of the Group’s Internal Capital Adequacy Assessment Process (‘ICAAP’).
The Group’s capital management policy is focused on optimising shareholder value, in a safe and sustainable manner. The Board regularly reviews the current and forecast capital position to ensure capital resources are sufficient to support planned levels of growth.
In accordance with the EU’s Capital Requirements Directive IV (’CRD IV’) and the required parameters set out in the EU’s Capital Requirement Regulation, the Group maintains an ICAAP which is updated at least annually. The ICAAP is a process that brings together the management framework (i.e. the policies, procedures, strategies and systems that the Group has implemented to identify, manage and mitigate its risks) and the financial disciplines of business planning and capital management.
Not all material risks can be mitigated by capital, but where capital is appropriate the Board has adopted an approach to determine the level of capital the Group needs to hold. This method takes the Pillar 1 capital formula calculations (standardised approach for credit, market and operational risk) as a starting point, and then considers whether each of the calculations delivers a sufficient capital sum adequately to cover management’s assessment of anticipated risks. Where it is considered that the Pillar 1 calculations do not reflect the risk, an additional capital add-on in Pillar 2 is applied, as per the Individual Capital Guidance issued by the PRA.
A complete assessment of the Group’s capital requirement is contained in its Pillar 3 disclosures. Pillar 3 disclosures for the Group for the year ended 31 December 2017 are published as a separate document on the Group’s website.
Change – STABLE Stringent stress tests are performed to ensure that capital resources are adequate over a future three year horizon. At 31 December 2017, the CET1 Ratio was 16.5% (2016: 18.0%) and the Leverage Ratio was 12.3% (2016: 14.5%) on a group consolidated basis.
Both ratios are significantly better than regulatory requirements. The Group capital resources increased during the year to £243.3 million as at 31 December 2017 (31 December 2016: £232.7 million) on a group consolidated basis.
The basis of consolidation has been updated from a solo-consolidated basis to a group consolidated basis following the Arbuthnot Banking Group shareholding in Secure Trust Bank Group reducing to 18% in June 2016. As a result, all subsidiaries of Secure Trust Bank PLC are now included in the Group’s capital resources and requirements, whereas previously the V12 and DMS legal entities were excluded. The 2016 comparative ratios above have been updated accordingly.
The Group has elected to adopt transitional provisions in respect of the implementation of IFRS 9, as set out by the European Banking Authority. These provisions allow the capital impact of the standard to be phased in over a five year period. Further details are provided in Note 29.

Strategic Report Corporate Governance Report
Financial Statements
47www.securetrustbank.co.uk
Description Mitigation
Operational Risk
Operational Risk is the risk that the Group may be exposed to direct or indirect loss arising from inadequate or failed internal processes, personnel, technology/ infrastructure, or from external factors.
The scope of Operational Risk is broad and includes Business Process, Business Continuity, Third Party, Financial Crime, Change, Human Resources, Information Security and IT Risk, including Cyber Risk.
The Group has adopted an Operational Risk Policy and Framework designed in accordance with the ‘Principles for the Sound Management of Operational Risk’ issued by the Basel Committee on Banking Supervision.
The approach ensures appropriate governance is in place to provide adequate and effective oversight of the Group’s operational risk. The governance framework includes the Board Risk Committee and Group Operational Risk Committee.
The Group has a defined set of qualitative and quantitative operational risk appetite measures. Quantitative measures cover operational losses, complaints, key operational risks, systems availability and information security. The appetite measures are reported and monitored on a monthly basis.
Change – IMPROVED The improvement of the status of this risk is driven by the Group’s continued investment in resource, expertise and systems to support the Operational Risk Framework and Policy. This Framework defines and facilitates the following activities:
• A biannual Risk and Control Self Assessments process to identify, assess and mitigate risks across all business units through improvements to the control environment.
• The Governance arrangements for managing and reporting these risks.
• All risk appetite measures and associated thresholds and metrics.
• An incident management process that defines how incidents should be managed and associated remediation, reporting and root-cause analysis.
Key Risk themes of Operational Risk focus in 2017 include:
• Supplier management – The Group uses a number of third parties to support its IT and operational processes. The Group recognises that it is important to effectively manage these suppliers and has throughout 2017 introduced a suite of standard controls for all its material suppliers to reduce the risk of operational impacts on these critical services.
• IT resilience – Having adequate and effective servers, networks and storage systems. The Group tested its disaster recovery and business continuity processes in 2017 and further improved the processes of identifying, assessing and managing its critical IT assets and processes.
• Information security and cyber risk – The Group has maintained focus on ensuring the effective management of risks arising from a failure or breach of its information technology systems that could result in customer exposure, business disruption, financial losses, or reputational damage.
Cyber risk continues to evolve and is covered in more detail in the ‘Strategic and emerging risks’ section on page 50.
Capital Risk
Capital risk is the risk that the Group will have insufficient capital resources to meet minimum regulatory requirements and to support the business. The Group adopts a conservative approach to managing its capital and at least annually assesses the robustness of the capital requirements as part of the Group’s Internal Capital Adequacy Assessment Process (‘ICAAP’).
The Group’s capital management policy is focused on optimising shareholder value, in a safe and sustainable manner. The Board regularly reviews the current and forecast capital position to ensure capital resources are sufficient to support planned levels of growth.
In accordance with the EU’s Capital Requirements Directive IV (’CRD IV’) and the required parameters set out in the EU’s Capital Requirement Regulation, the Group maintains an ICAAP which is updated at least annually. The ICAAP is a process that brings together the management framework (i.e. the policies, procedures, strategies and systems that the Group has implemented to identify, manage and mitigate its risks) and the financial disciplines of business planning and capital management.
Not all material risks can be mitigated by capital, but where capital is appropriate the Board has adopted an approach to determine the level of capital the Group needs to hold. This method takes the Pillar 1 capital formula calculations (standardised approach for credit, market and operational risk) as a starting point, and then considers whether each of the calculations delivers a sufficient capital sum adequately to cover management’s assessment of anticipated risks. Where it is considered that the Pillar 1 calculations do not reflect the risk, an additional capital add-on in Pillar 2 is applied, as per the Individual Capital Guidance issued by the PRA.
A complete assessment of the Group’s capital requirement is contained in its Pillar 3 disclosures. Pillar 3 disclosures for the Group for the year ended 31 December 2017 are published as a separate document on the Group’s website.
Change – STABLE Stringent stress tests are performed to ensure that capital resources are adequate over a future three year horizon. At 31 December 2017, the CET1 Ratio was 16.5% (2016: 18.0%) and the Leverage Ratio was 12.3% (2016: 14.5%) on a group consolidated basis.
Both ratios are significantly better than regulatory requirements. The Group capital resources increased during the year to £243.3 million as at 31 December 2017 (31 December 2016: £232.7 million) on a group consolidated basis.
The basis of consolidation has been updated from a solo-consolidated basis to a group consolidated basis following the Arbuthnot Banking Group shareholding in Secure Trust Bank Group reducing to 18% in June 2016. As a result, all subsidiaries of Secure Trust Bank PLC are now included in the Group’s capital resources and requirements, whereas previously the V12 and DMS legal entities were excluded. The 2016 comparative ratios above have been updated accordingly.
The Group has elected to adopt transitional provisions in respect of the implementation of IFRS 9, as set out by the European Banking Authority. These provisions allow the capital impact of the standard to be phased in over a five year period. Further details are provided in Note 29.

Secure Trust Bank PLC Annual Report & Accounts 2017 Straightforward transparent banking
48
Description Mitigation
Market risk
For the Group, market risk is primarily limited to interest rate risk, being the potential adverse impact on the Group’s future cash flows from changes in interest rates arising from the differing interest rate risk characteristics of the Group’s assets and liabilities. When interest rates change, the present value and timing of future cash flows change. This in turn changes the underlying value of the Group’s assets, liabilities and off-balance sheet instruments and hence its economic value. Changes in interest rates also affect the Group’s earnings by altering interest-sensitive income and expenses, affecting its net interest income.
The principal currency in which the Group operates is Sterling, although a small number of transactions are completed in US dollars, Euros and other currencies in the Commercial Finance business. All currency exposures are swapped to Sterling. The Group has no significant exposures to foreign currencies and therefore there is no significant currency risk.
The Group’s risk management framework, policies and procedures are regularly reviewed and updated to ensure that they accurately identify the risks that the Group faces in its business activities and are appropriate for the nature, scale and complexity of the Group’s business.
Market risk is managed by the Company’s Treasury function and is overseen by the Assets and Liabilities Committee (‘ALCO’). The Group does not take significant unmatched positions and does not operate a trading book.
The key measure the Group uses to monitor the risk is an Interest Rate Sensitivity Gap analysis which informs the Group of mismatched interest rate risk positions.
The Group monitors the interest rate mismatch on a monthly basis. The main test employed is a 200bps interest rate shock across all interest indices on a parallel basis. The Group maintains such exposures within the risk appetite set by the Board.
Change – STABLE The mismatch in terms of interest rate repricing characteristics of the Bank’s assets and liabilities creates exposure to interest rate risk that requires management and measurement within risk limits.
An effective risk management process that maintains interest rate risk within prudent levels is therefore essential to the safety and soundness of the Bank.
The Group measures Earnings at Risk (EaR) and Value at Risk (VaR), predominantly by monitoring the Interest Rate Sensitivity Gap. Interest rate risks inherent in new products or through changes to the terms and conditions of existing products were assessed over the course of the year. The Group remained within risk appetite in respect of interest rate risk throughout the year.
Conduct risk
The Group defines conduct risk as the risk that the Group’s products and services, and the way they are delivered, result in poor outcomes for customers, or harm to the Group. This could be as a direct result of poor or inappropriate execution of the Group’s business activities or staff behaviour.
The Group takes a principles based approach and includes retail and commercial customers in its definition of ‘customer’, which covers all business units and both regulated and unregulated activities.
Across the Group, conduct risk exposure is managed via monthly review and challenge of key risk indicators (‘KRIs’) at the Customer Focus Committee, which oversees complaints, FEEFO and Customer Service Excellence as well as conduct risk.
Conduct risk management information is also reviewed at Executive Committee meetings at product level.
The key risk indicators vary across the business units to reflect the relevant conduct risks; the business units’ key risk indicators are aggregated for measurement against the Group’s risk appetite, which is reported to the Group Executive Committee and the Board.
Change – STABLE Review of conduct risk and controls with the business units is managed through the regular cycle of risk and control self-assessments, in line with other operational risk categories.
Monthly review and challenge of key risk indicators in the Customer Focus Committee provides oversight of the first line activities to assure senior management that the first line are identifying conduct risks when they arise and taking appropriate actions to mitigate them.
Training on conduct risk continues to be delivered to new starters, with an eLearning module completed by all staff during the year.
Regulatory Risk
Regulatory risk is the risk that the Group fails to be compliant with all relevant regulatory requirements. This could occur if the Group failed to interpret, implement and embed processes and systems to address regulatory requirements, emerging risks, key focus areas and initiatives or deal properly with new laws and regulations.
The Group seeks to manage regulatory risks through the Group wide risk management framework. The Group Compliance and Regulatory Risk Committee is responsible for reviewing and monitoring regulatory changes, and ensuring that appropriate actions are taken, and also reviewing and approving the compliance risk management framework. Further details are given on page 68.
Change – STABLE In the year ended 31 December 2017, the Group has delivered changes to address new and revised regulations and legislation that have come into force, including changes to Regulatory References requirements, conduct rules for Non-Executive Directors, change to the FSCS Depositor Protection Limits and completion of the amendments necessary for the revised Payment Services Directive 2.
A number of formal projects and initiatives are in place to address forthcoming regulatory changes in 2018 including extending the Senior Managers and Certification Regime; Insurance Distribution Directive; General Data Protection Regulation; and PRA/FCA ring fencing.Improved
Stable
Deteriorating
Principal risks and uncertaintiescontinued

Strategic Report Corporate Governance Report
Financial Statements
49www.securetrustbank.co.uk
Description Mitigation
Market risk
For the Group, market risk is primarily limited to interest rate risk, being the potential adverse impact on the Group’s future cash flows from changes in interest rates arising from the differing interest rate risk characteristics of the Group’s assets and liabilities. When interest rates change, the present value and timing of future cash flows change. This in turn changes the underlying value of the Group’s assets, liabilities and off-balance sheet instruments and hence its economic value. Changes in interest rates also affect the Group’s earnings by altering interest-sensitive income and expenses, affecting its net interest income.
The principal currency in which the Group operates is Sterling, although a small number of transactions are completed in US dollars, Euros and other currencies in the Commercial Finance business. All currency exposures are swapped to Sterling. The Group has no significant exposures to foreign currencies and therefore there is no significant currency risk.
The Group’s risk management framework, policies and procedures are regularly reviewed and updated to ensure that they accurately identify the risks that the Group faces in its business activities and are appropriate for the nature, scale and complexity of the Group’s business.
Market risk is managed by the Company’s Treasury function and is overseen by the Assets and Liabilities Committee (‘ALCO’). The Group does not take significant unmatched positions and does not operate a trading book.
The key measure the Group uses to monitor the risk is an Interest Rate Sensitivity Gap analysis which informs the Group of mismatched interest rate risk positions.
The Group monitors the interest rate mismatch on a monthly basis. The main test employed is a 200bps interest rate shock across all interest indices on a parallel basis. The Group maintains such exposures within the risk appetite set by the Board.
Change – STABLE The mismatch in terms of interest rate repricing characteristics of the Bank’s assets and liabilities creates exposure to interest rate risk that requires management and measurement within risk limits.
An effective risk management process that maintains interest rate risk within prudent levels is therefore essential to the safety and soundness of the Bank.
The Group measures Earnings at Risk (EaR) and Value at Risk (VaR), predominantly by monitoring the Interest Rate Sensitivity Gap. Interest rate risks inherent in new products or through changes to the terms and conditions of existing products were assessed over the course of the year. The Group remained within risk appetite in respect of interest rate risk throughout the year.
Conduct risk
The Group defines conduct risk as the risk that the Group’s products and services, and the way they are delivered, result in poor outcomes for customers, or harm to the Group. This could be as a direct result of poor or inappropriate execution of the Group’s business activities or staff behaviour.
The Group takes a principles based approach and includes retail and commercial customers in its definition of ‘customer’, which covers all business units and both regulated and unregulated activities.
Across the Group, conduct risk exposure is managed via monthly review and challenge of key risk indicators (‘KRIs’) at the Customer Focus Committee, which oversees complaints, FEEFO and Customer Service Excellence as well as conduct risk.
Conduct risk management information is also reviewed at Executive Committee meetings at product level.
The key risk indicators vary across the business units to reflect the relevant conduct risks; the business units’ key risk indicators are aggregated for measurement against the Group’s risk appetite, which is reported to the Group Executive Committee and the Board.
Change – STABLE Review of conduct risk and controls with the business units is managed through the regular cycle of risk and control self-assessments, in line with other operational risk categories.
Monthly review and challenge of key risk indicators in the Customer Focus Committee provides oversight of the first line activities to assure senior management that the first line are identifying conduct risks when they arise and taking appropriate actions to mitigate them.
Training on conduct risk continues to be delivered to new starters, with an eLearning module completed by all staff during the year.
Regulatory Risk
Regulatory risk is the risk that the Group fails to be compliant with all relevant regulatory requirements. This could occur if the Group failed to interpret, implement and embed processes and systems to address regulatory requirements, emerging risks, key focus areas and initiatives or deal properly with new laws and regulations.
The Group seeks to manage regulatory risks through the Group wide risk management framework. The Group Compliance and Regulatory Risk Committee is responsible for reviewing and monitoring regulatory changes, and ensuring that appropriate actions are taken, and also reviewing and approving the compliance risk management framework. Further details are given on page 68.
Change – STABLE In the year ended 31 December 2017, the Group has delivered changes to address new and revised regulations and legislation that have come into force, including changes to Regulatory References requirements, conduct rules for Non-Executive Directors, change to the FSCS Depositor Protection Limits and completion of the amendments necessary for the revised Payment Services Directive 2.
A number of formal projects and initiatives are in place to address forthcoming regulatory changes in 2018 including extending the Senior Managers and Certification Regime; Insurance Distribution Directive; General Data Protection Regulation; and PRA/FCA ring fencing.

Secure Trust Bank PLC Annual Report & Accounts 2017 Straightforward transparent banking
50
Strategic and emerging risksIn addition to the principal risks described on the previous page, the Board considers strategic and emerging risks, including key factors, trends and uncertainties which can influence the results of the Group. These risks include the following:
Macroeconomic environment and market conditionsThe Group operates exclusively within the UK and its performance is influenced by the macroeconomic environment in the UK. The economy affects demand for the Group’s products, margins that can be earned on lending assets and the levels of loan impairment.
Growth in the UK economy slowed in 2017, largely due to economic uncertainty. This uncertainty is affecting business investment, export growth and causing a moderation in UK household spending. However, current UK economic fundamentals remain strong and employment levels are at a record level. The longer term effects of the vote will become clearer once the nature of the UK’s exit from the European Union has been clarified.
The availability of liquidity from the BOE’s Funding for Lending and Term Funding Schemes have also impacted on lending markets, driving aggressive pricing from some lenders who have used this funding to build scale. The closure of these schemes in February 2018 will push up funding costs. The Group has not excessively used these schemes, and expects market pricing to return over time to levels where the Group has been operating, therefore strengthening the Group’s competitive position.
The Financial Policy Committee, PRA and FCA have all expressed concerns over 2017, regarding the UK consumer credit market. The Group shares these concerns, perceiving there to be a mispricing of risk, and has reacted accordingly by exiting markets most affected. As a consequence, the Group is not exposed to the majority of the issues highlighted by the regulators.
The repositioning of the Group’s lending books, towards lower risk areas, leaves it well placed to navigate this period of uncertainty. The Group will continue to review its credit risk appetite as economic and market conditions evolve.
On 1 November 2017, the Monetary Policy Committee announced a base rate rise, for the first time in a decade, to 0.5%, in order to head off rising inflation. The overshoot of the inflation target reflects the effects on import prices of the referendum-related fall in sterling. Rising interest rates may expose borrowers to difficulties making interest payments, however the continuing low base rate position has a mitigating effect on credit risk. The Group is less exposed to the credit risk related impact of interest rate changes than the systemically important banks and building societies, through its fixed rates on both its assets and liabilities.
Principal risks and uncertaintiescontinued
House prices have continued to rise in 2017; however confidence in the housing market is now reducing largely due to the uncertainty described above and concerns from new buyers over job security and the ability to raise deposits. The UK housing stock remains in short supply. The Group will continue to monitor the mortgage market in connection with its Consumer Mortgage product.
Regulatory and Capital positionThe Group continues to monitor regulatory developments in respect of capital requirements for banks. There has been acknowledgement that the current approach, whereby standardised risk weights under Pillar 1 are assessed separately to and then combined with Pillar 2 add ons, can lead to excessive capital requirements. The impact of a more judgemental approach should become clearer in 2018.
The Bank of England has announced an increase in the UK countercyclical buffer, from zero to 0.5% of risk weighted assets from June 2018 with a further increase to 1% following in November 2018. The capital conservation buffer also increases over the Group’s forecast period. These increases in buffers are factored into the Group’s capital planning.
Information Security and Cyber RiskThe Group has continued to maintain focus on managing risks arising from a failure or breach of its information technology systems or via our supply chain.
The Group recognises that financial services organisations face an increasing number and variety of cyber-attacks that could result in customer exposure, business disruption, financial losses, legal penalties or reputational damage.
Continuously improving resilience against emerging cyber threats requires an understanding of the tactics and motivations of potential attackers. The Group adopts strategies and comprehensive technical and organisational measures to keep abreast of these tactics and to prevent, detect, disrupt and facilitate rapid recovery from attacks.

Strategic Report Corporate Governance Report
Financial Statements
51www.securetrustbank.co.uk
Model Risk and the impact of IFRS 9The Group has significantly enhanced its modelling capability in response to the introduction of IFRS 9. From 1 January 2018 onwards, the Group’s impairment provisions will be estimated using a suite of models that use historical and forward looking data, with associated judgements and assumptions, to derive the probability of default (PD), loss given default (LGD) and exposure at default (EAD). In addition, the models used to derive the effective interest rate of the Group’s lending portfolios, and hence drive the release of income, are being upgraded.
Material elements of the Group’s financial statements will therefore increasingly be impacted by these models. The Group has taken steps to mitigate the associated model risk: the risk that a financial model fails to perform effectively and produces an inaccurate result. A Model Governance Committee has been established, comprising members from the Finance and Risk teams, to ensure the Group’s models are being developed and maintained subject to adequate controls, including validation of model outputs. This committee has approved the usage of the Group’s IFRS 9 models.
The introduction of IFRS 9 also brings an element of uncertainty into banks’ reporting. This is a complex accounting standard which has required all banks to develop new models. This increases the risk that firms will account for impairments using a wide variety of assumptions and model methodologies, with consequent inconsistency in the reported results that could take a number of years to align. Significant disclosure is required in order to assist the understanding of IFRS 9 results, and the Group is well progressed in developing this disclosure for use in its 2018 interim report.

Secure Trust Bank PLC Annual Report & Accounts 2017 Straightforward transparent banking
52
Going concern and viability
In assessing the Group as a going concern, the directors have given consideration to the factors likely to affect its future performance and development, the Group’s financial position and the principal risks and uncertainties facing the Group, as set out in the Strategic Report.
Going concernThe Group uses various short and medium term forecasts to monitor future capital and liquidity requirements and these include stress testing assumptions to identify the headroom on regulatory compliance measures.
The directors are satisfied that the Company and the Group have adequate resources to continue to operate for the foreseeable future as going concerns. For this reason they continue to adopt the going concern basis in preparing these financial statements.
Business viabilityIn accordance with provision C2.2 of the UK Corporate Governance Code, the directors confirm that there is a reasonable expectation that the Company and the Group will be able to continue in operation and meet their liabilities as they fall due, for the period up to 31 December 2020. The assessment of ongoing viability covers this period as it is the Group’s planning horizon and the period covered by the Group’s stress testing.
Given the Group’s strong capital and liquidity position at 31 December 2017, reduction in exposure to higher risk lending, continuing growth in profit and positive trading outlook, the directors are confident of the Group’s viability over the longer term. However, the inherent uncertainties regarding the economic, regulatory and market environment that the Group operates in may compromise the reliability of longer range forecasts.
The directors have based the assessment on:
• The latest annual budget, which contains information on the expected financial position and performance for the period to 31 December 2020 and by considering the potential impact of the principal risks facing the Group, as set out on pages 42 to 51.
• The analysis of key sensitivities, undertaken as part of the budget process, which could impact on profitability for the forthcoming financial year. Assumptions made to calculate risk weighted assets and capital requirements are clearly stated and additional scenarios are modelled to demonstrate the potential impact of risks and uncertainties on capital.
• The Group’s ILAAP, which uses stress scenarios to assess the adequacy of liquidity resources.
• The Group’s ICAAP, which considers a macroeconomic stress and a severe shock scenario in order to assess the adequacy of capital resources.
• Consideration of the other principal risks as set out on pages 42 to 51, to identify any other severe but plausible scenarios that could threaten the Group’s business model, future performance, solvency or liquidity.
In making this statement, the Board has sought input from the Audit Committee and the Risk Committee.

Strategic Report Corporate Governance Report
Financial Statements
53www.securetrustbank.co.uk
Corporate responsibility
The Group has a clearly defined commitment within the corporate strategy ‘To make this a great Bank for customers and colleagues’.
The Group strategy is underpinned by six core values that reflect the behaviours required to deliver the Group’s promise to deliver straightforward and transparent banking. Exceeding customer expectations and living the Group’s values are at the heart of the Group culture and as such it rewards innovative and inspiring behaviours and sets clear expectations around staff being trustworthy, compliant and safe. The Group also always seeks to act as a responsible business. Further details on how the Group meets its commitments are set out below.
Responsible BusinessThe Group takes its commitment to operate as a responsible business very seriously and recognises that this goes far beyond the adherence to legal requirements and best practice. Measures are in place to assess the impact of the Group’s business model and the delivery of its services on its customers, and the organisation strives to make a positive contribution to the wider community in which it operates. The Board does not consider there to be any environmental social or governance matters that are significant to the business of the Group.
The Group sees its ability to have a positive effect on social and community issues as an extension of its customer centric culture and colleagues are encouraged to make a positive contribution through a number of community focused schemes. Last year the Group supported 32 charities through activities run by its Charity Committees. The Charity Committees empower colleagues from different business areas to drive forward a wide range of successful charitable activities. This year the Group also doubled the available funding for its pound for pound matching scheme which allows colleagues to increase the money they raise for charity. The enthusiasm of colleagues to help good causes resulted in a wide range of fundraising activities which generated over £50,000 for charities in 2017.
Following the launch of a community volunteering scheme in 2016 which allows employees to take one day paid leave to make a difference to charities or community groups in their area, nearly a thousand hours were donated to worthy causes during 2017. Group staff have taken part in a wide range of activities and made a positive contribution to many charities and community projects.
Greenhouse Gas emissions from our operationsAs a financial services provider, the Group’s operations do not have a significant impact on the environment. The Group reports on its greenhouse gas emissions and, to ensure its environmental impact remains low, has included it as a key performance indicator. The key performance indicators are shown on page 19.
The Group’s report on all of the emission sources required under the Companies Act 2006 (Strategic Report and Directors’ Report) Regulation 2013 is set out below. This is the second Greenhouse Gas report that the Group has issued under the above Regulation and only emission sources where accurate and consistent data is available for the complete reporting period have been included.
Scope 1 emissions resulting from the combustion of natural gas for heating buildings and Scope 2 and 3 emissions associated with the consumption of purchased electricity are included within the GHG report. Scope 1 emissions resulting from the use of company owned/leased vehicles have been excluded. All Scope 3 sources, except for purchased electricity transmission, distribution emissions and grey fleet have also been excluded from this report. Systematic procedures have also been established to collect accurate data for Scope 1 company vehicle and fugitive refrigerant emissions with effect from 1 January 2017. The Group has set 2017 as the GHG baseline year and reports from 2018 will show emissions for the current year and for each subsequent year following the baseline year.
In compiling this GHG report, the GHG Protocol Corporate Accounting and Reporting Standard (revised edition) and energy supplier invoice data have been used. Greenhouse gas emissions are reported as a single total, by converting them to the equivalent amount of CO2 using emission factors from the UK Government’s GHG Conversion Factors for Company Reporting 2017.

Secure Trust Bank PLC Annual Report & Accounts 2017 Straightforward transparent banking
54
The Group’s Greenhouse Gas emissions are shown at the base of the page.
Human rights and tackling modern slavery The Group is subject to the European Convention on Human Rights and the UK Human Rights Act 1998. The fair treatment of customers is central to the Group’s strategy and values, and the Group opposes all forms of discrimination.
The Group is committed to tackling modern slavery and human trafficking and has taken steps to ensure it is considered and addressed in its business and throughout its supply chain, consistent with its obligations under the Modern Slavery Act 2015. The full Board statement on Slavery and Human Trafficking can be found on the Group’s website: www.securetrustbank.co.uk
EmployeesInvestors in PeopleSecure Trust Bank Group currently holds the highly coveted Investors in People Gold Accreditation, which the Group is extremely proud of. This internationally recognised accreditation is held by over 10,000 organisations worldwide and defines what it takes to lead, support and manage people well for sustainable results.
The Investors in People Standard is underpinned by a rigorous assessment methodology and a framework which reflects the very latest workplace trends, essential skills and effective structures required to outperform in any industry.
The Investors in People review process is one of a number of methods used to gain the views and opinions of employees to inform the Group’s People Strategy and is a key element of the Group’s open and transparent culture.
Employee VoiceIn addition to gaining feedback through Investors in People the Group conducts regular employee opinion ‘Your Voice’ surveys.
Towards the end of 2017, the Group again engaged an independent specialist to run the annual Your Voice employee engagement survey, and 81% of employees
participated (2016: 84%). Although the results showed a small decline in the employee engagement score (78% versus 85% from the previous year), across the majority of key survey areas the scores were significantly higher than the external benchmark, which is drawn from other similar sized companies in the Group’s sector. Of particular note were the following results:
• 95% of employees understand the Secure Trust Bank values.
• 83% of employees stated that they believe they can make a valuable contribution to the Group.
• 85% of employees consider customers to be central to the Group’s strategy.
The presentation of this year’s survey results to employees sets out the progress made in addressing issues raised in the previous survey. Actions plans will be developed during 2018 to address areas of improvement identified from this year’s survey.
The Bank also operates an Employee Council which has department representatives elected by their colleagues. The Council meets on a regular basis and encourages a two way process of communication between employees and senior managers. The aim of the Employee Council is to further promote employee engagement and provide a structured forum for teams to share their views.
Various initiatives have been implemented following feedback from this group. Most notably in 2017 were the enhancements to the relaunch of ‘Boost’ which is the Group Employee benefit and discount platform.
Employee DevelopmentContinued investment in employee development remains a priority with over 70 external qualifications recognised in 2017. In addition to the qualifications completed the Group had another record number of employees sign up to study towards an external Banking Qualification as part of their career development. The Banking Qualifications are delivered by the London Institute of Banking & Finance (previously the IFS) and are available to all employees.
Corporate responsibilitycontinued
The Group’s Greenhouse Gas emissions 2017
Carbon dioxide (tonnes)
2016Carbon dioxide
(tonnes)
Scope 1 – direct emissions from combustion of fuel 26.7 93.0Scope 2 – indirect emissions from electricity purchased 501.7 555.6Scope 3 – other indirect emissions from purchased electricity transmission and distribution 152.7 50.3
Total scope 1 to 3 emissions 681.1 698.9
Environmental intensity indicator (tonnes carbon dioxide per £1 million group income) 4.2 5.4

Strategic Report Corporate Governance Report
Financial Statements
55www.securetrustbank.co.uk
The prestigious Customer Service Excellence Award was developed by the Cabinet Office to acknowledge excellence in public services.
Awards
IiP is an exacting national standard that helps organisations to improve performance through their people and also strive for continuous improvement.
Accreditations
Banking Qualifications are just one of a number of opportunities created to study towards a range of professional qualifications which range from Apprenticeships to MBAs. In partnership with the National Skills Academy for Financial Services the Group commenced a development programme for Operational Team Leaders that enables them to achieve the Institute of Leadership and Management Level 3 qualification. This programme is designed to provide additional skills in core leadership disciplines for these critical customer facing roles.
Secure Trust Bank Group has been awarded Platinum Approved Status for both professional and trainee development by the Association of Chartered Certified Accountants, one of the world’s leading professional accountancy bodies. The accreditation joins the Chartered Institute of Management Accountants Premier Partner status which is already held by STB Group and demonstrates the high industry standards of both accountancy training schemes, and continuing professional development programmes, offered by the Group.
External development and wider career skills development is supported by a comprehensive in-house learning and development programme and induction process. To encourage teams to learn new skills and embrace learning opportunities the Group continues to participate in National Learning at Work Week where employees showcase their wider talents or participate in workshops on a wide range of engaging topics. In 2017 the Group also launched the Connect & Learn scheme as a result of feedback from the Your Voice employee survey. This scheme allows colleagues to draw on the expertise in other areas of the Group by setting up structured sessions with other teams. The focus on employee development has helped result in a record 90 employees promoted or moved in to new roles during the year.
The Group continues to take steps to address the wider needs and concerns of its staff. Existing employee support services have been supplemented by new initiatives, including further ‘Wellbeing at Work’ activities which provide a focus on employees’ mental and physical health. A number of People Managers attended training in partnership with Mind and Samaritans, and Mental Health Awareness training now forms an integral part of the core development programme for all People Leaders.
Employee engagement and recognitionResearch has consistently shown a clear link between enhanced levels of performance and teams that are fully engaged and share the values of the organisation that they work for. The positive performance of Secure Trust Bank Group is a result of the efforts of employees and to ensure that colleagues are recognised for this contribution there are a number of schemes in place to celebrate exceptional performance and behaviours.
These schemes together with the Group’s annual incentive programme continue to help embed excellence within the culture.
These schemes include:
e thank you cards and Be Valued awards: Being thanked is something that everyone appreciates and it makes individuals feel valued and helps create job satisfaction. For those occasions when colleagues deserve a thank you and behaviours are observed that truly reflected one of the Company values, colleagues can recognise each other by sending an e thank you card. Where behaviour has been exceptional, line managers have the opportunity to reward team members with a Be Valued award which includes a gift and certificate. Colleagues can nominate their peers whenever and as often as they like and in 2017 over 1,200 e cards were sent.
Customer Service Excellence Awards: colleagues who go the extra mile when it comes to exceptional internal and external customer service are recognised at monthly Customer Service Excellence Awards.
Outstanding achievers: these are given to colleagues who stand out for their fantastic contribution to the business. Winners are nominated by their peers and then selected by a panel of judges.
Incentive programme: the Group’s incentive scheme links tangible performance targets which are based on the Group’s strategy and values, to the outcomes of the scheme.
Long Service awards: to recognise loyalty and commitment to the Group, long service is awarded at key milestones from 5 years of service. Colleagues are rewarded with a cash payment, engraved pen, bottle of champagne, certificate and are also invited to lunch with the head of their business area. In 2017 590 years of long service were recognised.

Secure Trust Bank PLC Annual Report & Accounts 2017 Straightforward transparent banking
56
Gender diversityAt the year end, the split by gender of the Group’s employees was as shown in the table below.
The Group is committed to diversity in the workplace at all levels. During the early months of 2018, the Group is supporting a range of initiatives to demonstrate this commitment. The first is the launch, on International Women’s Day, of an exciting partnership with everywoman which gives all colleagues, regardless of gender, access to the everywomanNetwork, a highly acclaimed, online development tool, with a particular focus on empowering women to take control of their career development.
Customers firstWith today’s customer now having wider choice and access to more information than ever before the quality of the customer experience has never been more important and this is ingrained in the Group’s values and mission to provide straightforward and transparent banking. The focus on creating a culture where every interaction is seen as an opportunity to exceed our customers’ expectations is driven through specific initiatives and lived through day-to-day processes and interactions. This culture is reinforced through recognition and reward structures and a series of independent monitoring tools which facilitate a continuous process of customer service review and improvement.
The Group has used FEEFO, an independent global ratings and reviews provider used by the world’s most trusted brands for the last four years to collect customer feedback. Customer comments and ratings are published in real time on the Group’s website and used to monitor and maintain service levels. The Group’s average FEEFO rating for the year based on over 1,200 reviews stood at 4.7 out of 5 in December 2017 and all poor ratings are followed up by attempting to resolve the issue with the customer.
This year the Group was also delighted to be awarded three FEEFO Gold Trusted Service awards. This is an independent seal of excellence that recognises businesses for delivering exceptional experiences, rated by real customers. They are based purely on customer feedback and awarded on performance. The Group received the gold accolade for products offered under its Secure Trust Bank, V12 and Moneyway brands.
FEEFO ratings and comments are available on the Group’s websites:
www.securetrustbank.co.uk
www.moneyway.co.uk
Having been the first bank to be awarded the Customer Service Excellence Award, this year the Group was pleased to announce that it had retained the standard for the fifth year running. This Government backed accolade tests in great depth those areas that research has indicated are a priority for customers, with particular focus on delivery, timeliness, information, professionalism and staff attitude. There is also emphasis placed on developing customer insight, understanding the user’s experience and robust measurement of service satisfaction. The assessment report noted that “it was evident when speaking to leaders and front line staff within STB Group that they are highly motivated to achieve the best possible service for their customers.”
In addition to independent assessments of customer service levels, the Group’s internal recognition schemes are all built around reinforcing the Group’s values and culture and the Group’s Team Recognition Award clearly demonstrates how effective these are in driving the right behaviours. Focusing on customer service, this award ran throughout 2017 with 18 teams taking part across the Group, and resulted in the clear delivery of tangible improvements in customer service.
By order of the Board
Neeraj Kapur Chief Financial Officer
21 March 2018
Gender diversityMale Female
Directors 75% 25%Senior managers 80% 20%Other employees 44% 56%
All employees 47% 53%
Corporate responsibilitycontinued

Strategic Report Corporate Governance Report
Financial Statements
57www.securetrustbank.co.uk
Board
Chairman’s introduction 57
Board of Directors 58
Corporate governance statement
Corporate governance statement 61
Risk management 66
Nomination Committee
Statement by the Chairman of the Nomination Committee 69
Nomination Committee report 70
Audit Committee
Statement by the Chairman of the Audit Committee 72
Audit Committee report 73
Risk Committee
Statement by the Chairman of the Risk Committee 78
Risk Committee report 79
Remuneration
Statement by the Chairman of the Remuneration Committee 82
Operation of the Remuneration Committee 83
Remuneration report 85
Directors Remuneration Report for 2017 86
Summary remuneration policy 94
Directors’ report 98
Directors’ responsibility statement 102
Independent Auditor’s report 103
Chairman’s introduction
On behalf of the Board I am pleased to introduce our report on Corporate Governance. This explains the Group’s governance arrangements and how the Group has applied the principles of the UK Corporate Governance Code (the ‘Code’).
The Board is committed to maintaining high standards of corporate governance. The Board strengthened our governance framework in 2017 as we implemented the Remuneration Policy approved at the 2017 Annual General Meeting and changed the composition of our Committees.
The Board has considered comments made by some shareholders in relation to resolutions proposed at our 2017 Annual General Meeting, including on Executive Director remuneration. The Board has listened to those comments. The Chairman of the Remuneration Committee addresses executive remuneration on page 82. Reflecting on those comments and in contemplation of the proposed changes to the Code announced by the FRC in December 2017, Sir Henry Angest has decided to step down from the Remuneration Committee and Andrew Salmon has decided to step down from the Remuneration and Audit Committees, both with effect from 31 March 2018. Both will continue to remain members of the Board and to play an active role in our discussions.
The Board has discussed the implications of the proposed changes to the Code and the impact upon STB as a smaller company. The Board will continue to monitor the proposed changes as they move from consultation to implementation and will respond appropriately to the changes.
The Board looks forward to engaging with shareholders at the Annual General Meeting to be held on 16 May 2018.
Lord Forsyth Chairman of the Board
Corporate governance report

Secure Trust Bank PLC Annual Report & Accounts 2017 Straightforward transparent banking
58
Board of Directors
5
Audit Committee members Risk Committee members Assets and Liabilities Committee members Remuneration Committee members Nomination Committee members
4 1
267
3 98

Strategic Report Corporate Governance Report
Financial Statements
59www.securetrustbank.co.uk
1.The Rt Hon Lord Forsyth of Drumlean PC KtNon-Executive Chairman
Appointed to the Board on 1 March 2014 as an Independent Non-Executive Director and appointed Chairman of the Company on 19 October 2016.
Skills and experienceLord Forsyth is a former Chairman of Hyperion Insurance Group, and former Deputy Chairman of JP Morgan UK and Evercore Partners International. He was appointed to the Privy Council in 1995, knighted in 1997, and joined the House of Lords in 1999. He was a member of the House of Commons for 14 years and served in Government for 10 years, latterly as a Cabinet Minster. His background in the public and private sectors has given Lord Forsyth a broad experience of a number of matters relevant to the business of the Group including strategy, governance, operations, marketing, risk and human capital.
Other appointments include:Lord Forsyth is a director of J&J Denholm Limited and Denholm Logistics Limited and Chairman of the House of Lords Economic Affairs Committee.
2.Sir Henry Angest LLLNon-Executive Director
Appointed to the Board on 28 January 1982.
Skills and experienceSir Henry Angest is an experienced and respected banker. He is a past Master of the Worshipful Company of International Bankers, Chairman and Chief Executive of Arbuthnot Banking Group and Chairman of Arbuthnot Latham & Co., Limited. He gained extensive national and international experience as an executive of The DOW Chemical Company and DOW Banking Corporation. He was chairman of the banking committee of the London Investment Banking Association and a director of the Institute of Directors. He has a law degree from the University of Basel. During his career, Sir Henry has gained extensive experience in leadership, general management, corporate strategy, acquisitions, banking operations, human capital, legal and risk.
Other appointments include:Sir Henry is Chairman of Arbuthnot Banking Group PLC and of its subsidiary Arbuthnot Latham & Co., Limited. Sir Henry was appointed by Arbuthnot Banking Group to the Board of Secure Trust Bank PLC.
3.Ann Berresford ACAIndependent Non-Executive Director
Appointed to the Board on 22 November 2016 and appointed Chairman of the Audit Committee on 23 September 2017.
Skills and experienceAnn Berresford is a Chartered Accountant with a background in the financial services and energy sectors. She has held positions at Bath Building Society, the Pensions Regulator, Hyperion Insurance Group, Triodos Renewables plc, the Pension Protection Fund, Bank of Ireland Group, Clyde Petroleum plc and Grant Thornton. Her career has given Ann experience in mortgages, pensions, operations, accounting, finance and risk.
Other appointments include:Ann is a non-executive director of Albion Venture Capital Trust PLC.
4.Neeraj Kapur B.Eng, ACGI, FCA, CF, FCIBS Chief Financial Officer
Appointed to the Board on 31 May 2011.
Skills and experienceNeeraj Kapur has over 25 years’ financial services experience spent in both the accounting and banking industries. He holds a degree in Aeronautical Engineering from Imperial College, London, is a fellow of the Chartered Institute of Bankers in Scotland, a fellow of the Institute of Directors, a fellow and a member of the Council of the Institute of Chartered Accountants in England & Wales (‘ICAEW’), and Chair of the ICAEW Financial Services Faculty. Neeraj qualified as a Chartered Accountant in 1993 at Arthur Andersen and spent 11 years working in professional practice. He joined RBS in 2001 where he performed a number of roles which included Chief Financial Officer of Lombard North Central PLC. His background has given Neeraj experience in accounting, finance, professional services, governance, operations, marketing and risk.
Other appointments include:Member of the Council of the ICAEW.

Secure Trust Bank PLC Annual Report & Accounts 2017 Straightforward transparent banking
60
Board of Directorscontinued
5.Paul Lynam ACIB, AMCT, FifsChief Executive Officer
Appointed to the Board on 13 September 2010. Chairman of the Assets and Liabilities Committee.
Skills and experiencePaul Lynam joined Secure Trust Bank as Chief Executive Officer, having spent 22 years working for NatWest and RBS. Prior to leaving RBS, Paul was the Managing Director, Banking, for RBS/NatWest’s SME banking business across the UK. Before that Paul spent four years as the Managing Director of Lombard North Central PLC. During his career Paul has undertaken roles in branch banking, business banking, corporate and commercial banking, asset finance, invoice finance, strategy, performance management, lending and central head office functions. Paul is a member of the UK Finance Board, the recognised trade body for the finance industry, leading on Challenger Banks and SME customer interests. He also chairs the Specialist Bank Strategic Advisory Committee. He is a Fellow of the IFS University College and an Associate of the Chartered Institute of Bankers and the Association of Corporate Treasurers.
Other appointments include:Paul is a director of Arbuthnot Banking Group and a member of the UK Finance Board, as well as a member of the faculty of the School for CEOs.
6.Paul Marrow ACIBIndependent Non-Executive Director and Senior Independent Director
Appointed to the Board on 3 March 2011. Chairman of the Risk Committee.
Skills and experiencePaul Marrow has over 40 years’ banking experience and has, in the past, been responsible for the Commercial Banking and Specialist Corporate Banking business divisions of RBS Group in the UK and been the chair of JCB Finance Limited. Paul served for a number of years as Chair of the Group Audit Committee and was Chairman of Everyday Loans Group. During his career, Paul has gained experience in governance, risk, finance, accounting, operations and corporate strategy across a wide range of banking disciplines.
Other appointments include:Paul is an independent non-executive director of Arbuthnot Latham & Co., Limited, a wholly owned subsidiary of Arbuthnot Banking Group.
7.Andrew Salmon ACANon-Executive Director
Appointed to the Board on 8 July 2003.
Skills and experienceAndrew Salmon joined Arbuthnot Banking Group in 1997 and is its Chief Operating Officer and Head of Business Development. He was previously a director of Hambros Bank Limited and qualified as a Chartered Accountant with KPMG. His professional qualification and background in the financial services sector has given Andrew experience in remuneration, governance, operations, accounting, finance, marketing, risk and compliance.
Other appointments include:Andrew is a Director of Arbuthnot Banking Group PLC and its subsidiary Arbuthnot Latham & Co., Limited. Andrew was appointed by Arbuthnot Banking Group to the Board of Secure Trust Bank PLC.
8.Victoria Stewart Independent Non-Executive Director
Appointed to the Board on 22 November 2016, appointed Chairman of the Remuneration Committee on 21 July 2017 and appointed as a member of the Nomination Committee on 28 February 2018.
Skills and experienceVictoria Stewart was for many years a fund manager and investor in UK small companies. Victoria has knowledge of corporate structures and capital markets with particular experience in smaller companies listed on the Main Market and AIM. She has held a number of positions at Royal London Group and Chiswell Associates (formerly Cantrade Investment Management Limited and now part of Sarasin & Partners). Her background has given Victoria experience in remuneration, governance, operations, investor relations, accounting, finance and risk.
Other appointments include:Member of the ICAEW Corporate Governance Committee.
9. Alan Karter LLB (Hons)Company SecretaryAlan Karter is a Scottish and English qualified solicitor and a former partner of Simmons & Simmons LLP. He joined Arbuthnot Banking Group as Head of Legal Affairs in February 2012 and was appointed Company Secretary of Secure Trust Bank PLC on 31 August 2014. On 1 September 2016 he transferred his employment from Arbuthnot Banking Group to the Company and was appointed to the dual role of General Counsel and Company Secretary of Secure Trust Bank.

Strategic Report Corporate Governance Report
Financial Statements
61www.securetrustbank.co.uk
Corporate governance statement
UK Corporate Governance Code (‘Code’) – Statement of ComplianceThe Code sets out principles relating to good governance of companies. The Code is available at www.frc.org.uk. Throughout the period under review, the Company was subject to the Code.
The Board confirms that from 1 January 2017 to the date of this report the Group has complied with the requirements of the Code save that, until the appointment of Ann Berresford as a member of the Nomination Committee, a majority of the members of the Nomination Committee were not independent Non-Executive Directors. This was rectified on 21 February 2017.
The following sections of this report describe how the Board has applied the principles of the Code and describes the Group’s governance arrangements with particular reference to leadership, effectiveness, accountability, remuneration and relations with shareholders.
Section A: LeadershipRole of the BoardThe Board is led by the Chairman. The Board provides strategic leadership to the Group, sets the Group’s long term strategic objectives and exercises oversight over the implementation of the strategy and the activities of management. The Board is responsible to shareholders for promoting the long term success of the Group. The setting of a risk appetite and the oversight of risk management practices is an important part of the role of the Board.
The Board meets regularly and, both as a Board and through its committees, provides direction, oversight and challenge of and to management. The Board has delegated specific authorities to its committees as set out in each committee’s terms of reference. The Board exercises oversight of the work of its committees and receives updates on the work of each committee at Board meetings.
There is a schedule of matters reserved for consideration by the Board. Matters reserved for exclusive determination by the Board include the determination of dividends, material acquisitions or disposals and the issue of new shares.
The Board has delegated authority to executive management to run the business and to implement the strategy set by the Board. Two members of executive management, the CEO and the CFO, are members of the Board.
Key: NED 25%
ED 25%
INED 50%
Composition
Key: Board 98.75%
Meeting attendance
Key: Women 25%
Men 75%
Gender Diversity
NED: Non-Executive DirectorED: Executive DirectorINED: Independent
Non-Executive Director

Secure Trust Bank PLC Annual Report & Accounts 2017 Straightforward transparent banking
62
Board compositionThe Board meets formally at least eight times a year and otherwise as required. The number of planned meetings held during 2017 and the attending directors are shown in the table at the base of this page.
There are eight members of the Board as set out in the chart on page 61. Biographical details for each director can be found on pages 59 to 60 together with their roles and membership of Committees. Further information on Board effectiveness, Non-Executive Director evaluation and independence can be found on page 63 to 64.
The Code recommends that the Board should appoint one of the independent Non-Executive Directors as Senior Independent Director. The Senior Independent Director should be available to shareholders if they have concerns which contact through the normal channels of Chairman, Chief Executive Officer or other Executive Directors has failed to resolve or for which such contact is inappropriate. The Board has appointed Paul Marrow as the Senior Independent Director.
Role of the ChairmanThe Chairman’s role is to ensure good corporate governance and the smooth and effective operation of the Board. His responsibilities include leading the Board, ensuring the effectiveness of the Board, supporting effective communication with shareholders, setting the Board’s agenda and ensuring that all Directors are encouraged to participate fully in the activities and decision making process of the Board.
The Chairman of the Board and the Chairmen of the Remuneration, Risk and Audit Committees and the Senior Independent Director, together with the Chief Executive Officer and Chief Financial Officer, are all Senior Managers for the purposes of the Senior Manager Regime.
Separation of roles of Chairman and Chief ExecutiveThe roles of the Chairman and the Chief Executive Officer are separate, clearly defined in writing and have been approved by the Board.
MeetingsThe Board meets at regular intervals. There is a comprehensive Board pack and agenda which is circulated in advance of the meeting and minutes and actions are documented. There is an annual Board calendar at which certain items are considered by the Board at certain times of the year, including the report and accounts, regulatory filings and review of risk appetite. Additional meetings of the Board are held as required and, in addition to the standing committees of the Board, the Board may appoint ad hoc committees to deal with particular matters from time to time.
Company SecretaryThe Company Secretary or the Deputy Company Secretary acts as Secretary to the Board and its Committees and is responsible for ensuring that Board processes and procedures are followed and support effective decision making. All directors have access to the Company Secretary’s advice and services. Directors may obtain independent professional advice in the course of their duties, if necessary, at the Company’s expense in order to assist them in carrying out their duties.
The Company Secretary provides support and acts as a first point of contact for the Chairman and Non-Executive Directors. The Company Secretary is also responsible for the induction of new independent Non-Executive Directors. In 2017 a Deputy Company Secretary was appointed.
Corporate governance statementcontinued
Board membership and meetings
Board
Number of meetings during 2017 10Lord Forsyth (Chairman) 10/10Sir Henry Angest 9¹/10Ann Berresford 10/10Neeraj Kapur 10/10Paul Lynam 10/10Paul Marrow (Senior Independent Director) 10/10Andrew Salmon 10/10Victoria Stewart 10/10
¹ Sir Henry was unable to attend one meeting as telecommunications into the meeting from his location were unreliable.

Strategic Report Corporate Governance Report
Financial Statements
63www.securetrustbank.co.uk
The role of the members of the BoardThe Chairman leads the Board and sets the Board’s agenda with the support of the Company Secretary.
The Chief Executive Officer is responsible for the day-to-day management of the Group within the delegated authorities and risk appetite approved by the Board. He recommends the Group strategy and leads the executive management team in the execution of the strategy approved by the Board. He leads the relationship with institutional shareholders and ensures that timely and accurate information is disclosed to the market.
The Chief Financial Officer manages the Group’s financial affairs and supports the Chief Executive Officer in the management of the business. He has particular responsibility for the financial and regulatory reporting of the Group and balance sheet and liquidity management.
The Senior Independent Director acts as a sounding board for other Non-Executive Directors and the Chairman. The Senior Independent Director also conducts the Chairman’s annual performance evaluation, collecting views from the other Directors.
The Non-Executive Directors provide independent and constructive challenge of the Executive Directors and scrutinise the delivery of the strategy within the risk and control framework set by the Board. Non-Executive Directors also determine Executive Director remuneration.
Executive managementThe Chief Executive Officer and Chief Financial Officer are supported by an executive team who sit on an Executive Committee which operates under authorities delegated from the Board.
Below the Executive Committee there is a comprehensive governance structure involving a number of committees linked to business lines and functions. Details of that structure can be found on the Company’s website www.securetrustbank.co.uk
CommitteesThe Board has established Audit, Nomination, Remuneration and Risk Committees. There is also an Assets and Liabilities Committee (‘ALCO’) and an Assumptions Committee both of which report to the Risk Committee. Each committee has formally delegated duties and responsibilities and written terms of reference. The terms of reference of the Board committees are available on www.securetrustbank.co.uk.
All Board committees have access to independent advice and the services of the Company Secretary.
Further information about the Board committees is set out later in this governance report, including information about membership of the committees, meetings held during the year and the attendance of committee members.
Election of DirectorsThe Articles of Association contain provisions for the retirement by rotation of directors.
Lord Forsyth and Paul Marrow retire under Article 82 of the Articles of Association and, being eligible, offer themselves for re-election at the 2018 Annual General Meeting. Both Lord Forsyth and Paul Marrow have contributed significantly to the success of the Group, providing advice and guidance to management as well as oversight of shareholders’ interests. Paul Marrow is a former Audit Committee Chairman and is the Risk Committee Chairman. He is also the Whistleblowers’ Champion.
In accordance with the provisions of the Code, having served as Directors for longer than nine years, Sir Henry Angest and Andrew Salmon retire and offer themselves for re-election at the 2018 Annual General Meeting. Sir Henry Angest, who was chairman of the Company until the appointment of Lord Forsyth as Chairman in October 2016 has steered the Group through its development. He has demonstrated significant entrepreneurial flair in his leadership of the Group and the Board continues to value his wise counsel. Andrew Salmon, who has been a director of the Company since 2003, has contributed significantly to the success of the Group, providing advice and guidance to management.
The Board recommends the re-election of Lord Forsyth, Sir Henry Angest, Paul Marrow and Andrew Salmon at the 2018 Annual General Meeting. Further information about them can be found on pages 59 to 60.
Section B: EffectivenessAppointments to the BoardAppointments to the Board are the responsibility of the full Board, on the recommendation of the Nomination Committee. On appointment, new Non-Executive Directors enter into a formal appointment letter which sets out the terms and conditions of their appointment as Non-Executive Directors. The terms and conditions of appointment of the Non-Executive Directors and the service contracts of Executive Directors are available for inspection at the Group’s registered office during normal business hours. All the Non-Executive Directors (other than Ann Berresford and Victoria Stewart) entered into new letters of appointment on 6 October 2016. Ann Berresford and Victoria Stewart entered into letters of appointment on 22 November 2016. The letters of appointment were amended in January 2018 to reflect changes to the composition of the Board’s Committees and associated changes to individual Non-Executive Director responsibilities.

Secure Trust Bank PLC Annual Report & Accounts 2017 Straightforward transparent banking
64
Induction, training and professional developmentOn appointment, all new directors receive a comprehensive and tailored induction. The induction involves provision of information about the Group as well as face-to-face meetings with directors and senior management. New directors have access to historic Board material, including the prospectus and other Admission related documentation. New directors are also provided with briefing notes on regulatory and legal matters, including their duties and responsibilities under the Companies Act 2006.
Further information on Board training and development can be found on page 71.
Board effectivenessThe composition of the Board and its committees and the performance of directors were rigorously evaluated during the year. More details can be found on page 71.
Formal evaluations of the performance of the Audit and Risk committees took place during the year and the result of those evaluations was that the performance of each committee was considered to be satisfactory. Following the change to the Chairman of the Remuneration Committee and the adoption and implementation of the Remuneration Policy during the year, formal evaluation of the committee has been deferred until mid-2018 to allow the committee the opportunity to work through a full annual cycle of remuneration under the leadership of the current Chairman.
The Board conducted a formal self-evaluation of the effectiveness of the Board to assess its effectiveness and how it performs, along with other Board related governance matters, including the provision of information to the Board. Further details can be found on page 71.
DiversityThe Board of STB has adopted a Board policy on diversity, which addresses gender, race, ethnicity, age, disability, religious belief, sexual orientation, marital status, gender reassignment and pregnancy (together “Diversity”). The Board embraces the benefits of Diversity in the boardroom and considers that Diversity benefits governance. In considering the appointment of new directors, the Board will give careful consideration to Diversity as well as the skill, experience and knowledge of the candidates. The Board’s approved Board Diversity Policy operates in conjunction with the Equality and Diversity Policy applicable throughout the Group. Appointments to the Board are made on merit and having regard to the balance of skills and experience of the Board and the candidates. The Board has not set targets for representation of any particular group on the Board. Female membership of the Board currently stands at 25%. BAME membership currently stands at 12.5%.
Section C: AccountabilityThe Board has delegated authority to the Audit, Nomination, Remuneration and Risk Committees to exercise oversight of aspects of the operations of the Group.
Conflicts of interestAll Directors are required to disclose to the Board any outside interests which may pose a conflict with their duties to the Group. The Board is required to approve any actual or potential conflicts of interest. On appointment new Directors are required to disclose their other interests. Conflicts of interest are also governed by the Articles of Association of the Company and company law.
Financial reportingA description of the responsibilities of the directors in relation to the preparation of the annual report and accounts is set out on page 102.
The approach taken by the Board to ensuring that the annual report and accounts are fair, balanced and understandable is set out on page 75 and the information necessary for shareholders to assess the Company’s position and performance is set out in the Strategic Report starting on page 2.
A statement of the responsibility of the external auditors in relation to the report and accounts is set out on page 109.
An explanation of the business model and the strategy for delivering the objectives of the Company is set out on pages 2 to 3.
The basis on which the Board reached its decision to adopt the going concern basis of accounting is described on page 75.
Internal controlThe Board has overall responsibility for the Group’s system of internal control and for reviewing its effectiveness. Such a system is designed to manage rather than eliminate risk of failure to achieve business objectives and can only provide reasonable but not absolute assurance against the risk of material misstatement or loss.
The Board has adopted a Group risk appetite statement which sets out the Board’s attitude to risk and internal control. Key risks identified by the Directors are formally reviewed and assessed at least once a year by the Board and are also reviewed by the Risk Committee at its meetings. Key business risks are also identified, evaluated and managed on an ongoing basis by management. The Board and the Risk Committee also receive regular reports on any material risk matters. Significant risks identified in connection with the development of new activities are considered by the Board and the Risk Committee in conjunction with the approval of any such new activity.
Corporate governance statementcontinued

Strategic Report Corporate Governance Report
Financial Statements
65www.securetrustbank.co.uk
The effectiveness of the internal control system is reviewed regularly by the Board and the Audit Committee, which also receives reports of reviews undertaken by the internal audit function. The Audit Committee also receives reports from the external auditors, KPMG LLP, which include details of internal control matters that they have identified. Certain aspects of the system of internal control are also subject to regulatory supervision, the results of which are monitored closely by the Board and its Committees.
Key elements of the Group’s system of internal control include regular meetings of the Executive and business unit risk committees, together with annual budgeting, monthly financial and operational reporting for all businesses within the Group. Conduct and compliance are monitored by management, the Risk team, Internal Audit and Compliance and, to the extent necessary to support its audit report, the external auditor. Oversight is also exercised by the Board and Board Risk Committee.
During 2017 the Group continued to invest in its risk management capability and this ongoing investment will continue during 2018.
The Board regularly reviews actual and forecast performance compared with annual plans as well as other key performance indicators as described on pages 14 to 19.
Lines of responsibility and delegated authorities are clearly defined. The Group’s policies and procedures are reviewed and regularly updated and a training programme applies in relation to the roll-out of policies.
Section D: RemunerationDetails regarding the remuneration of the Directors, the governance processes connected with remuneration and the operation of the Directors Remuneration Policy can be found on pages 82 to 84.
Section E: Relations with shareholdersThe Company maintains a regular dialogue with its principal shareholders and makes full use of the Annual General Meeting to communicate with investors. All Directors are expected to make themselves available to shareholders at the Annual General Meeting. The Chairmen of the Board Committees will be available at the Annual General Meeting to answer questions about the work of their committees.
The Board recognises the importance of maintaining good relationships with shareholders. The Chief Executive Officer and the Chief Financial Officer would normally expect to meet with institutional shareholders on a regular basis, including following the publication of financial information or updates by the Group. The Chairman has joined them in some meetings throughout 2017. The Group’s brokers also facilitate communication between the Group and its institutional shareholders.
The Chairman is responsible for ensuring that appropriate channels of communication are established between the Directors (and in particular the Chief Executive Officer and Chief Financial Officer) and shareholders and that the views of shareholders are made known to the Board.
The Chief Executive Officer provides written reports prepared by the Group’s brokers to all Directors on meetings held with institutional shareholders.
The Group recognises the importance of ensuring effective communication with its shareholders. An annual financial report is distributed to all shareholders. This report, together with the half-yearly financial report, regulatory announcements and current details of the Group’s share price are made available on the Company’s website.
Annual General MeetingThe Group’s Annual General Meeting will be held at Arbuthnot House, 7 Wilson Street, London, EC2M 2SN at 3.00 p.m. on Wednesday 16 May 2018. The Notice of Annual General Meeting, together with an explanation of the items of business to be discussed at the meeting will be posted to shareholders and made available at www.securetrustbank.co.uk.
Members of the Board will be in attendance at the 2018 Annual General Meeting which will provide an opportunity to engage with shareholders and to respond to any questions from shareholders.
ApprovalThis corporate governance statement was approved by the Board on 21 March 2018 and signed on its behalf by:
A J Karter Secretary
Secure Trust Bank PLC Annual Report & Accounts 2017 Straightforward transparent banking
66
Risk management
A fundamental element of the Group’s strategy is the effective management of risk in order to protect the Group’s depositors, borrowers and shareholders, and to ensure that the Group maintains sufficient capital, liquidity and operational control at all times, and acts in a reputable way.
OverviewThis is reflected in the Group’s strategy and values, in particular the ‘Sustain’ strategy and ‘Risk Aware’ value, which demonstrate the Group’s commitment to protect the reputation, integrity and sustainability of the Bank for all of its customers and stakeholders through prudent balance sheet management, investment for growth and robust risk and operational control.
The Group’s Chief Risk Officer is responsible for leading the Group’s Risk Function, which is independent from the Group’s operational and commercial functions. The Risk Function is responsible for ensuring that appropriate risk management processes and controls are in place, and that they are sufficiently robust, so as to ensure that key risks are identified, assessed, monitored and mitigated. The Chief Risk Officer is responsible for providing assurance to the Board that the Group’s principal risks are appropriately managed and that it is operating within its risk appetite.
The Group’s risk management framework, policies and procedures are regularly reviewed and updated to ensure that they accurately identify the risks that the Group faces in its business activities and are appropriate for the nature, scale and complexity of the Group’s business.
Group risk appetite statementThe Group risk appetite statement confirms the risk parameters within which the strategic aims and vision of the Group are to be achieved. The Board has identified risk themes, risk drivers and major risk categories relevant to the business to enable it to produce the risk appetite statements, set out below, which underpin the strategy of the Group.
The Group risk appetite statement is subject to regular monitoring and review.
Risk management frameworkThe Group’s risk management framework supports decision-making across the Group and is designed to ensure that each risk is managed, monitored and overseen through a dedicated risk-specific committee. The Group operates a ‘Three Lines of Defence’ model for the management of its risks in which each risk has a defined risk appetite which is controlled and managed through documented policies and frequent reporting, and is overseen by one or more committees as part of the Group’s governance process.
The Group’s governance structure in respect of risk is summarised in the table on page 67, which sets out for each risk the relevant policy governing the risk, the method of reporting and the responsible committee(s).
Group risk appetite statement
Key theme Risk appetite statement Risk categories
Profitability The Group is profit and growth orientated whilst seeking to maintain a conservative and controlled risk profile. The Group manages credit risk through a pricing for risk model, which drives a potential post tax return on equity in excess of 20% in aggregate.
Market riskCredit risk
Financial strength The Group’s financial strength is safeguarded by a strong capital base and a prudent approach to liquidity management. The Group’s governance and capital planning processes and procedures are designed to ensure that capital levels will not fall below the Group’s individual capital guidance requirements. Liquidity is maintained at a level above the overall liquidity adequacy requirement with the majority of loans funded typically by retail deposits.
Credit riskLiquidity riskCapital risk
Conduct with customers and reputation
The Group conducts its business in a way that seeks to avoid negative outcomes for customers by consistently treating them fairly. The Group is straightforward and fair with its customers and seeks to achieve excellent customer service standards. The Group’s aim is to be seen as a sound and professional business in the marketplace. It has no appetite for reputational risk arising from the way in which it or its partners behave. It seeks to remain fully compliant with all relevant regulatory requirements.
Conduct risk
Business processes and people
The appetite of the Group for operational risk is to have well defined, scalable and controlled processes, running on robust and resilient systems, effective delivery of change and business continuity management. STB has a low tolerance for operational losses but understands that losses may occur in the pursuit of its business objectives.
Operational riskRegulatory risk

Strategic Report Corporate Governance Report
Financial Statements
67www.securetrustbank.co.uk
Risk governanceThe Three Lines of Defence, when taken together, control and manage risks in line with the Group’s risk appetite. The three lines are:
First Line: the Business Line Managers who own and manage risk;
Second Line: functions that oversee or specialise in risk management or compliance (Information Security, Operational Risk, Financial Crime and Compliance Teams); and
Third Line: Internal Audit.
Each line of defence effectively ensures a robust operational risk framework within the Group. The Group ensures that each line understands its respective responsibilities and those of the other lines, and has the appropriate resource and expertise in order to fulfil its responsibilities.
First Line of Defence – Business Line Managers As the First Line of Defence, the management and staff of each business unit are responsible and accountable for identifying, assessing, controlling and mitigating risks. They are the owners of the risks and controls that operate within their business.
Each business unit or subsidiary is responsible for the recording and maintenance of its own risks, within the statements of risk appetite, limits, tolerances and thresholds articulated within the risk management framework, including those set out in this document.
Second Line of Defence – Information Security, Operational Risk, Financial Crime and Compliance TeamsThe role of the Second Line of Defence is to support and guide the first line of defence in operating within the risk appetite. It does this by developing policies, providing monitoring, oversight, support and challenge to the first line, and aggregating and reporting risk related information throughout the organisation.
Third Line of Defence – Group Internal AuditInternal Audit provides the Audit Committee and senior management with comprehensive, independent and objective assurance on the effectiveness of risk governance, risk management, and internal controls in the first and second lines of defence. It reports significant risk exposures and control issues to the Audit Committee.
Risk management framework
Risk Credit Market Liquidity Operational Capital Conduct Regulatory
Key control documents
Consumer Credit Risk Policy
Business and Commercial Credit Risk Policy
Treasury Policy and ILAAP
Treasury Policy and ILAAP
Operational Risk Policy and Framework
ICAAP Conduct Risk Policy
Compliance Manual
Reporting Credit Risk Reports
ALCO and Treasury Reports
ALCO and Treasury Reports
Operational Risk MI and Reporting
ICAAP and other capital reports
Conduct Risk MI and Reporting
Compliance Reports
Monitoring committee
Consumer Credit Risk Committee
SME Credit Committee
ALCO ALCO Group and Business Level Operational Risk Committees
ALCO Customer Focus Committee
Group Compliance and Regulatory Risk Committee
Oversight committee
Risk Committee
Risk Committee
Risk Committee
Risk Committee
Risk Committee
Risk Committee
Risk Committee

Secure Trust Bank PLC Annual Report & Accounts 2017 Straightforward transparent banking
68
The scope of this assurance covers a broad range of objectives, including:
• efficiency and effectiveness of operations
• safeguarding of assets
• reliability and integrity of reporting processes
• compliance with laws, regulations, policies, procedures, and contracts.
The remit extends to a number of areas: group-wide processes; subsidiaries; business units; business processes including customer lifecycle, sales, marketing and operations; and enabling functions such as finance, HR, operational risk, compliance and IT.
The monitoring and control of risk is a fundamental part of the management process within the Group. The responsibilities of the Board, Risk Committee and Audit Committee in this respect are described later in this Corporate Governance Report. The following committees also form a key part of the Group’s risk management governance structure:
Assets and Liabilities Committee (‘ALCO’)The ALCO is a sub-committee of the Risk Committee and is responsible for implementing and controlling the liquidity and asset and liability management risk appetite of the Group, ensuring high level control over the Group’s balance sheet and associated risks. The committee sets and controls capital deployment, treasury strategy guidelines and limits and focuses on the effects of future plans and strategy on the Group’s assets and liabilities.
Consumer Credit Risk CommitteeThis committee ensures that there is control of credit and lending decisions and related risks in respect of the Consumer Finance businesses. Retail Finance and Motor Finance are reviewed in alternate months to ensure a detailed analysis is undertaken of the entire portfolio. This committee determines whether the credit strategies and risk polices are working and will make recommendations on any changes required.
SME Credit CommitteesThe Group operates a Credit Committee structure for its Business Finance operations, with lending authorities approved at the Board Risk Committee. There is no local sales authority with all deals going via the respective Credit Risk functions for manual underwriting and, where required under the mandate approval, at the STB Credit Committee level.
Group Operational Risk CommitteeThis committee reviews and monitors the adequacy, the implementation and the level of embeddedness of the operational risk management framework across the Group. It recommends and undertakes improvements where required. The committee assesses the operational risks across the
Group and recommends, initiates and monitors any further mitigating action that is required.
Group Compliance and Regulatory Risk CommitteeThis committee reviews and monitors regulatory change with which the Group is required to comply and it provides oversight that appropriate co-ordinated and controlled action is taken to deliver the required changes to an acceptable standard, which achieves compliance in a timely manner. This committee also reviews and approves the compliance risk management framework, the compliance universe and annual monitoring plan, anti-money laundering and financial crime systems of governance and control. It ensures that the Compliance function offers close and continual support to the First Line of Defence in understanding regulatory requirements and delivery of required outcomes.
Financial Crime CommitteeThis Committee ensures that fraud losses are maintained within risk appetite, that anti-money laundering and other financial crime related risks are well managed and that all related regulatory responsibilities are complied with.
Customer Focus CommitteeThis committee reviews and challenges the customer experience delivered by the Group, ensuring that treating customers fairly principles, conduct risk, and customer service excellence requirements are met and good customer outcomes are achieved.
Information Security Management CommitteeThis committee oversees the Group’s management of information, including safeguarding the personal information of its customers.
IT Governance and Risk CommitteeThis Committee reviews and monitors the adequacy and implementation of the Group’s IT Strategy and Policies. It also reviews, challenges and assesses the key IT risks across the Group and recommends, initiates and monitors, where further mitigating action may be required.
Other CommitteesThe governance arrangements are kept under review and changes made to respond to emerging needs. An Assumptions Committee was established in 2017 for the purpose of reviewing and challenging assumptions used in a number of areas including the ICAAP and ILAAP. The Assumptions Committee reports to the Risk Committee via ALCO. The implementation of IFRS 9 required new financial models to be produced and as a result a Model Governance Committee is being established to review and exercise oversight of financial models established and used by the Group.
Risk managementcontinued

Strategic Report Corporate Governance Report
Financial Statements
69www.securetrustbank.co.uk
I am pleased to present the report of the Nomination Committee in respect of 2017. Following the appointment of Ann Berresford and Victoria Stewart as directors in November 2016, Ann and Victoria have proven to be welcome additions to the Board, enhancing the Board’s collective experience and skills, and providing fresh challenge and oversight.
During 2017 the Committee has supported the new directors as they settle into their roles, bringing their experience to bear in the work of the Board and its Committees. Following a recommendation from the Committee, I am delighted that Ann has joined the Nomination Committee and has become Chairman of the Audit Committee; and Victoria has become Remuneration Committee Chairman. Both have received thorough inductions into their respective roles and have had the opportunity to meet senior members of the leadership team and other employees.
At the end of 2017 the Board underwent a questionnaire based performance evaluation which was conducted by the Company Secretary under my direction. In addition I have conducted individual evaluations with each of the Non-Executive Directors; and Paul Marrow, as SID, has undertaken an evaluation of me as Chairman, seeking feedback from both the Executive and Non-Executive Directors.
The outcomes of those various evaluations are consistent with a Board adapting to a new dynamic in terms of personnel, leadership and being listed on the Main Market. There are areas of excellence and areas for improvement. I am pleased to report, however, that the Board has concluded it is both performing well and is effective. Further information on the evaluations can be found on page 71, together with information on the activities of the Committee throughout 2017.
Since the end of the financial year, the Committee has considered the Financial Reporting Council’s proposed changes to the Code and specifically the impact those changes may have upon the Board and the composition of its Committees. As a consequence, following a recommendation from the Committee, the Board appointed Victoria Stewart as a member of the Committee with effect from 28 February 2018. In addition, Sir Henry Angest has decided to step down from the Remuneration Committee and Andrew Salmon has decided to step down from the Remuneration and Audit Committees, both with effect from 31 March 2018. Both will continue to remain members of the Board and the Committee.
The Committee will continue to review the composition of the Board and the Committees’ composition during 2018 having regard to proposed changes to the Code.
Lord Forsyth Chairman of the Nomination Committee
Statement by the Chairman of the Nomination Committee

Secure Trust Bank PLC Annual Report & Accounts 2017 Straightforward transparent banking
70
Meetings and attendanceNominationCommittee
Number of meetings during 2017 3Lord Forsyth 3/3Sir Henry Angest 3/3Ann Berresford 3/3Paul Marrow 3/3Andrew Salmon 3/3
Nomination Committee membership and meetingsThe Nomination Committee is composed of five members and is therefore compliant with the Code provision regarding the composition of the Nomination Committee. The Chairman of the Committee is Lord Forsyth.
The Nomination Committee meets as frequently as its chairman may require and also at regular intervals to deal with routine matters and in any event not less than twice in each financial year. The number of planned meetings held during 2017 and the attending directors are shown in the table at the bottom of this page.
The Company Secretary or the Deputy Secretary acts as Secretary to the Nomination Committee. Other individuals attend at the request of the Nomination Committee Chairman when appropriate and during the year the Chief Executive Officer and the Chief Financial Officer attended meetings.
The Chairman of the Nomination Committee reports to the Board on the outcome of Committee meetings and any recommendations made by the Committee.
Role and activities of the Nomination CommitteeThe Nomination Committee assists the Board in discharging its responsibilities relating to the structure, size and composition of the Board. The Nomination Committee is responsible for, amongst other matters, evaluating the balance of skills, knowledge, independence, experience and diversity of the Board, and makes recommendations to the Board on such matters. The Nomination Committee also considers succession planning, both for the Executive and Non-Executive Directors, taking into account the skills and expertise that will be needed on the Board in the future.
Nomination Committee report
Key: NED 40%
ED 0%
INED 60%
Composition
Key: Nomination Committee 100%
Meeting attendance
NED: Non-Executive DirectorED: Executive DirectorINED: Independent
Non-Executive Director

Strategic Report Corporate Governance Report
Financial Statements
71www.securetrustbank.co.uk
Board effectiveness and Non-Executive Director evaluationDuring 2017 the Board conducted an internally facilitated review of the effectiveness of the Board, its Committees and individual Directors using a combination of questionnaires and face to face meetings. The Committee reviewed the results of the effectiveness reviews and the individual Directors’ performance evaluations when assessing the composition of the Board Committees and the contribution made by the individual Directors. The Committee noted that the conclusion to the Board effectiveness review was that the Board was performing well and exercising the right level of judgement with due regard to the duties placed on Directors under company law.
As with all Boards that have undergone change, there were areas for improvement. The effectiveness review highlighted that there could be improvement in the quality of information coming to the Board and its Committees; and that this would assist the Board in moving towards an enhanced view on forward looking strategic direction rather than backward facing historic performance. The Committee noted that the Directors had been mindful of the provisions of the Code and their responsibilities as directors and, where applicable, as senior managers under the Senior Managers Regime when reaching their assessment of Board effectiveness and individual Director contributions.
The Committee reviewed the independence of each Non-Executive Director. Sir Henry Angest and Andrew Salmon were appointed to the Board by Arbuthnot Banking Group when Arbuthnot Banking Group owned the Group’s entire issued share capital and remain Non-Executive Directors of the Group. There is an understanding between the Group and Arbuthnot Banking Group that for so long as Arbuthnot Banking Group holds ten per cent., or more, of the issued share capital of the Group, Arbuthnot Banking Group would expect two directors of the Group to be nominees of Arbuthnot Banking Group.
The Board, upon the recommendation of the Committee, concluded that Sir Henry Angest and Andrew Salmon were not independent within the meaning of the Code, having regard to the relationship between the Company and Arbuthnot Banking Group.
The Committee, following a rigorous review and evaluation, considers Paul Marrow to be independent in both character and judgement, and his judgement unaffected by his appointments at other companies. The Board, upon the recommendation of the Committee, is satisfied that Ann Berresford, Paul Marrow and Victoria Stewart are all independent Non-Executive Directors within the meaning of the Code and that Lord Forsyth, on his appointment as Chairman, met the independence criteria set out in the Code. As a smaller company within the meaning of the Code, the Company is required to have at least two independent Non-Executive Directors.
The Committee recommended to the Board that the composition of each Committee was appropriate, with each Committee having the right balance of skills and experience. Further information on the individual Directors’ experience can be found on pages 59 to 60. Following the proposed changes to the Code announced by the FRC in December 2017, the Committee has recommended to the Board that Victoria Stewart join the Committee, which the Board approved with effect from 28 February 2018. The Committee contemplates conducting a further internally facilitated review of the effectiveness of the Board, its committees and individual Directors during 2018.
Board training and developmentThe Board receives detailed reports from executive management on the performance of the Group at its meetings. Updates are provided on relevant legal, corporate governance and financial reporting developments.
In addition, the Board, upon the recommendation of the Committee, adopted a training programme during 2017 and received formal training from both internal and external experts on topics ranging from Gender Pay Gap to Treasury Management; and from IFRS 9 disclosures to directors’ duties. The focus for training in 2017 was on strategic matters likely to impact the Group and on regulatory obligations following the listing on the Main Market in October 2016. Directors are also encouraged to attend external seminars on areas of relevance to their role and to keep a record of their external training.
A training plan for 2018 has been developed with a focus both on strategic and governance matters.
Succession planningThe Nomination Committee has considered the Company’s succession plans and focused on Board (executive and non-executive) and Senior Manager succession. Consideration has been given to potential internal candidates, short term solutions in the event of unanticipated changes in circumstances and external recruitment as well as re-allocating responsibilities on a short term or longer basis. The need for regulatory approval of the persons performing Senior Manager functions under the Senior Managers Regime has also been taken into account.
The Nomination Committee also reviewed the Board policy on diversity, including gender. The policy is described on page 64.
A full copy of the terms of reference for the Nomination Committee can be obtained by request to the Company Secretary or via the Group’s website at www.securetrustbank.co.uk.

Secure Trust Bank PLC Annual Report & Accounts 2017 Straightforward transparent banking
72
I am pleased to present the report of the Audit Committee for the financial year ended 31 December 2017.
2017 has been an active year for the Audit Committee. As well as routine ‘business as usual items’, the Committee has exercised oversight of the external audit tender and managed changes to the Committee composition and responsibilities. In respect of the latter I would like to offer my thanks to Paul Marrow who stepped down as Audit Committee Chairman in September 2017 after serving as Chairman since 2011. Paul remains an active member of the Committee and our ‘Whistleblowers’ Champion’ and, as Chairman of the Risk Committee, he provides an important link between the two Committees and helps avoid duplication of oversight.
I would also like to thank Andrew Salmon for his contribution to the Committee as he steps down from the Committee with effect from 31 March 2018.
I was appointed to the Audit Committee in November 2016 and succeeded Paul Marrow as Chairman on 22 September 2017. During that period I received a tailored induction from the Company Secretary and the Chairman of the Audit Committee and since then have met regularly with key members of the Finance team and the Chief Internal Auditor, as well as the external audit partner.
In the Audit Committee report of the 2016 Annual Report and Accounts we indicated that the Company would conduct an external tender process coinciding with the required rotation in audit partner at the end of the financial year 2017 audit. The tender was completed in late 2017 and, based upon the Audit Committee’s recommendation, the Board is proposing that shareholders approve that Deloitte LLP be appointed as auditor effective from the 2018 Annual General Meeting. We set out the details of the audit tender process on page 76. KPMG LLP will continue in the role until the audit of the Group’s consolidated accounts for the year ending 31 December 2017 has been completed. The Committee and the Board would like to thank each audit firm that participated in the audit tender and specifically KPMG LLP for their contribution and dedication over the years. We look forward to a constructive and professional relationship with Deloitte in the future.
The Committee has monitored closely the Group’s transition to IFRS 9 and the accounting judgements involved, and understanding the potential accounting treatment of IFRS 9 formed one of the key assessment criteria for potential auditors in the audit tender. Further detail is set out on page 117 and in Note 29 on pages 155 to 160.
2018 will be another busy year, as the Committee oversees the implementation of IFRS 9 and addresses the transition to that Standard and seeks to develop its relationship with the external auditor, whilst overseeing the delivery of the Internal Audit plan and the interim and Full Year accounts.
Further information on the activities of the Audit Committee is provided in the following report and I will be available at the AGM to answer any questions about our work.
Ann Berresford Chairman of the Audit Committee
Statement by the Chairman of the Audit Committee

Strategic Report Corporate Governance Report
Financial Statements
73www.securetrustbank.co.uk
Audit Committee membership and meetingsThe Audit Committee is composed of four members: the Chairman of the Company (Lord Forsyth), who was considered independent on appointment as Chairman, two independent Non-Executive Directors (Ann Berresford and Paul Marrow) and Andrew Salmon, who is a Non-Executive Director. Andrew Salmon and Ann Berresford are considered by the Board to have recent and relevant financial experience and the Audit Committee as a whole has competence relevant to the sector in which the Group operates.
The Code provides that for smaller companies, such as the Company, the Board should establish an Audit Committee of at least two independent Non-Executive Directors. In addition, the Chairman of the Company may be a member of, but not chair, the Committee if he/she was considered independent on appointment as Chairman. The Company complies with this provision.
The Audit Committee meets formally at least four times a year and otherwise as required. The number of planned meetings held during 2017 and the attending directors are shown in the table at the bottom of this page.
The Company Secretary or the Deputy Company Secretary acts as Secretary to the Audit Committee. Other individuals attend at the request of the Audit Committee Chairman and during the year the external auditor lead partner, Chief Executive Officer, Chief Financial Officer and Chief Internal Auditor and a number of senior members of the finance department attended meetings to report to the Audit Committee. The Chairman of the Audit Committee reports to the Board on the outcome of Committee meetings and any recommendations arising from the Committee.
Role of the Audit CommitteeThe Audit Committee assists the Board in, amongst other matters, discharging its responsibilities with regard to regulatory reporting, financial reporting, including reviewing the Company’s annual financial statements, reviewing and monitoring the extent of the non-audit work undertaken by external auditors, advising on the appointment, reappointment, removal and independence of external auditors and reviewing the effectiveness of the Company’s internal audit activities, internal controls and risk management systems. The ultimate responsibility for reviewing and approving the annual report and accounts and the half-yearly report remains with the Board. The Board ensures the Annual Report, taken as a whole is fair, balanced and understandable and provides the information necessary for shareholders to assess the Company’s position, performance, business model and strategy. The Audit Committee assists the Board in reaching those conclusions, including an assessment that the narrative reporting in the front of the Annual Report accurately reflects the financial statements in the back.
Audit Committee membership and meetingsAudit
Committee
Number of meetings during 2017 6Ann Berresford 6/6Lord Forsyth 6/6Paul Marrow 6/6Andrew Salmon 6/6
Audit Committee report
Key: NED 25%
ED 0%
INED 75%
Composition
Key: Audit Committee 100%
Meeting attendance
NED: Non-Executive DirectorED: Executive DirectorINED: Independent
Non-Executive Director

Secure Trust Bank PLC Annual Report & Accounts 2017 Straightforward transparent banking
74
A full copy of the terms of reference for the Audit Committee can be obtained by request to the Company Secretary or via the Group’s website at www.securetrustbank.co.uk.
Matters discussed at Audit Committee meetings since 1 January 2017The Audit Committee has a schedule of meetings with standing agenda items. Meetings are planned to coincide with key dates in the Group’s financial reporting cycle, enabling the Committee to deal with matters on a timely basis over the course of the year. In addition to standing agenda items the Committee also deals with other matters that arise during the year. In 2017 this included matters relating to the external audit tender and the planned transition to IFRS 9.
During the year the Audit Committee reviewed and approved its Terms of Reference, the schedule of standing agenda items, the Internal Audit Charter and the engagement contract with the external auditors.
The principal matters considered by the Audit Committee during the year and up to the date of this report are set out below.
Financial reportingThe Audit Committee has reviewed the matters set out in the table opposite in connection with the annual and interim financial statements and considers that the Company has adopted appropriate accounting policies and made appropriate estimates and judgements.
The table opposite is not a complete list of matters considered by the Committee but highlights the most significant matters for the period in the opinion of the Audit Committee.
External auditThe Committee has reviewed and approved the external audit terms of engagement, the scope of the external audit, timetable, materiality, strategy and fees. The Committee maintains a close dialogue with the external auditors and undertakes meetings with them without management when considered appropriate and at least once a year.
The Audit Committee has also considered matters that might impair the independence of the external auditor, including the non-audit fees paid to the external auditor, and has confirmed that it was satisfied as to the independence of the external audit firm KPMG LLP.
The Audit Committee reviews written reports prepared by the external auditors setting out their audit approach and conclusions on matters of judgment impacting the financial statements, disclosures in relation to non-recurring or sensitive items and any internal control findings identified during the course of the external audit.
During the year the Audit Committee assessed the effectiveness of the work of the external auditors using a questionnaire which considered matters such as the quality of the team, the scope of the work, communications and fees. The Committee also met with management, including without KPMG LLP present, to hear their views on the effectiveness of the external auditors. The Committee concluded that the external auditors are performing well.
KPMG LLP has also confirmed to the Audit Committee that it has policies and procedures in place to satisfy the required standards of objectivity, independence and integrity and that these comply with the Auditing Practices Board’s Ethical Standards for Auditors. This ensures that the objectives of the proposed engagement are not inconsistent with the objectives of the audit; allows the identification and assessment of any related threats to KPMG LLP’s objectivity; and assesses the effectiveness of available safeguards to eliminate such threats or reduce them to an acceptable level. KPMG LLP does not carry out non-audit services where no satisfactory safeguards exist.
During the year the Financial Reporting Council wrote to all audit firms including KPMG LLP to highlight concerns about the impact of findings from Audit Quality Reviews they had carried out. KPMG LLP wrote to the Audit Committee setting out their reflections on the matters raised by the Financial Reporting Council, including procedures they intend to carry out on a firm-wide basis to address the concerns raised. The Committee has reviewed and discussed KPMG LLP’s proposed responses with the external audit partner.
The Audit Committee was satisfied that the level of audit fees payable in respect of the audit services provided, being £338,000 (2016: £212,000) was appropriate and that an effective audit could be conducted for such a fee. The existing authority for the Audit Committee to determine the current remuneration of the external auditors is derived from shareholder approval granted at the AGM held in May 2017.
Non audit services policy The Group has agreed a policy on the provision of non-audit services by its external auditor. The policy ensures that the engagement of the external auditor for such services requires pre-approval by appropriate levels of management and does not impair the independence of the external auditor, and that such engagements are reported to the Audit Committee on a regular basis. The external auditor will only be selected for such services when they are best suited to undertake the work and there is no conflict of interest.
Audit Committee reportcontinued

Strategic Report Corporate Governance Report
Financial Statements
75www.securetrustbank.co.uk
Financial reporting
Subject area Matters considered
Accounting policies, key judgements and assumptions used in preparing interim and annual financial statements
The Audit Committee reviewed the key accounting judgments made by management in preparing the financial statements for the year ended 31 December 2017 (including comparatives for the year ended 31 December 2016), the interim financial statements for the six months ended 30 June 2017, and the press releases and investor presentations that were prepared when the financial statements were released.
In particular the Committee considered at its meeting in February 2018 a paper on the key accounting judgments relating to the 2017 annual report and accounts. Among other matters the Committee considered income recognition, impairments and expected value of share option schemes. In relation to income recognition the treatment of fees and commissions was considered together with the assessment of the appropriate expected lives for different products. This is relevant to the calculation of the effective interest rate for each product. In relation to impairment provisions the Committee considered the adequacy of provision cover, including the emergence period for different products, factors relevant to the loss given default assumptions used for consumer products and the level of overlay to the modelled impairment provision to reflect increased uncertainty in the UK economy and the remaining sub-prime motor book.
In making its recommendations to the Board to approve the annual and interim financial statements the Committee has taken into account matters raised by the external auditor on matters of judgment and disclosures in relation to non-recurring or sensitive items.
Use of the going concern basis in preparing the financial statements and long term viability of the STB Group
The financial statements are prepared on the basis that the Group and Company are each a going concern. The Audit Committee has reviewed management’s explanations as to the appropriateness of the going concern basis in preparing the Group and Company financial statements.
The financial statements for 2017 also include statements that provide shareholders with the Board’s views on the long term viability of the Group. The Audit Committee has reviewed and challenged the basis for assessing long term viability, including the period by reference to which viability is assessed, the principal risks to long term viability and actions taken or planned to manage those risks.
Presentation of a ‘fair, balanced and understandable’ Annual Report and Accounts
The Audit Committee, having reviewed the content of the Annual Report and considering relevant matters including the presentation of material sensitive items, the representation of significant issues, the consistency of the narrative disclosures in the ‘front half’ with the financial statements, the overall structure of the Annual Report and the steps taken to ensure the completeness and accuracy of the matters included, has advised the Board that the 2017 Annual Report and Accounts include a ‘fair, balanced and understandable’ assessment of the Group and Company’s businesses.
The potential impact of future accounting changes
The Committee has considered changes to financial reporting requirements that were not yet effective as at 31 December 2017 but that are likely to impact the reported results or financial position of the Group in the future. One significant development is the implementation of International Financial Reporting Standard 9 (Financial Instruments) which became effective in 2018 and for which the Company established an implementation project. The Committee has reviewed progress in responding to the requirements of IFRS9 and has this matter as a standing agenda item, considering matters such as: key decisions taken; credit loss modelling under the new and existing standards; systems and controls requirements to embed IFRS9; and risks to the successful completion of the project. Following the standard becoming effective, the Committee has reviewed the expected impact of the transition on the 2018 opening balance sheet and the associated treatment of the impact on capital resources. The Committee also approved the accounting policies in respect of IFRS9.

Secure Trust Bank PLC Annual Report & Accounts 2017 Straightforward transparent banking
76
The provision of any non-audit services provided by the external auditors requires prior approval, as set out in the table at the bottom of this page.
The total of audit and non-audit fees paid to KPMG LLP during the period is set out in Note 5 on page 129. The non-audit services fee of £101,000 (2016: £536,000) was in respect of, but not limited to, the review of the half-year accounts and work relating to access to the Term Funding Scheme. In the case of each engagement, management considered it appropriate to engage KPMG LLP for the work because of their existing knowledge and experience from prior Group engagements. KPMG LLP were the reporting accountants in connection with Admission and, as a consequence, the non-audit fees for 2016 were substantial.
The Committee is satisfied that these non-audit services did not adversely impact the independence of KPMG LLP’s audit services.
External audit tenderKPMG LLP (and their predecessor firm) were appointed as the Company’s auditor in 2009, requiring the audit to be subject to an external tender process no later than 2019. The current KPMG LLP audit partner is Andrew Walker who has been the audit partner for four years and who can therefore continue until the completion of the 2017 audit at the latest. Although the Audit Committee has remained satisfied with both KPMG LLP’s quality of service and independence, as detailed above, the Audit Committee recommended to the Board that it would be appropriate to conduct an external tender process in anticipation of the change in audit partner and commenced work on the tender process in mid-2017.
The Audit Committee approved and oversaw the tender process, including agreeing the timetable and tender document, which were prepared in accordance with the relevant requirements. A description of the process undertaken during the audit tender is set out on page 77.
The Audit Committee has reviewed plans for the transition to the new auditors and will receive regular reports on the transition at its meetings throughout 2018. KPMG LLP will cease to hold office at the conclusion of the financial year 2017 audit. A statement of circumstances will be included in the Notice of Annual General Meeting to be circulated to shareholders.
The Company confirms that it has complied with the Statutory Audit Services for Large Companies Market Investigation (Mandatory Use of Competitive Processes and Audit Committee Responsibilities) Order 2014 (Article 7.1) published by the CMA on 26 September 2014 and Article 16 (3) of the Audit Regulation, including with respect to the Audit Committee’s responsibilities for agreeing the audit scope and fees and supervising the audit tender process.
Internal auditThe Group has an independent Internal Audit function led by the Chief Internal Auditor. The Chief Internal Auditor reports directly to the chairman of the Audit Committee and they meet each month.
The Audit Committee has reviewed and approved the internal audit plan for the year and has monitored the activity of the Internal Audit function throughout the year. It has also:
• Reviewed other matters which are not currently contemplated in the audit plan but which may be appropriate for inclusion in the future.
• Considered the risk and control matters identified in internal audit reports issued since the previous meeting along with management’s responses to those points and progress in taking action to resolve control weaknesses.
• Approved the Internal Audit budget and resource plan for the year.
• Reviewed and approved the Internal Audit Charter.
• Reviewed the annual assessment of the overall effectiveness of the governance and risk and control framework provided by the Internal Audit function.
In addition the Audit Committee assesses the effectiveness and independence of the Internal Audit Function each year. In 2016 it commissioned an independent external party to carry out a full external effectiveness review which highlighted a number of particular strengths as well as some areas for further enhancement. During 2017 the Committee has reviewed the performance of the Internal Audit Function taking into account an updated assessment carried out by the Chief Internal Auditor and the progress made addressing areas for enhancement identified in the 2016 review, and was satisfied as to the effectiveness and independence of the internal audit function.
Audit Committee reportcontinued
Non audit services policy
Approval required
Services not previously pre-approved regardless of fee Audit CommitteeAny engagement > £100,000 Audit CommitteePre-approved services < £100,000 CEO or CFO

Strategic Report Corporate Governance Report
Financial Statements
77www.securetrustbank.co.uk
Audit tender process
Key activities and timeline
Stage 1The Audit Committee agreed and approved the draft plan submitted to the Committee, drafted by a Working Group of the then Audit Committee Chairman, Chief Financial Officer, the Proposed Chairman of the Audit Committee, the Chief Internal Auditor and the General Counsel and Company Secretary.A stakeholder workshop was then held to confirm the scope and timetable for the tender, to determine the key selection criteria as a basis for the evaluation scorecard and determine which firms would be invited to participate in the tender. These documents were each agreed and approved by the Audit Committee prior to circulation to the participants.
Stage 2 Four firms, including one outside of the “Big Four”, were then invited by the Audit Committee Chairman to participate in this stage of the tender, with each firm providing written confirmation in a prescribed format that they had no conflict of interest and that they expected to satisfy independence requirements.Once confirmation had been received from each firm, a timetable and process, including selection criteria and identification of those individuals and roles the Committee expected to meet was sent to each firm. Written responses in respect of the tender documentation were required.
Stage 3 Each written submission was evaluated using the scorecard determined in Stage 1, with a recommendation made from the Working Group to the Audit Committee on which firms should be invited to present. Three firms were invited to give a presentation on their proposals to the Audit Committee.
Stage 4 Each of the three firms gave a presentation, followed by a Question and Answer session, to the Audit Committee. The Audit Committee ranked each firm based on both their written submission and their presentations.
Stage 5The Audit Committee provided a written report to the Board, including a recommendation to the Board of two firms to be appointed, specifying the Audit Committee’s first and second choices. The Board accepted the Audit Committee’s recommendation to appoint Deloitte LLP as external auditor and a resolution for the appointment of Deloitte LLP will be put to shareholders at the 2018 AGM. The Audit Committee and the Board confirm that this recommendation to shareholders is free from influence by a third party and that no contractual term has been imposed on the Company limiting the choice of auditor.
The Committee was satisfied that Internal Audit has the appropriate resources to deliver the 2017 and 2018 internal audit plan. In addition to the internal resource it is also able to draw on a panel of external subject matter experts.
Internal controls and risk managementThe Audit Committee monitors the effectiveness of the Group’s governance, risk and control framework. A statement approved by the Committee regarding the operation of the risk and control framework is set out on page 67.
During 2017 the Committee has reviewed the procedures for detecting fraud affecting financial reporting.
WhistleblowingThe Audit Committee has reviewed the effectiveness of whistleblowing arrangements in place within the Group and adherence to the Financial Conduct Authority Rules on Whistleblowing which became effective in September 2016.
During the year the Committee received a report on a review and test of the Whistleblowing framework, which included the results of mandatory training provided for staff and the provision of a confidential hotline by an external third party.
The Chairman of the Risk Committee is the Whistleblowers’ Champion for the Group and the Risk Committee received a report each quarter on the operation of the Whistleblowing arrangements.
Audit Committee effectivenessDuring the year the Committee considered and evaluated its performance. It did this by means of a questionnaire which members of the Committee completed and by taking soundings from other attendees, including the external auditor. The Chairman of the Committee then collected the responses and produced a report to the Committee. The result of the evaluation was that the Committee considered that it was performing effectively.

Secure Trust Bank PLC Annual Report & Accounts 2017 Straightforward transparent banking
78
I am pleased to present the report of the Risk Committee for the financial year ended 31 December 2017.
Statement by the Chairman of the Risk Committee
The Group has had separate Audit and Risk Committees since 2011 and both Committees have overseen the development and evolution of the risk management and internal control frameworks during that period and to date. The Risk and Compliance teams continue to meet the challenge of developing regulation and have provided the Committee with effective oversight of the risk landscape within the Group.
Management of risk is a key part of what the Group does. The Committee has been involved both with assessing the principal risks that impact the Group at a macro-economic and strategic level; and also in assessing risk at a business level when the Group seeks to develop new business opportunities or products. The Committee has worked closely with the nascent residential mortgage team in assessing and developing products which the mortgage team are now bringing to market. We will continue to monitor the emerging risks in this area as the business grows the mortgage book and continues to develop new products.
Throughout the year the Committee has had a key focus on data resilience and security, with special attention being paid to ‘cyber security’ as the Group launched its new online deposits platform. Cyber security has become a standing agenda item for the Committee as the Group seeks to mitigate the risk in this area, both by reviewing current preventative measures and by scenario planning should a cyber event occur. As well as receiving updates from the Committee, the Board will participate in a specific cyber security training session in 2018.
The Committee also considers regulatory updates through regular reporting which includes the outputs of the Compliance monitoring programme and emerging regulatory requirements.
Further information on the activities of the Committee during the year is provided in the following report and further information about risk related matters can be found in the sections of the report and accounts on pages 42 to 51.
Paul Marrow Chairman of the Risk Committee

Strategic Report Corporate Governance Report
Financial Statements
79www.securetrustbank.co.uk
Risk Committee report
Risk Committee membership and meetingsThe Risk Committee is composed of three members as set out below. Paul Marrow is the Chairman of the Risk Committee. There were no changes to the membership of the Committee in 2017.
The Risk Committee has met formally five times during the year and meets when required to address non-routine matters. The number of planned meetings held during 2017 and the attending directors are shown in the table at the base of this page:
The Company Secretary or the Deputy Company Secretary acts as Secretary to the Risk Committee. Other individuals attend at the request of the Risk Committee Chairman and during the year the Chief Risk Officer, Chief Internal Auditor, Chief Compliance Officer, Group Head of Operational Risk, Chief Information Security Officer and other senior managers attended meetings to report to the Committee.
The Chairman of the Risk Committee reports to the Board on the outcome of Committee meetings and any recommendations arising from the Committee.
Role of the Risk CommitteeThe Risk Committee reviews the design and implementation of risk management policies and risk related strategies and the procedures for monitoring the adequacy and effectiveness of this process; considers the Group’s risk appetite in relation to the current and future strategy of the Group; oversees the Group’s ICAAP and ILAAP and outputs from these; and exercises oversight of the risk exposures of the Group.
The Committee exercises its internal control and risk management role through the reports it receives from the ALCO, the Chief Risk Officer, the Chief Internal Auditor, the Chief Executive Officer, the Chief Financial Officer and other members of management and its engagement with executive management, internal and external auditors and consultants.
Other matters within the remit of the Committee are the risk profile of the Group, risk appetite, frameworks and limits, the risk management operating model, the technology infrastructure supporting the risk management framework, operational risk and regulatory and compliance matters.
Risk Committee membership and meetingsRisk
Committee
Number of meetings during 2017 5Paul Marrow 5/5Paul Lynam 5/5Andrew Salmon 4¹/5
Key: NED 33.33%
ED 33.33%
INED 33.33%
Composition
Key: Risk Committee 93.33%
Meeting attendance
¹ Andrew Salmon was unable to attend the February meeting as he was overseas and unable to dial in to the meeting.
NED: Non-Executive DirectorED: Executive DirectorINED: Independent
Non-Executive Director

Secure Trust Bank PLC Annual Report & Accounts 2017 Straightforward transparent banking
80
Matters discussed at Risk Committee meetings since 1 January 2017
Subject area Matters considered
Group risk appetite statement and key risk indicators
The Group’s key risk appetite metrics, which are reviewed and approved on an annual basis. The Committee reviews exceptions to the last quarter’s performance on the key risk indicator metrics in each meeting.
Strategic risks Strategic risks (those arising from the internal environment and the external environment that could have an effect on management’s ability to deliver on the Group strategic plan) are discussed and challenged on an annual basis.
Credit risk Credit risk performance for all businesses and ‘deep dive’ reviews on status and plans for individual account balances or portfolios that warrant specific focus.
The Committee has a mandate to approve some Group-wide mandates and policies including single counterparty limits and credit risk policies set for individual business areas.
Operational risk Oversight of the operational risk policy including metrics and KPI reporting and business unit management risk and control self-assessment. Complaints data, governance, including review of the Group Governance Manual.
Capital risk The Committee has primary responsibility for reviewing and making a recommendation to the Board on the Bank’s ICAAP and ILAAP and the Resolution and Recovery Plans. Specific matters such as the Pillar 2A capital requirement and the results of stress testing were reviewed and debated.
Cyber resilience risk The strategies undertaken within the Group to understand, identify, monitor and respond to cyber threats including the current state and planned activity.
Regulatory and conduct risk The Committee receives regular reports on the key risk indicators for regulatory, reputational and conduct risk. The Committee reviews the regulatory risk assessment on an annual basis and approves the annual compliance monitoring programme.
Whistleblowing The Chair of the Committee has the role of Whistleblowers’ Champion. The Committee has validated through oversight and regular reporting that the arrangements for whistleblowing remain effective.
Matters discussed at Risk Committee meetings since 1 January 2017The Risk Committee has a schedule of meetings with standing agenda items so that all relevant matters are dealt with over the course of the year. In addition to standing agenda items the Committee also deals with other matters that arise during the year. In 2017 this included, for example, increasing the focus on cyber security and matters relating to the development of the mortgage business, the appointment of a Group Data Protection Officer and updates on compliance with the EU General Data Protection Regulation (GDPR).
During the year the Risk Committee reviewed its Terms of Reference and approved the schedule of standing agenda items, the Compliance monitoring plan for 2018, the business continuity plan and the operational risk management policy.
The principal matters discussed during the year and up to the date of this report were as follows:
Risk Committee reportcontinued

Strategic Report Corporate Governance Report
Financial Statements
81www.securetrustbank.co.uk
Compliance monitoringThe Committee oversees the management of regulatory risk for the Group. The Chief Compliance Officer presents an Annual Compliance Report to the Committee and responds to any challenge from the Committee on the effectiveness of the Compliance function.
The Committee receives bi-monthly reports on key risk indicators for regulatory, reputational and conduct risk, regulatory incidents and key advisory activity of note, horizon scanning and actions to implement new and revised regulations or legislation, and the outputs of the compliance monitoring programme. The Committee reviews the Regulatory Risk Assessment on an annual basis, and approves the annual compliance monitoring programme.
In addition, the Committee receives a detailed review of financial crime focussed on Anti-Money Laundering in the Money Laundering Reporting Officer’s (MLRO) Annual Report.
The Group has appointed an outsourced service provider to manage its whistleblowing arrangements. Quarterly reports are provided to the Committee and the Whistleblowers’ Champion and tests have been completed validating the adequacy of the framework, service provider and internal procedures.
During 2017, regulatory changes have included the implementation of Conduct Rules to notified Non-Executive Directors and implementation of Regulatory References Rules; planning for the extension of the Senior Managers and Certification Regime to our regulated subsidiaries (Debt Managers (Services) Ltd and V12 Retail Finance Ltd); the major project for GDPR, which requires changes to the management of personal data across the Group; and implementation of Payment Services Directive II.
Conduct risk and culture remain a key focus within the Group and are managed through the Customer Focus Committee which reports to the Board through the Executive Committee.
Strategic and operational riskThe Committee oversees the management of strategic and operational risk across the Group. The Group Head of Operational Risk presents annually an Operational Risk Management Policy to the Committee and responds to any challenge from the Committee on the effectiveness of risk management and risk governance throughout the Group.
To assist in understanding how the risk framework has embedded within the Group and to challenge the effectiveness of the risk management function, the Committee receives a quarterly review of material operational risk events/losses, together with the key findings from bi-annual Risk and Control Self Assessments (RCSAs).
The Committee conducts an annual review of the Group risk appetite statement and the supporting metrics and recommends the Group risk appetite statement to the Board for approval.
In assessing strategic risk the Committee has regard to the identified strategic risks, which the Committee reviews annually. In assessing strategic risks, the Committee has due regard to the existing process and internal controls in operation and reviews the recommendations from the Risk and Compliance functions on how to adapt the controls to mitigate those risks.
Credit riskThe Committee receives reports on key risk indicators for credit risk, together with quarterly assessments of each portfolio’s credit profile including impairments, bad debts, watch-lists, and any policy exceptions. These assessments are underpinned by the associated credit risk policies which, together with the Responsible Lending policy, set out the credit risk framework which is reviewed by the Committee at least annually.
Risk Committee effectivenessDuring the year the Committee considered and evaluated its own performance. It did this by means of a questionnaire which members of the Committee completed. The Chairman of the Committee then collected the responses and produced a report to the Committee. The result of the evaluation was that the Committee considered that it was performing effectively.
A full copy of the terms of reference for the Risk Committee can be obtained by request to the Company Secretary or via the Group’s website at www.securetrustbank.co.uk.

Secure Trust Bank PLC Annual Report & Accounts 2017 Straightforward transparent banking
82
Statement by the Chairman of the Remuneration Committee
I am pleased to present my first report as Remuneration Committee Chairman at the end of the first full year as a Company listed on the Main Market of the London Stock Exchange.
I succeeded Sir Henry Angest as Remuneration Committee Chairman on 21 July 2017 and I would like to thank him for his guidance and input as the Committee Chairmanship transitioned to me, and also for his work earlier in the year in drafting the Remuneration Policy, which was approved by shareholders at the AGM on 3 May 2017. As detailed on page 69 Sir Henry and Andrew Salmon will be stepping down from the Committee with effect from 31 March 2018. I would like to offer them both my thanks for their contribution and counsel to the Committee throughout their tenure.
Our focus for the majority of 2017 has been on producing and implementing the Remuneration Policy (“Policy”) and the processes which underpin the Policy. The Committee considers 2017 to be a transitional year in which the Company made changes to practice and procedure resulting from the move from AIM to the Main Market and in contemplation of the implementation of the new Policy. The Committee will, therefore, make a more detailed disclosure of the Executive Directors’ performance metrics and target ranges for the financial year ending 31 December 2018, and future years, subject to any commercial sensitivity at the time of reporting. The Committee intends to disclose the performance metrics and targets for the financial year ending 31 December 2018, subject to commercial sensitivity considerations, in the 2018 Annual Report.
Shareholders also approved three new share schemes at the 2017 AGM and we granted awards to the Executive Directors and senior management under the 2017 Long Term Incentive Plan for the first time on 1 June 2017. In August 2017 we successfully launched our first Sharesave Scheme for eligible staff which had a 41% take up. Both schemes are a powerful retention tool creating alignment and encouragement for staff to have greater engagement with STB. We intend to grant shares under the Deferred Bonus Plan in Q2 2018, following the payment and deferral of the 2017 Annual Bonus to the Executive Directors.
The Policy has provided a framework for the remuneration of our Executive Directors and we have sought to replicate and implement a similar remuneration framework across all staff to ensure that remuneration across the Group is aligned to our strategic goals. This continues to be work in progress and will be a focus for the Committee throughout 2018. The adoption of a remuneration framework, together with a new grading structure, will also help in our identification of the Gender Pay Gap (“GPG”) within STB and what we can do constructively to address both the “gap” and our talent pipeline.
We listened to shareholders’ concerns raised at the last AGM about the quantum of executive remuneration and, taking account of 2017 performance, have reflected this in 2017 reward outcomes and for the proposed remuneration for 2018. Details of Executive Director remuneration in 2017 and 2018 can be found later in this report.
Our focus for 2018 will be in continuing to strengthen the processes put in place during 2017, on reviewing the implementation of the All Employee Remuneration Policy, together with reviewing progress in GPG. Further disclosure on diversity generally can be found on page 56. The Committee will also be giving consideration to the proposed changes to the remit of the Committee under the revised UK Corporate Governance Code.
We encourage an active interest from our investors in our Remuneration Policy and practices, and we welcome dialogue with shareholders on remuneration and would expect to engage regularly with shareholders on this important subject.
Victoria Stewart Chairman of the Remuneration Committee

Strategic Report Corporate Governance Report
Financial Statements
83www.securetrustbank.co.uk
Remuneration Committee membership and meetingsThe Remuneration Committee is composed of five members as set out below. Victoria Stewart was appointed as the Chairman of the Remuneration Committee on 21 July 2017. There were no changes to the membership of the Committee in 2017.
The Remuneration Committee meets at least twice a year and when required to address non-routine matters. The number of planned meetings held during 2017 and the attending directors are shown in the table at the base of the page:
The Company Secretary or the Deputy Company Secretary acts as Secretary to the Remuneration Committee. Other individuals attend at the request of the Remuneration Committee Chairman and during the year the Chief Executive Officer, HR Director and other senior managers attended meetings to report to the Committee.
The Chairman of the Remuneration Committee reports to the Board on the outcome of Committee meetings and any recommendations arising from the Committee.
The UK Corporate Governance Code contemplates that, in relation to the Company, the Board should establish a Remuneration Committee of at least two independent Non-Executive Directors. The Company Chairman may also be a member of the Committee where, as is the case with STB, he was considered independent on appointment as Chairman. All the members of the Committee are Non-Executive Directors and Paul Marrow and Victoria Stewart are independent Non-Executive Directors, in compliance with the Code provision in relation to the composition of the Remuneration Committee.
During the year the Committee reviewed and approved its terms of reference. A full copy of the terms of reference of the Remuneration Committee can be obtained by request to the Company Secretary or via the Group’s website at www.securetrustbank.co.uk.
Operation of the Remuneration Committee
Remuneration Committee membership and meetings
RemunerationCommittee
Number of meetings during 2017 5Victoria Stewart 5/5Lord Forsyth 5/5Sir Henry Angest 5/5Paul Marrow 5/5Andrew Salmon 5/5
Key: NED 40%
ED 0%
INED 60%
Composition
Key: Remuneration
Committee 100%
Meeting attendance
NED: Non-Executive DirectorED: Executive DirectorINED: Independent
Non-Executive Director

Secure Trust Bank PLC Annual Report & Accounts 2017 Straightforward transparent banking
84
Role of the Remuneration CommitteeThe Remuneration Committee assists the Board in fulfilling its responsibilities in relation to remuneration including, amongst other matters, determining the individual remuneration and benefits package of each of the Executive Directors and recommending and monitoring the remuneration of senior management below Board level.
The table below is not a complete list of matters considered by the Committee but highlights the most significant matters for the period in the opinion of the Remuneration Committee.
Key Matters considered by the Committee from 1 January 2017 to the date of this report.
Item Comment
Directors Remuneration Report (“DRR”) and other disclosures in the Annual Report & Accounts.
The Committee considered the disclosures required in the Annual Report & Accounts for the first time as a company listed on the Main Market. The Committee received advice from the Company Secretary, HR Director and Deloitte LLP when compiling the DRR and the additional disclosures in the Notes.
Remuneration Policy (“Policy”) proposed at AGM
The Committee reviewed and approved for recommendation to the Board the Remuneration Policy, having consulted with major shareholders and received advice on the Policy from Deloitte, the HR Director and the Company Secretary. The Policy was proposed to shareholders at the AGM held on 3 May 2017 and was approved as set out on the Company website, www.securetrustbank.co.uk
Share Schemes presented at AGM.
In connection with the Policy, the Committee considered proposals regarding three share plans, being a Long Term Incentive Plan, a Deferred Bonus Plan and an HMRC approved eligible employee Save As You Earn (Sharesave) Plan. Further details on each plan and their operation can be found in the Policy on the Company website.
The plans were presented to shareholders at the 2017 AGM and approved. The above plans were then implemented in June and September 2017 as detailed later in this report.
Executive Directors bonus arrangements
The Remuneration Committee considered the bonus arrangements in relation to the Executive Directors for 2016 under the arrangements that applied before the adoption of the Remuneration Policy. These arrangements had operated on a discretionary basis but the Remuneration Committee took into account the financial performance of the Group and personal performance in a year of record profits, strong return on equity and operational and regulatory performance.
The Remuneration Committee considered the bonus arrangements in relation to the Executive Directors for 2017 in accordance with the Remuneration Policy and the targets set as part of a balanced business scorecard. In doing so the Remuneration Committee took into account the financial performance of the Group and personal performance. Details of the 2017 bonus earned by directors during the year can be found on pages 86 to 87.
Forward calendar and items for 2018
The Committee agreed a standing agenda and calendar of meetings for 2018. Four meetings are planned to be held in 2018 to address routine matters.
Annual review of terms of reference
The Committee reviewed its terms of reference and approved these for recommendation to the Board.
Proposed Grading Structure for 2018
The Committee reviewed the new grading structure within the Group. The structure is backed by a robust analytical job evaluation system, supported by industry based market benchmarking and is intended to provide greater clarity and transparency for staff, allowing individuals to map how their career could develop within the Group.
Gender Pay Gap Reporting (“GPG”)
The Committee reviewed the GPG between staff and discussed disclosure of the figures and the differences between Equal Pay and GPG.
Operation of the Remuneration Committeecontinued
Strategic Report Corporate Governance Report
Financial Statements
85www.securetrustbank.co.uk
The information contained in the Directors Remuneration Report is subject to audit, where indicated in the Report, in accordance with The Large and Medium-sized Companies and Groups (Accounts and Reports) Regulations 2008 (as amended).
On behalf of the Board, as Chairman of the Remuneration Committee, I am pleased to present our Directors’ Remuneration Report.
The Directors’ Remuneration Report contains the Annual Remuneration Report which explains the operation of remuneration related arrangements for 2017 and a summary of the intended operation of the Remuneration Policy in 2018. An extract of the Remuneration Policy for Executive and Non-Executive Directors and an illustration of the application of the Remuneration Policy in 2018 are included at the end of this Report for reference.
A full copy of the Remuneration Policy, which was approved by shareholders at the 2017 Annual General Meeting, can be found on the Company’s website at www.securetrustbank.co.uk.
How we link executive remuneration to our strategyThe key principles behind the Group’s Remuneration Policy are:
• to be simple and transparent in order to reflect the Group’s mission statement of straightforward, transparent banking,
• to promote the long term success of the Group, with transparent and demanding performance conditions,
• to provide alignment between executive reward and the Group’s values, risk appetite and shareholder returns, and
• to have a competitive mix of base salary and short and long term incentives, with an appropriate proportion of the package linked to the delivery of sustainable long term growth.
In developing and implementing the Remuneration Policy we have also had regard to regulatory requirements and the responsibilities of senior managers under the Senior Manager Regime.
The Group is currently a level 3 firm within the classifications applied by the regulators for regulated entities. That means that the Group is not required to satisfy in full all elements of the remuneration codes. Notwithstanding this, in formulating and applying the Remuneration Policy the Committee has had regard to the remuneration codes.
Remuneration report
Performance and variable pay outcomes for the year ended 31 December 2017For the financial year ended 31 December 2017 Executive Directors were eligible for an annual bonus award of up to 100% of salary, subject to stretching performance metrics based on a balanced business scorecard of financial, customer, operational and staff metrics. Up to 70% of the bonus was subject to financial performance metrics and 30% of the bonus was subject to a mixture of customer, operational and staff performance metrics.
The Board agreed the 2017 financial year budget at its meeting in November 2016, which included targets relating to the majority of the KPIs set out in the Strategic Report on page 19. The performance objectives set for the Executive Directors for the 2017 financial year reflected elements of those KPIs. Additional strategic targets were set, specifically relating to the non-financial performance metrics, for each of the Executive Directors. Performance against those objectives is set out on page 88.
With this in mind, and taking into account performance in the year against the annual bonus performance metrics, the CEO and CFO will receive 33% and 40% of their maximum opportunities respectively. Further details are set out on page 87.
There were no share based performance plans which vested in respect of the financial year ended 31 December 2017.
Executive remuneration arrangements for 2018Further detail on the intended operation of the Remuneration Policy in 2018 is set out on page 92.
In outline:
• It is proposed that the CEO will not receive a salary increase in 2018.
• It is proposed that the CFO’s salary will increase by 2.5% to £410,000 in line with broader staff salary increases across the Group.
• The maximum annual bonus opportunity for the year ending 31 December 2018 will be equal to 100% of salary. The bonus will be subject to stretching performance metrics based on a balanced business scorecard of financial, customer, operational and staff metrics. Up to an additional 100% of salary may be awarded under the annual bonus in exceptional circumstances (such as in order to recognise exceptional performance during the year).
• 50% of any bonus earned will be deferred into shares under the Deferred Bonus Plan. Deferred shares will vest in equal tranches after one, two and three years following deferral and will be subject to malus and clawback.
• Long term incentive arrangements up to 50% of salary are expected to be awarded in 2018, which is below the maximum limit of 100% of salary set out within our approved Directors’ Remuneration Policy.

Secure Trust Bank PLC Annual Report & Accounts 2017 Straightforward transparent banking
86
Single figure table (audited information)
Salary and fees Benefits Annual bonus2011 share
option scheme Pension Total remuneration
2017 £’000
2016 £’000
2017 £’000
2016 £’000
2017 £’000
2016 £’000
2017 £’000
2016 £’000
2017 £’000
2016 £’000
2017 £’000
2016 £’000
Executive DirectorsP Lynam 1,200 1,200 28 23 400 2,0005 0 2,2846 35 35 1,663 5,542N Kapur 400 325 35 22 160 4005 0 5716 25 25 620 1,343Non-Executive Directors M Forsyth1 200 95 1 1 – – – – – – 201 96H Angest1,2 60 55 – – – – – – – – 60 55A Berresford3 74 7 17 – – – – – – – 75 7P Marrow 126 102 – – – – – – – – 126 102A Salmon2 60 55 – – – – – 2,2846 – – 60 2,339V Stewart4 72 7 17 – – – – – – – 73 7
2,192 1,846 66 46 560 2,400 0 5,139 60 60 2,878 9,491
1 Lord Forsyth was appointed as Chairman of the Board on 19 October 2016 following the retirement of Sir Henry Angest as Chairman. Sir Henry Angest remains on the Board as a Non-Executive Director.
² Fees for the services of Sir Henry Angest and Andrew Salmon as Non-Executive Directors are paid to Arbuthnot Banking Group by whom they are employed. Prior to the step up to the Main Market total fees for both directors of £81,000 were paid in respect of these directors in 2016. Following the step up, fees of £5,000 per director per month were paid. These figures exclude VAT. The aggregate amount of fees for both directors in 2016 was £111,000 excluding VAT.
³ Ann Berresford was appointed to the Board on 22 November 2016 and became Audit Committee Chairman on 23 September 2017.4 Victoria Stewart was appointed to the Board on 22 November 2016 and became Remuneration Committee Chairman on 21 July 2017.5 Paul Lynam and Neeraj Kapur earned a bonus equal to £400,000 (2016: £500,000) and £160,000 (2016: £200,000) respectively in respect of performance for the financial
year ended 31 December 2017. In 2016 Paul Lynam and Neeraj Kapur also earned a one-off bonus equal to £1,500,000 and £200,000 respectively following the sale of ELG. Further information regarding the one-off bonuses is provided in the Directors’ Remuneration Report for 2016.
6 Further information regarding awards vesting under the 2011 share option scheme (a pre Main Market Admission long term incentive) is provided in the Directors’ Remuneration Report for 2016.
7 During 2017 Ann Berresford and Victoria Stewart became eligible to join and participated in the Company’s private medical insurance scheme.
The figures in the single figure table above are derived from the following:
Salary and fees The amount of salary / fees received in the year.
Benefits The taxable value of benefits received in the year. These are principally private medical health insurance, car allowances and the value of Sharesave Scheme options granted during the year. Sharesave Scheme options are valued based on the difference between the market value of the shares at grant and the exercise price and were granted for the first time in 2017.
Annual bonus The value of the bonus earned in respect of the financial year (including the proportion of the amount earned which is subject to deferral).
2011 share option scheme The intrinsic value (as at the date of vesting) of share options that vested during the financial year.
Pension The amount of payments in lieu of Company pension contributions received in the year.
Single figure table (audited information) The following table sets out total remuneration earned for each Director in respect of the year ended 31 December 2017 and the prior year.
Directors Remuneration Report for 2017

Strategic Report Corporate Governance Report
Financial Statements
87www.securetrustbank.co.uk
Additional disclosures in respect of the single figure table (audited information)
Base salary and feesBase salaries for the Executive Directors in respect of the year ended 31 December 2016 and 31 December 2017 are as follows:
2016 base salary
£000
2017 base salary
£000
P Lynam 1,200 1,200
N Kapur 325 400
The Committee considered it appropriate to increase Neeraj Kapur’s base salary for 2017 to £400,000 to reflect his contribution to the business, his experience in his current role and the position of his salary compared to peers.
Bonus arrangementsFor the financial year ended 31 December 2017 Executive Directors were eligible for an annual bonus award of up to 100% of salary, subject to stretching performance metrics based on a balanced business scorecard of financial, customer, operational and staff metrics. Up to 70% of the bonus was subject to financial performance metrics and 30% of the bonus was subject to a mixture of customer, operational and staff performance metrics. Details of the annual bonus outturn are shown below.
50% of the bonus earned is deferred into shares under the Deferred Bonus Plan. Deferred shares will vest in equal tranches after one, two and three years following deferral. The CFO’s objectives differ in weighting and target to those of the CEO and, whilst no less challenging, had a different outturn to that of the CEO.
Set out below are the high level financial and non-financial performance metrics applied in respect of the financial year ended 31 December 2017. The Directors’ Remuneration Policy was implemented following its approval at the Annual General Meeting in May 2017 and after the start of the performance period. The Committee considers 2017 to be a transitional year in which the Company made changes to practice and procedure resulting from the move from AIM to the Main Market and in the preparation and implementation of the new Directors Remuneration Policy. The Committee will make a more detailed disclosure of the Executive Directors’ performance metrics and target ranges for the financial year ending 31 December 2018, and future years, subject to any commercial sensitivity at the time of reporting. The Committee intends to disclose the performance metrics and targets for the financial year ending 31 December 2018, subject to commercial sensitivity considerations, in the 2018 Annual Report.
Bonus arrangementsFinancial
% of salary opportunity
Financial % of salary
outturn
Non-financial % of salary
opportunity
Non-financial % of salary
outturn
Total % of salary
outturn £000
Paul Lynam 70 12.3 30 21.1 33.4 £400
Neeraj Kapur 70 14.3 30 25.7 40.0 £160

Secure Trust Bank PLC Annual Report & Accounts 2017 Straightforward transparent banking
88
Directors Remuneration Report for 2017continued
Financial performance metrics
Objective Targets Achievement
Grow Underlying Profit Before Tax. Range of UPBT between 90% and 110% of an agreed UPBT target.
Actual UPBT was £27.7M and this objective was not achieved.
Sustain Return on Average Equity. Range of ROAE between 90% and 110% of an agreed ROAE target.
Actual ROAE 9.1% and this objective met the threshold.
Maintenance of Basel III regulatory capital as determined by the Board.
Range of capital required set at the minimum capital requirement through to a level, which included a capital buffer, as determined by the Board.
Basel III regulatory capital as assessed by the Board is above the agreed target as detailed on page 20.
Love Cost Income ratio as determined by the Board.
Range of Cost Income ratio between 90% and 110% of an agreed target.
Actual Cost Income Ratio was 55.1% and this objective was not achieved.
Non-financial performance metricsThe high level objectives and targets (together with commentary on their achievement) for both Executive Directors are set out below. Targets that remain commercially sensitive, or are ongoing, have not been disclosed. These targets will be disclosed in the Directors Remuneration Report for 2018 or at such time when the targets are no longer considered commercially sensitive or, where the target covers multiple years, the year of their completion.
Vesting of the non-financial performance element of the annual bonus was based on the Committee’s view of the relative importance and impact of each of the objectives during the year.
Financial performance metricsThe financial performance metrics were based on the delivery of Board agreed KPIs in accordance with the schedule below.
Targets that remain commercially sensitive, or are ongoing, have not been disclosed.
Non-financial performance metrics
Objective Targets Achievement
Grow Develop new systems, processes and technology to improve the operating model.
Measured by reference to the launch of the new deposit platform, the assessment of regulatory capital and liquidity and developing the treasury operations of the Group.
New deposit platform successfully established in 2017, treasury management function of the Group enhanced.
Delivery of strategic objectives throughout the year.
Measured by reference to the completion of projects during the 2017 financial year.
The majority of projects were delivered with other projects either being delayed into 2018 or carried forward.
Sustain Maintain strong compliance with risk appetite and legal and regulatory obligations across the Group.
Measured by reference to the Group’s risk appetite and risk control framework and assessed, in part, by the Risk Committee and by reference to staff completion of regulatory training.
The Group’s risk appetite was maintained within tolerance; mandatory training had been completed by relevant staff.
Love Placing the customer at the heart of what we do.
Measured by reference to the FEEFO and overall customer rating for STB; and the retention of customer service excellence award.
FEEFO scores for the period increased and STB retained its customer service award.
Being an employer of choice. Maintaining and improving on the employee engagement scores; achieving the Investors In People Gold rating.
The Group was awarded the Investors in People Gold rating in 2017, employee engagement scores remained above average for the sector in 2017.

Strategic Report Corporate Governance Report
Financial Statements
89www.securetrustbank.co.uk
Awards granted during the financial year (audited information)
2017 Long Term Incentive PlanFollowing shareholder approval of the Secure Trust Bank PLC 2017 Long Term Incentive Plan (LTIP) at the 2017 AGM, nominal-cost share options were granted to Executive Directors on 1 June 2017 in accordance with the rules of the LTIP in the table below.
Vesting of the share options is subject to EPS, Relative TSR and risk management performance metrics, assessed over a three year performance period.
The EPS and relative TSR performance targets are set out in the table below:
20% of the share options will be assessed on risk management performance objectives aligned with the Company’s risk management framework, including but not limited to the number of customer complaints received during the Performance Period; the number and nature of material risk events within the Group during the Performance Period; credit losses during the Performance Period compared to the Board’s assessment of the Group’s risk appetite; and management of regulatory capital limits during the Performance Period.
Director Date of grant Basis of awardNumber
of sharesFace value of award £0001 Performance period
Paul Lynam 1 June 2017 52% of salary 26,335 622.2 1 January 2017 to 31 December 2019Neeraj Kapur 1 June 2017 52% of salary 7,132 168.5 1 January 2017 to 31 December 2019
1 Based on a share price of 2,362.5p per share.
Vesting (% of maximum)
EPS growth(40% of award)
Relative TSR1
(40% of award)
0% Less than 10% per annum Below Median25% 10% per annum Median100% 30% per annum Upper quartileStraight-line vesting between points.
1 As at the grant date, the TSR comparator group consisted of the following constituents: Aldermore Group, Arbuthnot Banking Group, Close Brothers, OneSavings Bank, Metro Bank, Paragon Banking Group, Provident Financial, S&U, Shawbrook Group and Virgin Money.
Vesting will be determined based on the Committee’s view of the relative importance and impact of each of the objectives over the performance period.
Awards are subject to a two year holding period following the end of the performance period to the extent that the performance metrics are achieved and awards vest.

Secure Trust Bank PLC Annual Report & Accounts 2017 Straightforward transparent banking
90
Statement of Directors’ shareholding and share interests (audited information)No formal shareholding guidelines are currently in place. However, Paul Lynam has committed to building up and maintaining a shareholding of at least 100% of base salary, over time, by retaining all awards under the LTIP that vest (net of income tax and National Insurance).
The interests of the Directors and their connected persons in the Company’s ordinary shares as at 31 December 2017 were as set out below. There have been no changes to those interests between 31 December 2017 and the date of signing of these financial statements.
Payments made to former Directors during the year (audited information)No payments were made in the year to any former Director of the Company.
Payments for loss of office made during the year (audited information)No payments for loss of office were made in the year to any Director of the Company.
Performance graph and historical CEO remuneration outcomesThe graph on the following page shows the total shareholder return (“TSR”) performance for the Company’s shares in comparison to the FTSE SmallCap Index (excluding Investment Trusts) for the period from 1 January 2012 to 31 December 2017. For the purposes of the graph, TSR has been calculated as the percentage change during the period in the market price of the shares, assuming that dividends are reinvested. The graph shows the value, by 31 December 2017, of £100 invested in the Group over the period compared with £100 invested in the FTSE SmallCap Index (excluding Investment Trusts). The FTSE SmallCap Index (excluding Investment Trusts) has been chosen as a comparator as this is the most appropriate reference point given the capitalisation of the Company.
The table on the following page shows details of the total remuneration, bonus and share options vesting (as a percentage of the maximum opportunity) for the CEO over the last six financial years.
Directors Remuneration Report for 2017continued
Directors’ shareholding and share interests
Director Type Owned outrightVested but
unexercised
Vested and exercised
during the year
Unvested, not subject to
performance conditions
Unvested, subject to
performance conditions
Total as at 31 December
2017
P Lynam Shares 15,000 – – – – 15,000
2011 Share Options – 141,667 – – – 141,667
2017 LTIP – – – – 26,335 26,335
2017 SAYE – – – 1,364 – 1,364
Phantom share options1 – – – – 187,500 187,500
371,866
N Kapur Shares 1,000 – – – – 1,000
2011 Share Options – 35,417 – – – 35,417
2017 LTIP – – – – 7,132 7,132
2017 SAYE – – – 1,364 – 1,364
Phantom share options1 – – – – 31,250 31,250
76,163
M Forsyth Shares 2,000 – – – – 2,000
H Angest Shares – – – – – –
A Berresford Shares – – – – – –
P Marrow Shares 5,440 – – – – 5,440
A Salmon Shares 7,500 – – – – 7,500
V Stewart Shares – – – – – –
1 Each Phantom Share Option was granted on 23 March 2015 and entitles the holder on exercise to a cash payment equal to the difference between the market value of a share on the date of exercise and a notional exercise price of £25.00 per share. Each Phantom Share Option may be exercised on or after 3 November 2018 subject to the satisfaction of a performance condition that, over the period from 23 March 2015 to 3 November 2018, the dividends paid by the Company have increased in percentage terms when compared to the dividend of £12.3 million in respect of the financial year ended 31 December 2014 by at least the higher of the increase in RPI during that period and 5% per annum.

Strategic Report Corporate Governance Report
Financial Statements
91www.securetrustbank.co.uk
ꢀ00
ꢁ00
ꢂ00
200
100ꢃan 1ꢄꢃan 12 ꢃan 1ꢂ ꢃan 1ꢁ ꢃan 1ꢀ ꢃan 1ꢅ ꢃan 17
Total Shareholder Return (‘TSR’) vs FTSE SmallCap Index
Total remuneration and share optionsTotal
remuneration£’000’s
Bonus as a % of maximum
opportunity1
Share options as a % of maximum
opportunity2
2017 1,657 33.3 N/A2016 5,542 N/A 100%2015 1,459 N/A N/A2014 3,671 N/A 100%2013 1,031 N/A N/A2012 870 N/A N/A
1 Pre Main Market Admission bonuses have been determined by the Committee on a discretionary basis taking into account Group financial and individual performance during the financial year.
2 No share options vested in respect of the years 2012, 2013, 2015 and 2017.
CEO pay increase in relation to all employees
Percentage change CEO Wider workforce
Salary 0% 2.4%Taxable benefits 0% 0%Annual bonus (20)% 0%
Spend on pay
2017£million
2016£million
Change%
Dividends, excluding special dividends, and share buybacks 14 13.1 6.9Dividends, including special dividends, and share buybacks 14 43.1 (207.8)Overall expenditure on pay continuing operations1 39.0 35.5 9.9
1 Further information can be found in Note 5 set out on page 129.
CEO pay increase in relation to all employeesThe table below sets out the percentage change (from the financial year ending 31 December 2016) in base salary, value of taxable benefits and bonus for the CEO compared with the average percentage change for all employees.
Paul Lynam earned a bonus equal to £400,000 in respect of performance for the financial year ended 31 December 2017 (2016: £500,000).
Spend on payThe table at the foot of this page sets out the percentage change (from the financial year ending 31 December 2016) in dividends and the overall expenditure on pay (as a whole across the organisation).
Secure Trust
FTSE SmallCap (excluding Investment Trusts)

Secure Trust Bank PLC Annual Report & Accounts 2017 Straightforward transparent banking
92
Service agreements and letters of appointmentDetails of the Directors’ service agreements, letters of appointment and notice periods are set out below:
Implementation of Directors’ Remuneration Policy for the financial year ending 31 December 2018Details on how Secure Trust intends to implement the Directors’ Remuneration Policy for the financial year ending 31 December 2018 is set out below.
SalaryPaul Lynam will not receive a salary increase in 2018. Neeraj Kapur’s salary was increased by 2.5% to £410,000 with effect from 1 April 2018.
Directors Remuneration Report for 2017continued
Fees
Role2018 fee
£’000’s
Chairman1 200Non-Executive Director (basic fee) 65Senior Independent Director 20Chairman of Audit Committee 20Chairman of Risk Committee 20Chairman of Remuneration Committee 10Member of Audit Committee 5Member of Risk Committee 5Member of Remuneration Committee 5
1 The Chairman does not receive any additional fees for his membership of any of the Board’s committees.
Service agreements and letters of appointment
NameCommencement of current service agreement/letter of appointment2,3 Notice period
P Lynam 28 July 2010 12 monthsN Kapur 27 October 2011 12 monthsM Forsyth1 6 October 2016 6 monthsH Angest1 6 October 2016 6 monthsA Berresford 22 November 2016 6 monthsP Marrow1 6 October 2016 6 monthsA Salmon1 6 October 2016 6 monthsV Stewart 22 November 2016 6 months
1 Entered into new letters of appointment prior to the Company’s transition from the AIM to the Main Market.2 Each of the Non-Executive Directors’ letter of appointment was amended in January 2018 by a side letter confirming their respective Committee membership and their total
fee. No other changes were made to their existing letter of appointment. 3 All Non-Executive Directors are subject to re-election at intervals of not more than three years.4 Those directors retiring at the Annual General Meeting to be held on 16 May 2018 are listed on page 63.5 Those Non-Executive Directors who are members of the Committee are set out on page 83.
FeesThe table at the base of this page sets out the Non-Executive Director fee structure effective from 1 January 2018.
No fee increases are proposed for 2018.
Annual bonusThe proposed maximum annual bonus opportunity for the year ending 31 December 2018 will be equal to 100% of salary. The bonus will be subject to stretching performance metrics based on a balanced business scorecard. Up to 70% of the bonus will be subject to financial performance metrics and a maximum of 30% of the bonus will be subject to a mixture of customer, operational and staff performance metrics. The Committee considers that the targets are commercially sensitive. A description of the performance metrics and targets will be disclosed in the Annual Report on Remuneration for the year ending 31 December 2018 or at such time when the targets are no longer considered commercially sensitive.

Strategic Report Corporate Governance Report
Financial Statements
93www.securetrustbank.co.uk
The proposed EPS and Relative TSR performance targets
Vesting (% of maximum)
EPS growth(40% of award)
Relative TSR1
(40% of award)
0% Less than 10% per annum Below Median25% 10% per annum Median100% 30% per annum Upper quartileStraight-line vesting between points.
1 The Committee intends to use the following group of selected peers for assessing TSR performance: Arbuthnot Banking Group, Charter Court Financial Services Group plc, Close Brothers, OneSavings Bank, Metro Bank, Paragon Banking Group, Provident Financial, S&U and Virgin Money.
Statement of voting at AGM
Resolution Proxy votes for% of proxy votes cast
Proxy votes against
% of proxy votes cast
To receive and approve the directors’ remuneration report 10,785,526 76.99 3,223,375 23.01To approve the directors’ remuneration policy 13,454,036 96.04 554,865 3.96
Up to an additional 100% of salary may be awarded in exceptional circumstances (such as in order to recognise exceptional performance during the year). To the extent that any additional bonus is awarded, full details of the award and rationale will be disclosed in the Annual Report on Remuneration for the year ending 31 December 2018.
50% of any bonus earned will be deferred into shares under the Deferred Bonus Plan. Deferred shares will vest in equal tranches after one, two and three years following deferral.
LTIPThe Company proposes to grant LTIP awards to the Executive Directors in the form of nominal share options at the level of up to 50% of salary. The LTIP awards will be subject to EPS, Relative TSR and risk management performance metrics as in 2017. Performance will be assessed over a three year performance period.
The proposed EPS and Relative TSR performance targets are set out below.
20% of the award will be based on risk management performance objectives aligned with the Company’s risk management framework.
Remuneration Consultants and Committee advice Management received advice form McLagen, part of the Talent, Rewards & Performance practice at Aon plc, and from Deloitte LLP during the year. McLagen was appointed by the Group Head of HR. Deloitte was appointed by the Company Secretary. Deloitte is a member of the Remuneration Consultants’ Group, and as such chooses to operate pursuant
to a code of conduct that requires remuneration advice to be given objectively and independently. The Committee is satisfied that the advice provided by McLagen and Deloitte in relation to remuneration matters is objective and independent.
The advice received from Deloitte did not preclude Deloitte from participating in the audit tender held during 2017. Following the success of Deloitte in the audit tender, arrangements are in place to monitor compliance with the non-audit services policy of the Group and to ensure that the remuneration related advice received from Deloitte in respect of the 2017 Annual Report and Accounts does not adversely affect their independence as auditor.
Statement of voting at AGMThe Remuneration Policy and Remuneration Report were approved by shareholders at the AGM in 2017 and the votes cast were as detailed in the table at the base of this page.
ApprovalThis Report was approved by the Board on 21 March 2018 and signed on its behalf by:
Victoria Stewart Chairman of the Remuneration Committee

Secure Trust Bank PLC Annual Report & Accounts 2017 Straightforward transparent banking
94
Summary remuneration policy
The Directors’ Remuneration Policy was approved by shareholders at the 2017 AGM and took effect from the end of that meeting. A summary of the Directors’ Remuneration Policy is set out below. A full copy of the Directors’ Remuneration Policy can be found within the 2016 Report and Accounts, which are on the website at www.securetrustbank.co.uk, and that document should be used when evaluating Directors Remuneration.
Summary Directors’ Remuneration Policy table for Executive Directors
Operation Maximum opportunity
Base salary
Salaries are usually reviewed annually taking into account:
• underlying Group performance;
• role, experience and individual performance;
• competitive salary levels and market forces; and
• pay and conditions elsewhere in the Group.
No maximum salary; increases will normally be in line with the typical range of salary increases awarded (in percentage of salary terms) to other employees in the Group.
Salary increases above this level may be awarded to take account of individual circumstances.
Benefits
Executive Directors receive benefits in line with market practice, and these include a car allowance, medical insurance, life assurance and disability insurance.
Other benefits may be provided based on individual circumstances. These may include, for example, relocation and travel allowances.
Whilst the Committee has not set an absolute maximum on the level of benefits Executive Directors may receive, the value of benefits is set at a level which the Committee considers to be appropriately positioned taking into account relevant market levels based on the nature and location of the role and individual circumstances.
Pension
Executive Directors are eligible to participate in the Group defined contribution pension plan. In appropriate circumstances, such as where contributions exceed the annual or lifetime allowance, Executive Directors may be permitted to take a cash supplement in lieu of contributions to a pension plan.
Employer pension contributions are limited to 5% of base salary.
The maximum cash supplement in lieu of pension is 5% of base salary (less any employer pension contribution).

Strategic Report Corporate Governance Report
Financial Statements
95www.securetrustbank.co.uk
Operation Maximum opportunity
Annual bonus
Awards are based on performance (measured over a year) against metrics determined by the Committee.
Pay-out levels are determined by the Committee after the year end based on performance against those targets.
The Committee has discretion to amend the pay-out should any formulaic output not reflect the Committee’s assessment of overall business performance.
Executive Directors are required to defer 50% of any bonus earned into shares under the Deferred Bonus Plan (’DBP’). Deferred share awards vest in equal tranches after one, two and three years following deferral.
The Committee may decide to pay the whole of the bonus earned in cash where the amount to be deferred is less than £50,000. Clawback provisions will apply to annual bonus awards and malus and clawback provisions will apply to deferred share awards.
The normal maximum annual bonus opportunity is 100% of base salary.
An additional annual bonus opportunity of up to 100% of base salary may be awarded in exceptional circumstances.
Targets are set annually reflecting the Group’s strategy and aligned with key financial, strategic and/or individual targets.
The annual bonus will be assessed against key financial performance metrics of the business and non-financial strategic/personal objectives, in such proportions as the Committee considers appropriate.
Financial metrics At least 50% of the maximum potential will be paid for on-target performance and all of the maximum potential will be paid for maximum performance.
Non-financial strategic or individual metrics Vesting of the non-financial strategic or individual metrics will apply on a scale between 0% and 100% based on the Committee’s assessment of the extent to which a non-financial performance metric has been met.
Deferred share awards are not subject to any additional performance metrics.
Long Term Incentive Scheme (‘LTIP’)
Awards are in the form of nil-cost / nominal-cost share options, conditional shares or other such form as has the same economic effect. Awards will be granted with vesting dependent on the achievement of performance conditions set by the Committee, normally over at least a three year performance period.
Awards will usually be subject to a two year holding period following the end of the performance period (with the exception that sufficient awards may be sold to meet any income tax and National Insurance liabilities). The holding period does not apply to awards with a face value of £150,000 or less at the time of grant.
Awards may be settled in cash (or granted as a right to a cash amount) at the election of the Committee.
Malus and clawback provisions will apply to awards.
The normal maximum award is 100% of salary in respect of a financial year.
The Committee will take into account Company and personal performance during the preceding financial year when determining the maximum award to be granted.
Performance metrics are selected that reflect underlying business performance.
Performance metrics and their weighting where there is more than one metric are reviewed annually to maintain appropriateness and relevance.
Awards will vest between 25% and 100% for performance between ‘threshold’ performance (the minimum level of performance that results in any level of vesting) and ‘maximum’ performance.
All employee share schemes
Executive Directors are entitled to participate in a HMRC tax-qualifying all-employee Sharesave Scheme under the same terms as other Group employees.
Participant limits are those set by the UK tax authorities from time to time.
N/A
Performance metrics

Secure Trust Bank PLC Annual Report & Accounts 2017 Straightforward transparent banking
96
Application of malus and clawback
Element Malus Clawback
Annual bonus award To such time as payment is made. Up to three years following payment.
Deferred bonus award To such time as the award vests. Tranche of award deferred for one year: Up to two years following vesting.Tranche of award deferred for two years: Up to one year following vesting.Tranche of award deferred for three years: No clawback provisions apply.
LTIP award To such time as the award vests. Up to two years following vesting.
Non-Executive Directors
Element and purpose Approach of the Company
Chairman and Non-Executive Director fees
To enable the Group to recruit and retain Non-Executive Directors of a suitable calibre.
Fees are normally reviewed annually.
Fees paid to Non-Executive Directors for their services are approved by the Board. Fees may include a basic fee and, for Non-Executive Directors excluding the Chairman, additional fees for further responsibilities (for example, chairmanship and membership of Board committees or holding the office of Senior Independent Director). Fees are based on the level of fees paid to Non-Executive Directors serving on the board of similar-sized UK listed companies and the time commitment and contribution expected for the role.
Non-Executive Directors cannot participate in any of the Company’s share schemes or annual bonus and are not eligible to join the Company’s pension scheme.
Non-Executive Directors may be eligible to receive benefits such as private medical insurance, the use of secretarial support, travel costs or other support that may be appropriate.
Application of malus and clawbackMalus and clawback provisions will apply over the time periods set out in the table below.
Malus may apply in the following circumstances:
• The Executive Director’s service agreement is terminated for gross misconduct or the Executive Director receives a formal written warning for gross misconduct, as defined by the Company’s disciplinary policy.
• The Company suffers a material loss arising from the Executive Director operating outside of agreed risk policy parameters and as such the Committee considers a material failure in risk management has occurred.
• The level of the award is not considered sustainable when assessing the overall financial viability of the Company.
• The Executive Director is subject to regulatory censure in respect of a material failure in control.
Clawback may apply in the following circumstances:
• Discovery of a material misstatement resulting in an adjustment in the audited consolidated accounts of the Company.
• The assessment of any performance target or condition in respect of an award was based on material error or materially inaccurate or misleading information.
• The discovery that any information used to determine the DBP and/or LTIP was based on material error, or materially inaccurate or misleading information.
• Action or conduct of an Executive Director which, in the reasonable opinion of the Board, amounts to fraud or gross misconduct.
• The Executive Director is subject to regulatory censure in respect of a material failure in control.
Summary remuneration policycontinued

Strategic Report Corporate Governance Report
Financial Statements
97www.securetrustbank.co.uk
0
ꢀ00
1000
1ꢀ00
2000
2ꢀ00
ꢁ000
ꢁꢀ00
ꢂ000
ꢃꢄnꢄꢅuꢅ perꢆorꢅance
ꢇarꢈet perꢆorꢅance
ꢃaꢉꢄꢅuꢅ perꢆorꢅance
ꢀꢁꢂꢃꢄꢅꢆ
ꢀꢃꢂꢁꢄꢅꢆ
ꢀꢅꢂꢇꢄꢅꢆ
100ꢍ ꢀꢎꢍ ꢁꢂꢍ
27ꢍꢁꢁꢍ1ꢂꢍ
ꢁꢁꢍ
Paul Lynam
Neeraj Kapur
0
200
ꢀ00
ꢁ00
ꢂ00
1000
1200
1ꢀ00
ꢀꢁꢂꢃꢄ
ꢀꢅꢆꢇꢄ
ꢀꢈꢉꢊꢅꢃꢄ
100ꢉ ꢁ0ꢉ ꢊꢁꢉ
2ꢁꢉꢊ2ꢉ
1ꢀꢉ
ꢊ2ꢉ
ꢋꢅnꢅꢄuꢄ perꢌorꢄance
ꢃarꢍet perꢌorꢄance
ꢋaꢎꢅꢄuꢄ perꢌorꢄance
Base salary, benefits and pension
Annual Bonus LTIP
Scenario Description Assumptions
Minimum performance Minimum remuneration receivable. Fixed elements of remuneration only – salary as at 1 January 2018, benefits and pension.
No payments under incentive plans.
Target performance Remuneration receivable for achieving performance in line with expectations.
Fixed elements of remuneration (as above).
50% of maximum annual bonus earned.
25% of maximum LTIP award vesting.
Maximum performance Remuneration receivable for achieving performance in excess of the maximum performance targets.
Fixed elements of remuneration (as above).
100% of maximum annual bonus earned.
100% of maximum LTIP award vesting.
Illustrations of application of remuneration policyThe charts on this page set out for each Executive Director an illustration of the application for 2018 of the remuneration policy. The charts show the split of remuneration between fixed pay, annual bonus (including amounts deferred under the DBP) and LTIP on the basis of minimum remuneration, remuneration receivable for performance in line with the Company’s expectations and maximum remuneration (not allowing for any share price appreciation).
In illustrating the potential reward, the following assumptions have been made:

Secure Trust Bank PLC Annual Report & Accounts 2017 Straightforward transparent banking
98
Directors’ report
Report and financial statementsThe Strategic Report is set out beginning on page 2. This Directors’ Report also includes additional disclosures required by the UKLA’s Disclosure and Transparency Rules and Listing Rules. Some of the matters normally included in the Directors’ Report are included by reference as indicated below.
Principal activities and reviewThe principal activity of the Group is banking including deposit taking and secured and unsecured lending. The business review and information about future developments, key performance indicators and principal risks are contained in the Strategic Report.
Corporate governanceThe Corporate Governance report contains information about the Group’s corporate governance arrangements, including the Group’s compliance with the UK Corporate Governance Code (“Code”). A statement relating to the Group’s compliance with the Code throughout the year ending 31 December 2017 is set out on page 61.
ResultsThe results for the year are shown on page 110. The Group made a profit for the period of £23.8 million (2016: £137.5 million), being profit after tax from continuing operations of £19.9 million (2016: £14.2 million) and profit from discontinued operations of £3.9 million (2016: £123.3 million). The reconciliation of statutory results to underlying results is set out in the Financial Review in the Strategic Report.
For the purposes of DTR 4.15R2 and DTR 4.1.8 this Directors’ Report and the Strategic Report on pages 2 to 56 comprise the management report.
DividendsThe directors recommend the payment of a final dividend of 61 pence per share which, together with the interim dividend of 18 pence per share paid on 29 September 2017, represents total dividends for the year of 79 pence per share (2016: 75 pence per share). The final dividend, if approved by members at the Annual General Meeting, will be paid on 25 May 2018 to shareholders on the register at the close of business on 27 April 2018.
Dividend PolicyThe Directors reviewed the dividend policy of the Company and have adopted a progressive dividend policy which takes into account the Company’s capital requirements, earnings and cash flow in the long term.
The Directors will have regard to current and projected capital, liquidity, earnings and market expectations in determining the amount of the dividend. On occasion, the Company may declare and pay a special dividend resulting from special circumstances, however no such special dividend is currently envisaged.
The directors submit their report, the related Strategic Report and Corporate Governance Report and the audited financial statements of Secure Trust Bank PLC and its subsidiaries (the ‘Group’) for the year ended 31 December 2017.

Strategic Report Corporate Governance Report
Financial Statements
99www.securetrustbank.co.uk
Share capital The share capital of the Company comprises one class of ordinary shares with a nominal value of 40p each. As at 31 December 2017 the Company had 18,475,229 ordinary shares in issue. Each ordinary share entitles the holder to one vote.
All the ordinary shares are fully paid and rank equally in all respects and there are no special rights to dividends or in relation to control of the Company. No shares were issued during 2017 (2016: 283,335 shares issued).
Details of the Company’s share capital and movements in the Company’s issued share capital during the year are provided in Note 25 of the consolidated financial statements.
The Company operates a Long Term Incentive Plan, Sharesave Plan and a Deferred Bonus Share Plan as set out in the Remuneration Report on pages 85 to 93. Upon exercise, shares awarded under these plans have the same rights and rank pari passu with existing ordinary shares.
The powers of the Directors, including in relation to the issue or buyback of the Company’s shares are set out in the Companies Act 2006 and the Company’s Articles of Association. Shareholders will be asked to grant authority to the Directors to issue and allot shares at the 2018 Annual General Meeting.
Under section 551 of the Companies Act 2006, the Directors may allot equity securities only with the express authorisation of shareholders which may be given in General Meeting, but which cannot last more than five years. Under section 561 of the Companies Act 2006, the Board may also not allot shares for cash (otherwise than pursuant to an employee share scheme) without first making an offer to existing shareholders to allot such shares to them on the same or more favourable terms in proportion to their respective shareholdings, unless this requirement is waived by special resolution of the shareholders.
Resolutions permitting such actions will be proposed at the 2018 Annual General Meeting. Details of the resolutions for such authority are included in the Notice of the 2018 Annual General Meeting and in the related explanatory notes.
Under section 701 of the Companies Act 2006 a company may make a market purchase of its own shares if the purchase has first been authorised by a resolution of the company.
The Company did not repurchase any of the issued ordinary shares during the year or up to the date of this report, although it was granted authority to do so by shareholders at the 2017 Annual General Meeting on 3 May 2017. That authority expires on 31 May 2018 or, if earlier, the conclusion of the 2018 Annual General Meeting.
At the 2018 Annual General Meeting a special resolution will be proposed authorising the Company to make market purchases of ordinary shares within the limits set out in the resolution. The resolution is in a similar form to that proposed at the 2017 Annual General Meeting. The Directors have no present intention of exercising the authority granted by the resolution, but regard it as a useful tool to have available.
On a show of hands, each member has the right to one vote at General Meetings of the Company. On a poll, each member is entitled to one vote for every share held. The shares carry no rights to fixed income. No person has any special rights of control over the Company’s share capital and all issued shares are fully paid.
There are no specific restrictions on the transfer of the shares in the Company which are governed by the general provisions of the Articles of Association and prevailing legislation.
Substantial shareholdersIn accordance with Disclosure and Transparency Rules DTR5, the Company as at 19 March 2018 (being the latest practicable date before publication of this report), has been notified of the following disclosable interests in its issued ordinary shares:
Significant shareholdersNo.of
Ordinary Shares %
Invesco Perpetual Asset Management 3,584,131 19.40%Arbuthnot Banking Group PLC 3,444,538 18.64%Columbia Threadneedle Investments 2,591,862 14.03%Wellington Management Company 1,552,549 8.40%Mr Steven A Cohen 1,510,412 8.18%Ruffer 1,332,247 7.21%Unicorn Asset Management 1,175,662 6.36%BAE Systems Pension Fund Investment Management 792,027 4.29%

Secure Trust Bank PLC Annual Report & Accounts 2017 Straightforward transparent banking
100
Relationship with major shareholderOn the AIM IPO in 2011 the Company entered into a Relationship Agreement with its majority shareholder, Arbuthnot Banking Group PLC. Following the sell down by Arbuthnot Banking Group in 2016 the Relationship Agreement terminated. Nevertheless, the Company has an understanding with Arbuthnot Banking Group that for so long as Arbuthnot Banking Group holds 10% or more of the issued share capital of the Company, Arbuthnot Banking Group would expect two directors of the Company to be nominees of Arbuthnot Banking Group.
Directors A full list of Directors, including their biographical information is shown on pages 59 to 60. All the Directors served on the Board throughout the financial year and up to the date of signing these financial statements. Those Directors retiring and standing for re-election at the Annual General Meeting to be held on 16 May 2018 are listed on page 63.
Directors’ interestsThe Directors’ interests (and those of any persons connected with them) in the share capital of the Company as at 31 December 2017 are set out on page 90 in the Directors Remuneration Report.
Powers of DirectorsThe Directors’ powers are conferred on them by UK legislation and by the Company’s Articles of Association. Changes to the Company’s Articles of Association must be approved by shareholders by way of a special resolution and must comply with the provisions of the Companies Act 2006 and the Financial Conduct Authority’s Disclosure and Transparency Rules.
Appointment and retirement of DirectorsThe appointment and retirement of the Directors is governed by the Company’s Articles of Association, the UK Corporate Governance Code and the Companies Act 2006. Further details can be found on page 63 and in the explanatory notes included in the Notice of 2018 Annual General Meeting.
Directors’ indemnitiesThe Company’s Articles of Association provide that, subject to the provisions of the Companies Act 2006, the Company may indemnify any director or former director of the Company or any associated company against any liability and may purchase and maintain for any director or former director of the Company or any associated company insurance against any liability.
The Group has maintained directors and officers liability insurance throughout 2017.
The letters of appointment of the Non-Executive Directors incorporate by reference the provisions of the Articles of Association in relation to the indemnity of Directors into the contract established by the letter of appointment between the Non-Executive Director and the Company.
Disclosure of information under Listing Rule 9.8.4RAdditional information, where not already contained in the Directors’ Report, where applicable to the Company can be found in the sections of the Annual Report as set out in the table at the base of this page.
Significant contractsDetails of related party transactions are set out in Note 35 to the financial statements. There are no contracts of significance in which a Director is interested.
There are no agreements between any Group company and any of its employees or any Director of any Group company which provide for compensation to be paid to an employee or a Director for termination of employment or for loss of office as a consequence of a takeover of the Company.
There are no significant agreements to which the Company is party that take effect, alter or terminate upon a change of control following a takeover bid for the Company.
Employment policies and equal opportunitiesThe Group is an inclusive and equal opportunities employer and opposes all forms of discrimination. Applications from people with disabilities will be considered fairly and if existing employees become disabled, every effort is made to retain them within the workforce wherever reasonable and practicable. The Group also endeavours to provide equal opportunities in the training, promotion and general career development of disabled employees.
Group policies seek to create a workplace that has an open atmosphere of trust, honesty and respect. Harassment or discrimination of any kind is not tolerated. This principle applies to all aspects of employment from recruitment and promotion, through to termination and all other terms and conditions of employment.
Disclosure of information under Listing Rule 9.8.4R
Item Page reference
Details of any long term incentive schemes page 89
Allotments of cash of equity securities otherwise than to shareholders in proportion to their holdings Note 26 and page 90
Directors’ reportcontinued

Strategic Report Corporate Governance Report
Financial Statements
101www.securetrustbank.co.uk
The Group has processes in place for communicating with its employees. Employee communications include information about the performance of the Group, on major matters affecting their work, employment or workplace and to encourage employees to get involved in social or community events. These communications aim to achieve a common awareness for all employees of the financial and economic factors affecting the performance of the Group. Further information on the ways in which the Group communicates with its employees are set out in the Corporate Responsibility Report starting on page 53.
Research and developmentThe Group does not undertake research and development activities.
Political donations and expenditureThe Group made no political donations and incurred no political expenditure during the year (2016: £nil).
Post balance sheet eventsThere have been no significant events between 31 December 2017 and the date of approval of the financial statements which would require a change to or additional disclosure in the financial statements.
Disclosure of information to auditorEach Director in office at the date of this Directors’ Report confirms that so far as the Director is aware, there is no relevant audit information of which the Company’s auditor is unaware and each Director has taken all the steps that they ought to have taken as a Director to make themselves aware of any relevant audit information and to establish that the Company’s auditor is aware of that information.
This confirmation is given and should be interpreted in accordance with the provisions of the Companies Act 2006.
Going concernThe financial statements have been prepared on a going concern basis. Further information about this is to be found on page 52.
Fair, balanced and understandableThe Directors are satisfied that the Annual Report and Accounts, taken as a whole, are fair, balanced and understandable, and provide the information necessary for members and other stakeholders to assess the Group’s position and performance, strategy and business model.
Future developments and financial risk management objectives and policiesInformation about future developments, internal control and financial risk management systems in relation to financial reporting and financial risk management objectives and policies in relation to the use of financial instruments can be found in the following sections of the annual report which are incorporated into this report by reference:
Future developments – see Strategic Report on pages 2 to 56.
Internal control and financial risk management systems in relation to financial reporting – see Corporate Governance Report on pages 57 to 109.
Financial risk management objectives and policies in relation to the use of financial instruments – see Risk Management Report on pages 42 to 51 and Note 28 to the financial statements.
Greenhouse Gas emissions from our operationsThe Group’s Greenhouse Gas emissions, required under the Companies Act 2006 (Strategic Report and Directors’ Report) Regulation 2013, are detailed on page 53.
AuditorKPMG LLP was reappointed as auditor at the Annual General Meeting held in 2017. As detailed on page 77 in the Audit Committee Report, following a thorough and competitive tender process the Board is recommending the appointment of Deloitte LLP as auditor at the 2018 Annual General Meeting.
Annual General MeetingThe 2018 Annual General Meeting will be held at 3pm on 16 May 2018 at Arbuthnot House, 7 Wilson Street, London, EC2M 2SN.
By order of the Board
A J Karter Secretary
21 March 2018

Secure Trust Bank PLC Annual Report & Accounts 2017 Straightforward transparent banking
102
Directors’ responsibility statement
The directors are responsible for preparing the Annual Report and the Group and parent company financial statements in accordance with applicable law and regulations.
Company law requires the directors to prepare group and parent company financial statements for each financial year. As required by the Listing Rules they are required to prepare the group financial statements in accordance with IFRS as adopted by the EU and applicable law and have elected to prepare the parent company financial statements on the same basis.
Under company law the directors must not approve the financial statements unless they are satisfied that they give a true and fair view of the state of affairs of the Group and parent Company and of their profit or loss for that period. In preparing each of the Group and parent Company financial statements, the directors are required to:
• select suitable accounting policies and then apply them consistently;
• make judgements and estimates that are reasonable and prudent;
• state whether they have been prepared in accordance with IFRS as adopted by the EU; and
• assess the Group and parent Company’s ability to continue as a going concern, disclosing, as applicable, matters related to going concern; and
• use the going concern basis of accounting unless they either intend to liquidate the Group or the parent Company or to cease operations, or have no realistic alternative but to do so.
The directors are responsible for keeping adequate accounting records that are sufficient to show and explain the parent Company’s transactions and disclose with reasonable accuracy at any time the financial position of the parent Company and enable them to ensure that its financial statements comply with the Companies Act 2006. They are responsible for such internal control as they determine is necessary to enable the preparation of financial statements that are free from material misstatement, whether due to fraud or error, and have general responsibility for taking such steps as are reasonably open to them to safeguard the assets of the Group and to prevent and detect fraud and other irregularities.
Under applicable law and regulations, the directors are also responsible for preparing a Strategic Report, Directors’ Report, Directors’ Remuneration Report and Corporate Governance Statement that complies with that law and those regulations.
The directors are responsible for the maintenance and integrity of the corporate and financial information included on the Company’s website. Legislation in the UK governing the preparation and dissemination of financial statements may differ from legislation in other jurisdictions.
We confirm that to the best of our knowledge:
• The financial statements, prepared in accordance with IFRS as adopted by the European Union, give a true and fair view of the assets, liabilities, financial position and profit or loss of the Company and the undertakings included in the consolidation taken as a whole;
• The strategic report includes a fair review of the development and performance of the business and the position of the Company and the undertakings included in the consolidation taken as a whole, together with a description of the principal risks and uncertainties that they face; and
• The Annual Report and financial statements, taken as a whole, are fair, balanced and understandable and provide the information necessary for shareholders to assess the Company’s performance, business model and strategy.
This responsibility statement was approved by the Board of directors on 21 March 2018 and is signed on their behalf by:
Paul Lynam Chief Executive Officer
Neeraj Kapur Chief Financial Officer

Strategic Report Corporate Governance Report
Financial Statements
103www.securetrustbank.co.uk
Independent Auditor’s reportto the members of Secure Trust Bank PLC
1. Our opinion is unmodifiedWe have audited the financial statements of Secure Trust Bank (“the Company”) for the year ended 31 December 2017 which comprise the Consolidated statement of comprehensive income, the Consolidated and Company statement of financial position, the Consolidated and Company statement of changes in equity, the Consolidated and Company statement of cash flows, and the related notes, including the accounting policies in Note 1.
In our opinion:
• the financial statements give a true and fair view of the state of the Group’s and of the parent Company’s affairs as at 31 December 2017 and of the Group’s profit for the year then ended;
• the Group financial statements have been properly prepared in accordance with International Financial Reporting Standards as adopted by the European Union (IFRSs as adopted by the EU);
• the parent Company financial statements have been properly prepared in accordance with IFRSs as adopted by the EU and as applied in accordance with the provisions of the Companies Act 2006; and
• the financial statements have been prepared in accordance with the requirements of the Companies Act 2006 and, as regards the Group financial statements, Article 4 of the IAS Regulation.
Overview
Materiality: Group financial statements as a whole
£1.2m (2016:£1.1m)4% (2016: 4%) of Group profit before tax
Coverage 100% (2016:100%) of Group profit before tax
Risks of material misstatement vs 2016
Recurring risksImpairment of loans and receivables
Revenue Recognition
Basis for opinionWe conducted our audit in accordance with International Standards on Auditing (UK) (“ISAs (UK)”) and applicable law. Our responsibilities are described below. We believe that the audit evidence we have obtained is a sufficient and appropriate basis for our opinion. Our audit opinion is consistent with our report to the audit committee.
We were appointed as auditor by the directors on 24 September 2009. The period of total uninterrupted engagement is for the nine financial years ended 31 December 2017. We have fulfilled our ethical responsibilities under, and we remain independent of the Group in accordance with, UK ethical requirements including the FRC Ethical Standard as applied to listed public interest entities. No non-audit services prohibited by that standard were provided.
2. Key audit matters: our assessment of risks of material misstatementKey audit matters are those matters that, in our professional judgment, were of most significance in the audit of the financial statements and include the most significant assessed risks of material misstatement (whether or not due to fraud) identified by us, including those which had the greatest effect on: the overall audit strategy; the allocation of resources in the audit; and directing the efforts of the engagement team. We summarise below the key audit matters (unchanged from 2016), in decreasing order of audit significance (and relating to both the Group and parent Company), in arriving at our audit opinion above, together with our key audit procedures to address those matters and, as required for public interest entities, our results from those procedures. These matters were addressed, and our results are based on procedures undertaken, in the context of, and solely for the purpose of, our audit of the financial statements as a whole, and in forming our opinion thereon, and consequently are incidental to that opinion, and we do not provide a separate opinion on these matters.

Secure Trust Bank PLC Annual Report & Accounts 2017 Straightforward transparent banking
104
Independent Auditor’s reportcontinued
2. Key audit matters: our assessment of risks of material misstatement (continued)
1 Impairment of loans and receivables
1a - Collective and individual impairment provision on Consumer FinanceGroup and Bank impairment provision: £33.8 million (2016: £22.7 million).
Group and Bank impairment charge: £33.9 million (2016: £24.1 million).
Refer to page 73 (Audit Committee Report), page 117 (accounting policy) and page 124 (financial disclosures).
The risk
Subjective estimatesDuring the year the Group saw an increase in arrears and a decrease in recoveries on the Consumer Finance portfolio which impacts the impairment provision. The Group calculates an impairment provision against its Consumer Finance portfolio using models that are based on historical experience and management judgement.
An individual impairment provision is determined by stratifying loans by arrears category and applying assumptions to determine a loss given default (“LGD”) and propensity to default (“PD”). Collective provisions are then calculated for the performing book to capture incurred but not reported losses.
The Group calculates the probability of default based on historical loss experience over an assumed outcome period. The use of historical data has inherent limitations as it does not fully capture all factors that impact incurred losses as at the reporting date. Such factors can include changes in credit quality, the lengthening of the period taken to reach default or macroeconomic conditions which may have an adverse impact on loan losses. There is a risk that the Group does not adequately provide for these inherent limitations within its impairment model.
The Group applies judgement to estimate the amount of recoveries made on loans that are in default. As such, there is a risk that the Group’s estimate does not accurately predict actual future recoveries across the whole portfolio in particular over repossessed vehicles.
In the calculation of the collective provision, the Group applies judgement to estimate the emergence period (the period of time from an impairment trigger event such as loss of employment to the loans being identified as impaired). There is a risk that the Group’s estimate of the emergence period may not accurately reflect the period of time between an impairment trigger and the observable incurred loss event.
The most significant assumption for loan loss impairment provision is in relation to loss given default.
Our response
Our procedures included:
• Control testing: We tested controls over the acceptance, monitoring and reporting of credit risk;
• Our Sector Experience: We assessed the adequacy of the assumptions made in respect of the emergence period with reference to available benchmarking data for similar asset classes at peer group organisations;
• Historical Comparisons: We assessed the appropriateness of the Group’s key assumptions for probabilities of default and recoveries with reference to actual historical experience. We assessed the adequacy of the Group’s assumptions for loss given default based upon the historical recoveries achieved and the composition of the accounts that remain within the portfolio at the reporting date;
• Expectation vs outcome: We applied alternative statistics based provisioning methodologies, based on actual arrears experience, to create an expectation of the impairment provisions. We compared our result to the Group’s impairment provision and assessed whether the assumptions applied by the directors for emergence period and the length of the period taken to reach default were appropriate;
• Tests of details: We applied sampling techniques to test the levels of recoveries achieved on motor accounts and compared to the directors’ own analysis; and
• Assessing transparency: We assessed the adequacy of the Group’s disclosures in respect of the degree of estimation involved in arriving at the balance.
Our results:• We found the resulting estimate of the consumer loan
impairment provision to be acceptable (2016: acceptable).
Accounting applicationThe Group applies judgement in developing the methodology applied to calculate impairment provisions. As this is inherently subjective, there is a risk that the methodology applied is not in line with the relevant accounting standards and industry practice.
Our procedures included:
• Methodology implementation: We tested the key assumptions and logic applied within the impairment models with reference to our interpretation of the relevant accounting standards and our wider industry experience.
Our results• The results of our procedures were satisfactory
(2016: satisfactory).
Strategic Report Corporate Governance Report
Financial Statements
105www.securetrustbank.co.uk
1 Impairment of loans and receivables (Continued)
The risk
Data capture and calculation errorThe impairment models used by the Group are Excel based and models are populated by extraction of large data sets. As a result, there is an inherent risk that the data included in the impairment models is not complete or accurate and that the formulae applied in order to calculate the impairment provision are not accurate.
Our response
Our procedures included:
• Control observations: We tested controls over the lending processes that capture certain static data used in the impairment model (e.g. initial collateral valuation, loan amounts and product interest rates) by observing the operation of these controls over these processes;
• Data comparison: We checked both a sample of internal data and the data totals used in the model back to the Bank’s underlying source (e.g. current balance on the loan systems); and
• Re-performance: We re-performed the provision calculations to test the mathematical accuracy of the impairment models.
Our results• The results of our procedures were satisfactory
(2016: satisfactory).
1b - Individual impairment provision on Real Estate FinanceGroup and Bank impairment provision: £nil (2016: £nil).
Refer to page 73 (Audit Committee Report), page 117 (accounting policy) and page 125 (financial disclosures).
The risk
Omitted exposureThe Group assesses each Real Estate Finance loan for indications of impairment in accordance with the relevant accounting standards.
The Real Estate Finance loan book requires the Group to make significant judgements over the ability of counterparties to make future loan repayments.
Whilst consideration is given to historical collections performance, there is a risk that not all loans that require an individual impairment provision will be identified.
As a result, the Group employs in-life monitoring procedures to identify possible indicators of impairment.
Our response
Our procedures included:
• Control design: We tested controls over the acceptance, monitoring and reporting of credit risk. This included the key controls over the completeness of individual provisioning watchlists. We also assessed the effectiveness of the governance and monitoring process in place for the appropriate identification of higher risk loans and the accuracy of risk grades allocated to counterparties; and
• Test of detail: We assessed the Group’s identification of impairment triggers by inspecting a sample of loan files. This included an inspection of performing accounts to assess if there was any evidence of impairment; and an inspection of accounts where an impairment trigger had been met.
Our results• The results of our procedures were satisfactory
(2016: satisfactory).
Subjective estimatesThe individual impairment on Real Estate Finance loans is dependent on the quantum of future cash flows. The estimate of this quantum is mostly sensitive to the valuation of the collateral that may be sold to recover the loan balance in the event of default and interest rates. Given the specialised nature of collateral assets, this can be difficult to establish.
Our procedures included:
• Control observations: We tested controls over the lending processes that capture certain static data used in the impairment model (e.g. initial collateral valuation, loan amounts and product interest rates) by observing the operation of these controls over these processes; and
• Comparing valuations: We used our independent Real Estate Property Specialists to assess the value of realisable collateral with reference to certain valuation reports.
Our results• We found the resulting estimate of the Real Estate Finance
impairment provision to be acceptable (2016: acceptable).

Secure Trust Bank PLC Annual Report & Accounts 2017 Straightforward transparent banking
106
2 Income Recognition on an EIR basis
Consolidated interest receivable and similar income £149.3 million (2016: £141.1 million). Company interest receivable and similar income £124.8 million; 2016: £122.0 million.
Refer to page 73 (Audit Committee Report), page 117 (accounting policy) and page 126 (financial disclosures).
The riskSubjective estimatesThe Group uses bespoke models, which were refined during the period, and increase the complexity of estimating interest income.The models are in both Excel and specialised software, and enable interest and fees earned and incurred on loans to be recognised using the effective interest rate (‘EIR’) method which spreads directly attributable expected cash flows over the behavioural life of a loan.The behavioural life of a loan is the expected length of time and profile customers follow to repay their loan balances. This determines the quantum and timing of income recognition in respect of a loan. The Group has a number of expected life assumptions due to the variety of products that it offers.The Group applies judgement in estimating the behavioural life with reference to both historical experience and the Group’s expertise and experience in the sector. As the Group applies judgement to forecast behavioural lives there is a risk that the profile used to recognise income is not reflective of recent performance. In addition, as the forecast profiles extend into the future there is a high level of estimation uncertainty.
Our responseOur procedures included: • Our sector experience: We assessed appropriateness of
the key assumptions behind the expected behavioural life of the loan;
• Historical comparison: We assessed the reasonableness of the models’ expected behavioural life against historical experience of loan life;
• Our sector experience: We compared the profile of future cash flows to our own expectations based on our knowledge of the Group and experience of the industry in which it operates; and
• Assessing transparency: We assessed the adequacy of the Group’s disclosures in respect of the degree of estimation involved in EIR accounting.
Our results• We found the resulting estimate of the income recognised
to be acceptable (2016: acceptable).
Accounting applicationThe Group applies judgement in deciding which cash flows, such as interest, fees and origination costs, are spread on an EIR basis and which are recognised upfront. There is a risk that cash flows that should be spread on an EIR basis are recognised upfront or vice versa; and that the methodology for spreading cash flows on an EIR basis is not in-line with the relevant accounting standards and industry practice.
Our procedures included:• Methodology implementation: We tested the methodology
across the models for all material portfolios, with reference to relevant accounting standards and our wider industry experience; and
• Testing application: We inspected product literature to assess whether the interest rate features, fees, subsidies and origination costs were appropriately incorporated into the Group’s income recognition models. As part of this assessment we made reference to our interpretation of the requirements of the relevant accounting standards and our wider industry experience.
Our results:• The results of our testing were satisfactory (2016: satisfactory).
Data capture and calculation errorThe models used by the Group are populated by extraction of large data sets from a number of loan systems. As a result, there is an inherent risk that the data included in the income recognition models is not complete or accurate and that the formulae applied in order to calculate the income amounts are not accurate.
Our procedures included:• Control observation: We tested controls over the lending
processes that capture certain static data used in the EIR model (such as loan balance and interest rate) by observing the operation of the controls over these processes. We also tested General IT controls over the loan systems;
• Data comparison: We checked that the models contained a complete and accurate set of data inputs by agreeing a sample of specified model inputs to source loan documentation; and
• Re-performance: We re-performed EIR calculations, including the calculation of behavioural lives, in order to test the mathematical accuracy of the income recognition models.
Our results• The results of our testing were satisfactory (2016: satisfactory).
2. Key audit matters: our assessment of risks of material misstatement (continued)
Independent Auditor’s reportcontinued

Strategic Report Corporate Governance Report
Financial Statements
107www.securetrustbank.co.uk
ꢀrꢁuꢂ ꢂrꢁꢃꢄt ꢅeꢃꢁre taꢆꢀꢁ0ꢂꢃꢄ ꢅ201ꢆꢇ ꢀ27ꢂꢃꢄꢈ
ꢀrꢁuꢂ ꢇaterꢄaꢈꢄtꢉꢀ1ꢂ2ꢄ ꢅ201ꢆꢇ ꢀ1ꢂ1ꢄ)
ꢀ1.2ꢁꢉꢊole ꢋꢌnancꢌal stateꢄents ꢄaterꢌalꢌtꢍ ꢅ201ꢆꢇ ꢀ1ꢂ1ꢄꢈ
ꢀꢂ.ꢂ6ꢁꢎꢌsstateꢄents reporteꢏ to tꢊe auꢏꢌt coꢄꢄꢌttee ꢅ201ꢆꢇ ꢀ0ꢂ0ꢆꢄꢈ
Group profit before tax Group materiality
3. Our application of materiality and an overview of the scope of our auditMateriality for the group financial statements as a whole was set at £1.2m (2016: £1.1m), determined with reference to a benchmark of group profit before tax of which it represents 4% (2016: 4%).
Materiality for the parent company financial statements as a whole was set at £1.2m (2016: £1.1m), determined with reference to a benchmark of profit before tax of which it represents 3.9% (2016: 3.4%).
We agreed to report to the Audit Committee any corrected or uncorrected identified misstatements exceeding £0.06m, in addition to other identified misstatements that warranted reporting on qualitative grounds.
Scope –GroupThe Group team performed the audit of the Group as if it was a single aggregated set of financial information and our audit was mainly performed at the Principal Office in Solihull. The Group team visited 4 (2016: 4) further satellite locations to further assess the audit risk and strategy. The audit was performed using the materiality level set out above. The audit was performed using the materiality level set out above and covered 100% of total Group revenue, Group profit before tax, and total Group assets.
Scope –disclosure of IFRS 9 effectThe Bank is adopting IFRS 9 Financial Instruments from 1 January 2018 and have included an estimate of the financial impact of the change in accounting standard in accordance with IAS 8 Changes in Accounting Estimates and Errors as set out in Note 29. While further testing of the financial impact will be performed as part of our 2018 year end audit, we have performed sufficient audit procedures for the purposes of assessing the disclosures made in accordance with IAS 8. We spent considerable time assessing the key areas of judgement inherent in the IFRS 9 transition which supports our assessment of the appropriateness of the disclosure but also supports our 2018 year end audit. Specifically we have:
• obtained an understanding of and evaluated management’s process for the calculation of the IFRS 9 transition. We considered key management judgement papers generated during the transitional process as part of our assessment of the effectiveness of the implementation;
• considered key Classification and Measurement decisions, including Business Model Assessments and Solely Payment of Principal and Interest (SPPI) outcomes;
• considered the reasonableness and appropriateness of key assumptions and judgements in respect of the data inputs to the model (leveraging, where appropriate, from our IAS 39 work) as well as assessing the operation of the model;
• compared the key assumptions and judgements with those of comparable lenders;
• assessed the adequacy of the Bank’s transitional disclosure.
4. We have nothing to report on going concernWe are required to report to you if:
• we have anything material to add or draw attention to in relation to the directors’ statement in Note 1 to the financial statements on the use of the going concern basis of accounting with no material uncertainties that may cast significant doubt over the Group and Company’s use of that basis for a period of at least twelve months from the date of approval of the financial statements; or
• the related statement under the Listing Rules set out on page 102 is materially inconsistent with our audit knowledge.
We have nothing to report in these respects.

Secure Trust Bank PLC Annual Report & Accounts 2017 Straightforward transparent banking
108
Independent Auditor’s reportcontinued
5. We have nothing to report on the other information in the Annual ReportThe directors are responsible for the other information presented in the Annual Report together with the financial statements. Our opinion on the financial statements does not cover the other information and, accordingly, we do not express an audit opinion or, except as explicitly stated below, any form of assurance conclusion thereon.
Our responsibility is to read the other information and, in doing so, consider whether, based on our financial statements audit work, the information therein is materially misstated or inconsistent with the financial statements or our audit knowledge. Based solely on that work we have not identified material misstatements in the other information.
Strategic report and directors’ reportBased solely on our work on the other information:
• we have not identified material misstatements in the strategic report and the directors’ report;
• in our opinion the information given in those reports for the financial year is consistent with the financial statements; and
• in our opinion those reports have been prepared in accordance with the Companies Act 2006.
Directors’ remuneration reportIn our opinion the part of the Directors’ Remuneration Report to be audited has been properly prepared in accordance with the Companies Act 2006.
Disclosures of principal risks and longer-term viabilityBased on the knowledge we acquired during our financial statements audit, we have nothing material to add or draw attention to in relation to:
• the directors’ confirmation within the going concern and business viability statement on page 52 that they have carried out a robust assessment of the principal risks facing the Group, including those that would threaten its business model, future performance, solvency and liquidity;
• the Principal Risks and Uncertainties disclosures describing these risks and explaining how they are being managed and mitigated; and
• the directors’ explanation in the going concern and business viability statement of how they have assessed the prospects of the Group, over what period they have done so and why they considered that period to be appropriate, and their statement as to whether they have a reasonable expectation that the Group will be able to continue in operation and meet its liabilities as they fall due over the period of their assessment, including any related disclosures drawing attention to any necessary qualifications or assumptions.
Under the Listing Rules we are required to review the going concern and business viability statement. We have nothing to report in this respect.
Corporate governance disclosuresWe are required to report to you if:
• we have identified material inconsistencies between the knowledge we acquired during our financial statements audit and the directors’ statement that they consider that the annual report and financial statements taken as a whole is fair, balanced and understandable and provides the information necessary for shareholders to assess the Group’s position and performance, business model and strategy; or
• the section of the annual report describing the work of the Audit Committee does not appropriately address matters communicated by us to the Audit Committee.
We are required to report to you if the Corporate Governance Statement does not properly disclose a departure from the eleven provisions of the UK Corporate Governance Code specified by the Listing Rules for our review.
We have nothing to report in these respects.
6. We have nothing to report on the other matters on which we are required to report by exceptionUnder the Companies Act 2006, we are required to report to you if, in our opinion:
• adequate accounting records have not been kept by the parent Company, or returns adequate for our audit have not been received from branches not visited by us; or
• the parent Company financial statements and the part of the Directors’ Remuneration Report to be audited are not in agreement with the accounting records and returns; or
• certain disclosures of directors’ remuneration specified by law are not made; or
• we have not received all the information and explanations we require for our audit.
We have nothing to report in these respects.

7. Respective responsibilitiesDirectors’ responsibilitiesAs explained more fully in their statement set out on page 102, the directors are responsible for: the preparation of the financial statements including being satisfied that they give a true and fair view; such internal control as they determine is necessary to enable the preparation of financial statements that are free from material misstatement, whether due to fraud or error; assessing the Group and parent Company’s ability to continue as a going concern, disclosing, as applicable, matters related to going concern; and using the going concern basis of accounting unless they either intend to liquidate the Group or the parent Company or to cease operations, or have no realistic alternative but to do so.
Auditor’s responsibilitiesOur objectives are to obtain reasonable assurance about whether the financial statements as a whole are free from material misstatement, whether due to fraud, or other irregularities (see below), or error, and to issue our opinion in an auditor’s report. Reasonable assurance is a high level of assurance, but does not guarantee that an audit conducted in accordance with ISAs (UK) will always detect a material misstatement when it exists. Misstatements can arise from fraud, other irregularities or error and are considered material if, individually or in aggregate, they could reasonably be expected to influence the economic decisions of users taken on the basis of the financial statements.
A fuller description of our responsibilities is provided on the FRC’s website at www.frc.org.uk/auditorsresponsibilities.
Irregularities – ability to detectOur audit aimed to detect non-compliance with relevant laws and regulations (irregularities) that could have a material effect on the financial statements. We identified relevant areas of laws and regulations from our sector experience, through discussion with the directors and other management (as required by auditing standards), and from inspection of the Group’s regulatory and legal correspondence.
We had regard to laws and regulations in areas that directly affect the financial statements including financial reporting (including related company legislation) and taxation legislation. We considered the extent of compliance with those laws and regulations as part of our procedures on the related annual accounts items.
In addition we considered the impact of laws and regulations in the specific areas of regulatory capital and liquidity, conduct including money laundering, and market abuse regulations recognising the financial and regulated nature of the Group’s activities. With the exception of any known or possible non-compliance, and as required by auditing standards, our work in respect of these was limited to enquiry of the directors and other management and inspection of regulatory and legal correspondence. We considered the effect of any known or possible non-compliance with these, including PPI mis-selling, as part of our procedures on the related annual accounts items.
We communicated identified laws and regulations throughout our team and remained alert to any indications of non-compliance throughout the audit.
As with any audit, there remained a higher risk of non-detection of irregularities, as these may involve collusion, forgery, intentional omissions, misrepresentations, or the override of internal controls.
8 The purpose of our audit work and to whom we owe our responsibilitiesThis report is made solely to the Company’s members, as a body, in accordance with Chapter 3 of Part 16 of the Companies Act 2006. Our audit work has been undertaken so that we might state to the Company’s members those matters we are required to state to them in an auditor’s report and for no other purpose. To the fullest extent permitted by law, we do not accept or assume responsibility to anyone other than the Company and the Company’s members, as a body, for our audit work, for this report, or for the opinions we have formed.
Andrew Walker (Senior Statutory Auditor)
for and on behalf of KPMG LLP, Statutory Auditor
Chartered AccountantsOne SnowhillSnow Hill QueenswayBirminghamB4 6GH
21 March 2018
109www.securetrustbank.co.uk
Strategic Report Corporate Governance Report
Financial Statements

Straightforward transparent bankingSecure Trust Bank PLC Annual Report & Accounts 2017
110
Consolidated statement of comprehensive income
The notes on pages 117 to 181 are an integral part of these consolidated financial statements.
Note
2017Continuing
£million
2017Discontinued
£million
2017Total
£million
2016Continuing
£million
2016Discontinued
£million
2016Total
£million
Income statementInterest receivable and similar income 141.3 8.0 149.3 118.8 22.3 141.1Interest expense and similar charges (26.7) – (26.7) (26.3) – (26.3)
Net interest income 4 114.6 8.0 122.6 92.5 22.3 114.8
Fee and commission income 16.0 – 16.0 16.3 0.1 16.4Fee and commission expense (1.1) – (1.1) (1.8) (0.1) (1.9)
Net fee and commission income 4 14.9 – 14.9 14.5 – 14.5
Operating income 129.5 8.0 137.5 107.0 22.3 129.3
Net impairment losses on loans and advances to customers 12 (33.5) (3.4) (36.9) (23.3) (7.0) (30.3)Operating expenses 5 (71.3) (0.3) (71.6) (64.3) (7.2) (71.5)Profit on sale of equity instruments available-for-sale 0.3 – 0.3 – – –
Profit before income tax 25.0 4.3 29.3 19.4 8.1 27.5Income tax expense 7 (5.1) (0.8) (5.9) (5.2) (1.6) (6.8)
Profit after income tax 19.9 3.5 23.4 14.2 6.5 20.7Gain recognised on disposal after tax 37 – 0.4 0.4 – 116.8 116.8
Profit for the period 19.9 3.9 23.8 14.2 123.3 137.5
Other comprehensive incomeItems that will not be reclassified to the income statementRevaluation reserve 0.1 – 0.1 1.2 – 1.2Taxation – – – (0.2) – (0.2)
0.1 – 0.1 1.0 – 1.0
Items that may subsequently be reclassified to the income statementAvailable-for-sale reserve 2.8 – 2.8 (2.8) – (2.8)Taxation – – – – – –
2.8 – 2.8 (2.8) – (2.8)
Other comprehensive income for the period, net of income tax 2.9 – 2.9 (1.8) – (1.8)
Total comprehensive income for the period 22.8 3.9 26.7 12.4 123.3 135.7
Profit attributable to:
Equity holders of the Company 19.9 3.9 23.8 14.2 123.3 137.5
Total comprehensive income attributable to:
Equity holders of the Company 22.8 3.9 26.7 12.4 123.3 135.7
Earnings per share for profit attributable to the equity holders of the Company during the period (pence per share)
Basic earnings per share 8 107.7 21.1 128.8 77.9 676.2 754.1
Diluted earnings per share 8 106.4 20.9 127.3 77.3 671.4 748.7

Strategic Report Corporate Governance Report
Financial Statements
111www.securetrustbank.co.uk
Note
At 31 December
2017£million
At 31 December
2016£million
ASSETS Cash and balances at central banks 226.1 112.0Loans and advances to banks 9 34.3 18.2Loans and advances to customers 10 1,598.3 1,321.0Debt securities held-to-maturity 13 5.0 20.0Equity instruments available-for-sale 14 – 13.5Property, plant and equipment 15 11.5 11.4Intangible assets 16 10.4 9.0Deferred tax assets 18 0.6 –Other assets 19 5.4 4.9
Total assets 1,891.6 1,510.0
LIABILITIES AND EQUITY Liabilities Due to banks 20 113.0 70.0Deposits from customers 21 1,483.2 1,151.8Current tax liabilities 3.0 1.7Deferred tax liabilities 18 – 0.2Other liabilities 22 41.9 49.0Provisions for liabilities and charges 23 1.4 1.3
Total liabilities 1,642.5 1,274.0
Equity attributable to owners of the parent Share capital 25 7.4 7.4Share premium 81.2 81.2Revaluation reserve 1.3 1.2Available-for-sale reserve 14 – (2.8)Retained earnings 159.2 149.0
Total equity 249.1 236.0
Total liabilities and equity 1,891.6 1,510.0
The financial statements on pages 110 to 181 were approved by the Board of Directors on 21 March 2018 and were signed on its behalf by:
Paul Lynam Chief Executive Officer
Neeraj Kapur Chief Financial Office
Consolidated statement of financial position
The notes on pages 117 to 181 are an integral part of these consolidated financial statements.

Straightforward transparent bankingSecure Trust Bank PLC Annual Report & Accounts 2017
112
Note
At 31 December
2017£million
At 31 December
2016£million
ASSETS Cash and balances at central banks 226.1 112.0Loans and advances to banks 9 32.3 16.5Loans and advances to customers 10 1,565.5 1,289.2Debt securities held-to-maturity 13 5.0 20.0Equity instruments available-for-sale 14 – 13.5Property, plant and equipment 15 6.1 6.2Intangible assets 16 8.5 6.2Investments 17 3.7 3.7Deferred tax assets 18 0.6 0.1Other assets 19 33.2 35.3
Total assets 1,881.0 1,502.7
LIABILITIES AND EQUITYLiabilities Due to banks 20 113.0 70.0Deposits from customers 21 1,483.2 1,151.8Current tax liabilities 1.9 0.8Other liabilities 22 44.4 57.0Provisions for liabilities and charges 23 1.4 1.3
Total liabilities 1,643.9 1,280.9
Equity attributable to owners of the parent Share capital 25 7.4 7.4Share premium 81.2 81.2Revaluation reserve 0.5 0.5Available-for-sale reserve 14 – (2.8)Retained earnings 148.0 135.5
Total equity 237.1 221.8
Total liabilities and equity 1,881.0 1,502.7
The Company has elected to take the exemption under section 408 of the Companies Act 2006 not to present the parent company income statement. The profit for the parent company for the year is presented in the Company statement of changes in equity.
The financial statements on pages 110 to 181 were approved by the Board of Directors on 21 March 2018 and were signed on its behalf by:
Paul Lynam Chief Executive Officer
Neeraj Kapur Chief Financial Officer
Registered number: 00541132
Company statement of financial position
The notes on pages 117 to 181 are an integral part of these consolidated financial statements.

Strategic Report Corporate Governance Report
Financial Statements
113www.securetrustbank.co.uk
Share capital
£million
Share premium£million
Revaluation reserve£million
Available-for-sale reserve
£million
Retained earnings£million
Total£million
Balance at 1 January 2016 7.3 79.3 0.2 – 54.4 141.2Total comprehensive income for the period Profit for 2016 – – – – 137.5 137.5
Other comprehensive income, net of income taxRevaluation reserve – – 1.0 – – 1.0Available-for-sale reserve – – – (2.8) – (2.8)
Total other comprehensive income – – 1.0 (2.8) – (1.8)
Total comprehensive income for the period – – 1.0 (2.8) 137.5 135.7
Transactions with owners, recorded directly in equity Contributions by and distributions to owners Issue of shares under a Share Option Scheme 0.1 1.9 – – – 2.0Dividends – – – – (43.1) (43.1)Charge for share based payments – – – – 0.2 0.2
Total contributions by and distributions to owners 0.1 1.9 – – (42.9) (40.9)
Balance at 31 December 2016 7.4 81.2 1.2 (2.8) 149.0 236.0
Total comprehensive income for the period Profit for 2017 – – – – 23.8 23.8
Other comprehensive income, net of income taxRevaluation reserve – – 0.1 – – 0.1Available-for-sale reserve – – – 2.8 – 2.8
Total other comprehensive income – – 0.1 2.8 – 2.9
Total comprehensive income for the period – – 0.1 2.8 23.8 26.7
Transactions with owners, recorded directly in equityContributions by and distributions to ownersDividends – – – – (14.0) (14.0)Tax on share based payments – – – – 0.4 0.4
Total contributions by and distributions to owners – – – – (13.6) (13.6)
Balance at 31 December 2017 7.4 81.2 1.3 – 159.2 249.1
Consolidated statement of changes in equity
The notes on pages 117 to 181 are an integral part of these consolidated financial statements.

Straightforward transparent bankingSecure Trust Bank PLC Annual Report & Accounts 2017
114
Share capital
£million
Share premium£million
Revaluation reserve£million
Available-for-sale reserve
£million
Retained earnings£million
Total£million
Balance at 1 January 2016 7.3 79.3 – – 48.6 135.2 Total comprehensive income for the periodProfit for 2016 – – – – 129.8 129.8
Other comprehensive income, net of income taxRevaluation reserve – – 0.5 – – 0.5Available-for-sale reserve – – – (2.8) – (2.8)
Total other comprehensive income – – 0.5 (2.8) – (2.3)
Total comprehensive income for the period – – 0.5 (2.8) 129.8 127.5
Transactions with owners, recorded directly in equity Contributions by and distributions to owners Issue of shares under a Share Option Scheme 0.1 1.9 – – – 2.0Dividends – – – – (43.1) (43.1)Charge for share based payments – – – – 0.2 0.2
Total contributions by and distributions to owners 0.1 1.9 – – (42.9) (40.9)
Balance at 31 December 2016 7.4 81.2 0.5 (2.8) 135.5 221.8
Total comprehensive income for the periodProfit for 2017 – – – – 26.1 26.1
Other comprehensive income, net of income taxAvailable-for-sale reserve – – – 2.8 – 2.8
Total other comprehensive income – – – 2.8 – 2.8
Total comprehensive income for the period – – – 2.8 26.1 28.9
Transactions with owners, recorded directly in equityContributions by and distributions to ownersDividends – – – – (14.0) (14.0)Tax on share based payments – – – – 0.4 0.4
Total contributions by and distributions to owners – – – – (13.6) (13.6)
Balance at 31 December 2017 7.4 81.2 0.5 – 148.0 237.1
Company statement of changes in equity
The notes on pages 117 to 181 are an integral part of these consolidated financial statements.

Strategic Report Corporate Governance Report
Financial Statements
115www.securetrustbank.co.uk
Note
Year ended 31 December
2017£million
Year ended 31 December
2016£million
Cash flows from operating activities – Continuing operations Profit for the year 19.9 14.2
Adjustments for: Income tax expense 7 5.1 5.2Depreciation of property, plant and equipment 15 0.8 0.6Loss on sale of property, plant and equipment – 0.2Amortisation of intangible assets 16 2.0 1.6Impairment losses on loans and advances to customers 33.5 23.3Share based compensation – 0.2Profit on sale of equity instruments available-for-sale (0.3) –
Cash flows from operating profits before changes in operating assets and liabilities 61.0 45.3
Changes in operating assets and liabilities: – net decrease/(increase) in debt securities held-to-maturity 15.0 (16.2)– net increase in loans and advances to customers (378.3) (396.9)– net (increase)/decrease in other assets (1.0) 2.2– net increase in amounts due to banks 43.0 35.0– net increase in deposits from customers 331.4 118.7– net (decrease)/increase in other liabilities (7.0) 22.9Income tax paid (5.1) (6.3)Proceeds from sale of equity instruments available-for-sale 16.6 –
Net cash inflow/(outflow) from operating activities – Continuing operations 75.6 (195.3)
Cash flows from investing activities Sale of subsidiary undertakings 37 – 209.9Sale of discontinued operation 37 37.1 –Purchase of property, plant and equipment 15 (0.8) (2.5)Purchase of computer software and other intangible assets 16 (3.4) (3.6)
Net cash inflow from investing activities – Continuing operations 32.9 203.8
Cash flows from financing activities Shares issued – 2.0Dividends paid (14.0) (43.1)
Net cash outflow from financing activities – Continuing operations (14.0) (41.1)
Net increase/(decrease) in cash and cash equivalents – Continuing operations 94.5 (32.6)Net increase in cash and cash equivalents – Discontinued operations 37 35.7 19.5Cash and cash equivalents at 1 January 130.2 143.3
Cash and cash equivalents at 31 December 27 260.4 130.2
Consolidated statement of cash flows
The notes on pages 117 to 181 are an integral part of these consolidated financial statements.

Straightforward transparent bankingSecure Trust Bank PLC Annual Report & Accounts 2017
116
Company statement of cash flows
Note
Year ended 31 December
2017£million
Year ended 31 December
2016£million
Cash flows from operating activities – Continuing operations Profit for the year 22.2 125.3
Adjustments for: Income tax expense 2.7 3.3Depreciation of property, plant and equipment 15 0.4 0.4Loss on sale of property, plant and equipment – 0.2Profit on sale of subsidiary undertakings – (120.5)Amortisation of intangible assets 16 1.0 0.5Impairment losses on loans and advances to customers 35.1 24.2Share based compensation – 0.2Profit on sale of equity instruments available-for-sale (0.3) –
Cash flows from operating profits before changes in operating assets and liabilities 61.1 33.6
Changes in operating assets and liabilities: – net decrease/(increase) in debt securities held-to-maturity 15.0 (16.2)– net increase in loans and advances to customers (378.9) (393.9)– net decrease in other assets 0.6 2.6– net increase in amounts due to banks 43.0 33.6– net increase in deposits from customers 331.4 118.7– net (decrease)/increase in other liabilities (11.5) 28.1Income tax paid (2.6) (3.5)Proceeds from sale of equity instruments available-for-sale 16.6 –
Net cash inflow/(outflow) from operating activities – Continuing operations 74.7 (197.0)
Cash flows from investing activities Sale of subsidiary undertakings 37 – 212.3Sale of discontinued operation 37 37.1 –Purchase of property, plant and equipment 15 (0.3) (2.0)Purchase of computer software 16 (3.3) (3.5)
Net cash inflow from investing activities – Continuing operations 33.5 206.8
Cash flows from financing activities Issue of shares – 2.0Dividends paid (14.0) (43.1)
Net cash outflow from financing activities – Continuing operations (14.0) (41.1)
Net increase/(decrease) in cash and cash equivalents 94.2 (31.3)Net increase in cash and cash equivalents – Discontinued operations 35.7 18.8Cash and cash equivalents at 1 January 128.5 141.0
Cash and cash equivalents at 31 December 27 258.4 128.5
The notes on pages 117 to 181 are an integral part of these consolidated financial statements.

Strategic Report Corporate Governance Report
Financial Statements
117www.securetrustbank.co.uk
Notes to the consolidated financial statements
1. Accounting policies
The principal accounting policies applied in the preparation of these consolidated financial statements are set out below. These policies have been consistently applied to all the years presented, unless otherwise stated.
1.1 Reporting entitySecure Trust Bank PLC is a company incorporated in the United Kingdom (referred to as ‘the Company’). The Company is registered in England and Wales and has the registered number 00541132. The registered address of the Company is One Arleston Way, Solihull, West Midlands, B90 4LH. The consolidated financial statements of the Company as at and for the year ended 31 December 2017 comprise Secure Trust Bank PLC and its subsidiaries (together referred to as ‘the Group’ and individually as ‘subsidiaries’). The Group is primarily involved in banking and financial services.
1.2 Basis of presentationThe Group’s consolidated financial statements and the Company’s financial statements have been prepared in accordance with International Financial Reporting Standards, as adopted by the Group and endorsed by the EU and the Companies Act 2006 applicable to companies reporting under IFRS. They have been prepared under the historical cost convention, as modified by the revaluation of equity instruments available-for-sale and land and buildings and financial instruments at fair value through profit or loss. The consolidated financial statements are presented in pounds sterling, which is the functional and presentational currency of the entities within the Group.
The preparation of financial statements in conformity with IFRS requires the use of certain critical accounting estimates. It also requires management to exercise its judgement in the process of applying the Group’s accounting policies. The areas involving a higher degree of judgement or complexity or areas where assumptions and estimates are significant to the consolidated financial statements are disclosed in Note 2.
The directors have assessed, in the light of current and anticipated economic conditions, the Group’s ability to continue as a going concern. The directors confirm they are satisfied that the Company and the Group have adequate resources to continue in business for the foreseeable future. For this reason, they continue to adopt the ‘going concern’ basis for preparing accounts, as set out in the going concern and viability section of the Strategic Report starting on page 2.
The consolidated financial statements were authorised for issue by the Board of Directors on 21 March 2018.
The following International Financial Reporting Standards, which have been endorsed by the EU, have been issued but are not yet effective and have not been adopted early:
• IFRS 9 ‘Financial Instruments’ (effective for annual periods beginning after 1 January 2018). This is the International Accounting Standards Board’s replacement of IAS 39 ‘Financial Instruments: Recognition and Measurement’. Based on assessments undertaken to date, the estimated adjustment (net of tax) of the adoption of IFRS 9 on the opening balance of the Group’s equity at 1 January 2018 is expected to be a reduction in the range of £22 million to £27 million. This represents:
- £nil related to the classification requirements (refer to Note 29 for further information);
- An expected reduction in the range of £28 million to £34 million related to the impairment requirements (refer to Note 29 for further information). This reduction is primarily attributable to Consumer Finance. The Business Finance portfolio is not expected to drive a material reduction; and
- An increase in the range of £6 million to £7 million related to associated deferred tax impacts.
The above are estimates and will not be finalised until all transition work has been completed. The actual impact of adopting IFRS 9 may change as the Group continues to refine and finalise its models for the expected credit loss (ECL) calculations following validations undertaken both internally and by the Group’s incoming external auditors. The new accounting policies, assumptions, judgements and estimation techniques are subject also to change until the Group finalises its interim report for the six months ended 30 June 2018.

Straightforward transparent bankingSecure Trust Bank PLC Annual Report & Accounts 2017
118
1. Accounting policies continued
• IFRS 15 ‘Revenue from contracts with customers’ (effective for annual periods beginning after 1 January 2018). This standard replaces a number of existing standards and interpretations and applies to contracts with customers, but does not apply to insurance contracts, financial instruments or lease contracts, which are in the scope of other IFRS. It also does not apply if two companies in the same line of business exchange non-monetary assets to facilitate sales to other parties. The standard specifies how and when an IFRS reporter will recognise revenue as well as requiring such entities to provide users of financial statements with more informative relevant disclosures. It introduces a new revenue recognition model that recognises revenue either at a point in time or over time. The model features a principles-based five-step model to be applied to all contracts with customers. Following consideration of the Group’s operating model, it has been concluded that this standard will not have a material impact on the Group.
• IFRS 16 ‘Leases’ (effective for annual periods beginning after 1 January 2019). The standard sets out the principles for the recognition, measurement, presentation and disclosure of leases for both parties to a contract i.e. the customer (‘lessee’) and the supplier (‘lessor’). IFRS 16 replaces the previous leases standard, IAS 17 ‘Leases’, and related interpretations. IFRS 16 eliminates the classification of leases as either operating leases or finance leases for a lessee. Instead all leases, except short term and low value leases, are treated in a similar way to finance leases applying IAS 17. Leases are ‘capitalised’ by recognising the present value of the lease payments and showing them either as lease assets (right-of-use assets) or together with property, plant and equipment. If lease payments are made over time, a company also recognises a financial liability representing its obligation to make future lease payments. The most significant effect of the new requirements in IFRS 16 will be an increase in lease assets and financial liabilities. The effect of this standard is currently being assessed, but it is unlikely to be substantial. Lessor accounting remains unchanged from IAS 17.
1.3 Change in accounting policy
Charge-off of debt sold by Secure Trust Bank PLC to Debt Managers (Services) LimitedPreviously, when debt was sold by Secure Trust Bank PLC to its subsidiary Debt Managers (Services) Limited, the debt was ‘charged off’, i.e. the gross receivable and associated impairment provision were written off, when Debt Managers (Services) Limited considered that the remaining debt was unlikely to be recovered. The Group considers that it better reflects the economic reality to charge off the debt at the point of its sale to Debt Managers (Services) Limited.
This has resulted in a reduction of both gross receivables and impairment provision of £32.1 million at 31 December 2016. There is no impact on net receivables or the income statement. Further information is provided in Note 10.
1.4 Consolidation
SubsidiariesSubsidiaries are all investees controlled by the Group. The Group controls an investee when it is exposed, or has rights, to variable returns from its involvement with the investee and has the ability to affect those returns through its power over the investee. Subsidiaries are fully consolidated from the date on which control is transferred to the Group.
The acquisition method of accounting is used to account for the acquisition of subsidiaries by the Group. The cost of an acquisition is measured as the fair value of the assets given, equity instruments issued and liabilities incurred or assumed at the date of exchange plus costs directly attributable to the acquisition. Identifiable assets acquired and liabilities and contingent liabilities assumed in a business combination are measured initially at their fair values at the acquisition date, irrespective of the extent of any non-controlling interest. The excess of the cost of acquisition over the fair value of the Group’s share of the identifiable net assets acquired is recorded as goodwill. If the cost of acquisition is less than the fair value of the net assets of the subsidiary acquired, the difference is recognised directly in the income statement.
The parent company’s investments in subsidiaries are recorded at cost less, where appropriate, provision for impairment in value.
Inter-company transactions, balances and unrealised gains and losses on transactions between Group companies are eliminated. Accounting policies of subsidiaries have been changed where necessary to ensure consistency with the policies adopted by the Group.
Notes to the consolidated financial statementscontinued

Strategic Report Corporate Governance Report
Financial Statements
119www.securetrustbank.co.uk
1. Accounting policies continued
Discontinued operationsSubsidiaries are de-consolidated from the date that control ceases. Discontinued operations are a component of an entity that has been disposed of, and represents a major line of business and is part of a single co-ordinated disposal plan.
1.5 Interest income and expenseInterest income and expense are recognised in the income statement for all instruments measured at amortised cost using the effective interest method.
The effective interest method calculates the amortised cost of a financial asset or a financial liability and allocates the interest income or interest expense over the relevant period. The effective interest rate is the rate that discounts estimated future cash payments or receipts through the expected life of the financial instrument or, when appropriate, a shorter period to the net carrying amount of the financial asset or financial liability. When calculating the effective interest rate, the Group takes into account all contractual terms of the financial instrument but does not consider future credit losses. The calculation includes all fees paid or received between parties to the contract that are an integral part of the effective interest rate, transaction costs and all other premiums or discounts.
Once a financial asset or a group of similar financial assets has been written down as a result of an impairment loss, interest income is recognised using the rate of interest used to discount the future cash flows for the purpose of measuring the impairment loss.
1.6 Net fee and commission incomeFees and commissions which are not considered integral to the effective interest rate are generally recognised on an accruals basis when the service has been provided.
1.7 Financial assets and financial liabilitiesThe Group classifies its financial assets as fair value through profit or loss, loans and receivables, held-to-maturity or available-for-sale and classifies its financial liabilities as other financial liabilities. Management determines the classification of its investments at initial recognition. A financial asset or financial liability is measured initially at fair value plus, for an item not at fair value through profit or loss, transaction costs that are directly attributable to its acquisition or issue.
(a) Loans and receivablesLoans and receivables are non-derivative financial assets with fixed or determinable payments that are not quoted in an active market. They arise when the Group provides money, goods or services directly to a debtor with no intention of trading the receivable. Loans are recognised when the funds are advanced to customers. Loans and receivables are carried at amortised cost using the effective interest method (see over the page).
(b) Held-to-maturityHeld-to-maturity investments are non-derivative financial assets with fixed or determinable payments and fixed maturities that the Group’s management has the positive intention and ability to hold to maturity. Held-to-maturity investments are carried at amortised cost using the effective interest method.
(c) Available-for-saleAvailable-for-sale (‘AFS’) investments are those not classified as another category of financial assets. These comprised equity investments in a quoted company. They may be sold in response to liquidity requirements or equity price movements. AFS investments are initially recognised at cost, which is considered as the fair value of the investment including any acquisition costs. AFS investments are subsequently measured at fair value in the statement of financial position. Fair value changes on the AFS securities are recognised in the statement of other comprehensive income and in equity (AFS reserve), until the investment is sold or impaired. Once sold or impaired, the cumulative gains or losses previously recognised in the AFS reserve are recycled to the income statement.

Straightforward transparent bankingSecure Trust Bank PLC Annual Report & Accounts 2017
120
1. Accounting policies continued
(d) Other financial liabilitiesOther financial liabilities are non-derivative financial liabilities with fixed or determinable payments. Other financial liabilities are recognised when cash is received from the depositors. Other financial liabilities are carried at amortised cost using the effective interest method. The fair value of other liabilities repayable on demand is assumed to be the amount payable on demand at the statement of financial position date.
DerecognitionFinancial assets are derecognised when the rights to receive cash flows from the financial assets have expired or where the Group has transferred substantially all of the risks and rewards of ownership. There have not been any instances where assets have only been partially derecognised. The Group derecognises a financial liability when its contractual obligations are discharged, cancelled or expire.
Amortised cost measurementThe amortised cost of a financial asset or financial liability is the amount at which the financial asset or financial liability is measured at initial recognition, minus principal payments, plus or minus the cumulative amortisation using the effective interest method of any difference between the initial amount recognised and the maturity amount, minus any reduction for impairment.
Fair value measurementFair value is the price that would be received to sell an asset or paid to transfer a liability in an orderly transaction between market participants at the measurement date. The fair value of assets and liabilities traded in active markets are based on current bid and offer prices respectively. If the market for a financial instrument is not active the Group establishes a fair value by using an appropriate valuation technique. These include the use of recent arm’s length transactions, reference to other instruments that are substantially the same for which market observable prices exist, net present value and discounted cash flow analysis.
1.8 Foreign currenciesTransactions in foreign currencies are initially recorded at the rates of exchange prevailing on the dates of the transactions. Monetary assets and liabilities denominated in foreign currencies are retranslated into the Company’s functional currency at the rates prevailing on the balance sheet date. Exchange differences arising on the settlement of monetary items, and on the retranslation of monetary items, are included in the income statement for the period.
1.9 Impairment of financial assets
Assets carried at amortised costOn an ongoing basis the Group assesses whether there is objective evidence that a financial asset or group of financial assets is impaired. Objective evidence is the occurrence of a loss event, after the initial recognition of the asset, that impacts on the estimated future cash flows of the financial asset or group of financial assets, and can be reliably estimated.
Notes to the consolidated financial statementscontinued

Strategic Report Corporate Governance Report
Financial Statements
121www.securetrustbank.co.uk
1. Accounting policies continued
The criteria that the Group uses to determine that there is objective evidence of an impairment loss include, but are not limited to, the following:
• Delinquency in contractual payments of principal or interest;
• Breach of financial covenants or contractual obligations;
• Cash flow difficulties experienced by the borrower; and
• Initiation of bankruptcy proceedings.
If there is objective evidence that an impairment loss on loans and receivables or held-to-maturity investments carried at amortised cost has been incurred, the amount of the loss is measured as the difference between the asset’s carrying amount and the present value of estimated future cash flows discounted at the financial asset’s original effective interest rate. The carrying amount of the asset is reduced through the use of an allowance account and the amount of the loss is recognised in the income statement. If a loan or held-to-maturity investment has a variable interest rate, the discount rate for measuring any impairment loss is the current effective interest rate determined under the contract.
The Group considers evidence of impairment for loans and advances at both an individual asset and collective level. All individually significant loans and advances are assessed for specific impairment. Those found not to be specifically impaired are then collectively assessed for any impairment that has been incurred but not yet identified. In assessing collective impairment the Group uses historical trends of the probability of default, emergence period, the timing of recoveries and the amount of loss incurred, adjusted for management’s judgement as to whether current economic and credit conditions are such that the actual losses are likely to be significantly different to historic trends.
When a loan is uncollectible, it is written off against the related provision for loan impairment. Such loans are written off after all the necessary procedures have been completed and the amount of the loss has been determined. Subsequent recoveries of amounts previously written off decrease the amount of the provision for loan impairment in the income statement.
Business FinanceIn assessing objective evidence of a loss event for business loans, the following factors are considered:
• If any contractual repayment date has been missed;
• Covenant breaches; and
• In Commercial Finance, a loan may be considered for potential impairment if the financial prospects of the borrower’s customers deteriorates.
Consumer FinanceFor consumer loans, cash flows are estimated based on past experience combined with the Group’s view of the future considering the following factors:
• Our exposure to the customer;
• Based on the number of days in arrears at the statement of financial position date, the likelihood that a loan will progress through the various stages of delinquency and ultimately be written off; and
• The amount and timing of expected receipts and recoveries.
Modification of loansA customer’s account may be modified to assist customers who are in or have recently overcome financial difficulties and have demonstrated both the ability and willingness to meet the current or modified loan contractual payments. Loans that have renegotiated or deferred terms, resulting in a substantial modification to the cash flows, are no longer considered to be past due but are treated as new loans recognised at fair value, provided the customers comply with the renegotiated or deferred terms.
Straightforward transparent bankingSecure Trust Bank PLC Annual Report & Accounts 2017
122
1. Accounting policies continued
1.10 Intangible assets
(a) GoodwillGoodwill represents the excess of the cost of the acquisition over the fair value of the Group’s share of the net identifiable assets acquired at the date of acquisition. Goodwill is held at cost less accumulated impairment losses and is deemed to have an infinite life.
The Group reviews the goodwill for impairment at least annually or when events or changes in economic circumstances indicate that impairment may have taken place. Impairment losses are recognised in the income statement if the carrying amount exceeds the recoverable amounts.
(b) Computer softwareAcquired computer software licences are capitalised on the basis of the costs incurred to acquire and bring to use the specific software.
Costs associated with developing or maintaining computer software programs are recognised as an expense as incurred unless the technical feasibility of the development has been demonstrated, and it is probable that the expenditure will enable the asset to generate future economic benefits in excess of its originally assessed standard of performance, in which case they are capitalised.
These costs are amortised on the basis of the expected useful lives, which are between 3 to 10 years.
(c) Other intangiblesThe acquisition of subsidiaries was accounted for in accordance with IFRS 3 ‘Business Combinations’, which requires the recognition of the identifiable assets acquired and liabilities assumed at their acquisition date fair values. As part of this process, it was necessary to recognise certain intangible assets which are separately identifiable and which are not included on the acquiree’s balance sheet, which are amortised over their expected useful lives, as set out in Note 16.
1.11 Property, plant and equipmentProperty is held at its revalued amount, being its fair value at the date of valuation less any subsequent accumulated depreciation. Revaluations are carried out annually at the reporting date, and movements are recognised in other comprehensive income, net of any applicable deferred tax.
Plant and equipment is stated at historical cost less depreciation. Historical cost includes expenditure that is directly attributable to the acquisition of the items. Pre-installed computer software licences are capitalised as part of the computer hardware it is installed on. Depreciation is calculated using the straight-line method to allocate their cost to their residual values over their estimated useful lives, which are subject to regular review:
Land not depreciatedFreehold buildings 50 yearsLeasehold improvements shorter of life of lease or 7 yearsComputer equipment 3 to 5 yearsOther equipment 5 to 10 years
Gains and losses on disposals are determined by comparing proceeds with carrying amounts. These are included in the income statement.
1.12 Leases
(a) As a lessorAssets leased to customers under agreements which transfer substantially all the risks and rewards of ownership, with or without ultimate legal title, are classified as finance leases. When assets are held subject to finance leases, the present value of the lease payments is recognised as a receivable. The difference between the gross receivable and the present value of the receivable is recognised as unearned finance income. Lease income is recognised over the term of the lease using the net investment method, which reflects a constant periodic rate of return.
Notes to the consolidated financial statementscontinued

Strategic Report Corporate Governance Report
Financial Statements
123www.securetrustbank.co.uk
1. Accounting policies continued
(b) As a lesseeRentals made under operating leases are recognised in the income statement on a straight-line basis over the term of the lease.
1.13 Cash and cash equivalentsFor the purposes of the statement of cash flows, cash and cash equivalents comprise cash in hand and demand deposits, and cash equivalents comprise highly liquid investments which are convertible into cash with an insignificant risk of changes in value with a maturity of three months or less at the date of acquisition, including certain loans and advances to banks and short-term highly liquid debt securities.
1.14 Equity instrumentsEquity instruments issued by the Company are recorded at the proceeds received, net of direct issuance costs. Any amounts received over nominal value are recorded in the share premium account, net of direct issuance costs. Costs associated with the listing of shares are expensed immediately.
1.15 Employee benefits
(a) Post-retirement obligationsThe Group contributes to defined contribution schemes for the benefit of certain employees. The schemes are funded through payments to insurance companies or trustee-administered funds at the contribution rates agreed with individual employees. The Group has no further payment obligations once the contributions have been paid. The contributions are recognised as an employee benefit expense when they are due. There are no post-retirement benefits other than pensions.
(b) Share-based compensationThe fair value of equity settled share-based payment awards are calculated at grant date and recognised over the period in which the employees become unconditionally entitled to the awards (the vesting period). The amount is recognised as personnel expenses in the income statement, with a corresponding increase in equity. Further details of the valuation methodology is set out in Note 26.
The fair value of cash settled share-based payments is recognised as personnel expenses in the income statement with a corresponding increase in liabilities over the vesting period. The liability is remeasured at each reporting date and at settlement date based on the fair value of the options granted, with a corresponding adjustment to personnel expenses.
1.16 TaxationCurrent income tax which is payable on taxable profits is recognised as an expense in the period in which the profits arise.
Deferred tax is provided in full on temporary differences arising between the tax bases of assets and liabilities and their carrying amounts in the consolidated financial statements. Deferred tax is determined using tax rates (and laws) that have been enacted or substantially enacted by the statement of financial position date and are expected to apply when the related deferred tax asset is realised or the deferred tax liability is settled.
Deferred tax assets and liabilities are offset if there is a legally enforceable right to offset current tax assets and liabilities, and they relate to taxes levied by the same tax authority on the same taxable entity, or on different tax entities, when they intend to settle current tax liabilities and assets on a net basis or their tax assets and liabilities will be realised simultaneously.
Deferred tax assets are recognised where it is probable that future taxable profits will be available against which the temporary differences can be utilised.
1.17 DividendsDividends on ordinary shares are recognised in equity in the period in which they are approved by Shareholders.

Straightforward transparent bankingSecure Trust Bank PLC Annual Report & Accounts 2017
124
1. Accounting policies continued
1.18 Funding for Lending Scheme and Term Funding SchemeUnder the applicable International Accounting Standard, IAS 39, if a security is lent under an agreement to return it to the transferor, as is the case for eligible securities lent by institutions to the Bank of England under the Funding for Lending Scheme, then the security is not derecognised because the transferor retains all the risks and rewards of ownership. The UK Treasury Bills borrowed from the Bank of England under the Funding for Lending Scheme are not recognised on the statement of financial position of the institution until such time as they are subject to a repurchase agreement with a third party, as they will not meet the criteria for derecognition by the Bank of England. When the UK Treasury Bills are pledged as part of a sale and repurchase agreement with a third party, amounts borrowed from the third party are recognised in the statement of financial position.
Under the new Term Funding Scheme, the Bank borrows cash and this is recognised in the consolidated statement of financial position within cash and cash equivalents, with the corresponding loan being recognised in liabilities to banks.
2. Critical judgements and estimates
JudgementsIn the course of preparing the financial statements, no judgements have been made in applying the Group’s accounting policies, other than those involving estimations, that have had a significant effect on the amounts recognised in the financial statements.
EstimatesThe Group makes certain estimates which affect the reported amounts of assets and liabilities. The following areas are those where assumptions and estimates at the end of the current reporting period have a significant risk of resulting in a material adjustment to the carrying amounts of assets and liabilities within the next financial year:
2.1 Impairment losses on loans and advances to customersWhere financial assets are individually evaluated for impairment, management uses their best estimates in calculating the net present value of future cash flows. Management has to make estimates on the financial position of the counterparty and the net realisable value of collateral (where held), in determining the expected future cash flows.
In assessing collective impairment the Group uses historical trends of the probability of default, the timing of recoveries and the amount of loss incurred, adjusted for management’s estimate as to whether current economic and credit conditions are such that the actual losses are likely to be significantly different to historic trends.
Consumer FinanceThe Group reviews its Consumer Finance loan portfolios to assess impairment at least on a half-yearly basis. The basis for evaluating impairment losses is described in accounting policy 1.9. In determining whether an impairment loss should be recorded in the income statement, the Group makes estimates as to whether there is any observable data indicating that there is a measurable decrease in the estimated future cash flows from financial assets, or a group of financial assets.
This evidence may include observable data indicating that there has been an adverse change in the payment status of borrowers in a group, or national or local economic conditions that correlate with defaults on assets in the group. Loans and advances are identified as impaired by taking account of the age of the debt’s delinquency and the product type. The impairment provision is calculated by applying a percentage rate to the balance of different ages and categories of impaired debt. The methodology and assumptions used for estimating both the amount and timing of future cash flows are reviewed regularly to reduce any differences between loss estimates and recent actual loss experience.
Notes to the consolidated financial statementscontinued

Strategic Report Corporate Governance Report
Financial Statements
125www.securetrustbank.co.uk
2. Critical judgements and estimates continued
The key estimates made in calculating the consumer individual provisions are the probability of default rates and the loss given default. Uplifting the probability of each by 10% would result in an estimated increase in the Consumer Finance individual provisions as follows:
201710% increase in probability
of default rates£million
201710% increase in loss given
default£million
201610% increase in probability
of default rates£million
201610% increase in loss given
default£million
Personal Lending N/A N/A 0.2 0.3Motor Finance 0.3 2.3 0.3 1.6Retail Finance 0.3 0.6 0.1 0.4
0.6 2.9 0.6 2.3
Of the £2.3 million (2016: £1.6 million) sensitivity to loss given default in Motor Finance above, an estimated £0.9 million (2016: £0.8 million) relates to the expected loss on the sale of repossessed vehicles.
The collective provision for the consumer portfolio assumes an emergence period of 2 months for the Motor Finance and Personal Loan portfolios and 1 month for the Retail Finance portfolio. Increasing this assumption by 1 month would result in an estimated increase in the collective impairment allowance as follows:
2017£million
2016£million
Personal Lending N/A 0.5Motor Finance 1.0 0.8Retail Finance 1.1 0.9
2.1 2.2
Business FinanceWithin the Real Estate Finance and Asset Finance businesses, accounts which are impaired are assessed against the discounted cash flows expected to arise in order to identify any impairment provisions. Collective provisions are assessed only to the extent that there is sufficient data to justify an inherent level of losses within the current portfolios.
For specific Commercial Finance clients assessment is made as to the collectability of outstanding invoices in relation to the amounts lent against them. If there is a deficit against outstanding invoices then other security is considered in terms of value and collectability. If there is an overall shortfall then the unsecured amount is assessed as to whether a provision is required. For collective provisions a view of the overall level of non-collectability in the portfolio is taken. The level of provision required is under review as the product is yet to mature, and therefore data is developing, so the Group has estimated a level appropriate based on other data available in the industry.
The Business Finance portfolio is largely assessed on an individual basis with minimal losses experienced to date. The decision on whether or not an impairment trigger has occurred for Real Estate Finance loans is made based on the Group’s knowledge of the counterparty and assessment of their ability to repay their loan balance. The Real Estate Finance portfolio is exposed to deteriorations in property prices, in the event of borrower default. However, given the low loan to value ratios of loans held within the portfolio, this exposure is not considered significant.
The collective provision for the Asset Finance portfolio assumes an emergence period of three months. The collective provision for the Commercial Finance and Real Estate Finance portfolios are based on peer group experience of comparable groups of financial assets and determined as 0.15% and 0.1% of gross balances net of specific provisions respectively.
Straightforward transparent bankingSecure Trust Bank PLC Annual Report & Accounts 2017
126
2. Critical judgements and estimates continued
2.2 Average life of lendingIAS 39 requires interest earned from lending to be measured under the effective interest rate method. The effective interest rate is the rate that exactly discounts estimated future cash receipts or payments through the expected life of the financial instrument or, when appropriate, a shorter period to the net carrying amount of the financial asset.
Management must therefore use estimates to estimate the expected life of each instrument and hence the expected cash flows relating to it. The accuracy of these estimates would therefore be affected by unexpected market movements resulting in altered customer behaviour, inaccuracies in the models used compared to actual outcomes and incorrect assumptions. The Group also needs to identify which cash flows relating to each instrument should be subject to the effective interest rate method.
A one month increase in the assumed behavioural life would change the income received in the year as follows:
2017£million
2016£million
Personal Lending N/A –Motor Finance 0.2 0.1Retail Finance 0.4 (0.6)
0.6 (0.5)
2.3 Reassessment of critical estimatesDuring the year, Management reassessed the critical estimates and resolved that the assumptions used to estimate acquisition accounting and share option scheme valuations were not sensitive enough to change the balances materially, and therefore were no longer considered critical.
3. Operating segments
The Group is organised into seven operating segments, which consist of the different products available, disclosed below:
Business Finance1) Real Estate Finance: residential and commercial investment and development loans secured by UK real estate.2) Asset Finance: loans to small and medium sized enterprises to acquire commercial assets.3) Commercial Finance: invoice discounting and invoice factoring.
Consumer Finance4) Personal Lending: Unsecured consumer loans sold to customers via broker aggregators and business partners.5) Motor Finance: Hire purchase agreements secured against the vehicle being financed.6) Retail Finance: Point of sale unsecured finance for in-store and online retailers.
Consumer Mortgages7) Residential mortgages for the self-employed, contract workers, those with complex income and those with a recently
restored credit history, sold via select mortgage intermediaries.
OtherOther includes OneBill, current accounts, STB Leasing Limited, debt collection and a £30 million loan to Non-Standard Finance plc (NSF) as part of their purchase of ELG, which was repaid during the year. All current accounts were closed by the end of 2016, and OneBill has been closed to new customers since 2009.
Notes to the consolidated financial statementscontinued

Strategic Report Corporate Governance Report
Financial Statements
127www.securetrustbank.co.uk
3. Operating segments continued
Management review these segments by looking at the income, size and growth rate of the loan books, impairments and customer numbers. Except for these items no costs or balance sheet items are allocated to the segments.
Interest receivable and similar income
£million
Fee and commission
income £million
Revenue from external
customers £million
Net impairment losses on loans
and advances to customers
£million
Loans and advances to
customers £million
Year ended 31 December 2017 Business Finance
Real Estate Finance 32.1 0.2 32.3 (0.2) 580.8Asset Finance 8.5 – 8.5 1.0 116.7Commercial Finance 2.5 4.7 7.2 0.1 126.5
Consumer FinanceMotor Finance 46.2 0.9 47.1 20.8 274.6Retail Finance 47.5 3.2 50.7 13.8 452.3
Consumer Mortgages 0.1 – 0.1 – 16.5Other 4.4 7.0 11.4 (2.0) 30.9
Continuing operations 141.3 16.0 157.3 33.5 1,598.3Discontinued operations
Personal Lending 8.0 – 8.0 3.4 –
149.3 16.0 165.3 36.9 1,598.3
Interest receivable and similar income
£million
Fee and commission
income £million
Revenue from external
customers £million
Net impairment losses on loans
and advances to customers
£million
Loans and advances to
customers £million
Year ended 31 December 2016 Business Finance
Real Estate Finance 28.3 0.1 28.4 0.1 451.0Asset Finance 7.8 – 7.8 0.6 117.2Commercial Finance 1.5 3.1 4.6 0.2 62.8
Consumer FinanceMotor Finance 39.6 0.9 40.5 14.6 236.2Retail Finance 34.3 2.4 36.7 9.5 325.9
Other 7.3 9.8 17.1 (1.7) 62.4
Continuing operations 118.8 16.3 135.1 23.3 1,255.5Discontinued operations
Personal Lending 22.3 0.1 22.4 7.0 65.5
141.1 16.4 157.5 30.3 1,321.0
The ‘other’ segment above includes products which are individually below the quantitative threshold for separate disclosure and fulfils the requirement of IFRS 8.28 by reconciling operating segments to the amounts reported in the financial statements. Currently, the Consumer Mortgages segment also falls below this threshold, but the directors consider that this segment represents a key part of the future strategy of the Group, and therefore merits separate disclosure.

Straightforward transparent bankingSecure Trust Bank PLC Annual Report & Accounts 2017
128
3. Operating segments continued
Funding costs and operating expenses are not aligned to operating segments for day to day management of the business, so they cannot be allocated on a reliable basis. Accordingly, profit by operating segment has not been disclosed.
All of the Group’s operations are conducted wholly within the United Kingdom and geographical information is therefore not presented.
4. Operating income
a) Net interest income2017
£million2016
£million
Cash and balances at central banks 0.4 0.6Loans and advances to banks 0.2 –Loans and advances to customers 140.7 118.2
Interest receivable and similar income 141.3 118.8
Deposits from customers (26.7) (26.3)
Interest expense and similar charges (26.7) (26.3)
Net interest income 114.6 92.5
The net interest income shown above excludes £8.0 million (2016: £22.3 million) of interest on loans and advances to customers in respect of discontinued operations, as shown in the income statement as set out on page 110.
b) Net fee and commission income2017
£million2016
£million
Fee and disbursement income 12.4 12.3Commission income 2.7 3.6Other income 0.9 0.4
Fee and commission income 16.0 16.3
Other expenses (1.1) (1.8)
Fee and commission expense (1.1) (1.8)
Net fee and commission income 14.9 14.5
Fees and commissions income consists principally of the following:
• weekly and monthly fees from the OneBill product;
• associated insurance commissions and commissions earned on debt collection activities in DMS;
• discounting, service and arrangement fees in Commercial Finance; and
• account management and administration fees from retailers in Retail Finance.
Fee and commission expenses consist primarily of fees payable in respect of Motor Finance.
Notes to the consolidated financial statementscontinued

Strategic Report Corporate Governance Report
Financial Statements
129www.securetrustbank.co.uk
5. Operating expenses
Continuing 2017
£million
Discontinued2017
£million
Total2017
£million
Continuing2016
£million
Discontinued2016
£million
Total2016
£million
Staff costs, including those of directors: Wages and salaries 33.8 0.3 34.1 31.5 3.5 35.0Social security costs 4.2 – 4.2 3.1 0.3 3.4Pension costs 1.2 – 1.2 0.9 0.2 1.1Share based payment transactions (0.2) – (0.2) (0.5) – (0.5)
Depreciation of property, plant and equipment (Note 15) 0.8 – 0.8 0.6 – 0.6Amortisation of intangible assets (Note 16) 2.0 – 2.0 1.6 – 1.6Operating lease rentals 1.5 – 1.5 1.6 0.3 1.9Other administrative expenses 28.0 – 28.0 25.5 2.9 28.4
Total operating expenses 71.3 0.3 71.6 64.3 7.2 71.5
As described in Note 3, operating expenses are not aligned to operating segments for day to day management of the business, so they cannot be allocated on a reliable basis. Accordingly, discontinued operating expenses above relates only to those costs that are directly attributable to the discontinued business.
Remuneration of the auditor and its associates, excluding VAT, was as follows:
2017£’000
2016£’000
Fees payable to the Company’s auditor for the audit of the Company’s annual accounts 270 149Fees payable to the Company’s auditor for other services:The audit of the Company’s subsidiaries, pursuant to legislation 68 63Audit related assurance services 100 13Other assurance services 62 521All other non-audit services 39 15
539 761
Other assurance services related to the half year review (2016: related to reporting accountant work in respect of the Main Market listing).
All other non-audit services related to profit certification, work relating to entry into the Term Funding Scheme and advice on a potential corporate acquisition (2016: related to profit certification and work relating to entry into the Funding for Lending Scheme).
6. Average number of employees2017
Number2016
Number
Directors 8 6Management 116 101Administration 610 590
734 697
The prior year figures above include employees of ELG for the period of ownership by the Group.

Straightforward transparent bankingSecure Trust Bank PLC Annual Report & Accounts 2017
130
7. Income tax expense
Continuing operations
2017£million
Discontinued operations
2017£million
Total2017
£million
Continuing operations
2016£million
Discontinued operations
2016£million
Total2016
£million
Current taxationCorporation tax charge – current year 5.5 0.8 6.3 3.1 1.7 4.8Corporation tax charge – adjustments in respect of prior years – – – 1.8 – 1.8
5.5 0.8 6.3 4.9 1.7 6.6
Deferred taxationDeferred tax charge – current year (0.5) – (0.5) – (0.1) (0.1)Deferred tax charge – adjustments in respect of prior years 0.1 – 0.1 0.3 – 0.3
(0.4) – (0.4) 0.3 (0.1) 0.2
Income tax expense 5.1 0.8 5.9 5.2 1.6 6.8
Tax reconciliationProfit before tax 25.0 4.3 29.3 19.4 8.1 27.5
Tax at 19.25% (2016: 20.0%) 4.8 0.8 5.6 3.9 1.6 5.5Permanent differences 0.2 – 0.2 (0.8) – (0.8)Prior period adjustments 0.1 – 0.1 2.1 – 2.1
Income tax expense for the year 5.1 0.8 5.9 5.2 1.6 6.8
On 26 October 2015, the Government substantively enacted a reduction in the main rate of UK corporation tax from 20% to 19% (effective from 1 April 2017). Subsequently, a further reduction to 17% (effective 1 April 2020) was also substantively enacted on 6 September 2016. This will reduce the Company’s future current tax charge accordingly.
8. Earnings per ordinary share
BasicBasic earnings per ordinary share are calculated by dividing the profit attributable to equity holders of the parent by the weighted average number of ordinary shares as follows:
2017 2016
Profit attributable to equity holders of the parent (£ millions)Continuing operations 19.9 14.2Discontinued operations 3.9 123.3
23.8 137.5
Weighted average number of ordinary shares (number) 18,475,229 18,234,588
Notes to the consolidated financial statementscontinued

Strategic Report Corporate Governance Report
Financial Statements
131www.securetrustbank.co.uk
8. Earnings per ordinary share continued
DilutedDiluted earnings per ordinary share are calculated by dividing the profit attributable to equity holders of the parent by the weighted average number of ordinary shares in issue during the year, as noted above, as well as the number of dilutive share options in issue during the year, as follows:
2017 2016
Weighted average number of ordinary shares 18,475,229 18,234,588Number of dilutive shares in issue at the year end 219,007 130,200
Fully diluted weighted average number of ordinary shares 18,694,236 18,364,788
Dilutive shares being based on:Number of options outstanding at the year end 368,063 177,084Weighted average exercise price (pence) 799 720Average share price during the period (pence) 1,974 2,720
9. Loans and advances to banks
Group2017
£million
Group2016
£million
Company2017
£million
Company2016
£million
Placements with banks included in cash and cash equivalents (Note 27) 34.3 18.2 32.3 16.5
Included within loans and advances to banks are amounts placed with Arbuthnot Latham & Co., Limited, a related company prior to the sale of its controlling stake in the Group, of £5.0 million (31 December 2016: £5.0 million).
Moody’s long-term ratings are as follows:
Group2017
£million
Group2016
£million
Company2017
£million
Company2016
£million
A1 6.1 4.6 6.0 4.6A3 23.2 8.6 21.3 6.9Arbuthnot Latham & Co., Limited – No rating 5.0 5.0 5.0 5.0
34.3 18.2 32.3 16.5
None of the loans and advances to banks are either past due or impaired.
10. Loans and advances to customers
Group2017
£million
Group2016
£million
Company2017
£million
Company2016
£million
Gross loans and advances 1,638.2 1,349.4 1,605.4 1,316.9Less: allowances for impairment on loans and advances (Note 12) (39.9) (28.4) (39.9) (27.7)
1,598.3 1,321.0 1,565.5 1,289.2
Straightforward transparent bankingSecure Trust Bank PLC Annual Report & Accounts 2017
132
10. Loans and advances to customers continued
The Group has changed its policy on the charge-off of debt sold by Secure Trust Bank PLC to Debt Managers (Services) Limited. A description of this change in accounting policy is set out in Note 1.3, the effect of which is set out below:
31 December2017
£million
31 December2016
£million
Gross loans and advancesAs originally stated 1,381.5 994.9Restatement (32.1) (10.9)
As restated 1,349.4 984.0
Allowances for impairment on loans and advancesAs originally stated (60.5) (34.3)Restatement 32.1 10.9
As restated (28.4) (23.4)
The fair value of loans and advances to customers is shown in Note 34. For a maturity profile of loans and advances to customers, refer to Note 31.
Group and CompanyAt 31 December 2017 loans and advances to customers of £200.7 million were pre-positioned under the Bank of England’s Term Funding Scheme, which replaced the Funding For Lending Scheme during the year (see below), and were available for use as collateral within the scheme. At 31 December 2016 loans and advances to customers of £180.6 million were pre-positioned under the Bank of England’s Funding for Lending Scheme and were available for use as collateral within the scheme.
At 31 December 2016, £86.0 million of UK Treasury Bills were drawn under the Funding for Lending Scheme. During the period, these Treasury Bills were pledged as part of a sale and repurchase agreement with an original maturity period of six months. Monies arising as a result are disclosed in Note 20.
£597.3 million (2016: £451.0 million) of the loans are secured upon residential or commercial property and these are neither past due nor impaired. All portfolios of loans secured are at an initial loan to value ratio of less than 85%. All property valuations at loan inception, and the majority of development stage valuations, are performed by independent Chartered Surveyors, who perform their work in accordance with the Royal Institution of Chartered Surveyors Valuation – Professional Standards.
Group£2.5 million (2016: £2.9 million) of collateral is held from RentSmart, against loans of £17.2 million (2016: £18.7 million). This collateral is included in trade payables at 31 December 2017. This is based upon the balance of customer receivables and expected new agreements during the following month.
Notes to the consolidated financial statementscontinued

Strategic Report Corporate Governance Report
Financial Statements
133www.securetrustbank.co.uk
11. Finance lease receivables
Loans and advances to customers include finance lease receivables as follows:
Group2017
£million
Group2016
£million
Company2017
£million
Company2016
£million
Gross investment in finance lease receivables: – No later than 1 year 189.9 163.5 180.7 151.7– Later than 1 year and no later than 5 years 374.2 347.0 367.7 338.9– Later than 5 years 1.2 1.5 1.2 1.5
565.3 512.0 549.6 492.1Unearned future finance income on finance leases (162.5) (151.2) (158.4) (146.2)
Net investment in finance leases 402.8 360.8 391.2 345.9
The net investment in finance leases may be analysed as follows: – No later than 1 year 117.5 98.0 111.3 89.9– Later than 1 year and no later than 5 years 284.2 261.5 278.8 254.7– Later than 5 years 1.1 1.3 1.1 1.3
402.8 360.8 391.2 345.9
12. Allowances for impairment of loans and advances
Group
Individual provision
£million
Collective provision
£million
Total provision
£million
Gross loans and receivables
£million
Provision cover
%
Year ended 31 December 2017Business Finance
Real Estate Finance – 0.3 0.3 581.1 0.1%Asset Finance 1.0 0.2 1.2 117.9 1.0%Commercial Finance 0.4 0.2 0.6 127.1 0.5%
Consumer Finance Motor Finance
Voluntary termination provision 1.0 – 1.0Other impairment 23.3 2.6 25.9
24.3 2.6 26.9 301.5 8.9%Retail Finance 6.5 1.1 7.6 459.9 1.7%
Consumer Mortgages – – – 16.5 0.0%Other 3.3 – 3.3 34.2 9.6%
35.5 4.4 39.9 1,638.2 2.4%

Straightforward transparent bankingSecure Trust Bank PLC Annual Report & Accounts 2017
134
12. Allowances for impairment of loans and advances continued
Individual provision
£million
Collective provision
£million
Total provision
£million
Gross loans and receivables
£million
Provision cover
%
Year ended 31 December 2016Business Finance
Real Estate Finance – 0.5 0.5 451.5 0.1%Asset Finance 0.4 0.1 0.5 117.7 0.4%Commercial Finance 0.4 0.1 0.5 63.3 0.8%
Consumer FinancePersonal Lending 3.5 0.7 4.2 69.7 6.0%Motor Finance
Voluntary termination provision 0.6 – 0.6Other impairment 10.0 3.0 13.0
10.6 3.0 13.6 249.8 5.4%Retail Finance 4.0 0.9 4.9 330.8 1.5%
Other 4.2 – 4.2 66.6 6.3%
23.1 5.3 28.4 1,349.4 2.1%
Provisions included in ‘Other’ are in respect of various legacy products. This segment also includes loans of £17.2 million (2016: £18.7 million) held in STB Leasing Limited. The credit risk associated with those loans is retained by its partner, RentSmart. Accordingly, no provision is held against the RentSmart loans.
The Group net impairment losses disclosed in the income statement can be analysed as follows:
2017£million
2016£million
Individual provision: charge for impairment losses 36.4 25.1Collective provision: charge for impairment losses (0.4) 3.3Loans written off, net of amounts utilised 1.4 1.2Recoveries of loans written off (0.5) (1.9)
36.9 27.7Less Personal Lending (3.4) (4.4)
33.5 23.3
Notes to the consolidated financial statementscontinued

Strategic Report Corporate Governance Report
Financial Statements
135www.securetrustbank.co.uk
12. Allowances for impairment of loans and advances continued
A reconciliation of the allowance accounts for losses on loans and advances is as follows:
2017£million
2016£million
Individual allowances for impairmentAt 1 January 23.1 21.4Charge for impairment losses 36.4 25.1Amounts utilised (13.5) (10.7)Changes to presentation in respect of debt sales (3.6) (12.7)Sale of Personal Lending (6.9) –
At 31 December 35.5 23.1
Collective allowances for impairmentAt 1 January 5.3 2.0Charge for impairment losses (0.4) 3.3Sale of Personal Lending (0.5) –
At 31 December 4.4 5.3
Total allowances for impairment 39.9 28.4
Loans and advances to customers can be further summarised as follows:
2017£million
2017%
2016£million
2016%
Neither past due nor impaired 1,545.6 94.3% 1,268.7 94.1%Not past due but impaired 5.4 0.3% 0.6 0.0%Past due but not impaired 0.3 0.0% 12.4 0.9%Past due up to 90 days and impaired 37.8 2.3% 37.4 2.8%Past due after 90 days and impaired 49.1 3.0% 30.3 2.2%
Gross 1,638.2 100.0% 1,349.4 100.0%Less: allowance for impairment (39.9) (28.4)
Net 1,598.3 1,321.0
Gross amounts of loans and advances to customers that were past due up to 90 days and impaired were as follows:
2017£million
2016£million
Past due up to 30 days 24.5 24.4Past due 30 – 60 days 8.6 7.9Past due 60 – 90 days 4.7 5.1
Total 37.8 37.4
During the period, the methodology used to derive the above analyses of loans and advances to customers, categorising them into past due banding, was enhanced. Accordingly, the comparatives as at 31 December 2016 have been re-presented on this basis.

Straightforward transparent bankingSecure Trust Bank PLC Annual Report & Accounts 2017
136
12. Allowances for impairment of loans and advances continued
Gross amounts of loans and advances to customers that were past due but not impaired were as follows:
2017£million
2016£million
Past due up to 30 days 0.2 4.6Past due 30 – 60 days 0.1 7.8
Total 0.3 12.4
Company
Individual provision
£million
Collective provision
£million
Total provision
£million
Gross loans and receivables
£million
Provision cover
%
Year ended 31 December 2017Business Finance
Real Estate Finance – 0.3 0.3 581.1 0.1%Asset Finance 1.0 0.2 1.2 117.9 1.0%Commercial Finance 0.4 0.2 0.6 124.8 0.5%
Consumer Finance Motor Finance
Voluntary termination provision 1.0 – 1.0Other impairment 23.3 2.6 25.9
24.3 2.6 26.9 301.5 8.9%Retail Finance 6.5 1.1 7.6 459.9 1.7%
Consumer Mortgages – – – 16.5 0.0%Other 3.3 – 3.3 3.7 89.2%
35.5 4.4 39.9 1,605.4 2.5%
Individual provision
£million
Collective provision
£million
Total provision
£million
Gross loans and receivables
£million
Provision cover
%
Year ended 31 December 2016Business Finance
Real Estate Finance – 0.5 0.5 451.5 0.1%Asset Finance 0.4 0.1 0.5 117.7 0.4%Commercial Finance 0.4 0.1 0.5 63.3 0.8%
Consumer FinancePersonal Lending 3.5 0.7 4.2 69.7 6.0%Motor Finance
Voluntary termination provision 0.6 – 0.6Other impairment 10.0 1.6 11.6
10.6 1.6 12.2 248.4 4.9%Retail Finance 4.0 0.9 4.9 330.8 1.5%
Other 3.5 1.4 4.9 35.5 13.8%
22.4 5.3 27.7 1,316.9 2.1%
Notes to the consolidated financial statementscontinued

Strategic Report Corporate Governance Report
Financial Statements
137www.securetrustbank.co.uk
12. Allowances for impairment of loans and advances continued
The Company net impairment losses included in the income statement can be analysed as follows:
2017£million
2016£million
Individual provision: Charge for impairment losses 38.8 21.4Collective provision: Charge for impairment losses (0.4) 3.2Loans written off, net of amounts utilised 1.4 0.9Recoveries of loans written off (0.5) (0.3)Profit on sale of debt (0.3) (1.0)
39.0 24.2Less Personal Lending (3.4) (4.4)
35.6 19.8
A reconciliation of the allowance accounts for losses on loans and advances is as follows:
2017£million
2016£million
Individual allowances for impairmentAt 1 January 22.4 18.5Charge for impairment losses 38.8 25.8Utilised (13.5) (8.5)Release of allowance for impairment on the sale of debt (5.3) (13.4)Sale of Personal Lending (6.9) –
At 31 December 35.5 22.4
Collective allowances for impairmentAt 1 January 5.3 2.0Charge for impairment losses (0.4) 3.3Sale of Personal Lending (0.5) –
At 31 December 4.4 5.3
Total allowances for impairment 39.9 27.7
Loans and advances to customers can be further summarised as follows:
2017£million
2017%
2016£million
2016%
Neither past due nor impaired 1,529.0 95.3% 1,250.2 95.0%Not past due but impaired 5.4 0.3% 0.6 0.0%Past due but not impaired – 0.0% 12.4 0.9%Past due up to 90 days and impaired 37.5 2.3% 37.2 2.8%Past due after 90 days and impaired 33.5 2.1% 16.5 1.3%
Gross 1,605.4 100.0% 1,316.9 100.0%Less: allowance for impairment (39.9) (27.7)
Net 1,565.5 1,289.2

Straightforward transparent bankingSecure Trust Bank PLC Annual Report & Accounts 2017
138
12. Allowances for impairment of loans and advances continued
Gross amounts of loans and advances to customers that were past due up to 90 days and impaired were as follows:
2017£million
2016£million
Past due up to 30 days 24.4 24.2Past due 30 – 60 days 8.5 7.9Past due 60 – 90 days 4.6 5.1
Total 37.5 37.2
During the period, the methodology used to derive the above analyses of loans and advances to customers, categorising them into past due banding, was enhanced. Accordingly, the comparatives as at 31 December 2016 have been re-presented on this basis.
Gross amounts of loans and advances to customers that were past due but not impaired were as follows:
2017£million
2016£million
Past due up to 30 days – 4.6Past due 30 – 60 days – 7.8
Total – 12.4
The impairment provision calculation is based on the individual past-due status of each loan.
Group and CompanyInterest income on loans classified as impaired totalled £2.6 million (2016: £6.4 million).
13. Debt securities held-to-maturity
Debt securities of £5.0 million (2016: £20.0 million) represent UK Treasury Bills. The Company’s intention is to hold them to maturity and, therefore, they are stated in the statement of financial position at amortised cost.
All of the debt securities held-to-maturity had a rating agency designation at 31 December 2017, based on Moody’s long-term ratings of Aa2 (2016: Aa1. Moody’s downgraded the UK credit rating in September 2017). None of the debt securities held-to-maturity are either past due or impaired.
14. Equity instruments available-for-sale
On 13 April 2016, as part of the sale of ELG to NSF, the Group acquired 23,529,412 shares in NSF at a cost of 69.25 pence per share. This equity instrument was considered to be available-for-sale, and therefore fair value changes on the available-for-sale securities were recognised directly in other comprehensive income and equity (‘AFS’ reserve).
In May 2017, the shares were sold at an average price of 71 pence, realizing a profit of £343,000. The AFS reserve balance of £2.8 million, which had arisen due to previous movements in the NSF share price, was reclassified from other comprehensive income to the income statement.
Notes to the consolidated financial statementscontinued

Strategic Report Corporate Governance Report
Financial Statements
139www.securetrustbank.co.uk
15. Property, plant and equipment
Group
Freehold land and
buildings £million
Computer and other
equipment £million
Total £million
Cost or valuation At 1 January 2016 7.1 10.1 17.2Additions 1.4 1.1 2.5Disposals – (0.3) (0.3)Revaluation 0.5 – 0.5
At 31 December 2016 9.0 10.9 19.9
Additions – 0.8 0.8
At 31 December 2017 9.0 11.7 20.7
Accumulated depreciation At 1 January 2016 (0.6) (8.1) (8.7)Depreciation charge (0.1) (0.5) (0.6)Disposals – 0.1 0.1Revaluation 0.7 – 0.7
At 31 December 2016 – (8.5) (8.5)
Depreciation charge (0.1) (0.7) (0.8)Revaluation 0.1 – 0.1
At 31 December 2017 – (9.2) (9.2)
Net book amount
At 31 December 2016 9.0 2.4 11.4
At 31 December 2017 9.0 2.5 11.5

Straightforward transparent bankingSecure Trust Bank PLC Annual Report & Accounts 2017
140
15. Property, plant and equipment continued
Company
Freehold property £million
Computer and other
equipment £million
Total £million
Cost or valuation At 1 January 2016 2.7 9.5 12.2Additions 1.4 0.6 2.0Disposals – (0.3) (0.3)Revaluation 0.5 – 0.5
At 31 December 2016 4.6 9.8 14.4
Additions – 0.3 0.3
At 31 December 2017 4.6 10.1 14.7
Accumulated depreciation At 1 January 2016 – (8.0) (8.0)Depreciation charge (0.1) (0.3) (0.4)Disposals – 0.1 0.1Revaluation 0.1 – 0.1
At 31 December 2016 – (8.2) (8.2)
Depreciation charge – (0.4) (0.4)
At 31 December 2017 – (8.6) (8.6)
Net book amount –
At 31 December 2016 4.6 1.6 6.2
At 31 December 2017 4.6 1.5 6.1
The Group’s freehold properties comprise:
• the Registered Office of the Company, which is fully utilised for the Group’s own purposes;
• Secure Trust House, Boston Drive, Bourne End, SL8 5YS, the majority of which up to the sale of ELG, was also used for the Group’s own purposes. Since the sale, it is only partially used for the Group’s own purposes; and
• 25 and 26 Neptune Court, Vanguard Way, Cardiff, CF24 5PJ, the majority of which is used for the Group’s own purposes.
The directors have assessed the value of the Group’s freehold property at the year end through comparison to current rental yields on similar properties in the same area and an increase in the fair value of freehold property has been recognised and its carrying value has been adjusted accordingly. Changes in the fair value of freehold property are recognised in other comprehensive income, to the extent that any reductions do not exceed the initial increase.
The carrying value of freehold land which is included in the total carrying value of freehold land and buildings and which is not depreciated is £1.9 million (2016: £1.9 million).
Notes to the consolidated financial statementscontinued

Strategic Report Corporate Governance Report
Financial Statements
141www.securetrustbank.co.uk
15. Property, plant and equipment continued
The historical cost of freehold property included at valuation is as follows:
Group 2017
£million
Group 2016
£million
Company 2017
£million
Company 2016
£million
Cost 7.9 7.9 4.1 4.1Accumulated depreciation (1.5) (1.4) (0.1) (0.1)
6.4 6.5 4.0 4.0
16. Intangible assets
Group
Goodwill £million
Computer software £million
Other intangible
assets£million
Total £million
Cost or valuation At 1 January 2016 1.0 9.3 2.2 12.5Additions – 3.6 – 3.6
At 31 December 2016 1.0 12.9 2.2 16.1
Additions – 3.3 0.1 3.4
At 31 December 2017 1.0 16.2 2.3 19.5
Accumulated amortisationAt 1 January 2016 – (4.8) (0.7) (5.5)Amortisation charge – (1.3) (0.3) (1.6)
At 31 December 2016 – (6.1) (1.0) (7.1)
Amortisation charge – (1.8) (0.2) (2.0)
At 31 December 2017 – (7.9) (1.2) (9.1)
Net book amount
At 31 December 2016 1.0 6.8 1.2 9.0
At 31 December 2017 1.0 8.3 1.1 10.4
Goodwill above relates to the following cash generating units, which are part of the Retail Finance operating segment:
2017£million
2016£million
Music business 0.3 0.3V12 0.7 0.7
Total 1.0 1.0

Straightforward transparent bankingSecure Trust Bank PLC Annual Report & Accounts 2017
142
16. Intangible assets continued
The recoverable amount of these cash generating units are determined on a value in use calculation which uses cash flow projections based on financial forecasts covering a three year period, and a discount rate of 8%. Cash flow projections during the forecast period are based on the expected rate of new business. A zero growth based scenario is also considered. The directors believe that any reasonably possible change in the key assumptions on which recoverable amount is based would not cause the aggregate carrying amount to exceed the aggregate recoverable amount of the cash-generating unit.
Other intangible assets were recognised as part of the V12 Finance Group acquisition. These were recorded at fair value, and are being amortised as follows:
Years
IT system 5Distribution channel 10Brand name 5
Company
Goodwill £million
Computer software £million
Total £million
Cost or valuation At 1 January 2016 0.3 5.5 5.8Additions – 3.5 3.5
At 31 December 2016 0.3 9.0 9.3
Additions – 3.3 3.3
At 31 December 2017 0.3 12.3 12.6
Accumulated amortisationAt 1 January 2016 – (2.6) (2.6)Amortisation charge – (0.5) (0.5)
At 31 December 2016 – (3.1) (3.1)
Amortisation charge – (1.0) (1.0)
At 31 December 2017 – (4.1) (4.1)
Net book amount
At 31 December 2016 0.3 5.9 6.2
At 31 December 2017 0.3 8.2 8.5
Goodwill above relates to the music business cash generating unit, which is part of the Retail Finance operating segment. The recoverable amount is determined on the same basis as for the Group.
Notes to the consolidated financial statementscontinued

Strategic Report Corporate Governance Report
Financial Statements
143www.securetrustbank.co.uk
17. Investments
Company
Shares at cost
£million
Impairment provisions
£million
Net investments
£million
At 31 December 2016, 1 January 2017 and 31 December 2017 3.7 – 3.7
Shares in subsidiary undertakings of Secure Trust Bank PLC at 31 December 2017 are stated at cost less any provision for impairment. All subsidiary undertakings are unlisted and none are banking institutions. The subsidiary undertakings were all incorporated in the UK and wholly owned via ordinary shares. All subsidiary undertakings are included in the consolidated financial statements and have an accounting reference date of 31 December.
Details are as follows:
Principal activity
Owned directlyDebt Managers (Services) Limited Debt collection companySecure Homes Services Limited Property rentalSTB Leasing Limited LeasingV12 Finance Group Limited Holding company
Owned indirectly via intermediate holding companiesV12 Personal Finance Limited DormantV12 Retail Finance Limited Sourcing and servicing of unsecured loans
The registered office of the Company, and all subsidiary undertakings, is One Arleston Way, Shirley, Solihull, West Midlands, B90 4LH.
The following subsidiaries were sold to NSF on 13 April 2016:
Principal activity
Owned directlyEveryday Loans Holdings Limited Holding company
Owned indirectly via intermediate holding companies Everyday Loans Limited Sourcing and servicing of unsecured and secured loansEveryday Lending Limited Provider of unsecured and secured loans

Straightforward transparent bankingSecure Trust Bank PLC Annual Report & Accounts 2017
144
18. Deferred taxation
Group 2017
£million
Group 2016
£million
Company 2017
£million
Company 2016
£million
Deferred tax liabilities: Unrealised surplus on revaluation of freehold property (0.2) (0.2) – –Other short term timing differences 0.2 – – –
Deferred tax liabilities – (0.2) – –
Deferred tax assets:Other short term timing differences 0.6 – 0.6 0.1
Deferred tax assets 0.6 – 0.6 0.1
Deferred tax liabilities:At 1 January (0.2) – – –Income statement 0.2 – – –Other comprehensive income – (0.2) – –
At 31 December – (0.2) – –
Deferred tax assets:At 1 January – 0.3 0.1 0.6Income statement 0.2 (0.3) 0.1 (0.4)Other comprehensive income 0.4 – 0.4 (0.1)
At 31 December 0.6 – 0.6 0.1
On 26 October 2015, the Government substantively enacted a reduction in the main rate of UK corporation tax from 20% to 19% (effective from 1 April 2017). Subsequently, a further reduction to 17% (effective 1 April 2020) was also substantively enacted on 6 September 2016. This will reduce the Company’s future current tax charge accordingly. Deferred tax has been calculated based on the enacted rates to the extent that the related temporary or timing differences are expected to reverse in the future periods.
19. Other assets
Group 2017
£million
Group 2016
£million
Company 2017
£million
Company 2016
£million
Other receivables 1.2 0.7 1.0 0.6Amounts due from related companies – – 29.7 31.2Prepayments and accrued income 4.2 4.2 2.5 3.5
5.4 4.9 33.2 35.3
Notes to the consolidated financial statementscontinued

Strategic Report Corporate Governance Report
Financial Statements
145www.securetrustbank.co.uk
20. Due to banks
Group 2017
£million
Group 2016
£million
Company 2017
£million
Company 2016
£million
Amounts due to other credit institutions 113.0 70.0 113.0 70.0
Amounts due to banks for the current year represent monies arising from drawings under the Term Funding Scheme. These are due for repayment between May 2021 and November 2021.
Amounts due to banks in the prior year represented monies arising from the sale and repurchase of drawings under the Funding for Lending Scheme, which were repaid during 2017.
21. Deposits from customers
Group and Company2017
£million2016
£million
Current/demand accounts 14.5 15.2Term deposits 1,468.7 1,136.6
1,483.2 1,151.8
For a maturity profile of deposits from customers, refer to Notes 30 and 32.
22. Other liabilities
Group 2017
£million
Group 2016
£million
Company 2017
£million
Company 2016
£million
Other payables 29.5 21.2 24.5 17.5Amounts due to related companies – – 9.7 13.2Accruals and deferred income 12.4 27.8 10.2 26.3
41.9 49.0 44.4 57.0
Financial Services Compensation Scheme LevyThe liability for the Financial Services Compensation Scheme levy is included in accruals and deferred income of both Group and Company.
In common with all regulated UK deposit takers, the Company pays a levy to the Financial Services Compensation Scheme to enable it to meet claims against it. The levy consists of a compensation levy which covers the amount of compensation and a management expenses levy, which covers the costs of running the scheme and interest associated with compensation which the scheme pays.
The Company’s Financial Services Compensation Scheme provision reflects market participation up to the reporting date and the accrual of £0.2 million (2016: £0.3 million) relates to the levy for the scheme year 2017/18 which is payable in September 2018. This amount was calculated on the basis of the Company’s share of protected deposits and the Financial Services Compensation Scheme’s estimate of total interest levies payable for each scheme year.

Straightforward transparent bankingSecure Trust Bank PLC Annual Report & Accounts 2017
146
23. Provisions for liabilities and charges
2017Customer
redress£million
2017Fraud
£million
2017Total
£million
2016Customer
redress£million
Balance at 1 January 1.3 – 1.3 2.0Charged to income statement 0.4 0.2 0.6 0.4Utilised (0.5) – (0.5) (1.1)
Balance at 31 December 1.2 0.2 1.4 1.3
Customer redress provisionThe Group provides for its best estimate of redress payable in respect of historical sales of accident, sickness and unemployment insurance, by considering the likely future uphold rate for claims, in the context of confirmed issues and historical experience. The likelihood of potential new claims is projected forward to 2019, as management believe this to be an appropriate time horizon, recognising the significant decline in recent claims experience and the increasing subjectivity beyond that. The accuracy of these estimates would be affected, were there to be a significant change in either the number of future claims or, the incidence of claims upheld by the Financial Ombudsman Service.
The Financial Conduct Authority has announced a deadline for making these customer redress claims, which would give consumers until 29 August 2019 to make a claim.
FraudThe fraud provision relates to cases where the Bank has reasonable evidence of suspected fraud, but further investigation is required before the cases can be dealt with appropriately.
24. Contingent liabilities and commitmentsContingent liabilitiesAs a financial services business, the Group must comply with numerous laws and regulations, which significantly affect the way it does business. Whilst the Group believes there are no material unidentified areas of failure to comply with these laws and regulations, there can be no guarantee that all issues have been identified.
Capital commitmentsAt 31 December 2017, the Group had no capital commitments (2016: £nil).
The Company had no capital commitments (2016: £nil).
Credit commitmentsSee Note 29 for details of the Group and Company commitments to extend credit to customers.
Notes to the consolidated financial statementscontinued

Strategic Report Corporate Governance Report
Financial Statements
147www.securetrustbank.co.uk
24. Contingent liabilities and commitments continued
Operating lease commitmentsThe future aggregate lease payments for non-cancellable operating leases are as follows:
Group
2017Land and buildings
£million
2017Other
£million
2016Land and buildings
£million
2016Other
£million
Within 1 year 0.3 0.1 0.3 0.4Between 1 year and 5 years 0.8 0.1 0.9 0.1Over 5 years – – 0.1 –
1.1 0.2 1.3 0.5
Company
2017Land and buildings
£million
2017Other
£million
2016Land and buildings
£million
2016Other
£million
Within 1 year 0.1 0.1 0.1 0.3Between 1 year and 5 years 0.4 – 0.4 0.1Over 5 years – – 0.1 –
0.5 0.1 0.6 0.4
There are two leases classified as land and buildings in the Group (2016: four). Other leases include motor vehicles and computer hardware.
25. Share capital
2017Number of
shares
2017Ordinary
shares £million
2016Number of
share
2016Ordinary
shares £million
At start of year 18,475,229 7.4 18,191,894 7.3Shares issued during the year – – 283,335 0.1
At end of year 18,475,229 7.4 18,475,229 7.4
Share capital comprises ordinary shares with a par value of 40 pence each.
Straightforward transparent bankingSecure Trust Bank PLC Annual Report & Accounts 2017
148
26. Share based payments
At 31 December 2017, the Group had four share based payment schemes in operation:
• Share Option Scheme;
• 2017 Long Term Incentive Plan;
• 2017 Sharesave Scheme; and
• ‘Phantom’ Share Option Scheme.
In addition, the 2017 deferred bonus plan has been approved by shareholders but has not yet been launched.
A summary of the key details of each scheme is set out below:
Outstanding at the start of
the yearNumber
Granted during
the yearNumber
Forfeited during
the yearNumber
Outstanding at the end of
the yearNumber
Vested and exercisable
NumberVesting
Date
Exercise price
£
Equity settledShare Option Scheme 177,084 – – 177,084 177,084 2 November 2016 7.202017 Long Term Incentive Plan – 67,992 – 67,992 – 1 June 2020 0.402017 Sharesave Plan – 125,987 (40) 125,947 – 1 November 2020 13.19
177,084 193,979 (40) 371,023 177,084
Cash settled
‘Phantom’ Share Option Scheme 312,917 – – 312,917 – 16 March 2019 25.00
The Group and Company incurred an expense in relation to share based payments of £0.2 million (2016: credit of £0.5 million), as disclosed in Note 5.
Share Option SchemeOn 17 October 2011, the Group established the Share Option Scheme entitling three directors and certain senior employees to purchase shares in the Company.
On 2 November 2011, 934,998 share options were granted at an exercise price of £7.20 per share. Approximately half of the share options vested and were exercised on 2 November 2014, with the remainder vesting and becoming exercisable on 2 November 2016. The bulk of the remainder were exercised on 7 November 2016, leaving 177,084 share options of two directors unexercised at 31 December 2016. Vested options are exercisable for a period of 10 years from the date of grant.
The number of unexercised share options as at 31 December 2017 remains unchanged from the position as at 31 December 2016. The intrinsic value of unexercised options is £1.8 million (2016: £2.5 million).
Notes to the consolidated financial statementscontinued

Strategic Report Corporate Governance Report
Financial Statements
149www.securetrustbank.co.uk
26. Share based payments continued
2017 Long Term Incentive PlanOn 3 May 2017, the Group established the 2017 Long Term Incentive Plan Scheme entitling two directors and certain other key senior employees to purchase shares in the Company.
The awards are subject to three performance conditions, which are based on:
• Annual compound growth in earnings per share (‘EPS’) over the performance period;
• Rank of the total shareholder return (‘TSR’) over the performance period against the TSR of the comparator group of peer group companies; and
• Maintaining appropriate risk practices over the performance period reflecting the longer term strategic risk management of the Group.
The awards will vest on the date on which the board determines that these conditions have been met.
The awards have a performance term of three years. Those awards granted to the Executive Directors are subject to a holding period of two years following the vesting date. Those awards not subject to a holding period will be released to the participants on the vesting date. Vested options are exercisable for a period of 10 years from the date of grant.
On 1 June 2017, 67,992 share options were granted at an exercise price of 40 pence per share. 33,467 share options are subject to a holding period of two years, whilst the remaining 34,525 share options are not subject to a holding period.
The original grant date valuation was determined to be £12.19 for those awards that are subject to a holding period, and £14.82 for those awards not subject to a holding period, using a Black-Scholes model for the EPS and risk management tranches, and a Monte Carlo model for the TSR tranche, and these valuations have been used in the calculation. Measurement inputs and assumptions used were as follows:
At grant date
Share price at grant date £22.45Expected dividend yield 3.80%
Awards subject to a holding periodExpected stock price volatility 24.6%Risk free interest rate 0.42%Average expected life (years) 5.00Discount for lack of marketability during holding period 10.00%
Awards not subject to a holding periodExpected stock price volatility 25.1%Risk free interest rate 0.19%Average expected life (years) 3.00
Assumptions applicable to TSR tranche onlyExpected stock price volatility 25.50%Grant date TSR performance of the Company compared to comparator group Below medianCorrelation 37%
Straightforward transparent bankingSecure Trust Bank PLC Annual Report & Accounts 2017
150
26. Share based payments continued
2017 Sharesave PlanOn 3 May 2017, the Group established the 2017 Sharesave Plan, entitling all eligible employees to purchase shares in the Company.
The 2017 Sharesave Plan allows employees with more than 12 months service to save for three years, subject to a maximum monthly amount of £500, with the option to buy shares in Secure Trust Bank PLC when the plan matures. Participants can not change the amount that they have agreed to save each month but they can suspend payments for up to six months. Participants can withdraw their savings at any time but, if they do this before the completion date, they lose the option to buy shares at the Option Price, and if participants cease to hold plan-related employment before the third anniversary of the grant date, then the options are also lost.
On 20 September 2017, 229 employees were granted 125,987 share options, at an exercise price of £13.19. The options will ordinarily vest on 1 November 2020 and be exercisable for a period of six months. At 31 December 2017, 228 employees with 125,947 share options remained in the 2017 Sharesave Plan.
The original grant date valuation was determined to be £3.53 per option, using a Black-Scholes model, and this valuation has been used in the calculation. Measurement inputs and assumptions used were as follows:
At grant date
Share price at grant date £17.51Expected stock price volatility 25.55%Expected dividend yield 4.34%Risk free interest rate 0.58%Average expected life (years) 3.36Expected cancellation rate 8.00%
Cash settled share based paymentsOn 16 March 2015, a four year ‘phantom’ share option scheme was established in order to provide effective long-term incentive to senior management of the Group. Under the scheme, no actual shares would be issued by the Company, but those granted awards under the scheme would be entitled to a cash payment. The amount of the award is calculated by reference to the increase in the value of an ordinary share in the Company over an initial value set at £25 per ordinary share, being the price at which the shares resulting from the exercise of the first tranche of share options under the Share Option Scheme were sold in November 2014.
As at 31 December 2017, 312,917 (2016: 312,917) share options remained outstanding. The options will vest on 16 March 2019, and be exercisable for a period of 10 years after grant date.
As at 31 December 2017, the estimated fair value has been prepared using the Black-Scholes model. Measurement inputs and assumptions used were as follows:
2017 2016
Share price at reporting date £17.97 £21.51Expected stock price volatility 24.49% 40.00%Expected dividend yield 4.45% 3.40%Risk free interest rate 0.59% 0.06%Average expected life (years) 4.03 1.84Fair value £0.79 £2.80
Notes to the consolidated financial statementscontinued

Strategic Report Corporate Governance Report
Financial Statements
151www.securetrustbank.co.uk
26. Share based payments continued
This resulted in the following being recognised in the financial statements:
2017£million
2016£million
Liability at 1 January 0.6 1.2Credit for the year (0.4) (0.6)
Liability at 31 December 0.2 0.6
27. Cash and cash equivalents
For the purposes of the statement of cash flows, cash and cash equivalents comprise the following balances with less than three months’ maturity from the date of acquisition.
Group 2017
£million
Group 2016
£million
Company 2017
£million
Company 2016
£million
Cash and balances at central banks 226.1 112.0 226.1 112.0Loans and advances to banks (Note 9) 34.3 18.2 32.3 16.5
260.4 130.2 258.4 128.5
28. Financial risk management strategy
By their nature, the Group’s activities are principally related to the use of financial instruments. The directors and senior management of the Group have formally adopted a Group risk appetite statement which sets out the Board’s attitude to risk and internal controls. Key risks identified by the directors are formally reviewed and assessed at least once a year by the Board, in addition to which key business risks are identified, evaluated and managed by operating management on an ongoing basis by means of procedures such as physical controls, credit and other authorisation limits and segregation of duties. The Board also receives regular reports on any risk matters that need to be brought to its attention. Significant risks identified in connection with the development of new activities are subject to consideration by the Board. There are budgeting procedures in place and reports are presented regularly to the Board detailing the results of each principal business unit, variances against budget and prior year, and other performance data.
A more detailed description of the risk governance structure is contained in the Strategic Report beginning on page 2.
The principal financial risks inherent in the Group’s business are credit risk (Note 29), market risk (Note 30), liquidity risk (Note 31), and capital risk (Note 32).

Straightforward transparent bankingSecure Trust Bank PLC Annual Report & Accounts 2017
152
29. Credit risk
The Company and Group take on exposure to credit risk, which is the risk that a counterparty will be unable to pay amounts in full when due. A formal Credit Risk Policy has been agreed by the Board whilst credit risk is monitored on a monthly basis by the Credit Risk Committees which review performance of key portfolios including new business volumes, collections performance, provisioning levels and provisioning methodology. A credit risk department within the Group monitors adherence to the Credit Risk Policy, implements risk tools to manage credit risk and evaluates business opportunities and the risks and opportunities they present to the Group whilst ensuring the performance of the Group’s existing portfolios is in line with expectations.
The Group structures the levels of credit risk it undertakes by placing limits on the amount of risk accepted in relation to individual borrowers or groups of borrowers. Such risks are monitored on a revolving basis and subject to an annual or more frequent review. The limits on the level of credit risk are approved periodically by the Board of Directors and actual exposures against limits monitored daily.
Impairment provisions are provided for losses that have been incurred at the statement of financial position date. Significant changes in the economy could result in losses that are different from those provided for at the statement of financial position date. Management therefore carefully manages its exposures to credit risk as they consider this to be the most significant risk to the business.
Exposure to Consumer Finance credit risk is managed through regular analysis of the ability of borrowers and potential borrowers to meet interest and capital repayment obligations and by changing these lending limits where appropriate. Exposure to credit risk is also managed in part by obtaining collateral, principally motor vehicles on Motor loans and a credit support balance provided by RentSmart. The assets undergo a scoring process to mitigate risk and are monitored by the Board.
For Real Estate Finance and Commercial Finance, lending decisions are made on an individual transaction basis, using expert judgement and assessment against criteria set out in the lending policies. Asset Finance lending is outsourced to Haydock, who operate in line with the Group’s credit policies and risk appetite. The loans are secured against the assets lent against (real estate, trade receivables and commercial plant and equipment, respectively). Disclosures relating to collateral and arrears on loans and advances to customers are disclosed in Notes 10 and 12 respectively.
The Board monitors the ratings of the counterparties in relation to the Group’s loans and advances to banks. Disclosures of these at the year end are contained in Note 9. There is no direct exposure to the Eurozone and peripheral Eurozone countries.
The maximum exposure to credit risk for the Company and the Group was as follows:
Group 2017
£million
Group 2016
£million
Company 2017
£million
Company 2016
£million
Cash and balances at central banks 226.1 112.0 226.1 112.0Loans and advances to banks 34.3 18.2 32.3 16.5Loan and advances to customers 1,598.3 1,321.0 1,565.5 1,289.2Debt securities held-to-maturity 5.0 20.0 5.0 20.0Other receivables 1.2 0.7 1.0 0.6Amounts due from related parties – – 29.7 31.2
Credit risk exposures relating to off-balance sheet assets are as follows:Loan commitments 178.6 178.0 178.5 177.8
At 31 December 2,043.5 1,649.9 2,038.1 1,647.3
The above table represents the maximum credit risk exposure (net of impairment) to the Company and Group at 31 December 2017 and 2016 without taking account of any collateral held or other credit enhancements attached. For on-balance sheet assets, the exposures are based on the net carrying amounts as reported in the statement of financial position.
Notes to the consolidated financial statementscontinued

Strategic Report Corporate Governance Report
Financial Statements
153www.securetrustbank.co.uk
29. Credit risk continued
Concentration riskManagement assesses the potential concentration risk from geographic, product and individual loan concentration. Due to the well diversified nature of the Group’s lending operations the directors do not consider there to be a material exposure arising from concentration risk. The increase in lending balances and loan commitments in the London region is principally due to the increase in Real Estate Finance activities during the year. The concentration by product and location of the Group and Company’s lending to customers and loan commitments are detailed below:
Loans and advances to customers Loan commitments
Group2017
£million2016
£million2017
£million2016
£million
Concentration by product: Business Finance:
Real Estate Finance 580.8 451.0 98.6 99.4Asset Finance 116.7 117.2 15.5 19.5Commercial Finance 126.5 62.8 35.5 28.9
Consumer Finance:Personal Lending – 65.5 – –Motor 274.6 236.2 0.6 0.6Retail 452.3 325.9 20.1 28.6
Consumer Mortgages 16.5 – 7.7 –Other 30.9 62.4 0.6 1.0
At 31 December 1,598.3 1,321.0 178.6 178.0
Concentration by region: East Anglia 142.0 113.1 25.4 19.7East Midlands 61.5 52.3 4.0 3.0London 528.0 415.3 76.6 61.3North East 44.5 37.4 1.0 2.2North West 152.0 120.8 25.4 17.0Northern Ireland 16.8 12.5 0.5 0.4Scotland 93.0 90.3 3.7 10.6South East 231.2 205.0 14.3 35.0South West 74.0 62.6 8.1 12.1Wales 53.5 46.8 1.8 4.2West Midlands 93.1 80.5 6.1 5.5Yorkshire and the Humber 88.1 69.1 4.5 3.9Overseas 20.6 15.3 7.2 3.1
At 31 December 1,598.3 1,321.0 178.6 178.0
The above table relates to the location of the borrower. The majority of the overseas borrowers are Real Estate Finance clients. All of the property secured against Real Estate Finance loans is based in the United Kingdom.

Straightforward transparent bankingSecure Trust Bank PLC Annual Report & Accounts 2017
154
29. Credit risk continued
Loans and advances to customers Loan commitments
Company2017
£million2016
£million2017
£million2016
£million
Concentration by product: Business Finance:
Real Estate Finance 580.8 451.0 98.6 99.4Asset Finance 116.7 117.2 15.5 19.5Commercial Finance 124.2 62.8 35.5 28.9
Consumer Finance:Personal Lending – 65.5 – –Motor 274.6 236.2 0.6 0.6Retail 452.3 325.9 20.1 28.6
Consumer Mortgages 16.5 – 7.7 –Other 0.4 30.6 0.5 0.8
At 31 December 1,565.5 1,289.2 178.5 177.8
Concentration by region:East Anglia 139.3 110.4 25.4 19.7East Midlands 59.6 50.1 4.0 3.0London 523.8 411.2 76.6 61.1North East 43.0 35.9 1.0 2.2North West 146.1 117.1 25.4 17.0Northern Ireland 16.2 11.9 0.5 0.4Scotland 90.1 87.1 3.7 10.6South East 227.1 200.6 14.3 35.0South West 71.8 60.3 8.1 12.1Wales 51.9 45.1 1.8 4.2West Midlands 90.4 77.8 6.0 5.5Yorkshire and the Humber 85.6 66.4 4.5 3.9Overseas 20.6 15.3 7.2 3.1
At 31 December 1,565.5 1,289.2 178.5 177.8
The above table relates to the location of the borrower. The majority of the overseas borrowers are Real Estate Finance clients. All of the property secured against Real Estate Finance loans is based in the United Kingdom.
Notes to the consolidated financial statementscontinued

Strategic Report Corporate Governance Report
Financial Statements
155www.securetrustbank.co.uk
29. Credit risk continued
ForbearanceAt year end, all customers within the Group’s Consumer Mortgage business were up to date with their monthly payments. Should customers face financial difficulties, the Group may, depending on individual circumstances, offer customers one of a number of forbearance options. The types of forbearance the Group may be prepared to offer include the following:
• Temporary interest only concessions are offered to customers in financial difficulty on a temporary basis with formal periodic review. The concession allows the customer to reduce monthly payments to cover interest only, and if made, the arrears status will not increase;
• Arrangement payment plans are agreed to enable customers to reduce their arrears balances by an agreed amount per month which is paid in addition to their standard monthly repayment;
• Payment concessions can be agreed on a temporary basis whereby the customer may pay less than the contractual monthly payment, in line with their individual affordability. If a customer is within this type of concession, their arrears position will increase; and
• In exceptional circumstances, capitalisations of arrears may occur or an interest rate adjustment may be applied. These are used under strict controls, explicitly where the customer circumstances offer no other option.
All forbearance arrangements are formally discussed and agreed with the customer. By offering customers in financial difficulty the option of forbearance the Group potentially exposes itself to an increased level of risk through prolonging the period of non-contractual payment and/or potentially placing the customer into a detrimental position at the end of the forbearance period.
All forbearance arrangements are reviewed and monitored regularly to assess the ongoing potential risk, suitability and sustainability to the Group.
Where forbearance measures are not possible or are considered not to be in the customer’s best interests, or where such measures have been tried and the customer has not adhered to the forbearance terms that have been agreed, the Bank will consider realising its security and taking possession of the property in order to sell it and clear the outstanding debt.
Other than Consumer Mortgages, the Group does not routinely reschedule contractual arrangements where customers default on their repayments. It may offer the customer the option to reduce or defer payments for a short period, in which cases the loan will retain the normal contractual payment due dates and will be treated the same as any other defaulting cases for impairment purposes. Arrears tracking will continue on the account with any impairment charge being based on the original contractual due dates for all products.
Implementation of IFRS 9 As detailed in note 1.2 the estimated adjustment (net of tax) of the adoption of IFRS 9 on the opening balance of the Group’s equity at 1 January 2018 is expected to be a reduction in the range of £22 million to £27 million. This represents:
• £nil related to the classification requirements (refer to (a) below for further information);
• An expected reduction in the range of £28 million to £34 million related to the impairment requirements (refer to (b) below for further information). This reduction is primarily attributable to Consumer Finance. The Business Finance portfolio is not expected to drive a material reduction; and
• An increase in the range of £6 million to £7 million related to associated deferred tax impacts.
The above are estimates and will not be finalised until all transition work has been completed.

Straightforward transparent bankingSecure Trust Bank PLC Annual Report & Accounts 2017
156
29. Credit risk continued
a) Classification of financial instruments IFRS 9 contains three primary measurement categories for financial assets; ‘amortised cost’, ‘fair value through other comprehensive income (FVOCI)’ and ‘fair value through profit and loss (FVTPL)’. The IAS 39 categories ‘held-to-maturity’, ‘available-for-sale’ and ‘loans and receivables’ will be eliminated. A financial asset will be measured at amortised cost if both the following conditions are met and it has not been designated as at FVTPL:
• the asset is held within a business model whose objective is to hold the asset to collect its contractual cash flows; and
• the contractual terms of the financial asset give rise to cash flows on specified dates that represent payments of solely principal and interest on the outstanding principal amount.
A debt instrument would be measured at FVOCI only if both the below conditions are met and it has not been designated as FVTPL:
• the asset is held within a business model whose objective is achieved by both collecting its contractual cash flows and selling the financial asset; and
• the contractual terms of the financial asset give rise to cash flows on specified dates that represent payments of solely principal and interest on the outstanding principal amount.
On initial recognition of an equity investment that is not held for trading, the Group may irrevocably elect to present subsequent changes in fair value in OCI. This election will be made on an investment by investment basis.
All other assets will be classified as FVTPL.
Impact assessmentAs detailed below IFRS 9 will have minimal impact on the classification of financial assets held as at 1 January 2018:
• The Group’s cash and balances at central banks, loans and advances to banks and customers, debt securities held-to-maturity and other financial assets will be classified as amortised cost. This is consistent with their current IAS 39 classification; and
• The Group held no financial instruments that would be classified as FVOCI or FVTPL at 1 January 2018.
b) Impairment of financial assets and loan commitmentsIFRS 9 replaces the incurred loss impairment model within IAS 39 with a forward looking expected loss model. The Group will recognise loss allowances for expected credit losses on all financial assets carried at amortised cost, including lease receivables and loan commitments.
Credit loss allowances will be measured as an amount equal to lifetime ECL, except for the following, for which they will be measured as 12 month ECL:
• Financial assets determined to have low credit risk at the reporting date;
• Financial assets which have not experienced a significant increase in credit risk since their initial recognition; and
• Financial assets which have experienced a significant increase in credit risk since their initial recognition but have subsequently met the Group’s cure policy, as set out below.
A financial asset will be considered to have low credit risk when its credit risk rating is equivalent to the widely understood definition of ‘investment grade’ assets. The Group expects all its debt securities, which represent UK Treasury bills, and loans held in STB Leasing Limited, for which credit risk is retained by its partner RentSmart, to be low credit risk.
Lifetime ECL is the ECL that results from all possible default events over the expected life of a financial asset. Further detail regarding the measurement of ECL is set out below.
12 month ECL is the portion of lifetime ECL that results from default events on a financial asset that are expected within 12 months after the reporting date.
Notes to the consolidated financial statementscontinued

Strategic Report Corporate Governance Report
Financial Statements
157www.securetrustbank.co.uk
29. Credit risk continued
Measurement of ECLECL’s are probability weighted estimates of credit losses which will be measured as the present value of all cash shortfalls. Specifically, this is the difference between the contractual cash flows due and the cash flows expected to be received, discounted at the original effective interest rate (or for portfolios purchased outside of the Group by Debt Managers (Services) Limited the credit adjusted effective interest rate). For undrawn loan commitments ECL will be measured as the difference between the contractual cash flows due if the commitment is drawn and the cash flows expected to be received.
Significant increase in credit riskFor Consumer Finance, the credit risk of a financial asset will be considered to have experienced a significant increase in credit risk since initial recognition where there has been a significant increase in the remaining lifetime probability of default of the asset. The Group may also use its expert credit judgement and where possible relevant historical and current performance data, including bureau data to determine that an exposure has undergone a significant increase in credit risk.
For Business Finance, the credit risk of a financial asset will be considered to have experienced a significant increase in credit risk where certain early warning indicators apply (e.g. cost over runs, timing delays, notification of county court judgements etc.).
As a backstop, the Group will consider that a significant increase in credit risk occurs no later than when an asset is more than 30 days past due for all portfolios.
The credit risk of a financial asset may improve such that it is no longer considered to have experienced a significant increase in credit risk if it meets the Group’s cure policy.
Cure policyThe Group’s cure policy will require sufficient payments to be made to bring an account back within less than 30 days past due and for such payments to be maintained for six consecutive months. For the Real Estate Finance portfolio payments would need to be maintained for 12 consecutive months.
Definition of default/credit impaired financial assetsAt each reporting date, the Group will assess whether financial assets carried at amortised cost are credit impaired. A financial asset will be considered to be credit impaired when an event(s) that has a detrimental impact on estimated future cash flows have occurred. Evidence that a financial asset is credit impaired includes the following observable data:
• Initiation of bankruptcy proceedings;
• Notification of bereavement;
• Identification of loan meeting debt sale criteria; or
• Initiation of repossession proceedings.
In addition, a loan that is 90 days or more past due will be considered credit impaired for all portfolios. The credit risk of financial assets that become credit impaired are not expected to improve such that they are no longer considered credit impaired.
Modified financial assetsA customer’s account may be modified to assist customers who are in or have recently overcome financial difficulties and have demonstrated both the ability and willingness to meet the current or modified loan contractual payments. Where the terms of a financial asset have been modified and the modification has not resulted in derecognition, the expected cash flows arising from the modified financial asset are included in calculating any cash shortfalls from the existing asset.

Straightforward transparent bankingSecure Trust Bank PLC Annual Report & Accounts 2017
158
29. Credit risk continued
Inputs in to measurement of ECL The key inputs in to the measurement of expected credit loss will be:
• Probability of default (PD);
• Exposure at default (EAD); and
• Loss given default (LGD).
These variables will be derived from internally developed statistical models and historical data, adjusted to reflect forward looking information.
Probability of default and credit risk gradesCredit risk grades will be a primary input into the determination of the PD for exposures. The Group will allocate each exposure to a credit risk grade at origination and at each reporting period to predict the risk of default. Credit risk grades will be determined using qualitative and quantitative factors that are indicative of the risk of default e.g. arrears status and loan applications scores. These factors will vary for each loan portfolio. Exposures will be subject to ongoing monitoring, which may result in an exposure being moved to a different credit risk grade. In monitoring exposures information such as payment records, request for forbearance strategies and forecast changes in economic conditions will be considered for the Consumer Finance portfolio. Additionally for the Business Finance portfolio information obtained during periodic reviews, for example audited financial statements, management accounts, budgets and projections will be considered, with particular focus on key ratios, compliance with covenants and changes in senior management teams.
Exogenous, Maturity, Vintage (EMV) modelling will be used in the production of forward looking lifetime PDs. This method will entail modelling the effects of external (exogenous) factors against cohorts of lending and their time on the books creating a clean relationship to best demonstrate the movement in default rates as macroeconomic variables are changed. These models will be extrapolated to provide PD estimates for the future, based on forecasted economic scenarios.
As the Group’s performance data does not go back far enough to capture a full economic cycle, the proxy series of the quarterly rates of write offs for UK unsecured lending data will be used to build an economic response model (ERM) to incorporate the effects of recession.
The portfolios for which external benchmark information represents a significant input into the measurement of ECL are as follows:
External benchmarks used
Exposure (£m) LGD PD
Real Estate Finance £581.0 CML Repossessions and Default Rates
The benchmarks below relate to all three portfolios: S&P Ratings; BOE UK Possessions as proxy data for ERM
Asset Finance £117.9 N/A
Commercial Finance £127.1 N/A
Notes to the consolidated financial statementscontinued

Strategic Report Corporate Governance Report
Financial Statements
159www.securetrustbank.co.uk
29. Credit risk continued
Exposure at default EAD represents the expected exposure in the event of a default. EAD will be derived from the current exposure and potential changes to the current amount allowed under the terms of the contract, including amortisation overpayments and early terminations. The EAD of a financial asset is its gross carrying amount. For loan commitments the EAD includes the amount drawn as well as potential future amounts that may be drawn under the terms of the contract, estimated based on historical observations and forward looking forecasts.For Commercial Finance facilities that have no specific term an assumption will be made that accounts close 36 months after the reporting date. This assumption is based on industry experience of average client life. The Group therefore measures the lifetime ECL for these assets over an assumed 36 month period.
These facilities do not have a fixed term or repayment structure but are revolving and increase or decrease to reflect the value of the collateral i.e. receivables or inventory. The Group can cancel them with immediate effect but this contractual right is not enforced in the normal day to day management of the facility. Typically, demand would only be made on failure of a client business or in the event of a material event of default, such as a fraud. In the normal course of events, the Group’s exposure is recovered through receipt of remittances from the client’s debtors rather than from the client itself. The ECL for such facilities will be estimated taking into account the credit risk management actions that the Group expects to take to mitigate against such losses. These include a reduction in advance rate and facility limits or application of reserves against a facility so as to improve the likelihood of full recovery of exposure from the debtors. Alternative recovery routes mitigating ECL would include refinance by another funding provider, taking security over other asset classes or secured personal guarantees from the client’s principals.
Loss given defaultLGD is the magnitude of the likely loss in the event of default. This will take into account recoveries either through curing or, where applicable, through auction sale of repossessed collateral and debt sale of the residual shortfall amount. For loans secured by retail property loan to value (LTV) ratios are key parameters in determining LGD. LGD’s will be calculated on a discounted cash flow basis using the financial instrument’s origination effective interest rate as the discount factor.
Incorporation of forward looking dataThe Group will incorporate forward looking information into both its assessment of whether the credit risk of a financial asset has increased significantly since initial recognition and its measurement of expected credit loss. This will be achieved by developing a number of potential economic scenarios and modelling expected credit losses for each scenario. The outputs from each scenario will be combined, using the estimated likelihood of each scenario occurring to derive a probability weighted expected credit loss. The scenarios adopted and probability weighting applied will both be approved by the Assumptions Committee.
The scenarios expected to be adopted at 1 January 2018 were as follows:
Scenario Derivation Weighting
Base case Derived from external consensus forecasts, primarily from the Bank of England, and used in the Group’s strategic planning and budgeting processes.
80%
Benign case Assumes that the expected credit loss models are unaffected by changing macroeconomic variables.
5%
Stressed case Management’s assessment, based on historic data, of an adverse scenario that could occur once every seven to eight years.
10%
Deeper stress Based on the scenario used by the PRA for the H1 2017 ICAAP. This can be found on the Bank of England’s website: www.bankofengland.co.uk
5%
The key drivers of credit risk and credit losses included in the above scenarios have been identified as annual unemployment rate growth, changes to the consumer price index and annual house price index growth.
Straightforward transparent bankingSecure Trust Bank PLC Annual Report & Accounts 2017
160
29. Credit risk continued
c) Classification of financial liabilitiesThe treatment of financial liabilities is carried forward to IFRS 9 essentially unchanged from IAS 39. The only aspect to change is the treatment of financial liabilities that an entity elects to measure at fair value. The Group does not elect to measure any of its liabilities at fair value and therefore expects no impact to arise from adopting these new requirements.
d) Disclosures IFRS 9 will require extensive new disclosures regarding credit risk and ECLs.
e) Impact on capital planningThe European Banking Authority has issued guidance on the transition requirements for the implementation of IFRS 9. The guidelines allow a choice of two approaches to recognise the impact of implementing IFRS 9 on regulatory capital:
• Phase in the impact over a five year period (applying add back factors of 95%, 85%, 70%, 50% and 25% for years one to five respectively); or
• Recognise the impact in full on transition to IFRS 9
The Group has agreed to adopt the first approach. It is expected that implementation of IFRS 9 will result in a decrease in the Group’s CET 1 ratio in the range of 8 to 10 basis points.
f) Transition Changes in accounting policies resulting from adoption of IFRS 9 will be applied retrospectively, except as noted below:
• Comparative periods will not be restated. Differences in the carrying amount of financial instruments resulting from adoption of IFRS 9 will be recognised in retained earnings and reserves as at 1 January 2018;
• The determination of the business model within which a financial asset is held will be made based on the facts and circumstances that existed at the date of initial application; and
• If a debt security was deemed to have low credit risk at the date of initial application, then the Group will assume that the credit risk of the asset had not increased significantly since its initial recognition. A financial asset is considered to have low credit risk when its credit risk rating is equivalent to the widely understood definition of investment grade.
30. Market risk
Market risks arise from open positions in interest rate and currency products, all of which are exposed to general and specific market movements. The Group and Company have no significant exposures to foreign currencies and therefore there is no significant currency risk.
Interest rate riskInterest rate risk is the potential adverse impact on the Company and Group’s future cash flows from changes in interest rates and arises from the differing interest rate risk characteristics of the Company and Group’s assets and liabilities. In particular, fixed rate savings and borrowing products expose the Group to the risk that a change in interest rates could cause either a reduction in interest income or an increase in interest expense relative to variable rate interest flows. The Group seeks to ‘match’ interest rate risk on either side of the statement of financial position. However, this is not a perfect match and interest rate risk is present on money market deposits of a fixed rate nature, fixed rate loans and fixed rate savings products. The Group monitors the interest rate mismatch on a monthly basis.
The interest rate mismatch is monitored, throughout the maturity bandings of the book on a parallel scenario for 100 and 200 basis points movements. The Group considers the 100 and 200 basis points movement to be appropriate for scenario testing given the current economic outlook and industry expectations. This typically results in a pre-tax mismatch of £0.7 million or less (2016: £0.7 million or less) for the Company and Group, with the same impact to equity pre-tax.
Notes to the consolidated financial statementscontinued

Strategic Report Corporate Governance Report
Financial Statements
161www.securetrustbank.co.uk
30. Market risk continued
Interest rate sensitivity gapThe following tables summarise the re-pricing periods for the assets and liabilities in the Company and Group. Items are allocated to time bands by reference to the earlier of the next contractual interest rate re-price and the maturity date.
GroupAs at 31 December 2017
Within 3 months
£million
More than 3 months
but less than 6 months
£million
More than 6 months
but less than 1 year
£million
More than 1 year
but less than 5 years
£million
More than 5 years
£million
Non interest bearing£million
Total£million
ASSETS Cash and balances at central banks 226.1 – – – – – 226.1Loans and advances to banks 34.3 – – – – – 34.3Debt securities held-to-maturity 5.0 – – – – – 5.0Loans and advances to customers 581.2 121.3 181.9 696.0 2.3 15.6 1,598.3Other assets – – – – – 27.9 27.9
Total assets 846.6 121.3 181.9 696.0 2.3 43.5 1,891.6
LIABILITIES AND EQUITYDue to banks 113.0 – – – – – 113.0Deposits from customers 577.2 28.2 269.9 581.4 6.5 20.0 1,483.2Other liabilities – – – – – 46.3 46.3Equity – – – – – 249.1 249.1
Total liabilities and equity 690.2 28.2 269.9 581.4 6.5 315.4 1,891.6
Interest rate sensitivity gap 156.4 93.1 (88.0) 114.6 (4.2) (271.9)
Cumulative gap 156.4 249.5 161.5 276.1 271.9 –
GroupAs at 31 December 2016
Within 3 months
£million
More than 3 months
but less than 6 months
£million
More than 6 months
but less than 1 year
£million
More than 1 year
but less than 5 years
£million
More than 5 years
£million
Non interest bearing£million
Total£million
ASSETS Cash and balances at central banks 112.0 – – – – – 112.0Loans and advances to banks 18.2 – – – – – 18.2Debt securities held-to-maturity 20.0 – – – – – 20.0Loans and advances to customers 378.7 119.7 164.8 644.6 – 13.2 1,321.0Other assets – – – – – 38.8 38.8
Total assets 528.9 119.7 164.8 644.6 – 52.0 1,510.0
LIABILITIES AND EQUITYDue to banks 30.0 40.0 – – – – 70.0Deposits from customers 462.4 66.7 63.8 535.9 23.0 – 1,151.8Other liabilities – – – – – 52.2 52.2Equity – – – – – 236.0 236.0
Total liabilities and equity 492.4 106.7 63.8 535.9 23.0 288.2 1,510.0
Interest rate sensitivity gap 36.5 13.0 101.0 108.7 (23.0) (236.2)
Cumulative gap 36.5 49.5 150.5 259.2 236.2 –

Straightforward transparent bankingSecure Trust Bank PLC Annual Report & Accounts 2017
162
30. Market risk continued
CompanyAs at 31 December 2017
Within 3 months
£million
More than 3 months
but less than 6 months
£million
More than 6 months
but less than 1 year
£million
More than 1 year
but less than 5 years
£million
More than 5 years
£million
Non interest bearing£million
Total£million
ASSETS Cash and balances at central banks 226.1 – – – – – 226.1Loans and advances to banks 32.3 – – – – – 32.3Debt securities held-to-maturity 5.0 – – – – – 5.0Loans and advances to customers 576.6 119.2 178.3 689.1 2.3 – 1,565.5Other assets – – – – – 52.1 52.1
Total assets 840.0 119.2 178.3 689.1 2.3 52.1 1,881.0
LIABILITIES AND EQUITYDue to banks 113.0 – – – – – 113.0Deposits from customers 577.2 28.2 269.9 581.4 6.5 20.0 1,483.2Other liabilities – – – – – 47.7 47.7Equity – – – – – 237.1 237.1
Total liabilities and equity 690.2 28.2 269.9 581.4 6.5 304.8 1,881.0
Interest rate sensitivity gap 149.8 91.0 (91.6) 107.7 (4.2) (252.7)
Cumulative gap 149.8 240.8 149.2 256.9 252.7 –
CompanyAs at 31 December 2016
Within 3 months
£million
More than 3 months
but less than 6 months
£million
More than 6 months
but less than 1 year
£million
More than 1 year
but less than 5 years
£million
More than 5 years
£million
Non interest bearing£million
Total£million
ASSETS Cash and balances at central banks 112.0 – – – – – 112.0Loans and advances to banks 16.5 – – – – – 16.5Debt securities held-to-maturity 20.0 – – – – – 20.0Loans and advances to customers 378.6 119.1 162.3 629.2 – – 1,289.2Other assets – – – – – 65.0 65.0
Total assets 527.1 119.1 162.3 629.2 – 65.0 1,502.7
LIABILITIES AND EQUITYDue to banks 30.0 40.0 – – – – 70.0Deposits from customers 462.4 66.7 63.8 535.9 23.0 – 1,151.8Other liabilities – – – – – 59.1 59.1Equity – – – – – 221.8 221.8
Total liabilities and equity 492.4 106.7 63.8 535.9 23.0 280.9 1,502.7
Interest rate sensitivity gap 34.7 12.4 98.5 93.3 (23.0) (215.9)
Cumulative gap 34.7 47.1 145.6 238.9 215.9 –
Notes to the consolidated financial statementscontinued

Strategic Report Corporate Governance Report
Financial Statements
163www.securetrustbank.co.uk
31. Liquidity risk
Liquidity risk is the risk that the Group will encounter difficulty in meeting obligations associated with its financial liabilities that are settled by delivering cash or another financial asset.
The Group’s approach to managing liquidity is to ensure, as far as possible, that it will always have sufficient liquidity to meet its liabilities when due, under both normal and stressed conditions, without incurring unacceptable losses or risking damage to the Group’s reputation. The liquidity requirements of the Group are met through withdrawing funds from its Bank of England Reserve Account to cover any short-term fluctuations and, longer term funding to address any structural liquidity requirements.
The Company has a formal governance structure in place to manage and mitigate liquidity risk on a day-to-day basis. The Board sets and approves the Company’s liquidity risk management strategy. The ALCO, comprising senior executives of the Company, monitors liquidity risk. Key liquidity risk management information is reported by the Treasury function and monitored by the Chief Executive Officer and Chief Financial Officer on a daily basis. The ALCO meets monthly to review liquidity risk against set thresholds and risk indicators including early warning indicators, liquidity risk tolerance levels and ILAAP metrics.
The Company issued fixed rate deposit bonds to customers during the year as set out below:
2017 2016
Amount £347.9 million £299.0 millionTerm 1 to 5 years 1 to 7 years
These were issued to broadly match the term lending by the Company.
The PRA requires a firm to maintain at all times liquidity resources which are adequate, both as to amount and quality, to ensure that there is no significant risk that its liabilities cannot be met as they fall due. There is also a requirement that a firm ensures its liquidity resources contain an adequate buffer of high quality, unencumbered assets (i.e. Government Securities in the liquidity asset buffer); and it maintains a prudent funding profile. The liquidity assets buffer is a pool of highly liquid assets that can be called upon to create sufficient liquidity to meet liabilities on demand, particularly in a period of liquidity stress. The liquidity resources outside the buffer must either be marketable assets with a demonstrable secondary market that the firm can access, or a credit facility that can be activated in times of stress.
The Group has a Board approved ILAAP. The ILAAP rules require STB to identify, measure, manage and monitor liquidity and funding risks across different time horizons and stress scenarios, consistent with STB’s risk appetite as established by the STB Board. The ILAAP seeks to document STB’s approach to liquidity and funding, and demonstrate that it complies with the Overall Liquidity Adequacy Rule. The PRA’s approach to liquidity supervision is based on the principle that a firm must have adequate levels of liquidity resources and a prudent funding profile, and that it comprehensively manages and controls liquidity and funding risks. The liquidity buffer required by the ILAAP has been put in place and maintained since that time. Liquidity resources outside of the buffer are made up of deposits placed at the Bank of England. The ILAAP is updated annually.
The primary measures used by management to assess the adequacy of liquidity is the Overall Liquidity Adequacy Rule, which is the Board’s own view of the Group’s liquidity needs as set out in the Board approved ILAAP. The Group maintained liquidity in excess of the Overall Liquidity Adequacy Rule throughout the year ended 31 December 2017.
The LCR regime has applied to the Group from 1 October 2016, requiring management of net 30 day cash outflows as a proportion of High Quality Liquid Assets. STB has set a more prudent internal limit. The actual LCR has significantly exceeded both limits throughout the year.
The Group is exposed to daily calls on its available cash resources from current accounts, maturing deposits and loan draw-downs. The Group maintains significant cash resources to meet all of these needs as they fall due.
The matching and controlled mismatching of the maturities and interest rates of assets and liabilities is fundamental to the management of the Group. It is unusual for banks to be completely matched, as transacted business is often of uncertain term and of different types.

Straightforward transparent bankingSecure Trust Bank PLC Annual Report & Accounts 2017
164
31. Liquidity risk continued
The maturities of assets and liabilities and the ability to replace, at an acceptable cost, interest bearing liabilities as they mature are important factors in assessing the liquidity of the Group and its exposure to changes in interest rates.
The tables below analyse the contractual undiscounted cash flows for the financial liabilities and assets into relevant maturity groupings:
Group At 31 December 2017
Carrying amount£million
Gross nominal
inflow/ (outflow)£million
Not more than
3 months£million
More than 3 months
but less than 1 year
£million
More than 1 year but less than
5 years£million
More than 5 years
£million
Non-derivative financial liabilitiesDue to banks 113.0 (115.1) (0.1) (0.4) (114.6) –Deposits from customers 1,483.2 (1,517.2) (580.8) (318.6) (611.1) (6.7)Other financial liabilities 29.5 (29.5) (29.5) – – –
1,625.7 (1,661.8) (610.4) (319.0) (725.7) (6.7)
Non-derivative financial assetsCash and balances at central banks 226.1 226.1 226.1 – – –Loans and advances to banks 34.3 34.3 34.3 – – –Debt securities held-to-maturity 5.0 5.0 5.0 – – –Loans and advances to customers 1,598.3 2,054.4 667.8 420.8 965.3 0.5Other financial assets 1.2 1.2 1.2 – – –
1,864.9 2,321.0 934.4 420.8 965.3 0.5
Liquidity mismatch 239.2 659.2 324.0 101.8 239.6 (6.2)
Group At 31 December 2016
Carrying amount£million
Gross nominal
inflow/ (outflow)£million
Not more than
3 months£million
More than 3 months
but less than 1 year
£million
More than 1 year but less than
5 years£million
More than 5 years
£million
Non-derivative financial liabilities Due to banks 70.0 (70.0) (30.0) (40.0) – –Deposits from customers 1,151.8 (1,202.9) (461.6) (147.9) (569.5) (23.9)Other financial liabilities 18.3 (18.3) (18.3) – – –
1,240.1 (1,291.2) (509.9) (187.9) (569.5) (23.9)
Non-derivative financial assetsCash and balances at central banks 112.0 112.0 112.0 – – –Loans and advances to banks 18.2 18.2 18.2 – – –Debt securities held-to-maturity 20.0 20.0 20.0 – – –Loans and advances to customers 1,321.0 1,955.5 349.1 413.9 1,192.2 0.3Other financial assets 0.9 0.9 0.9 – – –
1,472.1 2,106.6 500.2 413.9 1,192.2 0.3
Liquidity mismatch 232.0 815.4 (9.7) 226.0 622.7 (23.6)
Notes to the consolidated financial statementscontinued

Strategic Report Corporate Governance Report
Financial Statements
165www.securetrustbank.co.uk
31. Liquidity risk continued
CompanyAt 31 December 2017
Carrying amount£million
Gross nominal
inflow/ (outflow)£million
Not more than
3 months£million
More than 3 months
but less than 1 year
£million
More than 1 year but less than
5 years£million
More than 5 years
£million
Non-derivative financial liabilities Due to banks 113.0 (115.1) (0.1) (0.4) (114.6) –Deposits from customers 1,483.2 (1,517.2) (580.8) (318.6) (611.1) (6.7)Other financial liabilities 34.2 (34.2) (34.2) – – –
1,630.4 (1,666.5) (615.1) (319.0) (725.7) (6.7)
Non-derivative financial assetsCash and balances at central banks 226.1 226.1 226.1 – – –Loans and advances to banks 32.3 32.3 32.3 – – –Debt securities held-to-maturity 5.0 5.0 5.0 – – –Loans and advances to customers 1,565.5 2,017.5 646.6 413.1 957.3 0.5Other financial assets 30.7 30.7 30.7 – – –
1,859.6 2,311.6 940.7 413.1 957.3 0.5
Liquidity mismatch 229.2 645.1 325.6 94.1 231.6 (6.2)
CompanyAt 31 December 2016
Carrying amount£million
Gross nominal
inflow/ (outflow)£million
Not more than
3 months£million
More than 3 months
but less than 1 year
£million
More than 1 year but less than
5 years£million
More than 5 years
£million
Non-derivative financial liabilities Due to banks 70.0 (70.0) (30.0) (40.0) – –Deposits from customers 1,151.8 (1,202.9) (461.6) (147.9) (569.5) (23.9)Other financial liabilities 30.7 (30.7) (30.7) – – –
1,252.5 (1,303.6) (522.3) (187.9) (569.5) (23.9)
Non-derivative financial assetsCash and balances at central banks 112.0 112.0 112.0 – – –Loans and advances to banks 16.5 16.5 16.5 – – –Debt securities held-to-maturity 20.0 20.0 20.0 – – –Loans and advances to customers 1,289.2 1,921.5 345.7 397.6 1,177.9 0.3Other financial assets 33.0 33.0 33.0 – – –
1,470.7 2,103.0 527.2 397.6 1,177.9 0.3
Liquidity mismatch 218.2 799.4 4.9 209.7 608.4 (23.6)
The maturities of assets and liabilities and the ability to replace, at an acceptable cost, interest bearing financial liabilities as they mature are important factors in assessing the liquidity of the Company and Group and its exposure to changes in interest rates and exchange rates.
Other financial liabilities, as shown above, do not include non-interest accruals as these are not classed as financial liabilities.

Straightforward transparent bankingSecure Trust Bank PLC Annual Report & Accounts 2017
166
32. Capital risk
The Group’s capital management policy is focused on optimising shareholder value, in a safe and sustainable manner. There is a clear focus on delivering organic growth and ensuring capital resources are sufficient to support planned levels of growth. The Board regularly reviews the capital position.
In accordance with CRD IV and the required parameters set out in the Capital Requirements Regulation, the Group’s ICAAP is embedded in the risk management framework of the Group and is subject to ongoing updates and revisions when necessary. However, at a minimum, the ICAAP is updated annually as part of the business planning process. The ICAAP is a process that brings together the management framework (i.e. the policies, procedures, strategies, and systems that the Group has implemented to identify, manage and mitigate its risks) and the financial disciplines of business planning and capital management. Prior to the sale of Arbuthnot’s controlling stake in the Group, the Group’s ICAAP was aggregated into the Arbuthnot Banking Group’s ICAAP.
Not all material risks can be mitigated by capital, but where capital is appropriate the Board has adopted a ‘Pillar 1 plus’ approach to determine the level of capital the Group needs to hold. This method takes the Pillar 1 capital formula calculations (standardised approach for credit, market and operational risk) as a starting point, and then considers whether each of the calculations delivers a sufficient capital sum adequate to cover management’s anticipated risks. Where it is considered that the Pillar 1 calculations do not reflect the risk, an additional capital add-on in Pillar 2 should be applied, as per the Individual Capital Guidance issued by the PRA.
Pillar 3 complements the minimum capital requirements (Pillar 1) and the supervisory review process (Pillar 2). Its aim is to encourage market discipline by developing a set of disclosure requirements which would allow market participants to assess key pieces of information on a firm’s capital, risk exposures and risk assessment processes. Pillar 3 disclosures for the Group for the year ended 31 December 2017 are published as a separate document on the Group’s website.
The following table shows the regulatory capital resources for the Group. Following the sale of its majority holding in the Group by Arbuthnot Banking Group plc in 2016, the regulatory capital of the Group is now managed on a group consolidated basis. Therefore, the prior year figures in the table below have been restated from a solo-consolidated basis to a group consolidated basis, and the CET 1 capital ratio restated accordingly:
2017
£million2016
£million
Tier 1 Share capital 7.4 7.4Share premium 81.2 81.2Retained earnings 159.2 149.0Revaluation reserve 1.3 1.2Available-for-sale reserve – (2.8)Goodwill (1.0) (1.0)Intangible assets net of attributable deferred tax (9.2) (7.6)
CET 1 capital 238.9 227.4
Tier 2Collective allowance for impairment of loans and advances 4.4 5.3
Total Tier 2 capital 4.4 5.3
Own Funds 243.3 232.7
Reconciliation to total equity:Goodwill and other intangible assets net of attributable deferred tax 10.2 8.6Collective allowance for impairment of loans and advances (4.4) (5.3)
Total equity 249.1 236.0
Notes to the consolidated financial statementscontinued

Strategic Report Corporate Governance Report
Financial Statements
167www.securetrustbank.co.uk
32. Capital risk continued
The Group ICAAP includes a summary of the capital required to mitigate the identified risks in its regulated entities and the amount of capital that the Group has available. The PRA sets Individual Capital Guidance for each UK bank calibrated by reference to its Capital Resources Requirement, broadly equivalent to 8% of risk weighted assets and thus representing the capital required under Pillar 1 of the Basel III framework. The ICAAP is a key input into the PRA’s Individual Capital Guidance setting process, which addresses the requirements of Pillar 2 of the Basel II framework. The PRA’s approach is to monitor the available capital resources in relation to the Individual Capital Guidance requirement. The Group maintains an extra internal buffer and capital ratios are reviewed on a monthly basis to ensure that external and internal requirements are adhered to.
The Group is also subject to further capital requirements imposed by the PRA on all financial services firms. During the periods, the Group complied with these requirements.
33. Maturity analysis of consolidated assets and liabilities
Group Contractual maturity analysis at 31 December 2017
Due within one year£million
Due after more than
one year£million
No contractual
maturity £million
Total£million
ASSETS Cash and balances at central banks 226.1 – – 226.1Loans and advances to banks 34.3 – – 34.3Loans and advances to customers 884.4 698.3 15.6 1,598.3Debt securities held-to-maturity 5.0 – – 5.0Property, plant and equipment – – 11.5 11.5Intangible assets – – 10.4 10.4Deferred tax assets – – 0.6 0.6Other assets – – 5.4 5.4
Total assets 1,149.8 698.3 43.5 1,891.6
LIABILITIESDue to banks 113.0 – – 113.0Deposits from customers 875.3 587.9 20.0 1,483.2Current tax liabilities 3.0 – – 3.0Other liabilities – – 41.9 41.9Provisions for liabilities and charges – – 1.4 1.4
Total liabilities 991.3 587.9 63.3 1,642.5

Straightforward transparent bankingSecure Trust Bank PLC Annual Report & Accounts 2017
168
33. Maturity analysis of consolidated assets and liabilities continued
Group Contractual maturity analysis at 31 December 2016
Due within one year£million
Due after more than
one year£million
No contractual
maturity £million
Total£million
ASSETS Cash and balances at central banks 112.0 – – 112.0Loans and advances to banks 18.2 – – 18.2Loans and advances to customers 663.2 657.8 – 1,321.0Debt securities held-to-maturity 20.0 – – 20.0Equity instruments available-for-sale – – 13.5 13.5Property, plant and equipment – – 11.4 11.4Intangible assets – – 9.0 9.0Other assets 4.9 – – 4.9
Total assets 818.3 657.8 33.9 1,510.0
LIABILITIESDue to banks 70.0 – – 70.0Deposits from customers 592.9 558.9 – 1,151.8Current tax liabilities 1.7 – – 1.7Deferred tax liabilities – 0.2 – 0.2Other liabilities 47.4 2.9 – 50.3
Total liabilities 712.0 562.0 – 1,274.0
The directors have reviewed behavioural maturity of the loan book and have concluded that it would not significantly affect the analysis above.
Notes to the consolidated financial statementscontinued
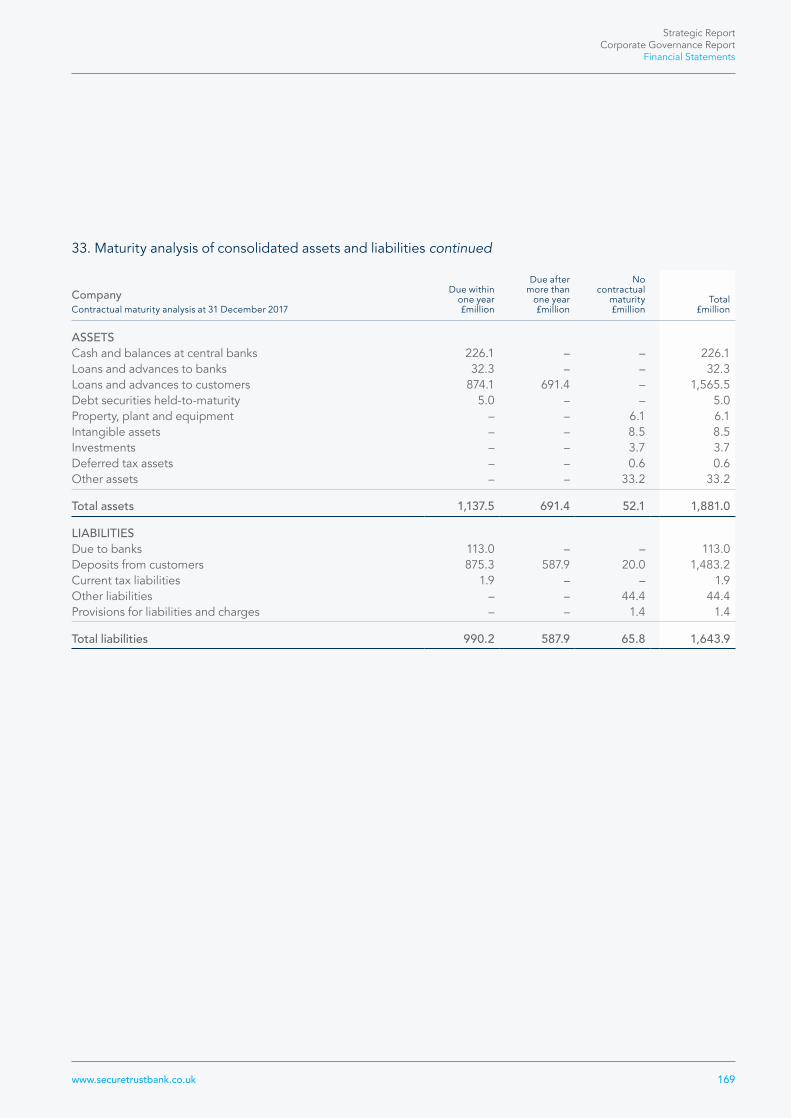
Strategic Report Corporate Governance Report
Financial Statements
169www.securetrustbank.co.uk
33. Maturity analysis of consolidated assets and liabilities continued
Company Contractual maturity analysis at 31 December 2017
Due within one year£million
Due after more than
one year£million
No contractual
maturity £million
Total£million
ASSETS Cash and balances at central banks 226.1 – – 226.1Loans and advances to banks 32.3 – – 32.3Loans and advances to customers 874.1 691.4 – 1,565.5Debt securities held-to-maturity 5.0 – – 5.0Property, plant and equipment – – 6.1 6.1Intangible assets – – 8.5 8.5Investments – – 3.7 3.7Deferred tax assets – – 0.6 0.6Other assets – – 33.2 33.2
Total assets 1,137.5 691.4 52.1 1,881.0
LIABILITIESDue to banks 113.0 – – 113.0Deposits from customers 875.3 587.9 20.0 1,483.2Current tax liabilities 1.9 – – 1.9Other liabilities – – 44.4 44.4Provisions for liabilities and charges – – 1.4 1.4
Total liabilities 990.2 587.9 65.8 1,643.9

Straightforward transparent bankingSecure Trust Bank PLC Annual Report & Accounts 2017
170
33. Maturity analysis of consolidated assets and liabilities continued
Company At 31 December 2016
Due within one year£million
Due after more than
one year£million
No contractual
maturity £million
Total£million
ASSETS Cash and balances at central banks 112.0 – – 112.0Loans and advances to banks 16.5 – – 16.5Loans and advances to customers 660.0 629.2 – 1,289.2Debt securities held-to-maturity 20.0 – – 20.0Equity instruments available-for-sale 13.5 – – 13.5Property, plant and equipment – – 6.2 6.2Intangible assets – – 6.2 6.2Investments – – 3.7 3.7Deferred tax assets – 0.1 – 0.1Other assets 35.3 – – 35.3
Total assets 857.3 629.3 16.1 1,502.7
LIABILITIESDue to banks 70.0 – – 70.0Deposits from customers 592.9 558.9 – 1,151.8Current tax liabilities 0.8 – – 0.8Other liabilities 58.3 – – 58.3
Total liabilities 722.0 558.9 – 1,280.9
The directors have reviewed behavioural maturity of the loan book and have concluded that it would not significantly affect the analysis above.
Notes to the consolidated financial statementscontinued

Strategic Report Corporate Governance Report
Financial Statements
171www.securetrustbank.co.uk
34. Classification of financial assets and liabilities
Group At 31 December 2017
Held to maturity£million
Loans and receivables
£million
Other financial
assets and liabilities£million
Total carrying amount£million
Fair value£million
Fair value hierarchy
level
Cash and balances at central banks – 226.1 – 226.1 226.1 Level 1Loans and advances to banks – 34.3 – 34.3 34.3 Level 2Loans and advances to customers – 1,598.3 – 1,598.3 1,641.1 Level 3Debt securities held-to-maturity 5.0 – – 5.0 5.0 Level 1Other financial assets – – 1.2 1.2 1.2 Level 3
5.0 1,858.7 1.2 1,864.9 1,907.7
Due to banks – – 113.0 113.0 113.0 Level 2Deposits from customers – – 1,483.2 1,483.2 1,481.6 Level 3Other financial liabilities – – 29.5 29.5 29.5 Level 3
– – 1,625.7 1,625.7 1,624.1
Group At 31 December 2016
Available-for-sale
£million
Held to maturity£million
Loans and receivables
£million
Other financial
assets and liabilities£million
Total carrying amount£million
Fair value£million
Fair value hierarchy
level
Cash and balances at central banks – – 112.0 – 112.0 112.0 Level 1Loans and advances to banks – – 18.2 – 18.2 18.2 Level 2Loans and advances to customers – – 1,321.0 – 1,321.0 1,399.8 Level 3Debt securities held-to-maturity – 20.0 – – 20.0 20.0 Level 1Equity instruments available-for-sale 13.5 – – – 13.5 13.5 Level 1Other financial assets – – – 0.9 0.9 0.9 Level 3
13.5 20.0 1,451.2 0.9 1,485.6 1,564.4
Due to banks – – – 70.0 70.0 70.0 Level 2Deposits from customers – – – 1,151.8 1,151.8 1,160.9 Level 3Other financial liabilities – – – 18.3 18.3 18.3 Level 3
– – – 1,240.1 1,240.1 1,249.2
Equity investments held-for-sale are carried at fair value. All other assets and liabilities are carried at amortised cost. Therefore for these assets and liabilities, the fair value hierarchy noted above relates to the disclosure in this note only.
During the period, the underlying methodology used to calculate the fair values of loans and advances to customers has been enhanced to calculate fair values on an individual business segment basis. Accordingly the comparatives as at 31 December 2016 have been re-presented on this basis.

Straightforward transparent bankingSecure Trust Bank PLC Annual Report & Accounts 2017
172
34. Classification of financial assets and liabilities continued
Company At 31 December 2017
Held to maturity£million
Loans and receivables
£million
Other financial
assets and liabilities£million
Total carrying amount£million
Fair value£million
Fair value hierarchy
level
Cash and balances at central banks – 226.1 – 226.1 226.1 Level 1Loans and advances to banks – 32.3 – 32.3 32.3 Level 2Loans and advances to customers – 1,565.5 – 1,565.5 1,608.3 Level 3Debt securities held-to-maturity 5.0 – – 5.0 5.0 Level 1Other financial assets – – 30.7 30.7 30.7 Level 3
5.0 1,823.9 30.7 1,859.6 1,902.4
Due to banks – – 113.0 113.0 113.0 Level 2Deposits from customers – – 1,483.2 1,483.2 1,481.6 Level 3Other financial liabilities – – 34.2 34.2 34.2 Level 3
– – 1,630.4 1,630.4 1,628.8
Company At 31 December 2016
Available-for-sale
£million
Held to maturity£million
Loans and receivables
£million
Other financial
assets and liabilities£million
Total carrying amount£million
Fair value£million
Fair value hierarchy
level
Cash and balances at central banks – – 112.0 – 112.0 112.0 Level 1Loans and advances to banks – – 16.5 – 16.5 16.5 Level 2Loans and advances to customers – – 1,289.2 – 1,289.2 1,591.1 Level 3Debt securities held-to-maturity – 20.0 – – 20.0 20.0 Level 1Equity instruments available-for-sale 13.5 – – – 13.5 13.5 Level 1Other financial assets – – – 33.0 33.0 33.0 Level 3
13.5 20.0 1,417.7 33.0 1,484.2 1,786.1
Due to banks – – – 70.0 70.0 70.0 Level 2Deposits from customers – – – 1,151.8 1,151.8 1,173.2 Level 3Other financial liabilities – – – 30.7 30.7 30.7 Level 3
– – – 1,252.5 1,252.5 1,273.9
Equity investments available-for-sale are carried at fair value. All other assets and liabilities are carried at amortised cost. Therefore for these assets, the fair value hierarchy noted above relates to the disclosure in this note only.
Notes to the consolidated financial statementscontinued

Strategic Report Corporate Governance Report
Financial Statements
173www.securetrustbank.co.uk
34. Classification of financial assets and liabilities continued
Fair value classificationThe tables above include the fair values and fair value hierarchies of the Group and Company’s financial assets and liabilities. The Group measures fair value using the following fair value hierarchy that reflects the significance of the inputs used in making measurements:
• Level 1: Quoted prices in active markets for identical assets or liabilities.
• Level 2: Inputs other than quoted prices included within Level 1 that are observable for the asset or liability, either directly (i.e. as prices) or indirectly (i.e. derived from prices).
• Level 3: Inputs for the asset or liability that are not based on observable market data (unobservable inputs).
Cash and balances at central banksThe fair value of cash and balances at central banks was calculated based upon the present value of the expected future principal and interest cash flows. The rate used to discount the cash flows was the market rate of interest at the balance sheet date.
At the end of each year, the fair value of cash and balances at central banks was calculated to be equivalent to their carrying value.
Loans and advances to banks The fair value of loans and advances to banks was calculated based upon the present value of the expected future principal and interest cash flows. The rate used to discount the cash flows was the market rate of interest at the balance sheet date.
Loans and advances to customers The fair value of loans and advances to customers was calculated based upon the present value of the expected future principal and interest cash flows. The rate used to discount the cash flows was the market rate of interest at the balance sheet date, and the same assumptions regarding the risk of default were applied as those used to derive the carrying value.
Debt securities held-to-maturity and equity instruments available-for-saleThe fair value of debt securities held-to-maturity and equity instruments available-for-sale is based on the quoted mid-market share price.
At the end of December 2017 the fair value of debt securities held-to-maturity was calculated to be equivalent to their carrying value.
Due to banksThe fair value of amounts due to banks was calculated based upon the present value of the expected future principal and interest cash flows. The rate used to discount the cash flows was the market rate of interest at the balance sheet date.
At the end of each year, the fair value of amounts due to banks was calculated to be equivalent to their carrying value due to the short maturity term of the amounts due.
Deposits from customersThe fair value of deposits from customers was calculated based upon the present value of the expected future principal and interest cash flows. The rate used to discount the cash flows was the market rate of interest at the balance sheet date for the notice deposits and deposit bonds. The fair value of instant access deposits is equal to book value as they are repayable on demand.

Straightforward transparent bankingSecure Trust Bank PLC Annual Report & Accounts 2017
174
34. Classification of financial assets and liabilities continued
Dividends and other financial liabilitiesThe fair value of dividends and other financial liabilities was calculated based upon the present value of the expected future principal cash flows.
At the end of each year, the fair value of dividends and other financial liabilities was calculated to be equivalent to their carrying value due to their short maturity. The other financial liabilities include all other liabilities other than non-interest accruals.
35. Related party transactions
Related parties of the Company and Group include subsidiaries, Key Management Personnel, close family members of Key Management Personnel and entities which are controlled, jointly controlled or significantly influenced, or for which significant voting power is held, by Key Management Personnel or their close family members.
A number of banking transactions are entered into with related parties in the normal course of business on normal commercial terms. These include loans and deposits as set out below. Except for the directors’ disclosures, there were no other Key Management Personnel disclosures, therefore the tables below relate to directors and close members of their family only.
2017£million
2016£million
LoansLoans outstanding at 1 January 3.2 0.2Loans advanced 0.4 3.4Repayments – (0.5)Interest applied 0.1 0.1
Loans outstanding at 31 December 3.7 3.2
DepositsDeposits outstanding at 1 January 0.3 0.5Additional deposits made during the year 0.1 –Withdrawals during the year – (0.1)Director retired – (0.1)
Deposits outstanding at 31 December 0.4 0.3
The loans outstanding above comprise the following:
• A £0.4 million advance (2016: £0.4 million) as part of a £2.5 million facility agreed with a company in which a director holds 50% of the voting shares, which is secured by property and personal guarantees; and
• A £3.3 million advance (2016: £2.8 million) as part of a £4.4 million facility agreed with a director, which is secured by property and certain other undertakings.
Both of these transactions were agreed by the Group’s Real Estate Finance business and arose during the normal course of business. Both loans were subject to the usual Board governance and Credit Committee approval procedures and are on substantially the same terms as for comparable transactions with third parties.
Notes to the consolidated financial statementscontinued

Strategic Report Corporate Governance Report
Financial Statements
175www.securetrustbank.co.uk
35. Related party transactions continued
The Company undertook the following transactions with other companies in the Secure Trust Bank Group:
2017£million
2016£million
Debt Managers (Services) Limited – income from sale of debt portfolio (0.3) (2.9)Debt Managers (Services) Limited – debt collection services 0.2 –Secure Homes Services Limited – building rental paid 0.4 0.4V12 Finance Group Limited – dividend received (13.9) –V12 Retail Finance Limited – financial intermediary charges – applications proposed 5.1 4.5V12 Retail Finance Limited – financial intermediary charges – applications accepted 2.3 2.2V12 Retail Finance Limited – financial intermediary charges – loan set-up and processing 4.5 4.4V12 Retail Finance Limited – loan book management and servicing fees 8.9 7.1
7.2 15.7
No longer related partiesArbuthnot Banking Group PLC – group recharges – 0.2Everyday Lending Limited – interest income on loan receivable – 1.9
– 2.1
7.2 17.8
The loans and advances with, and amounts receivable and payable to, related companies are noted below:
Company 2017
£million
Company 2016
£million
Amounts receivable from subsidiary undertakings 29.7 31.2Amounts due to subsidiary undertakings (9.7) (13.2)
20.0 18.0
Directors’ remunerationThe directors’ emoluments (including pension contributions and benefits in kind) for the year are disclosed in the Remuneration Report beginning on page 86.
At the year end the ordinary shares held by the directors are disclosed in the Directors’ Report beginning on page 98. Details of the directors’ holdings of share options, as well as details of those share options exercised during the year, are also disclosed in the Directors’ Report.
The interests of any directors who hold shares in the ultimate parent company, Arbuthnot Banking Group PLC, which was the ultimate parent company until the sale of its controlling stake, are shown in the Directors’ Report of that company.

Straightforward transparent bankingSecure Trust Bank PLC Annual Report & Accounts 2017
176
36. Immediate and ultimate parent company
Prior to the sale of its controlling interest on 15 June 2016, the Company regarded Arbuthnot Banking Group PLC, a company registered in England and Wales, as the immediate and ultimate parent company. At that time, Sir Henry Angest, the Group Chairman and Chief Executive of Arbuthnot Banking Group, had a beneficial interest in 53.7% of the issued share capital of Arbuthnot Banking Group and was regarded by the Company as the ultimate controlling party. A copy of the consolidated financial statements of Arbuthnot Banking Group may be obtained from the Company Secretary, Arbuthnot Banking Group, Arbuthnot House, 7 Wilson Street, London, EC2M 2SN.
Since 15 June 2016, the Company has had no ultimate controlling party.
37. Discontinued operations
a) Sale of unsecured personal loan portfolioOn 21 December 2017, the Bank agreed to sell its remaining portfolio of unsecured personal loans to Alpha Credit Solutions 8 S.à.r.l., a company owned by AnaCap Credit Opportunities III LP. As previously highlighted, the Group made the decision to withdraw from the unsecured personal loan market in 2016, and the sale of this portfolio represents a full exit by the Group from this market.
The net proceeds of sale, after transaction costs, amounted to £36.6 million, which will be used for general corporate purposes including other forms of lending. The cash purchase consideration for the portfolio was calculated based on an agreed price for the portfolio as at 30 June 2017, adjusted for cash receipts the Group has already received from the portfolio during the period up to the date of completion.
The effect of the transaction is to accelerate capital realisation to reinvest into the Group’s core business while removing any future credit risk associated with the portfolio. The profit arising on sale of the portfolio was £0.5 million before tax. The Group continued to administer the portfolio until the completion of a migration of the portfolio to a third party administrator appointed by the purchaser, which is due to be completed in the first half of 2018.
Details of the income statement, net assets disposed of and consequential gain recognised on disposal, and cash flow of the discontinued operation are set out below:
Income statement2017
£million2016
£million
Interest receivable and similar income 8.0 11.2Interest expense and similar charges – –
Net interest income 8.0 11.2
Fee and commission income – –Fee and commission expense – –
Net fee and commission income – –
Operating income 8.0 11.2
Net impairment losses on loans and advances to customers (3.4) (4.4)Operating expenses (0.3) (1.2)
Profit before income tax 4.3 5.6Income tax expense (0.8) (1.1)
Profit after income tax 3.5 4.5Gain recognised on disposal after tax (see below) 0.4 –
Profit for the period 3.9 4.5
As described in Note 3, funding costs and operating expenses are not aligned to operating segments for day to day management of the business, so they cannot be allocated on a reliable basis. Accordingly, funding costs are not included above, and operating expenses above relates only to those costs that are directly attributable to the discontinued business.
Notes to the consolidated financial statementscontinued

Strategic Report Corporate Governance Report
Financial Statements
177www.securetrustbank.co.uk
37. Discontinued operations continued
Net assets disposed and gain recognised on disposal
Assets sold on 21 December 2017
£million
ASSETS Loans and advances to customers 36.1
ConsiderationCash 37.1Less selling costs (0.5)
36.6
Gain recognised on disposal before tax 0.5Tax (0.1)
Gain recognised on disposal after tax 0.4
Cash flow statement
Year ended 31 December
2017£million
Year ended 31 December
2016£million
Cash flows from discontinued operationsCash flows from operating activities Profit for the year 3.5 4.5
Adjustments for:Income tax expense 0.8 1.1Impairment losses on loans and advances to customers 3.4 4.4
Cash flows from operating profits before changes in operating assets and liabilities 7.7 10.0Changes in operating assets and liabilities:– net decrease in loans and advances to customers 28.0 8.8
Net cash inflow from operating activities and net increase in cash and cash equivalents 35.7 18.8

Straightforward transparent bankingSecure Trust Bank PLC Annual Report & Accounts 2017
178
37. Discontinued operations continued
b) Sale of non-standard consumer lending business ELGOn 4 December 2015, the Bank agreed to the conditional sale of its non-standard consumer lending business, ELG, which comprises Everyday Loans Holdings Limited and subsidiary companies Everyday Lending Limited and Everyday Loans Limited, to NSF. Consideration received on completion comprised £106.9 million in cash and £16.3 million in NSF ordinary shares. The disposal completed on 13 April 2016, and on completion NSF paid £215.0 million to the Group, being the £106.9 million cash consideration plus repayment of intercompany debt of £108.1 million. Subsequently, NSF took a £30.0 million three year loan from STB, which was repaid in full during 2017. After selling costs of £2.7 million, this resulted in a gain recognised on disposal in 2016 of £116.8 million. In addition, staff costs of £3.5 million were incurred in respect of the sale, which are included in 2016 operating expenses.
Details of the income statement, net assets disposed of and consequential gain recognised on disposal, assets and liabilities held-for-sale at 31 December 2015 and cash flow of discontinued operations are set out below.
Income statement2017
£million2016
£million
Interest receivable and similar income – 11.1Interest expense and similar charges – –
Net interest income – 11.1
Fee and commission income – 0.1Fee and commission expense – (0.1)
Net fee and commission income – –
Operating income – 11.1
Net impairment losses on loans and advances to customers – (2.6)Operating expenses – (6.0)
Profit before income tax – 2.5Income tax expense – (0.5)
Profit after income tax – 2.0Gain recognised on disposal (see below) – 116.8
Profit for the period – 118.8
Notes to the consolidated financial statementscontinued

Strategic Report Corporate Governance Report
Financial Statements
179www.securetrustbank.co.uk
37. Discontinued operations continued
Net assets disposed and gain recognised on disposal
Assets and liabilities
sold on 13 April 2016
£million
ASSETS Loans and advances to banks 2.4Loans and advances to customers 117.9Property, plant and equipment 0.5Intangible assets 1.2Deferred tax assets 0.4Other assets 0.8
Total assets 123.2
LIABILITIES Current tax liabilities 4.0Other liabilities 7.4
Total liabilities 11.4
Net assets disposed of 111.8
ConsiderationCash (including the settlement of inter-company debt) 215.0NSF shares 16.3
231.3Selling costs (2.7)Net assets disposed of (111.8)
Gain recognised on disposal 116.8
The cash flow from the sale of subsidiary undertakings can be analysed as follows:
Group£million
Company£million
Cash consideration (including the settlement of inter-company debt) 215.0 215.0Selling costs (2.7) (2.7)Cash disposed of as part of sale (2.4) –
209.9 212.3
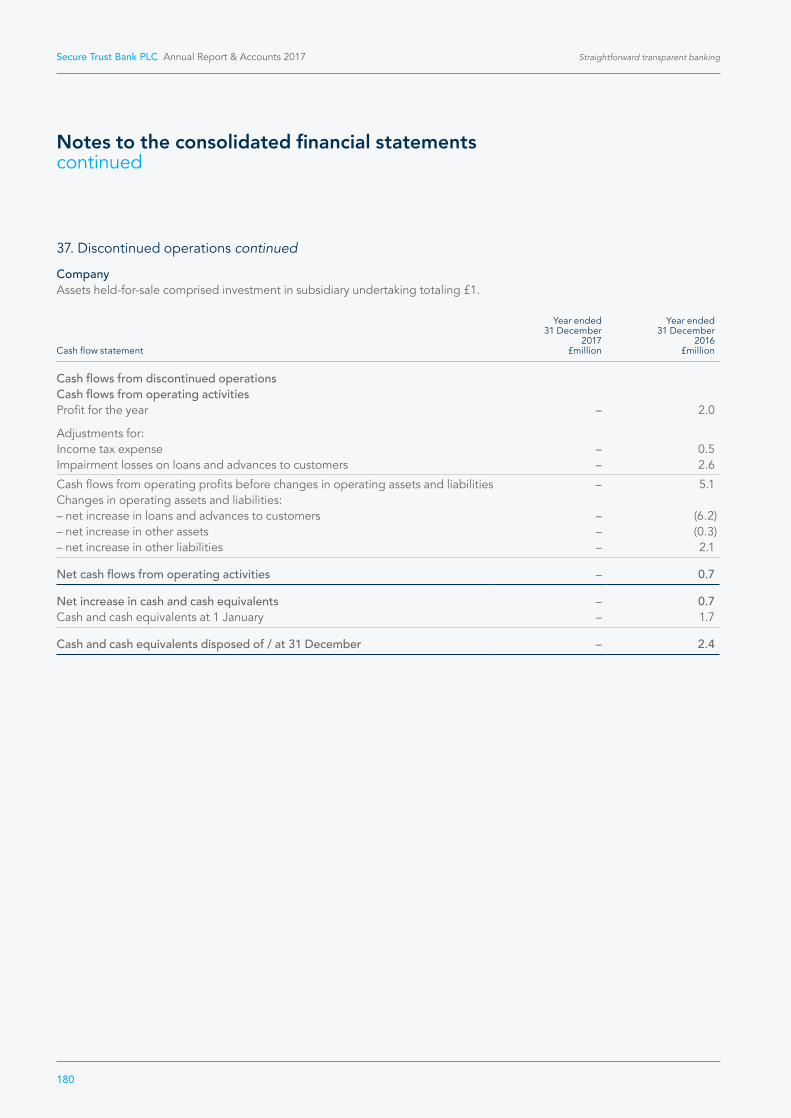
Straightforward transparent bankingSecure Trust Bank PLC Annual Report & Accounts 2017
180
37. Discontinued operations continued
CompanyAssets held-for-sale comprised investment in subsidiary undertaking totaling £1.
Cash flow statement
Year ended 31 December
2017£million
Year ended 31 December
2016£million
Cash flows from discontinued operationsCash flows from operating activities Profit for the year – 2.0
Adjustments for:Income tax expense – 0.5Impairment losses on loans and advances to customers – 2.6
Cash flows from operating profits before changes in operating assets and liabilities – 5.1Changes in operating assets and liabilities:– net increase in loans and advances to customers – (6.2)– net increase in other assets – (0.3)– net increase in other liabilities – 2.1
Net cash flows from operating activities – 0.7
Net increase in cash and cash equivalents – 0.7Cash and cash equivalents at 1 January – 1.7
Cash and cash equivalents disposed of / at 31 December – 2.4
Notes to the consolidated financial statementscontinued

Strategic Report Corporate Governance Report
Financial Statements
181www.securetrustbank.co.uk
38. Country-by-Country Reporting
The Capital Requirements (Country-by-Country Reporting) Regulations 2013 introduced reporting obligations for institutions within the scope of CRD IV. The requirements aim to give increased transparency regarding the activities of institutions.
The Country-by-Country Information is set out below:
31 December 2017Name Nature of activity Location
Turnover £million
Number of FTE
employees
Profit before tax
£million
Tax paid on profit£million
Secure Trust Bank PLC Banking services UK 165.3 734 29.3 6.0
31 December 2016Name Nature of activity Location
Turnover £million
Number of FTE
employees
Profit before tax
£million
Tax paid on profit£million
Secure Trust Bank PLC Banking services UK 157.5 697 27.5 6.8

Straightforward transparent bankingSecure Trust Bank PLC Annual Report & Accounts 2017
182
2017£million
2016£million
2015£million
2014£million
2013£million
Profit for the year Interest and similar income 149.3 141.1 139.7 93.6 73.8 Interest expense and similar charges (26.7) (26.3) (21.6) (14.2) (12.9)
Net interest income 122.6 114.8 118.1 79.4 60.9
Net fee and commission income 14.9 14.5 14.4 18.5 18.1
Operating income 137.5 129.3 132.5 97.9 79.0
Impairment losses on loans and advances (36.9) (30.3) (24.3) (15.3) (15.6)Gain from a bargain purchase – – – – 0.4 Exceptional costs – – – – (0.9)Arbuthnot Banking Group recharges – – (0.8) (0.2) (0.1)Operating expenses (71.6) (71.5) (70.9) (56.3) (45.7)Profit on sale of equity instruments available-for-sale 0.3 – – – –
Profit before income tax 29.3 27.5 36.5 26.1 17.1
2017£million
2016£million
2015£million
2014£million
2013£million
Earnings per share for profit attributable to the equity holders of the Group during the year
(expressed in pence per share) – basic 128.8 754.1 157.8 122.3 78.3
2017£million
2016£million
2015£million
2014£million
2013£million
Financial position Cash and balances at central banks 226.1 112.0 131.8 81.2 – Loans and advances to banks 34.3 18.2 11.5 39.8 110.0 Loans and advances to customers 1,598.3 1,321.0 1,074.9 622.5 391.0 Debt securities held-to-maturity 5.0 20.0 3.8 16.3 – Other assets 27.9 38.8 25.4 22.5 24.9
Total assets 1,891.6 1,510.0 1,247.4 782.3 525.9
Due to banks 113.0 70.0 35.0 15.9 0.1 Deposits from customers 1,483.2 1,151.8 1,033.1 608.4 436.6 Other liabilities 46.3 52.2 38.1 33.1 27.6 Total shareholders’ equity 249.1 236.0 141.2 124.9 61.6
Total liabilities and shareholders’ equity 1,891.6 1,510.0 1,247.4 782.3 525.9
Five year summary (unaudited)

Strategic Report Corporate Governance Report
Financial Statements
183www.securetrustbank.co.uk
Appendix to the Annual Report (unaudited)
Key performance indicators
All revenue, income, impairments, and expenses used in the calculations below are stated on a continuing operations basis.
(i) Margin ratiosNet interest margin is calculated as interest receivable and similar income less interest expense and similar charges as a percentage of the average loan book, net revenue margin is calculated as operating income as a percentage of the average loan book and gross revenue margin is calculated as interest receivable and similar income plus fee and commission income as a percentage of the average loan book. The calculation of the average loan book is the average of the monthly balance of loans and advances to customers, net of provisions and discontinued operations:
2017£million
2016£million
Net interest marginInterest receivable and similar income 141.3 118.8Interest expense and similar charges (26.7) (26.3)
Net interest income 114.6 92.5
Net revenue marginNet interest income 114.6 92.5Net fee and commission income 14.9 14.5
Operating income 129.5 107.0
Gross revenue marginInterest receivable and similar income 141.3 118.8Fee and commission income 16.0 16.3
Gross revenue 157.3 135.1
Opening loan book 1,255.5 886.3Closing loan book 1,598.3 1,255.5
Average loan book 1,418.1 1,065.1
Net interest margin 8.1% 8.7%
Net revenue margin 9.1% 10.0%
Gross revenue margin 11.1% 12.7%
A reconciliation of the loan book figures used above to the statement of financial position is as follows:
2017£million
2016£million
2015£million
Balance sheet loan book 1,598.3 1,321.0 960.6PLD loans – (65.5) (74.3)
1,598.3 1,255.5 886.3
The margin ratios all measure the yield of the loan book.

Straightforward transparent bankingSecure Trust Bank PLC Annual Report & Accounts 2017
184
Key performance indicators continued
(ii) Cost ratiosCost of risk is calculated as net impairment losses on loans and advances to customers as a percentage of the average loan book, cost of funds is calculated as interest expense as a percentage of average loan book and cost to income ratio is calculated as operating expenses as a percentage of operating income:
2017£million
2016£million
Net impairment losses on loans and advances to customers 33.5 23.3Average loan book 1,418.2 1,065.1
Cost of risk 2.4% 2.2%
Interest expense 26.7 26.3Average loan book 1,418.2 1,065.1
Cost of funds 1.9% 2.5%
Operating expenses 71.3 64.3Operating income 129.5 107.0
Cost to income ratio 55.1% 60.1%
The cost of risk measures how effective the Group has been in managing its impairment losses. The cost of funds measures the cost of money being lent to customers. The cost to income ratio measures how efficiently the Group is utilising its cost base in producing income.
(iii) Return ratiosAnnualised underlying return on average assets is calculated as the underlying profit after tax for the previous 12 months as a percentage of average assets, annualised underlying return on average equity is calculated as the underlying profit after tax for the previous 12 months as a percentage of average equity and annualised underlying return on required equity is calculated as the underlying profit after tax for the previous 12 months as a percentage of average required equity.
Underlying profit after tax is profit after tax attributable to continuing operations, adjusted for items that are non-controllable items or other items that fall outside of the Group’s core business activities. A reconciliation of underlying profit after tax to statutory profit after tax is provided on page 14.
Average assets is calculated as the average of the monthly assets balances, net of discontinued operations, average equity is calculated as the average of the monthly equity balances and average required equity is calculated as the average of the monthly balances of total required equity. Total required equity is calculated as the equity required to achieve a CET1 ratio of 12%, excluding equity required against discontinued operations:
Appendix to the Annual Report (unaudited)continued
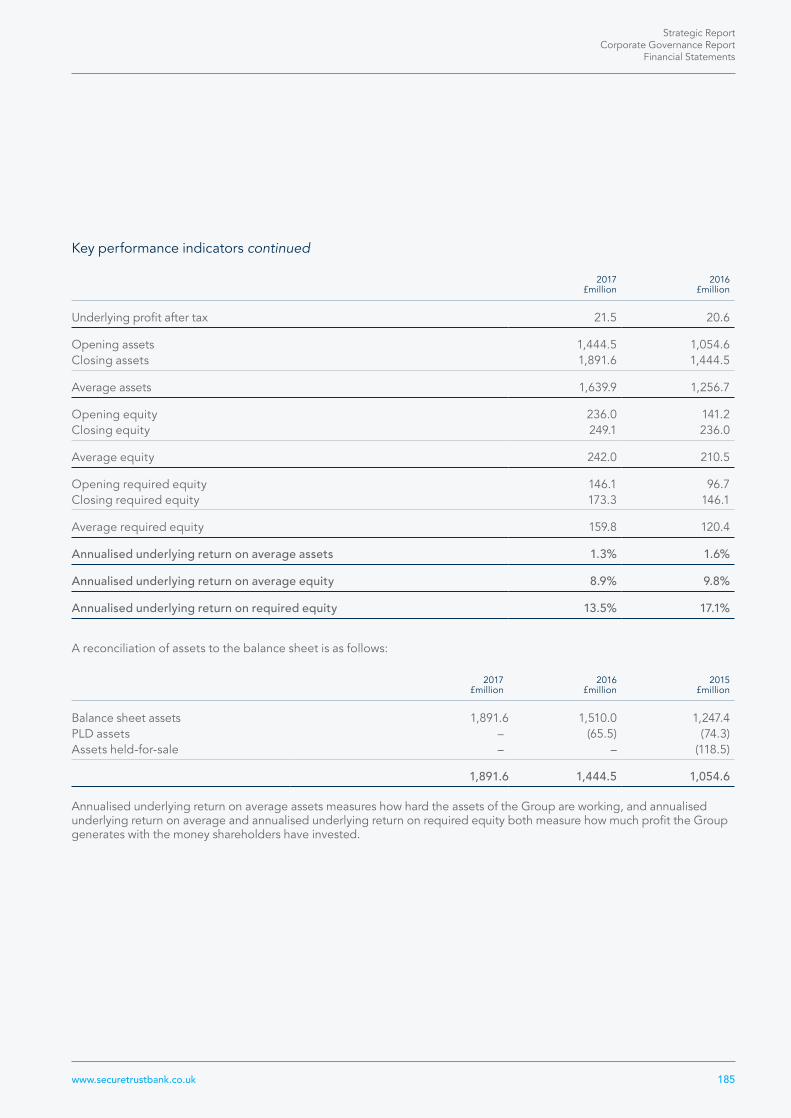
Strategic Report Corporate Governance Report
Financial Statements
185www.securetrustbank.co.uk
Key performance indicators continued
2017£million
2016£million
Underlying profit after tax 21.5 20.6
Opening assets 1,444.5 1,054.6Closing assets 1,891.6 1,444.5
Average assets 1,639.9 1,256.7
Opening equity 236.0 141.2Closing equity 249.1 236.0
Average equity 242.0 210.5
Opening required equity 146.1 96.7Closing required equity 173.3 146.1
Average required equity 159.8 120.4
Annualised underlying return on average assets 1.3% 1.6%
Annualised underlying return on average equity 8.9% 9.8%
Annualised underlying return on required equity 13.5% 17.1%
A reconciliation of assets to the balance sheet is as follows:
2017£million
2016£million
2015£million
Balance sheet assets 1,891.6 1,510.0 1,247.4PLD assets – (65.5) (74.3)Assets held-for-sale – – (118.5)
1,891.6 1,444.5 1,054.6
Annualised underlying return on average assets measures how hard the assets of the Group are working, and annualised underlying return on average and annualised underlying return on required equity both measure how much profit the Group generates with the money shareholders have invested.

Straightforward transparent bankingSecure Trust Bank PLC Annual Report & Accounts 2017
186
Key performance indicators continued
(iv) Funding ratiosThe loan to deposit ratio is calculated as the loan book, net of discontinued operations, at the year end, divided by deposits from customers at the year end, and the total funding ratio is calculated as the total funding at the year end, being the sum of deposits from customers, borrowings under the Term Funding Scheme, or the Funding for Lending Scheme, and equity, divided by the loan book, net of discontinued operations, at the year end:
2017£million
2016£million
Loan book 1,598.3 1,255.5
Deposits from customers 1,483.2 1,151.8Borrowings under the Term Funding Scheme, or the Funding for Lending Scheme 113.0 70.0Equity 249.1 236.0
Total funding 1,845.3 1,457.8
Loan to deposit ratio 107.8% 109.0%
Total funding ratio 115.5% 116.1%
The funding ratios measure the Group’s liquidity.
Appendix to the Annual Report (unaudited)continued

Strategic Report Corporate Governance Report
Financial Statements
187www.securetrustbank.co.uk
Glossary
Term Explanation
AIM The Alternative Investment Market is the London Stock Exchange’s international market for smaller growing companies. A wide range of businesses including early stage, venture capital backed as well as more established companies join AIM seeking access to growth capital.
ALCO The Assets and Liabilities Committee. The remit of the Committee is set out on page 68.
Bank of England The Bank of England promotes the good of the people of the United Kingdom by maintaining monetary and financial stability. It also performs a supervisory role of the banking system via the Prudential Regulation Authority.
CET 1 capital Common Equity Tier 1 capital comprises a bank’s core capital and includes common shares, stock surpluses resulting from the issue of common shares, retained earnings, common shares issued by subsidiaries and held by third parties, and accumulated other comprehensive income.
CET 1 capital ratio The Common Equity Tier 1 capital ratio is the ratio of the bank’s CET 1 capital to its Total Risk Exposure. This signifies a bank’s financial strength. The CET 1 capital ratio is utilised by regulators and investors because it shows how well a bank can withstand financial stress and remain solvent.
CRD IV Capital Requirements Directive IV is intended to implement the Basel III agreement in the EU. This includes enhanced requirements for the quality and quantity of capital; a basis for new liquidity and leverage requirements; new rules for counterparty risk; and new macroprudential standards including a countercyclical capital buffer and capital buffers for systemically important institutions.
Capital Requirement Regulation
The EU regulation implementing CRD IV directly across the EU.
DBP Deferred Bonus Plan.
DMS Debt Managers (Services) Limited, the wholly owned subsidiary of Secure Trust Bank PLC, responsible for carrying out market leading debt recovery services to the credit industry.
ELG Everyday Loans Group, which comprised Everyday Loans Holdings Limited and subsidiary companies Everyday Lending Limited and Everyday Loans Limited.
EU European Union.
Financial Conduct Authority
The Financial Conduct Authority is the conduct regulator for 56,000 financial services firms and financial markets in the UK. Its aims are to protect consumers, enhance market integrity and promote competition.
FEEFO The Feedback Forum collects independent reviews from the customers of over 2,500 businesses.
Funding for Lending Scheme
The Funding for Lending Scheme was designed to incentivise banks and building societies to boost their lending to the UK real economy. It did that by providing funding to banks and building societies for an extended period, with both the price and quantity of funding provided linked to their lending performance. This scheme is now in run-off and is being replaced by the Term Funding Scheme.
The Financial Ombudsman Service
Set up by Parliament, the Financial Ombudsman Service is the UK’s official expert in sorting out problems with financial services.
Financial Services Compensation Scheme
The Financial Services Compensation Scheme protects consumers when authorised financial services firms fail.
General Data Protection Regulation
The General Data Protection Regulation (Regulation (EU) 2016/679) is a regulation by which the European Parliament, the European Council and the European Commission intend to strengthen and unify data protection for individuals within the European Union. It also addresses export of personal data outside the European Union.
High Quality Liquid Assets
High Quality Liquid Assets are assets with a high potential to be converted easily and quickly into cash. This is comprised of cash and balances at central banks and treasury bills that are the subject of a repurchase agreement (see below).
IAS International Accounting Standard.

Straightforward transparent bankingSecure Trust Bank PLC Annual Report & Accounts 2017
188
Term Explanation
ICAAP Internal Capital Adequacy Assessment Process. A firm must carry out an ICAAP in accordance with the PRA’s ICAAP rules. These include requirements on the firm to undertake a regular assessment of the amounts, types and distribution of capital that it considers adequate to cover the level and nature of the risks to which it is or might be exposed.
IFRS International Financial Reporting Standard.
ILAAP The Internal Liquidity Adequacy Assessment Process allows firms to assess the level of liquidity and funding that adequately supports all relevant current and future liquidity risks in their business. In undertaking this process, a firm should be able to ensure that it has appropriate processes in place to ensure compliance with the CRD IV. This requires firms to develop and use appropriate risk and liquidity management techniques.
Individual Capital Guidance
Guidance given to a firm about the amount and quality of capital resources that the PRA considers that firm should hold at all times under the overall financial adequacy rule as it applies on a solo level or a consolidated level.
IPO Initial Public Offering of the Company’s shares on AIM in November 2011.
LCR The Liquidity Coverage Ratio regime requires management of net 30 day cash outflows as a proportion of High Quality Liquid Assets. The Group has set a more prudent internal limit than that proposed in guidance from the regulator.
LTIP Long term incentive plan.
MREL Minimum Requirement for Own Funds and Eligible Liabilities regime.
NSF Non-Standard Finance plc, the AIM listed business that bought ELG on 16 April 2016.
Overall Liquidity Adequacy Rule
The Overall Liquidity Adequacy Rule is the Board’s own view of the Group’s liquidity needs as set out in the Board approved ILAAP.
Pillar 1, Pillar 2 and Pillar 3
Basel III uses a ‘three pillars’ concept – (1) Pillar 1 – minimum capital requirements (addressing risk) using a standardised approach for credit, market and operational risk, (2) Pillar 2 – supervisory review process and (3) Pillar 3 – market discipline and enhanced disclosures. Basel II is the second of the Basel Accords, (now extended and partially superseded by Basel III), which are recommendations on banking laws and regulations issued by the Basel Committee on Banking Supervision.
PRA The Prudential Regulation Authority was created as a part of the Bank of England by the Financial Services Act (2012) and is responsible for the prudential regulation and supervision of around 1,700 banks. The PRA’s objectives are set out in the Financial Services and Markets Act 2000, but the main objective is to promote the safety and soundness of the firms it regulates.
PSOS Phantom Share Option Scheme.
Repurchase agreement A repurchase agreement is a form of short-term borrowing for dealers in government securities. The dealer sells the government securities to investors, and buys them back at an agreed point in the future.
Required Equity Required equity is calculated as the mean of the total required equity at the 13 previous month ends. Total required equity is calculated to achieve a CET 1 ratio of 12%, excluding equity required against discontinued operations.
SOS1 Share options vesting on 2 November 2014.
SOS2 Share options vesting on 2 November 2016.
SME Small to medium sized enterprises.
Term Funding Scheme The Term Funding Scheme is designed to reinforce the transmission of Bank Rate cuts to those interest rates actually faced by households and businesses by providing term funding to banks at rates close to Bank Rate. The Term Funding Scheme allows participants to borrow central bank reserves in exchange for eligible collateral.
Glossarycontinued

Strategic Report Corporate Governance Report
Financial Statements
189www.securetrustbank.co.uk
Term Explanation
Tier 2 capital Tier 2 capital is the secondary component of bank capital, in addition to Tier 1 capital, that makes up a bank’s required reserves. Tier 2 capital is designated as supplementary capital, and is composed of Collective allowance for impairment of loans and advances.
Total Risk Exposure Total Risk Exposure is the total of the bank’s risk-weighted assets.
Underlying return on required equity
Annualised underlying return on required equity is calculated as the underlying profit after tax for the previous 12 months as a percentage of average required equity.
UPL Unsecured personal lending.
V12 V12 Retail Finance Limited, the wholly owned subsidiary of Secure Trust Bank PLC, responsible for retail lending.

Straightforward transparent bankingSecure Trust Bank PLC Annual Report & Accounts 2017
190
Corporate contacts and advisers
Secretary & Registered Office
A J Karter LLB (Hons)One Arleston WaySolihull West MidlandsB90 4LHT 0121 693 9100F 0121 693 9124
Advisers
Independent AuditorKPMG LLPOne SnowhillSnow Hill QueenswayBirminghamB4 6GH
Principal BankerBarclays Bank PLC38 Hagley RoadEdgbastonBirminghamB16 8NY
StockbrokersCanaccord Genuity Limited88 Wood StreetLondonEC2V 7QR
Stifel Nicolaus Europe Limited150 CheapsideLondonEC2V 6ET
RegistrarLink Asset ServicesThe Registry34 Beckenham RoadBeckenhamKentBR3 4TU


Secure Trust Bank PLC One Arleston Way Shirley Solihull West Midlands B90 4LH
T 0121 693 9100
Registration No. 00541132
www.securetrustbank.co.uk