![La Catedral(Stover Ed.)[1]](https://static.fdocuments.net/doc/165x107/55cf9135550346f57b8b8a5c/la-catedralstover-ed1.jpg)
Stover Update Mallarino
29
Nutrient Considerations with Corn Stover Harvest Antonio P. Mallarino John E. Sawyer Department of Agronomy Iowa State University
-
Upload
pioneerlacek -
Category
Technology
-
view
754 -
download
0
Transcript of Stover Update Mallarino

Nutrient Considerations with
Corn Stover Harvest
Antonio P. Mallarino
John E. Sawyer
Department of Agronomy
Iowa State University

Stover Harvest for Feed, Bedding, Bioenergy
Much Larger Impacts on K Removal and Soil-Test K than for P
Topics
Corn biomass and carbon
Corn silage harvest and nutrient removal
Corn grain and stover nutrient composition
Corn grain and stover nutrient cost
Stover harvest effect on corn yield and N
fertilization rate in continuous corn
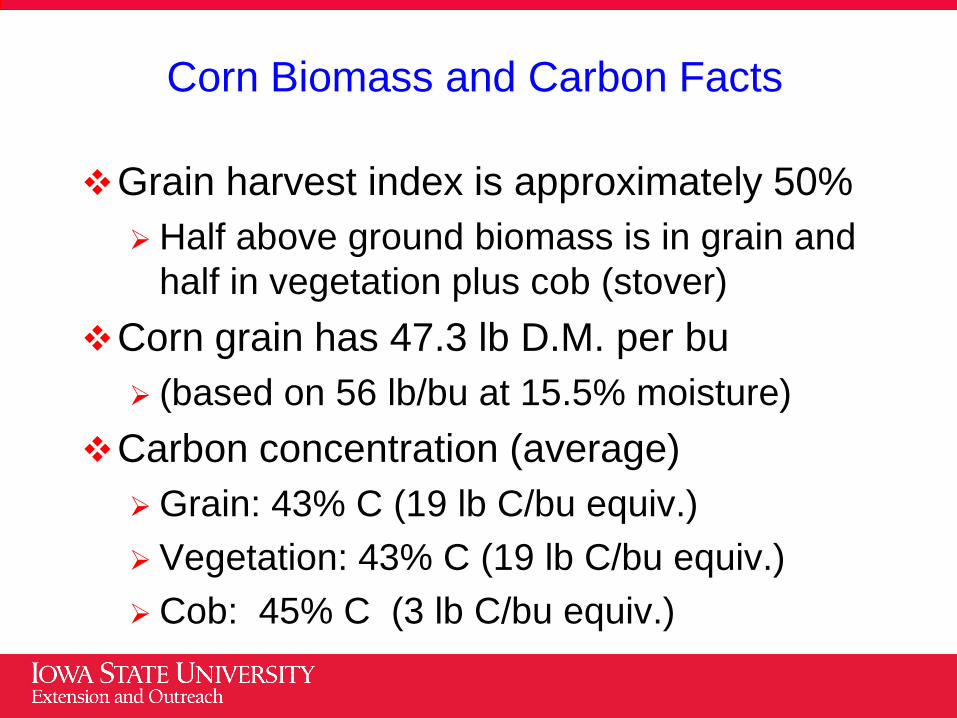
Corn Biomass and Carbon Facts
Grain harvest index is approximately 50%
Half above ground biomass is in grain and
half in vegetation plus cob (stover)
Corn grain has 47.3 lb D.M. per bu
(based on 56 lb/bu at 15.5% moisture)
Carbon concentration (average)
Grain: 43% C (19 lb C/bu equiv.)
Vegetation: 43% C (19 lb C/bu equiv.)
Cob: 45% C (3 lb C/bu equiv.)

Grain ~50%
Silage Harvest
Grain
Leaf Blades
Stalk, Leaf Sheaths
Shank, Husk, Cob Tassel
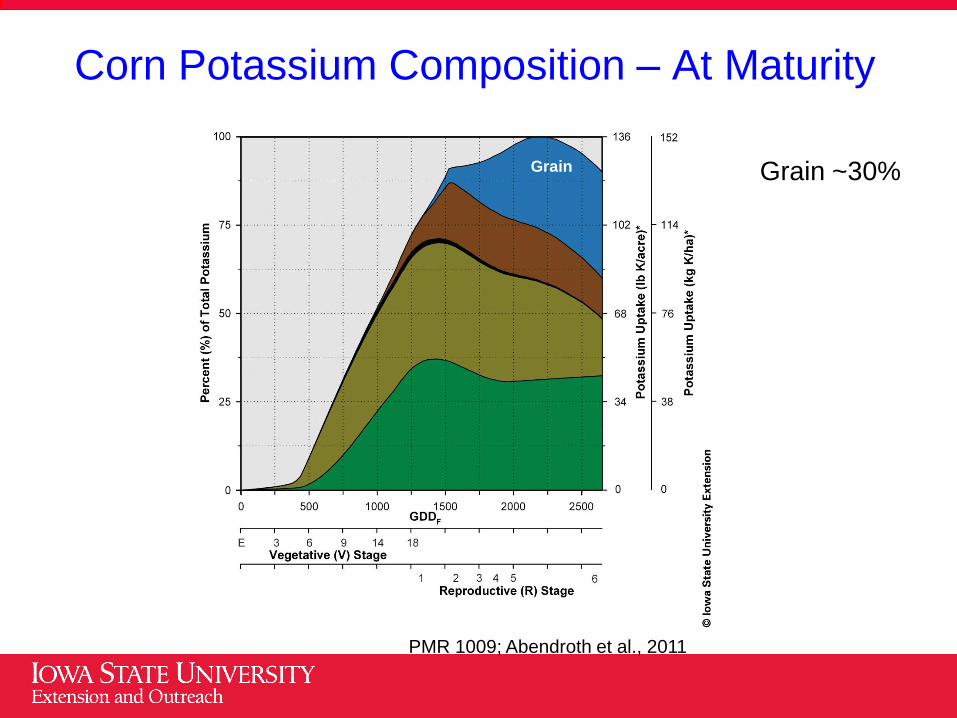
PMR 1009; Abendroth et al., 2011

Corn Silage Harvest
Silage harvests nearly 100% aboveground
vegetation
Harvest silage at 60-70% moisture
Before plant maturity
Close to total dry matter (DM) accumulation
Close to total nutrient accumulation

Corn Silage Harvest
ISU P and K concentrations in PM 1688
3.5 lb P2O5 per ton silage (65% moisture)
10 lb P2O5 per ton silage (DM basis)
0.5 lb P2O5 per bu equivalent (15% moist.)
9.0 lb K2O per ton silage (65% moisture)
26 lb K2O per ton silage (DM basis)
1.25 lb K2O per bu equivalent
Have not worried about N or other nutrients
removal with silage harvest

Corn Stover Harvest
Grain is harvested separate
Harvest stover after plant maturity and at or
after grain harvest
After total dry matter (DM) accumulation
After total nutrient accumulation
After nutrient leaching loss from plant before
grain harvest or from stover residue

Grain
PMR 1009; Abendroth et al., 2011
Corn Nitrogen Composition – At Maturity
Grain ~70%

Grain
PMR 1009; Abendroth et al., 2011
Corn Phosphorus Composition – At Maturity
Grain ~86%
Grain
PMR 1009; Abendroth et al., 2011
Corn Potassium Composition – At Maturity
Grain ~30%

Corn Stover Harvest Considerations
Consideration of all nutrients removed?
Nutrient removal setting cost of stover?
Estimating amount of stover harvested?
Nutrient removal amount?
Stover moisture?

Corn Nutrient Composition – At Maturity
PM 1688
Gr. St.
16 5.9
13 25 ( 2)
(17)
( 1)
(10)
Nutrient Grain Veg. Cob Grain Veg. Cob
C 3717 3283 469 795 840 787N 110 48 8 24 12 13
P2O5 55 11 -- 12 3 --K2O 37 85 -- 8 22 --
Ca 8 37 -- 2 9 --Mg 9 25 -- 2 6 --S 8 5 -- 2 1 --Zn 0.14 0.12 -- 0.030 0.031 --Mn 0.03 0.27 -- 0.006 0.069 --Cu 0.02 0.06 -- 0.004 0.015 --B 0.04 0.06 -- 0.009 0.015 --Fe 0.22 1.10 -- 0.047 0.281 --
Dry Matter 9355 7816 119214 site years; at plant maturity; 198 bu/acre grain yield.
J. Sawyer and D. Barker, Iowa State University, 2006-2007.
Corn Nutrient Composition
- - - - - lb/acre - - - - - - - - lb/ton (D.M.) - - -

Corn Stover Nutrient Composition
Nutrient Average Range
P2O5 3 10
K2O 19 44
Ca 8 8
Mg 4 7
S 1 1
Zn 0.033 0.052
Mn 0.096 0.167
Cu 0.013 0.024
B 0.010 0.011
Fe 0.148 0.17129 site years, 2008-2011.
Little or no soil contamination.
R. Oltmans and A.P. Mallarino (2011).
Corn Stover at Grain Harvest
- - lb/ton (D.M) - -

Distribution of P Removal in Stover Harvest
from 50 Central Iowa Fields, 2011
Stover P Concentration (lb P2O5/ton)
0 1 2 3 4 5 6 7 8 9 10 11 12
Fre
qu
en
cy (
%)
0
2
4
6
8
10
12
14
16
18
PhosphorusAverage: 3.7Median: 3.3
DM concentrations, M. Darr et al., Iowa State Univ. May contain soil contamination.

Distribution of K Removal in Stover Harvest
from 50 Central Iowa Fields, 2011
DM concentrations, M. Darr et al., Iowa State Univ. May contain soil contamination.
Stover K Concentration (lb K2O/ton)
0 5 10 15 20 25 30 35 40 45
Fre
qu
en
cy (
%)
0
2
4
6
8
10
12
14 PotassiumAverage: 16.5Median: 15.3

Corn Grain Phosphorus and Potassium
Composition Variability
Mallarino et al., 2011 Mallarino et al., 2011
Arrows indicate current ISU Pub. PM-1688 values.

Iowa P-K Recycling Research, 2008 to 2012
Ryan Oltmans and Antonio Mallarino, support by the Iowa Soybean Association and International Plant Nutrition Institute
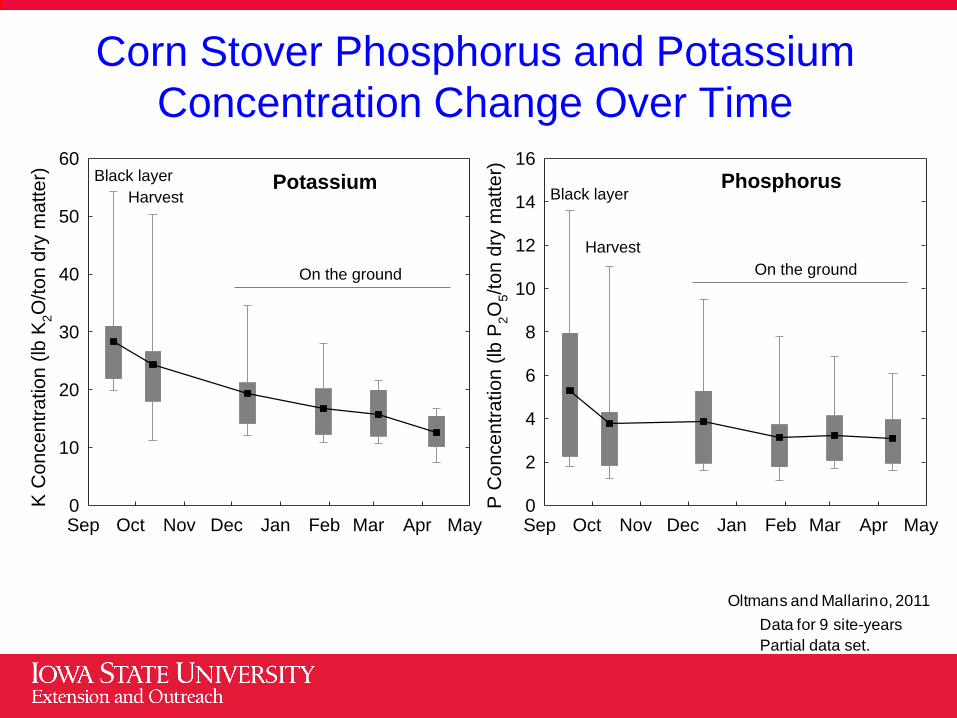
Corn Stover Phosphorus and Potassium
Concentration Change Over Time
Harvest time currently assumed average
25 lb K2O/ton = 1.0 %
Harvest time currently assumed average
5.9 lb P2O5/ton = 0.13 %
Oltmans and Mallarino, 2011
Data for 9 site-years
Sep Oct Nov Dec Jan Feb Mar Apr May
K C
oncen
tra
tio
n (
lb K
2O
/to
n d
ry m
atte
r)
0
10
20
30
40
50
60
Harvest
On the ground
Black layer Potassium
Sep Oct Nov Dec Jan Feb Mar Apr May
P C
oncen
tra
tio
n (
lb P
2O
5/t
on
dry
ma
tte
r)0
2
4
6
8
10
12
14
16
Harvest
On the ground
Black layerPhosphorus
Partial data set.

Potassium Loss and Precipitation
Oltmans and Mallarino, 2012
Precipitation (inches)
0 5 10 15 20 25
Tis
sue A
ccum
ula
tion (
lb K
2O
/acre
)
0
20
40
60
80
100
120
140
160
Precipitation (inches)
0 5 10 15 20 25
Soybean Corn
Y = 11.1e-(2.93/(X+1.47))
R2 = 0.84
P < 0.01
Y = 23.3e-(5.85/(X+4.70))
R2 = 0.68
P < 0.01

Nutrient Cost in Corn Grain and Stover At Plant Maturity
Nutrient Grain Stover Grain Stover Price Nutrient Product
$/ton $/lb
N 110 54 52.80 25.92 768 0.48 Ammonia
P2O5 55 14 28.05 7.14 645 0.51 DAP
K2O 37 99 18.50 49.50 615 0.50 Potash
Ca 8 41 0.24 1.23 20 0.03 Lime
Mg 9 27 0.27 0.81 20 0.03 Lime
S 8 5 3.36 2.10 750 0.42 Elemental
Total 103.22 86.70
Corn grain at 198 bu/acre; corn stover at 4.5 ton D.M./acre. At plant maturity.
J. Sawyer, Iowa State University.
Example Estimated Nutrient Cost
Fertilizer/Lime
- - lb/acre - - - - $/acre - -

Nutrient Cost in Corn Stover At Grain Harvest
Nutrient Price Nutrient Product
lb/acre $/acre $/ton $/lbP2O5 3 1.53 645 0.51 DAP
K2O 19 9.50 615 0.50 Potash
Ca 8 0.24 20 0.03 Lime
Mg 4 0.12 20 0.03 Lime
S 1 0.42 750 0.42 Elemental
Total 11.81
R.Oltmans and A.P. Mallarino (2011).
Little or no soil contamination.
Per Ton DM
Example Nutrient Cost - Stover at Grain Harvest
Fertilizer/LimeCorn Stover

Corn Stover Equivalent Price to Grain
$/bu $/acre $/lb DM $/ton DM $/lb C $/ton C
5.00 990 0.11 220 0.26 528
6.00 1188 0.13 264 0.32 633
7.00 1386 0.15 308 0.37 739
198 9008 3752
bu/acre lb DM/acre lb C/acre
J. Sawyer, Iowa State University.
Corn Stover Priced Equivalent to Corn Grain
Corn Grain Corn Stover
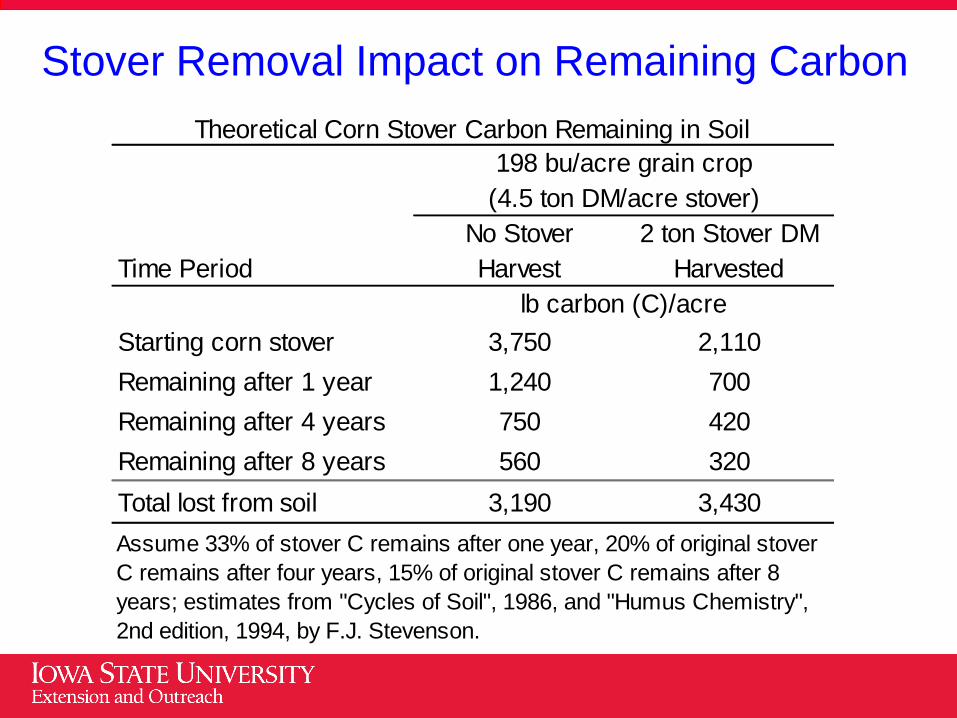
Stover Removal Impact on Remaining Carbon
No Stover 2 ton Stover DM
Time Period Harvest Harvested
Starting corn stover 3,750 2,110
Remaining after 1 year 1,240 700
Remaining after 4 years 750 420
Remaining after 8 years 560 320
Total lost from soil 3,190 3,430
lb carbon (C)/acre
Theoretical Corn Stover Carbon Remaining in Soil
Assume 33% of stover C remains after one year, 20% of original stover
C remains after four years, 15% of original stover C remains after 8
years; estimates from "Cycles of Soil", 1986, and "Humus Chemistry",
2nd edition, 1994, by F.J. Stevenson.
198 bu/acre grain crop
(4.5 ton DM/acre stover)

Corn Stover Removal and Tillage Effect on
Yield and N Fertilization in Continuous Corn
Residue
Removal EONR YEONR EONR YEONR
lb N/acre bu/acre lb N/acre bu/acre
None 228 179 227 162
50% 203 177 212 173
100% 185 181 189 170
J. Pantoja et al., Iowa State University
Chisel Plow No-Tillage
Effect of tillage and residue removal on corn grain yield
and economic optimum N rate across sites, 2009-2011.
EONR, economic optimum N rate; YEONR, yield at EONR.
EONR and YEONR at 0.10 N:corn grain price ratio.

Corn Stover Removal and Tillage Effect on
Yield and N Fertilization in Continuous Corn
Residue
Removal EONR YEONR EONR YEONR
lb N/acre bu/acre lb N/acre bu/acre
None 181 205 161 164
Partial 161 215 140 154
Full 161 215 102 137
Three sites normal precip., one site low precip.
J.A. Coulter and E.D. Nafziger, 2008.
Effect of tillage and residue removal on corn grain yield
and economic optimum N rate, 2006-2007, Univ. IL.
Avg. across systems No-till (Low precip)
EONR, economic optimum N rate; YEONR, yield at EONR.
EONR and YEONR at 0.10 N:corn grain price ratio.

Summary
In Iowa continuous corn research (short
term)
Stover harvest reduced the EONR by 20 lb
N/acre (half removal) and 40 lb N/acre (full
removal)
Stover harvest did not change yield with
chisel plow
Stover harvest increased yield with no-tillage
(6%)

Summary
Corn stover has less N than grain (2x less)
Corn stover has less P than grain (4x less)
Corn stover has more K than grain (3x more)
Stover nutrient concentration varies
Stover harvest in addition to grain harvest
removes more nutrients than grain alone
Stover harvest removes carbon

Summary
Nutrient value in harvested stover depends
on harvest amount, timing, and fertilizer price
Suggested average corn stover nutrient
concentrations (lb/ton dry matter)
But remember the variation (conc. and soil)
N: 17 lb/ton
P2O5: 3 lb/ton
K2O: 19 lb/ton
Test harvested stover for nutrient content