Stormy Energy Future and Security Strategyeneken.ieej.or.jp/data/6739.pdf · Energy demand . GDP ....
37
Stormy Energy Future and Security Strategy 2016-5-26 IEEJ / APERC Symposium Former Executive Director, IEA President, the Sasakawa Peace Foundation Nobuo TANAKA IEEJ:June 2016 © IEEJ2016
Transcript of Stormy Energy Future and Security Strategyeneken.ieej.or.jp/data/6739.pdf · Energy demand . GDP ....
Stormy Energy Future and
Security Strategy
2016-5-26 IEEJ / APERC Symposium Former Executive Director, IEA President, the Sasakawa Peace Foundation Nobuo TANAKA
IEEJ:June 2016 © IEEJ2016
Oil as strategic commodity
“Safety and certainty in oil lie in variety and variety alone.”
2
IEEJ:June 2016 © IEEJ2016

© O
ECD
/IEA
201
5
London, 10 November 2015
3
IEEJ:June 2016 © IEEJ2016

The start of a new energy era?
• 2015 has seen lower prices for all fossil fuels
– Oil & gas could face second year of falling upstream investment in 2016
– Coal prices remain at rock-bottom as demand slows in China
• Signals turn green ahead of key Paris climate summit
– Pledges of 150+ countries account for 90% of energy-related emissions
– Renewables capacity additions at a record-high of 130 GW in 2014
– Fossil-fuel subsidy reform, led by India & Indonesia, reduces the global subsidy bill below $500 billion in 2014
• Multiple signs of change, but are they moving the energy system in the right direction?
WEO2015 4
IEEJ:June 2016 © IEEJ2016

Low Oil Price Scenario
WEO2015
What will happen if Oil Price of $50 per barrel continues well into 2020s? 5
IEEJ:June 2016 © IEEJ2016
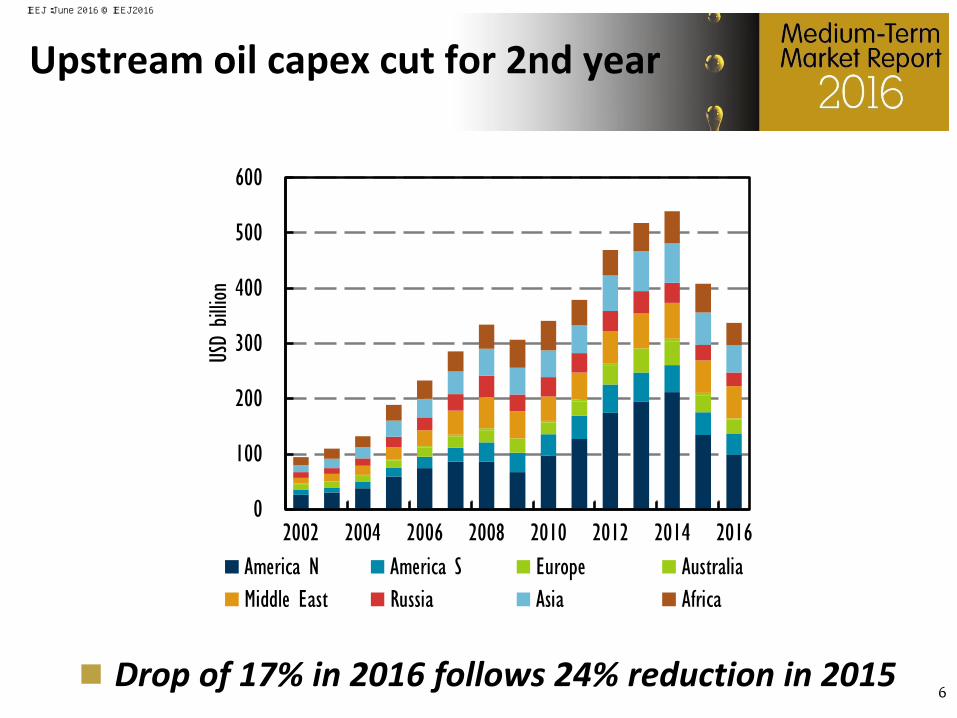
6
IEEJ:June 2016 © IEEJ2016

7
IEEJ:June 2016 © IEEJ2016

A new balancing item in the oil market?
Change in production (2015-2020) of US tight oil for a range of 2020 oil prices
Tight oil has created more short-term supply flexibility, but there is no guarantee that the adjustment mechanism in oil markets will be smooth
-4
-3
-2
-1
0
1
2
$40/bbl $50/bbl $60/bbl $70/bbl $80/bbl $90/bbl $100/bbl
mb/d
WEO2015
8
IEEJ:June 2016 © IEEJ2016

Mtoe
-300
0
300
600
900
1 200
Demand growth in Asia – the sequel
By 2040, India’s energy demand closes in on that of the United States, even though demand per capita remains 40% below the world average
European Union
United States
Japan Latin America
Middle East
Southeast Asia
Africa China India
Change in energy demand in selected regions, 2014-2040
WEO2015
9
IEEJ:June 2016 © IEEJ2016
2013 2020 2030 2040 2015
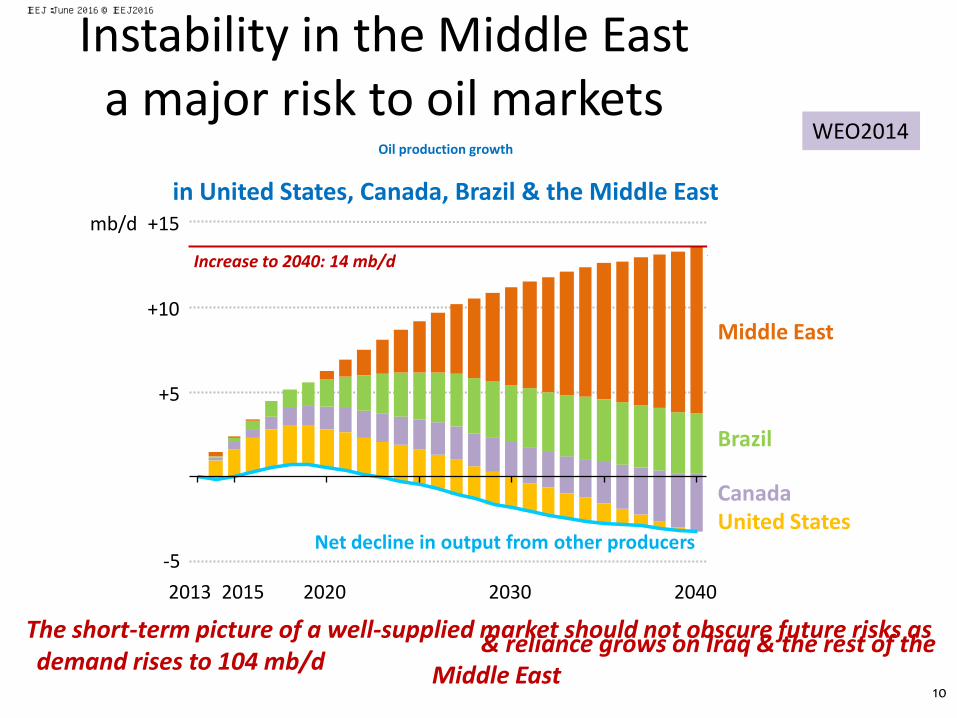
Instability in the Middle East a major risk to oil markets
Oil production growth
The short-term picture of a well-supplied market should not obscure future risks as demand rises to 104 mb/d & reliance grows on Iraq & the rest of the Middle East
+5
+10
+15
-5
2013 2020 2030 2040 2015
Net decline in output from other producers
Increase to 2040: 14 mb/d
mb/d
Increase to 2040: 14 mb/d
Middle East
Brazil
Canada United States
& reliance grows on Iraq & the rest of the
Middle East
in United States, Canada, Brazil & the Middle East
WEO2014
10
IEEJ:June 2016 © IEEJ2016
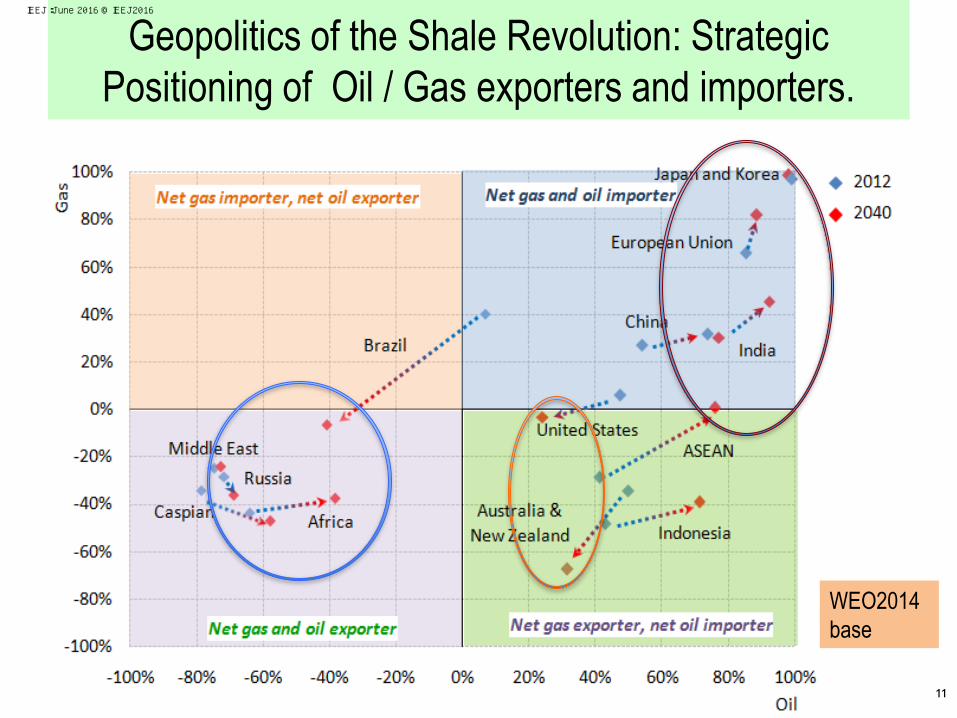
WEO2014
base
11
Geopolitics of the Shale Revolution: Strategic
Positioning of Oil / Gas exporters and importers.
IEEJ:June 2016 © IEEJ2016
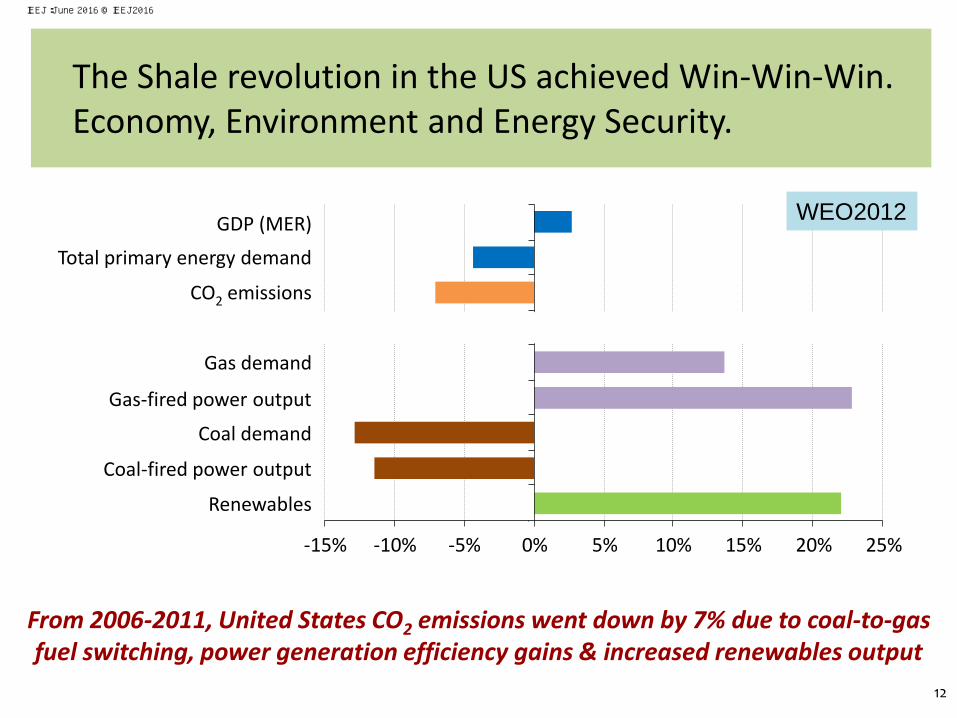
The Shale revolution in the US achieved Win-Win-Win. Economy, Environment and Energy Security.
-15% -10% -5% 0% 5% 10% 15% 20% 25%
Renewables
Coal-fired power output
Coal demand
Gas-fired power output
Gas demand
CO2 emissions
Total primary energy demand
GDP (MER)
From 2006-2011, United States CO2 emissions went down by 7% due to coal-to-gas fuel switching, power generation efficiency gains & increased renewables output
WEO2012
12
IEEJ:June 2016 © IEEJ2016

North American Energy Independence and Middle East Oil to Asia: a new Energy Geopolitics
Middle East oil export by destination
By 2035, almost 90% of Middle Eastern oil exports go to Asia; North America’s emergence as a net exporter accelerates the eastward shift in trade
7
United States Japan & Korea Europe China India
mb/d 2000
2011
2035
1
2
3
4
5
6
IEA WEO2012
13
IEEJ:June 2016 © IEEJ2016

USDOD China Report 2015 14
China’s Oil and Gas Import Transit Routes:
One Belt and One Road (一帯一路)
Figure 2. China’s Import Transit Routes.
IEEJ:June 2016 © IEEJ2016

Should China and India join the IEA?
Net oil imports of selected countries in the New Policies Scenario (mb/d)
Asia becomes the unrivalled centre of the global oil trade as the region draws in a rising share of
the available crude
5
10
15
20
25
OECD China & India
2000
2012
2020
2035
15
IEEJ:June 2016 © IEEJ2016

Gas on the way to become first fuel, with role of LNG on the rise
Main sources of regional LNG supply
Share of LNG rises in global gas trade, pushed by a near-tripling in liquefaction sites: LNG brings more integrated & secure gas markets, but only limited relief on prices
Middle East
Australia
US & Canada
East Africa
Russia
North Africa West Africa
Other
Middle East
Southeast Asia
West Africa Australia
North Africa Other
100
200
300
400
500
600 bcm
2012 2040
WEO2014
16
IEEJ:June 2016 © IEEJ2016

Natural Gas Import Infrastructure in Europe
IEA Medium Term Oil and Gas Markets 2010 17
IEEJ:June 2016 © IEEJ2016

Mid-Term Oil & Gas Market 2010, IEA
Russian Gas Pipelines Will Extend to the East: Recent China Deal
18
IEEJ:June 2016 © IEEJ2016
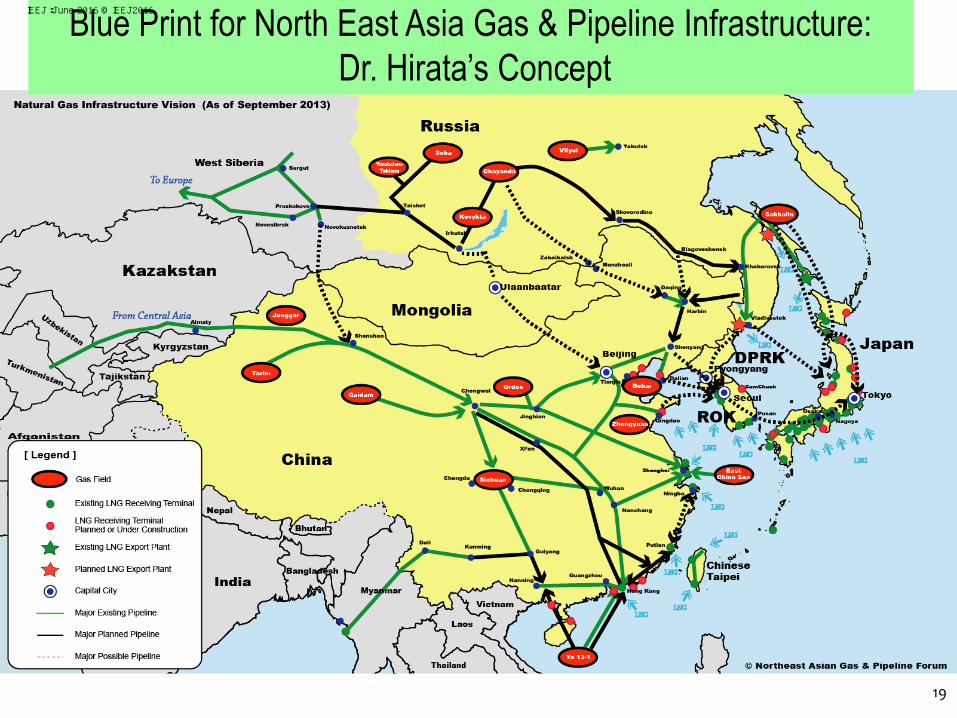
Blue Print for North East Asia Gas & Pipeline Infrastructure:
Dr. Hirata’s Concept
19
IEEJ:June 2016 © IEEJ2016

Trading hub – Asian-tailored solution?
Southeast Asian countries are already interlinked by pipeline and plan to increase these linkages through Trans ASEAN Gas Pipeline (TAGP) and LNG.
TAGP and LNG terminals in Southeast Asia
The Asian Quest for LNG in a Globalising Market
20
IEEJ:June 2016 © IEEJ2016

Possible Pipeline Project from Russia to Japan
Estimated volume of 8bcm pa
21
IEEJ:June 2016 © IEEJ2016
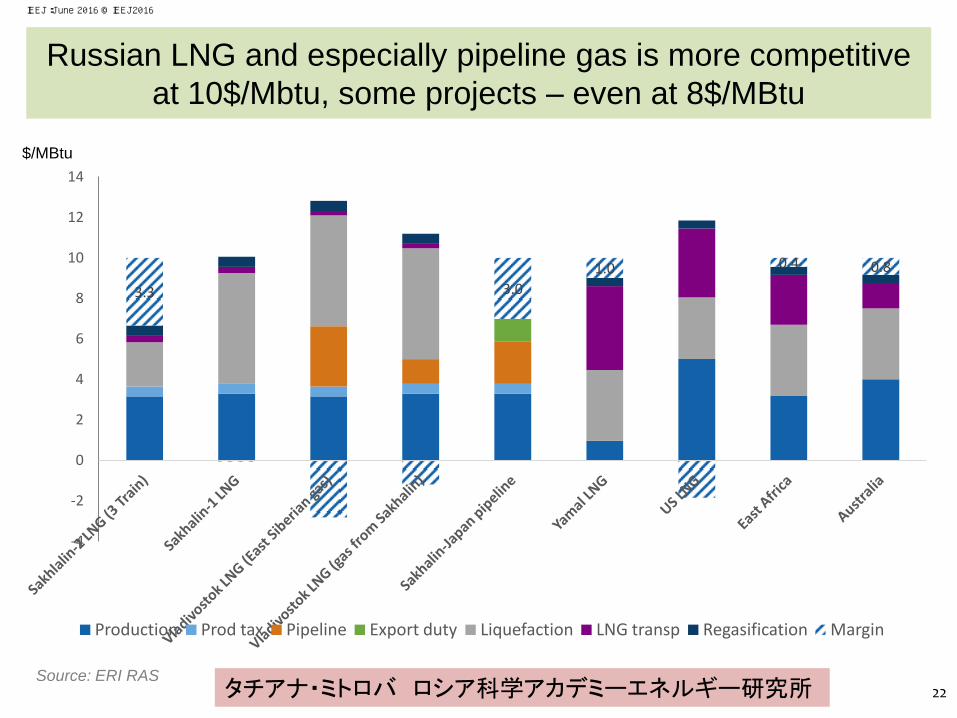
Russian LNG and especially pipeline gas is more competitive
at 10$/Mbtu, some projects – even at 8$/MBtu
3.3 3.0
1.0 0.4 0.8
-4
-2
0
2
4
6
8
10
12
14
Production Prod tax Pipeline Export duty Liquefaction LNG transp Regasification Margin
$/MBtu
Source: ERI RAS タチアナ・ミトロバ ロシア科学アカデミーエネルギー研究所 22
IEEJ:June 2016 © IEEJ2016
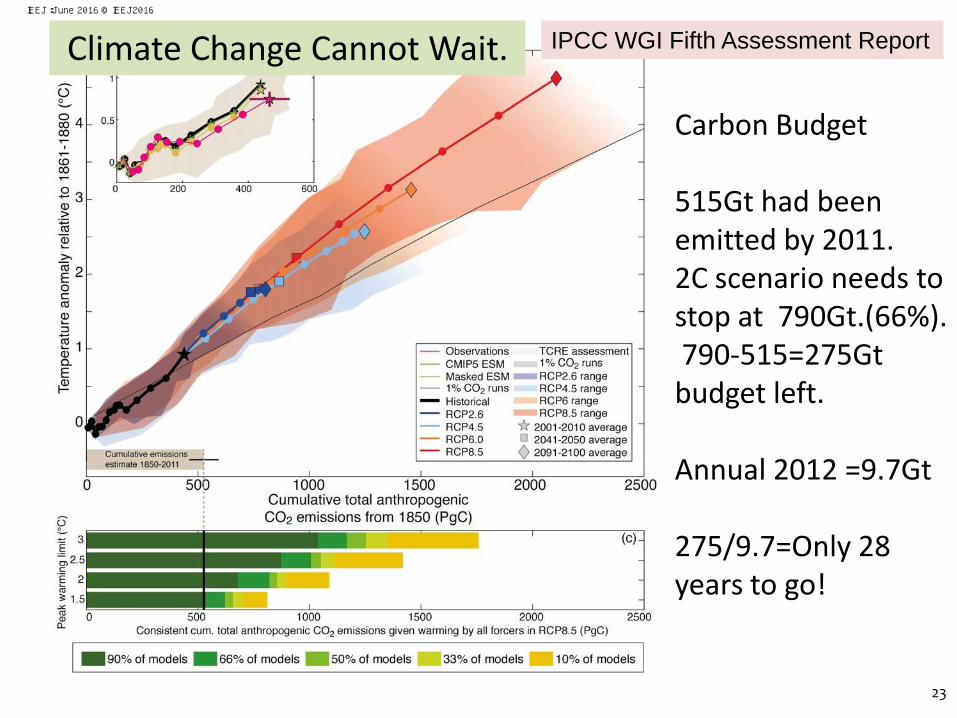
Final Draft (7 June 2013) Technical Summary IPCC WGI Fifth Assessment Report
Do Not Cite, Quote or Distribute TS-119 Total pages: 127
TFE.8, Figure 1: Global mean temperature increase since 1861–1880 as a function of cumulative total global CO2
emissions from various lines of evidence. (a) Decadal average results are shown over all CMIP5 EMIC and ESMs for
each RCP respectively, with coloured lines (multi-model average), decadal markers (dots) and with three decades
(2001–2010, 2041–2050 and 2091–2100) highlighted with a star, square and diamond, respectively. The historical time
period up to decade 2001–2010 is taken from the CMIP5 historical runs prolonged by RCP8.5 for 2005–2010 and is
indicated with a black thick line and black symbols. Coloured ranges illustrate the model spread (90% range) over all
CMIP5 ESMs and EMICs and do not represent a formal uncertainty assessment. Ranges are filled as long as data of all
models is available and until peak temperature. They are faded out for illustrative purposes afterward. CMIP5
simulations with 1% yr–1 CO2 increase only are illustrated by the dark grey area (range definition similar to RCPs
above) and the black thin line (multi-model average). The light grey cone represents this report’s assessment of the
transient climate response to emissions (TCRE) from CO2 only. Estimated cumulative historical CO2 emissions from
1850 to 2011 with associated uncertainties are illustrated by the grey bar at the bottom of panel a. (b) Comparison of
historical model results with observations. The magenta line and uncertainty ranges are based on observed emissions
from CDIAC extended by values of the Global Carbon project until 2010 and observed temperature estimates of
HadCRUT4. The uncertainties in the last decade of observations are based on the assessment in this report. The black
thick line is identical to the one in panel a. The thin green line with crosses is as the black line but for ESMs only. The
yellow-brown line and range show these ESM results until 2010, when corrected for HadCRUT4’s incomplete
geographical coverage over time. All values are given relative to the 1861–1880 base period. All time-series are derived
Carbon Budget 515Gt had been emitted by 2011. 2C scenario needs to stop at 790Gt.(66%). 790-515=275Gt budget left. Annual 2012 =9.7Gt 275/9.7=Only 28 years to go!
IPCC WGI Fifth Assessment Report Climate Change Cannot Wait.
23
IEEJ:June 2016 © IEEJ2016
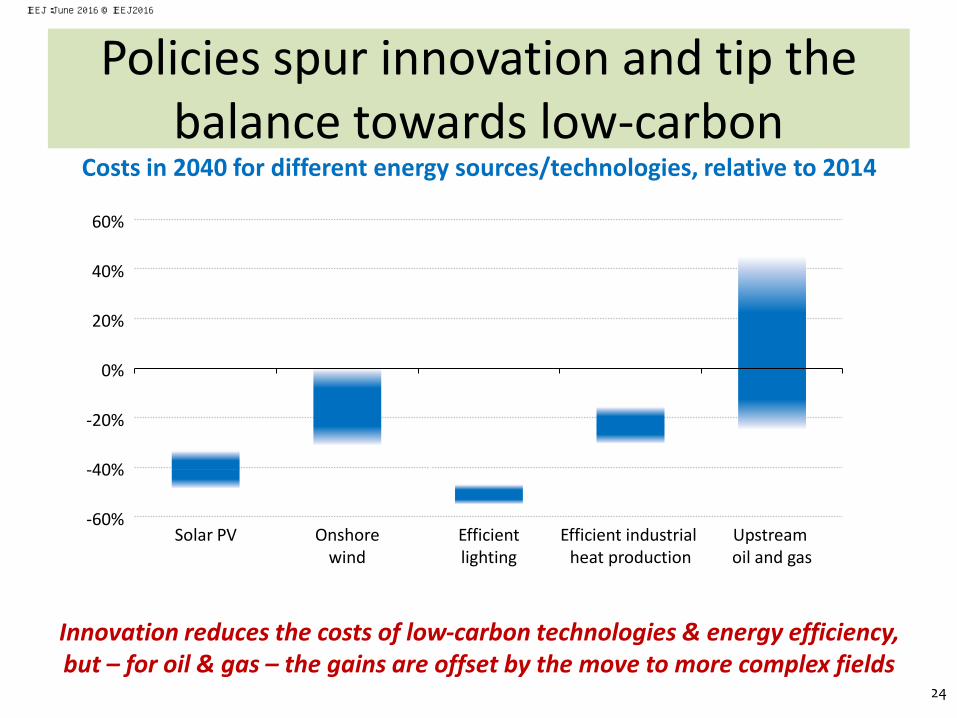
but – for oil & gas – the gains are offset by the move to more complex fields
Policies spur innovation and tip the balance towards low-carbon
Costs in 2040 for different energy sources/technologies, relative to 2014
-60%
-40%
-20%
0%
20%
40%
60%
Solar PV Onshore wind
Efficient industrial heat production
Efficient lighting
Upstream oil and gas
Innovation reduces the costs of low-carbon technologies & energy efficiency,
24
IEEJ:June 2016 © IEEJ2016

Power is leading the transformation of the energy system
Global electricity generation by source
Driven by continued policy support, renewables account for half of additional global generation, overtaking coal around 2030 to become the largest power source
3 000 12 000 15 000
TWh
Change to 2040
2014 Renewables
Coal
Gas
Nuclear
Oil
Hydro
Wind
Solar
Other renewables
Of which:
6 000 9 000
WEO2015
25
IEEJ:June 2016 © IEEJ2016

Energy demand
GDP
A new chapter in China’s growth story
Along with energy efficiency, structural shifts in China’s economy favouring expansion of services, mean less energy is required to generate economic growth
3 000
6 000
9 000
2000 2010 2020 2030 2040
Ener
gy d
eman
d (
Mto
e)
20
40
60
GD
P (
trill
ion
do
llars
, PP
P)
Energy demand
GDP
Total primary energy demand & GDP in China Energy demand in China
1 000
2 000
3 000
4 000
Coal
Oil
Gas
Nuclear
Renewables
Energy demand
GDP
3 000
6 000
9 000
2000 2010 2020 2030 2040
Ener
gy d
eman
d (
Mto
e)
20
40
60
GD
P (
trill
ion
do
llars
, PP
P)
WEO2015
26
IEEJ:June 2016 © IEEJ2016
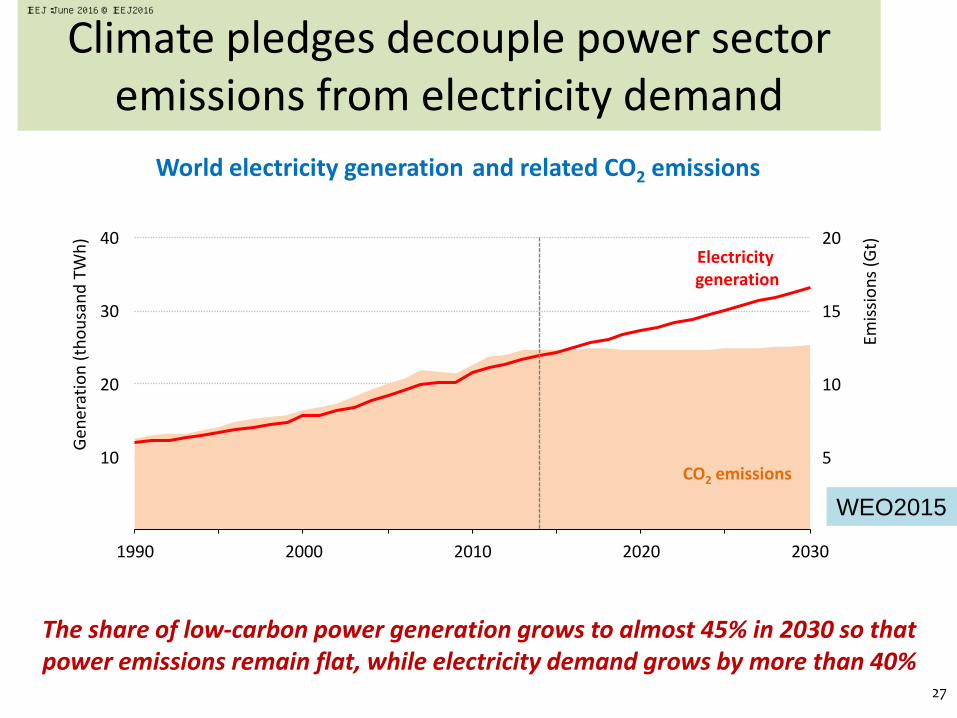
Climate pledges decouple power sector emissions from electricity demand
World electricity generation
The share of low-carbon power generation grows to almost 45% in 2030 so that power emissions remain flat, while electricity demand grows by more than 40%
10
20
30
40
Gen
erat
ion
(th
ou
san
d T
Wh
)
and related CO2 emissions
1990 2000 2010 2020 2030
Emis
sio
ns
(Gt)
5
10
15
20
CO2 emissions
Electricity generation
Electricity generation
CO2 emissions
WEO2015
27
IEEJ:June 2016 © IEEJ2016
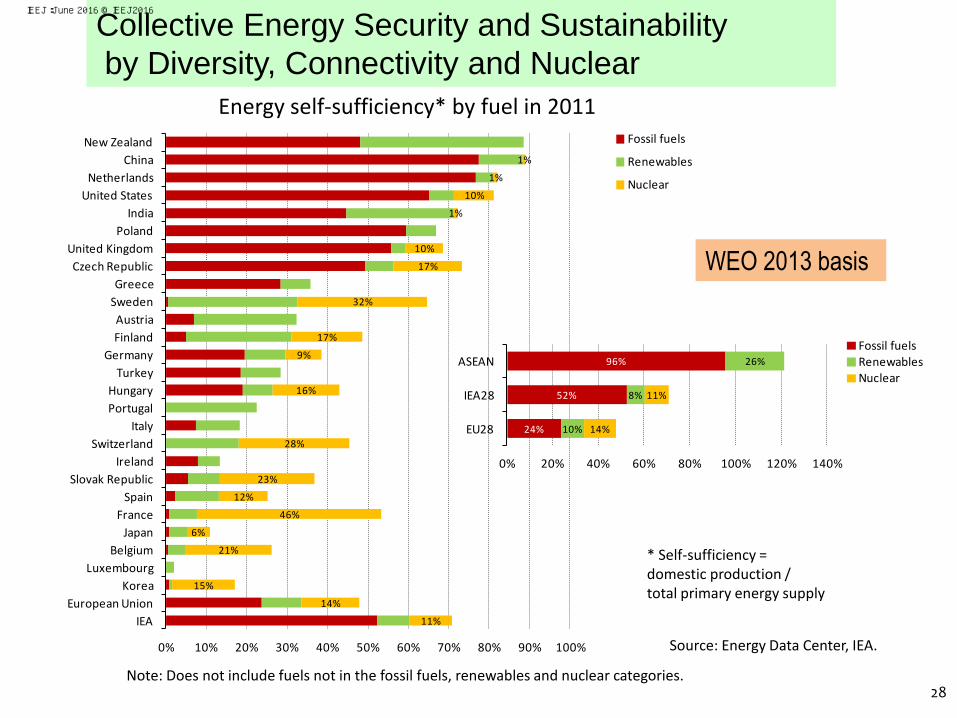
Energy self-sufficiency* by fuel in 2011
Source: Energy Data Center, IEA.
* Self-sufficiency = domestic production / total primary energy supply
Note: Does not include fuels not in the fossil fuels, renewables and nuclear categories.
11%
14%
15%
21%
6%
46%
12%
23%
28%
16%
9%
17%
32%
17%
10%
1%
10%
1%
1%
0% 10% 20% 30% 40% 50% 60% 70% 80% 90% 100%
IEA
European Union
Korea
Luxembourg
Belgium
Japan
France
Spain
Slovak Republic
Ireland
Switzerland
Italy
Portugal
Hungary
Turkey
Germany
Finland
Austria
Sweden
Greece
Czech Republic
United Kingdom
Poland
India
United States
Netherlands
China
New Zealand Fossil fuels
Renewables
Nuclear
24%
52%
96%
10%
8%
26%
14%
11%
0% 20% 40% 60% 80% 100% 120% 140%
EU28
IEA28
ASEANFossil fuelsRenewablesNuclear
Collective Energy Security and Sustainability
by Diversity, Connectivity and Nuclear
WEO 2013 basis
28
IEEJ:June 2016 © IEEJ2016

Power Grid Connection in Europe: Collective Energy Security and Sustainability
Physical energy flows between European countries, 2008 (GWh)
Source: ENTSO-E
29
IEEJ:June 2016 © IEEJ2016
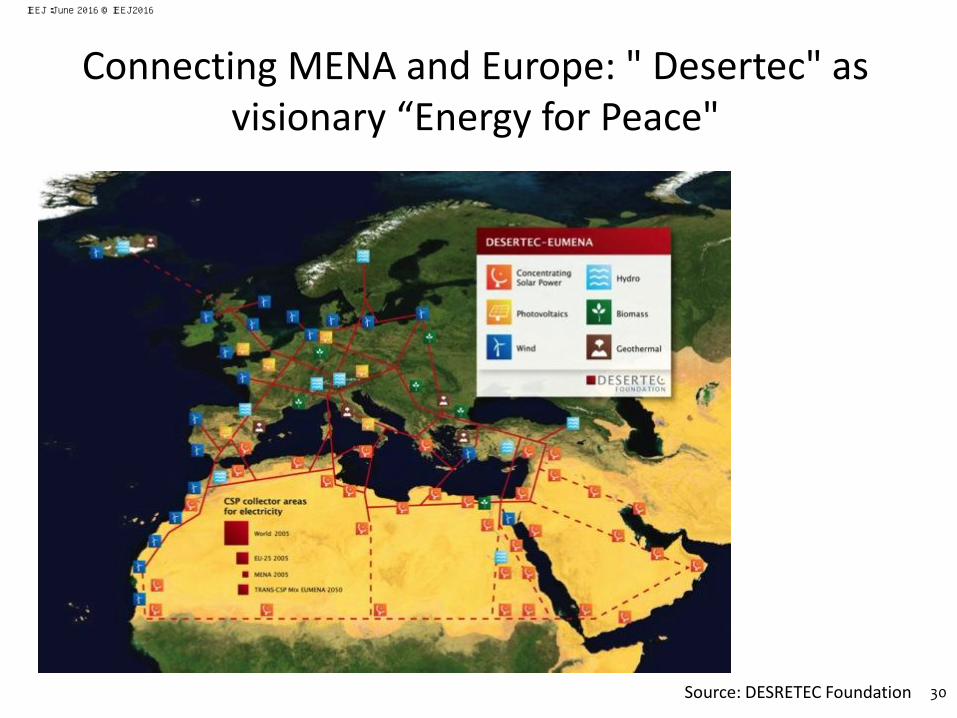
Connecting MENA and Europe: " Desertec" as visionary “Energy for Peace"
Source: DESRETEC Foundation 30
IEEJ:June 2016 © IEEJ2016

ASEAN power grid connection
31
IEEJ:June 2016 © IEEJ2016
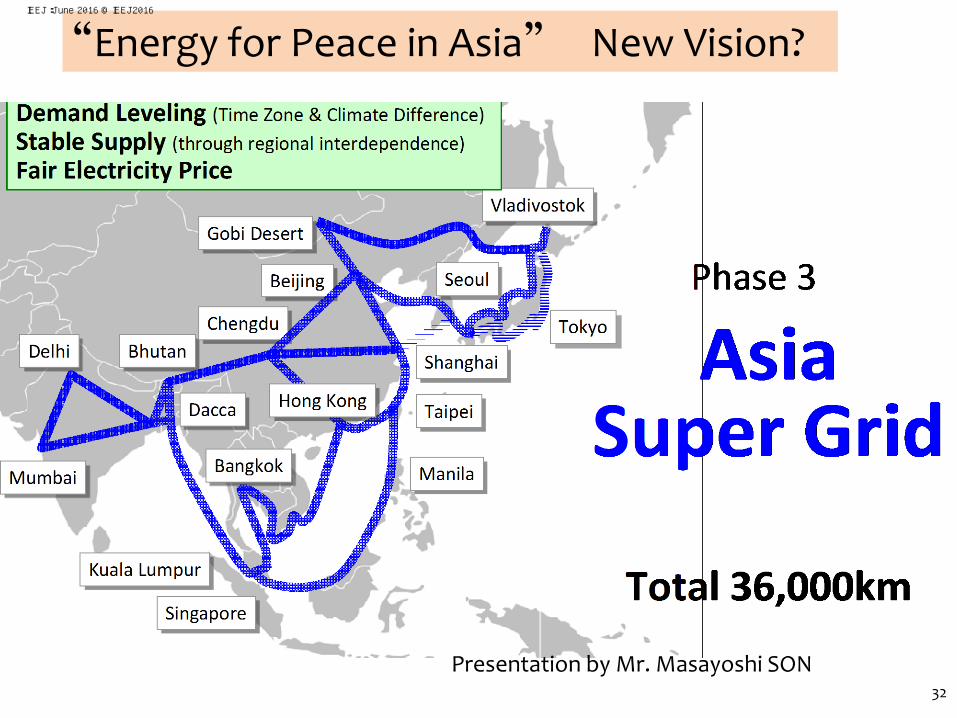
Presentation by Mr. Masayoshi SON 32
“Energy for Peace in Asia” New Vision? IEEJ:June 2016 © IEEJ2016

GOBITECH Initiative
Renewable Energy in Asia through Sun and Wind
33
IEEJ:June 2016 © IEEJ2016
Чистая энергия
387
I stage
II stage
Sakhalin GRES
Nokliki GTES
Sakhalin GRES-2
Yuzhno-sakhalin TPP
Mayskaya GRES
Sovgavan TPP
Comsomol TPP 1-3
Amur TPP
Nikolaev TPP
CL 500 kV
III Stage
TP Gornozavodskaya
Dolinskaya TPP
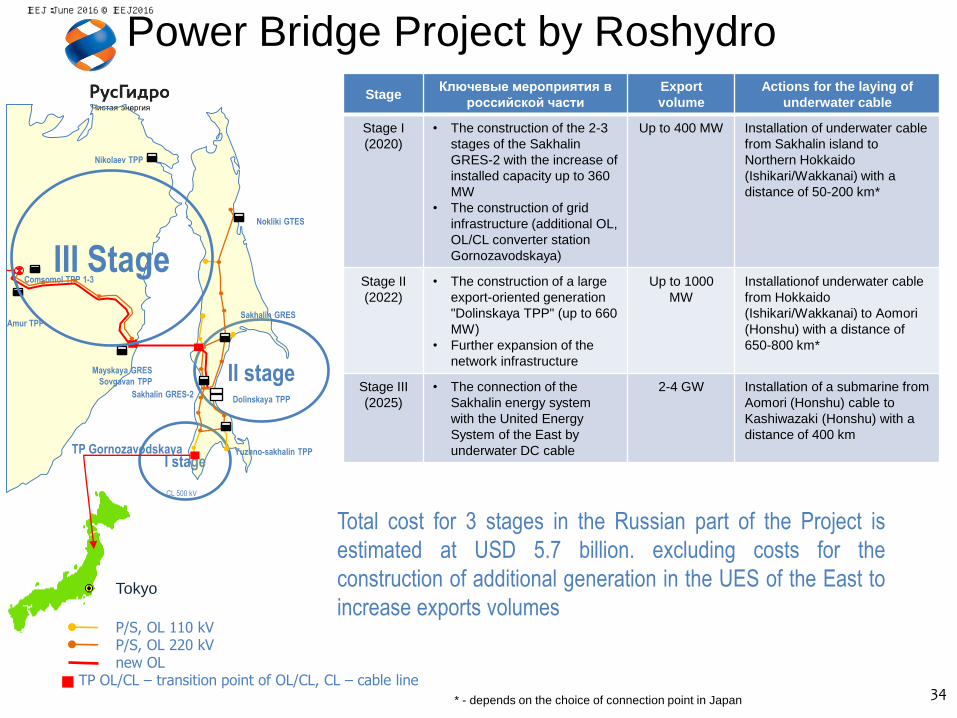
Total cost for 3 stages in the Russian part of the Project is
estimated at USD 5.7 billion. excluding costs for the
construction of additional generation in the UES of the East to
increase exports volumes
P/S, OL 110 kV P/S, OL 220 kV new OL TP OL/CL – transition point of OL/CL, CL – cable line
Tokyo
Stage Ключевые мероприятия в
российской части
Export
volume
Actions for the laying of
underwater cable
Stage I
(2020)
• The construction of the 2-3
stages of the Sakhalin
GRES-2 with the increase of
installed capacity up to 360
MW
• The construction of grid
infrastructure (additional OL,
OL/CL converter station
Gornozavodskaya)
Up to 400 MW Installation of underwater cable
from Sakhalin island to
Northern Hokkaido
(Ishikari/Wakkanai) with a
distance of 50-200 km*
Stage II
(2022)
• The construction of a large
export-oriented generation
"Dolinskaya TPP" (up to 660
MW)
• Further expansion of the
network infrastructure
Up to 1000
MW
Installationof underwater cable
from Hokkaido
(Ishikari/Wakkanai) to Aomori
(Honshu) with a distance of
650-800 km*
Stage III
(2025)
• The connection of the
Sakhalin energy system
with the United Energy
System of the East by
underwater DC cable
2-4 GW Installation of a submarine from
Aomori (Honshu) cable to
Kashiwazaki (Honshu) with a
distance of 400 km
* - depends on the choice of connection point in Japan
Power Bridge Project by Roshydro
34
IEEJ:June 2016 © IEEJ2016

Lack of Grid connectivity in Japan
Source: Agency for Natural Resources and Energy, The Federation of Electric Power Companies of Japan, Electric Power System Council of Japan, The International Energy Agency
Tokyo
Hokkaido
Tohoku
Hokuriku Kansai Chugoku
Kyushu 29GW
Shikoku 12GW
Chubu 40GW
Okinawa 2GW
Hydro Oil
Gas
Nuclear
Coal
Other
Power utility company
Generating company
In-house generation
--- 50 hz
60 hz <-------
35
IEEJ:June 2016 © IEEJ2016
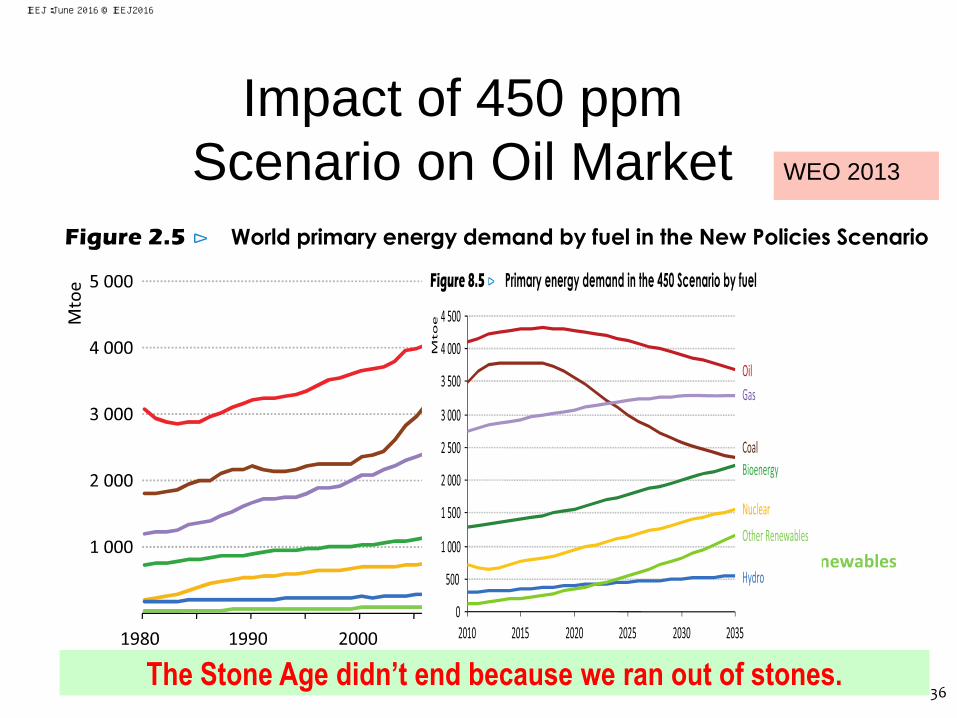
New Policies Scenario WEO 2013
Impact of 450 ppm
Scenario on Oil Market
The Stone Age didn’t end because we ran out of stones. 36
IEEJ:June 2016 © IEEJ2016
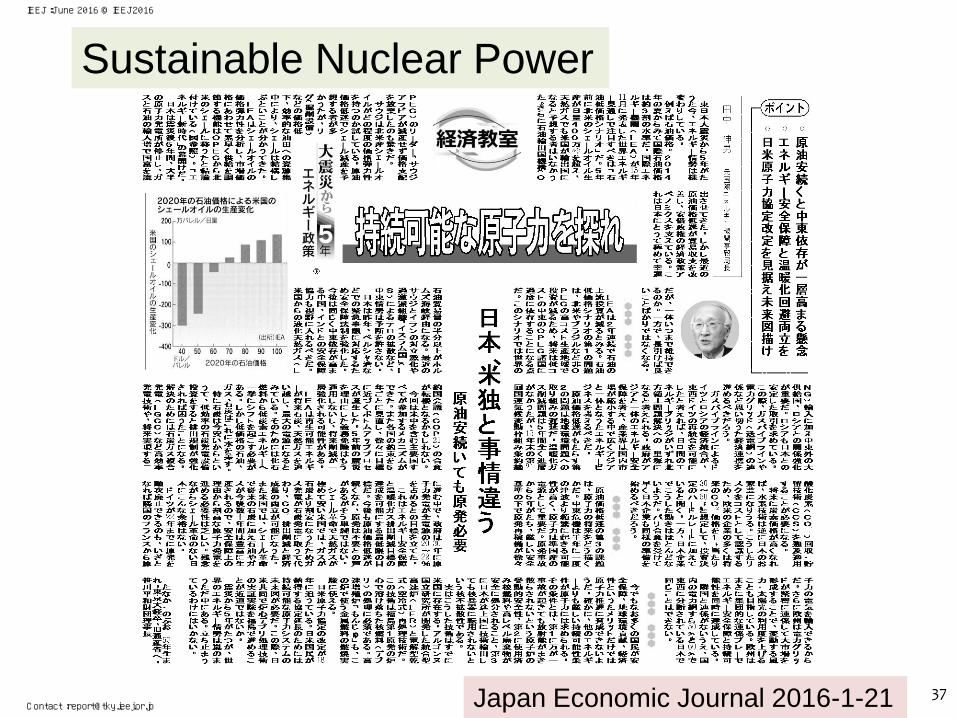
Japan Economic Journal 2016-1-21
Sustainable Nuclear Power
37
IEEJ:June 2016 © IEEJ2016
Contact :[email protected]