Stormwater Infrastructure Mapping Project
34
Town of Barre Stormwater Infrastructure Mapping Project October 2016 VTDEC – CLEAN WATER INITIATIVE PROGRAM, WATERSHED MANAGEMENT DIVISION https://dec.vermont.gov/water-investment/cwi/solutions/developed-lands/idde Jim Pease, [email protected] David Ainley, [email protected]
Transcript of Stormwater Infrastructure Mapping Project

Town of Barre
Stormwater Infrastructure Mapping Project
October 2016
VTDEC – CLEAN WATER INITIATIVE PROGRAM, WATERSHED MANAGEMENT DIVISION
https://dec.vermont.gov/water-investment/cwi/solutions/developed-lands/idde
Jim Pease, [email protected] David Ainley, [email protected]

Overview This stormwater infrastructure mapping project was completed for the municipality by the Agency of Natural Resources Ecosystems Restoration program to supplement the existing drainage data collected by the town and with the intention of providing a tool for planning, maintenance, and inspection of the stormwater infrastructure.
The GIS maps and geodatabase are meant to provide an overall picture and understanding of the connectivity or connectedness of the storm system on both public and private properties in order to raise the awareness of the need for regular maintenance. The generation and transport of nonpoint source pollution increases with increasing connectivity of a drainage system. Having an understanding of the connectedness of the system is also a valuable tool for hazardous material spill planning and prevention. Knowledge of the extent of the system is also essential for the detection and elimination of illicit discharges. Outfall locations and system connectedness data are used as a base for locating illicit or illegal discharges of non-stormwater to the municipal storm system and tracing them up to the source. Knowledge of which areas of the sewer service area have combined stormwater and sewer systems can better assist the municipality in planning and implementing combined sewer separation projects. Knowledge of the layout and extent of the stormwater system can inform options for cleaning up existing polluted stormwater discharges. This project provides information and guidance for potential retrofit treatment locations and opportunities. Knowledge of where storm drains are located can also assist municipalities and residents with emergency preparedness for large rainfall events (i.e. Tropical Storm or Hurricanes) or spring snowmelt runoff events. By keeping storm drains clean, clear and open a good deal of localized flooding could be prevented. Finally, by providing a more thorough understanding of the system it is the hope that this project could be the basis for a local stormwater ordinance or be used to help enhance an existing stormwater management program. Project Summary
The principal goal of this project was to develop up to date municipal drainage maps. These drainage maps were created showing the paths that stormwater runoff travels from where it falls on impervious surfaces such as parking lots, roads, and rooftops, to the outfall points in various receiving waters. These maps show the stormwater infrastructure including features like pipes, manholes, catchbasins, and swales within a municipality. Data sources included data collected from field work, a mapping grade Trimble GPS unit, available state permit plans, record drawings, town plans, WWMD plans, existing GIS data from contractors, and the input and guidance of knowledgeable members from the municipalities.
A second goal of this project was to establish potential locations for Best Management Practice (BMP) stormwater retrofit sites. These are sites where stormwater treatment structures could be added and where they would be most cost effective and efficient for sediment and phosphorus or nitrogen removal. In order to develop a retrofit site list, drainage area subwatersheds were delineated around the drainage networks. Determining how the stormwater infrastructure was connected was necessary in determining the subwatershed drainage areas within the town.
Delineating the drainage areas was done using the stormwater infrastructure maps, along with satellite imagery, a Digital Elevation Model (DEM), and USGS topographic maps. These data sources were used to approximate where the land area within each municipality was draining to; as well as where the high points were that divided the sub-drainage areas. The

completed maps show the drainage coverage for essentially the entire municipality, but with a focus on areas with greater concentrations of impervious cover.
Impervious cover layers were created by either hand digitization or by using a method of raster pixel calculation (with ArcGIS spatial analyst extension) to create a vegetation index from the National Agricultural Imagery Program (NAIP) 08 orthophotos. The area which contrasted with the vegetation represents impervious surfaces and was then modified with buffered water and roads layers to make it more accurate. A more detailed explanation of this process is available in a separate document. The impervious layer was used to calculate the percent of each delineated drainage area that would generate stormwater runoff. The percentage of impervious surface number for each subwatershed was then adjusted with a connectivity rating. A rating was assigned to each drainage area polygon describing how directly connected the impervious surfaces within that subwatershed are to the receiving water. By adjusting the percent impervious area numbers with this connectivity rating the effective impervious area (EIA) was established for each subwatershed (Sutherland, 1995). This effective impervious number is a more accurate description of the amount of runoff produced by each of the subwatersheds because it helps to take factors such as infiltration into account.
After the effective impervious numbers were calculated for the subwatersheds the Simple Method was used to estimate the annual sediment (TSS) and phosphorus (TP) or Nitrogen (TN) loads generated by each subwatershed. The Simple method uses information which includes the adjusted impervious value, average annual rainfall for the location, total subwatershed area, and a given pollutant concentration value to calculate an annual load for various pollutants (Schueler,1987). Pollutant loads estimated by the Simple Method in this project are planning level estimates and are meant to give a general idea of the amounts of sediment or nutrient wash-off produced by each subwatershed for prioritization purposes. Subwatersheds were then prioritized, using the loading calculations as well as other criteria, and given Action List numbers ranging from 1 to 3 (one being the highest priority). The Action List number depends both upon loading values and feasibility of potential retrofit treatment options. Potential retrofit options listed in the TARGET maps are based on field observations and not on actual availability of land or willingness of landowner.
Water Quality Volume (WQv – the amount of storage needed to treat stormwater from a 0.9 inch storm) and Channel Protection Volume (CPv – the volume of storage that is needed to hold and slowly release stormwater for a 2.1inch rain event) were also calculated for delineated subwatershed areas. CPv calculations are only applicable if the receiving water is not a large body of water and is therefore susceptible to channel erosion. These numbers were used in the retrofit recommendation process because the volume of water to be treated was a key factor in determining the type of retrofit. Project References Schueler, T. 1987. Technical Documentation of a Simple Method for Estimating Urban Storm Pollutant Export. Controlling Urban Runoff: A Practical Manual for Planning and Designing Urban BMPs. Appendix A. Schueler, T. et.al., 2007. Urban Stormwater Retrofit Practices, Version 1.0. Manual 3, Center for Watershed Protection, August 2007. Sutherland, R. 1995. Methodology for Estimating the Effective Impervious Area of Urban Watersheds. Technical Note 58 – Pervious Area Management. Watershed Protection Techniques. Vol. 2, No. 1 *All data was created in an ArcGIS 10 Geodatabase format and is available from VTDEC.
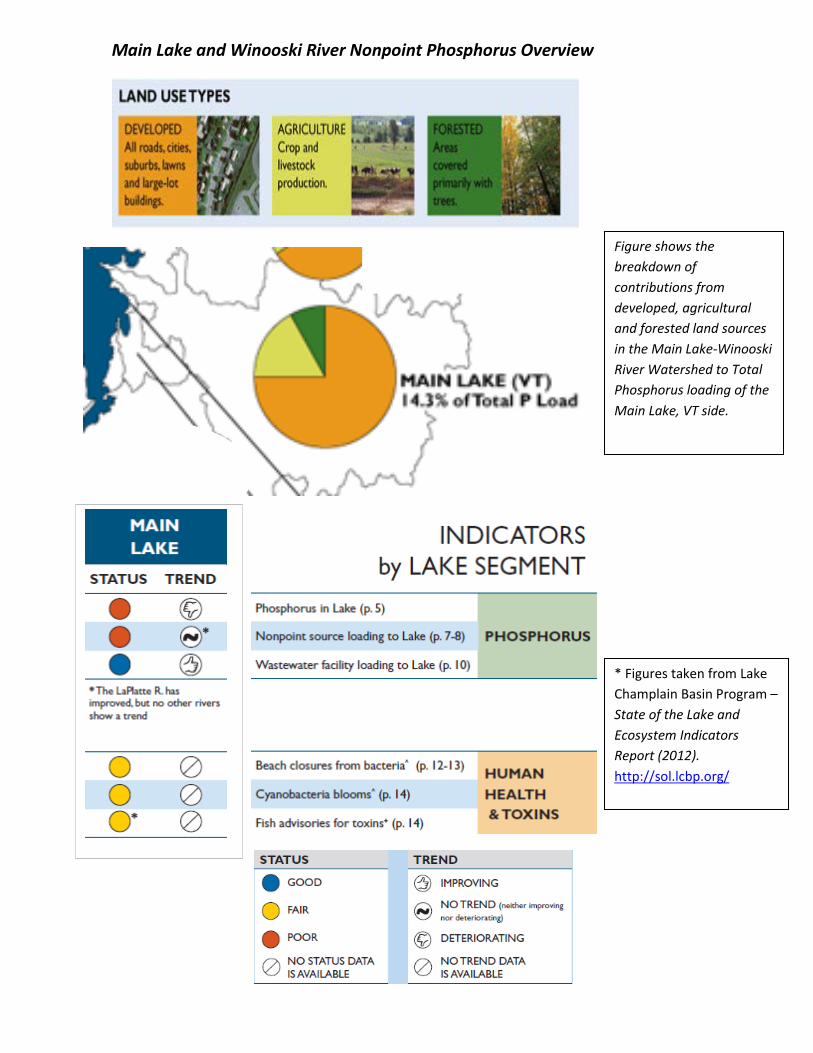
Main Lake and Winooski River Nonpoint Phosphorus Overview
Figure shows the breakdown of contributions from developed, agricultural and forested land sources in the Main Lake-Winooski River Watershed to Total Phosphorus loading of the Main Lake, VT side.
* Figures taken from Lake Champlain Basin Program – State of the Lake and Ecosystem Indicators Report (2012). http://sol.lcbp.org/

Subwatershed Data
Tables showing calculations and Priority drainage area retrofit possibilities

This is a key showing the abbreviations of the different stormwater treatment structures or practices listed in the calculation sheets.
Abbreviation Key
Code Structure Type BB Baffle Box
BFCB Baffled Catchbasin BR Bioretention Area (aka Bioretention Filter) BS Buffer Strip (25' Min.) CB Catch Basin CBI Catch Basin Insert CD Check Dam DG Detention Gallery DI Drop Inlet DP Dry Pond DS Dry Swale DW Drywell
EDPMP Extended Detention Pond with Micropool (aka Micropool Extended Detention Basin)
GS Grass Swale (aka Open Channel) IB Infiltration Basin IG Infiltration Gallery IP Infiltration Pipe OF Overland Flow
OGF Organic Filter POP Pocket Pond PP Perforated Pipe
RDD Roof Drain Disconnect RR Rock Riprap RS Riprap Swale SB Sediment Basin SF Sand Filter (aka Surface Sand Filter)
SS-SF Swirl Separator – Sand Filter ST Septic Tank
SWPPP Stormwater Pollution Prevention Plan TT Treatment Tank WL Wetland (Constructed) WP Wet Pond (Retention) WS Wet Swale

Barre Town - Subwatershed Prioritization and Recommendations
Watershed NumberAction List # Proposed Action
Proposed or Existing
Stormwater Treatment Practice Permit Number
Watershed Area (Acres)
Percent Mapped Impervious Area
(MIA)
Sediment Load with Current
Reductions (lbs)
Sediment Load with Priority
Action (lbs)
Phosphorus Load with Current
Reductions (lbs)
Phosphorus Load with Priority Action (lbs)
Water Quality Volume (Acre-Feet)
Channel Protection (Acre-Feet)
1 Barre Town 1 Riprap erosion RR/CB/GS 6.7 35 2,124 1,062 5.9 4.4 0.12 0.262 Barre Town CB/GS 4.2 14 524 524 1.5 1.5 0.03 0.063 Barre Town GS/OF 25.4 4 1,953 1,953 5.4 5.4 0.11 0.124 Barre Town GS/OF 6.1 15 835 835 2.3 2.3 0.05 0.105 Barre Town GS/OF 1.5 17 222 222 0.6 0.6 0.01 0.036 Barre Town CB/GS 13.2 14 1,703 1,703 4.7 4.7 0.10 0.207 Barre Town CB/OF 3.1 12 351 351 1.0 1.0 0.02 0.048 Barre Town GS/OF 6.4 7 561 561 1.6 1.6 0.03 0.059 Barre Town GS/OF/CR/GS 5587-9015 137.7 4 10,691 10,691 29.7 29.7 0.60 0.6810 Barre Town CB/GS 5.2 28 1,245 1,245 3.5 3.5 0.07 0.1611 Barre Town CB/GS 1.8 28 434 434 1.2 1.2 0.02 0.0612 Barre Town CB/GS 8.7 16 1,241 1,241 3.4 3.4 0.07 0.1513 Barre Town 1 Riprap erosion RR/CB/GS 11.4 32 3,254 2,603 9.0 8.1 0.18 0.4114 Barre Town CB/GS/SB 4817-9010 59.6 7 4,662 4,662 13.0 9.7 0.26 0.4415 Barre Town CB/GS 15.3 14 2,002 2,002 5.6 5.6 0.11 0.2416 Barre Town CB/GS 2.5 23 494 494 1.4 1.4 0.03 0.0617 Barre Town CB/GS 29.3 7 2,540 2,540 7.1 7.1 0.14 0.2118 Barre Town CB/GS 145.5 3 10,383 10,383 28.8 28.8 0.59 0.4219 Barre Town CB/GS 96.7 11 10,532 10,532 29.3 29.3 0.60 1.1520 Barre Town OF 27.1 3 1,983 1,983 5.5 5.5 0.11 0.1021 Barre Town OF/WP/SWPPP 5322-9003 144.5 5 10,608 10,608 29.5 29.5 0.60 0.7822 Barre Town GS/CB 32.9 10 3,383 3,383 9.4 9.4 0.19 0.3523 Barre Town GS/CB 41.7 8 3,799 3,799 10.6 10.6 0.21 0.3524 Barre Town OF/GS 3237-9010 73.7 9 6,263 6,263 17.4 17.4 0.35 0.7025 Barre Town OF 2.0 9 205 205 0.6 0.6 0.01 0.0226 Barre Town GS/OF 23.3 11 2,500 2,500 6.9 6.9 0.14 0.2727 Barre Town GS/OF 1.2 40 461 461 1.3 1.3 0.03 0.0628 Barre Town CB/GS 32.8 17 4,957 4,957 13.8 13.8 0.28 0.6229 Barre Town CB/OF 1.8 28 426 426 1.2 1.2 0.02 0.0530 Barre Town GS/OF 1.9 30 496 496 1.4 1.4 0.03 0.0631 Barre Town CB 2.9 37 1,240 1,240 3.4 3.4 0.07 0.1232 Barre Town CB/GS 4.3 14 542 542 1.5 1.5 0.03 0.0633 Barre Town CB/OF 12.9 17 1,961 1,961 5.4 5.4 0.11 0.2534 Barre Town CB/OF 7.7 14 984 984 2.7 2.7 0.06 0.1235 Barre Town CB/GS 3.0 29 756 756 2.1 2.1 0.04 0.1036 Barre Town CB/OF 10.3 26 2,267 2,267 6.3 6.3 0.13 0.2937 Barre Town CB/GS 6.9 23 1,387 1,387 3.9 3.9 0.08 0.1838 Barre Town CB 29.6 21 7,377 7,377 20.5 20.5 0.42 0.68
39 Barre Town 2
Bioretention behind 2 Countryside Circle BRA/CB/GS 3614-9010 10.8 28 2,666 533 7.4 4.4 0.15 0.34
40 Barre Town GS/OF 3614-9010 3.1 12 350 350 1.0 1.0 0.02 0.0441 Barre Town GS/CB/OF 6130-9010 39.4 9 3,363 3,363 9.3 9.3 0.19 0.3842 Barre Town CB/GS 6130-9010 89.6 3 6,555 6,555 18.2 18.2 0.37 0.3243 Barre Town CB/GS 12.2 15 1,628 1,628 4.5 4.5 0.09 0.2044 Barre Town CB/GS 3614-9010 0.8 17 95 95 0.3 0.3 0.01 0.0145 Barre Town CB/GS 45.7 8 4,180 4,180 11.6 11.6 0.24 0.3846 Barre Town CB/GS 8.4 9 822 822 2.3 2.3 0.05 0.0847 Barre Town CB/GS/EDP 3613-9010 46.2 12 3,836 3,836 10.7 10.7 0.22 0.6048 Barre Town GS 4.9 12 565 565 1.6 1.6 0.03 0.0649 Barre Town GS/OF 3.9 13 467 467 1.3 1.3 0.03 0.0550 Barre Town GS 6.7 10 686 686 1.9 1.9 0.04 0.07

Barre Town - Subwatershed Prioritization and Recommendations
Watershed Number Action List #
Proposed or Existing Stormwater Treatment
PracticeEstimated Basin
Construction CostEstimated Other BMP
Construction Cost
Cost of Sediment Removal Per Pound
(based on annual sediment load)
Cost of Phosphorus Removal Per Pound
(based on annual phosphorus load)
Assistance Program
Number of LID - Roof
Raingardens to treat CPv
(Residential)Raingarden
Cost1 Barre Town 1 RR/CB/GS 1,000.00 $1 $678 ERP, Section 319, LCBP 130 $59,9792 Barre Town 0 CB/GS 31 $14,2913 Barre Town 0 GS/OF 60 $27,5144 Barre Town 0 GS/OF 51 $23,4635 Barre Town 0 GS/OF 14 $6,3586 Barre Town 0 CB/GS 102 $46,9257 Barre Town 0 CB/OF 20 $9,1158 Barre Town 0 GS/OF 24 $11,0849 Barre Town 0 GS/OF/CR/GS 340 $156,41710 Barre Town 0 CB/GS 79 $36,34711 Barre Town 0 CB/GS 28 $12,66012 Barre Town 0 CB/GS 77 $35,22213 Barre Town 1 RR/CB/GS 1,000.00 $2 $1,106 ERP, Section 319, LCBP 203 $93,23114 Barre Town 0 CB/GS/SB 218 $100,37715 Barre Town 0 CB/GS 120 $55,30916 Barre Town 0 CB/GS 32 $14,51617 Barre Town 0 CB/GS 107 $49,28818 Barre Town 0 CB/GS 210 $96,77619 Barre Town 0 CB/GS 577 $265,40320 Barre Town 0 OF 48 $22,05621 Barre Town 0 OF/WP/SWPPP 391 $179,71122 Barre Town 0 GS/CB 177 $81,41623 Barre Town 0 GS/CB 174 $79,89624 Barre Town 0 OF/GS 351 $161,48125 Barre Town 0 OF 11 $4,83926 Barre Town 0 GS/OF 136 $62,34227 Barre Town 0 GS/OF 28 $12,66028 Barre Town 0 CB/GS 310 $142,46329 Barre Town 0 CB/OF 27 $12,43530 Barre Town 0 GS/OF 31 $14,34831 Barre Town 0 CB 59 $27,00732 Barre Town 0 CB/GS 32 $14,79833 Barre Town 0 CB/OF 123 $56,43434 Barre Town 0 CB/OF 59 $27,06435 Barre Town 0 CB/GS 48 $21,94336 Barre Town 0 CB/OF 145 $66,50537 Barre Town 0 CB/GS 89 $40,79238 Barre Town 0 CB 340 $156,361
39 Barre Town 2 BRA/CB/GS 34,688.59 $16 $11,712 ERP, Section 319, LCBP 169 $77,59040 Barre Town 0 GS/OF 20 $9,05941 Barre Town 0 GS/CB/OF 190 $87,38042 Barre Town 0 CB/GS 158 $72,69543 Barre Town 0 CB/GS 99 $45,35044 Barre Town 0 CB/GS 7 $3,26345 Barre Town 0 CB/GS 192 $88,33646 Barre Town 0 CB/GS 41 $18,84947 Barre Town 0 CB/GS/EDP 301 $138,30048 Barre Town 0 GS 32 $14,68549 Barre Town 0 GS/OF 27 $12,43550 Barre Town 0 GS 36 $16,486

Barre Town - Subwatershed Prioritization and Recommendations (pg2)
Watershed NumberAction List # Proposed Action
Proposed or Existing
Stormwater Treatment Practice Permit Number
Watershed Area (Acres)
Percent Mapped Impervious Area
(MIA)
Sediment Load with Current
Reductions (lbs)
Sediment Load with Priority
Action (lbs)
Phosphorus Load with Current
Reductions (lbs)
Phosphorus Load with Priority Action (lbs)
Water Quality Volume (Acre-Feet)
Channel Protection (Acre-Feet)
51 Barre Town GS 17.8 16 2,590 2,590 7.2 7.2 0.15 0.3252 Barre Town GS 1.2 19 195 195 0.5 0.5 0.01 0.0253 Barre Town CB/GS 2.9 30 765 765 2.1 2.1 0.04 0.1054 Barre Town GS/OF 1.6 28 392 392 1.1 1.1 0.02 0.0555 Barre Town GS/CB 2.5 20 436 436 1.2 1.2 0.02 0.0656 Barre Town OF 67.8 9 6,664 6,664 18.5 18.5 0.38 0.6757 Barre Town GS/CB 2.4 29 592 592 1.6 1.6 0.03 0.0758 Barre Town GS 2.2 29 551 551 1.5 1.5 0.03 0.0759 Barre Town GS 0.7 44 274 274 0.8 0.8 0.02 0.0360 Barre Town GS/WP 23.0 8 1,715 1,715 4.8 4.8 0.10 0.2161 Barre Town OF/GS 7.7 15 1,040 1,040 2.9 2.9 0.06 0.1362 Barre Town GS/OF/CB 27.0 9 2,726 2,726 7.6 7.6 0.15 0.2863 Barre Town CB/GS 16.9 24 3,425 3,425 9.5 9.5 0.19 0.4464 Barre Town OF/GS 36.7 7 3,279 3,279 9.1 9.1 0.19 0.2965 Barre Town CB/GS 31.7 11 3,440 3,440 9.6 9.6 0.19 0.3866 Barre Town CB/GS 7.3 19 1,202 1,202 3.3 3.3 0.07 0.1567 Barre Town CB/GS 4.9 19 811 811 2.3 2.3 0.05 0.1068 Barre Town CB/GS 52.4 25 11,245 11,245 31.2 31.2 0.64 1.4469 Barre Town GS/OF 3252-9010 5.4 14 582 582 1.6 1.6 0.03 0.0870 Barre Town GS/OF 3232-9010 23.1 13 2,383 2,383 6.6 6.6 0.13 0.3371 Barre Town CB/OF 10.8 36 3,570 3,570 9.9 9.9 0.20 0.4472 Barre Town CB/OF 8.6 18 1,347 1,347 3.7 3.7 0.08 0.1773 Barre Town OF 2.1 22 393 393 1.1 1.1 0.02 0.0574 Barre Town CB/GS 5.6 24 1,181 1,181 3.3 3.3 0.07 0.1575 Barre Town CB/GS 14.4 17 2,168 2,168 6.0 6.0 0.12 0.2776 Barre Town CB/OF 3.3 16 470 470 1.3 1.3 0.03 0.0677 Barre Town GS/EWP/OF 5714-9015 307.3 2 21,580 21,580 59.9 59.9 1.22 0.7578 Barre Town CB/OF 2.2 29 566 566 1.6 1.6 0.03 FALSE79 Barre Town CB/GS 5.9 6 501 501 1.4 1.4 0.03 FALSE80 Barre Town CB 4.5 16 626 626 1.7 1.7 0.04 FALSE81 Barre Town CB 3.2 9 311 311 0.9 0.9 0.02 FALSE82 Barre Town CB/OF 31.4 4 2,391 2,391 6.6 6.6 0.14 FALSE83 Barre Town OF 2.3 14 310 310 0.9 0.9 0.02 FALSE84 Barre Town GS/OF 3263-9010 3.1 12 302 302 0.8 0.8 0.02 0.0485 Barre Town GS/OF 3263-9010 1.0 20 150 150 0.4 0.4 0.01 0.0286 Barre Town GS/OF 3263-9010 9.4 3 652 652 1.8 1.8 0.04 0.0387 Barre Town GS/OF 3263-9010 5.4 8 442 442 1.2 1.2 0.03 0.0588 Barre Town OF/CB 195.1 2 13,728 13,728 38.1 38.1 0.78 0.4989 Barre Town GS/CB/OF 32.1 13 3,899 3,899 10.8 10.8 0.22 FALSE90 Barre Town GS/CB/OF 198.8 7 17,420 17,420 48.4 48.4 0.99 FALSE91 Barre Town GS/EDP 5175-9015 10.4 32 397 397 3.3 3.3 0.11 FALSE92 Barre Town CB/GS/OF 304.5 8 28,238 28,238 78.4 78.4 1.60 2.6493 Barre Town OF 168.2 2 11,818 11,818 32.8 32.8 0.67 FALSE94 Barre Town CB/SWPPP 5748-9003 34.3 19 5,671 5,671 15.8 15.8 0.32 FALSE95 Barre Town CB/SWPPP 5748-9003 76.6 10 7,771 7,771 21.6 21.6 0.44 FALSE96 Barre Town CB/GS 10.0 17 1,487 1,487 4.1 4.1 0.08 0.1897 Barre Town GS/CB 9.9 5 770 770 2.1 2.1 0.04 0.0598 Barre Town CB/GS 4.2 25 887 887 2.5 2.5 0.05 0.1199 Barre Town CB 3740-9010 5.7 59 3,171 3,171 8.8 8.8 0.18 0.37100 Barre Town 1 Riprap Erosion RR/OF 18.8 5 1,471 1,103 4.1 3.1 0.08 0.10
101 Barre Town 1
Extended Detention Basin between Rte 63 and gas station. EDP/CB 4.2 33 1,230 246 3.4 2.1 0.07 FALSE
102 Barre Town CB/GS 17.0 24 3,506 3,506 9.7 9.7 0.20 FALSE

Barre Town - Subwatershed Prioritization and Recommendations (pg2)
Watershed Number Action List #
Proposed or Existing Stormwater Treatment
PracticeEstimated Basin
Construction CostEstimated Other BMP
Construction Cost
Cost of Sediment Removal Per Pound
(based on annual sediment load)
Cost of Phosphorus Removal Per Pound
(based on annual phosphorus load)
Assistance Program
Number of LID - Roof
Raingardens to treat CPv
(Residential)Raingarden
Cost51 Barre Town 0 GS 161 $73,87652 Barre Town 0 GS 12 $5,68353 Barre Town 0 CB/GS 48 $22,11254 Barre Town 0 GS/OF 25 $11,42255 Barre Town 0 GS/CB 28 $12,77256 Barre Town 0 OF 334 $153,77357 Barre Town 0 GS/CB 37 $17,21758 Barre Town 0 GS 35 $15,97959 Barre Town 0 GS 16 $7,37160 Barre Town 0 GS/WP 106 $48,78261 Barre Town 0 OF/GS 63 $29,08962 Barre Town 0 GS/OF/CB 141 $64,64963 Barre Town 0 CB/GS 219 $100,71564 Barre Town 0 OF/GS 146 $66,95565 Barre Town 0 CB/GS 188 $86,53666 Barre Town 0 CB/GS 76 $34,99767 Barre Town 0 CB/GS 51 $23,63168 Barre Town 0 CB/GS 718 $330,22069 Barre Town 0 GS/OF 41 $18,96170 Barre Town 0 GS/OF 164 $75,33971 Barre Town 0 CB/OF 218 $100,09672 Barre Town 0 CB/OF 85 $38,93573 Barre Town 0 OF 25 $11,53474 Barre Town 0 CB/GS 75 $34,71675 Barre Town 0 CB/GS 135 $62,28576 Barre Town 0 CB/OF 29 $13,39177 Barre Town 0 GS/EWP/OF 375 $172,34078 Barre Town 0 CB/OF 0 $079 Barre Town 0 CB/GS 0 $080 Barre Town 0 CB 0 $081 Barre Town 0 CB 0 $082 Barre Town 0 CB/OF 0 $083 Barre Town 0 OF 0 $084 Barre Town 0 GS/OF 20 $9,22785 Barre Town 0 GS/OF 11 $5,28986 Barre Town 0 GS/OF 15 $6,80887 Barre Town 0 GS/OF 23 $10,74788 Barre Town 0 OF/CB 243 $111,85589 Barre Town 0 GS/CB/OF 0 $090 Barre Town 0 GS/CB/OF 0 $091 Barre Town 0 GS/EDP 0 $092 Barre Town 0 CB/GS/OF 1,322 $608,17093 Barre Town 0 OF 0 $094 Barre Town 0 CB/SWPPP 0 $095 Barre Town 0 CB/SWPPP 0 $096 Barre Town 0 CB/GS 92 $42,53697 Barre Town 0 GS/CB 25 $11,36698 Barre Town 0 CB/GS 57 $26,05199 Barre Town 0 CB 185 $85,298100 Barre Town 1 RR/OF 1,000.00 $3 $979 ERP, Section 319, LCBP 48 $22,000
101 Barre Town 1 EDP/CB 21,222.44 $22 $15,527 ERP, Section 319, LCBP 0 $0102 Barre Town 0 CB/GS 0 $0

Barre Town - Subwatershed Prioritization and Recommendations (pg3)
Watershed NumberAction List # Proposed Action
Proposed or Existing
Stormwater Treatment Practice Permit Number
Watershed Area (Acres)
Percent Mapped Impervious Area
(MIA)
Sediment Load with Current
Reductions (lbs)
Sediment Load with Priority
Action (lbs)
Phosphorus Load with Current
Reductions (lbs)
Phosphorus Load with Priority Action (lbs)
Water Quality Volume (Acre-Feet)
Channel Protection (Acre-Feet)
103 Barre Town 1 Riprap Erosion RR/CB/GS 3689-9010 18.2 33 4,535 3,401 12.6 9.4 0.26 FALSE105 Barre Town CB/GS 45.9 15 6,282 6,282 17.4 17.4 0.36 FALSE106 Barre Town OF/SWPPP 4807-9003 0.9 18 141 141 0.4 0.4 0.01 FALSE107 Barre Town OF 23.0 22 4,400 4,400 12.2 12.2 0.25 FALSE108 Barre Town CB/OF 6.9 23 1,378 1,378 3.8 3.8 0.08 0.18109 Barre Town GS/OF 5.8 15 805 805 2.2 2.2 0.05 0.10110 Barre Town CB/WP 4400-9010 2.3 8 174 174 0.5 0.5 0.01 0.02111 Barre Town CB/GS 7.8 16 1,129 1,129 3.1 3.1 0.06 0.14
112 Barre TownCB/EDP/SWPPP/G
S3110-9010/6228-
9003 20.9 25 580 580 4.8 4.8 0.16 FALSE
113 Barre TownCB/EDP/SWPPP/G
S3110-9010/6329-
9015 30.5 32 1,147 1,147 9.6 9.6 0.32 FALSE114 Barre Town CB 2.2 9 208 208 0.6 0.6 0.01 0.02115 Barre Town CB 89.9 3 6,560 6,560 18.2 18.2 0.37 0.31116 Barre Town CB/GS 3.3 41 1,230 1,230 3.4 3.4 0.07 0.15117 Barre Town CB 10.0 9 984 984 2.7 2.7 0.06 0.10118 Barre Town OF 2.4 34 742 742 2.1 2.1 0.04 0.09119 Barre Town CB/OF 3.1 30 827 827 2.3 2.3 0.05 0.10120 Barre Town CB/GS 13.6 21 2,498 2,498 6.9 6.9 0.14 0.32121 Barre Town CB 0.4 4 34 34 0.1 0.1 0.00 0.00122 Barre Town CB/GS 21.1 15 2,801 2,801 7.8 7.8 0.16 0.34123 Barre Town CB/GS 6.8 31 1,846 1,846 5.1 5.1 0.10 0.23124 Barre Town CB/GS 41.0 15 5,582 5,582 15.5 15.5 0.32 0.68125 Barre Town CB/GS 3686-9010 4.7 72 3,538 3,538 9.8 9.8 0.20 0.37126 Barre Town OF/GS 2.7 17 407 407 1.1 1.1 0.02 0.05127 Barre Town CB/GS/WP 3707-9010 2.7 44 820 820 2.3 2.3 0.05 0.13128 Barre Town SF/CB/GS 3686-9010 6.6 60 1,641 1,641 9.1 7.3 0.19 0.44129 Barre Town OF 12.7 17 1,919 1,919 5.3 5.3 0.11 0.24130 Barre Town OF 1.2 19 191 191 0.5 0.5 0.01 0.02
131 Barre Town 1
Bioretention or Sedimentation Basin at downhill side of Town Garage yard BRA/SB/OF/GS 18.3 19 3,020 1,812 8.4 6.7 0.17 0.38
132 Barre Town CB/OF 10.0 10 1,032 1,032 2.9 2.9 0.06 0.11133 Barre Town OF 91.1 2 6,387 6,387 17.7 17.7 0.36 FALSE
134 Barre Town CB/SB/SWPPP/GS4547-9003/3707-
9010 16.3 36 3,562 3,562 9.9 9.9 0.20 0.64135 Barre Town OF 150.8 8 13,945 13,945 38.7 38.7 0.79 FALSE136 Barre Town OF/GS 3.8 25 805 805 2.2 2.2 0.05 0.10137 Barre Town OF 250.4 7 22,028 22,028 61.2 61.2 1.25 1.90138 Barre Town OF 48.6 5 3,861 3,861 10.7 10.7 0.22 0.26139 Barre Town OF 6.7 13 815 815 2.3 2.3 0.05 0.10
140 Barre Town OF/CB/SWPPP4547-9003/3707-
9010 17.6 17 2,175 2,175 6.0 6.0 0.12 0.32141 Barre Town GS/OF 4400-9015 25.2 12 2,342 2,342 6.5 6.5 0.17 0.33142 Barre Town OF/GS/CB 31.1 8 2,841 2,841 7.9 7.9 0.16 0.26143 Barre Town OF 4.1 21 731 731 2.0 2.0 0.04 0.09144 Barre Town CB 13.7 40 5,099 5,099 14.2 14.2 0.29 FALSE

Barre Town - Subwatershed Prioritization and Recommendations (pg3)
Watershed Number Action List #
Proposed or Existing Stormwater Treatment
PracticeEstimated Basin
Construction CostEstimated Other BMP
Construction Cost
Cost of Sediment Removal Per Pound
(based on annual sediment load)
Cost of Phosphorus Removal Per Pound
(based on annual phosphorus load)
Assistance Program
Number of LID - Roof
Raingardens to treat CPv
(Residential)Raingarden
Cost103 Barre Town 1 RR/CB/GS 5,000.00 $4 $1,588 ERP, Section 319, LCBP 0 $0105 Barre Town 0 CB/GS 0 $0106 Barre Town 0 OF/SWPPP 0 $0107 Barre Town 0 OF 0 $0108 Barre Town 0 CB/OF 88 $40,511109 Barre Town 0 GS/OF 49 $22,619110 Barre Town 0 CB/WP 11 $4,895111 Barre Town 0 CB/GS 70 $32,184
112 Barre Town 0 CB/EDP/SWPPP/GS 0 $0
113 Barre Town 0 CB/EDP/SWPPP/GS 0 $0114 Barre Town 0 CB 10 $4,670115 Barre Town 0 CB 157 $72,019116 Barre Town 0 CB/GS 73 $33,703117 Barre Town 0 CB 50 $22,844118 Barre Town 0 OF 46 $21,043119 Barre Town 0 CB/OF 52 $23,913120 Barre Town 0 CB/GS 159 $73,313121 Barre Town 0 CB 1 $450122 Barre Town 0 CB/GS 169 $77,871123 Barre Town 0 CB/GS 116 $53,171124 Barre Town 0 CB/GS 340 $156,473125 Barre Town 0 CB/GS 186 $85,748126 Barre Town 0 OF/GS 25 $11,703127 Barre Town 0 CB/GS/WP 67 $30,608128 Barre Town 0 SF/CB/GS 218 $100,152129 Barre Town 0 OF 120 $55,140130 Barre Town 0 OF 12 $5,570
131 Barre Town 1 BRA/SB/OF/GS 39,303.07 $33 $23,423 ERP, Section 319, LCBP 191 $87,942132 Barre Town 0 CB/OF 54 $25,038133 Barre Town 0 OF 0 $0
134 Barre Town 0 CB/SB/SWPPP/GS 320 $147,246135 Barre Town 0 OF 0 $0136 Barre Town 0 OF/GS 51 $23,631137 Barre Town 0 OF 952 $437,968138 Barre Town 0 OF 132 $60,935139 Barre Town 0 OF 48 $21,887
140 Barre Town 0 OF/CB/SWPPP 162 $74,382141 Barre Town 0 GS/OF 167 $76,802142 Barre Town 0 OF/GS/CB 130 $59,979143 Barre Town 0 OF 47 $21,437144 Barre Town 0 CB 0 $0

Barre Town - Subwatershed Prioritization and Recommendations (pg4)
Watershed NumberAction List # Proposed Action
Proposed or Existing
Stormwater Treatment Practice Permit Number
Watershed Area (Acres)
Percent Mapped Impervious Area
(MIA)
Sediment Load with Current
Reductions (lbs)
Sediment Load with Priority
Action (lbs)
Phosphorus Load with Current
Reductions (lbs)
Phosphorus Load with Priority Action (lbs)
Water Quality Volume (Acre-Feet)
Channel Protection (Acre-Feet)
145 Barre Town OF 32.7 14 4,299 4,299 11.9 11.9 0.24 0.52146 Barre Town OF/CB 20.6 27 4,735 4,735 13.2 13.2 0.27 0.60147 Barre Town CB/SWPPP 5071-9003 4.0 68 2,911 2,911 8.1 8.1 0.16 0.30148 Barre Town CB 7.1 25 1,519 1,519 4.2 4.2 0.09 FALSE149 Barre Town GS/OF/CB 43.5 6 3,738 3,738 10.4 10.4 0.21 FALSE150 Barre Town OF/CB 44.7 3 3,199 3,199 8.9 8.9 0.18 FALSE151 Barre Town OF 45.8 3 3,363 3,363 9.3 9.3 0.19 FALSE152 Barre Town OF 44.2 8 4,221 4,221 11.7 11.7 0.24 FALSE153 Barre Town CB/GS 5.8 37 1,959 1,959 5.4 5.4 0.11 0.24154 Barre Town GS/OF 4400-9010 8.2 12 821 821 2.3 2.3 0.05 0.11155 Barre Town CB/OF 34.9 17 5,354 5,354 14.9 14.9 0.30 0.67156 Barre Town CB.GS 9.8 15 1,326 1,326 3.7 3.7 0.08 0.16157 Barre Town GS/CB 43.4 9 4,270 4,270 11.9 11.9 0.24 0.43158 Barre Town OF 10.5 0 695 695 1.9 1.9 0.04 0.00159 Barre Town OF/GS 28.1 9 2,797 2,797 7.8 7.8 0.16 FALSE160 Barre Town OF/WP 62.2 2 4,149 4,149 11.5 11.5 0.23 FALSE161 Barre Town GS 3612-9010 5.3 5 385 385 1.1 1.1 0.02 0.03162 Barre Town GS/OF 3612-9010 33.7 11 3,189 3,189 8.9 8.9 0.18 0.41163 Barre Town GS/OF 3612-9010 9.3 15 1,080 1,080 3.0 3.0 0.06 0.16164 Barre Town OF/GS/SB/CB 3379-9010 40.2 11 4,007 4,007 11.1 11.1 0.25 FALSE171 Barre Town GS/CB 6.6 32 1,856 1,856 5.2 5.2 0.11 FALSE172 Barre Town GS/CB 2.8 25 606 606 1.7 1.7 0.03 FALSE173 Barre Town GS/CB 1.8 41 677 677 1.9 1.9 0.04 FALSE174 Barre Town CB 1.2 68 886 886 2.5 2.5 0.05 FALSE175 Barre Town CB/GS 2.0 37 663 663 1.8 1.8 0.04 FALSE176 Barre Town CB/OF 3.0 47 1,356 1,356 3.8 3.8 0.08 FALSE177 Barre Town CB 3.0 74 2,713 2,713 7.5 7.5 0.15 FALSE179 Barre Town CB/GS 10.9 35 3,461 3,461 9.6 9.6 0.20 0.42180 Barre Town OF/GS 85.5 2 5,955 5,955 16.5 16.5 0.34 0.19181 Barre Town CB/GS 55.0 4 4,210 4,210 11.7 11.7 0.24 0.25182 Barre Town OF/GS 17.3 10 1,819 1,819 5.1 5.1 0.10 0.19183 Barre Town GS/CB 7.2 13 899 899 2.5 2.5 0.05 0.11184 Barre Town OF/GS 18.2 5 1,456 1,456 4.0 4.0 0.08 0.10185 Barre Town OF/GS 6.5 15 886 886 2.5 2.5 0.05 0.11186 Barre Town GS/CB 5.5 15 761 761 2.1 2.1 0.04 0.09187 Barre Town CB/GS 16.9 24 3,432 3,432 9.5 9.5 0.19 0.44188 Barre Town OF 31.5 3 2,273 2,273 6.3 6.3 0.13 0.10
189 Barre Town 2Stabilize erosion in park area RR/GS/CB 6.4 38 2,192 1,753 6.1 5.5 0.12 0.27
190 Barre Town OF 39.2 2 2,702 2,702 7.5 7.5 0.15 0.07191 Barre Town OF 15.4 27 3,613 3,613 10.0 10.0 0.20 0.46192 Barre Town OF/GS 32.1 4 2,411 2,411 6.7 6.7 0.14 0.13193 Barre Town OF 27.0 14 3,550 3,550 9.9 9.9 0.20 FALSE200 Barre Town OF/GS/EWP 3828-9015 6.1 41 318 318 2.6 2.6 0.09 0.27

Barre Town - Subwatershed Prioritization and Recommendations (pg4)
Watershed Number Action List #
Proposed or Existing Stormwater Treatment
PracticeEstimated Basin
Construction CostEstimated Other BMP
Construction Cost
Cost of Sediment Removal Per Pound
(based on annual sediment load)
Cost of Phosphorus Removal Per Pound
(based on annual phosphorus load)
Assistance Program
Number of LID - Roof
Raingardens to treat CPv
(Residential)Raingarden
Cost145 Barre Town 0 OF 259 $119,170146 Barre Town 0 OF/CB 301 $138,581147 Barre Town 0 CB/SWPPP 148 $68,193148 Barre Town 0 CB 0 $0149 Barre Town 0 GS/OF/CB 0 $0150 Barre Town 0 OF/CB 0 $0151 Barre Town 0 OF 0 $0152 Barre Town 0 OF 0 $0153 Barre Town 0 CB/GS 119 $54,746154 Barre Town 0 GS/OF 55 $25,488155 Barre Town 0 CB/OF 335 $154,279156 Barre Town 0 CB.GS 81 $37,079157 Barre Town 0 GS/CB 214 $98,520158 Barre Town 0 OF 2 $900159 Barre Town 0 OF/GS 0 $0160 Barre Town 0 OF/WP 0 $0161 Barre Town 0 GS 14 $6,302162 Barre Town 0 GS/OF 205 $94,075163 Barre Town 0 GS/OF 79 $36,235164 Barre Town 0 OF/GS/SB/CB 0 $0171 Barre Town 0 GS/CB 0 $0172 Barre Town 0 GS/CB 0 $0173 Barre Town 0 GS/CB 0 $0174 Barre Town 0 CB 0 $0175 Barre Town 0 CB/GS 0 $0176 Barre Town 0 CB/OF 0 $0177 Barre Town 0 CB 0 $0179 Barre Town 0 CB/GS 212 $97,621180 Barre Town 0 OF/GS 94 $43,262181 Barre Town 0 CB/GS 127 $58,442182 Barre Town 0 OF/GS 97 $44,644183 Barre Town 0 GS/CB 53 $24,409184 Barre Town 0 OF/GS 51 $23,483185 Barre Town 0 OF/GS 54 $24,832186 Barre Town 0 GS/CB 47 $21,429187 Barre Town 0 CB/GS 219 $100,905188 Barre Town 0 OF 50 $23,111
189 Barre Town 2 RR/GS/CB 1,000.00 $2 $1,643 ERP, Section 319, LCBP 133 $61,043190 Barre Town 0 OF 37 $16,860191 Barre Town 0 OF 230 $105,586192 Barre Town 0 OF/GS 67 $30,861193 Barre Town 0 OF 0 $0200 Barre Town 0 OF/GS/EWP 135 $62,117

Barre Town - Subwatershed Prioritization and Recommendations
Watershed Number Action List # Proposed Action
Proposed or Existing Stormwater
Treatment Practice Permit NumberWatershed
Area (Acres)
Percent Mapped
Impervious Area (MIA)
Sediment Load with Current
Reductions (lbs)
Sediment Load with Priority
Action (lbs)
Phosphorus Load with Current
Reductions (lbs)
Phosphorus Load with Priority Action (lbs)
Water Quality Volume (Acre-
Feet)
Channel Protection (Acre-Feet)
201 Barre Town CB/GS 73.3 8.8 7,157 7,157 19.9 19.9 0.40 0.71202 Barre Town CB 31.5 25.0 9,254 9,254 25.7 25.7 0.52 0.87203 Barre Town CB 2.1 42.6 827 827 2.3 2.3 0.05 0.10204 Barre Town OF/WP 63.7 7.7 5,847 5,847 16.2 16.2 0.33 FALSE205 Barre Town GS/CB 52.8 7.9 4,902 4,902 13.6 13.6 0.28 0.46206 Barre Town CB 79.4 6.9 9,082 9,082 25.2 25.2 0.51 0.60207 Barre Town CB 11.8 22.6 2,284 2,284 6.3 6.3 0.13 0.29208 Barre Town BFCB/OF 12.2 17.3 928 928 3.4 3.4 0.09 0.23209 Barre Town CB/GS 22.4 3.8 1,683 1,683 4.7 4.7 0.10 0.09210 Barre Town CB 4.5 34.8 1,835 1,835 5.1 5.1 0.10 0.17211 Barre Town OF 35.3 9.2 3,507 3,507 9.7 9.7 0.20 0.36212 Barre Town CB 26.1 14.9 4,922 4,922 13.7 13.7 0.28 0.43
213 Barre Town OF/GS/WP/SWPPP 4407-9003 122.3 9.0 8,436 8,436 26.4 26.4 0.60 FALSE214 Barre Town CB/GS/SWPPP 4717-9003 270.1 4.3 20,781 20,781 57.7 57.7 1.18 1.28215 Barre Town OF/WP 62.2 3.8 845 845 7.0 7.0 0.24 FALSE216 Barre Town CB/GS/WP 30.0 2.9 434 434 3.6 3.6 0.12 FALSE217 Barre Town CB/GS/WP 4.2 21.2 152 152 1.3 1.3 0.04 FALSE218 Barre Town CB/GS/WP 2.0 25.8 89 89 0.7 0.7 0.03 FALSE219 Barre Town CB/GS/WP 13.0 28.1 637 637 5.3 5.3 0.18 FALSE220 Barre Town OF 4.3 0.3 58 58 0.5 0.5 0.02 0.00221 Barre Town CB/GS 59.9 8.2 5,652 5,652 15.7 15.7 0.32 0.54222 Barre Town CB/GS 17.7 13.9 2,272 2,272 6.3 6.3 0.13 0.27223 Barre Town CB/GS/WP 12.8 27.7 404 404 3.4 3.4 0.11 FALSE224 Barre Town CB/GS/WP 18.7 12.4 317 317 2.6 2.6 0.09 FALSE225 Barre Town GS 19.8 4.0 1,350 1,350 3.7 3.7 0.08 FALSE226 Barre Town CB/BRA 4032-9015 2.8 21.7 70 70 0.6 0.6 0.02 0.07227 Barre Town OF/GS 4032-9015 1.8 9.4 32 32 0.3 0.3 0.01 FALSE228 Barre Town CB/GS 4032-9015 31.5 3.1 2,296 2,296 6.4 6.4 0.13 0.11229 Barre Town CB/GS 10.5 6.4 899 899 2.5 2.5 0.05 0.07230 Barre Town CB 13.2 13.6 1,658 1,658 4.6 4.6 0.09 0.20231 Barre Town CB 4.7 19.7 804 804 2.2 2.2 0.05 0.10232 Barre Town CB/GS 29.5 12.3 3,470 3,470 9.6 9.6 0.20 0.40233 Barre Town CB/GS 4.0 29.9 1,035 1,035 2.9 2.9 0.06 0.13234 Barre Town CB/GS/WP 2.1 42.9 121 121 1.0 1.0 0.03 FALSE235 Barre Town CB/GS 6.7 21.7 1,245 1,245 3.5 3.5 0.07 0.16236 Barre Town GS/OF 30.0 9.3 3,010 3,010 8.4 8.4 0.17 0.31237 Barre Town CB 1.2 37.1 411 411 1.1 1.1 0.02 0.05238 Barre Town CB/GS 1.5 26.6 339 339 0.9 0.9 0.02 0.04239 Barre Town CB 1.9 18.8 318 318 0.9 0.9 0.02 0.04240 Barre Town CB/GS 2.1 28.2 506 506 1.4 1.4 0.03 0.06241 Barre Town CB/GS/WP 3.0 36.0 657 657 1.8 1.8 0.04 FALSE242 Barre Town CB/GS/OF 36.3 6.3 3,995 3,995 11.1 11.1 0.23 FALSE243 Barre Town CB/GS/SF 4969-9010 3.8 33.4 153 153 1.3 1.3 0.04 FALSE
244 Barre Town 2Riparian filter strip behind gas station FS/GS/OF 17.2 17.7 3,720 2,604 10.3 8.8 0.21 FALSE
245 Barre Town OF 4.4 17.8 687 687 1.9 1.9 0.04 FALSE246 Barre Town OF 8.1 20.0 1,939 1,939 5.4 5.4 0.11 FALSE247 Barre Town CB/OF/GS 189.1 5.0 15,028 15,028 41.7 41.7 0.85 FALSE248 Barre Town GS 34.3 16.1 4,915 4,915 13.7 13.7 0.28 FALSE249 Barre Town CB/OF 114.8 3.9 8,667 8,667 24.1 24.1 0.49 FALSE

Barre Town - Subwatershed Prioritization and Recommendations
Watershed Number Action List #
Proposed or Existing Stormwater Treatment
PracticeEstimated Basin
Construction Cost
Estimated Other BMP Construction
Cost
Cost of Sediment Removal Per Pound
(based on annual sediment load)
Cost of Phosphorus Removal Per Pound
(based on annual phosphorus load)
Assistance Program
Number of LID - Roof Raingardens to treat CPv
(Residential) Raingarden Cost201 Barre Town 0 CB/GS ERP/Vtrans/LCBP 357 $163,988202 Barre Town 0 CB ERP/Vtrans/LCBP 434 $199,508203 Barre Town 0 CB ERP/Vtrans/LCBP 49 $22,403204 Barre Town 0 OF/WP ERP/Vtrans/LCBP 0 $0205 Barre Town 0 GS/CB ERP/Vtrans/LCBP 230 $105,702206 Barre Town 0 CB ERP/Vtrans/LCBP 300 $137,807207 Barre Town 0 CB ERP/Vtrans/LCBP 146 $67,162208 Barre Town 0 BFCB/OF ERP/Vtrans/LCBP 116 $53,281209 Barre Town 0 CB/GS ERP/Vtrans/LCBP 47 $21,588210 Barre Town 0 CB ERP/Vtrans/LCBP 87 $39,988211 Barre Town 0 OF ERP/Vtrans/LCBP 178 $81,862212 Barre Town 0 CB ERP/Vtrans/LCBP 214 $98,554
213 Barre Town 0 OF/GS/WP/SWPPP ERP/Vtrans/LCBP 0 $0214 Barre Town 0 CB/GS/SWPPP ERP/Vtrans/LCBP 640 $294,430215 Barre Town 0 OF/WP ERP/Vtrans/LCBP 0 $0216 Barre Town 0 CB/GS/WP ERP/Vtrans/LCBP 0 $0217 Barre Town 0 CB/GS/WP ERP/Vtrans/LCBP 0 $0218 Barre Town 0 CB/GS/WP ERP/Vtrans/LCBP 0 $0219 Barre Town 0 CB/GS/WP ERP/Vtrans/LCBP 0 $0220 Barre Town 0 OF ERP/Vtrans/LCBP 1 $298221 Barre Town 0 CB/GS ERP/Vtrans/LCBP 271 $124,437222 Barre Town 0 CB/GS ERP/Vtrans/LCBP 136 $62,355223 Barre Town 0 CB/GS/WP ERP/Vtrans/LCBP 0 $0224 Barre Town 0 CB/GS/WP ERP/Vtrans/LCBP 0 $0225 Barre Town 0 GS ERP/Vtrans/LCBP 0 $0226 Barre Town 0 CB/BRA ERP/Vtrans/LCBP 34 $15,611227 Barre Town 0 OF/GS ERP/Vtrans/LCBP 0 $0228 Barre Town 0 CB/GS ERP/Vtrans/LCBP 54 $24,954229 Barre Town 0 CB/GS ERP/Vtrans/LCBP 37 $17,040230 Barre Town 0 CB ERP/Vtrans/LCBP 98 $45,217231 Barre Town 0 CB ERP/Vtrans/LCBP 51 $23,481232 Barre Town 0 CB/GS ERP/Vtrans/LCBP 199 $91,722233 Barre Town 0 CB/GS ERP/Vtrans/LCBP 65 $29,969234 Barre Town 0 CB/GS/WP ERP/Vtrans/LCBP 0 $0235 Barre Town 0 CB/GS ERP/Vtrans/LCBP 80 $36,570236 Barre Town 0 GS/OF ERP/Vtrans/LCBP 154 $70,821237 Barre Town 0 CB ERP/Vtrans/LCBP 25 $11,483238 Barre Town 0 CB/GS ERP/Vtrans/LCBP 22 $9,933239 Barre Town 0 CB ERP/Vtrans/LCBP 20 $9,247240 Barre Town 0 CB/GS ERP/Vtrans/LCBP 32 $14,729241 Barre Town 0 CB/GS/WP ERP/Vtrans/LCBP 0 $0242 Barre Town 0 CB/GS/OF ERP/Vtrans/LCBP 0 $0243 Barre Town 0 CB/GS/SF ERP/Vtrans/LCBP 0 $0
244 Barre Town 2 FS/GS/OF $1,000 $1 $645 ERP/Vtrans/LCBP 0 $0245 Barre Town 0 OF ERP/Vtrans/LCBP 0 $0246 Barre Town 0 OF ERP/Vtrans/LCBP 0 $0247 Barre Town 0 CB/OF/GS ERP/Vtrans/LCBP 0 $0248 Barre Town 0 GS ERP/Vtrans/LCBP 0 $0249 Barre Town 0 CB/OF ERP/Vtrans/LCBP 0 $0

Target Maps
Showing Priority Action List Drainage Areas
And Potential Retrofit Locations

Barre Town
C
C
RICH
ARDS
ON R
D
SPRI
NG H
OLLO
W LN
CROSS ST
MISTY MOUNTAIN DR
MEAD
OWS D
R
Creator: Jim Pease, David AinleyDEC - WSMD - Ecosystem RestorationSectionPlotted Date: 4/16/2013Data Sources: VTRANS Roads data, VTHydrography data set, DEC StormwaterdatabaseImagery Source: NAIP 2012
Barre Town, VTDEC Stormwater Infrastructure
Mapping Project
µ0 30 6015 Meters
This map shows high priority subwatershedswhich are ranked by connectedness, percentof impervious cover, field observations, andpotential retrofit measures and locations.
The data shown on this map is only asaccurate as the available sources and fieldobservations allowed and should be used as abasic planning level tool only.
Subwatershed: 1Action List: 1
NRCS - SoilsABCD
SubwatershedIDPriority SubwatershedStormwater Treatment AreaPotential Stormwater Treatment Area
!!2 Sanitary manholes Sanitary line
Line Features
Swale
Footing drainUnder drainRoof drainTrench drainTunnel (storm)
((T TTTEmergency spillway
Stream
Storm line
Point Features"?B Catchbasin"?B Dry Well"W Drop Inlet
!Æ Yard drain!!2 Stormwater Manhole
!h Outfall!R Culvert inlet!R Culvert outletÑÕ Retrofit
Potential to Riprap the outfall of subwatershed #1.
1

Barre Town
B
C
C
C
D
C C
STERLING HILL RDSILVE
R CI
R
Creator: Jim Pease, David AinleyDEC - WSMD - Ecosystem RestorationSectionPlotted Date: 4/16/2013Data Sources: VTRANS Roads data, VTHydrography data set, DEC StormwaterdatabaseImagery Source: NAIP 2012
Barre Town, VTDEC Stormwater Infrastructure
Mapping Project
µ0 60 12030 Meters
This map shows high priority subwatershedswhich are ranked by connectedness, percentof impervious cover, field observations, andpotential retrofit measures and locations.
The data shown on this map is only asaccurate as the available sources and fieldobservations allowed and should be used as abasic planning level tool only.
Subwatershed: 100Action List: 1
NRCS - SoilsABCD
SubwatershedIDPriority SubwatershedStormwater Treatment AreaPotential Stormwater Treatment Area
!!2 Sanitary manholes Sanitary line
Line Features
Swale
Footing drainUnder drainRoof drainTrench drainTunnel (storm)
((T TTTEmergency spillway
Stream
Storm line
Point Features"?B Catchbasin"?B Dry Well"W Drop Inlet
!Æ Yard drain!!2 Stormwater Manhole
!h Outfall!R Culvert inlet!R Culvert outletÑÕ Retrofit
Potential to Riprap the outfall of subwatershed #100.
100
Barre Town
A
B
C
A
B
C
D
water
Æ·14
Æ·63
Æ·63
MIDDLE RD
WILMUT
H ST
WILMUTH
ST
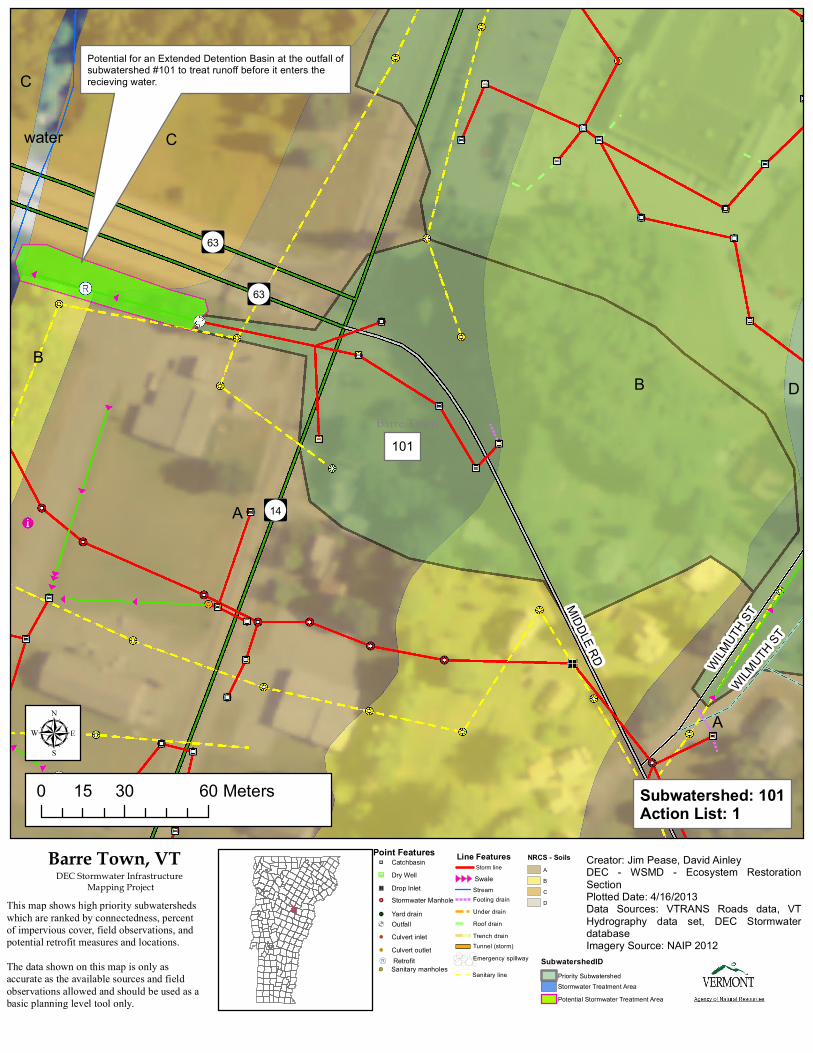
Creator: Jim Pease, David AinleyDEC - WSMD - Ecosystem RestorationSectionPlotted Date: 4/16/2013Data Sources: VTRANS Roads data, VTHydrography data set, DEC StormwaterdatabaseImagery Source: NAIP 2012
Barre Town, VTDEC Stormwater Infrastructure
Mapping Project
µ0 30 6015 Meters
This map shows high priority subwatershedswhich are ranked by connectedness, percentof impervious cover, field observations, andpotential retrofit measures and locations.
The data shown on this map is only asaccurate as the available sources and fieldobservations allowed and should be used as abasic planning level tool only.
Subwatershed: 101Action List: 1
NRCS - SoilsABCD
SubwatershedIDPriority SubwatershedStormwater Treatment AreaPotential Stormwater Treatment Area
!!2 Sanitary manholes Sanitary line
Line Features
Swale
Footing drainUnder drainRoof drainTrench drainTunnel (storm)
((T TTTEmergency spillway
Stream
Storm line
Point Features"?B Catchbasin"?B Dry Well"W Drop Inlet
!Æ Yard drain!!2 Stormwater Manhole
!h Outfall!R Culvert inlet!R Culvert outletÑÕ Retrofit
Potential for an Extended Detention Basin at the outfall ofsubwatershed #101 to treat runoff before it enters therecieving water.
101

Barre Town
A
B
A
D
C
C
C
C
B
Cwater
Æ·14
Æ·63
MIDDLE RD
WILMUT
H ST
WILSON ST
PLAT
INUM PL
AIN
STERLING HILL RD
HOWAR
D ST
WILMUTH
ST
Creator: Jim Pease, David AinleyDEC - WSMD - Ecosystem RestorationSectionPlotted Date: 4/16/2013Data Sources: VTRANS Roads data, VTHydrography data set, DEC StormwaterdatabaseImagery Source: NAIP 2012
Barre Town, VTDEC Stormwater Infrastructure
Mapping Project
µ0 60 12030 Meters
This map shows high priority subwatershedswhich are ranked by connectedness, percentof impervious cover, field observations, andpotential retrofit measures and locations.
The data shown on this map is only asaccurate as the available sources and fieldobservations allowed and should be used as abasic planning level tool only.
Subwatershed: 103Action List: 1
NRCS - SoilsABCD
SubwatershedIDPriority SubwatershedStormwater Treatment AreaPotential Stormwater Treatment Area
!!2 Sanitary manholes Sanitary line
Line Features
Swale
Footing drainUnder drainRoof drainTrench drainTunnel (storm)
((T TTTEmergency spillway
Stream
Storm line
Point Features"?B Catchbasin"?B Dry Well"W Drop Inlet
!Æ Yard drain!!2 Stormwater Manhole
!h Outfall!R Culvert inlet!R Culvert outletÑÕ Retrofit
Potential toRiprap the outfall of subwatershed #103.
103

Barre TownC
C
C
D
DC
LEDGE DR
CANO
DR
MOON
LIGHT
DR
SPRI
NG H
OLLO
W LN
GRAN
VIEW
DR
MEAD
OWS D
R
CROSS ST
RICHARDSON RD
MISTY MOUNTAIN DR
Creator: Jim Pease, David AinleyDEC - WSMD - Ecosystem RestorationSectionPlotted Date: 4/16/2013Data Sources: VTRANS Roads data, VTHydrography data set, DEC StormwaterdatabaseImagery Source: NAIP 2012
Barre Town, VTDEC Stormwater Infrastructure
Mapping Project
µ
0 50 10025 Meters
This map shows high priority subwatershedswhich are ranked by connectedness, percentof impervious cover, field observations, andpotential retrofit measures and locations.
The data shown on this map is only asaccurate as the available sources and fieldobservations allowed and should be used as abasic planning level tool only.
Subwatershed: 13Action List: 1
NRCS - SoilsABCD
SubwatershedIDPriority SubwatershedStormwater Treatment AreaPotential Stormwater Treatment Area
!!2 Sanitary manholes Sanitary line
Line Features
Swale
Footing drainUnder drainRoof drainTrench drainTunnel (storm)
((T TTTEmergency spillway
Stream
Storm line
Point Features"?B Catchbasin"?B Dry Well"W Drop Inlet
!Æ Yard drain!!2 Stormwater Manhole
!h Outfall!R Culvert inlet!R Culvert outletÑÕ Retrofit
Potential to Riprap the outfall of subwatershed #13.
13

Barre TownC
C
D
C
B
BOLS
TER
RD
WEBSTERVILLE RD
Creator: Jim Pease, David AinleyDEC - WSMD - Ecosystem RestorationSectionPlotted Date: 4/16/2013Data Sources: VTRANS Roads data, VTHydrography data set, DEC StormwaterdatabaseImagery Source: NAIP 2012
Barre Town, VTDEC Stormwater Infrastructure
Mapping Project
µ
0 70 14035 Meters
This map shows high priority subwatershedswhich are ranked by connectedness, percentof impervious cover, field observations, andpotential retrofit measures and locations.
The data shown on this map is only asaccurate as the available sources and fieldobservations allowed and should be used as abasic planning level tool only.
Subwatershed: 131Action List: 1
NRCS - SoilsABCD
SubwatershedIDPriority SubwatershedStormwater Treatment AreaPotential Stormwater Treatment Area
!!2 Sanitary manholes Sanitary line
Line Features
Swale
Footing drainUnder drainRoof drainTrench drainTunnel (storm)
((T TTTEmergency spillway
Stream
Storm line
Point Features"?B Catchbasin"?B Dry Well"W Drop Inlet
!Æ Yard drain!!2 Stormwater Manhole
!h Outfall!R Culvert inlet!R Culvert outletÑÕ Retrofit
Potential for aBioretention Area or Sedimentation Basinon the Downhill side of the Town Garage in subwatershed #131 to treat runoff before it enters therecieving water.
131

Barre Town
C
DC
C
C
C
water
£¤302
Æ·110
MILL ST
BIANCHI ST
PROSPECT ST
CARN
ES RD
WATER
MAN ST
PLEASANT ST
WEBSTERVILLE RD
CENTRAL ST
GARDEN ST
SUMMER ST
DICKEY LN
Creator: Jim Pease, David AinleyDEC - WSMD - Ecosystem RestorationSectionPlotted Date: 4/16/2013Data Sources: VTRANS Roads data, VTHydrography data set, DEC StormwaterdatabaseImagery Source: NAIP 2012
Barre Town, VTDEC Stormwater Infrastructure
Mapping Project
µ
0 50 10025 Meters
This map shows high priority subwatershedswhich are ranked by connectedness, percentof impervious cover, field observations, andpotential retrofit measures and locations.
The data shown on this map is only asaccurate as the available sources and fieldobservations allowed and should be used as abasic planning level tool only.
Subwatershed: 131Action List: 1
NRCS - SoilsABCD
SubwatershedIDPriority SubwatershedStormwater Treatment AreaPotential Stormwater Treatment Area
Line Features
Swale
Footing drainUnder drainRoof drainTrench drainTunnel (storm)
((T TTTEmergency spillway
Stream
Storm line
Point Features"?B Catchbasin"?B Dry Well"W Drop Inlet
!Æ Yard drain!!2 Stormwater Manhole
!h Outfall!R Culvert inlet!R Culvert outletÑÕ Retrofit
Potential for Erosion Stabilization in subwatershed #189.
189

Barre TownC
D
C
CCD
SMITH FARM RD
COUNTRYSIDE DR
FIELD
STONE LN
COUN
TRYS
IDE CI
R
Creator: Jim Pease, David AinleyDEC - WSMD - Ecosystem RestorationSectionPlotted Date: 4/16/2013Data Sources: VTRANS Roads data, VTHydrography data set, DEC StormwaterdatabaseImagery Source: NAIP 2012
Barre Town, VTDEC Stormwater Infrastructure
Mapping Project
µ
0 40 8020 Meters
This map shows high priority subwatershedswhich are ranked by connectedness, percentof impervious cover, field observations, andpotential retrofit measures and locations.
The data shown on this map is only asaccurate as the available sources and fieldobservations allowed and should be used as abasic planning level tool only.
Subwatershed: 39Action List: 2
NRCS - SoilsABCD
SubwatershedIDPriority SubwatershedStormwater Treatment AreaPotential Stormwater Treatment Area
!!2 Sanitary manholes Sanitary line
Line Features
Swale
Footing drainUnder drainRoof drainTrench drainTunnel (storm)
((T TTTEmergency spillway
Stream
Storm line
Point Features"?B Catchbasin"?B Dry Well"W Drop Inlet
!Æ Yard drain!!2 Stormwater Manhole
!h Outfall!R Culvert inlet!R Culvert outletÑÕ Retrofit
Potential fpr a Bioretention Area behind 2 countryside circle to treatrunoff from subwatershed #39 before it enters the receiving water.
39

Barre Town
C C
C
C
C
C
C
C
C
water
C C
C
£¤302
£¤302
£¤302
Æ·110
E COB
BLE H
ILL R
D
MILL ST
HILLSIDE AV
OLD ROUTE 302
BIANCHI ST
PARTRIDGE RD
VCGI
Creator: Jim Pease, David AinleyDEC - WSMD - Ecosystem RestorationSectionPlotted Date: 2/17/2017Data Sources: VTRANS Roads data, VTHydrography data set, DEC StormwaterdatabaseImagery Source: VCGI Best Available
Barre Town, VTDEC Stormwater Infrastructure
Mapping Project
µ
0 75 15037.5 Meters
This map shows high priority subwatershedswhich are ranked by connectedness, percentof impervious cover, field observations, andpotential retrofit measures and locations.
The data shown on this map is only asaccurate as the available sources and fieldobservations allowed and should be used as abasic planning level tool only.
Subwatershed: 244Action List: 2
NRCS - SoilsABCD
SubwatershedIDPriority SubwatershedStormwater Treatment AreaPotential Stormwater Treatment Area
Line Features
Swale
Footing drainUnder drainRoof drainTrench drainTunnel (storm)
((T TTTEmergency spillway
Stream
Storm line
Point Features"?B Catchbasin"?B Dry Well"W Drop Inlet
!Æ Yard drain!!2 Stormwater Manhole
!h Outfall!R Culvert inlet!R Culvert outletÑÕ Retrofit
Potential for a riparian filter strip behind the gas stationin subwatershed #244 to treat runoff before it entersthe recieving water.
244

Spill Control
and
Vermont Hazardous Waste Management Regulations
Have a spill control plan for accidental spills at municipal facilities and on municipal streets These stormwater infrastructure maps show the connectivity of the stormwater system for the municipality as accurately as it could be determined with the collected and existing data. In the event of a spill this can be a valuable tool for controlling spills and in spill response.
Towns should be equipped with suitable equipment to contain and clean up spills of hazardous materials. Accidental spills of materials can be sources of runoff pollution if not addressed appropriately. If possible Towns should be prepared to address spills on municipal streets while at the same time contacting the state Waste Management Division. DPW managers should be aware of all applicable requirements and should contact regulatory authorities if requirements are not known.
All spills should be cleaned up immediately after they occur. For municipal facilities the creation of a site specific spill control and response plan in combination with spill response training for designated on-site personnel can be effective in dealing with accidental spills and preventing the contamination of soil, water, and runoff. Preparation of a spill containment, control, and countermeasures (SPCC) plan might be required to meet regulatory requirements (e.g., requirements regarding storage of specified chemicals above certain volume thresholds). Even if a formal plan is not required, preparing one is a good idea. In general, an SPCC plan should include guidance to site personnel on the following:
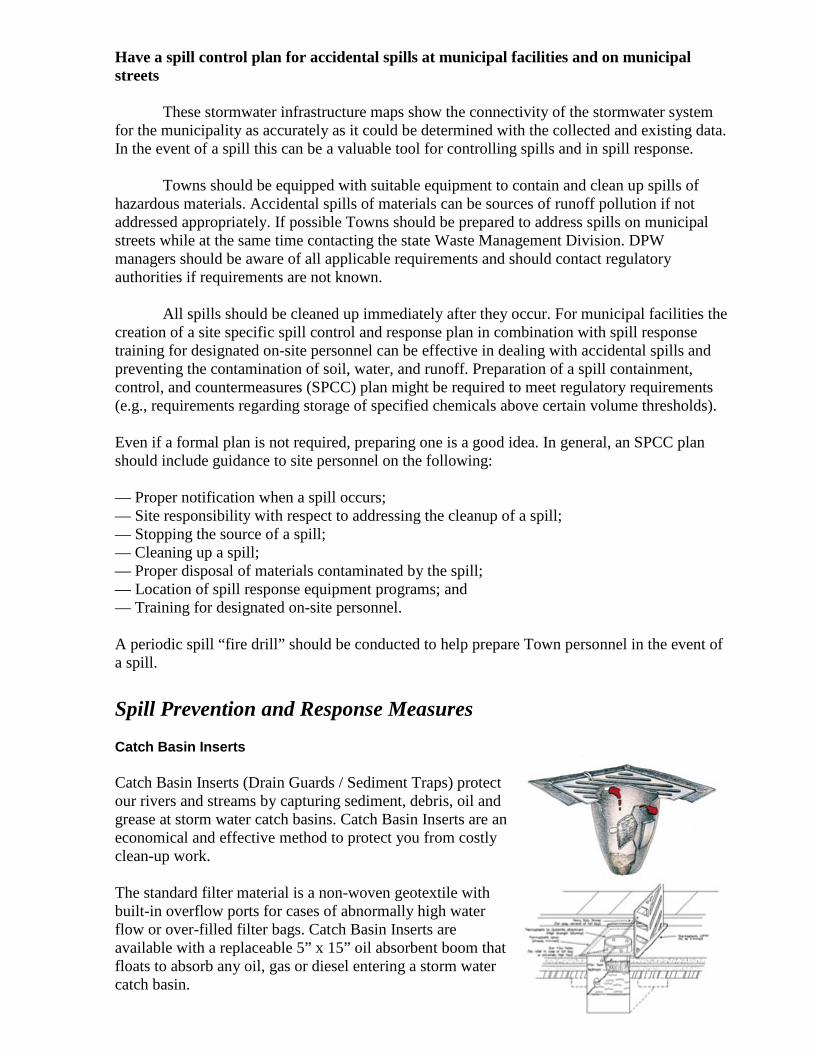
— Proper notification when a spill occurs; — Site responsibility with respect to addressing the cleanup of a spill; — Stopping the source of a spill; — Cleaning up a spill; — Proper disposal of materials contaminated by the spill; — Location of spill response equipment programs; and — Training for designated on-site personnel. A periodic spill “fire drill” should be conducted to help prepare Town personnel in the event of a spill. Spill Prevention and Response Measures Catch Basin Inserts Catch Basin Inserts (Drain Guards / Sediment Traps) protect our rivers and streams by capturing sediment, debris, oil and grease at storm water catch basins. Catch Basin Inserts are an economical and effective method to protect you from costly clean-up work. The standard filter material is a non-woven geotextile with built-in overflow ports for cases of abnormally high water flow or over-filled filter bags. Catch Basin Inserts are available with a replaceable 5” x 15” oil absorbent boom that floats to absorb any oil, gas or diesel entering a storm water catch basin.

Urethane Drain Protector Urethane Drain Protectors are positive sealing drain covers that ensure spills do not enter drains. Drain Protectors are environmentally safe and resistant to chemicals, solvents and hydrocarbons. After use, the Drain Protector can be washed and stored in its tube storage container. Absorbent Socks Absorbent socks are flexible tubes used to contain and clean-up spilled fluids. Socks are widely used in industrial applications and are ideal for Spill Kits. Fast spreading spills are quickly stopped with a sock. Drums & Intermediate Bulk Containers (IBC’s) New and reconditioned steel drums are ideal for storing solid and liquid waste. Poly drums available for durable outdoor storage or for building your own spill kits. Steel and poly drums are available in both tight-head (TH) and full open-head styles (FOH).
Pads & Rolls Absorbent pads and rolls made from polypropylene fibers are the most popular form of absorbents on the market. Various types of absorbent pads and rolls can be used for different liquids and site applications. The most widely used absorbent pads and rolls are oil-only (white) and universal (grey). Pads and rolls are great for spills on water or land, easily absorbing 20 to 25 times their own weight in recovered liquid. Rolls can easily be cut to the exact size required.
Booms Linkable Absorbent Booms Absorbent booms are ideal for containing and cleaning up spills on water. Booms repel water and float even when completely saturated. Absorbent booms are constructed with a strong mesh outer skin encasing non-linting and highly absorbent polypropylene filler. Linkable booms come complete with end rings and clips attached to nylon rope running the length of the boom.

Collection basins Collection basins are permanent structures in which large spills or contaminated storm water is contained and stored before cleanup or treatment. Collection basins are designed to receive spills, leaks, etc., and to prevent pollutants from being released into the environment. Unlike containment dikes, collection basins can receive and contain materials from many locations across a facility. Containment diking Containment dikes are temporary or permanent earth or concrete berms or retaining walls that are designed to hold spills. Diking can be used at any industrial facility, but is most common for controlling large spills or releases from liquid storage and transfer areas. Diking can provide one of the best protective measures against the contamination of storm water because it surrounds the area of concern and keeps spilled materials separated from the storm water outside of the diked area. Curbing Similar to containment diking, a curb is a barrier that surrounds an area of concern. Unlike diking, curbing is unable to contain large spills and is usually implemented on a small-scale basis. However, curbing is common at many facilities and in small areas where liquids are handled and transferred. Granular Absorbents A variety of granular and powdered absorbents are available for the effective clean-up of spills on streets, construction sites and in repair shops. These products absorb spilled liquids of various kinds to greatly lower the viscosity, aiding in the clean-up of the spill. Sorbents, Gels, and Foams Sorbents are compounds that immobilize materials by surface absorption or adsorption in the sorbent bulk. Gelling agents interact with the spilled chemical(s) by concentrating and congealing to form a rigid or viscous material more conducive to a mechanical cleanup. Foams are mixtures of air and aqueous solutions of proteins and surfactant-based foaming agents. The primary purpose of foams is to reduce the vapor concentration above the spill surface, thereby controlling the rate of evaporation. § 7-105 EMERGENCY AND CORRECTIVE ACTIONS (a) Emergency actions
(1) In the event of a discharge of hazardous waste or a release of a hazardous material, the person in control of such waste or material shall:
(A) Take all appropriate immediate actions to protect human health and the environment including, but not limited to, emergency containment measures and notification as described below; and (B) Take any further clean up actions as may be required and approved by federal, state, or local officials, or corrective actions as specified under subsection (b) of this section so that the discharged waste or released material and related contaminated materials no longer present a hazard to human health or the environment.
(2) Reporting (A) All discharges and/or releases that meet any of the following criteria shall be immediately reported to the Secretary by the person or persons exercising control over such waste by calling the Waste Management Division at (802) 241-3888, Monday

through Friday, 7:45 a.m. to 4:30 p.m. or the Department of Public Safety, Emergency Management Division at (800) 641-5005, 24 hours/day:
(i) A discharge of hazardous waste, or release of hazardous material that exceeds 2 gallons; (ii) A discharge of hazardous waste, or release of hazardous material that is less than or equal to 2 gallons and poses a potential or actual threat to human health or the environment; or (iii) A discharge of hazardous waste, or release of hazardous material that equals or exceeds its corresponding reportable quantity under CERCLA as specified under 40 CFR § 302.4. Note: Under the Federal Water Pollution Control Act, certain spills of “oil” and/or “hazardous substances” are prohibited and must be reported pursuant to the requirements of 40 CFR Part 110 / Discharge of Oil. Certain spills of hazardous substances must also be reported pursuant to CERCLA. In both cases, the National Response Center must be notified at (800) 424-8802. Finally, in addition to federal and state spill reporting, EPCRA requires that spills are also reported to local authorities.
(B) A written report shall be submitted to the Secretary within ten (10) days following any discharge or release subject to subsection (a)(1) of this section. The report should be sent to: The Vermont Department of Environmental Conservation, Waste Management Division, 103 South Main Street, Waterbury, VT 05671-0404. The person responsible for submitting the written report may request that it not be submitted for small discharges and/or releases that were reported pursuant to subsection (a)(2)(A) of this section, and that have been entirely remediated within the ten (10) day period immediately following the discharge and/or release
(3) If the discharge or release occurred during transportation, the transporter shall, in addition to notifying the Secretary:
(A) Notify the National Response Center at (800) 424-8802 or (202) 426-2675, if required by 49 CFR § 171.15; and (B) Report in writing to the Director, Office of Hazardous Materials Regulations, Materials Transportation Bureau, Department of Transportation, Washington, D.C. 20590, if required by 49 CFR § 171.16; and (C) A water (bulk shipment) transporter who has discharged hazardous wastes must give the same notice as required by 33 CFR § 153.203 for oil and hazardous substances.
(4) If a discharge or release occurs and the Secretary determines that immediate removal of the waste is necessary to protect human health or the environment, the Secretary may authorize its removal by unpermitted transporters without the preparation of a manifest. Such hazardous waste may be transported to a site authorized by the Secretary under the provisions of § 7-503 to temporarily accept hazardous waste generated during an emergency cleanup of a discharge or release. (5) In the case of an explosives or munitions emergency response, if a Federal, State, Tribal or local official acting within the scope of his or her official responsibilities, or an explosives or munitions emergency response specialist, determines that immediate removal of the material or waste is necessary to protect human health or the environment, that official or specialist may authorize the removal of the material or waste by transporters who do not have EPA identification numbers or hold Vermont hazardous waste transportation permits and without the preparation of a manifest. In the case of emergencies involving military munitions, the responding military emergency response specialist's organizational unit must retain records for three years identifying the dates of the response,

the responsible persons responding, the type and description of material addressed, and its disposition. (6) All clean up debris and residues that are hazardous waste must be transported ultimately to either:
(A) A designated facility; (B) A person authorized by the Secretary to use such waste if the waste has been delisted pursuant to § 7-218; (C) Some other location specified and authorized by the Secretary to receive clean up debris and residues if the waste has been delisted pursuant to § 7-218; or (D) For hazardous waste not defined as hazardous in 40 CFR Part 261 (i.e., waste regulated as hazardous by Vermont), to a facility, that is not a designated facility, located in a state other than Vermont provided the facility can receive such waste under applicable state and local laws, regulations and ordinances.
(b) Corrective actions (1) If a discharge of hazardous waste, or a release of hazardous material has not been adequately addressed under subsection (a)(1)(A) of this section the Secretary may require that the person or persons responsible pursuant to 10 V.S.A. § 6615 complete the following:
(A) Engage the services of an environmental consultant experienced in the investigation and remediation of hazardous waste-contaminated sites; and (B) Within thirty (30) days from either the date of the discharge/release or the date that the release was discovered if the date of discharge/release is not known, or within a period of time established by an alternative schedule approved by the Secretary, submit for approval by the Secretary a work plan for an investigation of the contaminated site (i.e., site investigation) prepared by the environmental consultant. The site investigation shall define the nature, degree and extent of the contamination; and shall assess potential impacts to human health and the environment (refer to the document titled: “Site Investigation Procedure” which is available from the Secretary upon request); and (C) Perform the site investigation within either ninety (90) days of receiving written approval of the work plan by the Secretary, or a period of time established by an alternative schedule approved by the Secretary. A report detailing the findings of the site investigation shall be sent to the Secretary for review; and (D) Within either thirty (30) days from the date of final acceptance of the site investigation report by the Secretary, or a period of time established by an alternative schedule approved by the Secretary, submit a corrective action plan prepared by the environmental consultant (refer to the document titled: “Corrective Action Guidance” which is available from the Secretary upon request); and (E) Implement the corrective action plan within either ninety (90) days of receiving written approval of the plan by the Secretary, or a period of time established by an alternative schedule approved by the Secretary. The corrective action activity shall continue until the contamination is remediated to levels approved by the Secretary; and (F) Submit to the Secretary all investigative, corrective action and monitoring reports, and all analytical results related to subsections (b)(1)(C) through (E) of this section, as they become available.
(2) A used or fired military munition is a waste and is potentially subject to corrective action authorities pursuant to 10 V.S.A. § 6615, and the process described by subsection (b)(1) of this section if the munition lands off-range and is not promptly rendered safe or retrieved. Any imminent and substantial threats associated with any remaining material must be addressed. If remedial action is infeasible, the operator of the range must maintain a record of the event for as long as any threat remains. The record must include the type of munition and its location (to the extent the location is known).

§ 7-106 LAND DISPOSAL RESTRICTIONS (a) Certain hazardous wastes shall not be disposed of in or on the land. 40 CFR Part 268, which is hereby incorporated by reference, except for 40 CFR §§ 268.5, 268.6, and 268.42(b), identifies those wastes which shall not be land disposed and describes the limited circumstances under which an otherwise prohibited waste may continue to be land disposed. The authority for implementing the CFR sections not incorporated by reference remains with the EPA.
Note: A copy of 40 CFR Part 268 (the Land Disposal Restrictions rule), as incorporated by these regulations, is available from the Secretary upon request.
(b) In addition to the prohibitions of 40 CFR Part 268, the Secretary may restrict the land disposal of any hazardous waste in the State of Vermont:
(1) Which may present an undue risk to human health or the environment, immediately or over a period of time; or (2) Which would be incompatible with the groundwater protection rule and strategy of chapter 12 of the environmental protection rules.
(c) Dilution of hazardous waste subject to the land disposal restrictions of 40 CFR Part 268 is prohibited pursuant to 40 CFR § 268.3. § 7-107 ENFORCEMENT (a) Information that the generation, transportation, treatment, storage or disposal of hazardous waste may present an actual or potential threat to human health or the environment, or is a violation of the 10 V.S.A. chapter 159, or these regulations, or any term or condition of certification, order, or assurance, may serve as grounds for an enforcement action by the Secretary, including, but not limited to:
(1) After notice and opportunity for hearing, issuing an order directing any person to take such steps as are necessary to:
(A) Immediately cease and desist any operation or practice; (B) Correct or prevent environmental damage likely to result from any deficiency in operation or practice; (C) Suspend or revoke any certification and require temporary or permanent cessation of the operation of such facility;
(2) A request that the Attorney General or appropriate State's Attorney commence an action for injunctive relief, the imposition of penalties and fines provided in 10 V.S.A. § 6612 and other relief as may be appropriate. (3) An order for reimbursement to any agency of federal, state, or local government from any person whose act caused governmental expenditures under 10 V.S.A § 1283. (4) All other powers of enforcement available to the Secretary through 10 V.S.A., chapter 201.
(b) The hearing by the Secretary identified under subsection (a)(1) of this section shall be conducted as a contested case. Pursuant to 10 V.S.A. § 6610(b), the Secretary may issue an emergency order without a prior hearing when an ongoing violation presents an immediate threat of substantial harm to the environment or an immediate threat to public health. An emergency order shall be effective upon actual notice to the person against whom the order is issued. Any person to whom an emergency order is issued shall be given the opportunity for a hearing within five (5) business days of the date the order is issued. (c) Inspections, investigations, and property access (10 V.S.A. § 8005)
(1) Inspections and investigations (A) An investigator may perform routine inspections to determine compliance. (B) An investigator may investigate upon receipt or discovery of information that an activity is being or has been conducted that may constitute or cause a violation.

(C) An investigator, upon presentation of credentials, may seek permission to inspect or investigate any portion of the property, fixtures, or other appurtenances belonging to or used by a person whose activity is required to be in compliance. The investigator shall state the purpose of the inspection or investigation. An inspection or investigation may include monitoring, sampling, testing, and copying of any records, reports, or other documents relating to the purposes to be served by compliance. (D) If permission for an inspection or investigation is refused, the investigator may seek an access order from the district or superior court in whose jurisdiction the property is located enabling the investigator to perform the inspection or investigation.
(2) Access orders (A) If access has been refused, an access order may be sought pursuant to either 10 V.S.A. § 8005 or 10 V.S.A. § 6609. (B) Issuance of an access order shall not negate the Secretary’s authority to initiate criminal proceedings in the same matter by referring the matter to the office of the attorney general or a state’s attorney.
(d) In an action to enforce these regulations, anyone raising a claim that a certain material is not a hazardous waste, or is exempt from regulation as hazardous waste, must demonstrate that there is a known market or disposition for the material, and that they meet the terms of the exclusion or exemption. Appropriate documentation (such as contracts showing that a second person uses the material as an ingredient in a production process) to demonstrate that the material is not a waste, or is exempt from regulation, must be provided. Owners and operators of facilities claiming that they are actually recycling materials must show that they have the necessary equipment to do so.