STORMWATER INFILTRATION AT THE SCALE OF AN...
115
STORMWATER INFILTRATION AT THE SCALE OF AN INDIVIDUAL RESIDENTIAL LOT IN NORTH CENTRAL FLORIDA By JUSTIN HAIG GREGORY A THESIS PRESENTED TO THE GRADUATE SCHOOL OF THE UNIVERSITY OF FLORIDA IN PARTIAL FULFILLMENT OF THE REQUIREMENTS FOR THE DEGREE OF MASTER OF ENGINEERING UNIVERSITY OF FLORIDA 2004
Transcript of STORMWATER INFILTRATION AT THE SCALE OF AN...

STORMWATER INFILTRATION AT THE SCALE OF AN INDIVIDUAL
RESIDENTIAL LOT IN NORTH CENTRAL FLORIDA
By
JUSTIN HAIG GREGORY
A THESIS PRESENTED TO THE GRADUATE SCHOOL OF THE UNIVERSITY OF FLORIDA IN PARTIAL FULFILLMENT
OF THE REQUIREMENTS FOR THE DEGREE OF MASTER OF ENGINEERING
UNIVERSITY OF FLORIDA
2004

Copyright 2004
by
Justin Haig Gregory

This thesis is dedicated to Chase, Lucy, and Charlie Brown

iv
ACKNOWLEDGMENTS
Special thanks are given to my supervisory committee members (Michael Dukes,
Pierce Jones, and Grady Miller). Their constant encouragement and guidance were
invaluable. I would also like to thank Sharra and my family. There continued support and
enthusiasm for my work resulted in the successful completion of this thesis.

v
TABLE OF CONTENTS page ACKNOWLEDGMENTS ................................................................................................. iv
LIST OF TABLES............................................................................................................ vii
LIST OF FIGURES ......................................................................................................... viii
ABSTRACT.........................................................................................................................x
CHAPTER 1 INTRODUCTION ........................................................................................................1
2 MEASURING INFILTRATION RATES ....................................................................3
Introduction...................................................................................................................3 Measuring Infiltration...................................................................................................3 Experimental Procedure................................................................................................7 Results...........................................................................................................................8 Conclusion ....................................................................................................................8
3 EFFECT OF URBAN SOIL COMPACTION ON INFILTRATION........................10
Introduction.................................................................................................................10 Literature Review .......................................................................................................11 Methodology and Site Descriptions............................................................................16 Results.........................................................................................................................21 Conclusion ..................................................................................................................32
4 LOT-LEVEL STORMWATER MANAGEMENT PRACTISES TO INCREASE
INFILTRATION AND REDUCE RUNOFF ............................................................41
Introduction.................................................................................................................41 Literature Review .......................................................................................................41 Pervious Pavement Evaluation ...................................................................................50 Soakaway Evaluation..................................................................................................54 Conclusion ..................................................................................................................62
5 LOT LEVEL HYDROLOGICAL MODEL...............................................................68

vi
Introduction.................................................................................................................68 The System .................................................................................................................70 Model Development ...................................................................................................72 Effectiveness of Promoting Lot Level Infiltration......................................................76 Conclusions.................................................................................................................87
6 CONCLUSION...........................................................................................................95
LIST OF REFERENCES...................................................................................................98
BIOGRAPHICAL SKETCH ...........................................................................................104

vii
LIST OF TABLES
Table page 2-1. Statistical analysis of infiltration rates from three types of infiltration tests...............9
2-2. Results of ANOVA for measured infiltration rates using different testing methodologies ............................................................................................................9
3-1. Predevelopment infiltration tests on the naturally wooded sites. ..............................33
3-2. Predevelopment and post development infiltration rates for the front and back yard on wooded site 2.......................................................................................................34
3-3. Infiltration rates, bulk density and CV from naturally wooded site 24, planted forest site 818 and 857........................................................................................................34
3-4. Paired t-test on infiltration rates and bulk density measurements for naturally wooded site 24 and planted forest site 818 and lot 857 ...........................................34
3-5. Correlation between average cone index (CI) and average infiltration rates, as measured on the compacted and undisturbed locations . .........................................35
3-6. Results of ANOVA for measured infiltration rates during Compaction Trial 2. ......35
3-7. Results of ANOVA for measured dry bulk density during Compaction Trial 2.......35
3-8. Mean infiltration and bulk density result from tests conducted in the wheel ruts of a dump truck, backhoe and pickup after nine passes over a graded pasture...............36
4-1. Measured infiltration rates on pervious surfaces in Gainesville, Fla. .......................63
5-1. Rainfall events used as inputs for the Lot Level Hydrological Model......................89
5-2. Total lot runoff (m3) as predicted with the Lot Level Hydrological Model for 5 rainfall events and 5 trials ........................................................................................89

viii
LIST OF FIGURES
Figure page 3-1. Predevelopment and post development cone index values for wooded site 2...........36
3-2. Average cone index values for undisturbed and compacted sites.. ...........................37
3-3. Standard Proctor density test results for the soil on the site under pasture and the wooded site...............................................................................................................38
3-4. Average infiltration and bulk density measurements from a site previously under pasture and a site in a natural wooded area.. ............................................................39
3-5. Average cone index values for different level of compaction...................................40
4-1. Typical cross section of a pervious pavement ...........................................................63
4-2. Construction detail for Bat House parking University of Florida .............................64
4-3. Theoretical relationships between exfiltration from a trench and water depth.. .......64
4-4. Results of water depths recorded in the model soakaway. . ......................................65
4-5. Linear regressions of data collected on model soakaway where...............................65
4-6. Comparison between model results and measured data for the soakaway Trial (a) and Trial (b)..............................................................................................................66
4-7. Theoretical change in water depth for the soakaway installed at the Madera model home .........................................................................................................................66
4-8. Model results of water volume in the soakaway installed at the Madera model home between January 2000 and December 2003. ............................................................67
5-1. Forester diagram for the Lot Level Hydrological Model ..........................................90
5-2. Conceptual Model of Flow Routing ..........................................................................90
5-3. Basic setup of the lot level hydrological model ........................................................90
5-4. Five-minute rainfall hyetographs for the 5 rainfall events used as an input to the lot-level hydrological model.. ..................................................................................91

ix
5-5. Rainfall events used as inputs for the lot-level hydrological model..........................92
5-6. Cumulative lot runoff simulated by the lot-level hydrological model.. ....................93
5-7. Lot-level hydrological model sensitivity analyses. ..................................................94
x
Abstract of Thesis Presented to the Graduate School
of the University of Florida in Partial Fulfillment of the Requirements for the Degree of Master of Engineering
STORMWATER INFILTRATION AT THE SCALE OF AN INDIVIDUAL RESIDENTIAL LOT IN NORTH CENTRAL FLORIDA
By
Justin Haig Gregory
August 2004
Chair: Michael D. Dukes Major Department: Agricultural and Biological Engineering
Managing stormwater at the scale of an urban residential lot may be an alternative
to traditional stormwater management strategies (i.e., curb and guttering). There are a
number of advantages to managing stormwater at the lot scale. Some of these advantages
include a reduced need for expensive large-scale, stormwater infrastructure; and
distributed groundwater recharge. Promoting infiltration on the lot is an effective means
of managing stormwater at this scale. Our study investigated lot level stormwater
infiltration in North Central Florida.
Quantifying soil infiltration rates was one goal of our study. Therefore, a small
double-ring infiltrometer (with a constant head) was compared to a number of other
double-ring methodologies. It was found that this was a suitable methodology for
measuring soil infiltration rates in the sandy soils found in North Central Florida.
Reduced soil infiltration rates will cause increased ponding, and increased
stormwater runoff. Compaction reduces the infiltration rate. A number of trials were used

xi
to quantify the effect of compaction on infiltration rates on sandy soils in North Central
Florida. The trials showed that compaction significantly reduced the measured infiltration
rates in sandy soils. This means that reducing the inadvertent compaction on a lot would
reduce stormwater runoff from the lot.
By definition, impervious driveways reduce infiltration on a lot. Use of pervious
materials in driveways can increase the overall perviousness of a lot. Infiltration rates
were measured at three locations with installed pervious pavement. It was found that the
infiltration rates on these pavements were extremely variable because of the subgrade. To
significantly reduce the imperviousness of a lot, driveways (and parking areas) need to be
correctly designed and installed.
A model soakaway was parameterized, using field experiments. The performance
of a soakaway was then simulated, using 4 years of measured rainfall data. It was found
that the soakaway effectively infiltrated the runoff from a roof, with only one failure
during that period.
A lot-level hydrological model was developed, to simulate the hydraulic and
hydrologic processes that occur on a lot. The model was used to compare the
effectiveness of four lot-level stormwater management scenarios, during five rainfall
events. Simulation results showed that promoting infiltration on a lot could be an
effective method for managing stormwater at the lot scale.

1
CHAPTER 1 INTRODUCTION
Urban areas in Florida are rapidly expanding, with Florida accounting for
approximately 11% of all new homes constructed in the United States in 2003 (US
Census Bureau 2004). Development of these new residential areas to meet Florida’s
growing population has increased the imperviousness of watersheds. This increased
imperviousness results in increased runoff generation. To address this problem,
stormwater systems characterized by large detention and conveyance structures have
been developed to prevent flooding of suburban areas, improve water quality, and help
recharge groundwater supplies. These systems are generally built at the residential
development scale, and large detention ponds within residential developments have
become commonplace. Detention ponds and their associated conveyance infrastructure
have helped solve a number of stormwater problems, but have simultaneously introduced
a number of new ones. These ponds often become unsightly stagnant pools of water
where mosquitoes breed, where vegetation growth requires maintenance, and where litter
collects. Furthermore, dangerously steep sides are a hazard to children, pets, and wildlife.
Viewing stormwater management from a different perspective has created a new
paradigm. Instead of focusing on conveying stormwater to storage and infiltration
facilities, research is being carried out to analyze the reasons why so much stormwater is
being generated in suburban areas. The new paradigm seeks to minimize and manage the
stormwater that is produced at a smaller scale, closer to the source.

2
Roofs, roads, driveways, and even the compaction of soils during construction all
contribute to the increased imperviousness of Florida’s watersheds. A number of
practices and techniques have been suggested to mitigate imperviousness. These include
promoting the construction of two-story houses to reduce the roof area within a suburb,
keeping road widths to a minimum, and using porous paving materials for road and
driveway surfaces. The soil compaction created during construction can be remediated by
tilling and adding compost to the soil during landscaping (Pitt et al., 1999). The use of
micro scale infiltration structures (such as infiltration trenches, bioretention areas, swales
and soakaways) at the scale of individual residences can reduce the volume, and improve
the quality, of stormwater that is produced on the site.
Our objective was to quantify the effect of soil compaction (which occurs during
the construction of residential homes) on infiltration rates in North Central Florida. The
effect of varying levels of compaction on soil infiltration rates, bulk density and cone
index were investigated. Included is a review of stormwater management practices that
can be applied at the scale of a residential lot. This review was included to help the reader
assimilate some of the information that is available on lot level practices that can be
implemented, to promote infiltration and to reduce lot runoff. Pervious pavements and an
infiltration structure were evaluated through field tests and a modeling exercise. A simple
simulation of some of the hydrological processes occurring at the lot scale was
undertaken through the development of the Lot Level Hydrological Model. This model
was used to assess the significance of soil compaction and the effectiveness of the
infiltration practices at reducing runoff and promoting infiltration.

3
CHAPTER 2 MEASURING INFILTRATION RATES
An important part of our study was the accurate and consistent measurement of
infiltration rates. Infiltration rates were measured on predevelopment lots, on
post-development lots, and on soils exposed to various levels of compaction. This chapter
presents research into a suitable methodology to measure infiltration rates in situ.
Introduction
Infiltration is the process by which water arriving at the soil surface enters the soil.
The process is important, because it affects surface runoff, soil erosion, and groundwater
recharge. Being able to measure (and therefore estimate) the infiltration rate that will take
place is necessary in many disciplines. The double-ring infiltrometer is often used for
measuring infiltration rates, and has been described by Bouwer (1986) and by ASTM
(2003). These references contain standard guidelines on conducting double-ring
infiltration tests; in practice, however, a wide variety of testing methodologies are used.
Our objective was to conduct a field test evaluating double-ring infiltrometer
methodologies. The tests were conducted over a small area, to compare the infiltration
results among the three methodologies. This would help determine the most appropriate
methodology to use during field research.
Measuring Infiltration
There are a number of techniques and methodologies for conducting infiltration
tests. The following is a brief review of some of the techniques that were considered for
our study.

4
Cylinder Infiltrometers
Cylinder infiltrometers are metal cylinders that are driven a shallow depth into the
soil. The cylinder is filled with water, and the rate at which the water moves into the soil
is measured. This rate becomes constant when the saturated infiltration rate for the
particular soil has been reached. A number of measurement errors are associated with
cylindrical infiltrometer test: the size of the cylinder used is one source of error. A 15-cm
diameter cylinder produces measurement errors of approximately 30%, while a 50-cm
diameter cylinder produces measurements errors of approximately 20% compared to the
infiltration rate that would be measured with a ring with an infinitely large diameter
(Tricker 1978). It has been suggested that a diameter of at least 100 cm should be used
for accurate results (Bouwer 1986). However, cylinders of this size become very difficult
to use in practice, as large volumes of water are required to conduct tests on sandy soils
with high infiltration rates.
Cylinder infiltrometers overestimate actual vertical infiltration rates (Bouwer
1986, Tricker 1978). This has been attributed to the fact that the flow of water beneath
the cylinder is not purely vertical, and diverges laterally. This lateral divergence is due to
capillary forces within the soil, and layers of reduced hydraulic conductivity below the
cylinder. A number of techniques for overcoming this error have been developed (such as
a correction procedure that uses an empirical equation) for 15 cm diameter cylinders
(Tricker 1978).
For a ring diameter d, and an unsaturated-flow capacity of the soil hcr, the true
vertical infiltration will only be given when hcr/d = 0 (Bouwer 1961). This can only be
achieved by using a cylinder that has such a large diameter such that hcr/d approaches 0;
or when hcr for the soil is so small that hcr/d is approximately 0. The high unsaturated

5
flow capability of the sandy soils in North Central Florida make this condition difficult to
achieve.
There are two techniques for measuring the flow of water into the ground; these are
to keep a constant head within the cylinder and then measure how much water is required
to maintain this constant head, and to use what is referred to as a falling head test where
the time that the water level within the cylinder falls is measured. Numerical modeling
has shown that falling head and constant head methods give very similar results for fine
textured soils but the falling head test underestimates infiltration rates for coarse textured
soils (Wu et al., 1997).
A possible source of error occurs when driving the cylinder into the ground, as
there can be a poor connection between the cylinder wall and the soil. This poor
connection can cause a leakage of water along the cylinder wall and an overestimation of
the infiltration rate. Placing a larger concentric ring around the ring and keeping this
outer ring filled with water so that the water levels in both rings are always constant can
reduce this leakage (Bouwer 1986). Arranging the rings in this manner should result in no
flow between the two rings because of the equal piezometric head. This arrangement
reduces leakage and associated error. This type of infiltrometer is called a double-ring
infiltrometer.
Double-Ring Infiltrometers
The double-ring infiltrometer test is a well-recognized and documented technique
for directly measuring soil infiltration rates (Bouwer 1986, ASTM 2003). Bouwer (1986)
describes the double-ring infiltrometer as often being constructed from thin walled steel
pipe with the inner and outer cylinder diameters being 20 and 30 cm, respectively. The
edge of the cylinders should be beveled so that the soil disturbance is minimized. The

6
infiltrometer should be installed with as little disturbance to the soil as possible by being
pushed or driven into the soil without any rocking motion. The cylinders should penetrate
about 5 cm into the soil. The soil must be checked to ensure that there is no separation of
the soil from the cylinder edge, if so the soil should be pushed back against the cylinder
wall. Equal water levels must be maintained in the inner and outer ring. Differences in
water level will result in flow from one cylinder to the other and a resulting erroneous
infiltration reading. The water level should be kept constant within the two cylinders by
either manually adding small quantities of water or by using an automated system. This
can consist of a float valve inside the cylinders, setting up a Mariotte syphon or an
electronically controlled system (Maheshwari 1996). The water depth should be set as
low as possible and recorded. The infiltration rate can then be calculated from the rate of
fall of the water level in the reservoir. The measurements should be continued until the
infiltration rate has become essentially constant.
The ASTM standard also describes a procedure for measuring the soil infiltration
rate with a double-ring infiltrometer for soil with a hydraulic conductivity between 1x10⁻²
and 1x10⁻⁶ cm/s (360 mm/h to 0.036 mm/h). The ASTM standard specifies inner and
outer diameters of 30 and 60 cm, respectively. There are also some minor differences in
the method that is suggested by the standard compared to that described above. Some of
these differences are that the ASTM standard requires the cylinders to be driven 15 cm
into the soil and that a constant head of between 2.5 cm and 15 cm be maintained in the
two cylinders.
Infiltration data can be analyzed according to a number of infiltration models. One
such model is that developed by Philip (1957) and can be stated as

7
21
tStKI ⋅+⋅= (2-1)
Where I is the cumulative infiltration (cm), S is the soil water sorptivity (cm h-1/2),
K is the saturated hydraulic conductivity, and t is the time (h). By regressing the
cumulative infiltration data collected in the field to Eq. 2-1 one can estimate the values of
the parameters K and S (Lal and Vandoren 1990). The infiltration rate i (cm h-1) can be
computed from Eq 2-1 as follows:
21
tS21K
dtdIi
−⋅+== (2-2)
The infiltration rate (i), can be approximated by K as time increases (Chow et al.,
1988).
Experimental Procedure
Three different methodologies of conducting a double-ring infiltrometer test were
evaluated. An area at the Irrigation Park on the University of Florida campus was used to
conduct the tests. The area was approximately 5 m by 15 m and was covered by a
removable black plastic sheeting to prevent weed growth. The soil was an Arredondo fine
sand (USDA, 1985), which had been tilled and appeared to be fairly uniform. The three
types of tests that were evaluated were the ASTM standard 30 cm and 60 cm double-ring
infiltrometer, the Turf-Tech (Coral Springs, Florida) 15 cm and 30 cm infiltration rings
under a constant head and the Turf-Tech 15 cm and 30 cm infiltration rings under a
falling head.
Four infiltration tests were conducted using an inner and outer ring of 30 and 60 cm
diameter respectively. These tests were conducted according to the procedure set out by
the ASTM standard. Five infiltration tests were conducted using the Turf-Tech rings with

8
a falling head and five tests were conducted using the Turf-Tech rings with a constant
head. For the constant head tests, a constant head was maintained with a Mariotte Siphon.
Cumulative infiltration and time were recorded, with each test generally lasting 1 to
2 hours for the constant head test and approximately 20 to 30 minutes for the falling head
test. The bulk density and volumetric moisture content of the soil were measured adjacent
to each test site before each infiltration test was conducted using standard laboratory
procedures (ASTM 2002 b, c, Blake and Hartge 1986, Gardner 1986). The infiltration
rate was found by regressing the recorded cumulative infiltration and time data to Eq. 2-1
using Sigma Plot (SPSS, 2001). The GLM procedure in SAS (2001) was then used to
produce an Analysis of Variance (ANOVA) to test for statistical differences.
Results
Table 2-1 shows the results of the measured infiltration rates from the three
different testing methods. The mean, standard deviation and coefficient of variation for
each test and for all the tests combined were calculated. Table 2-2 presents the results of
the ANOVA. Based on the analysis of variance no significant statistical differences were
found between the three methods. Table 2-1 shows that the methodology with the lowest
coefficient of variation (CV) was the Turf-Tech rings with the constant head while the
Turf-Tech rings with the falling head had the highest CV. The Turf-Tech rings with the
falling head also had a greater CV than the CV for all the data. The ASTM and Turf-Tech
constant head tests each had a CV that was lower than the CV for all the data.
Conclusion
The use of smaller diameter inner and outer rings (15 and 30 cm respectively) with
a constant head provided results that were not statistically different to the ASTM standard
test. The tests, which used the smaller rings and a falling head, were also not statistically

9
different from the ASTM standard test, however these tests did show a high CV, which
seemed to indicate that these tests would result in unacceptably high variability. It was
concluded that the test using a constant head with a double-ring infiltrometer of 15 cm
inner diameter and 30 cm outer diameter would be suitable for infiltration research on the
sandy soils generally found in North Central Florida. This allows for infiltration tests to
be conducted in areas where a methodology such as that specified by the ASTM would
not be suitable due to insufficient spacing between trees or because the volumes of water
required to maintain a constant head in the larger diameter double-ring infiltrometers are
unable to be transported to remote sites.
Table 2-1. Statistical analysis of infiltration rates from three types of infiltration tests ASTM standard (30/60 cm) Turf-tech constant
head (15/30 cm) Turf-tech falling head (15/30cm)
Test no. K (mm/h) Test no. K (m/h) Test no. K (mm/h) 1 120 1 79 1 161 2 147 2 225 2 56 3 210 3 171 3 128 4 164 4 196 4 100 5 209 5 186 Mean 160 Mean 176 Mean 126 Std dev 38 Std dev 23 Std dev 55 CV 23% CV 13% CV 43% Note, the overall mean infiltration rate was 154 mm/h, with a standard deviation of 51 mm/h and a CV of 33%. Table 2-2. Results of ANOVA for measured infiltration rates using different testing
methodologies Source Type III sum of squares DF Mean square F Pr > F tmt 7255 2 3627 1.36 0.37 rep 9262 4 2315 0.87 0.67 error 18728 7 2675

10
CHAPTER 3 EFFECT OF URBAN SOIL COMPACTION ON INFILTRATION
Introduction
Soil compaction is associated with urban area development. This compaction can
be in the form of controlled compacting of a site in order to increase the structural
strength of the soil or inadvertently caused by the use of heavy equipment during grading
of lots. Soil compaction has an effect on the physical properties of soil. Some of these
effects include increased strength, increased bulk density, decreased porosity, and a
change in the distribution of pore size within the soil. These changes affect the way in
which air and water move through the soil and the ability of roots to grow in the soil
(NRCS 2000).
Changes to the way that air and water move within the soil results in changed
infiltration rates. Decreased infiltration rates can cause increased runoff volumes, greater
flooding potential and reduced groundwater recharge. Measuring soil compaction was an
integral part of this project’s research into reducing runoff potential from a residential
urban lot.
The objective of this chapter is to analyze the effect of urban soil compaction on
soil infiltration rates in North Central Florida. Infiltration rates and other soil properties
were measured on: natural forested areas before development, on inadvertently
compacted areas during the early stages of development, on newly established turf after
development, and under a number of controlled compaction experiments.

11
Literature Review
Introduction
Soil can be described as a matrix of solid grains and voids. Solid grains are made
up of mineral or organic particles, while voids are filled by either air or water. The mass
of solid material per unit volume of soil is the bulk density of a soil. During compaction,
the dry bulk density of a soil is increased, indicating that the volume occupied by voids
has been decreased. Compaction is the result of natural or human induced forces being
applied to the soil. Therefore, the process of soil compaction may be viewed as the 'soil’s
behavioral reaction to compressive forces applied by nature or humans” (Johnson and
Bailey 2002).
The degree of compactness of a soil can be directly measured with the dry bulk
density, dry bulk specific volume, void ratio and porosity of the soil. There are also
indirect measures of compactness such as cone penetration resistance, often expressed as
a cone index, which is the ratio of the force required to press a 30-deg circular cone
through a soil to the area of the cone. The cone index is expressed in units of pressure and
increases with increased soil compaction (ASAE Standards 2000). The permeability of
the soil to air and water can also be used as an indirect measure of soil compactness. The
compactability of soil is a measure of the range of dry bulk densities that a given soil may
experience and can be measured using standardized tests such as the Standard and the
Modified Proctor Density Tests (Johnson and Bailey 2002).
Compaction Research In Agriculture
Compaction is a detrimental process in agriculture resulting in inhibited crop
growth and yield reductions (Lindstom and Voorhees 1994). It has also been shown that
soil compaction in agriculture has a negative affect on the long-term quality of the

12
environment (Soane and van Ouwerkerk 1995). A brief review of agricultural research
was conducted to increase the understanding of the potential effects of urban soil
compaction on infiltration rates.
Agricultural research has found that vehicle axle load is a crucial factor influencing
the depth of the subsoil compaction. Compaction has been observed at a depth of 30 cm
with an axle load of 4 Mg, 40 cm with an axle load of 6 Mg, and 50 cm with an axle load
of 10 Mg (Hakansson and Petelkau 1994).
Compaction has a significant influence on soil hydraulic properties such as soil
water retention, soil water diffusivity, unsaturated hydraulic conductivity and saturated
hydraulic conductivity (Horton et al., 1994). These hydraulic properties govern
infiltration rates, suggesting that soil compaction affects infiltration rates.
Li et al. (2001) looked at the effect of agricultural traffic on infiltration rates. The
effect of a single tractor wheel (4 Mg) pass on a clay loam soil under a controlled traffic
farming system in Queensland, Australia was tested. A rainfall simulator was used to
measure infiltration rates. The reported infiltration rates are the final steady infiltration
rates determined by subtracting the runoff rate from the applied rainfall rate. It was found
that infiltration rates for bare soil were reduced from 48 mm/h to 11 mm/h, while
infiltration rates for the same soil covered with a crop residue were reduced from 102
mm/h to 16 mm/h by a single pass of the tractor. This shows a reduction in infiltration,
due to compaction, of approximately 77% and 84%, respectively.
Sheridan (2003) examined the effect of soil compaction, created by a rubber
wheeled and a steel tracked skidder, on infiltration rates for a silty clay loam forest soil in
Victoria, Australia. Infiltration rates were measured with a rainfall simulator by

13
subtracting the cumulative runoff from the cumulative rainfall. A linear regression was
used to find the steady rate of change of the cumulative infiltration and this was assumed
to be the steady infiltration. No significant differences in bulk density and cone index
were found between the two types of vehicles. There were; however, significant changes
in infiltration rates, cone penetration resistance, and bulk density when the treatments
were compared to an undisturbed area. The undisturbed soils had infiltration rates that
varied from 53 mm/h to greater than 100 mm/h, while the treatments resulted in
infiltration rates varying from 14 mm/h to less than 4 mm/h. The treatments, therefore,
resulted in infiltration rates being decreased from 74% to more than 96%.
The previous two studies combined with studies by Gent et al. (1984), Dickerson
(1976), Horton et al. (1994) and Richard et al. (2001) on the effect of compaction on
infiltration rates in agricultural areas, show that soil compaction results in reduced
infiltration rates for agricultural land use.
Compaction Research in Urban Areas
Research conducted into the effect of compaction in urban areas has generally
consisted of surveys that have measured infiltration rates within urban areas and then
compared these data based on methods of land development, land types or levels of
compaction. The following is a review of the findings of these surveys.
The Sudbury Watershed, North Carolina was monitored to help determine the
effect of urbanization on runoff. The study included measuring infiltration rates for
various land types within the watershed. Mean final infiltration rates were reported,
although no methodology for the measurements was given (Kays 1980). These results
indicate that disturbing the natural soils caused a substantial decrease in infiltration rates.
The infiltration rate as measured on medium aged pine-mixed hardwood forest with leaf

14
litter was 315 mm/h, on slightly disturbed soils with lawns and large trees preserved was
112 mm/h, and on highly disturbed cut and compacted soils with sparse grass and no
trees was 5 mm/h (Kays 1980). Although the levels of soil compaction were not
measured, it can be assumed that the greater the level of soil disturbance is related to the
level of compaction.
Felton and Lull (1963) measured infiltration rates on lawns, fields and wooded
areas with a double-ring infiltrometer. The time required for a measured depth of water to
be infiltrated was recorded. The average depths of water infiltrated per minute were
reported. These reported values have been converted to mm/h for this review. Average
infiltration rates for the lawns, fields and wooded areas were found to be 152 mm/h, 427
mm/h and 883 mm/h, respectively. The low infiltration rates on lawns (an 83% reduction
from wooded condition) were attributed to the high density of urban soil that is “man-
mixed and bulldozed into position and further compacted by frequent mowing and
trampling” (Felton and Lull 1963). No direct measure of compactness was made in this
study.
Kelling and Peterson (1975) measured infiltration rates on lawns in Wisconsin as
part of a fertilizer runoff loss study. A rainfall simulator was used to measure the
infiltration rates. The reported values are the infiltration rates as measured in the final 10
min of each test. These rates were determined by subtracting the measured runoff from
the applied rainfall during this period. It was found that the final infiltration rates on
lawns (88 mm/h and 73 mm/h) that had been left undisturbed during building
construction approached those rates measured on a nearby wooded area and a prairie.
While those lawns established on filled and compacted soils had lower final infiltration

15
rates that varied between (1 mm/h and 53 mm/h). The authors concluded that compaction
discontinuities in the soil profile resulted in an approximate 35% reduction in infiltration
rate compared to those lawns established on an undisturbed soil profile.
Lawn infiltration rates in central Pennsylvania were also found to vary
substantially, from 4 mm/h to 100 mm/h (Hamilton and Waddington 1999). Infiltration
rates were measured using a double-ring infiltrometer with a constant head. The average
infiltration rate were determined by dividing the volume of water that was required to
maintain a constant head in the inner cylinder for 1 hour, by the area of the inner
cylinder. The highest infiltration rate was measured on a lawn that had been established
on an undisturbed soil profile, which had been exposed to minimal traffic during
construction due to a stand of trees on the lot. From this it was concluded that
compaction, due to traffic, is one of the factors affecting lawn infiltration rates.
A series of 153 infiltration tests were conducted on disturbed urban soils near
Birmingham and Mobile, Alabama (Pitt et al., 1999). A double-ring infiltrometer with a
falling head was used to measure average infiltration rates at 5 min intervals for 2
hoursrs. The infiltration rates were regressed to the Horton equation, allowing the Horton
coefficients to be determined for each test. These infiltration data and Horton coefficients
were compared with site conditions to evaluate the effect of moisture content and
compaction on infiltration rates in urban soils. It was found that sandy soils were mostly
affected by compaction with moisture levels having little affect on infiltration rates, while
clayey soils showed a strong correlation between the effect of soil moisture and soil
compaction. The mean final infiltration rates measured after 2 hours of testing were
found to be 414 mm/h for noncompacted sandy soils, 64 mm/h for compacted sandy

16
soils, 220 mm/h for noncompacted and dry clayey soils and 20 mm/h for all other clayey
soils (Pitt et al., 1999). The authors arbitrarily defined compact soils as those soils having
a cone index reading of greater than 2068 kPa at a depth of 7.5 cm on a cone
penetrometer, while non-compacted soils had cone index readings of less than 2068 kPa
at a depth of 7.5 cm. For compacted sandy soils there was approximately an 85%
reduction in final infiltration rate compared to a noncompacted conditions and an
approximate 67% reduction in final infiltration rates for compacted clayey soils when
compared to noncompacted clayey soils.
From this literature review of infiltration rates and urban soil compaction it can be
concluded that soil infiltration rates are negatively affected by the compaction associated
with urban development. Decreased infiltration rates in urban areas would most likely
increase runoff volumes, decrease in runoff response time, and decrease groundwater
recharge.
Methodology and Site Descriptions
Site Descriptions
Madera, an 88-home ‘green’ development in Gainesville, FL was used as a research
site. A natural, mixed wood forest, selectively cleared for home construction, covered the
area. The predominant soil type for the area was a Bonneau fine sand (loamy, siliceous,
thermic Arenic Paleudults) (USDA 1985). The University of Florida owned 4 lots in
phase 1 of this development for extension purposes; two of these lots were used for
compaction testing, namely lot 24 and lot 8. Lot 24 was used as an access to a detention
pond in the development and for parking heavy construction vehicles. The lot was made
up of areas that had been compacted and areas that were relatively undisturbed due to the
wooded conditions. Lots 2, 3, 4, 8 and 12 of the Madera development were undisturbed
17
lots that had not been cleared or driven on by any vehicles. Madera lots 2, 3, 4, 8, 12 and
24 will be referred to as natural wooded sites 2, 3, 4, 8, 12 and 24.
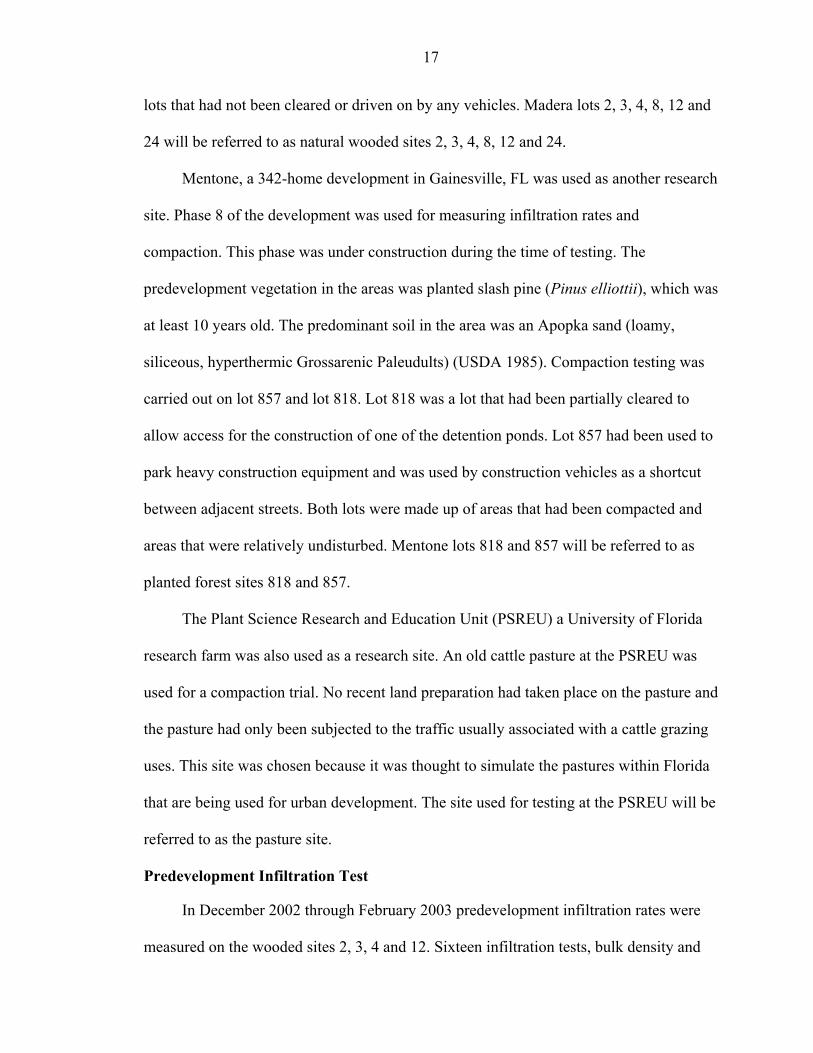
Mentone, a 342-home development in Gainesville, FL was used as another research
site. Phase 8 of the development was used for measuring infiltration rates and
compaction. This phase was under construction during the time of testing. The
predevelopment vegetation in the areas was planted slash pine (Pinus elliottii), which was
at least 10 years old. The predominant soil in the area was an Apopka sand (loamy,
siliceous, hyperthermic Grossarenic Paleudults) (USDA 1985). Compaction testing was
carried out on lot 857 and lot 818. Lot 818 was a lot that had been partially cleared to
allow access for the construction of one of the detention ponds. Lot 857 had been used to
park heavy construction equipment and was used by construction vehicles as a shortcut
between adjacent streets. Both lots were made up of areas that had been compacted and
areas that were relatively undisturbed. Mentone lots 818 and 857 will be referred to as
planted forest sites 818 and 857.
The Plant Science Research and Education Unit (PSREU) a University of Florida
research farm was also used as a research site. An old cattle pasture at the PSREU was
used for a compaction trial. No recent land preparation had taken place on the pasture and
the pasture had only been subjected to the traffic usually associated with a cattle grazing
uses. This site was chosen because it was thought to simulate the pastures within Florida
that are being used for urban development. The site used for testing at the PSREU will be
referred to as the pasture site.
Predevelopment Infiltration Test
In December 2002 through February 2003 predevelopment infiltration rates were
measured on the wooded sites 2, 3, 4 and 12. Sixteen infiltration tests, bulk density and

18
volumetric soil moisture content measurements were made on each of these lots.
Infiltration rates were measured using a constant head double-ring infiltrometer with ring
diameters of 15 and 30 cm. The constant head was maintained with a Mariotte syphon
and the volume of water required to maintain this head was measured. The infiltration
tests were conducted for at least 40 min or until the infiltration rate became constant.
Infiltration rates where calculated and regressed to the Philip’s infiltration equation. The
parameter K from the Philips infiltration equation can be used as an approximation for
the infiltration rate as time increases (Chow et al., 1988). Therefore, K will be used as an
approximation for the infiltration rate.
Soil bulk density was determined using a standard intact core method (ASTM
2002c or Blake and Hartge 1986) and soil moisture content was measured according to
the gravimetric procedure (ASTM 2002b or Gardner 1986 ). The measurements were
made between the property boundary and the easement, as it was assumed that this area
would not be covered with an impermeable material and the post development infiltration
rates could be measured. The cone index (ASAE Standards 2000) was also measured in
the area between the property boundary and the easement using a Spectrum TM SC900
Soil Compaction Meter (Spectrum Technologies, Inc., Plainfield, Illinois) which records
cone index at increments of 2.5 cm until 45 cm. The mean cone index at 2.5 cm depths
was then found.
Post Development Infiltration Test
Post development infiltration tests were carried out on wooded site 2 in May 2003.
Infiltration rates were measured at four sites on the turf area on the front yard and four
sites on the turf area on the backyard. These infiltration tests were carried out using the
previously described procedure. Cone index was then recorded near each site where an

19
infiltration test was conducted. The previously described method was also used to record
the cone index.
Compaction Trial 1
The first type of compaction test to be carried out was on natural wooded site 24
and the planted forest site 857 and 818. The testing was carried out on different locations
between February and July 2003. On each lot, twelve sites were selected for testing.
These sites were selected so that they could be grouped in pairs with each pair consisting
of a site that appeared to be undisturbed and a site with obvious compaction. There was a
maximum distance of 2 m between the sites making up the pair.
A double-ring infiltrometer test was undertaken at each site using previously
described methods. An intact soil core sample was collected on all sites, and the bulk
density and the volumetric soil moisture content were measured according to previously
described procedures. The sites were then marked with flags. Within a week of the
completion of the infiltration tests a cone penetrometer was used to measure the cone
index at each of these sites similar to previously described procedures. On the planted
forest site 818 the cone index was measured at only eight of the sites due to clearing
operations destroying 4 of the sites. A particle size distribution analysis (Gee and Bauder
1986) was conducted on five soils samples collected randomly on each lot.
Compaction Trial 2
The second type of compaction trial was carried out on the pasture site and at the
natural wooded site18 in February 2004. An area of the pasture approximately 5-m long
by 2.5-m wide was cleared of the top 10 cm of grass roots. A mechanical grader was used
to clear a 1.2-m width and the rest of the plot was manually cleared with a shovel. This
area was then divided into sixteen subplots each 0.6 m by 1.2 m, the wheel tracks of the

20
grader were excluded from the sub plots. The volumetric soil moisture content was
measured according to previously described procedures and four levels of compaction
treatment were then applied in a Latin Square experimental design with four replications.
A Mikasa GX100 (MT-65H) ‘jumping jack’ type compactor was used to apply the levels
of compaction. The compactor was moved about the subplots in a steady manner to
achieve a uniform level of compaction. The four levels of compaction were zero minutes
of compaction (natural conditions), thirty seconds of compaction, three minutes of
compaction and ten minutes of compaction. The infiltration rate was measured on each of
the sub plots using a constant head double-ring infiltrometer with a 15 cm and 30 cm
diameter rings while bulk density, soil moisture content, and cone index were measured
as in similar experiments. A Proctor density test (ASTM 2002a) was conducted on a soil
sample from the site.
This experimental procedure was then repeated in an undisturbed area on the
natural wooded site 18. The plot was located in a clearing in a wooded area and the top
10 cm of organic material and soil was manually cleared using a shovel.
The results from the two locations were analyzed separately using the GLM
procedure with an analysis of variance (SAS 2001). Duncan’s Multiple Range Test at the
95% confidence interval was used to find significant differences in means between the
treatments.
Compaction Trial 3
The third type of compaction trial was carried out on the pasture site. A mechanical
grader was used to remove the top 10 cm of grass and soil from three plots each about 18
m long and 1.2 m wide. It took approximately four passes of the grader to remove the
grass roots and soil, care was taken to ensure that the grader traveled in the same wheel

21
tracks for each pass, thus ensuring that there was minimal compaction within the plots.
Each plot was demarcated into four subplots 1.2 m wide and 4.5 m long.
Three vehicles that are commonly used in urban construction were used for the
compaction trial. These vehicles were an all-wheel drive Caterpillar 416B backhoe
weighing 6.3 Mg with a front tire pressure of 206 kPa and a rear tire pressure of 310 kPa,
a dump truck with a front axle weight of 6.0 Mg, a total load of 18.4 Mg on the two rear
axles and tire pressures of 310 kPa and a pickup truck with a front axle load of 1.1 Mg, a
rear axle load of 0.8 Mg and a tire pressure of 275 kPa. Each vehicle was driven, at a
walking speed, along a plot with one wheel running down the middle of the plot and the
other outside of the plot, nine passes of the vehicles were made with wheels running in
the same wheel ruts. Five to six measurements of cone index, according to previously
described procedures, were made within the wheel ruts and three measurements of cone
index were made outside of the wheel ruts to represent the noncompacted cone index.
Four measurements of infiltration rate, soil bulk density and volumetric soil moisture
content were then made in each rut. These measurements were made as described
previously. The double-ring infiltrometer was placed within the wheel ruts created by the
vehicles.
Results
Results of Predevelopment Infiltration Tests
The predevelopment infiltration rates on the natural wooded lots were generally
high and extremely variable. The results of these predevelopment infiltration tests from
the wooded sites 2, 3, 4 and 12 are summarized in Table 3-1.
The infiltration rates on these undisturbed wooded lots were generally very high
with average rates varying from 634 mm/h to 377 mm/h. These values were in the range

22
of values reported in the literature. Felton and Lull (1963) found an average infiltration
rate of 883 mm/h for wooded conditions, Kays (1980) reported mean final infiltration
rates of 315 mm/h for a medium aged pine-mixed hardwood forest and Pitt et al. (1999)
reported a mean infiltration rate of 414 mm/h for noncompacted sandy soils.
Variability in the infiltration rates measured in these wooded areas was a high. The
maximum measured infiltration rate was 1023 mm/h and the minimum measured
infiltration rate was 33 mm/h. Table 3-1 shows CV values varying from 36% to 52% for
the measurements made on the individual lots. Although there are no literature values for
the CV of measured infiltration rates in naturally wooded areas, it may be useful to
compare these CV’s to those reported for infiltration rates measured on undisturbed
sandy soil profiles. Pitt et al. (1999) reported a CV of 40% for measured infiltration rates
on noncompact sandy soil, while Hamilton and Waddington (1999) reported a CV of
183% on an undisturbed urban lawn. Therefore, it would seem that the CV values
reported in this study are within a range found previously when measuring infiltration
rates on undisturbed soils.
The infiltration rates measured on an undisturbed natural wooded area are greater
than the 1 in 100-year 24-hour design storm intensity of 254 mm/h (Florida Department
of Transportation 2003) for this region in Florida. The average infiltration rate on each lot
varied from 2.5 times to 1.5 times greater than this design storm. This would indicate
that, theoretically there would be no runoff from these pre construction lots for the 1 in
100-year 24-hour design storm and runoff would only occur if the groundwater table was
to rise to the surface. During 20 separate soil tests conducted in the Madera development
there was one instance of a perched water table approximately 1.4 m below the ground

23
level, all other locations showed no indication of a groundwater table in the top 2.4 m of
the soil profile. It could, therefore, be assumed that there was an extremely small
probability that these lots, in their naturally undisturbed conditions, would produce runoff
during a storm event.
Results of Post Development Infiltration Tests
A summary of the predevelopment and post development infiltration rates
measured on the wooded site 2 is presented in Table 3-2. The predevelopment infiltration
rates were measured in approximately the same location as the post development
infiltration rates. There was no statistically significant difference between the front and
back yard measurements for both the predevelopment conditions (t = 3.596 and p =
0.037) and post development conditions (t = 4.099 and p = 0.026). There were however
significant differences between the infiltration rates for the predevelopment and post
development conditions for both the front yard (t = 7.735 and p = 0.004) and back yard (t
= 6.511 and p = 0.007). There was an 80% decrease in infiltration rates on the front yard
and a 97% decrease in infiltration rates on the back yard. A reason for these significant
changes in infiltration rate could be compaction.
Figure 3-1 is a plot of predevelopment and post development mean cone index.
From Figure 3-1 it can be seen that there was a difference between the predevelopment
mean cone index data and the post development mean cone index data recorded on the
wooded site 24. The predevelopment data for the front yard and back yard showed a
maximum cone index of 858 kPa and 1104 kPa respectively. The post development data
for the front and back yard showed a maximum cone index of 4260 kPa and 4382 kPa
respectively. This change in cone index during development of the lot was most likely
due to compaction that occurred during the construction process.

24
The difference between the cone index profile measured on the front yard and back
yard should also be noted. The maximum cone index in the front yard occurred at 37.5
cm while the maximum compaction on the back yard occurred at 27.5 cm. The fill that
was brought onto the front of the site, for grading purposes, could have resulted in this 10
cm difference in depth of maximum cone index. A layer of fill approximately 10 cm deep
was placed over the previously compacted soil, this resulted in the depth to the maximum
cone index being increased by 10 cm.
From this test of infiltration rates on a developed urban lot and the comparison
between the infiltration rates measured on the same lot before development, it was shown
that development could have a significant affect on infiltration rates. It was also shown
that compaction could be the greatest cause of this with significant changes in the cone
index measured before and after development.
Compaction Trial 1
A summary of the infiltration rate and bulk density results for the compaction tests
carried out on natural wooded sites 24 and planted forest sites 818 and 857 are presented
in Table 3-3. The results of paired t-tests conducted on the infiltration and bulk density
measurements are presented in Table 3-4. These results show that compaction caused an
overall decrease in the infiltration rate of 73%, from 733 mm/h to 178 mm/h and a
corresponding increase in bulk density of 10%, from 1.34 g/cm3 to 1.49 g/cm3. These
overall changes are statically significant with p < 0.001 for overall infiltration results and
p = 0.001 for overall bulk density results. Compaction caused by the vehicle traffic used
during construction of urban developments significantly increased bulk densities and
significantly lower infiltration rates.

25
The soil on sites 24, 818 and 857 were classified as a sand according to the USDA
soil textural classification (Soil Survey Staff 1975). All of the samples analyzed showed a
sand classification except for one sample on lot 24 that was classified a loamy sand.
The naturally wooded area and the planted forest were different land uses with the
wooded area being made up of mixed tree species and the predevelopment soil being
subjected to very little compaction. The planted forest would have been subjected to
planting and harvesting activities in the past; this would have involved heavy equipment,
causing compaction. Therefore, the significant difference (t = 3.03, p = 0.008) between
the mean undisturbed infiltration rates on the natural wooded site (908 mm/h) and the
planted forest sites (631 mm/h) was therefore expected; however, there was no significant
difference between the undisturbed bulk densities (t = 1.54, p = 0.144). This difference in
infiltration rate was probably due to compaction of the soil on the planted forest sites
during planting and harvesting of the slash pine forests, while the natural wooded site
was undisturbed. The lack of a significant difference in bulk densities could be due to the
soil core samples being collected in the top 10 cm of the soil profile. The effect of
compaction is only likely at depths greater than 30 cm (Hakansson and Petelkau 1994);
therefore, the soil samples collected in the top 10 cm might not show this effect. Figure 3-
2, a plot of average Cone Index values as measured on compacted and uncompacted sites
in compaction Trial 1, shows how the greatest effect of compaction occurred between 25
cm and 32.5 cm.
From Figure 3-2 it should be noted that there was a difference between the
magnitudes of the cone index graphs from the wooded site and the forested sites. Figure
3-2 (a) shows a maximum cone index of 1071 kPa at 32.5 cm for the undisturbed tests

26
and a maximum cone index of 1965 kPa at 25.0 cm for the compacted tests. Figure 3-2
(b) shows a maximum cone index of 2668 kPa at a depth of 25.0 cm for the undisturbed
tests and a maximum cone index of 3556 kPa at a depth of 30.0 cm for the compacted
test. Figure 3-2 (c) shows a maximum cone index of 1914 kPa at a depth of 32.5 cm for
undisturbed tests and a maximum cone index of 3741 kPa at a depth of 32.5 cm for the
compacted tests. It can be concluded from these results that compaction had the greatest
effect at depths between 25.0 and 32.5 cm. Similar findings had previously been made for
compaction caused by vehicular traffic under agricultural conditions (Hakansson and
Petelkau 1994). The finding that compaction has its greatest effect between 25 cm and
32.5 cm can be used to help explain why there were no significant differences between
the bulk densities that were measured on the top 10 cm of the soil profile for the
undisturbed and compacted naturally wooded sites and the undisturbed and compacted
planted forest sites.
A paired t-test was used to evaluate the difference between the average cone index
data for the undisturbed sites and compacted sites in Figure 3-2 (a), (b) and (c). It was
found that there was a statistically significant difference between these results (t > 8.34
and p < 0.001) for all three of the locations. It can; therefore, be stated that the average
compacted cone index values were higher than the average undisturbed cone index values
at each of the locations.
It is also interesting to note that after compaction there is no statistical difference in
the infiltration rates and bulk densities measured on the natural wooded site or those
measured on the planted forest sites (t = 0.33, p = 0.746 and t = 0.59, p = 0.563). This
would indicate that although land use before development may have an effect on

27
infiltration rates, compaction during development would result in similar infiltration rates
for compacted soils. Based on these results it may be more beneficial to avoid
compaction on a natural wooded area than on an area that had previously been compacted
such as those used for commercially planted forests.
Table 3-5 shows the Pearson correlation coefficients between the average cone
index (at 2.5 cm depths, down to 40 cm) and average infiltration rate as measured on the
compacted and undisturbed locations on the naturally wooded site 24, planted forest site
818 and 857. From Table 3-5 it can be seen that there is a negative correlation between
cone index and infiltration rate. This would imply that an increase in cone index results in
a decrease in infiltration rate. The strongest correlation between cone index and
infiltration rate occurs between 5 cm and 20 cm. This indicates that the compaction that
occurs between these depths has the greatest affect on the surface infiltration rate.
From this trial it can be concluded that compaction has a negative affect on
infiltration rates and increased cone index and bulk density. Measuring infiltration rates is
a more lengthy procedure when compared to measuring cone index. Cone index can,
therefore, be used to identify compacted areas of a development quickly and efficiently.
Compaction Trial 2
Compaction caused a decrease in infiltration rates and an increase in bulk densities
and cone index at both the pasture and wooded locations. The effect of different levels of
compaction, on infiltration rates, was generally not significant.
During compaction the volumetric soil moisture content of the soil was found to be
approximately 7% at the pasture site and 6% at the wooded site. The results of the
particle size distribution test carried out on soil samples from the pasture showed a sand
fraction always greater then 91%, a silt fraction always less than 9% and a clay fraction

28
always less than 4%. The soil at the pasture location was, therefore, classified as a sand
according to the USDA soil textural classification (Soil Survey Staff 1975). The naturally
wooded area showed a sand fraction always greater then 91%, a silt fraction always less
then 7% and a clay fraction always less then 2%. Similar to the pasture site, the textural
classification of the soil at the naturally wooded area was classified as a sand.
The results of the standard proctor density test, conducted on soil samples
collected on the pasture and naturally wooded area are presented in Figure 3-3. From
these proctor density tests it can be seen that the naturally wooded area had a maximum
proctor density of 1.89 g/cm3, while the pasture had a maximum Proctor density of 1.83
g/cm3. The two soils seem to have different responses to moisture content with the
naturally wooded area having a higher Proctor density at lower moisture content than the
pasture.
The mean infiltration rates and bulk densities, for the four treatments on the
wooded area and on the area under pasture, are presented in Figure 3-4. The analysis of
variance performed on the individual tests produced no difference in bulk density and
infiltration rate along the rows or columns of the plot. Only the treatments resulted in an
affect on infiltration rate and bulk density. It was therefore assumed that that the soil
conditions were uniform across the plots.
From Figure 3-4 it can be seen that the mean infiltration rates on noncompacted
subplots were significantly different than the mean infiltration rates on the compacted
subplots. There was also a significant difference between the noncompacted infiltration
rates on the pasture (225 mm/h) and on the wooded area (487 mm/h). However, the two

29
locations had the same textural soil classifications (sand) and the same noncompacted
mean bulk densities (1.49 g/cm3).
Table 3-6, shows the results of the ANOVA conducted on the infiltration data
measured on the both the pasture and wooded subplots. It can be seen from Table 3-6 that
the compaction treatment and the location of the treatment both resulted in a significant
difference in infiltration rate. There also appeared to be an interaction effect between the
treatments and the location. There was also no significant effect due to variations in soil
within each experimental location.
Table 3-7, shows the results of the ANOVA conducted on the soil bulk density
measurements made on the pasture and wooded subplots. It can be seen from Table 3-6
that only the treatment resulted in a significant change to the soil bulk density.
Figure 3-5, a plot of the average cone index at 2.5 cm depths for all the treatments
on both the pasture and wooded subplots, shows that the cone index measured on the
noncompacted wooded area was lower than the cone index measured on the
noncompacted pasture. The maximum average cone index on the noncompacted wooded
subplots was 1213 kPa at 42.5 cm and the maximum average cone index on the
noncompacted pasture subplots was 4145 kPa at 37.5 cm. From this it can be concluded
that the pasture had been subjected to previous compaction that resulted in increased cone
index. However, the difference in cone index between the pasture and the wooded site
occurred at depths greater than the 10 cm used for sampling bulk density. The difference
in noncompacted infiltration rates between the two locations was most likely due to the
compaction that had taken place on the pasture.

30
There were not well-defined differences between infiltration rates for the
compaction treatments used in this trial. There were no statistically significant differences
between the mean infiltration rates of 65 mm/h, 30 mm/h and 23 mm/h that occurred after
30 s, 3 min, and 10 min of compaction, respectively on the pasture. This would suggest
that when describing infiltration rates with respect to compaction, the soil could be
classified as either compact or noncompact. A similar trend was observed with the data
from the wooded site. The only statistically significant difference between the mean
infiltration rates after a treatment had been applied occurred between the 30 sec treatment
(79 mm/h) and the 10 min treatment (20 mm/h).
The mean bulk densities after 10 min of compaction are shown in Figure 3-4 to be
different between the pasture and the wooded locations. This can be explained using
Figure 3-3 where it can be seen that the wooded location soil was more susceptible to
compaction than the pasture soil, with a maximum Proctor density of 1.89 g/cm3
compared to the maximum proctor density of 1.83 g/cm3 for the pasture. The bulk density
of the pasture soil after 10 min of compaction was 1.73 g/cm3, this equates to
approximately 95% of the maximum Proctor density and the bulk density of the soil at
the wooded area after 10 min of compaction was 1.79 g/cm3, which also equates to 95%
of the maximum Proctor density. The wooded area also had a higher Proctor density at
lower moisture contents, which would have made it easier to compact at the low moisture
content measured during the compaction study.
Figure 3-5 is a plot of the average cone index at 2.5 cm depth increments for each
treatment at the pasture and wooded location. Comparing Figure 3-5 (a) and (b) show that
the pasture location was more compact than the wooded location, before the treatments

31
were applied. The noncompacted wooded sites had a maximum average cone index of
1213 kPa at 42.5 cm while the noncompacted pasture sites had a maximum average cone
index of 4053 kPa at 32.5 cm.
There was a distinct difference between the effects of the treatment levels on the
shape of the average cone index results in Figure 3-5 (b). The maximum cone index
values increased from 1213 kPa to 2349 kPa after 30 s of compaction and then to 4667
kPa after 3 min of compaction. After 10 min of compaction the cone penetrometer could
only be inserted to a depth of 20 cm with a maximum cone index of 4909 kPa at this
depth. There was a less distinct change in the average cone index curves for the pasture
site with compaction levels being fairly high on the noncompacted locations. There did
appear to be an increase in the average maximum cone index, from 4145 kPa on the
noncompacted to 4948 kPa after 10 min of compaction.
Compaction Trial 3
Vehicle traffic caused a decrease in infiltration rates and an increase in bulk
density. Table 3-8 summarizes the mean infiltration rates and bulk density data collected
in the wheel ruts created during Trial 3.
The analysis of variance showed no significant difference between mean infiltration
rates in the backhoe tracks and in the pickup tracks, although the backhoe tracks did have
a 13% lower mean infiltration rate than the pickup. There was, however, a significant
difference in mean infiltration rates between these two vehicles and the dump truck (23
mm/h).
There were no significant differences between the mean bulk densities for the three
treatments, although the dump truck did result in a higher mean bulk density (1.68 g/cm3)
than the backhoe and pickup (1.61 g/cm3). The lack of a significant difference between

32
the mean bulk densities may be due to the bulk density being determined from soil
samples collected in the top 10 cm of the soil profile. Figure 3-2 and 3-5 show that soil
compaction seemed to have a greater affect below 10 cm. The pasture site also seemed to
have been subjected to compaction before these test (Figure 3-5), which may have
reduced the effect of the tests on bulk density.
It can be concluded from Trial 3 that vehicles do have a negative affect on soil
infiltration rates. There did not appear to be a significant difference between the effects of
the pickup and backhoe, but there was a significant difference between the effect of these
vehicles and the heavy dump truck.
Conclusion
Results show that soil compaction reduces infiltration rates. The level of
compaction did not appear to be as important as whether a soil had been compacted or
left undisturbed, although it was shown that there could be a significant difference
between the effect of compaction caused by relatively light construction equipment (i.e.,
a backhoe and pickup) and very heavy equipment (i.e., a fully loaded dump truck).
Therefore, when classifying the soil infiltration rate it is important that the history of
compaction of the soil is taken into account. This classification of the compaction of a
soil could have a significant affect on hydrological and stormwater modeling where the
soil infiltration rates that are used to determine runoff are often based on soils in their
undisturbed condition. Overestimation of the soil infiltration rate would generally result
in an underestimation of the runoff from a specified area and a resultant underestimation
of the potential for a flooding event.
It can also be recommended that to maintain predevelopment infiltration rates on a
lot, areas of the lot should be left undisturbed. Higher infiltration rates on the lot would

33
lead to reduced runoff from the lot and a smaller load being placed on the traditional
stormwater infrastructure. Demarcating areas of the lot to prevent compaction of the soil
would help maintain predevelopment infiltration rates. Special efforts should also be
made to leave natural areas undisturbed as these areas were shown to have the highest
infiltration rates. Reducing the use of very heavy equipment on the lot as much as
possible would also help limit the reduction in infiltration rates caused by compaction.
Further research needs to be conducted into finding more efficient methods for
quantifying the changes that occur to infiltration rates on the lot during construction.
Measuring infiltration rates in-situ is a time consuming processes that does not allow for
a spatially detailed analysis of the changes that have occurred to infiltration rates on the
lot. An example of a more efficient method would be developing a relationship that
relates the change in cone index to the change in infiltration rate. Measuring cone index is
a quick process and if a relationship were developed that related the change in cone index
to the change in infiltration rate, one could determine on which areas of a lot compaction
had resulted in reduced infiltration rate.
Table 3-1. Predevelopment infiltration tests on the naturally wooded sites.
Lot 2 3 4 12 Infiltration rate (mm/h)
Average 634 377 582 464 Median 608 357 632 428
Max 1023 764 881 862 Min 329 33 261 168
Std dev 239 196 208 189 CV (%) 37.7 52.0 35.7 40.8
Note, a total of sixteen measurements were made on each lot

34
Table 3-2. Predevelopment and post development infiltration rates for the front and back yard on wooded site 2
Infiltration Rate (mm/h) Predevelopment Post Development
Mean 861 175 CV (%) 25 48 Front Yard No of Tests 4 4
Mean 590 8 CV (%) 31 41 Back Yard No of Tests 4 4
Table 3-3. Infiltration rates, bulk density and CV from naturally wooded site 24, planted
forest site 818 and 857 Mean Infiltration Rate (mm/h) Bulk Density (g/cm3) Lot Undisturbed (%) Compacted (%) Undisturbed (%) Compacted (%)
818 637 (22.7) 187 (52.4) 1.20 (17.2) 1.48 (5.0) 857 652 (26.9) 160 (52.0) 1.40 (6.5) 1.52 (9.3) 24 908 (23.2) 188 (50.1) 1.42 (4.1) 1.47 (7.1) Overall 733 (28.8) 178 (49.1) 1.34 (12.1) 1.49 (7.1)
Table 3-4. Paired t-test on infiltration rates and bulk density measurements for naturally
wooded site 24 and planted forest site 818 and lot 857 Infiltration Rate Bulk Density Site
T p T p 818 5.35 0.003 -4.14 0.009 857 10.75 <0.001 -1.94 0.110 24 6.70 0.001 -1.29 0.252 Overall 10.58 <0.001 -3.38 0.001

35
Table 3-5. Correlation between average cone index (CI) and average infiltration rates, as measured on the compacted and undisturbed locations on naturally wooded site 24, planted forest site 818 and 857.
Depth (cm) Pearson correlation coef. (r) p 0.0 -0.581 0.227 2.5 -0.757 0.081 5.0 -0.807 0.052 7.5 -0.804 0.054
10.0 -0.818 0.047 12.5 -0.826 0.043 15.0 -0.815 0.048 17.5 -0.817 0.047 20.0 -0.811 0.050 22.5 -0.785 0.064 25.0 -0.756 0.082 27.5 -0.753 0.084 30.0 -0.727 0.102 32.5 -0.705 0.118 35.0 -0.691 0.129 37.5 -0.675 0.141 40.0 -0.704 0.118
Table 3-6. Results of ANOVA for measured infiltration rates during Compaction Trial 2.
The effect of compaction treatment (tmt) and location (loc) are shown. Source Type III sum of squares DF Mean square F Pr > F
tmt 1.645 3 0.548 241.69 < 0.0001loc 0.120 1 0.120 52.91 < 0.0001
tmt x loc 0.265 3 0.088 38.98 < 0.0001row 0.008 3 0.003 1.22 0.3307 col 0.003 3 0.001 0.44 0.7288
error 0.041 18 0.002 Table 3-7. Results of ANOVA for measured dry bulk density during Compaction Trial 2.
The effect of compaction treatment (tmt), location (loc) are shown. Source Type III sum of squares DF Mean square F Pr > F
tmt 0.320 3 0.107 61.52 <.0001 loc 0.012 1 0.012 6.7 0.0185
tmt x loc 0.005 3 0.002 1.0 0.4172 row 0.003 3 0.001 0.65 0.5959 col 0.009 3 0.003 1.74 0.1955
error 0.031 18 0.002

36
Table 3-8. Mean infiltration and bulk density result from tests conducted in the wheel ruts of a dump truck, backhoe and pickup after nine passes over a graded pasture. Means that were not significantly different (p<0.05) were grouped with the same letter.
K (mm/h) CV (%) Bulk Density (g/cm3) CV (%) Dump truck 23b 43.9 1.68a 2.3 Back hoe 59a 14.1 1.61a 1.9 Pickup 68a 23.1 1.61a 2.5
0
5
10
15
20
25
30
35
40
45
0 500 1000 1500 2000 2500 3000 3500 4000 4500 5000
Cone Index (kPa)
Dep
th B
elow
Sur
face
(cm
)
Front Yard - Predelopment Back Yard - PredevlopmentFront Yard - Post Devlopment Back Yard - Post Devlopment
Figure 3-1. Predevelopment and post development cone index values for wooded site 2.
Error bars represent one standard deviation.

37
05
1015202530354045
0 500 1000 1500 2000 2500 3000 3500 4000 4500 5000
Cone Index (kPa)
Dep
th B
elow
Sur
face
(cm
)
(b) Planted forest site 857 05
1015202530354045
0 500 1000 1500 2000 2500 3000 3500 4000 4500 5000
Cone Index (kPa)
Dep
th B
elow
Sur
face
(cm
)(a) Natural wooded site 24
(c) Planted forest site 81805
1015202530354045
0 500 1000 1500 2000 2500 3000 3500 4000 4500 5000
Cone Index (kPa)
Dep
th B
elow
Sur
face
(cm
)
Uncompacted Compacted
Figure 3-2. Average cone index values for undisturbed and compacted sites. A) Naturally wooded site 24. B) Planted forest site 857. C) Planted forest site 818. Note, error bars represent one standard deviation.
A
C
B

38
1.50
1.60
1.70
1.80
1.90
2.00
2.10
2.20
2.30
7 8 9 10 11 12 13 14 15 16
Gravimetric Water Content (%)
Bul
k D
ensi
ty (g
/cm3 )
Previously Pasture Previously Wooded
Zero Air Voids
Figure 3-3. Standard Proctor density test results for the soil on the site under pasture and
the wooded site

39
1.45
1.5
1.55
1.6
1.65
1.7
1.75
1.8
1.85
T0 T0.5 T3 T10
Bul
k D
ensi
ty (g
/cm3 )
Previously Pasture Previously Wooded
0
100
200
300
400
500
600
T0 T0.5 T3 T10
Infil
tratio
n R
ate
(mm
/h)
a
b
c dc
d ec d e
d e e
d
b
d
bb c
c
ba
Figure 3-4. Average infiltration and bulk density measurements from a site previously
under pasture and a site in a natural wooded area. A) Average infiltration. B) Average bulk density. Note, standard deviations are indicated by error bars.T0, T0.5, T3 and T10 represent compaction treatments of 0, 0.5, 3 and 10 minutes respectively. Letters above bars represent differences at P < 0.05, similar letters are not different across treatments.
A
B

40
05
101520253035404550
0 1000 2000 3000 4000 5000Cone Index (kPa)
Dep
th B
elow
Sur
face
(cm
)
T0 T0.5 T3 T10
05
101520253035404550
0 1000 2000 3000 4000 5000
Cone Index (kPa)
Dep
th B
elow
Sur
face
(cm
) (a) Previously pasture
(b) Previously wooded
Figure 3-5. Average cone index values for different level of compaction. A) Location
that was previously under pasture. B) Location that was previously wooded. Note, T0, T0.5, T3 and T10 represent compaction treatments of 0, 0.5, 3 and 10 minutes respectively.
A
B

41
CHAPTER 4 LOT-LEVEL STORMWATER MANAGEMENT PRACTICES TO INCREASE
INFILTRATION AND REDUCE RUNOFF
Introduction
At the scale of an urban residential lot, there are a number of stormwater
management practices that can be used to promote stormwater infiltration. Increasing the
infiltration of stormwater on individual residential lots can reduce the need for a large-
scale expensive stormwater management infrastructure and helps maintain the hydrologic
functions of a watershed closer to its predevelopment characteristics. Some of these
changes include reducing the response of the watershed to rain events and allowing
greater opportunity for aquifer recharge. This chapter is a review of some of the practices
that can be implemented at the lot scale to promote stormwater infiltration.
Literature Review
Reducing Imperviousness
Roofs, driveways, and walkways are common impervious surfaces found on a
residential lot. When these surfaces are combined with reduced infiltration rates, due to
compaction, there is an overall increase in the imperviousness of the lot. The following is
a review of some of the alternative practices that can be used to help reduce or counteract
this imperviousness on urban lots.
Pervious pavements
The use of porous and permeable pavements in urban areas is a method of
construction that can help reduce runoff by increasing infiltration. A porous pavement is

42
defined as a surface constructed from materials that allow the immediate infiltration of
rainfall into the underlying ground while a permeable pavement is defined as a pavement
constructed from materials that are themselves not porous but do provide facilities for
rainfall to enter the underlying ground. Both of these pavement types can be classified as
pervious pavements (Pratt 1997).
Figure 4-1 shows a typical cross section of a pervious pavement. First, a filter
membrane is generally placed across the undisturbed soil. This is to prevent movement of
the soil up into the subgrade. Second, the subgrade is added on top of this. The subgrade
is a made up of a coarse aggregate that has a large void space to temporarily store water
while it infiltrates. The base course is a finer material than the subgrade and is the
material on which the pervious surface is laid. A number of pervious surfaces may be
used and some of these include, crushed stone, permeable pavers and porous concrete.
Porous pavements can be used in most urban situations that require conventional
impermeable paving. Typically these situations are parking lots, lightly traveled streets
and pedestrian walk ways. There are two broad categories of porous pavement: porous
asphalt and porous concrete (Ferguson 1994).
Porous asphalt consists of an open-graded asphalt concrete over an open-graded
aggregate base, which is situated on a draining soil. Open graded asphalt concrete only
differs from other asphalt concrete in that it contains very little fine aggregate and,
therefore, forms a porous material. The infiltration rates found on porous asphalt are
reported to be as high as 1500 mm/h. It has also proved to be durable and in some
instances has lasted more then 20 years when it has been used for parking lots (Ferguson
1994). Porosity of the asphalt decreases due to three reasons: where water borne sediment

43
is allowed to drain onto the pavement causing blockages, where soil is brought onto the
pavement and forced into the pores, and where shear stress resulting from vehicles
braking or turning in a spot has caused a pore collapse (Ferguson 1994). Regular cleaning
is required of porous asphalt surfaces to maintain infiltration rates.
Porous Portland cement concrete pavement was developed in the 1970’s in Florida
and by 1990 more than 90,000 m2 had been constructed in Florida (Sorvig 1993). Mixing
four parts aggregate to one part Portland cement binder creates porous concrete; the
aggregate size used is roughly 1 cm. A typical impervious Portland cement concrete is
made up of approximately one part Portland cement binder, three parts fine aggregate and
four parts coarse aggregate. This means that the finer sized aggregate that is usually used
in combination with the larger aggregate has to be left out. The water that is used in the
mix should be between 0.34 to 0.40 water/cement ratio, if the ratio is exceeded the
cement binder will fill the pores and if the there is too little water there will be a weak
bond (Sorvig 1993).
Permeable pavements are generally constructed of open cell pavers that are either
precast or cast in place and can be made of plastic or concrete. The cells are either filled
with soil and sown with seeds so that a vegetative covering will form over the cells or
filled with a permeable aggregate such as gravel. The cells covered with vegetation are
typically installed in lightly traveled areas such as overflow parking, golf cart paths or
emergency accesses.
Pratt et al. (1989) constructed a 4.6 m by 40 m experimental parking lot. The study
examined the hydrologic response of a permeable pavement installation with four
different types of subgrade material. An impermeable membrane was installed below the

44
subgrade and the flows from the reservoirs were measured. It was found that the
percentage of the rain that was converted to reservoir discharge varied from 55% to 75%
for the various subgrade materials and the time of concentration of the runoff was
increased from 2-3 minutes for an impermeable surface to 5-10 minutes for the
permeable surfaces.
Overcoming soil compaction
Reduced infiltration is one of the effects of compaction (Pitt et al., 1999). Reduced
infiltration rates on the urban residential lot adds to the increase in imperviousness
generally associated with urban development. The following is a review of possible
techniques to help maintain the natural infiltration rate or increase the infiltration rate on
disturbed urban soils.
Avoiding soil compaction during the construction phase can help maintain soil
infiltration characteristics. The only successful method of avoiding compaction is by
dividing a construction site into zones (Randrup and Dralle 1997). Construction sites
should be divided into three zones namely a building zone, a working zone and a
protection zone. The building zone would consist of areas that are to be built on and the
closely surrounding area. The working zone would be the area that would be used for
driveways, storage and any other tasks that could cause compaction. The protection zone
should be fenced off to avoid inadvertent use, this area would then be left in its natural
state and any work done in the area would be non-compacting work (Randrup and Dralle
1997).
The NRCS (2000) suggests that soil only be manipulated when below field
capacity as this will reduce the likelihood of compaction. Topsoil could also be removed
before the construction process and returned once construction is complete to help

45
maintain predevelopment soil characteristics. The use of a reinforcing mesh over heavily
trafficked areas is another option for reducing compaction.
Amending soils with compost has been shown to increase infiltration and reduce
runoff (Ros and Garcia 2001, Pitt et al., 1999). Pitt et al. (1999) found that compost-
amended soils had infiltration rates 1.5 and 10.5 times higher than the infiltration rates for
the unamended soils. It was also shown that storms of up to 20 mm total rainfall were
buffered in amended soils and did not result in significant peak flows; whereas, without
the amendment, storms of only 10 mm total rainfall were similarly buffered. Ros and
Garcia (2001) found that soil amended with compost was more effective at reducing
runoff and erosion than soil amended with unstabilized municipal waste or aerobic
sewage sludge. The soil amended with compost reduced runoff by 54%. However, Pitt et
al. (1999) showed that amending soil with compost created an increase in the
concentration of nutrients in the surface runoff. Although, it was hypothesized that the
overall mass of nutrient discharges would most likely decrease when using compost, this
was not the case. It was also shown that the sorption and ion exchange properties of the
compost reduced the concentration of many cations and toxicants, but nutrient
concentrations were significantly increased in the infiltrated water. The compost-
amended test plots produced superior turfgrass, with little or no need for establishment or
maintenance fertilization.
Storing and Infiltrating Stormwater
The use of small-scale infiltration systems to infiltrate runoff that has been
generated on the residential lot is a technique that is gaining favor throughout the world.
The following is a review of small-scale infiltration systems that have been installed.
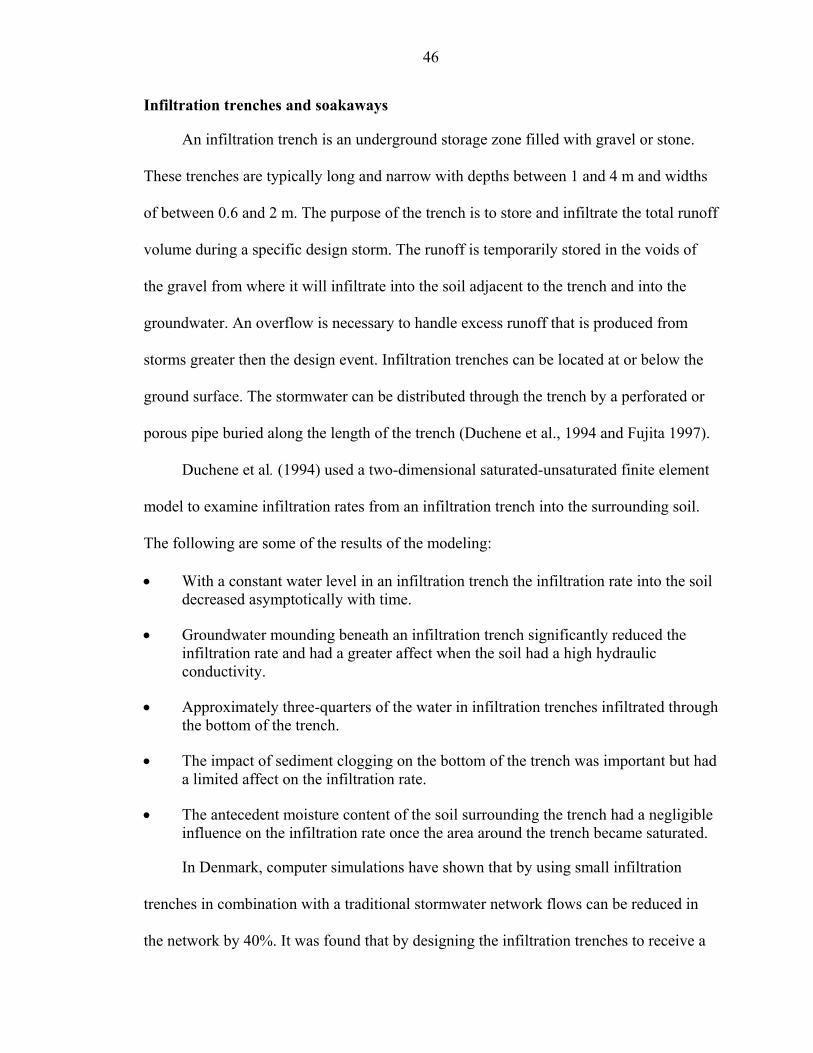
46
Infiltration trenches and soakaways
An infiltration trench is an underground storage zone filled with gravel or stone.
These trenches are typically long and narrow with depths between 1 and 4 m and widths
of between 0.6 and 2 m. The purpose of the trench is to store and infiltrate the total runoff
volume during a specific design storm. The runoff is temporarily stored in the voids of
the gravel from where it will infiltrate into the soil adjacent to the trench and into the
groundwater. An overflow is necessary to handle excess runoff that is produced from
storms greater then the design event. Infiltration trenches can be located at or below the
ground surface. The stormwater can be distributed through the trench by a perforated or
porous pipe buried along the length of the trench (Duchene et al., 1994 and Fujita 1997).
Duchene et al. (1994) used a two-dimensional saturated-unsaturated finite element
model to examine infiltration rates from an infiltration trench into the surrounding soil.
The following are some of the results of the modeling:
• With a constant water level in an infiltration trench the infiltration rate into the soil decreased asymptotically with time.
• Groundwater mounding beneath an infiltration trench significantly reduced the infiltration rate and had a greater affect when the soil had a high hydraulic conductivity.
• Approximately three-quarters of the water in infiltration trenches infiltrated through the bottom of the trench.
• The impact of sediment clogging on the bottom of the trench was important but had a limited affect on the infiltration rate.
• The antecedent moisture content of the soil surrounding the trench had a negligible influence on the infiltration rate once the area around the trench became saturated.
In Denmark, computer simulations have shown that by using small infiltration
trenches in combination with a traditional stormwater network flows can be reduced in
the network by 40%. It was found that by designing the infiltration trenches to receive a

47
storm with an exceedence return period of 0.04 years compared to the common design
practice return period of between 2 and 10 years there would still be a 40% reduction in
stormwater runoff compared to a traditional stormwater system. This was the
economically optimum solution for the parameters modeled (Rosted Petersen et al.,
1994). A similar modeling technique could be used in other areas to achieve the
economically optimum trench size and design period.
Kronaveter et al. (2001) developed a hydrological micro model to simulate the
hydrology on a typical urban lot on the coastal plains of Israel. It was found that by
installing infiltration trenches to collect the roof runoff, total infiltration of rainfall over a
residential lot was increased by up to 21%.
Soakaways consist of a pit into which stormwater is directed and then given time to
infiltrate into the groundwater. The only difference between a soakaway and an
infiltration trench is the geometry of the structure that is used to temporarily store and
exfiltrate water. If the inflow exceeds the infiltration capacity of the soil, excess
stormwater is drained into the city's traditional stormwater system. More than 14,000
soakaways were installed at private housing sites within Tokyo between April 1981 and
March 1993. It was documented that since the installation of the soakaways many of the
nearly dry natural springs within the areas in Tokyo where the soakaways were installed,
had been revived (Fujita 1997).
In the Meyzieu residential area in Lyon, France the sewerage network was being
flooded by stormwater from private houses. The solution that was used to solve this
problem was to rehabilitate the old soakaways that had been built in the area between
1940 and 1960. The new soakaways were named filter pits and detail plans on how these

48
pits should be constructed where developed. The estimated cost of these pits was US$200
per pit in 1997 (Chocat et al., 1997).
The above examples show how successful stormwater infiltration structures such as
infiltration trenches and soakaways can be at increasing the infiltration of water on an
urban lot. The final two instances illustrate how a community can be encouraged to
include a simple and effective stormwater infiltration structure on each residential lot,
thereby improving the hydrologic response of an urban area.
Grassed swales
A swale is a vegetated open channel, which both transmits and infiltrates runoff
water. Deletic (2001) developed a one-dimensional physical mathematical model to
simulate surface water flow and sediment transport over a grassed surface as found on
grassed swales. Three processes were modeled simultaneously to simulate surface water
flow. These three processes were infiltration, surface retention and overland flow.
Infiltration was modeled using the modified Green-Ampt method. Surface retention was
modeled using a conceptual approach where it was assumed that flow only emerged from
the grassed area once the depression storage was full. A kinematic wave model, using a
combination of mass continuity and momentum equations, was used to model surface
runoff. Manning’s equation and the Darcy-Weisbach equation where used for the
momentum equation since there are numerous roughness parameters available for grass
and therefore the option to use either equation was given. In the study the model results
showed that a grassed swale 6 m long and 1 m wide with a slope of 5% was able to
reduce the overall runoff from a 211 m2 parking lot by 45.7%. (Deletic 2001).
The model developed by Kronaveter et al (2001) was also used to investigate the
effectiveness of a routing runoff from a roof over a grassed strip 10 m2 for every 100 m2

49
of roof area. It was found that this simple procedure resulted in an 18% increase in
infiltration over the lot.
Avellaneda (1984) found grassed swales in central Florida to be an effective
method for infiltrating stormwater. A design procedure for swales was also developed.
Swales can be combined with urban landscaping to help promote infiltration on urban
lots (Prince George’s County 2000a, b) and can be used to help move stormwater away
from areas where flooding is a concern.
Biological retention areas
Biological retention (bioretention) combines natural and engineered systems to
manage stormwater runoff from small, 0.1 to 0.08 ha, development areas. A bioretention
facility is typically designed to hold the first flush runoff from a rainfall event. The water
infiltrating the facility can be allowed to continue infiltrating as groundwater recharge or
it can be collected in perforated pipes and conveyed to traditional storm drains (Davies
2001).
Bioretention facilities consist of layers of soil, mulch and a variety of plants
species. These facilities can be installed in household gardens, industrial sites or parking
lots. Bioretention facilities have formed an integral part of Prince Georges County,
Maryland low impact development strategy. This form of retention can be used as a water
quality control measure as Davies (2001) and Hunt et al. (2003) have proven by showing
that bioretention facilities are able to reduce the quantity of several pollutants within
stormwater.
Rain barrels and cisterns
Rain barrels and cisterns are retention devices that can be used in residential areas.
Rain barrels are usually located near the surface while cisterns are buried below the

50
ground. Both operate by retaining a predetermined volume of rooftop runoff. When the
rain barrel is full it no longer provides retention for stormwater. However, this type of
retention device helps reduce runoff when it is below capacity and the storage of water
for later reuse is a beneficial use of rain barrels and cisterns.
Heaney et al. (2000) developed a technique to estimate the size of a rain barrel or
cistern that was required to satisfy the irrigation demands of a household. This technique
was based on monthly water budgeting for the area in which the household was located
and was performed for a number of cities in the United States.
Konrad (1995) modeled the effectiveness of residential stormwater detention using
three years of hourly rainfall data. It was found that these systems must be carefully
planned to provide both effective stormwater control and satisfy domestic demand.
Pervious Pavement Evaluation
Following this review of lot-level stormwater management practices several
examples of pervious pavements were evaluated. The infiltration rates on sites with
permeable paving and on a turf parking lot were measured.
Methodology
The infiltration rate was measured at three locations where a permeable pavement
had been installed. Our objective was to determine the infiltration rate on areas where a
permeable pavement was in use. The infiltration rate on a grassed parking lot was
measured for comparative purposes.
The first location (IDC1) that was tested was a parking lot on the University of
Florida campus located near the ‘Bat House’. The parking lot was constructed in 2003
from porous concrete pavers, which can be described as modular interlocking concrete

51
blocks with an internal drainage cell. Figure 4-2 shows the construction details and a
description of the procedure used for the construction of IDC1.
The second test location (IDC2) was a turning circle on the University of Florida
campus situated near the University Housing Office. The turning circle was constructed
from the same concrete blocks that were used for the ‘bat house’ parking lot. The age of
this pavement was unknown.
The third permeable pavement (EDC1) to be tested was a shared driveway
constructed at the model home in the Madera development in Gainesville, FL. The
driveway was constructed in 2004 using ‘UNI Eco-Stone’ (UNI-GROUP, USA, Palm
Beach Gardens, FL), which is a system of interlocking concrete blocks with external
drainage cells. The cost of the pavers installed on EDC1 was approximately $33 per m2
for the pavers and $30.00 per m2 for the installation. The total cost for 185 m2 of paving
used at the Madera model was therefore approximately $12,000.
The grassed parking lot that was tested was located on the University of Florida
campus off Bledsloe Drive and adjacent to the University Village South. The parking lot
was used regularly in the fall and spring semesters.
The infiltration rate on the permeable pavers was measured using a double-ring
infiltrometer with a 30 cm diameter inner ring and a 60 cm diameter outer ring. A larger
diameter double-ring infiltrometer was used on the permeable pavers because infiltration
only takes place through the drainage cells, and the more drainage cells that are within
the double-ring infiltrometer the more accurate the estimate of infiltration rate. A
constant head was maintained in the inner ring using a Mariotte syphon while the
constant head in the outer ring was maintained manually. Bentonite clay was used to
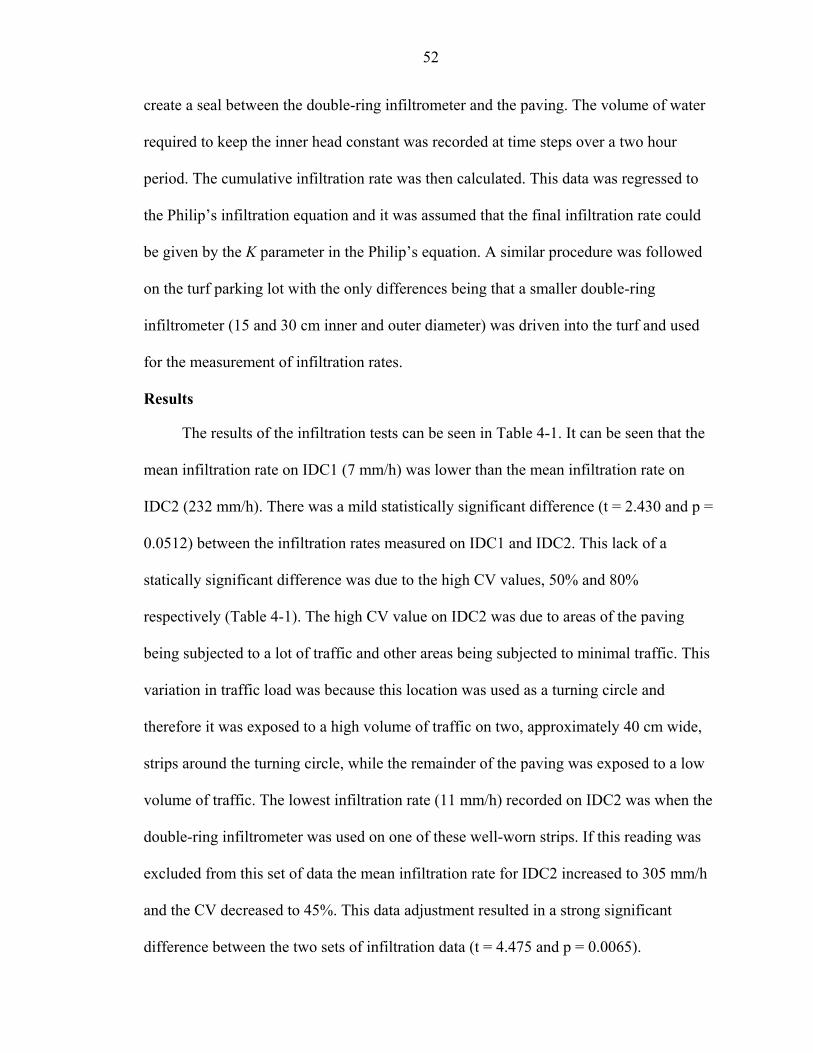
52
create a seal between the double-ring infiltrometer and the paving. The volume of water
required to keep the inner head constant was recorded at time steps over a two hour
period. The cumulative infiltration rate was then calculated. This data was regressed to
the Philip’s infiltration equation and it was assumed that the final infiltration rate could
be given by the K parameter in the Philip’s equation. A similar procedure was followed
on the turf parking lot with the only differences being that a smaller double-ring
infiltrometer (15 and 30 cm inner and outer diameter) was driven into the turf and used
for the measurement of infiltration rates.
Results
The results of the infiltration tests can be seen in Table 4-1. It can be seen that the
mean infiltration rate on IDC1 (7 mm/h) was lower than the mean infiltration rate on
IDC2 (232 mm/h). There was a mild statistically significant difference (t = 2.430 and p =
0.0512) between the infiltration rates measured on IDC1 and IDC2. This lack of a
statically significant difference was due to the high CV values, 50% and 80%
respectively (Table 4-1). The high CV value on IDC2 was due to areas of the paving
being subjected to a lot of traffic and other areas being subjected to minimal traffic. This
variation in traffic load was because this location was used as a turning circle and
therefore it was exposed to a high volume of traffic on two, approximately 40 cm wide,
strips around the turning circle, while the remainder of the paving was exposed to a low
volume of traffic. The lowest infiltration rate (11 mm/h) recorded on IDC2 was when the
double-ring infiltrometer was used on one of these well-worn strips. If this reading was
excluded from this set of data the mean infiltration rate for IDC2 increased to 305 mm/h
and the CV decreased to 45%. This data adjustment resulted in a strong significant
difference between the two sets of infiltration data (t = 4.475 and p = 0.0065).

53
The design of the permeable paving at the IDC1 site may have had an influence on
the low infiltration rates measured (7 mm/h). There were differences between the
installation shown in Figure 4-2 and the typical installation in Figure 4-1. The installation
guidelines for IDC1 showed crushed stone on a 6 inch compacted subgrade (with a
minimum 95% standard proctor density), however Figure 4-1 shows the crushed stone
resting on a filter membrane overlying undisturbed soil. As was shown in Chapter 3 of
this thesis, a soil compacted to 95% proctor density resulted in significantly reduced
infiltration rates, this would mean that water stored in the layer of crushed stone would
infiltrate into the surrounding soil at a slower rate then would occur in the typical
permeable pavement design as shown in Figure 4-1. The design for IDC1 was used
because clay was found below the site of the pavement, it was therefore decided that an
under drain would be installed below the pavement and this was used to route water from
under the pavers to a nearby detention basin (Monique Heathcock, personal
communication, 19 April 2003).
The primary reason for the low infiltration rates measured on the pavers was most
likely due to the use of a compacted layer of washed concrete sand, that met the ASTM
C-33 grading requirements, as a bedding layer. This grading of sand will generally yield
infiltration rates through the pavers that are too low for the pavement to effectively
infiltrate water (Cao et al., 1998). The ASTM C-448 grading is more effective (as a
bedding layer that promotes stormwater infiltration), and should have been used (Cao et
al., 1998).
The infiltration rate on EDC1 was extremely high (>12,000 mm/h). The actual
infiltration rate could not be measured because a water supply with a sufficient flow rate

54
could not be found. A water source with a flow rate equivalent to 12,000 mm/h was used
to try and fill the double-ring infiltrometer. The tests were conducted for 10 minutes and
at all the test locations the infiltration rate of the paving exceeded the flow rate of the
source. The infiltration rate on EDC1 was at least two orders of magnitude greater then
the infiltration rates at the other locations. The higher infiltration rates on EDC1 are due
to the choice of materials used on this permeable paving, specifically the use of an
aggregate that meets the ASTM C-33 requirement as the bedding layer and fill for
drainage cells allows for the rapid infiltration of water into the pavers. It was therefore
assumed that runoff will only be generated on this pavement when the subgrade is
saturated. The infiltration of water into the soil profile below the driveway and the
storage provided by the subgrade are therefore the limiting parameters when determining
the infiltration into this type of permeable pavement.
The infiltration rates measured on the grass parking (average = 94 mm/h) were
significantly different to the average infiltration rate on IDC1 (t = 23.391 and p = 0.0002)
but were not significantly different to the infiltration rates measured on IDC2 (t = 1.490
and p = 0.1866) using the paired t-test. This would indicate that the use of grass parking
would help promote infiltration. Although the rates measured on the grass were not as
great as some of those measured on IDC2 they were always greater then the values
measured on IDC1.
Soakaway Evaluation
A soakaway was installed at the Madera model home to help mitigate some
stormwater flooding that might occur. The home was located approximately 1 m below
the road level and there was no available stormwater infrastructure to convey stormwater
off the site. It was decided that installing a soakaway and a guttering system to capture

55
the runoff from the nearby roof area would be a solution to this potential flooding
problem. A guttering system that captured the runoff from 68 m2 of the roof was
installed. A soakaway, using 32 Atlantis® Matrix® modules (Atlantis Water
Management, Chatswood, Australia), was installed near the model home. The Atlantis®
Matrix® module, a rectangular plastic matrix, was assembled on site. Each module had a
volume of 0.125 m3 and void space of more than 90%. The matrix like structure of the
module created this void space. This is a more efficient method of storing water than
gravel that typically has a void space of 20 to 40%. The modules were stacked together to
form a 4 m3 “tank”; this entire tank was then covered with a geotextile to prevent soil
from entering the “tank” but allowing water to flow freely between the “tank” and the
surrounding soil. A capture basin, with a simple mesh filter, was installed below the
gutter downspout to capture the stormwater from the roof. The cost of this type of
soakaway was $164 per m3 for the structure and $300 for the installation; the total cost
for the soakaway installed at the Madera model home was therefore approximately
$1,000.
Methodology
To evaluate the effectiveness of the soakaway installed at the Madera model home,
a small-scale test was conducted near the location of the soakaway. The results of this test
were used to develop a model of the exfiltration out of the soakaway. This was used to
simulate water levels in the soakaway based on four years of continuous rainfall data.
There were a number of methodologies that could have been used to test the
effectiveness of the soakaway installed at the Madera model home. A pressure transducer
could have been installed in the soakaway and the depth of water in the soakaway
monitored continuously over a period of time. This would allow the effectiveness of the

56
soakaway under actual rainfall events to be determined. However, construction delays on
the model home meant that guttering was not in place in time to allow sufficient data to
be collected.
The possibility of filling the soakaway from a water supply and then monitoring the
water levels was investigated, however the volume of the soakaway installed at the
Madera model home was approximately 4 m3 and a water supply capable of filling this
volume could not be found. It was therefore decided to use a model described by
Warnaars et al. (1999) that could be parameterized with data collected from a model
soakaway to predict the exfiltration from the soakaway.
A simple model of exfiltration out of an infiltration trench or soakaway was
described by Warnaars et al. (1999):
)h(AK)h(Q fsout ⋅= (4-1)
Where Kfs is the field-saturated hydraulic conductivity that could be estimated from an in-
situ falling-head experiment and A(h) is the wetted area that is a function of the water
depth.
A parameter Kh could be used as a representative value of Kfs for the flows through
the walls of the soakaways and a parameter Kv could be used a representative for Kfs for
the flows through the bottom of the soakaway. The outflow from a soakaway of length
(l), width (w) and depth (h0) could then be described by the following:
dtdhwlwlKh)wl(K2)h(Q vhout ⋅⋅φ=⋅⋅+⋅+⋅⋅= (4-2)
The right hand part of Eq. 4-2 is a mass balance for the trench with no inflow. A
graphical representation of Eq. 4-2 can be seen in Figure 4-3. Figure 4-3 shows that the
relationship between the exfiltration from the trench and the water depth in the trench is

57
linear and can be represented by Qout(h ) = αhβ. The y-intercept (β) can be used to
determine Kv and the slope (α) can be used to determine Kh.
By recording falling water depths in a soakaway and calculating the exfiltration
during each time step, a plot of the outflow from the trench against the depth of water in
the trench can be made. The parameters α and β can then be estimated through linear
regression. The K-values can be estimated from Kh=α/(2(l+w)) and Kv=β/(l+w).
To estimate the K-values for the soakaway installed at the Madera model home a
small soakaway was constructed near the location of the actual soakaway. The small
soakaway was constructed from a single Atlantis® Matrix® tank module of length 0.408
m, width 0.685 m and height 0.450 m. The bottom and sides of the module were covered
with a geotextile to prevent soil entering the module. The geotextile used in the test was
not the same as the geotextile used on the actual soakaway, but it was assumed that its
hydraulic properties were not significantly different to the hydraulic properties of the
geotextile used on the actual soakaway. A 50 cm length of 2.5-inch well screen with a
float was installed in the center of the module.
The single Matrix® tank module was installed in a representative area within 50 m
of the full-scale soakaway so that the top of the tank was level with the soil surface. The
bottom of the hole was level and hand compacted. Soil was then backfilled around the
module and hand compacted to ensure that there was contact between the walls of the
module and the surrounding soil.
The exfiltration rate from an infiltration trench kept at a constant head is dependent
on time and decreases asymptotically with an increase in time (Duchene et al., 1994).
This was thought to be due to changes in hydraulic gradient across the sides and walls of

58
the trench. Saturation of the soil surrounding the trench causes an increase in the capillary
pressure in the soil resulting in a reduced hydraulic gradient between the soil and the
water in the trench. Two trials were conducted for this test. One trial simulated initially
dry soil moisture conditions and the other simulated initially saturated soil moisture
conditions.
The module was filled with water and the initial water level in the soakaway and
the start time were recorded. Water level and time were recorded until the module was
completely drained. This initial trial will be referred to as Trial (a). The module was then
kept full for approximately twenty minutes with a constant water supply. The water
supply was turned off and once again the water levels in the module were recorded. This
second trial will be referred to as Trial (b).
The K values for the two trials were estimated using the regression procedure
described previously. The theoretical changes in water depths with times were then
modeled using a simple Euler numerical model. The results of this model were compared
to the measured data.
The same numerical method was then used to predict how long it would take the
actual soakaway to drain after an initially full condition. The K values from Trial (b)
were used to model the exfiltration from the soakaway since these were considered the
more conservative values.
To test the long term effectiveness of the soakaway installed at the Madera model
home a numerical model was developed to simulate the volume of water in the soakaway
for a continuous 15 min rainfall record.

59
The model was developed in a spreadsheet using a 2nd order Runge-Kutta
numerical method. It was assumed that the only input into the system was the rainfall
falling on the 68 m2 of roof area that was captured by guttering and routed into the
soakaway. All the rainfall that fell during the time step was assumed to enter the
soakaway during the same time step and it was assumed that there was no loss of water. It
was also assumed that the initial volume at the start of the simulation period was zero.
The soakaway dimensions were 1.6 m wide, 2.7 m long and 0.9 m high. It was assumed
that the void space within the soakaway was 98%. The K values from the saturated trial
described earlier were used in the simulation. It was also assumed that once water had left
the system it could not return. The rainfall record was from 2000 to 2003 for Alachua
County and was downloaded from the Florida Automated Weather Network (FAWN
2004) website.
During the period of simulation there were a total of 232 rain events greater then
0.5 mm with a minimum of 3 hours of no precipitation separating events. The total
rainfall during the period was 460.5 cm with a mean annual average precipitation of
115.1 cm. This is below the mean annual precipitation for Gainesville (126.7 cm) as
measured at the Gainesville Municipal Airport. There were 73 events between 1 and 2
cm, 29 events between 2 and 3 cm, 10 events between 3 and 4 cm, 11 events between 4
and 5 cm and 3 events between 5 and 6 cm. The three maximum rainfall events were 7.3
cm, 9.6 cm and 12.5 cm.
Results
Figure 4-4 shows water depth recorded over time for Trial (a) and Trial (b) in the
model soakaway. The change in the water depth appears to be nonlinear with the rate of

60
change of the water depth decreasing with time for both trials. Both trials showed similar
results and no significant differences between the two data sets were observed.
Figure 4-5 shows the results of the linear regression used to estimate the K values
for the soakaway for the two trials. From these results it can be seen that the linear
regression had r2 values of 0.79 and 0.61 for Trials (a) and (b) respectively.
For Trial (a) Kh and Kv were calculated to be 283 mm/h and 213 mm/h, respectively
and for Trial (b) Kh and Kv were calculated to be 206 mm/h and 322 mm/h, respectively.
It should be noted that Kh decreased and Kv increased from Trial (a) to Trial (b), this may
be due to increasing soil moisture content in the soil surrounding the soakaway.
It was hypothesized that Kh was more dependent on the soil matric potential,
because it represented the lateral movement of water out of the soakaway, compared to
Kv, which represented the vertical movement out of the soakaway. Therefore as the soil
moisture content increased the soil matric potential decreased, causing Kh to decrease.
Conversely, Kv could be more dependent on soil hydraulic conductivity than Kh
because it is dominated by the vertical movement of water through the bottom of the
soakaway. Increased soil moisture content caused an increase in soil hydraulic
conductivity. This would result in an increased Kv.
Figure 4-6 shows a comparison between the results of the numerical model that
were used to predict water depths in the model soakaway based on the estimated K values
and the initial water depths for each trial. There was generally a good visual fit between
the modeled data and the measured data. This would indicate that parameter fitting
exercise was acceptable. However, the model using the K values from Trial (b) does
seem to show a better fit to the measured data than the model using the K values from

61
Trial (a). It was decided that the K values from Trial (b) would be used to model the
actual soakaway because these values were more conservative and because there was a
better fit between the data and the model.
Figure 4-7 shows the estimated change of water levels with time, for the
soakaway that was constructed at the Madera model home. It was assumed that the K
values from the model experiment could be used in the exfiltration model to approximate
outflows from the soakaway. It was also assumed that there would be no influence from a
groundwater table. Soil sampling to a depth of 2.45 m was conducted near the site of the
soakaway and no water table was found. If these assumptions were correct, it would take
approximately 110 min for the soakaway to exfiltrate the 3.8 m3 of water that could be
stored in the soakaway.
Figure 4-8 shows the volume of water in the soakaway during the 4 year simulation
period from January 2000 to December 2003. It can be seen that the soakaway would
have functioned well over the period of the simulation. A total rainfall depth of 460 cm
fell during this period, equating to 312.8 m3 of runoff from the 68 m2 area of roof that
was captured by the system, the soakaway stored and exfiltrated 310.2 m3 of this runoff
into the soil. There was only one rain event that caused the soakaway to overflow. The
rain event occurred on the 22 September 2001 and a rainfall depth of 9.6 cm was
recorded in a 15 min period resulting in 2.6 m3 of overflow from the soakaway.
The soakaway seems to be an effective method for reducing the possibility of
flooding on the model home site and should result in increased groundwater recharge and
less stormwater being generated on the model home.

62
Conclusion
There are a wide variety of practices that can be used to promote the infiltration of
stormwater on residential lots.
The infiltration rates measured on three pervious pavements were found to vary
significantly depending on; the type of pavement, materials used in the pavement and
traffic loads experienced by the pavement. It can therefore be concluded that the use of a
well-designed and correctly installed pervious pavement that will be exposed to light
traffic loads could significantly increase infiltration on a lot and reduce runoff from the
lot.
By simulating the functioning of a soakaway that received runoff from a roof, it
was shown that the soakaway installed at the Madera model home was able to store and
infiltrate most of the runoff from the roof during a four year period. This shows that a
correctly designed soakaway could effectively reduce runoff from a lot and promote the
infiltration of stormwater.
The techniques used in this chapter to model and simulate the soakaway could also
be used for design purposes. Varying the simulated soakaway size, would allow the
optimum volume of soakaway required on a lot to be found. This would reduce the
chance of the soakaway being undersized or oversized which would reduce the chance of
flooding on the lot or minimize the cost of stormwater management on the lot.
Further long-term monitoring of the practices discussed in this chapter needs to be
conducted under controlled and real world conditions. This would facilitate an improved
understanding of the functioning of these practices and how the effectiveness of these
practices changes with time. Improved insight into the functioning of these practices

63
would enhance the ability of decision-makers to decide on which practices should be
used and how these practices could be most effectively and efficiently utilized.
Table 4-1. Measured infiltration rates on pervious surfaces in Gainesville, Fla.
Measurement IDC1 IDC2 EDC1 Grass Parking
Infiltration Rates (mm/h) 1 8 321 >12 000 88 2 4 435 >12 000 92 3 3 160 >12 000 100 4 11 11 >12 000 94
Mean 7 232 94 Std Dev 3 185 5 CV (%) 50 80 5
Pervious Material
Base Course
Sub grade
Filter membrane
Undistributed soil
Pervious Material
Base Course
Sub grade
Filter membrane
Undistributed soil
Pervious Material
Base Course
Sub grade
Filter membrane
Undistributed soil Figure 4-1. Typical cross section of a pervious pavement

64
Figure 4-2. Construction detail for Bat House parking University of Florida
α
β
h
Qout(h)
Figure 4-3. Theoretical relationships between exfiltration from a trench and water depth.
Where h is depth of water in a soakaway, Qout is the flow rate of water out of the soakaway, β is the y-intercept and α is the slope (after Warnaars et al, 1999).

65
0.00
0.05
0.10
0.15
0.20
0.25
0.30
0.35
0.40
0 5 10 15 20 25 30 35 40
Time (min)
Dep
th (m
)
Trial (a) Trial (b)
Figure 4-4. Results of water depths recorded in the model soakaway. Trial (a) was under
low soil moisture conditions and Trial (b) was saturated moisture conditions.
y = 0.0103x + 0.9938R2 = 0.7874
y = 0.0075x + 1.4978R2 = 0.6084
0
1
2
3
4
5
6
0 50 100 150 200 250 300
Depth (mm)
Qou
t (l/m
in)
Trial (a) Trial (b) Trial (a) Trial (b)
(a) (b)
Figure 4-5. Linear regressions of data collected on model soakaway where: (a) was data
collected with low soil moisture content and (b) was the data collected after the soil had been saturated.
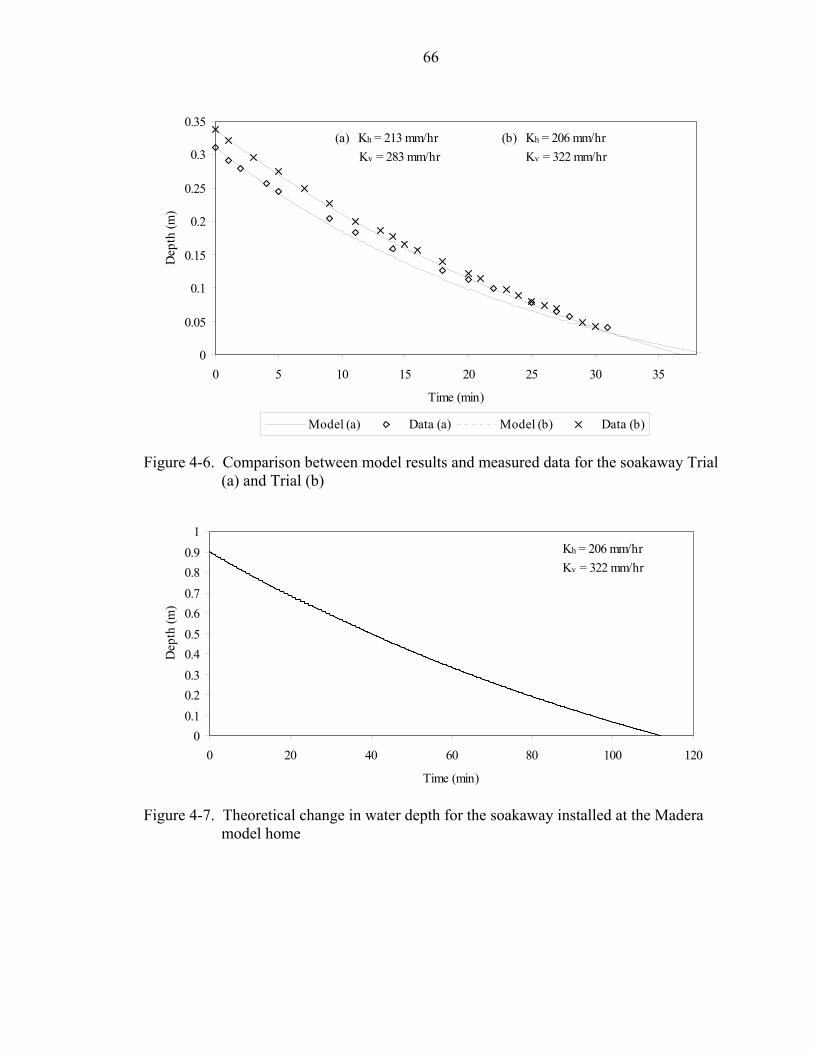
66
0
0.05
0.1
0.15
0.2
0.25
0.3
0.35
0 5 10 15 20 25 30 35
Time (min)
Dep
th (m
)
Model (a) Data (a) Model (b) Data (b)
(a) Kh = 213 mm/hr Kv = 283 mm/hr
(b) Kh = 206 mm/hr Kv = 322 mm/hr
Figure 4-6. Comparison between model results and measured data for the soakaway Trial
(a) and Trial (b)
00.10.20.30.40.50.60.70.80.9
1
0 20 40 60 80 100 120
Time (min)
Dep
th (m
)
Kh = 206 mm/hrKv = 322 mm/hr
Figure 4-7. Theoretical change in water depth for the soakaway installed at the Madera
model home

67
0.0
0.5
1.0
1.5
2.0
2.5
3.0
3.5
4.0
Jan-00May-00
Sep-00Dec-00
Apr-01
Aug-01
Dec-01
Apr-02
Aug-02
Dec-02
Apr-03
Aug-03
Dec-03
Wat
er st
ores
in so
akaw
ay (m
3 )
Figure 4-8. Model results of water volume in the soakaway installed at the Madera
model home between January 2000 and December 2003.

68
CHAPTER 5 LOT LEVEL HYDROLOGICAL MODEL
Introduction
Florida experienced the seventh highest population growth for a state in the United
Sates of America with a 23.5% increase in population during the period 1990 to 2000
(U.S. Census Bureau 2001). This has resulted in a rapid expansion of urban areas, with
Florida accounting for approximately 11% of all new homes constructed in the United
States in 2003 (U.S. Census Bureau 2004). Construction of roads, roofs and sidewalks
and the compaction of soils, all contribute to an increase in the imperviousness of a
watershed. This increased imperviousness results in more runoff being generated.
Traditionally, stormwater management seeks to redirect runoff as quickly and efficiently
as possible into streams, detention ponds and retention ponds. This rerouting of
stormwater often has many negative affects on water quality as urban area pollutants are
carried into sensitive aquatic environments. Increased storm flow volumes result in the
erosion of stream banks causing an increase in the sediment load of streams. Recharge of
groundwater supplies has also been shown to decrease under this traditional stormwater
management technique.
There are alternatives to managing stormwater in urban areas, for example
managing stormwater at the scale of an urban residence (lot level) can be used as an
alternative to traditional stormwater management techniques (Prince George’s County
1999, Carmon et al., 1997). Limiting the inadvertent compaction occurring on the lot
during construction allows more water to be infiltrated into the soil. Using porous paving

69
and reducing impermeable areas through shared driveways and multistory homes,
reduces the runoff produced on a lot. Routing runoff from impermeable areas to
depressed areas or micro scale infiltration structures allows water to be stored and either
used for domestic purposes or infiltrated to help increase groundwater recharge (Prince
George’s County 1999). Currently, the Soil Conservation Service method that is based on
curve number estimates and design storms, has been adjusted to investigate the effect of
increased on lot infiltration (Holman-Dodds 2003). This technique is currently being used
for design purposes (Prince George’s County 1999). It has been suggested that long-term
simulations with more physically based models should be run to more adequately
evaluate the effects of alternative stormwater management techniques (Strecker 2001). It
was also found in Israeli coastal plain simulations that a physically based approach was a
better way to evaluate the effect of on site micro scale infiltration facilities on ground
water recharge (Kronaveter et al., 2001).
Our objective was to develop a lot-level hydrological model to simulate the basic
hydrology that occurs at the residential home lot level. The goal of model development
was to simulate the effect of an infiltration structure, porous paving, changes in yard
infiltration rates and changes in the impermeable area on the hydrology that occurs on the
lot during a number of rainfall events. The purpose of the model was to evaluate the
relative effectiveness of stormwater Best Management Practices (BMPs) at the lot level.
The aim of the BMPs was to reduce runoff through use of pervious pavement,
soakaways, minimizing lot compaction and routing water to make effective use of the
BMPs.

70
The System
A Forester diagram of the Lot Level Hydrological Model, which shows how the
hydrological system was modeled, is depicted in Figure 5-1.The boundary of the system
that was being modeled was the boundary or property line of an individual lot or urban
residence. It was assumed that all the water that fell on the lot would either infiltrate or
become runoff from the yard, driveway or infiltration structure. It was therefore assumed
that there was no run on of water from other adjacent lots or from the road. Rainfall was
the only input into the system and was in the form of a time series of rainfall depths for a
given period. An individual rainfall event was used as this would make the model easier
to setup and quicker to run at the small time steps required to simulate the hydraulic and
hydrologic processes occurring on a lot. The outputs from the system were runoff from
the infiltration structure, yard, driveway or recharge to the groundwater supply. It was
assumed that the groundwater table was far enough below the soil surface to not have an
affect on the hydrological processes occurring on the lot. These are reasonable
assumptions for homes in North Central Florida.
There are four components in this system: roof, driveway, yard, infiltration
structure, and the soil. The state variable that was modeled in this simulation was the
volume of water stored during each time interval. The volume of water on the roof,
driveway, driveway base, yard, infiltration structure, and in the soil was simulated. The
main processes that occurred in the components were infiltration into the soil and
driveway (if it was pervious), flow routing over the roof, and yard, water percolation to
the groundwater and exfiltration out of the infiltration structure.
The roof was assumed to be a simple roof that sloped in one direction with a
uniform gradient. All the rain that fell on the roof was expected to be collected at one

71
point on the roof and it was assumed that the volume of water falling on the roof could be
calculated by multiplying the plan area of the roof by the depth of rainfall. This is an
overestimation of the volume of rainfall that would be collected on the roof. Ragab et al.
(2003a) found that depending on slope, aspect and prevailing wind a roof will collect
between 62 and 93% of the rainfall that would be collected at ground level.
The driveway was assumed to be rectangular with a constant gradient away from
the home. It was assumed that the driveway could be either pervious or impervious and
that all the water that fell or was routed onto the impervious driveway would flow down
the driveway and not be infiltrated or runoff the sides of the driveway. Ragab et al.
(2003b) measured the loss of water on impervious surfaces and found that between 6 and
9% of rainfall on impervious surfaces were infiltrated into the surface. It was assumed
that the pervious driveway would be constructed with a base made from coarse gravel
that could be used to store excess stormwater. The water that exfiltrated out of the base,
was assumed to be lost to the system and added to the groundwater store.
The yard was also assumed to be rectangular with a constant gradient and hydraulic
roughness. It was assumed that the soil underneath the yard could be divided into a root
zone. The root zone temporarily stored water, exfiltration of water out of the root zone
only occurred when the water content was above field capacity and infiltration into the
root zone only occurred when the root zone was not saturated. The rate of the exfiltration
out of the root zone was determined by a constant percolation rate that could be adjusted
to represent a compacted soil layer. This root zone could be used to simulate the fill that
is often brought onto a lot to create a gradient sloping away from the house and would be
important if an evapotranspiration component were to be added to the model. Once water

72
had drained through the root zone it was lost to the system and would become part of the
groundwater store.
Some important hydrological components were left out of the system. Irrigation,
which can contribute to the depth of water added to the soil profile, was left out of the
system. Irrigation could have an affect on the runoff response of a soil because the
frequency and depth of irrigation determine the soil water store available in the soil
profile before a rainfall event. It was decided to leave this component out of the model, as
the model would only be used to simulate single storm events and irrigation is usually
turned off during these events. The effect of irrigation could also be modeled by changing
the initial soil conditions at the start of the event.
Evapotranspiration (ET), which is a significant part of the hydrological cycle, was
also left out of the system. There is generally very little ET during a storm event with
most of the ET occurring between rain events. ET would be an important factor when
determining the soil moisture conditions at the start of the rainfall event and would
therefore be an important process to include if long term simulations of the hydrology on
a lot were to be undertaken. The ET component would affect the water store in the root
zone and could be added to the Lot Level Hydrological Model in the future.
Model Development
Software
Stella 7.0.3 (HPS 2002) was used to implement and run the Lot Level Hydrological
Model. Stella 7.0.3 is a graphical simulation tool that can be used to simulate a system.
There were a number of advantages to using this software, which included the speed at
which a simulation could be set up, no need for computer programming skills, and a user
interface which allowed the structure of the model to be easily understood. The

73
disadvantages of the software were that only 1,500 time varying data points could be read
into the simulation and that the software could not simulate all infiltration equations.
Infiltration
Infiltration is one of the most important hydrological processes occurring on the
urban lot during a rain event. By building structures that promote an increase in the
volume of water that is infiltrated on the lot during a storm event the runoff volume from
the lot could be reduced. There are a number of methods that can be used to model the
infiltration process. Chu (1979) described a methodology to model infiltration for an
unsteady rainfall using the Green-Ampt equation. Due to restrictions in the software used
to develop this model, the procedure described by Chu (1979) could not be coded. Instead
it was assumed that infiltration could be modeled according to a linear model
Kf = (5-1)
Where f is defined as the actual infiltration rate of water into the soil and K is the
potential infiltration rate for the soil or pervious pavement.
If the rainfall intensity (i) was less than the potential infiltration rate (K), then the
infiltration rate (f) was equal to i. If i was greater than the potential infiltration rate then f
was equal to K. This assumption was made because during the measurements, made in
chapter 3 of this thesis, of infiltration rates on sandy soils in North Central Florida the
infiltration rate became constant almost immediately after ponding and the typical,
approximately exponential, decrease in infiltration rate with time after ponding was not
found under natural undisturbed conditions. Compacted sandy soils showed infiltration
rates taking longer to become constant, making this assumption less valid. If more
detailed modeling were to be conducted this assumption would have to be changed.

74
Flow Routing
Overland flow routing was used to determine the rate at which water leaves the
yard, driveway and roof. A combination of a mass balance and Manning’s equation was
used to model this flow. A diagram of the conceptual model used to simulate runoff can
be seen in Figure 5-2, Eq. 5-3 describes this
outin QQdtdV
−= (5-3)
Where V (m3) is the volume of water stored and Qin (m3/s) and Qout (m3/s) are the
volumetric inflow and out flow of water for the surface being modeled. The outflow can
be either overland flow or infiltration. Eq. 5-4 was used to model this outflow and is a
combination of the mass balance equation in Eq. 5-3 and Manning’s equation.
Af)d(dn
sWQ 35
pout ⋅−−⋅⋅
= (5-4)
Where W is the width (m) of the flow surface, s is the slope (m/m) of the flow
surface, d is the depth of water (m) on the flow surface, that was estimated at the
beginning of each time step by calculating the maximum water depth that could occur
during the time step, dp is the depression storage (m) on the flow surface, f is the average
infiltration rate that occurred during the time step (m/h) and A is the area of the flow
surface (m2). The inflow was made up of rainfall over the flow surface or run on from
another component of the model. The inflow, due to rainfall was found by multiplying
the rainfall depth, i (m) by A and dividing by the time interval. Runoff only occurred
when the depth of ponding (d) was greater then the sum of the depression storage (dp) and
the potential infiltration during the time step. The n parameter represents Manning’s n, a
roughness coefficient for shallow overland flow.

75
Percolation
Percolation was used to simulate the movement of water from the root zone or base
of the driveway into the subsoil. It was assumed that percolation of water from the root
zone would only occur when the soil moisture content in the root zone was greater then
the field capacity. It was also assumed that percolation would always occur from the base
of the driveway since the coarse gravel generally used as the base of a pervious pavement
would have a field capacity that is essentially zero. The percolation rate was a constant
rate. This percolation rate could be varied depending on the conditions, for example
reducing the percolation rate could be used to simulate a compacted layer of soil covered
by a layer of fill that is often brought in to create a gradient on the site. This condition
could result in a perched water table that could have an effect on runoff from the yard.
Exfiltration
The exfiltration component of this model was used to simulate the functioning of
either an infiltration trench or soakaway. Infiltration trenches and soakaways are
underground storage zones that temporarily store excess runoff and allow it to be
exfiltrated out of the store and into the surrounding soil. The exfiltration of water from
the infiltration structure is dependent on a number of parameters; these include saturated
and unsaturated hydraulic conductivity, water and soil temperature, the geometry of the
infiltration structure, water level in the infiltration structure, soil matric potential, and soil
moisture content. Modeling the effect of all the parameters is very computational
intensive and requires the use of a dynamic three-dimensional saturated-unsaturated soil
water model. It was decided that a simple infiltration trench model described by
Warnaars et al. (1999) would be suitable for the Lot Level Hydrological Model.
The model was formulated as follows

76
wlKh)wl(K2)h(Q vhout ⋅⋅+⋅+⋅⋅= (5-5)
Where Kh and Kv (m/min) are parameters that can be used to describe the flow of
water through the sides and base of infiltration trench or soakaway. These parameters
were estimated by monitoring the change of water depth in an infiltration trench over
time. The length and width of the infiltration trench or soakaway are described by l (m)
and w (m) respectively, while the water depth is represented by h (m).
Effectiveness of promoting Lot Level Infiltration
The effectiveness of a number of combinations of practices, that increase lot level
infiltration, was simulated through the use of five trials. A brief sensitivity analysis for
the model was also carried out. The following is a review of the simulations.
Description of Model Setup
An idealized lot that could be easily modeled, but still represented the
characteristics of a typical urban residence in North Central Florida, was used as the basis
for the model setup. The model was based on a 980 m2 lot, with a 720 m2 yard, an 60 m2
driveway and a 200 m2 roof area. Figure 5-3 shows the basic setup of the lot as used in
the lot level hydrological model. It can be seen in Figure 5-3 that the roof was at the back
of the lot, the driveway was on the edge of the lot and the yard took up the rest of the lot.
The dimensions of the components that make up the yard could be changed to represent
different sized residences.
Five rainfall events were used as inputs for the model. The rainfall data were
recorded at a weather station in Lake County, North Central Florida using a tipping
bucket rain gauge. The rainfall data was analyzed using RIST2.1 (USDA 2003) and
storm events were extracted at a one-minute time interval. The rainfall events were

77
selected to include a range of magnitudes and seasonal characteristics. The rainfall events
were then used as an input to the Lot Level Hydrological Model in one-minute
increments. The model was run at a one-minute time interval to allow more accurate
estimation of model components during the relatively short storm events. This time step
would also allow for a 24 hour time period to be simulated in Stella 7.0.3. Figure 5-4
shows the rainfall hyetographs for the five storms simulated in the model. Five-minute
rainfall data was used for this plot as it gave a better visual indication of the
characteristics of the rainfall events then the one-minute data that was actually used in the
model. Figure 5-5 shows the cumulative rainfall depth for all five of the rainfall events.
Table 5-1 is a summary of each of the rainfall events. The rainfall events were ordered
from smallest to largest magnitude.
Sensitivity analysis
A brief sensitivity analysis was performed to analyze the sensitivity of the model to
changes in a number of the model parameters. The total lot runoff was used as the model
output. Rain events 1 and 4 were used as the inputs to the model as these were thought to
be two very different types of rainfall events. The parameters that were varied were the
potential infiltration rate (K), the soil moisture content, the percentage of the roof
connected to the soakaway, the percentage of the roof connected to the yard and the
Manning’s n for the yard.
The potential infiltration rate was varied from 10 to 400 mm/h, the soil moisture
was varied from 5 to 20%, the percentage of the roof area routed to the soakaway and
yard were both varied between 0 and 100% and Manning’s n was varied from 0.1 to 0.5.
The base run was setup as described in Trial 1. Each parameter was changed individually
for both rain events.

78
Trial 1
Trial 1 was setup to represent a current stormwater management scenario that could
be found on a typical lot in North Central Florida. The following is a description of how
the model was set up.
The roof was 5 m wide and 40 m long and was situated at the back of the lot. The
gradient of the roof was 50% and was sloped towards the front of the lot. It was assumed
that the roof had a Manning’s n of 0.012, which is the coefficient for a wood surface
(Mays 1999). The runoff from the roof was split so that 30% was routed onto the
driveway and 70% was routed onto the yard.
An impervious finished concrete driveway 15 m long and 4 m wide with a
Manning’s n of 0.012 (Mays 1999), a depression storage of 0.5 mm and a slope of 2%
was used in the simulations.
The yard was 20 m by 36 m with a gradient of 2% sloping a way from the house. It
was assumed that the yard was covered with a uniform Bermudagrass (Cynodon spp.)
with a Manning’s n of 0.41 (Weltz et al., 1992) and a depression storage of 2.5 mm. It
was assumed that the soil in the yard was compacted with a K value of 100 mm/h, this
value was assumed to be the infiltration rate after a soil has been exposed to typical urban
construction activities. The percolation rate was assumed to be equal to the surface
infiltration rate and was set at 100 mm/h. The soil in the root zone was assumed to have a
porosity of 35%, a field capacity of 11% and initial volumetric soil moisture content of
5%.
Trial 2
Trial 2 was setup with two changes to help promote infiltration when compared to
Trial 1. All the runoff from the roof was routed to the yard. The infiltration rate for the

79
yard was set at 400 mm/h. This was thought to represent an approximation of a
predevelopment infiltration rate under natural forested conditions based on the results of
Chapter 3 of this thesis. It was assumed that during the construction process there had
been minimal compaction and that those areas that had been compacted were remediated
to the original infiltration rate. The percolation rate was also set at 400 mm/h while the
other soil properties were the same as in Trial 1.
Trial 3
For Trial 3 one change was made to the stormwater management on the lot from
Trial 1. A pervious driveway was used in place of the impervious driveway. The
driveway dimensions were the same as the driveway used in Trial 1 and it was assumed
that the infiltration rate on the surface of the driveway was 1000 mm/h. Previous research
found that infiltration rates on pervious pavement vary widely from 3 mm/h to more than
12000 mm/h. It was decided that 1000 mm/h would be a conservative value for a
pervious driveway as it is greater then the maximum rainfall intensity (274 mm/h) and
would therefore not limit the infiltration of rainwater into the base of the driveway.
Runoff would only be generated when the 16 cm subgrade made from a coarse gravel
with an assumed porosity of 45% was saturated. The percolation out of the subgrade was
set at 100 mm/h, which is the same as the percolation rate for the rest of the yard. To take
advantage of the water storage potential of the pervious driveway 50% of the runoff from
the roof was routed onto the driveway. The other 50% was routed onto the yard. All other
parameters in the model were the same as in Trial 1.
Trial 4
Trial 4 was used to test the effectiveness of installing an infiltration structure in the
yard. The infiltration structure simulated was a soakaway similar to the Atlantis System

80
described in Chapter 4 of this thesis that would be installed below the yard and not have
an influence on the hydrological processes in the yard. The effective volume of the
soakaway was set at 5 m3 with dimensions of 1 m deep, 2.5 m wide and 2 m long. This
volume would be sufficient to store a 25 mm rainfall event falling on the roof. All of the
roof runoff was routed to the soakaway. The values of Kh and Kv were set at 206 and 322
mm/h respectively. These values for Kh and Kv were measured during a scale experiment.
The remaining lot parameters were the same as Trial 1.
Trial 5
Trial 5 was set up with all of the lot level stormwater management practices. The
yard was assumed to be noncompacted and those areas that were compacted were
assumed to have been remediated so that the infiltration rate was 400 mm/h, which is an
approximation of the infiltration rates measured on the naturally forested lots. The
percolation rate was also set to 400 mm/h. The same pervious driveway was assumed as
in Trial 3 except that the percolation rate out of the subgrade was set at 400 mm/h, this
would be the case if the driveway were installed as described in chapter 4, Figure 4-1
with the subgrade being installed on noncompacted soil. The roof runoff was all assumed
to be routed to a soakaway as described in Trial 4.
Costs
Costs of lot level stormwater management BMPs is an important factor when
deciding on which BMPs should be implemented. The following is a brief analysis of the
approximate costs associated with each of the trials described above.
Trial 1 was assumed to be a standard lot level management practices and most of
the expenses associated with the management of stormwater from this lot are at the scale
of the development. This lot will therefore be the reference cost for all the other trials.

81
The cost to the construction crews and developers of avoiding on lot compaction is
difficult to quantify, it will therefore be assumed that it would not add any significant cost
to the lot development. The approximate cost of amending the soil with 2.5 cm of
compost to a depth of 10 cm (under typically sandy Florida conditions) would be $1.5 per
m2. Assuming that 50% of the yard needed to be amended the total cost of trail 2 would
be approximately $540. The cost of the soil preparation could be significantly higher if
the soil were to be amended to a greater depth. Researchers in Washington found that
amending soils to a depth of 20 cm cost between $6.60 and $8.25 per m2 (Chollak and
Rosenfeld 1998).
There are a number of different types of pervious pavement materials that can be
used for the driveway. The Uni-Eco Stone pavers described in this thesis are an example
of a pervious pavement. The total installed cost of this type of pavement was
approximately $63 per m2.The cost of the driveway in Trial 3 would therefore have been
approximately $5,040. A standard driveway would have had a cost approximately $20
per m2 (RSMeans 2004), which would result in the pervious driveway costing $3,440
more then a conventional driveway.
There are a number of methods for creating a soakaway. The costs associated with
these different methods vary. It was assumed that the Atlantis® Matrix® module system
was used to create the soakaway in trail 4. The costs associated with this system were
$164 per m3 of storage plus approximately $300 labor to install the system. The total cost
of the system used in trail 4 was therefore $1,120.
When all of these practices were combined as in Trial 5 the total cost would be the
sum of all the individual costs, which would be approximately $5,100. It must, however,

82
be remembered that the costs of these lot level BMPs would reduce the costs of
stormwater management at the subdivision or development scale as less stormwater
would have to be managed at this scale.
Results
Sensitivity analysis
The results of the sensitivity analysis can be seen in Figure 5-7. Figure 5-7a shows
the effect of changes to the potential infiltration rate (K). It can be seen that the model
was very sensitive to the K parameter. It appears as if the model was more sensitive to
changes in the lower range of the K values and that the model was more sensitive to
changes in K during event 4. Decreasing K by 90% resulted in a 150% increase in the
total lot runoff for event 1 and a 36% increase in runoff for event 4. Increasing K to 200
mm/h and 400mm/h resulted in no change to the total lot runoff for event 1, this was
because the maximum intensity of this storm (21 mm/h) was less than the K value. The
same increase in K resulted in a 41% and 63% decreases in runoff, when compared to the
base run, for event 4.
Figure 5-7b shows the sensitivity of the model to changes in the percentage of the
roof runoff routed to the soakaway. It can be seen that as more water was routed into the
soakaway, runoff from the lot was reduced. The model was more sensitive to this
parameter for event 1. Total lot runoff was reduced by 20%, 59% and 78%, compared to
the base run, for 25%, 75% and 100% of the roof being routed to the soakaway. The
model was less sensitive and runoff for event 4 was reduced by 7%, 11% and 12%. This
reduction in sensitivity of the model between the two rain events was due to the size of
the soakaway, a larger soakaway would have made the model more sensitive to this

83
parameter as the soakaway would have been able to store a greater percentage of the roof
runoff.
Figure 5-7c shows the sensitivity of the model to the change in the percentage of
the roof connected to the yard. From this plot it can be seen that the model was only
sensitive to this parameter for event 1 and was reduced by 20%, 59% and 78%, compared
to the base run, for 25%, 75% and 100% of the roof being routed to the yard. There was
no affect on runoff being generated for event 4. It should be noted that the reduction in
runoff was the same as that which occurred when the roof runoff was routed to the
soakaway. This similarity occurred because both the soakaway and yard were able to
store and infiltrate all of the runoff from the roof for the smaller rainfall event.
Figure 5-7d shows the sensitivity of the model to changes in Manning’s n for the
yard. It can be seen that the model was not very sensitive to changes in Manning’s n.
There was no affect on total lot runoff for event 1 when Manning’s n was changed and
for event 4 there was a 2% increase in runoff when Manning’s n was reduced by 76%.
Selecting the Manning’s n parameter was not critical to determining total lot runoff.
However, the n parameter could be more critical when analyzing the timing of the runoff.
Varying the antecedent soil moisture content had no affect on total runoff generated
by the lot. The lack of sensitivity to this parameter was most likely due to the model setup
that was used. The potential percolation rate out of the root zone was set equal to the soil
infiltration rate. This meant that a perched water table could not occur as the rate of water
entering the root zone would always be equal to or less than the rate of water percolating
out of the root zone. The available storage in the root zone therefore had no affect on the
generation of runoff.

84
If the percolation rate out of the root zone were lower than the infiltration rate, the
available water store in the root zone would effect the time it took for the perched water
table to rise to the soil surface, preventing infiltration from taking place and thus
increasing the runoff from the lot. The antecedent soil moisture content would be critical
when determining the potential water store in the root zone before the onset of the rain
event and would therefore be a sensitive parameter under these circumstances.
From this sensitivity analysis it was discovered that K is an important parameter
when setting up the model and the choice of the correct value for K could be the most
important parameter when trying to achieve accurate model results. The sensitivity of the
system to the K parameter suggests that increasing infiltration rates on the lot by reducing
compaction and amending the soil could be the most successful method for reducing
runoff and increasing infiltration.
The percentage of the roof runoff routed to the soakaway and driveway were also
important parameters that should be measured in the field. These parameters can be easily
manipulated on a lot by rerouting the guttering on the roof; this would have a positive
effect of decreasing runoff generation and increasing infiltration.
Trial 1
Figure 5-6a shows the cumulative runoff from the lot for Trial 1. Event 4 produced
the greatest response of 86.7 m3 despite it being the second largest rainfall event (Table
5-2). The initial high rainfall intensity of this event (a maximum 5 minute intensity of 274
mm/h) was the probable cause of this high runoff response. The maximum 5 minute
intensity of event 4 exceeded the infiltration rate of the compacted soil, runoff was
therefore generated on the yard as well as on the impervious surfaces. Total runoff
volumes of 2.9, 7.7, 9.9 and 18.5 m3 were generated for events 1, 2, 3 and 5 respectively

85
and show a trend of the smaller events generating less runoff. This shows that the
intensity of a rainfall event can sometimes be more important then the magnitude of the
event. Intensity should therefore be a factor that is taken into account when designing and
installing stormwater management practices at the lot scale.
Trial 2
Figure 5-6b shows the cumulative runoff from the lot for Trial 2. During this trial
Storm 4 produced the second highest runoff response of 7.2 m3. This is a substantially
lower than the response of Trial 1 to the same event (86.7 m3), which is a 92% reduction
compared to Trial 1 in total runoff generated on the lot. This substantial reduction in lot
runoff was due to the greater infiltration rates on the yard that allowed the soil profile to
infiltrate the initially high rainfall intensity associated with this event.
The practices used in this trial had positive reductions in runoff for the other events,
with a 53%, 60%, 51%, and 50% reduction, compared to Trial 1, in runoff generated for
storms 1, 2, 3 and 5 respectively.
In Trial 2, increasing yard infiltration and percolation rates and routing more runoff
from the roof to the yard was extremely effective at reducing the runoff from the lot and
thereby increasing the infiltration on the lot. To achieve this high infiltration rate on the
yard careful management of the construction site would be required to reduce soil
compaction, while the soils that had been compacted would need to be amended with
compost and a roto-tilled. This option would not be as costly as some of the other lot
level stormwater management practices. It must also be taken into consideration that this
practice does increase the chance of flooding on the lot. Care would therefore have to be
taken to ensure that any excess water on the yard would drain away from the house to
reduce the possibility of flooding of the house.

86
Trial 3
In Trial 3 the pervious driveway was successful at reducing the runoff for the
smaller events (Figure 5-6c). Events 1 and 3 produced no lot runoff, while event 2 and
event 5 were reduced by 86% and 51% compared to Trial 1, respectively. The runoff
from event 4 was only reduced by 17%. This low reduction in runoff was most likely due
to the yard producing 97% of the total lot runoff for this event. The runoff that was
generated on the yard was the result of the relatively low infiltration rates on the yard and
the initially high intensity of event 4. The reduction in runoff from the pervious driveway
was therefore negligible when compared to the runoff being generated on the yard.
The option of installing a pervious driveway seemed to be beneficial on lots where
the majority of the runoff would have been generated on impervious surfaces. This option
would be the second most expensive of the lot level stormwater management practices.
Trial 4
The total lot runoff for Trial 4 is shown in Figure 5-6d. The soakaway was able to
reduce the runoff by 48%, 55%, 50% and 49%, compared to Trial 1, for events 1, 2, 3 and
5, respectively. The use of the soakaway was therefore effective at reducing runoff and
increasing stormwater infiltration for these events. The soakaway was able to reduce the
runoff associated with event 4 by 12%, the reason for the poor performance of the
soakaway for this event was due to 76% of the runoff that was generated on the lot
originating on the yard and driveway, these sources of runoff were not routed to the
soakaway and could, therefore, not be stored and infiltrated on the soakaway. The
soakaway was also at its maximum capacity for a period during the simulation and excess
overflow was generated during this period. This overflow was routed directly off the lot

87
and contributed to the total lot runoff. There was no overflow from the soakaway for any
of the other rain events.
The soakaway seemed to be an effective method for reducing stormwater runoff, it
is moderately expensive, but has the advantage of being installed below the ground
surface and could therefore be installed in a small yard or under a driveway.
Trial 5
Trial 5 demonstrated the effectiveness of combining all the lot level stormwater
management practices. All these practices combined were effective at reducing the total
runoff from the lot. There was no runoff for events 1, 2, 3 and 5. Event 4 produced 14.3
m3 of runoff. The runoff produced during event 4 was the overflow from the soakaway
that was at maximum capacity for approximately 40 minutes during the storm event.
Most of the water routed into the soakaway during this time became runoff as it was
assumed that the overflow from the soakaway was connected to a main stormwater
network to reduce the chance of flooding. This runoff could have been avoided by
diverting only a portion of the stormwater generated on the roof into the soakaway or by
allowing the overflow from the soakaway to run onto the yard. These practices would
however result in an increase in the chance of flooding of the lot and were therefore not
included in the simulation. The cost of all of these practices combined ($10,320) would
be very high and may not be feasible.
Conclusions
The Lot Level Hydrological Model was developed to model the relative
effectiveness of lot level BMPs at reducing stormwater runoff and increasing infiltration
on the lot. Simulating the effectiveness of lot level stormwater management practices
with the Lot Level Hydrological Model demonstrated that these practices can reduce

88
runoff from a lot. Reducing the runoff response and increasing infiltration on the lot are
beneficial when managing stormwater at the development scale, as the size and cost of
conveyance and detention structures needed to manage stormwater can be reduced.
All of the stormwater management practices that were simulated were shown to be
successful at reducing the total lot runoff. Maintaining high infiltration rates on the yard
and routing stormwater onto the yard was shown to be the most successful of the BMPs
modeled and resulted in a total lot runoff reduction that varied from 50% to 92% when
compared to the standard stormwater management scenario. A pervious driveway was
shown to result in a total lot runoff reduction varying from 17% to 100% when compared
to standard stormwater management practices and a soakaway was shown to result in a
total lot runoff reduction that varied from 12% to 55% when compared to a standard
stormwater management scenario.
From these findings it can be concluded that stormwater runoff from a lot can be
reduced through the use of BMPs at the lot scale. The effectiveness of the runoff
reduction seems to depend on the type of BMP implemented and the rainfall
characteristics. When deciding on which practices to be implemented and how these
practices should be implemented on the lot, a number of factors besides the effectiveness
of the potential management system should also be taken into account. Some of these
factors include cost, available area, soil conditions and suitability of the BMPs to the
landscaping and site conditions.
Future development of the Lot Level Hydrological Model could include a more
physically based infiltration model such as Green & Ampt, which would result in more
accurate modeling of the infiltration processes. The addition of an ET and irrigation

89
component would allow for long-term simulations to be run. Conversion of the model to
a finite element type model would facilitate more detailed modeling of the lot and
increase the accuracy of the model. Software that is more flexible than Stella 7.0.3 would
have to be considered to allow the above improvements to be made to the model.
Collection of actual infiltration and runoff data at the lot level would also be vital to
improving future modeling efforts. This data could be used to calibrate the various
components of the model and to validate the overall functioning of the model.
Table 5-1. Rainfall events used as inputs for the Lot Level Hydrological Model
Rainfall Event Date Magnitude (mm) Duration (h) Max 5-min intensity
(mm/h) 1 9 Feb. ‘03 26 14 21 2 31 Dec. ‘02 50 9 84 3 15 Mar. ‘02 84 7 217 4 20 Jul. ‘02 124 4 274 5 31 Jul. ‘02 156 6 19 Table 5-2. Total lot runoff (m3) as predicted with the Lot Level Hydrological Model for
5 rainfall events and 5 trials
Event
Cost ($) 1 2 3 4 5
1 0 2.9 7.1 9.9 86.7 18.5 2 5,760 1.4 2.8 4.8 7.2 9.2 3 3,440 0.0 1.0 0.0 71.6 9.2 4 1,120 1.5 3.2 5.0 76.3 9.3
Tria
l
5 10,320 0.0 0.0 0.0 14.3 0.0

90
PavingRoof Yard
Volume paving
Volume on Roof
Volume Base
Volume IS Volume Root Zone
Volume yard
Runoff IS Infiltration Infiltration
IS -Exfiltration
Percolation Percolation
Ground water
Rainfall Rainfall Rainfall
Total Runoff
Runoff Runoff
Runoff yard
Runoff paving
IS -Overflow
PavingRoof Yard
Volume paving
Volume on Roof
Volume Base
Volume IS Volume Root Zone
Volume yard
Runoff IS Infiltration Infiltration
IS -Exfiltration
Percolation Percolation
Ground water
Rainfall Rainfall Rainfall
Total Runoff
Runoff Runoff
Runoff yard
Runoff paving
IS -Overflow
Figure 5-1. Forester diagram for the Lot Level Hydrological Model
d dp
Qin Qout
Qout
Figure 5-2. Conceptual Model of Flow Routing
Yard Driveway
Roof
Yard Driveway
Roof
Figure 5-3. Basic setup of the lot level hydrological model

91
0.0
5.0
10.0
15.0
20.0
0 5 10 15
Time (hours)
Five
min
rain
fall
dept
h (m
m)
0.0
5.0
10.0
15.0
20.0
0 5 10 15
Time (hours)
Five
min
rain
fall
dept
h (m
m)
0.0
5.0
10.0
15.0
20.0
0 5 10 15Time (hours)
Five
min
rain
fall
dept
h (m
m)
0.0
5.0
10.0
15.0
20.0
0 5 10 15Time (hours)
Five
min
rain
fall
dept
h (m
m)
0.0
5.0
10.0
15.0
20.0
0 5 10 15Time (hours)
Five
min
rain
fall
dept
h (m
m)
(a) Event 1 (b) Event 2
(c) Event 3 (d) Event 4
(e) Event 5
Figure 5-4. Five-minute rainfall hyetographs for the 5 rainfall events used as an input to
the lot-level hydrological model. A) Event 1. B) Event 2. C) Event 3. D) Event 4.
A B
C D
E

92
0
20
40
60
80
100
120
140
160
180
0 2 4 6 8 10 12 14
Time (hr)
Cum
mul
ativ
e R
ainf
all (
mm
)
Event 5
Event 4
Event 3
Event 2
Event 1
Figure 5-5. Rainfall events used as inputs for the lot-level hydrological model

93
0102030405060708090100
02
46
810
1214
16Ti
me
(hrs
)
Volume of Water (m3)
Even
t 4Ev
ent 5
Even
t 3Ev
ent 2
Even
t 1
0102030405060708090100
02
46
810
1214
16Ti
me
(min
)
Volume of Water (m3)
(a) T
rial 1
(b) T
rial 2
Even
t 4Ev
ent 5
Even
t 3Ev
ent 2
Even
t 1
0102030405060708090100
02
46
810
1214
16Ti
me
(min
)
Volume of Water (m3)
0102030405060708090100
02
46
810
1214
16Ti
me
(min
)
Volume of Water (m3)
(c) T
rial 3
(d) T
rial 4
Even
t 4Ev
ent 5
Even
t 3Ev
ent 2
Even
t 1
Even
t 4Ev
ent 5
Even
t 2
Fi
gure
5-6
. C
umul
ativ
e lo
t run
off s
imul
ated
by
the
lot-l
evel
hyd
rolo
gica
l mod
el. A
) Tria
l 1. B
) Tria
l 2. C
) Tria
l 3. D
) Tria
l 4.
A
B
C
D

94
020406080100
120
010
020
030
040
050
0K
(mm
/hr)
Volume of water (m3)
020406080100
120
020
4060
8010
0
Perc
ent o
f roo
f con
nect
ed to
soa
kaw
ay (%
)
Volume of water (m3)
020406080100
120
020
4060
8010
0Pe
rcen
t of r
oof c
onne
cted
to y
ard
(%)
Volume of water (m3)
020406080100
120
00.
10.
20.
30.
40.
50.
6M
anni
ng's
n on
the
yard
Volume of water (m3) Ev
ent 1
Even
t 4
(a)
(b)
(c)
(d)
Fi
gure
5-7
. Lo
t-lev
el h
ydro
logi
cal m
odel
sens
itivi
ty a
naly
ses.
Para
met
ers t
hat w
ere
anal
yzed
wer
e A
) Inf
iltra
tion
rate
(K).
B) P
erce
nt
of ro
of c
onne
cted
to so
akaw
ay. C
) Per
cent
of r
oof c
onne
cted
to th
e ya
rd. D
) Man
ning
’s n
on
the
yard
.
AB
C
D

95
CHAPTER 6 CONCLUSION
Managing stormwater at the scale of an urban residential lot is an alternative to
stormwater management at a larger scale. By increasing the infiltration of stormwater on
the lot, there will be an associated decrease in runoff and an increase in groundwater
recharge. This thesis examined a number of aspects of small-scale stormwater
management that are important if stormwater is to be managed at the lot scale.
Measuring soil infiltration rates was considered an important part of the research
into increasing on lot infiltration. There are a number of methodologies and techniques
that can be used to measure soil infiltration rates, some of these methodologies were
reviewed (Chapter 2). A field test of a number of different double-ring infiltrometer
methodologies were conducted and it was found that the use of a double-ring
infiltrometer with an inner and outer diameter of 15 and 30 cm respectively, combined
with a constant head type procedure would be a suitable methodology to measure
infiltration rates on the sandy soils commonly found in North Central Florida. This
methodology allows infiltrometer measurements to be made in locations where a larger
double-ring infiltrometer could not be used.
Soil compaction has been shown by numerous authors to have a negative affect on
infiltration rates. The change in infiltration rate, due to compaction on sandy soils in
North Central Florida, was measured during three compaction trials (Chapter 3). The
results of these three compaction trials showed that soil compaction resulted in a
significant decrease in infiltration rate. It was also found that there were no significant

96
differences between the various levels of soil compaction and that the magnitude of the
undisturbed infiltration rate did not seem to affect the compacted infiltration rate. This
would indicate that compaction is an important process that affects the infiltration rate of
sandy soils in North Central Florida. By taking precautions to reduce compaction on
urban lots, the high infiltration rates associated with undisturbed sandy soils could be
maintained. This would help increase the perviousness of lots and reduce runoff from
these lots. It should also be noted that it would be more effective to reduce compaction on
those areas of a lot with the highest undisturbed infiltration rate and to set aside those
areas with low infiltration rate for construction activities that may result in compaction.
Another important conclusion, regarding potential infiltration rate, is that because
the degree of compaction did not seem to have an affect on the magnitude of the final
infiltration rate, a soil could either be classified as compact or noncompact. This could
have a significant impact on hydrologic and stormwater modeling of urban areas, as
compaction is generally not taken into account when specifying a soils infiltration rate.
There are a number of practices that can be implemented at the lot level to help
promote stormwater infiltration. For two of these practices the effectiveness was
evaluated (Chapter 4) as a part of this thesis research. Infiltration rates on three pervious
pavements were measured and found to vary from 3 mm/h to greater than 12,000 mm/h.
The reason for this variability was thought to be due to different materials being used in
the construction of the pavements and different types of pavement design. It was,
therefore, concluded that the performance of the pervious pavement is dependent on the
design, installation and use of the pavement and that the effectiveness of a pervious
pavement at infiltrating stormwater will be dependent on these factors.

97
A soakaway that had been installed at the Madera model home was modeled using
a mathematical exfiltration model. The model was parameterized using measurements
from a small-scale soakaway installed near the site of the actual soakaway. A spreadsheet
was used to simulate the functioning of the actual soakaway during four years of recorded
rainfall data. The soakaway was shown to be an effective practice that could be used to
reduce stormwater runoff from a lot and increase the infiltration of stormwater on the lot.
The Lot Level Hydrological Model was developed to simulate the hydraulic and
hydrological processes occurring on an urban lot (Chapter 5). The model was used to
compare the effectiveness of a number of different lot level stormwater management
scenarios and BMPs for five measured rainfall events. Maintaining predevelopment
infiltration rates on the yard and routing stormwater to make use of these high infiltration
rates were shown to be the most effective methods of reducing runoff from the lot for the
condition modeled, with runoff being reduced between 50% and 92% depending on the
rain event. A pervious driveway and soakaway were also shown to be effective methods
of reducing runoff and increasing infiltration on the lot. The lot level BMPs that were
used in these simulations were shown to be effective methods of managing stormwater at
the lot level. Further development of the Lot Level Hydrological Model as discussed in
Chapter 5 combined with a detailed validation of the model would need to be conducted
to verify the results of these simulations.
Managing stormwater by promoting infiltration at the scale of an individual
residential lot seems to be effective. Detailed modeling and evaluations of the practices
discussed in this thesis needs to be undertaken to ensure the successful implementation of
lot level stormwater management in North Central Florida.

98
LIST OF REFERENCES
ASAE Standards. 2000. S313.3: Soil Cone Penetrometer. St. Joseph, Mich.: ASAE.
ASTM. 2002a. D698-00: Standard Test Methods for Laboratory Compaction Characteristics of Soil Using Standard Effort (12,400 ft-lbf/ft3 (600 kN-m/m3)). In Annual Book of ASTM Standards 04.08. West Conshohocken, Penn.: ASTM.
ASTM. 2002b. D2216-98: Standard Test Method for Laboratory Determination of Water (Moisture) Content of Soil and Rock by Mass. In Annual Book of ASTM Standards 04.08. West Conshohocken, Penn.: ASTM.
ASTM. 2002c. D2937-00: Standard Test Method for Density of Soil in Place by the Drive-Cylinder Method. In Annual Book of ASTM Standards 04.08. West Conshohocken, Penn.: ASTM.
ASTM. 2003. D3385-03 Standard Test Method for Infiltration Rate of Soils in Field Using Double-Ring Infiltrometer. In Annual Book of ASTM Standards 04.08. West Conshohocken, Penn.: ASTM.
Avellaneda, E. 1984. Infiltration through roadside swales. MS thesis. Orlando, Florida: University of Central Florida, College of Engineering.
Blake, G. R., and J. H. Hartge. 1986. Bulk Density. In Methods of Soil Analysis, Part I, ASA Monograph 9: 363-375. A. Klute ed. Madison, Wisc.: ASA.
Bouwer, H. 1961. A study of infiltration rates from cylindrical infiltrometers and irrigation furrows with an electrical resistance network. Trans. Int. Congr. Soil Sci. 7(6): 448-456.
Bouwer, H. 1986. Intake rate: cylinder infiltrometer. In Methods of Soil Analysis, Part I, ASA Monograph 9: 825-843. A. Klute ed. Madison, Wisc.: ASA.
Cao, S. L., D. Poduska, and D. G. Zollinger. 1998. Drainage Design and Performance Guidelines for UNI Eco-Stone® Permeable Pavement. College Station, Texas: Texas A&M University, Department of Civil Engineering.
Carmon, N., U. Shamir, and S. Meiron-Pistiner. 1997. Water-sensitive urban planning: protecting groundwater. J. Environ. Planning Management 40(4): 413-434.

99
Chocat, B., J. Bardin, and A. Gautier. 1997. Filtration devices for urban drainage: a 50-year experience in Lyons. In Sustaining urban water resources in the 21st century, 181-195. eds. A. Cahrles Rowney, P. Stahre, and L. A. Roesner. Reston, Va.: ASCE.
Chollak, T., and P. Rosenfeld. 1998. Guidelines for landscaping with compost amended soils. Seattle, Washington: University of Washington, College of Forest Resources.
Chow, V., D. Maidment, and L. Mays. 1988. Applied Hydrology. New York, N.Y.: McGraw-Hill, inc.
Chu, S. T. 1979. Infiltration during an unsteady rain. Water Resources Res. 14(3): 461-466.
Davies, A. P., Shokouhian, M., Sharma, and H., Minami. 2001. Laboratory Study of Biological Retention (Bioretention) for Urban Stormwater Management. Water Environ. Res. 73(1): 5-14.
Deletic, A. 2001. Modelling of water and sediment transport over grassed areas. J. Hydrol. (Amsterdam) 248: 168-182.
Dickerson. B. P. 1976. Soil compaction after tree-length skidding in Northern Mississippi. Soil Sci. Soc. Am. J. 40: 965-966.
Duchene, M., E. McBean, and N. Thomson. 1994. Modeling of infiltration from trenches for storm-water control. Journal of Water Resources Planning and Management 120 (3): 276-293.
FAWN. 2004. Florida Automated Weather Network. Gainesville, Fla.: University of Florida, IFAS Extension. Available at: http://fawn.ifas.ufl.edu. Accessed 10 June 2004.
Felton, P. M., and H. W. Lull. 1963. Suburban hydrology can improve watershed conditions. Public Works 94: 93-94.
Ferguson, B. K. 1994. Stormwater Infiltration. Boca Raton, Fla., CRC Press, Inc.
Florida Department of Transportation. 2003. Drainage Manual. Tallahassee, Fla.: Office of Design, Drainage Section.
Fujita, S. 1997. Measures to promote stormwater infiltration. Water Sci. Technol. 36 (8/9): 289-193.
Gardner, W. H. 1986. Water content. Methods of Soil Analysis. Part I, ASA Monograph 9: 493-544. Madison, Wisc.: ASA
Gee, G.W., and J.W. Bauder. 1986. Particle size analysis. Methods of Soil Analysis. Part I, ASA Monograph 9: 383-411. Madison, Wisc.: ASA.

100
Gent, J. A., R. Ballard, A. E. Hassan, and D. K. Cassel. 1984. Impact of harvesting and site preparation on physical properties of Piedmont forest soils. Soil Sci. Soc. Am. J. 48: 173-177.
Hakansson, I., and H. Petelkau. 1994. Benefits of limited axle load. In Soil Compaction in Crop Production eds. Soane, B. D., and C. van Ouwerkerk: 479-500. Amsterdam, Netherlands: Elsevier Science B. V.
Hamilton, G. W., and D. V. Waddington. 1999. Infiltration rates on residential lawns in central Pennsylvania. J. Soil Water Conserv. 1999 (Third Quarter): 564-568.
Heaney, J., L. Wright, and D. Sample. 2000. Stormwater storage- treatment-reuse system. In Innovative Urban Wet-Weather Flow Management Systems, eds. R. Field, J. P. Heaney, and R. Pitt: 301-328. Lancaster, Penn.: Technomic Publishing Company, Inc.
Holman-Dodds, J. K., A. A. Bradley, and K. W. Potter. 2003. Evaluation of hydrologic benefits of infiltration based urban storm water management. J. Am. Water Resources Assoc. 39(1): 205-215.
Horton, R., M. D. Ankeny, and R. R. Allmaras. 1994. Effects of compaction on soil hydraulic properties. In Soil Compaction in Crop production, eds. Soane, B. D. and C. van Ouwerkerk: 479-500. Amsterdam, Netherlands: Elsevier Science B. V.
HPS. 2002. Stella. Ver. 7.0.3 Hanover, N.H.: High Performance Systems, Inc.
Hunt, W. F., A. R. Jarrett, and J. T. Smith, 2003. Field study of bioretention areas in North Carolina. ASAE Paper No. 032302. St. Joseph, Mich.: ASAE.
Johnson, C. E., and A. C. Bailey. 2002. Soil compaction. In Advances in Soil Dynamics Volume 2: 155-178. St. Joseph, Mich.: ASAE.
Kays, B. L. 1980. Relationship of forest destruction and soil disturbance to increased flooding in the suburban North Carolina Piedmont. Metropolitan Tree Improvement Alliance Proc. 3:118-1125. June 18-20, 1980, Rutgers, N.J.
Kelling, K., and A. Peterson. 1975. Urban lawn infiltration rates and fertilizer runoff losses under simulated rainfall. Soil Sci. Soc. Am. Proc. 39: 348-352.
Konrad, C. P. 1995. An examination of stormwater detention and infiltration at the scale of an individual residence in the Sammamish plateau region of King County, WA. MS thesis. Seattle, Wash.: University of Washington, Departmnet of Civil Engineering.
Kronaveter, L., U. Shamir, and A. Kesseler. 2001. Water sensitive urban planning: modeling on-site infiltration. Journal of Water Resources Planning and Management 127(2): 78-88.

101
Lal, R., and D. M. Vandoren. 1990. Influence of 25 years of continuous corn production by three tillage methods on water infiltration for two soils in Ohio. Soil and Tillage Research 16: 71-84.
Li, Y., J. N. Tullberg, and D. M. Freebairn. 2001. Traffic and Residue Cover Effects on Infiltration. Aust. J. Soil Res. 39: 239-247.
Lindstom, M. J., and W. B. Voorhees. 1994. Response of temperate crops in North America to soil compaction. In Soil Compaction in Crop Production, eds. B. D. Soane, and C. van Ouwerkerk: 265-286. Amsterdam, Netherlands: Elsevier Science B. V.
Maheshwari, B. L. 1996. Development of an automated double ring infiltrometer. Aust. J. Soil Res. 34: 709-714.
Mays, L. W. 1999. Hydraulic Design Handbook. New York, N.Y.: McGraw-Hill, inc.
NRCS. 2000. Urban soil compaction. Urban Technical Note No. 2. Auburn, Alabama: United States Department of Agriculture, Natural Resources Conservation Service, Soil Quality Institute.
Philip, J. R. 1957. The theory of infiltration: 4. Sorptivity and algebraic infiltration equation. Soil Sci. 84: 257-264.
Pitt, R., R. Harrison, C. Henry, D. Xue, and T. O’Conner. 1999. Infiltration through disturbed urban soils and compost-amended soil effects on runoff quality and quantity. Document no. EPA/600/R-00/016. Washington D.C.: United States Environmental Protection Agency, Office of Research and Development.
Pratt, C. J. 1997. Design guidelines for porous/permeable pavements. Sustaining urban water resources in the 21st century , eds. A. Cahrles Rowney, P. Stahre, and L. A. Roesner, 196-211. Reston, Va.: ASCE.
Pratt, C. J., J. D. Mantle, and P. A. Schofield. 1989. Urban stormwater reduction and quality improvement through the use of permeable pavements. Water Sci. Technol. 21: 769-778.
Prince George’s County, Maryland. 1999. Low Impact Development Design Strategies, an Integrated Design Approach. Largo, Md.: Prince George’s County, Maryland Department of Environmental Resource Programs and Planning Division.
Prince George’s County, Department of Environmental Resources, 2000a. Low Impact Development Design Manual. Prince George’s County, Md.: Department of Environmental Resources.
Prince George’s County, Department of Environmental Resources, 2000b. Low Impact Development Hydrological Analysis. Prince George’s County, Md.: Department of Environmental Resources.

102
Ragab, R., J. Bromley, P. Rosier, J. D. Cooper, and J. H. C. Gash. 2003a. Experimental study of water fluxes in a residential area: 1. Rainfall, roof runoff and evaporation: The effect of slop and aspect. Hydrological Processes 17: 2409 – 2422.
Ragab, R., J. Bromley, P. Rosier, J. D. Cooper, and J. H. C. Gash. 2003b. Experimental study of water fluxes in a residential area: 2. Road infiltration, runoff and evaporation. Hydrological Processes 17: 2423 – 2437.
Randrup, T., and K. Dralle. 1997. Influence of planning and design on soil compaction in construction sites. Landscape and Urban Planning 38: 87-92.
Richard, G., I. Cousin, J. F. Sillon, A. Bruand, and J. Gue´rif. 2001. Effect of compaction on soil porosity: consequences on hydraulic properties. European J. Soil Science 52: 49–58.
Ros, M., and C. Garcia. 2001. The use of organic wastes in the control of erosion in a semiarid Mediterranean soil. Soil Use and Management 17(4): 292-293.
Rosted Petersen, C., P. Jacobsen, and P. Mikkelsen. 1994. Design of stormwater infiltration for reduction of combined sewer overflow. Water Sci. Technol. 30(1): 53-61.
RSMeans. 2004. Building Construction Cost Data, 62nd Annual Edition. Kingston, Mass.: R. S. Means.
SAS. 2001. SAS User's Guide: Statistics. Ver. 8.02. Cary, N.C.: SAS Institute, Inc.
SPSS. 2001. SigmaPlot for Windows. Ver. 7.1.1 Chicago, Ill.: SPSS, Inc.
Sheridan, G. J. 2003. A comparison of rubber-tyred and steel-tracked skidders on forest soil physical properties. Aust. J. Soil Res. 43: 1063-1075.
Soane, B. D., and C. van Ouwerkerk. 1995. Implications of soil compaction in crop production for the quality of the environment. Soil Tillage Res. 35: 5-22.
Soil Survey Staff. 1975. Soil taxonomy: A basic system of sol classification for making and interpreting soil surveys. USDA-SCS Agric. Handb. 436. Washington, D.C.: U.S. Government Printing Office.
Sorvig, K. 1993. Porous Paving. Landscape Architecture. 83(2): 66-69.
Strecker, E. W. 2001. Low Impact Development (LID): How Low Development Is It? Water Resources IMPACT 3: 10-15.
Tricker, A. S. 1978. The infiltration cylinder: some comments on its use. J. Hydrol. (Amsterdam) 36: 383-391.

103
U.S. Census Bureau, 2001. United States: Population, percent change, 1990 to 2000. State and County Quick Facts. Washington D.C.: U.S. Census Bureau. Available at: http://quickfacts.census.gov/qfd/rankings/PL0120000r.html. Accessed 12 June 2004.
U.S. Census Bureau. 2004. U.S. New privately owned housing units authorized by state: 2003. Manufacturing, Mining and Construction Statistics. Washington D.C.: U.S. Census Bureau. Available at: http://www.census.gov/const/www/03statepiechart.pdf. Accessed 12 June 2004.
USDA. 1985. Soil Survey of Alachua County, Florida. Washington, D.C.: The United States Department of Agriculture, Soil Conservation Services.
USDA. 2003. Rainfall Intensity Summation Tool. Ver. 2.1. Oxford, Miss.: National Sedimentation Laboratory, United States Department of Agriculture, Agricultural Research Services.
Warnaars, E., A. Veldt Larsen, P. Jacobsen, and P. Mikkelsen. 1999. Hydraulic behaviour of stormwater infiltration trenches in a central urban area during 2 ¾ years of operation. Water Sci. Technol. 39(2): 217-224.
Weltz, M. A., A. B. Arslan, and L. J. Lane. 1992. Hydraulic Roughness Coefficients for Native Rangelands. Journal of Irrigation and Drainage Engineering 118(5): 776 – 789.
Wu, L., L. Pan, M. Robertson, and P. Shouse. 1997. Numerical evaluation of ring-infiltrometers under various soil conditions. Soil Sci. 162(11): 771-777.

104
BIOGRAPHICAL SKETCH
Justin Haig Gregory was born on May 6, 1979, in Pietermaritzburg, South Africa.
He matriculated from Alexandra High School in 1997, and enrolled at University of Natal
in 1998, where he received a Bachelor of Science degree in Agricultural Engineering in
2002. In summer of 2003, he accepted a graduate assistantship position in the
Agricultural and Biological Engineering Department at the University of Florida, and
began studying toward a Master of Engineering degree under the guidance of Dr. Michael
Dukes (in the Land and Water Resources specialization).