Storms and Flooding in California in December … · Storms and Flooding in California in December...
14
U.S. Geological Survey U.S. Department of the Interior Storms and Flooding in California in December 2005 and January 2006– a Preliminary Assessment Open-File Report 2006–1182
Transcript of Storms and Flooding in California in December … · Storms and Flooding in California in December...

U.S. Geological SurveyU.S. Department of the Interior
Storms and Flooding in California in December 2005 and January 2006–a Preliminary Assessment
Open-File Report 2006–1182

Inside front cover.

Storms and Flooding in California in December 2005 and January 2006—A Preliminary Assessment
By Charles Parrett and Richard A. Hunrichs
Open-File Report Series 2006–1182
U.S. Department of the InteriorU.S. Geological Survey

U.S. Department of the InteriorDirk Kempthorne, Secretary
U.S. Geological SurveyP. Patrick Leahy, Acting Director
U.S. Geological Survey, Reston, Virginia: 2006
For sale by U.S. Geological Survey, Information Services
Box 25286, Denver Federal Center Denver, CO 80225
For more information about the USGS and its products: Telephone: 1-888-ASK-USGS World Wide Web: http://www.usgs.gov/
Any use of trade, product, or firm names in this publication is for descriptive purposes only and does not imply endorsement by the U.S. Government.
Although this report is in the public domain, permission must be secured from the individual copyright owners to reproduce any copyrighted materials contained within this report.
Suggested referenceParrett, Charles, and Hunrichs, R.A., 2006, Storms and flooding in California in December 2005 and January 2006—A preliminary assessment: U.S. Geological Survey Open-File Report 2006–1182, 8 p.

Contents
Abstract ……………………………………………………………………………………… 1Introduction ………………………………………………………………………………… 1Summary of Major Storms …………………………………………………………………… 1Summary of Flooding ………………………………………………………………………… 2References Cited ……………………………………………………………………………… 8
FiguresFigure 1. Map showing rainfall over California and Nevada for (A) December 28, 2005,
(B) December 31, 2005, and (C) January 2, 2006 …………………………………… 2Figure 2. Map showing location of selected streamflow-gaging stations, precipitation
stations, and in recurrence interval ranges for peak discharges in California, December 2005 and January 2006 ………………………………………………… 5
Figure 3. Graph showing recorded annual peak discharges for the streamflow-gaging station at the Napa River at Napa, California ……………………………………… 6
Figure 4. Photograph showing flooding from the Russian River along Highway 101 near Hopland, California, December 31, 2005 …………………………………………… 7
Figure 5. Photograph showing streamflow on the South Yuba River passing under old Highway 29 Bridge, California, December 31, 2005 ………………………………… 8
TablesTable 1. Precipitation at selected precipitation stations in California, December 24, 2005,
through January 3, 2006 …………………………………………………………… 2Table 2. Peak discharge data for selected U.S. Geological Survey streamflow-gaging
stations in California ………………………………………………………………… 3
iii

Conversion Factors
Inch/Pound to SI
Multiply By To obtain
Lengthinch (in.) 2.54 centimeter (cm)
inch (in.) 25.4 millimeter (mm)
foot (ft) 0.3048 meter (m)
mile (mi) 1.609 kilometer (km)
Areasquare mile (mi2) 259.0 hectare (ha)
square mile (mi2) 2.590 square kilometer (km2)
Volumecubic foot (ft3) 28.32 cubic decimeter (dm3)
cubic foot (ft3) 0.02832 cubic meter (m3)
Flow ratecubic foot per second (ft3/s) 0.02832 cubic meter per second (m3/s)
SI to Inch/Pound
Multiply By To obtain
Lengthcentimeter (cm) 0.3937 inch (in.)
millimeter (mm) 0.03937 inch (in.)
meter (m) 3.281 foot (ft)
kilometer (km) 0.6214 mile (mi)
Areahectare (ha) 0.003861 square mile (mi2)
square kilometer (km2) 0.3861 square mile (mi2)
Volumecubic decimeter (dm3) 0.03531 cubic foot (ft3)
cubic meter (m3) 35.31 cubic foot (ft3)
Flow ratecubic meter per second (m3/s) 35.31 cubic foot per second (ft3/s)
Water year: The 12-month period October 1 through September 30. It is designated by the calendar year in which it ends.
NOTE TO USGS USERS: Use of hectare (ha) as an alternative name for square hectometer (hm2) is restricted to the measurement of small land or water areas.
Acronyms used in this report:USGS U.S. Geological Survey
FEMA Federal Emergency Management Agency
iv

AbstractA series of storms beginning before Christmas 2005 and
ending after New Year’s Day 2006 produced significant runoff over much of northern California. The storms resulted in an estimated $300 million in damages and Federal disaster dec-larations in 10 counties. Several precipitation stations in the Sierra Nevada had precipitation totals greater than 20 inches for the period December 24 through January 3, and several stations in the Coastal Range had precipitation totals greater than 18 inches. The peak stream discharges resulting from the storms in the north coast area generally had recurrence intervals in the 10- to 25-year range, although the recurrence interval for peak discharge at one station on Sonoma Creek near Agua Caliente was greater than 100 years. In the San Francisco Bay area, peak discharges also generally had recur-rence intervals in the 10- to 25-year range. Further south along the central coast and in southern California, peak discharges had smaller recurrence intervals, in the 2- to 5-year range. Upper Sacramento River tributaries draining from the west had peak flows with recurrence intervals in the 2- to 5-year range, whereas upper tributaries draining from the east side had recurrence intervals in the 5- to 10-year range. Further south, Sacramento River tributaries such as the Yuba and American Rivers had peak discharges with recurrence intervals in the 10- to 25-year range. On the east side of the central Sierra around Lake Tahoe, peak discharges had recurrence intervals in the 10- to 25-year range. Further south in the Sierra, streams draining into the San Joaquin River Basin had flows with recurrence intervals ranging from 2 to 5 years.
Introduction A series of storms beginning before Christmas 2005 and
ending after New Year’s Day 2006 produced significant runoff over much of northern California, including the north coast and the Sierra Nevada. There were localized evacuations and flooding, some slope failures, and road closures. An estimated $300 million in damages were attributed to the storms (Cali-fornia Office of Emergency Services, 2006). Ten counties sub-sequently were declared Federal disaster areas: Contra Costa, Del Norte, Lake, Marin, Mendocino, Napa, Sacramento,
Siskiyou, Solano, and Sonoma (Federal Emergency Manage-ment Agency, 2006). Major flood damages were concentrated primarily in the Napa and Russian River Basins in Napa and Sonoma Counties.
The flooding was widely compared by the media to the floods of 1986 and 1997, although the stream discharges generally were significantly smaller than those of the earlier floods. A storm on January 1 had been predicted to cause problems in southern California also; however, that storm did not develop as predicted. Nevertheless, the storm did manage to rain on the Rose parade for the first time in 51 years.
Summary of Major StormsOn the basis of provisional data obtained from the
National Weather Service, California–Nevada River Forecast Center (2006), storm totals recorded by automated rainfall recorders at several precipitation stations on the western slopes of the Sierra Nevada during the December 24–January 3 period were greater than 20 inches. In addition, recorders at several stations at the headwaters of the Russian and Napa River Basins in the Coast Range had storm totals greater than 18 inches. Storm totals at two selected stations in the Coast Range (Willits Howard RS and Venado) and at two selected stations in the Sierra Nevada (Brush Creek and Girard) are presented in table 1.
The 3 days of the 7-day period with the most intense precipitation were December 28, December 31, and January 2. Daily precipitation totals were for a 24-hour period 4:00 a.m. to 4:00 a.m. Precipitation was as much as 4.68 inches on December 28 at the Willits Howard RS station. On Decem-ber 31, the day of most intense rainfall over most of northern California, more than 5 inches were recorded at all sites, and the Venado and Willits Howard RS stations recorded 6.81 and 7.12 inches, respectively. Although rainfall intensity on Janu-ary 2 generally was less than on December 28 and December 31, as much as 3.84 inches was recorded at Venado. Figure 1 shows the areal distribution and amounts of daily rainfall throughout northern California on December 28, 31, and January 2.
Storms and Flooding in California in December 2005 and January 2006—A Preliminary Assessment
By Charles Parrett and Richard A. Hunrichs

Summary of FloodingUnusually warm storms produced more runoff from
higher elevations than normal for December and January. Because the accumulated snow pack had been rather light, snowmelt did not significantly increase runoff. Previous large floods in northern California, including the most recent in 1986 and 1997, had significant runoff from snowmelt as well as from large storms (Hunrichs and others, 1998; U.S. Geo-logical Survey, 1989).
Table 2 shows recorded peak discharges, gage heights, and computed recurrence intervals associated with the peak discharges at selected USGS streamflow-gaging stations. The peak discharges of record at the sites are also shown. The peak-discharge data are from near-real time stations, and the data are provisional and may change based on further review. As indicated by table 2, five sites, with periods of recorded data ranging from 24 to 64 years, had peaks of record (rank 1) on December 31, 2005. Figure 2 shows the locations of the streamflow-gaging stations and the recurrence intervals for the December–January peak discharges and the locations of 4 selected precipitation stations.
Precipitation stationTotal precipitation for
December 24–January 3 (inches)
Precipitation for 24-hour period (inches)
12/28/06 12/31/06 01/02/06
Sierra NevadaBrush Creek 22.05 2.75 6.81 2.56Girad 20.08 3.84 5.04 2.32
Coast RangeVenado 29.60 4.24 6.88 3.84Willits Howard RS 18.48 4.68 7.12 0.96
Table 1. Precipitation at selected precipitation stations in California, December 24, 2005, through January 3, 2006.
[24-hour period begins at 4:00 a.m.]
Map color indicates precipitation, in inches, as indicated by the color shade bar scale below. Gray shades indicate ‘no data’.
A B C
Figure 1. Rainfall over California and Nevada for (A) December 28, 2005, (B) December 31, 2005, and (C) January 2, 2006. (From National Weather Service, California–Nevada River Forest Center, 2006)
2 Storms and Flooding in California in December 2005 and January 2006—A Preliminary Assessment

Stat
ion
num
ber
Stat
ion
nam
eD
rain
age
area
(m
i2 )
Floo
ding
of
Dec
embe
r–Ja
nuar
yPe
ak
disc
harg
e (f
t3 /s)
Gag
e he
ight
(f
t)
Recc
urre
nce
inte
rval
(y
ears
)Ra
nkYe
ars
of
reco
rd
His
tori
c al
flood
ing
Year
Dat
e of
pea
k di
scha
rge
Max
imum
pe
ak (f
t3 /s)
1030
8200
Eas
t for
k C
arso
n R
iver
bel
ow M
arkl
eevi
lle C
reek
ne
ar M
arkl
eevi
lle
276
12/3
1/20
0519
,300
11.8
125
–50
144
18,9
0019
97
1031
0000
Wes
t for
k C
arso
n R
iver
at W
oodf
ords
65.4
12/3
1/20
053,
010
14.3
610
–25
889
8,10
019
9710
3366
60B
lack
woo
d C
reek
nea
r Ta
hoe
City
11.2
12/3
1/20
052,
260
7.43
10–2
52
442,
940
1997
1033
6676
War
d C
reek
at H
wy
89 n
ear
Taho
e Pi
nes
9.7
12/3
1/20
051,
660
8.44
10–2
53
322,
530
1997
1033
6780
Tro
ut C
reek
nea
r Ta
hoe
Val
ley
LIF
36.7
12/3
1/20
0562
39.
725
–50
143
535
1963
1033
8000
Tru
ckee
Riv
er n
ear
Tru
ckee
55
312
/31/
2005
6,03
06.
9710
–25
535
11,9
0019
9710
3460
00T
ruck
ee R
iver
at F
arad
932
12/3
1/20
0510
,100
10.7
710
–25
910
517
,500
1950
1109
8000
Arr
oyo
Seco
nea
r Pa
sade
na16
1/2/
2006
1,12
04.
582–
526
908,
620
1938
1111
1300
Sesp
e C
reek
nea
r Fi
lllm
ore
251
1/2/
2006
20,8
0016
.52–
519
6673
,000
1998
1114
3250
Car
mel
Riv
er n
ear
Car
mel
247
12/3
1/20
053,
010
10.5
5<
221
3916
,000
1995
1114
7500
Salin
as R
iver
at P
aso
Rob
les
390
1/2/
2006
6,95
011
.84
2–5
2259
28,4
0019
9511
1520
00A
rroy
o Se
co n
ear
Sole
dad
244
12/3
1/20
0512
,900
10.9
52–
528
9928
,300
1958
1115
9000
Paja
ro R
iver
at C
hitte
nden
1,18
61/
3/20
065,
030
19.2
52–
528
6525
,100
1998
1116
1000
San
Lor
enzo
Riv
er a
t San
ta C
ruz
115
12/3
1/20
0513
,900
21.5
55–
105
2530
,400
1955
1116
2500
Pesd
ero
Cre
ek n
ear
Pesd
ero
45.9
12/3
1/20
056,
000
15.9
55–
108
5310
,600
1998
1116
4500
San
Fran
cisq
uito
Cre
ek a
t Sta
nfor
d
Uni
vers
ity37
.412
/31/
2005
4,84
010
.35
10–2
54
647,
220
1998
1116
9500
Sara
toga
Cre
ek a
t Sar
atog
a9.
2212
/31/
2005
1,12
06.
315–
1014
712,
730
1955
1118
9500
Sout
h fo
rk K
ern
Riv
er n
ear
Ony
x53
01/
2/20
061,
600
7.54
2–5
2371
28,7
0019
6611
1199
40 M
aria
Ygn
acio
Cre
ek a
t Uni
vers
ity D
rive
nea
r G
olet
a6.
41/
2/20
0629
92.
95<
223
332,
500
1992
1126
6500
Mer
ced
Riv
er a
t Poh
ono
Bri
dge
near
Yos
emite
321
12/3
1/20
0510
,200
12.5
45–
1010
8824
,600
1997
1133
5000
Cos
umne
s R
iver
at M
ichi
gan
Bar
536
12/3
1/20
0535
,100
13.6
810
–25
898
93,0
0019
9711
3365
80M
orri
son
Cre
ek n
ear
Sacr
amen
to53
.412
/31/
2005
2,42
09.
6710
–25
335
2,73
019
8611
3455
00So
uth
fork
Pit
Riv
er n
ear
Lik
ely
247
12/3
1/20
0577
24.
695–
109
731,
620
1971
1137
2000
Cle
ar C
reek
nea
r Ig
o22
812
/30/
2005
4,40
08
2–5
3364
24,5
0019
5511
3771
00Sa
cram
ento
Riv
er a
bove
Ben
d B
ridg
e ne
ar
Red
Blu
ff8,
900
12/3
1/20
0511
8,00
030
.09
<2
4012
329
1,00
019
40
1137
9500
Eld
er C
reek
nea
r Pa
sken
ta92
.412
/30/
2005
7,65
010
.93
2–5
1556
17,7
0019
83
Tabl
e 2.
Pe
ak d
isch
arge
dat
a fo
r sel
ecte
d U.
S. G
eolo
gica
l Sur
vey
stre
amflo
w-g
agin
g st
atio
ns in
Cal
iforn
ia.
[Ran
k, p
ositi
on o
f th
e D
ecem
ber-
Janu
ary
peak
dis
char
ge in
a r
anke
d, f
rom
larg
est t
o sm
alle
st, l
ist o
f al
l rec
orde
d an
nual
pea
k di
scha
rges
for
the
peri
od o
f re
cord
. mi2 ,
squa
re m
ile; f
t3 /s,
cub
ic f
oot p
er
seco
nd; f
t, fo
ot. <
, les
s th
an th
e ac
tual
val
ue s
how
n; >
act
ual v
alue
is g
reat
er th
an v
alue
sho
wn]
Summary of Flooding 3

Stat
ion
num
ber
Stat
ion
nam
eD
rain
age
area
(m
i2 )
Floo
ding
of
Dec
embe
r–Ja
nuar
yPe
ak
disc
harg
e (f
t3 /s)
Gag
e he
ight
(f
t)
Recc
urre
nce
inte
rval
(y
ears
)Ra
nkYe
ars
of
reco
rd
His
tori
c al
flood
ing
Year
Dat
e of
pea
k di
scha
rge
Max
imum
pe
ak (f
t3 /s)
1138
3500
Dee
r C
reek
nea
r V
ina
208
12/3
1/20
0510
,300
11.1
55–
1016
8824
,000
1997
1139
0000
But
te C
reek
nea
r C
hico
147
12/3
1/20
0513
,800
9.41
5–10
874
35,6
0019
9711
4130
00N
orth
Yub
a R
iver
bel
ow G
oody
ears
Bar
250
12/3
1/20
0527
,200
19.5
710
–25
674
45,5
0019
9711
4255
00Sa
cram
ento
Riv
er a
t Ver
ona
21,2
511/
3/20
0685
,600
38.7
210
–25
375
94,0
0019
9711
4270
00N
orth
for
k A
mer
ican
Riv
er a
t Nor
th F
ork
Dam
342
12/3
1/20
0551
,600
10.4
810
–25
563
65,4
0019
6411
4473
60A
rcad
e C
reek
nea
r D
el P
aso
Hei
ghts
31
.412
/31/
2005
3,51
015
.88
10–2
51
243,
320
1998
1145
6000
Nap
a R
iver
nea
r St
Hel
ena
78.8
12/3
1/20
0518
,000
21.6
125
–50
164
16,9
0019
8611
4580
00N
apa
Riv
er n
ear
Nap
a21
812
/31/
2005
29,6
0029
.85
10–2
53
4837
,100
1986
1145
8500
Sono
ma
Cre
ek a
t Agu
a L
ient
e58
.412
/31/
2005
17,6
0032
.51
>10
01
298,
880
1955
1146
3000
Rus
sian
Riv
er n
ear
Clo
verd
ale
503
12/3
1/20
0550
,700
26.2
25–5
04
5355
,200
1964
1146
7000
Rus
sian
Riv
er n
ear
Gue
rnev
ille
1,33
81/
1/20
0685
,800
44.2
110
–25
665
102,
000
1986
1146
8000
Nav
arro
Riv
er n
ear
Nav
arro
303
12/3
1/20
0555
,700
39.8
110
–25
354
64,5
0019
5511
4685
00N
oyo
Riv
er n
ear
Fort
Bra
gg10
612
/31/
2005
13,7
0025
.09
5–10
853
26,6
0019
7411
4755
60E
lder
Cre
ek n
ear
Bra
nsco
mb
6.5
12/3
1/20
051,
040
7.49
2–5
1038
3,66
019
6411
4765
00So
uth
fork
Eel
Riv
er n
ear
Mir
anda
537
12/2
8/20
0588
,400
32.5
95–
1012
6419
9,00
019
6411
4770
00E
el R
iver
at S
cotia
3,
113
12/3
1/20
0532
8,00
052
.71
5–10
1093
752,
000
1964
1148
1000
Mad
Riv
er n
ear
Arc
ata
485
12/3
0/20
0547
,300
22.7
25–
1010
5781
,000
1964
1147
3900
Mid
dle
fork
Eel
Riv
er n
ear
Dos
Rio
s 74
512
/30/
2005
94,7
0026
.52
10–2
52
3913
5,00
019
9711
5175
00Sh
asta
Riv
er n
ear
Yre
ka79
312
/30/
2005
9,32
011
.59
25–5
03
6921
,500
1964
1152
3000
Kla
mat
h R
iver
at O
rlea
ns8,
475
12/3
0/20
0521
6,00
034
.810
–25
577
307,
000
1964
1153
0000
Tri
nity
Riv
er a
t Hoo
pa
2,85
312
/31/
2005
108,
000
40.6
85–
1010
7823
1,00
019
6411
5305
00K
lam
ath
Riv
er n
ear
Kla
mat
h12
,100
12/3
1/20
0541
6,00
047
.12
25–5
07
9155
7,00
019
6411
5325
00Sm
ith R
iver
nea
r C
resc
ent C
ity
641
12/3
0/20
0512
4,00
029
.55
10–2
512
7322
8,00
019
64
Tabl
e 2.
Pe
ak d
isch
arge
dat
a fo
r sel
ecte
d U.
S. G
eolo
gica
l Sur
vey
stre
amflo
w-g
agin
g st
atio
ns in
Cal
iforn
ia—
Cont
inue
d.
[mi2 ,
squa
re m
ile; f
t3 /s,
cub
ic f
oot p
er s
econ
d; f
t, fo
ot. <
, les
s th
an th
e ac
tual
val
ue s
how
n; >
act
ual v
alue
is g
reat
er th
an v
alue
sho
wn]
4 Storms and Flooding in California in December 2005 and January 2006—A Preliminary Assessment

#*#*
#*#*
#*
#*#*
#*
#*
#*
#*
*
#*#*
#*#*#*
#*
#*
#*
#*#*
#*
#*
#*
#* #*
#*
#*
#*#*
#*#*#*#*
#*
#*
#*
#*
#*
#*
#*
#*
#*
#*
#*
#*
#*
#*
")
")
")
")
11532500
11530500
11530000
11523000
11517500
11473900
11481000
11477000
11476500
11475560
11468500
11468000
11467000
11463000
11458500
1145800011456000
11456000
114473601142700011425500
11413000
11390000
1138350011379500
11377100
11372000
11345500
11336580 11335000
11266500
11266500
11119940 11113000
11189500
1116950011164500
11162500
1116100011159000
11159000
11152000
11147500
11143250
11143250
11098000
10346000
10346000
10338000
10336780
10336780
1033667610336660
10310000
10308200
Venado
Girard
Girard
Brush Creek
Willits Howard RS
EXPLANATION
") Precipitation station and name
Streamflow-gaging station and number(Recurrence interval, in years)
#* less than 2
#*
#*
2–5
#* 5–10
#* 10–25
#* 25–50
#* greater than 100
0 50 100 Miles
0 50 100 Kilometers
Figure 2. Location of selected streamflow-gaging stations, precipitation stations, and recurrence interval ranges for peak discharges in California, December 2005 and January 2006.
Summary of Flooding 5

Recurrence intervals, which express the average length of time in years between exceedances of peak flood discharges as large as those recorded during the December–January flood period, provide an indication of the frequency of flooding. For example, a peak discharge with a recurrence interval of 10 years is likely to be exceeded, on average, once every 10 years. The reciprocal of recurrence interval is the annual exceedance probability of a peak discharge. A peak discharge with a recur-rence interval of 10 years has an annual exceedance probabil-ity of 0.10, or 10 percent. During any year, the probability of having a peak discharge greater than a peak discharge with a 10-year recurrence interval is 0.10, or 10 percent.
Flood frequencies (recurrence intervals) for the December–January peak discharges were determined by fitting a log Pearson Type 3 probability distribution to the period of recorded annual peak discharges (through 2004 and including the December 2005–January 2006 peak discharge) at each site using methods described in Bulletin 17B by the Interagency Advisory Committee on Water Data (1982). The flood- frequency analyses were based on regional skew values pro-vided in Bulletin 17B and did not include any adjustments for
historical floods, high or low outliers, comparison with other stations, or other procedures described in the bulletin. The flood-frequency analyses also did not account for streamflow regulation or land-use changes over time, such as urbanization. These recurrence intervals are thus provisional and likely to change after a more thorough and rigorous analysis of flood frequency in California. The need for updated flood-frequency information in California is highlighted by the bar chart in figure 3, which shows that the three largest annual peak dis-charges at the Napa River at Napa (USGS station 11458000) were in water years 1986, 1995, and 2006 (December 31, 2005), after the last (1977) statewide systematic updating of flood-frequency data for USGS gage sites (Waananen and Crippen, 1977).
The most commonly used recurrence intervals for analyses of peak discharges are 2, 5, 10, 25, 50, and 100 years. These recurrence intervals were also used for the December–January peak discharges analyzed in this study. The intervals are presented in table 2 and figure 2 for the following ranges: less than 2 years, 2 to 5 years, 5 to 10 years, 10 to 25 years, 25 to 50 years, and greater than 100 years.
1986
1995
2006
0
10,000
20,000
30,000
40,000
1930
1935
1940
1945
1950 19
5519
6019
6519
7019
7519
8019
8519
9019
9520
0020
0520
10
WATER YEAR
ANN
UAL
PEAK
DIS
CHAR
GE, I
N C
UBIC
FEE
T PE
R SE
CON
D
Three largest annual peak discharges(1986, 1997, and 2006) occurred afterlast statewide analysis of flood frequencyin California in 1977
year
of l
ast f
lood
-freq
uenc
y an
alys
is
Figure 3. Recorded annual peak discharges for the streamflow-gaging station at the Napa River at Napa, California.
6 Storms and Flooding in California in December 2005 and January 2006—A Preliminary Assessment

In the north coast area, the recurrence intervals for the peak flows generally were in the 10- to 25-year range. Dis-charge for some stations, particularly those near the mouth of the Klamath River and in the upper Russian River Basin (fig. 4), showed more extreme flows, with recurrence inter-vals in the 25- to 50-year range. The peak discharge for the Sonoma River at Agua Caliente (USGS station 11458500) had a recurrence interval greater than 100 years and was about twice as big as the previous peak of record. Records at this site, however, do not include data for the large-flood years of 1986 or 1997.
The Russian River at Guerneville (USGS station 11467000), where significant flooding also occurred, had a recurrence interval in the 10- to 25-year range. Other streams, particularly those in the Eel River Basin, had less extreme peak discharges, with recurrence intervals in the 5- to 10-year range.
Streams in the San Francisco Bay area, including the Napa River Basin, had peak discharges with recurrence inter-vals generally in the 10- to 25-year and 25- to 50-year ranges. Along the central coast (Carmel River and Salinas River, for example) and in southern California (Sespe Creek and Arroyo Seco, for example), recurrence intervals generally were in the 2- to 5-year range.
Flows in the mainstem of the Sacramento River stayed within the capacity of the flood-control system, as relief weirs
and bypass channels were brought into operation. The peak discharge on the Sacramento River above Bend Bridge near Red Bluff (USGS station 11377100), which is regulated by Lake Shasta, had a recurrence interval of less than 2 years. Unregulated peak streamflows from tributaries draining the Coast Range on the west side of the upper Sacramento River Basin showed recurrence intervals in the 2- to 5-year range, whereas peak discharges from tributary streams draining the southern Cascade Mountains and the Sierra Nevada on the east side of the Sacramento River Basin had recurrence intervals in the 5- to 10-year range. Recurrence intervals for peak dis-charges from tributary streams farther south in the Sacramento River Basin (Yuba River and American River) generally were in the 10- to 25-year range (fig. 5). High flows, coupled with high tides and high winds, caused problems along levees in the Sacramento–San Joaquin River delta. At some locations, wind waves overtopped, but did not collapse, levees. Officials noted more than 40 episodes of erosion or seepage in the levees.
On the east side of the central Sierra Nevada around Lake Tahoe, these warm storms generally brought runoff peaks with recurrence intervals in the 10- to 25-year range. Further south, streams draining from the Sierra Nevada into the San Joaquin River Basin had peak flows with recurrence intervals ranging from 2 to 5 years.
Figure 4. Flooding from the Russian River along Highway 101 near Hopland, California, December 31, 2005. View is looking north. Photograph by Ken Markham, U.S. Geological Survey.
Summary of Flooding �
References Cited
California Office of Emergency Services, 2006, 2005–2006 winter storms status report, January 9, 2006 as of 1200 hours: 4 p., accessed February 16, 2006, at http://www.oes.ca.gov/Operational/OESHome.nsf/PDF/05-06%20Storm%20Update/$file/05-06WinterStormUpdate.pdf
Federal Emergency Management Agency, 2006, Designated counties for California severe storms, flooding, mudslides, and landslides: Disaster Summary for FEMA-1628-DR, California, 1 p., accessed February 16, 2006, at http://www.fema.gov/news/eventcounties.fema?id=5925
Hunrichs, R.A., Pratt, D.A., and Meyer, R.W., 1998, Magni-tude and frequency of the floods of January 1997 in North-ern and Central California—preliminary determinations: U.S. Geological Survey Open-File Report 98-626, 120 p.
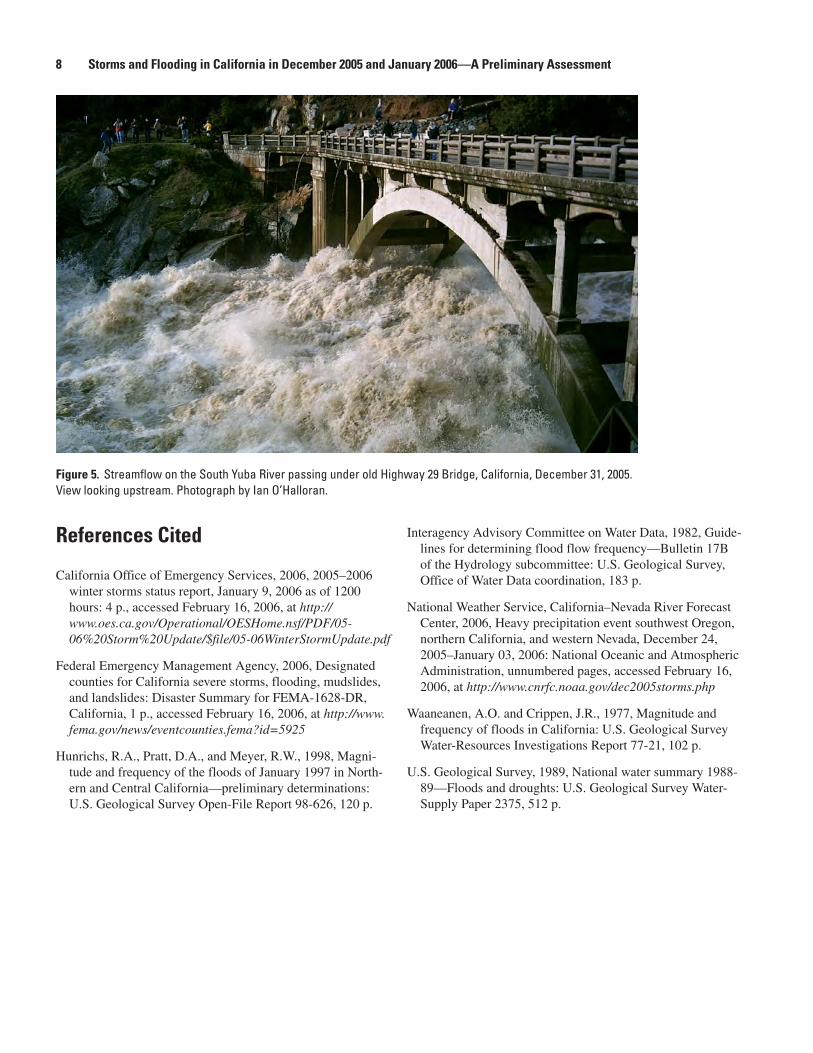
Figure 5. Streamflow on the South Yuba River passing under old Highway 29 Bridge, California, December 31, 2005. View looking upstream. Photograph by Ian O’Halloran.
Interagency Advisory Committee on Water Data, 1982, Guide-lines for determining flood flow frequency—Bulletin 17B of the Hydrology subcommittee: U.S. Geological Survey, Office of Water Data coordination, 183 p.
National Weather Service, California–Nevada River Forecast Center, 2006, Heavy precipitation event southwest Oregon, northern California, and western Nevada, December 24, 2005–January 03, 2006: National Oceanic and Atmospheric Administration, unnumbered pages, accessed February 16, 2006, at http://www.cnrfc.noaa.gov/dec2005storms.php
Waaneanen, A.O. and Crippen, J.R., 1977, Magnitude and frequency of floods in California: U.S. Geological Survey Water-Resources Investigations Report 77-21, 102 p.
U.S. Geological Survey, 1989, National water summary 1988-89—Floods and droughts: U.S. Geological Survey Water-Supply Paper 2375, 512 p.
8 Storms and Flooding in California in December 2005 and January 2006—A Preliminary Assessment