Store, Extract, Transform, Load, Visualize. Untagged Conference
71
Store, Extract, Transform, Load, Visualize
-
Upload
ani-lopez -
Category
Data & Analytics
-
view
165 -
download
2
Transcript of Store, Extract, Transform, Load, Visualize. Untagged Conference

Store, Extract, Transform, Load, Visualize

Ani Lopez
@anilopez linkedin.com/in/anilopez

What is this All About

In the beginning there was Data
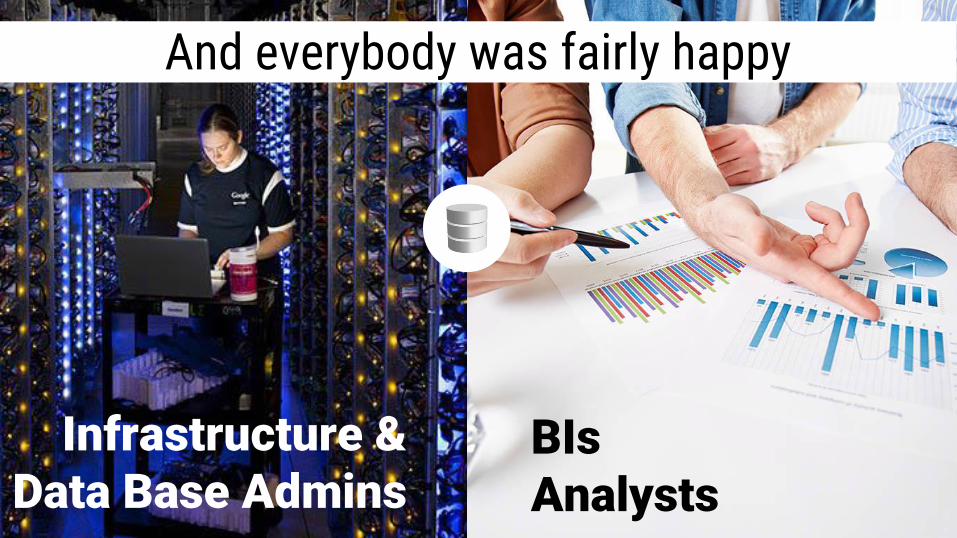
Infrastructure & Data Base Admins
BIs Analysts
And everybody was fairly happy
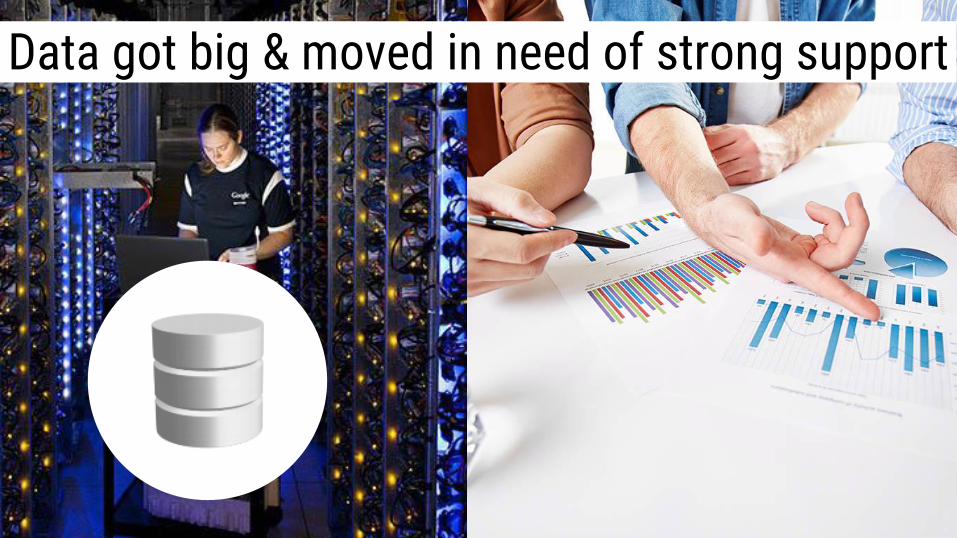
Data got big & moved in need of strong support

What made Analysts’ work way harder

How do we solve that?

As long as you have access to Sources, and control over SETL, you are ready to funk it up!

Go beyond GA/AA interface. You have to
No need to be an engineer. You can do it
BigData is not scary anymore

This is about how you take over the process with minimum or no technical knowledge
Analyze
Visualize
Store, Extract, Transform, Load Automate!

Step 1. Storage

Typical sources
• Online traffic measuring tools like GA or AA
• Social media platforms
• Customer Relationship Management platforms
• Booking systems, Call centers, Retailing
• Telemetry
Data don't exist till fixed somewhere
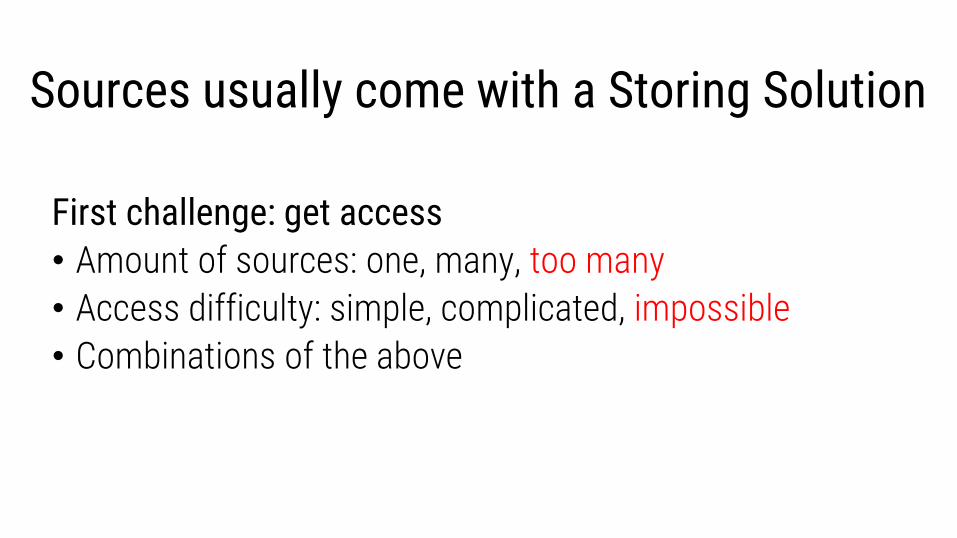
First challenge: get access
• Amount of sources: one, many, too many
• Access difficulty: simple, complicated, impossible
• Combinations of the above
Sources usually come with a Storing Solution

Yours
Why Our Own Storage?
Source
Source
Source
Source
Source

Safe
Why Our Own Storage?
Source
Source
Source

Types
• Internal
• Excel
• MSSQL / MySQL Server
• External or Cloud
• BigQuery, Cloud SQL, Big Table, DataStorage
• Amazon Redshift
Build your Own Storage

If you are lucky
• All data in a decent storage. Nothing else to do!
• DB / Infrastructure Admins connect the pipes for you
If you don’t
• Do it yourself, a little bit of coding becomes handy
• Cry for help
How?

Step 2. Extract

First
• From Sources to your Storage • Minimum or no transformation at all Second
• From your Storage to Intermediate tables • Heavily transformed
Two moments of Extraction

Dirty cheap
• Next Analytics / BigQuery add-ins for Excel
• Supermetrics / OWOX BQ add-ins for Google Sheets
Careful
• They should be able to automate extraction
• If not some scripting might be required
Tools for Extraction (I)

Data Integration Services
Not so cheap, no coding!
• Analytics Canvas
• Xplenty
• Alteryx
• Fivetran
• Mode
Tools for Extraction (II)
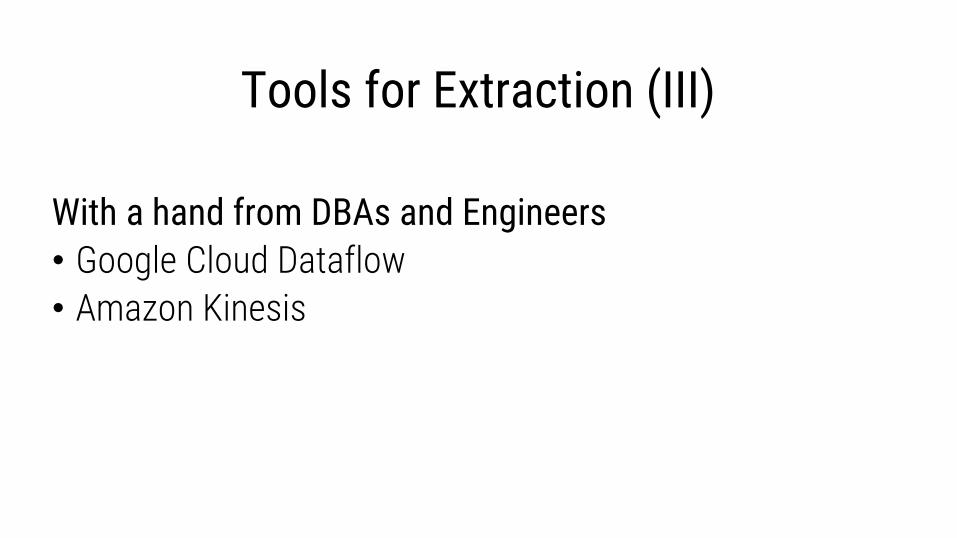
With a hand from DBAs and Engineers
• Google Cloud Dataflow
• Amazon Kinesis
Tools for Extraction (III)

Step 3. Transform
• Viz is important, transformation is key
• No good data = No SUCCESS
Transformation

First
• Data cleansing
• Data enrichment
• Consistency ensuring
Second
• Data Modeling previous to analysis or visualization
Two moments of Transformation

• SQL is the tool to answer complex business question
• It can take you to the BI realm = more $$$ :-D
• A bit of code takes you further
• modeanalytics.com --> Resources
Learn SQL and some JS/Python


Step 4. Load

Why not connecting Viz tool directly to Storage?
• They die when volume of data is huge
• Limited options for transformation
Solution
• Automate materialization to intermediate tables
• Feed Viz tools from those tables
Feed the Viz


Rows: 3,706M Total time: 180 secs CPU time: 1.7 days
Rows: 2,3M Total time: 18 secs CPU time: 17 secs

Flight delays
1 year of data Extract only November
10% sample of that
Quick guess
What city and day of November had highest delays?

And you need some
quick charts too

If you don’t know SQL
Xplenty

If you know

Step 5. Visualize
• It's not the same a dashboard than a visual analysis tool
• Insights don't come from any of those
• Insights are the outcome of analyst’s work
Let’s get some stuff straight

• Objective of the visualization itself, representative or exploratory • Interactivity requirements (on click drill down?) • Maturity of client's Measurement Culture • What's data consumer's role: CEO, Analyst, Media planner • Size of the audience and distribution needs • Available infrastructure • Data government and its requirements • Time to finish the project • Budget • Politics
Viz: Factors determining What & How to use

• All of them • From humble Excel • To big guys like Qlik and Tableau
• And the middle ones like Data Studio • Desktop or online solutions
• Coding your own (D3.js)? Interesting but resources intensive,
not agile for those just creating / distributing dashboards
Viz Tools?
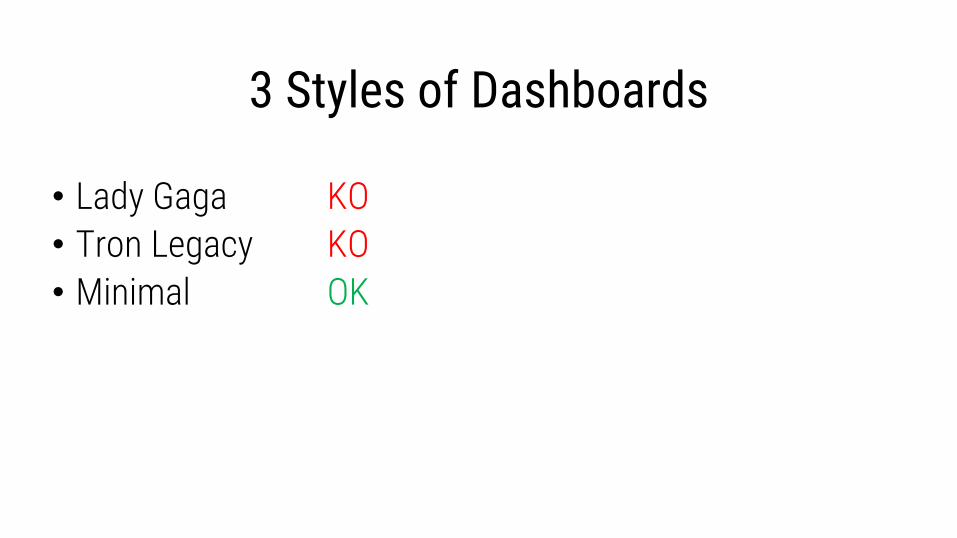
• Lady Gaga KO
• Tron Legacy KO
• Minimal OK
3 Styles of Dashboards


• Those using Excel default charts deserve the worst
• Same with the new shiny thing: Data Studio

What dashboards made with default styles look like to me

• Never use Excel default charts or Data Studio templates
• Read about art
• Modern Art de Giulio Carlo Argan
• Focus on: Rationalism / Minimalism / Functionalism
• Follow Viz masters
• Edward Tufte, Stephen Few, Robert Kosara, Alberto Cairo
For Fucks Sake, Educate your Aesthetics!

Examples

Viz
1. Franchise Based Business
SETLV all in once
Windows Task Scheduler
Online Source
Internal Store
Offline Source
Server
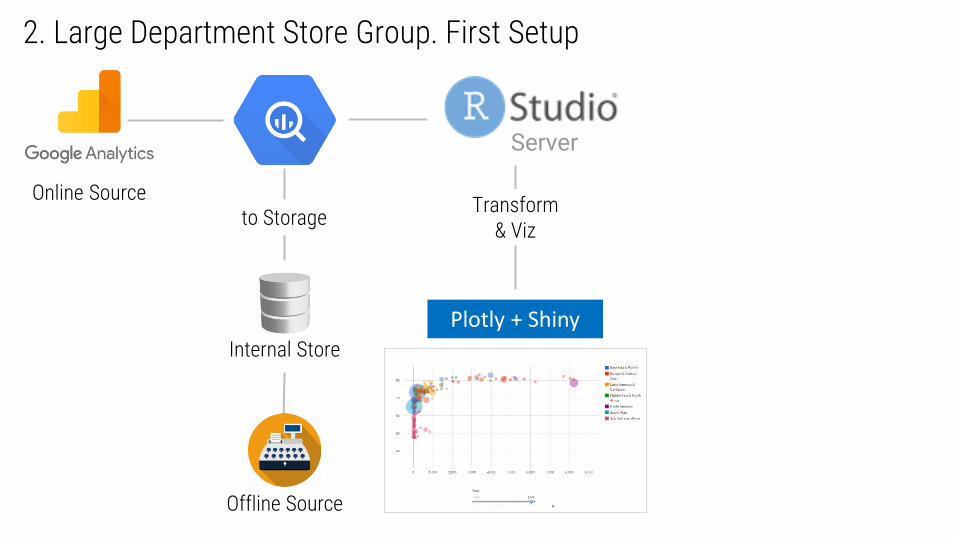
Plotly + Shiny
2. Large Department Store Group. First Setup
Transform & Viz
to Storage

Online Source
Internal Store
Offline Source
Server
2. Large Department Store Group. Second Setup
Transform & Load
Viz to Storage

Storage Viz to Storage
3. Sports Equipment Company
Transform
GA Views
Load
.tde

Live Example

Automated ETL with BigQuery + Apps Script $0.0, 30 lines of code, 10 minutes
Scheduled Transformation
Small & Fast BQ Table
Visualization Tool of your choice
Huge BQ Table
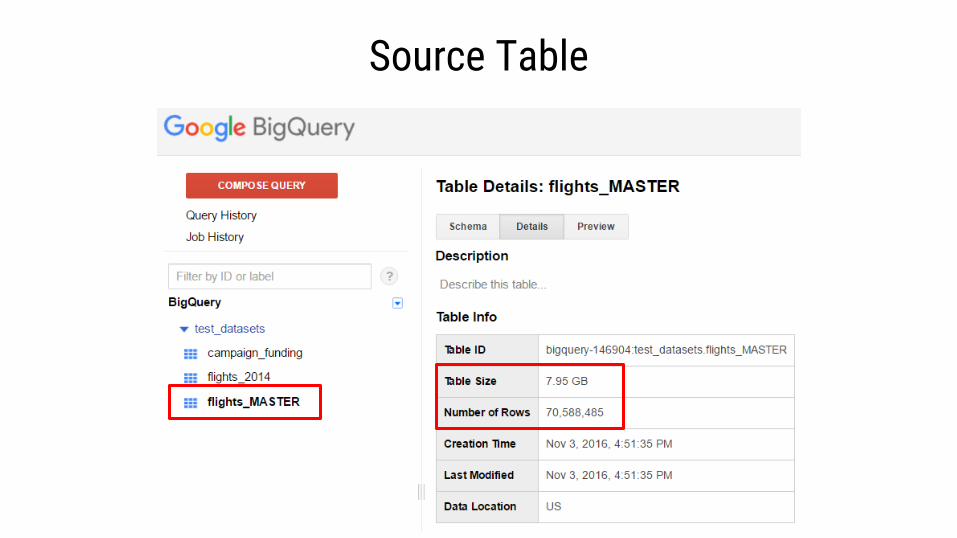
Source Table

Destination Table

SQL QUERY doing the Transformation

We want
• To run the transformation every day/week/month
• Append results to existing table feeding the visualization tool
We need
• Your Transforming Query + SQL minifier
• Google Sheets + Apps Script (JavaScript)
Destination Table

Process
• Open a new Google Sheet
• Go to Tools > Script Editor
In Script Editor go to Resources
• Advanced Google Services: Enable BigQuery API
• Developers Console Project: Project Number (of the project
where tables live)
• Place the script and tweak accordingly. Save and schedule
Google Sheets

function saveQueryToTable() { // Get previous day from cell B2 in spreadsheet var sheet = SpreadsheetApp.getActiveSpreadsheet().getSheetByName('Sheet1'); var previousDay = sheet.getRange("B2").getValue() // Query var sql = 'SELECT date, COUNT(*) FROM [bigquery-146904:test_datasets.flights_MASTER] WHERE YEAR(date)=2012 AND MONTH(date)='+previousDay+' GROUP BY date'; // Table destination details var projectId = 'bigquery-XXXXXX'; var datasetId = 'test_datasets'; var newTableId = 'flights_2012'; // Job definition var job = { configuration: { query: { query: sql, writeDisposition:'WRITE_APPEND', destinationTable: { projectId: projectId, datasetId: datasetId, tableId: newTableId } } } }; // Job execution var queryResults = BigQuery.Jobs.insert(job, projectId); Logger.log(queryResults.status); }
JS Script

Schedule

Almost there

• Don’t try to sell to stakeholders the megaproject of your life
• Start small and simple, get buy in, grow little by little
• Plan SETLV carefully according to circumstances
• Don’t just buy first vendor solution presented
• Many solutions out there, ask for demos
• It tends to get messy, don’t panic
$0.02 more of advice

![[1996] [Riloff] Automatically Generating Extraction Patterns From Untagged Text - AAAI96-155](https://static.fdocuments.net/doc/165x107/577d34b71a28ab3a6b8eace3/1996-riloff-automatically-generating-extraction-patterns-from-untagged.jpg)