storage systems in grid-connected PV plants Economic viability for residential battery ... ·...
8
IET Renewable Power Generation Research Article Economic viability for residential battery storage systems in grid-connected PV plants ISSN 1752-1416 Received on 10th April 2017 Revised 22nd July 2017 Accepted on 8th August 2017 doi: 10.1049/iet-rpg.2017.0243 www.ietdl.org Simone Barcellona 1 , Luigi Piegari 1 , Vincenzo Musolino 2 , Christophe Ballif 2 1 DEIB, Politecnico di Milano, Milan, Italy 2 CSEM-PV Center, Neuchatel, Switzerland E-mail: [email protected] Abstract: Today's residential battery energy storage systems (BESSs) are off the shelf products used to increase the self- consumption of residential photovoltaic (PV) plants and to reduce the losses related to energy transfer in distribution grids. This work investigates the economic viability of adding a BESS to a residential grid-connected PV plant by using a methodology for optimising the size of the BESS. The identification of the optimal size which minimises the total cost of the system is not trivial; indeed, it is a trade-off between OPEX and CAPEX, which are mainly affected by the battery technology, usage profile, expected lifetime, and efficiency. Here, an analysis of the opportunity to install a storage system together with a grid-connected residential PV plant is performed. Three typical low-voltage prosumers (Italy, Switzerland, and the UK) are investigated in order to take into account the different legislative and tariff framework over Europe. Numerical results reported here show that present costs of storages are still too high to allow an economic convenience of the storage installation. Moreover, an indication of the necessary incentives to allow the spreading of these systems is given. Nomenclature α (1+c r )/(1+d r ) η B efficiency of battery pack η I efficiency of the inverter η PV efficiency of the PV a b battery actualising term a g grid actualising term A h actual battery pack capacity (Ah) A ho initial battery pack capacity (Ah) BL battery lifetime (years) C battery total battery cost (€) c buy purchase energy grid cost (€) C g annual fixed cost of the electrical service provider (€) C grid total grid cost (€) c i incentives (€) c ins battery installation and disposal specific costs (€/kg) C ins_fix battery installation and disposal fixed costs (€) C INV a actualised battery inverter cost (€) c int,battery specific intrinsic battery cost (€) C INV battery inverter cost (€) C ins_fix a actualised battery installation and disposal fixed costs (€) c r capital cost rate c sell sale energy grid cost (€) c sto,battery unitary cost of the stored energy in the battery (€) c sto,grid unitary cost of the stored energy in the grid (€) C tot total cost (€) c W specific battery cost (€/Wh) c W th specific battery cost threshold (€/Wh) DoD depth of discharge d r discount rate E buy annual energy bought from the grid (kWh) EoL battery end of life E s specific energy of the battery pack (Wh/kg) E sell annual energy sold from the grid (kWh) E sold energy sold to the grid over the plant life (kWh) E stored energy exchanged with the battery or with the grid over the plant life (kWh) E TOT total energy exchanged by the battery over its life (kWh) g c capacity ageing coefficient g r resistance ageing coefficient I battery current (A) K M maintenance coefficient of the battery pack m mass of the battery pack (kg) N c life cycle of the battery pack N isn number of battery pack installations P B power exchanged by the battery pack (kW) P grid power exchanged with the grid (kW) PL plant lifetime (years) P LOAD power absorbed by the domestic load (kW) P PV power generated by the PV (kW) P sold power related to the energy sold to the grid (kW) P stored power related to the energy stored in the battery or in the grid (kW) q actual moved charge by the battery (Ah) Q TOT total charge moved by the battery over its life (Ah) R 0 initial internal battery resistance (Ω) R in actual internal battery resistance (Ω) S PV surface (m 2 ) SoC state of charge SoC i initial state of charge SoH state of health V battery voltage (V) V n nominal voltage of the battery pack (V) V o no-load battery voltage (V) 1 Introduction The declining cost of photovoltaic (PV) solar modules is driving the deployment of PV systems worldwide. In total, >75 GW peak power of PV were installed in 2016 in the international energy agency PV power system programme (IEA PVPS) countries [1]. Based on data in between 1976 and 2016, the learning curve of the PV module is 22.5% and, considering different insolation IET Renew. Power Gener. © The Institution of Engineering and Technology 2017 1
Transcript of storage systems in grid-connected PV plants Economic viability for residential battery ... ·...

IET Renewable Power Generation
Research Article
Economic viability for residential batterystorage systems in grid-connected PV plants
ISSN 1752-1416Received on 10th April 2017Revised 22nd July 2017Accepted on 8th August 2017doi: 10.1049/iet-rpg.2017.0243www.ietdl.org
Simone Barcellona1 , Luigi Piegari1, Vincenzo Musolino2, Christophe Ballif21DEIB, Politecnico di Milano, Milan, Italy2CSEM-PV Center, Neuchatel, Switzerland
E-mail: [email protected]
Abstract: Today's residential battery energy storage systems (BESSs) are off the shelf products used to increase the self-consumption of residential photovoltaic (PV) plants and to reduce the losses related to energy transfer in distribution grids. Thiswork investigates the economic viability of adding a BESS to a residential grid-connected PV plant by using a methodology foroptimising the size of the BESS. The identification of the optimal size which minimises the total cost of the system is not trivial;indeed, it is a trade-off between OPEX and CAPEX, which are mainly affected by the battery technology, usage profile,expected lifetime, and efficiency. Here, an analysis of the opportunity to install a storage system together with a grid-connectedresidential PV plant is performed. Three typical low-voltage prosumers (Italy, Switzerland, and the UK) are investigated in orderto take into account the different legislative and tariff framework over Europe. Numerical results reported here show that presentcosts of storages are still too high to allow an economic convenience of the storage installation. Moreover, an indication of thenecessary incentives to allow the spreading of these systems is given.
Nomenclatureα (1+cr)/(1+dr)ηB efficiency of battery packηI efficiency of the inverterηPV efficiency of the PVab battery actualising termag grid actualising termAh actual battery pack capacity (Ah)Aho initial battery pack capacity (Ah)BL battery lifetime (years)Cbattery total battery cost (€)cbuy purchase energy grid cost (€)Cg annual fixed cost of the electrical service provider (€)Cgrid total grid cost (€)ci incentives (€)cins battery installation and disposal specific costs (€/kg)Cins_fix battery installation and disposal fixed costs (€)CINV
a actualised battery inverter cost (€)cint,battery specific intrinsic battery cost (€)CINV battery inverter cost (€)Cins_fix
a actualised battery installation and disposal fixed costs(€)
cr capital cost ratecsell sale energy grid cost (€)csto,battery unitary cost of the stored energy in the battery (€)csto,grid unitary cost of the stored energy in the grid (€)Ctot total cost (€)cW specific battery cost (€/Wh)cW
th specific battery cost threshold (€/Wh)DoD depth of dischargedr discount rateEbuy annual energy bought from the grid (kWh)EoL battery end of lifeEs specific energy of the battery pack (Wh/kg)Esell annual energy sold from the grid (kWh)Esold energy sold to the grid over the plant life (kWh)
Estored energy exchanged with the battery or with the grid overthe plant life (kWh)
ETOT total energy exchanged by the battery over its life(kWh)
gc capacity ageing coefficientgr resistance ageing coefficientI battery current (A)KM maintenance coefficient of the battery packm mass of the battery pack (kg)Nc life cycle of the battery packNisn number of battery pack installationsPB power exchanged by the battery pack (kW)Pgrid power exchanged with the grid (kW)PL plant lifetime (years)PLOAD power absorbed by the domestic load (kW)PPV power generated by the PV (kW)Psold power related to the energy sold to the grid (kW)Pstored power related to the energy stored in the battery or in
the grid (kW)q actual moved charge by the battery (Ah)QTOT total charge moved by the battery over its life (Ah)R0 initial internal battery resistance (Ω)Rin actual internal battery resistance (Ω)S PV surface (m2)SoC state of chargeSoCi initial state of chargeSoH state of healthV battery voltage (V)Vn nominal voltage of the battery pack (V)Vo no-load battery voltage (V)
1 IntroductionThe declining cost of photovoltaic (PV) solar modules is drivingthe deployment of PV systems worldwide. In total, >75 GW peakpower of PV were installed in 2016 in the international energyagency PV power system programme (IEA PVPS) countries [1].Based on data in between 1976 and 2016, the learning curve of thePV module is 22.5% and, considering different insolation
IET Renew. Power Gener.© The Institution of Engineering and Technology 2017
1

conditions, today's levelised cost of electricity (LCOE) is in arange of 0.4 or 0.8 USD/kWh [2].
Battery energy storage systems (BESSs) are one of the mostpromising solutions for reducing the intermittence of PV systems;BESSs (i) increase the percentage of self-consumed electricity upto 70% [3], (ii) increase the PV penetration in our electric grids [4,5], and (iii) guarantee an adequate power quality level indistribution grids [6].
The total utility scale grid-connected BESS market was 0.48 GW in 2014, and it is set to reach up to 12 GW by 2024, whileannual revenues will grow to around 8.44 billion USD [7]. Theexperience curve for lithium ion batteries in electric vehicleapplications is 21%, which is very close to that one of the PVmarket [8]. Levelised costs of storage (LCOS) for electrochemicalstorage systems are in the range of 0.338 (redox-flow) to 3.072(lead-acid) USD/kWh [9]. LCOS is defined as the total cost ofownership over the investment period (that is the sum of thepurchase cost of the storage system plus all the costs ofmaintenance and of electric energy required for charging) dividedby the delivered energy.
Despite the continuing market expansion, investments in BESSspresent a high financial risk dealing with the evaluation ofperformances in real operation. Optimal sizing methodologies havebeen addressed in [10–14]. However, they are focused only on theeconomic aspects considering the battery pack attains the nominalperformances for all its lifetime and in all operative conditions.
The expected lifetime of a battery depends on many factors,including temperature, current cycle, and depth of discharge(DoD). The nominal data provided by manufacturers, which referto standard and fixed working conditions, are insufficient for aproper system design.
Complex models are available in the literature to take intoaccount the battery dynamic [15–20], thermal behaviour [21–23],and ageing aspects [24–31]. An ad hoc methodology for a correctbattery system sizing is required. The authors in [32] have alreadyaddressed a methodology for a correct sizing of electrochemicalstorage systems; the integrated model estimates the batteryperformances as expected lifetime, efficiency, and energy andpower densities on the basis of the real power profile usage andoperative working conditions. In [33], the authors used theproposed technical procedure to size the capacity of the BESS in astand-alone PV plant, and the results are compared with those onesobtained by using the procedures described in the IEEE 1013 and1561 standards [34, 35]. The procedure in [33] is limited to stand-alone systems and it cannot be used for grid-connected PVintegrating a battery storage system.
In this paper, we investigate the economic viability of batterystorage for residential solar PV systems operating grid connected.The technical procedure for the battery sizing is integral part of theeconomic analysis, so that the financial figures are provided takinginto account the impact of battery operations on the real systemperformances.
In the analysis, three different user cases corresponding todifferent countries over Europe are considered: Italy, Switzerland,and the UK. The investigation takes into account two differentbattery technologies (lithium-ion and lead acid), and the actualprices of electricity.
The work is organised as follows: in Section 2, the equivalentmodel of the battery is provided and it is integrated in the costanalysis procedure described in Section 3. In Section 4, the threeselected case studies are presented and in Section 5, the simulationresults are reported and discussed. Finally, the conclusions come inthe end of the paper in Section 6.
2 Battery modellingThe main battery models can be organised under three differentcategories: electric, thermal, and ageing models. In [32], a generalmodel that interconnected three previous ones was proposed. Thismade it possible to separately characterise the electric, thermal, andageing phenomena. The complete behaviour of a certain batterywas then obtained by joining them together, where each of thosemodels was chosen on the basis of what has to be characterised.
The aim of the present paper is to extend the analysis made in[33] to the case of a residential grid-connected PV plant equippedwith a BESS over a time horizon of 20 years, taking into account,in particular, the ageing of the batteries during these years, andneglecting the temperature effects.
Since we are interested to simulate the battery behaviour over along period, the electric model can be simple, without payingattention to the dynamic effects of the battery. The simplest one isconstituted by an ideal voltage source Vo as a function of the SoCseries to an internal resistance Rin (Fig. 1a). This electric model isnot able to represent the dynamic effects of the battery. Rather, it isonly suitable to represent the steady-state behaviour. The Vo(SoC)functions for both a lithium ion cell and lead-acid cell are reportedin Fig. 1b.
The resistance Rin is calculated taking into account theefficiency of the battery pack as follows:
Rin = Esm(1 − ηB)Ah0I(Ah0)(1 + ηB) (1)
where Esm is the sizing energy; ηB is the efficiency of the batterypack; and I(Ah0) is the current, which has the same value as theinitial capacity Ah0. The equivalent electric circuit is described bythe following equations:
V = Vo(SoC) + RinI
SoC = ∫ Idt + SoCi
0 ≤ SoC ≤ Ah .
(2)
Under the hypothesis that batteries work in a small range oftemperatures, the thermal behaviour can be neglected. Therefore,the thermal model is not included in the general one.
Finally, the ageing model chosen is the one proposed in [29],according to which the ageing of the battery is due to the squareroot of the total moved charge. Actually, it is well known that theageing of batteries is due to the cycle ageing and the calendareffect. In [29], the ageing is a function of the square root of themoved charge, cycling and calendar effects are jointly taken intoaccount: the total charge is moved over time. In [31], the proposedcalendar ageing model depends on the square root of the time at acertain temperature. Fixed the temperature, we can assume that themoved charge depends on the average current along the time. Inthis way, both phenomena have the same dependency on the time.
Fig. 1 Battery modelling(a) Electric circuit model, (b) Battery terminal voltage as a function of SoC forlithium-ion and lead-acid batteries
2 IET Renew. Power Gener.© The Institution of Engineering and Technology 2017

Consequently, the model proposed in [29] can be used for the totalageing. The indicator of the state of health (SoH) is the reduction inthe initial capacity of the battery Aho, and it can be expressed as afunction of the total moved charge q (Ah) as follows:
SOH = AhAh0
= 1 − gc q (3)
where Ah is the actual capacity and gc is the capacity ageingcoefficients, which depend on the type of battery. This coefficientis calculated by taking into account the life cycles Nc at a certainDoD and along a certain time period, given by the batterymanufacturer, and the end of life (EoL), typically, when the actualcapacity decreases to 80% of the initial one:
gc = 0.22DoD ⋅ Ah0 ⋅ Nc
. (4)
The actual capacitance as a function of the moved charge isobtained by multiplying (3) by Ah0
Ah(q) = Ah0 − gcAh0 q . (5)
In addition, the resistance Rin changes during the ageing process.According to [28], the series resistance varies with the square rootof the moved charge:
Rin q = R0 + grR0 q (6)
where R0 is the initial resistance, and gr is the resistance ageingcoefficient of the battery pack calculated by taking into account thelife cycles Nc and considering that, at the end of the life, theresistance is doubled:
gr = 12DoD ⋅ Ah0 ⋅ Nc
. (7)
By joining the electric and ageing model together, the total modelcan be obtained, and is shown in Fig. 2. Using (5) and (6), thefunction Vo(SoC) and resistance Rin can be expressed as functionsof the ageing process using the moved charge q.
In particular, the integrated model starts from the knowledge ofthe initial state of charge, SoCi, and the power exchanged by thebattery pack, PB. In fact, multiplying (2) by the current I, thefollowing second-order equation is obtained
PB = VI = VoI + RinI2 . (8)
Solving with respect to the current, we have
I = −Vo + Vo2 + 4RinPB
2Rin. (9)
3 Cost analysis procedureConsidering the PV application, the main goal of the present paperis to compare the total cost of the battery, obtained through thesizing procedure proposed in [32] (flow diagram in Fig. 3), withthe total cost of the grid, if it is used as a storage system instead ofthe battery. The plant that will be taken into account for thiscomparison is a domestic PV system with a lifetime of 20 years.
3.1 Battery cost for off-grid systems
If the grid is not present, as reported in [33], the plant cost iscalculated by taking into account the specific battery cost, cost ofthe battery inverter, capital cost rate, discount rate, and installation/disposal costs of the battery over the 20 years. Starting from theformula reported in [36], the total cost of the battery pack can beevaluated over the 20 years with the following expression:
Cbattery = ∑k = 0
[20/BL] − 1m cWEsKM + cins + Cins_fix
× 1 + cr1 + dr
k ⋅ BL+ ∑
k = 0
1CINV
1 + cr1 + dr
10k(10)
where [x] is the ceiling number of x, and all the other symbols aredefined in the nomenclature at the beginning of the paper.Moreover, the lifetime of the inverter has been considered equal to10 years. In order to simplify the expression (10), let us define thefollowing actualising and actualised terms:
ab = 1Nins
∑k = 0
Nins − 1αk ⋅ BL; CINV
a = ∑k = 0
1CINVα10k; Cins_fix
a
= ∑k = 0
Nins − 1Cins_fixαk ⋅ BL
where α=(1+cr)/(1+dr), and the number of battery installation isNins = [20/BL]. In this way, (10) becomes
Cbattery = Ninsm cWEsKM + cins ab + Cins_fixa + CINV
a . (11)
According to the procedure proposed in [33], the minimumnecessary battery mass is the one that assures no blackout during 1year. Given an annual solar power profile and an annual domesticload profile, this minimum mass is calculated iteratively until acondition with no blackouts is ensured. In general, this minimum
Fig. 2 Integrated model
Fig. 3 Flow diagram for correct sizing of the storage system [32]
IET Renew. Power Gener.© The Institution of Engineering and Technology 2017
3

mass could not be the optimal one from the cost point of view.Indeed, using the minimum mass, the battery pack operates in thewhole voltage span with a current, given by the ratio between thepower profile and the actual voltage. For a larger mass, a lowervoltage span is required to complete the power profile. As aconsequence, even if increasing the mass increases the initial cost,the specific energy required is lower, and the voltage profileschange. Furthermore, the ageing effect is minor. Once theminimum mass is obtained, the following iterative procedure isapplied. First, a maximum mass, a mass step, and a voltage stephave to be chosen. The end of life, number of battery installations,and plant cost over the 20 years can be evaluated using theintegrated model of Fig. 2 and plant cost expression (11). Afterthat, the lowest voltage limit, starting from the minimum one, isincreased in the chosen voltage step. In this way, the current will belower, and the efficiency higher. Once again, the integrated modeland the cost are evaluated. This procedure is repeated iterativelyuntil the maximum voltage is reached. Afterwards, the sameprocedure is repeated with an increased mass until the maximummass is reached.
Now, it is interesting to calculate the unitary cost of the storedenergy in the battery, expressed in €/kWh. For the sake ofsimplicity, let us consider, as a first step, a PV plant that suppliesthe exact amount of energy absorbed by the load every day. As itspower profile does not match the load power request from the load,the storage is necessary to store energy during the day and supplythe load after sunset. Using the above-discussed procedure, it ispossible to consider the optimal mass of the storage system thatminimises the overall costs over the plant life. This optimal masscorresponds to a value for which the plant life is an integermultiple of the battery life. This number corresponds to the numberof battery installations, Nins. During its service, the battery ischarged/discharged a number of times equal to its lifecycles, whichis calculated according to (5). In particular, considering the end oflife of the battery when its capacitance is 80% of the rated value,according to (4) and (5), the total charge moved by the battery overits life is as follows:
QTOT = 2 DoD Ah0 Nc . (12)
Starting from the specific energy Es, mass m, and nominal voltageVn of the equivalent battery pack that we want to model, the initialcapacity is as follows:
Ah0 = EsmVn
. (13)
Considering a constant voltage equal to the nominal one, from (12)and (13), the amount of energy (in kWh) exchanged by the batteryover its entire life is as follows:
ETOT = 2 DoD mEsNc/1000. (14)
Finally, the unitary cost of the stored energy in the battery,expressed in €/kWh, over its life, can be expressed as follows:
csto, battery = CbatteryETOTNins
. (15)
This cost is different from the specific battery cost per Wh, cW,referred to as the nominal battery capacity. Moreover, byneglecting both the capital cost and the discount rate cost, (15)becomes independent from the plant life; conversely, it onlydepends on the total cost of a single battery installation and on itstotal energy ETOT. Also neglecting both the cost of the inverter andthe installation/disposal costs, we can define the specific intrinsicbattery cost, expressed in €/kWh, as follows:
cint, battery = 1000 × cWKM2DoDNc
= KeqcW (16)
where Keq = (1000KM)/(2DoDNc).
3.2 Battery cost for grid-connected systems
If the grid is available, it is possible to work without the storagesystem or to use a lower size for the battery. Indeed, when the PVplant is not capable of supplying all the required power, themissing amount of power can be drawn from the grid. In this case,the storage service can be provided by the grid or by a battery (orby a combination of the two).
Let us start to consider only the grid as storage service. Thetotal grid cost over the 20 years can be expressed as follows:
Cgrid = 20 cbuyEbuy + csellEsell + Cg ag (17)
where Ebuy and Esell are, respectively, the annual energies boughtand sold from/to the grid, expressed in kWh, cbuy and csell are,respectively, the sell and purchase grid energy costs, Cg is theannual fixed cost connected with the service provider, and theactualising grid term is defined as
ag = 120 ∑
k = 0
19αk .
The grid-connected PV plant can exchange energy with the grid. Inthis way, it uses the grid itself as storage by exporting excessenergy during PV production and importing energy when requiredduring dark hours. The power exchanged with the grid can beexpressed as follows:
Pgrid = PPV − PLOAD = Psold + Pstored (18)
with the auxiliary condition that the integral over the plant life ofPstored is null. Even if, globally, no energy transfer is connectedwith Pstored, a storage service charge is paid to the grid because theprices per kWh to buy and sell the energy are different. Inparticular, the cost per stored kWh (in the grid) is easily evaluatedas follows:
csto, grid = cbuy − csell . (19)
The comparison between the two specific storage costs given by(15) and (19) allows the selection of using the battery or grid asstorage service. Note that the power Psold related to the net surplusof energy sold to the grid in 1 year is the same in the two cases, andCg is also present in both cases. Therefore, these terms do notintroduce any difference in the comparison. Based on the aboveexplanation, we consider the two cases:
• PVs on a grid with batteries;• PVs on a grid without batteries.
In the first case, the procedure proposed in [32] is appliedstarting from a null minimum mass because the continuity ofservice during dark hours is ensured by the grid. The plant costover the 20 years can be evaluated by adding in the cost expression(11) the cost related to the grid (17). In this way, the total plant costis defined as follows:
Ctot = Cbattery + Cgrid . (20)
In this case, the difference between the power generated by PVsand the power absorbed by the domestic load is, in a priority way,exchanged with the storage system. If the latter is fully charged,and the power produced by the PVs is greater than that absorbed bythe load, the power difference is injected into the grid. Conversely,if the storage system is fully discharged, and the power producedby the PVs is less than that absorbed by the domestic load, thepower difference is drawn from the grid.
Instead, for the second case, no optimal battery mass iscalculated because the storage system is not present. Indeed, in this
4 IET Renew. Power Gener.© The Institution of Engineering and Technology 2017

case, the difference between the energy produced by PVs and thatabsorbed by the domestic load is completely exchanged with thegrid. The costs are only the ones related to grid.
In this way, the related costs are calculated for these two cases.In case the best solution is the one without the storage system, it ispossible to calculate the specific battery cost threshold that makesthe battery solution convenient, as follows (see the Appendix fordetails):
cWth = 1
EsKM
Cgridg − Cgrid
b + g − CINVa − Cins_fix
a
moabNins− cins (21)
where the quantities with the apex b + g refer to the case in whichthe PVs are on a grid with batteries, and the quantities with theapex g refer to the case in which the PVs are on a grid withoutbatteries. Equation (21) represents the specific cost that the batteryshould have in order to be more convenient than the grid used asstorage. For lower specific battery costs, the solution with thebattery becomes more convenient than the solution with only thegrid. In order to better understand the meaning of (21), under thehypothesis that the annual energy produced by PVs is at leasthigher than that absorbed by the load and unitary efficiency of thebattery, (21) can be rewritten as follows (see the Appendix fordetails):
cWth = 1
abKeq(cbuy − csell)ag−
CINVa + Cins_fix
a + Ninsm0cinsabEstored
(22)
where Estored is the energy exchanged with the battery or with thegrid expressed in kWh and calculated over the plant life. From thisexpression, we can note that, if both the inverter battery cost andthe installation/disposal battery costs are nil, the specific batterycost depends only on the difference between the purchase and salecost energy of the grid. Otherwise, it also depends on the othercosts, on the annual stored energy, and on the optimal mass. It isimportant to note that, if the inverter battery cost and/or theinstallation/disposal battery costs become predominant, the specificbattery threshold cost may be negative.
As will be shown in the next section, the present costs ofbatteries lead to a consistent preference for the use of the grid asstorage system. However, the comparison between the two specificcosts provides information about the necessary incentives to besupported in order to facilitate the spread of distributed storageunits. These incentives can be calculated as follows:
ci = csto, battery − csto, grid . (23)
4 Case studyIn order to test the proposed procedure, a case study has beenidentified. One of the main goals of the paper is to assess theconvenience to install a storage system in a grid-connectedresidential PV plant. Therefore, in the analysis, the only overallcost for the user is considered and all the other advantagesconnected with the installation of a storage (continuity of service,quality of the voltage, reactive power compensation etc.) are notconsidered. The storage is used to maximise the self-consumptionof the user and, for this reason, its power reference is obtained asdifference between the available PV power and the power demandfrom the residential load. Power is exchanged with the grid onlywhen the storage is full charged (supplying energy to the grid) orfully discharged (absorbing power from the grid).
In order to understand, in different countries, whether thestorage installation is convenient or not, three different Europeancountries have been considered. Since the goal is to compare theresults only on the basis of the energy prices (for buying and forselling), no incentive tariffs have been taken into account. Indeed,incentives for energy produced by PV could ‘dope’ the systemchanging the results without a connection with the real price ofenergy. The three selected countries are Italy, Switzerland, and theUK. For each country, a city and its correspondent annual solardiagram have been chosen. In particular, the cities are Messina inItaly, Neuchatel in Switzerland, and London in the UK. Theirannual solar radiation diagram, retrieved by [37–39], is reported inFig. 4.
For each site, average energy prices of each country have beenconsidered as reported in Table 1.
The proposed procedure is applicable to any power profile but,to define the case study, power profiles for load and generationhave to be selected. In the paper, the suitability of the storageinstallation is investigated. For this reason, to have the same energybalance in the three countries, the PV systems have been sized inorder to have the same annual energy production. This means thatin Italy, where the solar power is higher, the smallest PV system isconsidered, while in the UK, it is used the biggest one. This choicewas driven by the choice to compare the storages only on the basisof energy prices, in the three countries, independently on thedifferent incoming due to the different latitude. Fixed the annualPV production to 6750 kWh the PV size, in square metres, areobtained as reported in Table 2.
For what concerns the load, a unique power profile has beenchosen for all the three countries. Also if this seems to be a stronghypothesis, this choice was always driven by the will to comparethe three countries mainly on the different energy prices more thanfrom other peculiarities that could change also from city to cityinside the same country. The daily load power profile has beengenerated using the tool reported in [40]. Four different daily
Fig. 4 Annual solar power profiles
Table 1 Energy pricesItaly Switzerland UK
cbuy, €/kWh 0.16 0.23 0.1csell, €/kWh 0.039 0.09 0.056Cg, € 55 123 141
IET Renew. Power Gener.© The Institution of Engineering and Technology 2017
5

power profiles have been generated for the four seasons and arereported in Fig. 5.
The annual power profile is obtained concatenating the dailyprofiles and the total amount of energy demand per year is 2700 kWh. Finally, the battery data used for the simulations are takenfrom [41–43] and are reported in Table 3.
5 Simulation resultsAccording to the case study definition reported in the previoussection, six simulations have been performed: three countries, eachwith the two types of battery. All the simulations were carried outusing Matlab®. The total costs of the plant as function of the
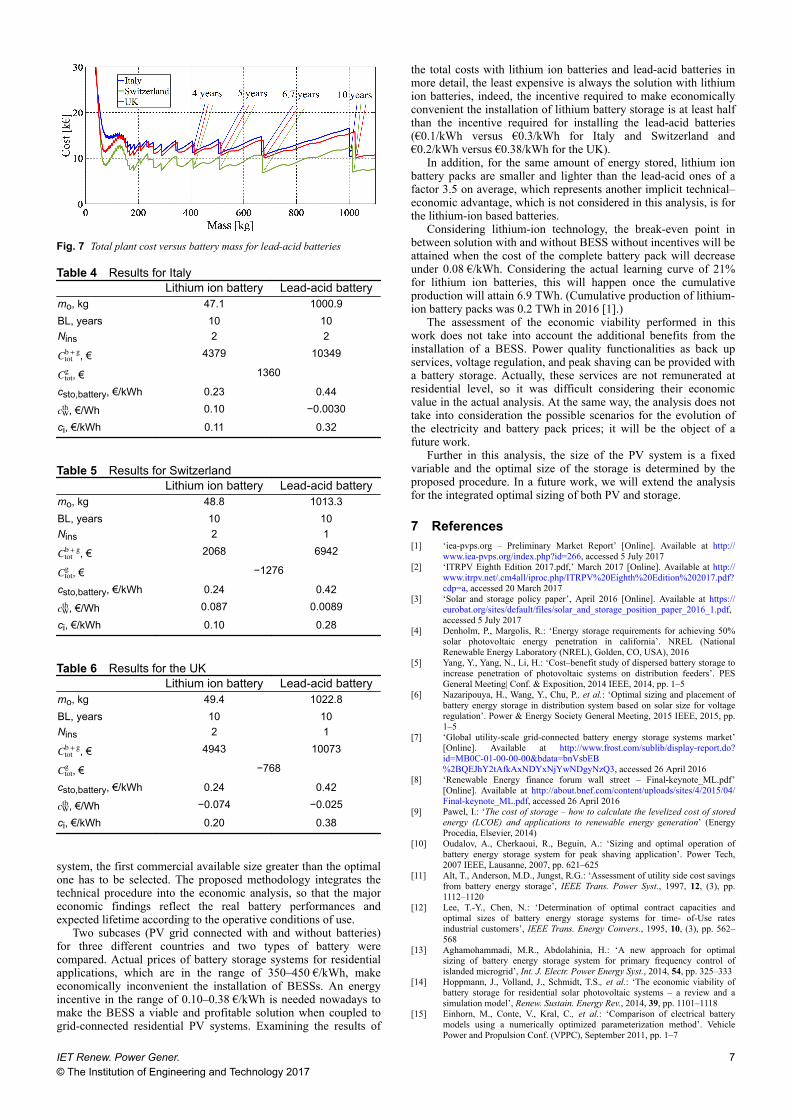
battery size are reported in Figs. 6 and 7 for lithium ion and lead-acid batteries, respectively.
It is worth noting that, in any case, when the mass values tendtowards zero, the total costs increase. This is a result of the factthat, for small storage masses, the number of replacements over theplant life increases. Consequently, the related battery fixedinstallation/disposal costs increase as well.
Conversely, when the mass value increases, the total costs tendto decrease until the battery fixed installation costs become lessthan the other costs because of the lower number of replacements.
Afterwards, there are several local minima which correspond tothe mass values for which the plant life is an integer multiple of thebattery life. In all the cases, the procedure was stopped when thebattery life exceeded 10 years. This was done to take into accountthe calendar ageing phenomenon according to the lifetime declaredby the battery manufacturers.
It is interesting to note that the costs related to the local minimaare not very different for each case. Taking into account that thespecific battery costs decrease over the years, a solution related to ashorter battery lifetime could be more reasonable considering theplant life of 20 years. For example, considering the Italian casewith lithium batteries (Fig. 6), the total cost related to a storage lifeequal to 5 years is 6.1 k€, while the optimal case, related to astorage life equal to 10 years, is 4.4 k€. In this case, the first choiceseems more reasonable to reduce the risk of the investment.Applying this consideration to all the cases, the mass of storages tobe installed is around 25 kg for lithium ion batteries and 180 kg forlead-acid batteries independently on the country.
After that, the total costs related to the case in which only thegrid is present, according to (17), were also calculated. Theseresults are reported in Tables 4–6 where these costs are comparedwith the best points of Figs. 6 and 7. Furthermore, the incentivesper kWh, according to (23), were calculated and reported in thesame tables.
Looking at the results, it is possible to state that, at present, thesolution with only the grid used as storage is more convenient in allthe cases. The reason for this stands in the actual high specific costof batteries. The expected cost reduction could change this result inthe next years. Moreover, it is possible to state that the solutionswith lead-acid batteries are always the least convenient. This isbecause their shorter lifetime makes their specific cost of energydelivered during their whole lifetime higher than the same cost oflithium ion batteries.
Looking at Tables 5 and 6, the total cost of the case withoutstorages, in Switzerland and in the UK, is negative. This meansthat the excess of generated energy compensates all the costs andgives an income. It is worth noting that in this income, the PV costis not considered, because this analysis is focused on the storage.
The cost threshold indicates the maximum specific cost ofbatteries, making them convenient. For instance, for lithiumbatteries, in the Italian case, this threshold is ∼0.10 €/Wh. Thismeans that, if the specific cost of the battery was <0.1 €/Wh, theinstallation of this battery would become convenient. In the case ofthe UK, the thresholds are negative. This means that theinstallation of storages, with actual costs of energy and auxiliaries,is never convenient, neither if the storage would be free of charge.This is because the cost of the grid (used as storage) is lower thanthe fixed costs (mainly the inverter) connected with the use ofbatteries.
Finally, looking at the incentives, ci, represents the necessaryincentive to be paid per exchanged kWh in order to make thestorage convenient. The value of this incentive is similar in theItalian and in the Switzerland cases, while it is necessary a higherincentive in the UK. This is because the cost of the grid (used asstorage) is much lower in the UK in comparison with Italy andSwitzerland.
6 ConclusionsIn this paper, the technical sizing procedure reported in [33], usedto find the minimum optimal mass of the battery storage for astand-alone PV plant, was extended to the case of battery storagefor grid-connected residential PV systems. In designing a real
Table 2 Main data of PV plants for the case studyItaly Switzerland UK
S, m2 35 48 60
ηPV 0.14ηI 0.9PL, years 20
Fig. 5 Electrical power consumption related to classic family composed offour people for each season, 2700 kWh/year
Table 3 Main data of batteries used in simulations
Lithium ion battery Lead-acid batteryVn, V 100 100Es, Wh/kg 128 35ηB 0.85 0.75EoL, % 80 80Life cycles at 80% DoD 3000 500cW, €/Wh 0.32 0.12KM 1.1 1cins, €/kg 2 0.5Cins_fix, € 100cr 0.0093dr 0.001CINV, € 800
Fig. 6 Total plant cost versus battery mass for lithium ion batteries
6 IET Renew. Power Gener.© The Institution of Engineering and Technology 2017
system, the first commercial available size greater than the optimalone has to be selected. The proposed methodology integrates thetechnical procedure into the economic analysis, so that the majoreconomic findings reflect the real battery performances andexpected lifetime according to the operative conditions of use.
Two subcases (PV grid connected with and without batteries)for three different countries and two types of battery werecompared. Actual prices of battery storage systems for residentialapplications, which are in the range of 350–450 €/kWh, makeeconomically inconvenient the installation of BESSs. An energyincentive in the range of 0.10–0.38 €/kWh is needed nowadays tomake the BESS a viable and profitable solution when coupled togrid-connected residential PV systems. Examining the results of
the total costs with lithium ion batteries and lead-acid batteries inmore detail, the least expensive is always the solution with lithiumion batteries, indeed, the incentive required to make economicallyconvenient the installation of lithium battery storage is at least halfthan the incentive required for installing the lead-acid batteries(€0.1/kWh versus €0.3/kWh for Italy and Switzerland and€0.2/kWh versus €0.38/kWh for the UK).
In addition, for the same amount of energy stored, lithium ionbattery packs are smaller and lighter than the lead-acid ones of afactor 3.5 on average, which represents another implicit technical–economic advantage, which is not considered in this analysis, is forthe lithium-ion based batteries.
Considering lithium-ion technology, the break-even point inbetween solution with and without BESS without incentives will beattained when the cost of the complete battery pack will decreaseunder 0.08 €/kWh. Considering the actual learning curve of 21%for lithium ion batteries, this will happen once the cumulativeproduction will attain 6.9 TWh. (Cumulative production of lithium-ion battery packs was 0.2 TWh in 2016 [1].)
The assessment of the economic viability performed in thiswork does not take into account the additional benefits from theinstallation of a BESS. Power quality functionalities as back upservices, voltage regulation, and peak shaving can be provided witha battery storage. Actually, these services are not remunerated atresidential level, so it was difficult considering their economicvalue in the actual analysis. At the same way, the analysis does nottake into consideration the possible scenarios for the evolution ofthe electricity and battery pack prices; it will be the object of afuture work.
Further in this analysis, the size of the PV system is a fixedvariable and the optimal size of the storage is determined by theproposed procedure. In a future work, we will extend the analysisfor the integrated optimal sizing of both PV and storage.
7 References[1] ‘iea-pvps.org – Preliminary Market Report’ [Online]. Available at http://
www.iea-pvps.org/index.php?id=266, accessed 5 July 2017[2] ‘ITRPV Eighth Edition 2017.pdf,’ March 2017 [Online]. Available at http://
www.itrpv.net/.cm4all/iproc.php/ITRPV%20Eighth%20Edition%202017.pdf?cdp=a, accessed 20 March 2017
[3] ‘Solar and storage policy paper’, April 2016 [Online]. Available at https://eurobat.org/sites/default/files/solar_and_storage_position_paper_2016_1.pdf,accessed 5 July 2017
[4] Denholm, P., Margolis, R.: ‘Energy storage requirements for achieving 50%solar photovoltaic energy penetration in california’. NREL (NationalRenewable Energy Laboratory (NREL), Golden, CO, USA), 2016
[5] Yang, Y., Yang, N., Li, H.: ‘Cost–benefit study of dispersed battery storage toincrease penetration of photovoltaic systems on distribution feeders’. PESGeneral Meeting| Conf. & Exposition, 2014 IEEE, 2014, pp. 1–5
[6] Nazaripouya, H., Wang, Y., Chu, P., et al.: ‘Optimal sizing and placement ofbattery energy storage in distribution system based on solar size for voltageregulation’. Power & Energy Society General Meeting, 2015 IEEE, 2015, pp.1–5
[7] ‘Global utility-scale grid-connected battery energy storage systems market’[Online]. Available at http://www.frost.com/sublib/display-report.do?id=MB0C-01-00-00-00&bdata=bnVsbEB%2BQEJhY2tAfkAxNDYxNjYwNDgyNzQ3, accessed 26 April 2016
[8] ‘Renewable Energy finance forum wall street – Final-keynote_ML.pdf’[Online]. Available at http://about.bnef.com/content/uploads/sites/4/2015/04/Final-keynote_ML.pdf, accessed 26 April 2016
[9] Pawel, I.: ‘The cost of storage – how to calculate the levelized cost of storedenergy (LCOE) and applications to renewable energy generation’ (EnergyProcedia, Elsevier, 2014)
[10] Oudalov, A., Cherkaoui, R., Beguin, A.: ‘Sizing and optimal operation ofbattery energy storage system for peak shaving application’. Power Tech,2007 IEEE, Lausanne, 2007, pp. 621–625
[11] Alt, T., Anderson, M.D., Jungst, R.G.: ‘Assessment of utility side cost savingsfrom battery energy storage’, IEEE Trans. Power Syst., 1997, 12, (3), pp.1112–1120
[12] Lee, T.-Y., Chen, N.: ‘Determination of optimal contract capacities andoptimal sizes of battery energy storage systems for time- of-Use ratesindustrial customers’, IEEE Trans. Energy Convers., 1995, 10, (3), pp. 562–568
[13] Aghamohammadi, M.R., Abdolahinia, H.: ‘A new approach for optimalsizing of battery energy storage system for primary frequency control ofislanded microgrid’, Int. J. Electr. Power Energy Syst., 2014, 54, pp. 325–333
[14] Hoppmann, J., Volland, J., Schmidt, T.S., et al.: ‘The economic viability ofbattery storage for residential solar photovoltaic systems – a review and asimulation model’, Renew. Sustain. Energy Rev., 2014, 39, pp. 1101–1118
[15] Einhorn, M., Conte, V., Kral, C., et al.: ‘Comparison of electrical batterymodels using a numerically optimized parameterization method’. VehiclePower and Propulsion Conf. (VPPC), September 2011, pp. 1–7
Fig. 7 Total plant cost versus battery mass for lead-acid batteries
Table 4 Results for ItalyLithium ion battery Lead-acid battery
mo, kg 47.1 1000.9BL, years 10 10Nins 2 2
Ctotb + g, € 4379 10349
Ctotg , € 1360
csto,battery, €/kWh 0.23 0.44
cWth, €/Wh 0.10 −0.0030
ci, €/kWh 0.11 0.32
Table 5 Results for SwitzerlandLithium ion battery Lead-acid battery
mo, kg 48.8 1013.3BL, years 10 10Nins 2 1
Ctotb + g, € 2068 6942
Ctotg , € −1276
csto,battery, €/kWh 0.24 0.42
cWth, €/Wh 0.087 0.0089
ci, €/kWh 0.10 0.28
Table 6 Results for the UKLithium ion battery Lead-acid battery
mo, kg 49.4 1022.8BL, years 10 10Nins 2 1
Ctotb + g, € 4943 10073
Ctotg , € −768
csto,battery, €/kWh 0.24 0.42
cWth, €/Wh −0.074 −0.025
ci, €/kWh 0.20 0.38
IET Renew. Power Gener.© The Institution of Engineering and Technology 2017
7
[16] Brumleve, T.: ‘Transmission line equivalent circuit models forelectrochemical impedances’, J. Electroanal. Chem., 1981, 126, pp. 73–104
[17] Mauracher, P., Karden, E.: ‘Dynamic modelling of lead/acid batteries usingimpedance spectroscopy for parameter identification’, J. Power Sources,1997, 67, pp. 69–84
[18] Ceraolo, M.: ‘New dynamical models of lead-acid batteries’, IEEE Trans.Power Syst., 2000, 15, (4), pp. 1184–1190
[19] Brenna, M., Foiadelli, F., Longo, M., et al.: ‘Lithium-ion battery: a simplifiedmodeling procedure and system simulation’. Int. Symp. on Power Electronics,Electrical Drives, Automation and Motion, SPEEDAM, 2016, pp. 1034–1040
[20] Barcellona, S., Grillo, S., Piegari, L.: ‘A simple battery model for EV rangeprediction: theory and experimental validation’. ESARS-ITEC, Toulouse,France, 2016, pp. 1–7
[21] Johnson, V.H., Pesaran, A.A., Sack, T.: ‘Temperature-dependent batterymodels for high-power lithium-ion batteries’. Symposium, Montreal, Canada,2000
[22] Bandhauer, T.M., Garimella, S., Fuller, T.F.: ‘A critical review of thermalissues in lithium-ion batteries’, J. Electrochem. Soc., 2011, 158, pp. R1–R25
[23] Jeon, D.H., Baek, S.M.: ‘Thermal modeling of cylindrical lithium ion batteryduring discharge cycle’, Energ. Convers. Manag., 2011, 52, pp. 2973–2981
[24] Wright, R., Motloch, C., Belt, J., et al.: ‘Calendar- and cycle-life studies ofadvanced technology development program generation 1 lithium-ionbatteries’, J. Power Sources, 2002, 110, (2), pp. 445–470
[25] Peterson, S.B., Apt, J., Whitacre, J.: ‘Lithium-ion battery cell degradationresulting from realistic vehicle and vehicle-to-grid utilization’, J. PowerSources, 2010, 195, (8), pp. 2385–2392
[26] Kötz, R., Ruch, P., Cericola, D.: ‘Aging and failure mode of electrochemicaldouble layer capacitors during accelerated constant load tests’, J. PowerSources, 2010, 195, (3), pp. 923–928
[27] Ecker, M., Gerschler, J.B., Vogel, J., et al.: ‘Development of a lifetimeprediction model for lithium-ion batteries based on extended acceleratedaging test data’, J. Power Sources, 2012, 215, pp. 248–257
[28] Eddahech, A., Briat, O., Vinassa, J.M.: ‘Strategy for lithium-ion batteryperformance improvement during power cycling’. 39th Annual Conf. of theIEEE Industrial Electronics Society, IECON 2013, Vienna, 2013, pp. 6806–6811
[29] Barcellona, S., Brenna, M., Foiadelli, F., et al.: ‘Analysis of ageing effect onLi-polymer batteries’, Sci. World J., 2015, 979321, p. 8
[30] Barcellona, S., Brenna, M., Foiadelli, F., et al.: ‘Battery lifetime for differentdriving cycles of EVs’. Proc. 2015 IEEE 1st Int. Forum on Research andTechnologies for Society and Industry, RTSI 2015, art. no. 7325138, pp. 446–450
[31] Redondo-Iglesias, E., Venet, P., Pélissier, S.: ‘Influence of the non-conservation of SoC value during calendar ageing tests on modelling thecapacity loss of batteries’. 2015 Tenth Int. Conf. on Ecological Vehicles andRenewable Energies (EVER), pp. 1–5
[32] Barcellona, S., Piegari, L., Tironi, E., et al.: ‘A methodology for a correctsizing of electrochemical storage devices’. Power and Energy EngineeringConf. (APPEEC), 2015 IEEE PES Asia-Pacific, Brisbane, QLD, 2015, pp. 1–7
[33] Barcellona, S., Piegari, L., Musolino, V.: ‘Correct sizing of a storage unit for aresidential PV plant’. 5th IET Int. Conf. on Renewable Power Generation(RPG) 2016, London, 2016, pp. 1–7
[34] IEEE Standard 1013: ‘IEEE recommended practice for sizing lead-acidbatteries for photovoltaic (PV) systems’,, 2000
[35] IEEE Standard 1561: ‘IEEE guide for selecting, charging, testing, andevaluating lead-acid batteries used in stand-alone photovoltaic (PV) systems’,,2014
[36] Musolino, V., Piegari, L., Tironi, E.: ‘Technical and economical evaluation ofstorage systems in naval applications’. 2013 Int. Conf. on Clean ElectricalPower (ICCEP), June 2013, pp. 120–127
[37] http://www.itmeteodata.com/itmeteotry-fotovoltaico.html, accessed on April2016
[38] http://www.soda-pro.com/web-services/radiation/helioclim-3-for-free,accessed on March 2016
[39] http://www.meteonorm.com/, accessed on March 2016[40] http://www.esru.strath.ac.uk/EandE/Web_sites/06-07/Carbon_neutral/tools
%20folder/Demand%20Profile%20Generators.htm, accessed on April 2016[41] Nykvist, B., Nilsson, M.: ‘Rapidly falling costs of battery packs for electric
vehicles’, Nat. Climate Change., 2015, 5, pp. 329–332
[42] Brown, D.H.: ‘The impact of rechargeable batteries: quantifying the cost andweight for a marine infantry battalion’. Thesis, Naval Postgraduate School,Monterey, California
[43] http://www.altenergymag.com/content.php?post_type=1884, accessed onMarch 2017
8 Appendix Let us define the following terms:
Cgridb + g = 20 cbuyEbuy
b + g + csellEsellb + g + Cg ag (24)
Cgridg = 20 cbuyEbuy
g + csellEsellg + Cg ag (25)
The total costs related to the two cases under analysis are thenfound as follows:
Ctotb + g = Cbattery + Cgrid
b + g (26)
Ctotg = Cgrid
g . (27)
In order to calculate the specific battery cost threshold, we have toimpose the following equality:
Ctotb + g = Ctot
g . (28)
By solving (28) with respect to the specific battery cost, (21) isfound.
Under the hypothesis that the annual energy produced by PVs isat least higher than that absorbed by the load and unitary efficiencyof the battery, the total costs, related to the two cases underanalysis, can also be decomposed by expressing (11), (24), and(25) as follows:
Cbattery = cint, batteryEstoredab + CINVa + Cins_fix
a + Nins m0 cins ab (29)
Cgridb + g = csellEsold + Cg ag (30)
Cgridg = csto, gridEstored + csellEsold + Cg ag (31)
where
Estored = 12 ∫
20 years
Pstored dt; Esold = ∫20 years
Psolddt .
Estored is the energy exchanged with the battery or with the grid,while Esold is the energy sold to the grid, both of which areexpressed in kWh and calculated over the plant life. As was donefor (21), let us impose an equality between the two total costs,using (29)–(31) and, solving with respect to the specific batterycost, (22) is found.
8 IET Renew. Power Gener.© The Institution of Engineering and Technology 2017