Stop-and-Frisk in the de Blasio Era...4 NUMBER OF REPORTED STOPS BY YEAR, 2002-2017 Figure 1 Since...
34
MARCH 2019 Stop-and-Frisk in the de Blasio Era
Transcript of Stop-and-Frisk in the de Blasio Era...4 NUMBER OF REPORTED STOPS BY YEAR, 2002-2017 Figure 1 Since...

1MARCH 2019
Stop-and-Frisk in the de Blasio Era

ACKNOWLEDGEMENTS
This report was authored by Legal Director Christopher Dunn and Research and Data Strategist Michelle Shames and edited by Communications Director Diana Lee. The report authors would like to thank John Paraskevopoulos, Abby Allender, Alexis Williams, and Donna Lieberman for their support.
ABOUT THE NYCLU
The New York Civil Liberties Union (NYCLU) is one of the nation’s foremost defenders of civil liberties and civil rights. Founded in 1951 as the New York affiliate of the American Civil Liberties Union, the NYCLU is a not-for-profit, nonpartisan organization with eight chapters and regional offices and more than 180,000 members across the state. The NYCLU’s mission is to defend and promote the fundamental principles and values embodied in the Bill of Rights, the U.S. Constitution, and the New York Constitution, including freedom of speech and religion, and the right to privacy, equality and due process of law for all New Yorkers. For more information, please visit www.nyclu.org.

1
The New York City Police Department’s aggressive stop-and-frisk program exploded into a national controversy during the mayoral administration of Michael Bloomberg, as the number of NYPD stops each year grew to hundreds of thousands. Most of the people stopped were black and Latino, and nearly all were innocent. Stop-and-frisk peaked in 2011, when NYPD officers made nearly 700,000 stops.
As stop-and-frisk rose dramatically during the Bloomberg years, the New York Civil Liberties Union used New York’s Freedom of Information Law to obtain and regularly report to the public information about NYPD stops. The NYCLU expanded its reporting on police stops when it successfully sued to obtain the database the NYPD was compiling with the details of each stop.
Using information from the database, the NYCLU in May 2012 released a report analyzing NYPD stop-and-frisk activity in 2011 with a level of detail never before available to the public. That report helped propel stop-and-frisk to the forefront of the unfolding campaigns to succeed Mayor Bloomberg. One candidate who embraced stop-and-frisk reform was then-Public Advocate Bill de Blasio, who at the time was considered a long-shot candidate.
De Blasio would go on to win the election in November 2013. By then, public pressure had forced Mayor Bloomberg and his police commissioner Raymond Kelly to start scaling back stop-and-frisk activity, and three federal cases — one led by the NYCLU — had resulted in court orders forcing sweeping reform of the NYPD’s stop-and-frisk program.
Since Mayor de Blasio came into office in January 2014, NYPD stops have plummeted, with reported stops now hovering near 10,000 per year. Though the NYCLU believes the actual number of stops is considerably higher because officers are failing to document many stops, current stop activity undoubtedly is a small fraction of what it was during the Bloomberg years.
Notably, as stops have receded, crime in New York City has dropped significantly, with 2018 seeing the lowest number of recorded homicides in nearly 70 years. This corresponding drop in the murder rate demonstrates just how false and alarmist were the claims made during the Bloomberg years that murders would soar if stop-and-frisk were curtailed.
Yet, in recent years, false narratives about stop-and-frisk have reemerged. President Trump has continued to call for a nation-wide stop-and-frisk program, despite the fact that a significant decrease in New York City’s stop-and-frisk activity was followed by a decrease in crime and despite evidence of the devastating toll of stop-and-frisk on black and Latino communities.
In this report, the NYCLU examines stop-and-frisk activity during the first four years of the de Blasio Administration, using 2011 as a benchmark. This report follows the same format of the NYCLU’s report about stop-and-frisk in 2011, allowing a ready comparison of recent stop-and-frisk activity and that of 2011.
INTRODUCTION

2
• The number of reported NYPD stops has drastically declined since 2011, the height of stop-and-frisk in New York City. In 2017, 11,629 stops were reported, marking a 98 percent decrease from the number reported in 2011.
• The 92,383 reported stops between 2014 and 2017 were spread unevenly amongst the city’s 77 precincts, with the 106th Precinct (Ozone Park South, Howard Beach in Queens) leading the city with 5,184 reported stops. Setting aside the Central Park Precinct (22nd), the 6th Precinct (Greenwich Village, SoHo in Manhattan) had the fewest reported stops at 224.
• Four of every five reported stops were of black or Latino people. In 73 out of 77 precincts, more than 50 percent of reported stops were of black and Latino people, and in 30 precincts, they accounted for more than 90 percent of reported stops. In six of the 10 precincts with the lowest proportion of black and Latino residents (such as the 6th Precinct where they account for eight percent of the population), black and Latino people accounted for more than 70 percent of stops.
• Young black and Latino males continue to be the targets of a hugely disproportionate number of stops. While they account for five percent of the city’s population, black and Latino males between the ages of 14 and 24 accounted for 38 percent of reported stops between 2014 and 2017. Young black and Latino males were innocent — that is, neither arrested nor received a summons — 80 percent of the time.
• Though frisks are to be conducted only when an officer reasonably suspects the person has a weapon that poses threat to the officer’s safety, 66 percent of reported stops led to frisks, of which over 93 percent resulted in no weapon being found.
• Frisks varied enormously by precinct. Officers in the 44th Precinct (Concourse, Highbridge in the Bronx) reported frisking 86 percent of the people they stopped, as compared to a low of 37 percent of people stopped being frisked in the 1st Precinct (Financial District, TriBeCa in Manhattan).
• Black and Latino people were more likely to be frisked than whites and, among those frisked, were less likely to be found with a weapon.
• Of the 73,055 reported stops of innocent people between 2014 and 2017, 64 percent were frisked, and 24 percent had force used against them. The 106th Precinct led the city in reported stops of innocent people with 4,672 such stops, and the 6th Precinct had the fewest with 177. The 121st Precinct (New Springville, Elm Park in Staten Island) had the largest proportion of innocent stops, with 92 percent of stops of innocent people, and the 40th Precinct (Mott Haven, Melrose in the Bronx) had the lowest at 40 percent.
HIGHLIGHTS

3
STOPS

4
NUMBER OF REPORTED STOPS BY YEAR, 2002-2017
Figure 1
Since 2002, the NYPD has reported stopping people in New York City 5,174,072 times.1 Between 2014 and 2017, Mayor Bill de Blasio’s first term in office, the NYPD reported 92,383 stops. By contrast, between 2010 and 2013, which were the last four years of the Bloomberg administration, the NYPD reported 2,011,771 stops. The number of stops in 2017 (11,629 stops), the most recent year for which annual stop data is available, marked a 98 percent decrease in reported stops from the height of stop-and-frisk in 2011.
1 The NYPD’s stop-and-frisk procedure does not require officers to report level one stops (where an officer can request information from someone for an articulable reason) or level two stops (often called “common law right of inquiry,” where an officer’s questioning can be more accusatory, based on a suspicion of criminal activity). The numbers in this report are based exclusively on level three stops that were reported.
STOPS
700,000
600,000
500,000
400,000
300,000
200,000
100,00
0
200
2
200
3
200
4
200
5
200
6
200
7
200
8
200
9
2010
2011
2012
2013
2014
2015
2016
2017
97,296
160,851
11,62912,404 22,563
191,851
532,911
685,724
601,285
581,168
506,491540,302
472,096
45,787
313,523
398,191

5
The number of stops in the four-year period between 2014 and 2017 varied widely by precinct. The 106th Precinct (Ozone Park South, Howard Beach in Queens) led the city with 5,184 stops. Excluding the Central Park Precinct (with 191 stops), the 6th Precinct (Greenwich Village, SoHo in Manhattan) had the fewest stops at 224. The top and bottom five precincts were as follows:
2 Stops by precinct were calculated by combining annual precinct totals from the four years under review. Because the 2014 totals were much larger than in any of the following years, the precincts’ 2014 numbers had a disproportionate impact on the combined four-year ranking. As such, the four-year precinct ranking does not capture any recent progress, or lack thereof.
3 Precinct demographics are based on census-block-to-precinct mapping (credit: John Keefe) and 2010 Census data. While more recent citywide demographic information is available, block level data, the level needed to accurately map precincts, is only published every 10 years.
Stops by Precinct2
REPORTED STOPS BY PRECINCT, 2014-2017
Figure 2
*Majority black and Latino precincts.3
TOP 5
Precinct Neighborhoods Stops
106Ozone Park (south), Howard Beach
5,184
120West Brighton, Rosebank*
2,910
121New Springville, Elm Park
2,757
105Queens Village, Rosedale*
2,604
40 Mott Haven, Melrose* 2,572
BOTTOM 5
Precinct Neighborhoods Stops
94 Greenpoint 379
17Kipps Bay, Murray Hill, Turtle Bay
374
68Bay Ridge, Dyker Heights
350
1Financial District, TriBeCa
240
6Greenwich Village, SoHo
224

6
4 The precinct with the highest stop percentage when measured against its resident population was the Midtown South Precinct (14th) in the Times Square area, at 5.4 percent. Because this precinct sees enormous influxes of people who are not residents, this precinct was excluded from this table (but only from this table).
When stops are measured as a percentage of precinct populations, there was also a wide range among precincts. Setting aside one atypical precinct covering much of Times Square, the 106th Precinct had the greatest percentage of stops as measured against its population, with the number of reported stops between 2014 and 2017 representing four percent of the total population. The 68th Precinct (Bay Ridge, Dyker Heights in Brooklyn) had the lowest percentage at 0.28 percent. The top and bottom five precincts were as follows:
TOP 5
Precinct Neighborhoods Stops/Pop
106Ozone Park (south), Howard Beach
4.23%
84Brooklyn Heights, DUMBO, Boerum Hill
3.55%
41 Hunts Point* 3.43%
25 East Harlem (north)* 3.37%
40 Mott Haven, Melrose* 2.81%
BOTTOM 5
Precinct Neighborhoods Stops/Pop
1Financial District, TriBeCa
0.36%
115 Jackson Heights* 0.35%
108Long Island City (south), Sunnyside, Woodside
0.34%
61 Sheepshead Bay 0.34%
68Bay Ridge, Dyker Heights
0.28%
REPORTED STOPS AS A PERCENTAGE OF THE RESIDENT POPULATION, 2014-2017
Figure 3
STOPS
* Majority black and Latino precincts. Central Park excluded due to lack of demographic data.

7
When officers make a stop, they are required to record information, including the reason for the stop, on what is known as a “stop report.” The most common reason reported between 2014 and 2016 was “fits a relevant description,” with officers identifying that as a reason in nearly half of all stops (43 percent, or 34,779 stops). In 2017, when the categories from which officers could chose changed, the most common reason given was “matches a specific suspect description” (54 percent, or 6,292 stops). “Furtive movement” had consistently been the most common stop justification provided for over a decade. This number began to sharply decline starting in 2014, and in 2017 was no longer listed as an option on stop forms.
2014-2016
Reason Stops% of Total Stops
Fits a relevant description 34,779 43.1%
Furtive movement 33,388 18.0%
Casing a victim or location 26,957 13.7%
Acting as a lookout 19,229 7.2%
Actions of engaging in a violent crime
7,220 7.1%
Suspicious bulge 16,107 6.1%
Actions indicative of a drug transaction
15,536 5.1%
Wearing clothes commonly used in a crime
13,969 3.2%
Carrying a suspicious object 13,323 2.9%
Other 34,387 43.4%
2017
REPORTED REASONS FOR A STOP
Figure 4
Reason Stops% of Total Stops
Matches a specific suspect description
6,292 54.1%
Proximity to the scene of a crime
4,283 36.8%
Concealing or possessing a weapon
1,672 14.4%
Casing victim or location 779 6.7%
Engaging in a drug transation
337 2.9%
Acting as a lookout 334 2.9%
Indentified crime pattern 117 1.5%
Other 3,385 29.1%
Justifications of Reported Stops
Note: An officer may check more than one reason for a stop.

8
It is notable that “actions of engaging in a violent crime” was a reason listed in only seven percent of reported stops between 2014 and 2016, a category that was removed from the stop form in 2017. During the height of stop-and-frisk, the NYPD routinely argued that the disproportionate number of stops of black people was justified because, according to the department, black people are disproportionately involved in violent crimes. Given that over 90 percent of stops had nothing to do with a suspected violent crime, the race of those convicted of violent crimes generally cannot explain the disproportionate number of black people stopped every year.
STOPS
9
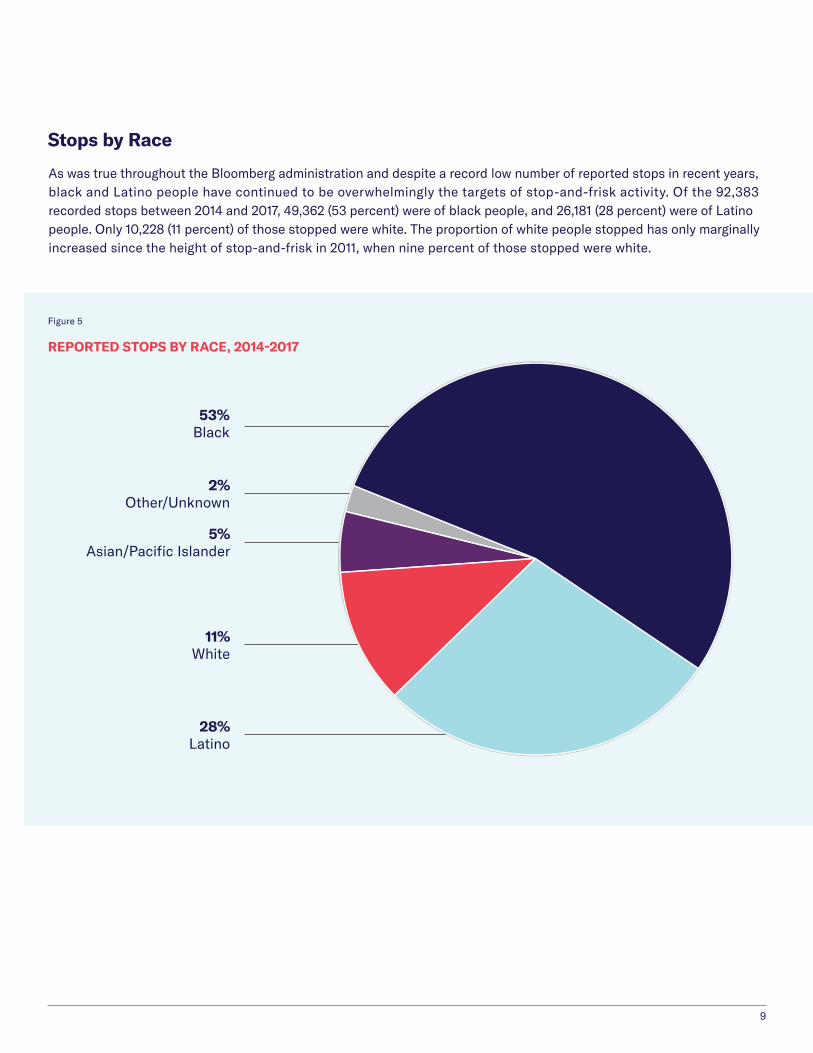
As was true throughout the Bloomberg administration and despite a record low number of reported stops in recent years, black and Latino people have continued to be overwhelmingly the targets of stop-and-frisk activity. Of the 92,383 recorded stops between 2014 and 2017, 49,362 (53 percent) were of black people, and 26,181 (28 percent) were of Latino people. Only 10,228 (11 percent) of those stopped were white. The proportion of white people stopped has only marginally increased since the height of stop-and-frisk in 2011, when nine percent of those stopped were white.
Stops by Race
REPORTED STOPS BY RACE, 2014-2017
Figure 5
53% Black
2% Other/Unknown
11% White
28% Latino
5% Asian/Pacific Islander

10
In this four-year period, stops of black and Latino people accounted for more than half of all stops in 73 out of 77 precincts. Led by the 44th Precinct in the Bronx, where 99 percent of stops were of black or Latino people, there were 30 precincts where more than 90 percent of those stopped were black or Latino, and an additional 29 precincts where more than 75 percent of those stopped were black or Latino. By contrast, the lowest percentage was in the 123rd Precinct (Tottenville, Rossville in Staten Island) where 24 percent of those stopped were black or Latino. The top and bottom five precincts were as follows:
TOP 5
Precinct Neighborhoods Black, Latino
44Concourse, Highbridge*
98.5%
46University Heights, Morris Heights, Fordham (south)*
97.0%
67 East Flatbush* 97.0%
73Brownsville, Ocean Hill*
96.9%
69 Canarsie 96.8%
BOTTOM 5
Precinct Neighborhoods Black, Latino
111Bayside, Douglaston, Little Neck
53.1%
68Bay Ridge, Dyker Heights
44.0%
62 Bensonhurst 42.7%
122New Dorp, Great Kills
37.9%
123 Tottenville, Rossville 23.5%
STOPS OF BLACK AND LATINO PEOPLE AS A PERCENTAGE OF REPORTED STOPS, 2014-2017
Figure 6
STOPS
* Majority black and Latino precincts.

11
The NYPD has also sought to justify the high percentages of stops of black and Latino people by contending that those high percentages merely reflect the concentration of stop-and-frisk activity in high-crime precincts that are populated by majority black and Latino residents. While there are many responses to this contention, the NYPD data are striking in what they reveal about the large percentages of black and Latino people being stopped in precincts that have substantial percentages of white residents.
For instance, the population of the 17th Precinct, which covers the East Side of Manhattan, has the lowest percentage of black and Latino residents in the city at eight percent, yet 74 percent of those stopped between 2014 and 2017 in that precinct were black or Latino. Similarly, the 6th Precinct, covering Greenwich Village and SoHo in Manhattan, is eight percent black and Latino, yet 80 percent of people stopped there were black or Latino.
As highlighted in Figure 7, in only one of the 10 precincts with the lowest black and Latino population did black and Latino stops account for less than half of all reported stops. Regardless of neighborhood composition, and the declining number of stops annually, black and Latino people remain dispropor-tionately targeted by the NYPD’s stop-and-frisk practices.
Precinct NeighborhoodsBlack & Latino Population (out of total residents)
Black & Latino Population (out of total stops)
17Kipps Bay, Murray Hill, Turtle Bay
7.8% 74.1%
6Greenwich Village, SoHo
8.0% 79.5%
19 Upper East Side 9.0% 76.4%
123Tottenville, Bay Terrace
9.4% 23.5%
1Financial District, TriBeCa
10.0% 74.6%
61 Sheepshead Bay 11.5% 56.8%
111Bayside, Douglaston, Little Neck
12.1% 53.1%
20Upper West Side (north)
12.1% 76.6%
13Gramercy, Stuyvesant Town
13.8% 72.1%
62 Bensonhurst 14.1% 42.7%
STOPS IN THE 10 PRECINCTS WITH THE SMALLEST BLACK AND LATINO RESIDENT POPULATION, 2014-2017
Figure 7

12
STOPS OF MALES AGED 14-24 BY RACE, 2014-2017
Figure 8
This is even more so the case for young black and Latino males between the ages of 14 and 24, who account for only five percent of the city’s population, compared with 38 percent of reported stops. By contrast, white males between the ages of 14 and 24 make up two percent of the city’s population but accounted for four percent of reported stops. In other words, while young white males accounted for double the number of stops compared with their representation in the New York City population, young black and Latino males accounted for eight times more stops than their share of the population.
STOPS
3.9% (3,559) Young White Males
and 2.0% (160,826)
of NYC’s population
24.9% (22,998) Young Black Males
but only 1.9% (158,406) of NYC’s population
12.8% (11,193) Young Latino Males
but only 2.8% (226,677)
of NYC’s population

13
FRISKS AND WEAPON
RECOVERY

14
Though the term “stop-and-frisk” is often used, stops and frisks are two separate acts that require different levels of legal justification. To stop a person, a police officer must have reasonable suspicion the person has committed, is com-mitting, or is about to commit an unlawful act. To frisk a person, however, the bar is much higher — the officer must have reason to believe the person stopped has a weapon that poses a threat to the officer’s safety.
Notwithstanding the higher and more specific legal standard that must be met to conduct a frisk, stop data from 2014 to 2017 indicate that NYPD officers were routinely frisking people. Of the 92,383 stops reported during this period, officers conducted frisks in 66 percent (60,583) of them.5 While this figure alone strongly suggests that officers were engaging in far too many frisks, the concern that officers were unjustifiably frisking people is clearly demonstrated by the fact that no weapons were found in over 93 percent of frisks during this four-year period.
5 In 18,335 stops (19.8 percent of all reported stops), officers conducted full searches of the person stopped.
FRISKS AND WEAPON RECOVERY
Figure 9
No weapons were recovered in 93.5% of frisks
15
No weapons were recovered in 93.5% of frisks
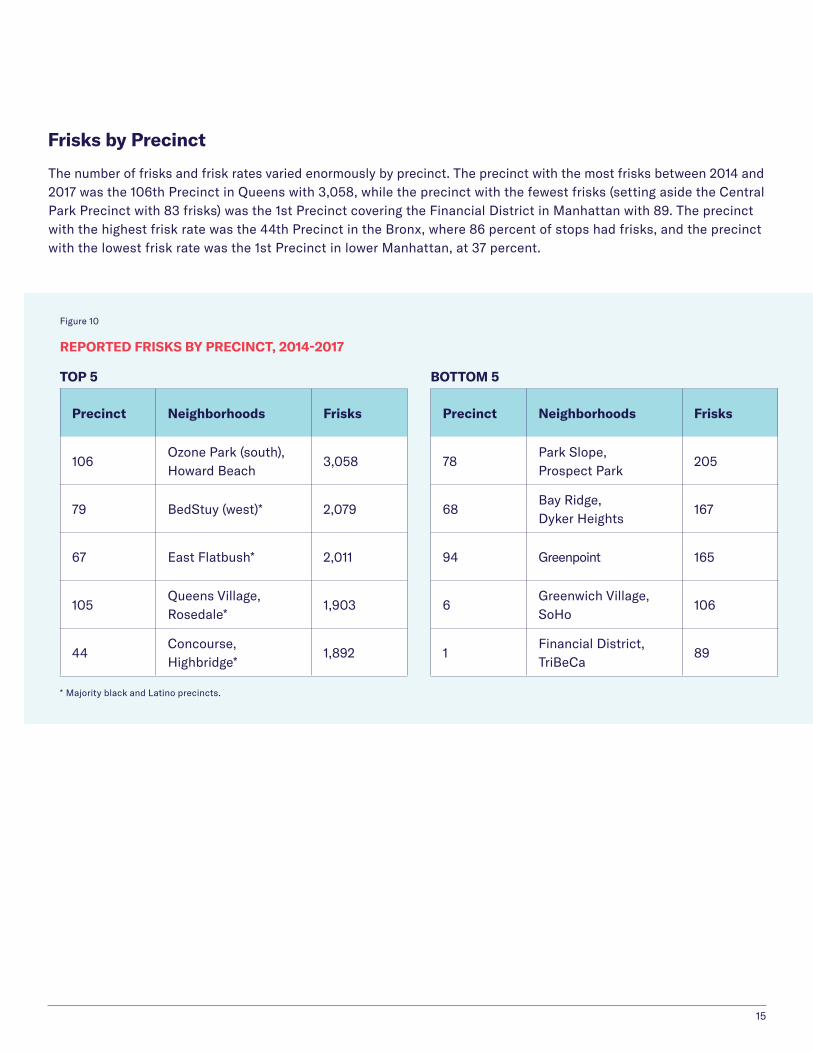
The number of frisks and frisk rates varied enormously by precinct. The precinct with the most frisks between 2014 and 2017 was the 106th Precinct in Queens with 3,058, while the precinct with the fewest frisks (setting aside the Central Park Precinct with 83 frisks) was the 1st Precinct covering the Financial District in Manhattan with 89. The precinct with the highest frisk rate was the 44th Precinct in the Bronx, where 86 percent of stops had frisks, and the precinct with the lowest frisk rate was the 1st Precinct in lower Manhattan, at 37 percent.
Frisks by Precinct
TOP 5
Precinct Neighborhoods Frisks
106Ozone Park (south), Howard Beach
3,058
79 BedStuy (west)* 2,079
67 East Flatbush* 2,011
105Queens Village, Rosedale*
1,903
44Concourse, Highbridge*
1,892
BOTTOM 5
Precinct Neighborhoods Frisks
78Park Slope, Prospect Park
205
68Bay Ridge, Dyker Heights
167
94 Greenpoint 165
6Greenwich Village, SoHo
106
1Financial District, TriBeCa
89
REPORTED FRISKS BY PRECINCT, 2014-2017
Figure 10
* Majority black and Latino precincts.

16
TOP 5
Precinct Neighborhoods Frisks/Stops
44Concourse, Highbridge*
85.9%
52Bedford Park, Fordham (north), Norwood*
83.6%
79 BedStuy (west)* 82.9%
48East Tremont, Belmont*
82.7%
46University Heights, Morris Heights, Fordham (south)*
80.4%
BOTTOM 5
Precinct Neighborhoods Frisks/Stops
5 Chinatown, Little Italy 44.5%
123 Tottenville, Rossville 43.7%
94 Greenpoint 43.5%
20Upper West Side (south)
41.9%
1Financial District, TriBeCa
37.1%
FRISKS AS A PERCENTAGE OF REPORTED STOPS, 2014-2017
Figure 11
FRISKS AND WEAPON RECOVERY
* Majority black and Latino precincts.

17
Frisks by Race
Given that far more stops between 2014 and 2017 were of black and Latino people than of white people, one would expect that more black and Latino people would be frisked, and that was true. Of 60,583 frisks, 51,061 (84 percent) were conducted during stops of black or Latino people. By contrast, only 5,573 frisks (nine percent) were during stops of white people.
What one would not expect and what raises further concerns about ongoing racial bias in the NYPD’s stop-and-frisk program is that in each of the four years between 2014 and 2017, compared to white people stopped, black and Latino people stopped were also more likely to be frisked, and among those frisked, were less likely to be found with a weapon. Of black and Latino people stopped, 68 percent were frisked, while over 54 percent of white people stopped were frisked. Yet, a weapon was found on just six percent of black and Latino people frisked, compared to a weapon being found on nine percent of white people frisked. Considering that people of color who were frisked were less likely to be carrying a weapon, this indicates that race remains a biasing factor in officers’ decisions to conduct a frisk.
REPORTED FRISKS BY RACE, 2014-2017
Figure 12
0
5,000
10,000
15,000
20,000
25,000
30,000
35,000
33,925 Black
17,136 Latino
5,573 White 3,949
Other

18
PERCENTAGE OF REPORTED STOPS RESULTING IN A FRISK, 2014-2017
PERCENTAGE OF REPORTED FRISKS RESULTING IN A WEAPON FOUND, 2014-2017
Figure 13
0%
10%
20%
30%
40%
50%
60%
70%
80%
0%
2%
4%
6%
8%
10%68.7% Black
5.7% Black
65.5% Latino 7.7%
Latino54.5% White
9.2% White
6 An additional 82 guns were found during stops that did not include frisks.
Figure 14
* Note differences in scales between the two graphs.
FRISKS AND WEAPON RECOVERY
Gun Recovery
Of the 6.5 percent of frisks that resulted in recovery of a weapon, less than one-quarter were guns. Between 2014 and 2017, a total of 793 reported frisks resulted in the recovery of a gun, equivalent to only one percent of total frisks.6
No Gun
Gun

USE OF FORCE
19

20
In some circumstances, officers are authorized to use physical force during a stop. On stop reports, officers must indicate if force was used and, if so, which type of force. Between 2014 and 2017 at least one act of force was reported in 25,661 stops (28 percent of all stops). In many cases, more than one act of force was used, with a total of 33,523 acts of force being used.
In 2017, the categories of force provided on the stop form changed to the grouping listed below in the right table of Figure 15.
USE OF FORCE
2014-2016
Type of Force Incidents % of Stops
Hands on suspect
12,349 15.3%
Handcuffed suspect 9,962 12.3%
Suspect against wall/car
3,732 4.6%
Drew firearm 1,066 1.3%
Suspect on ground 909 1.1%
Pointed firearm at suspect
746 0.9%
Pepper spray 21 0.03%
Baton 18 0.02%
Other 1,649 2.0%
2017
REPORTED INCIDENTS OF PHYSICAL FORCE
Figure 15
Reason Incidents % of Stops
Handcuffed suspect 1,921 16.5%
Drawing/pointing firearm 463 4.0%
Physical force/restraint 373 3.2%
Taser 16 0.14%
Impact weapon 6 0.05%
O.C. Spray 3 0.03%
Other 289 2.49%
Note: An officer may use more than one type of force during a stop. These incidents represent each use of force and do not reflect the number of stops where force was used.

21
Use of Force by Precinct
Use of force during stops varied widely across the city. The 44th Precinct in the Bronx had the most stops where force was used, with 1,215. Setting aside the Central Park Precinct (with 41 stops where force was used), the 68th Precinct (Bay Ridge, Dyker Heights in Brooklyn) had the fewest with 65. The 44th Precinct had the highest proportion of stops where force was used, with force being used in 55 percent of stops. By contrast, the 66th Precinct (Borough Park, Kensington in Brooklyn) had the lowest proportion of stops where force was used at 15 percent. The top and bottom five precincts by number of stops where force was used and force rates were as follows:
NUMBER OF REPORTED STOPS WHERE FORCE WAS USED, 2014-2017
Figure 16
*Majority black and Latino precincts.
TOP 5
Precinct Neighborhoods Force
44Concourse, Highbridge*
1,215
106Ozone Park (south), Howard Beach
1,050
40 Mott Haven, Melrose* 902
105Queens Village, Rosedale*
854
41 Hunts Point* 851
BOTTOM 5
Precinct Neighborhoods Force
6Greenwich Village, SoHo
93
78Park Slope, Prospect Park
90
1Financial District, TriBeCa
89
94 Greenpoint 87
68Bay Ridge, Dyker Heights
65

22
USE OF FORCE
STOPS WHERE FORCE WAS USED AS A PERCENTAGE OF REPORTED STOPS, 2014-2017
Figure 17
*Majority black and Latino precincts.
TOP 5
Precinct Neighborhoods Force/ Stops
44Concourse, Highbridge*
55.2%
41 Hunts Point* 47.5%
48East Tremont, Belmont*
45.8%
47Eastchester, Wakefield, Williamsbridge*
45.6%
46University Heights, Morris Heights, Fordham (south)*
44.9%
BOTTOM 5
Precinct Neighborhoods Force/ Stops
90 Williamsburg 17.4%
107Jamaica (north), Fresh Meadows, Hillcrest
16.9%
63 Mill Basin, Flatlands* 16.5%
112Forest Hills, Rego Park
16.1%
66Borough Park, Kensington
14.5%
23
Use of Force by Race
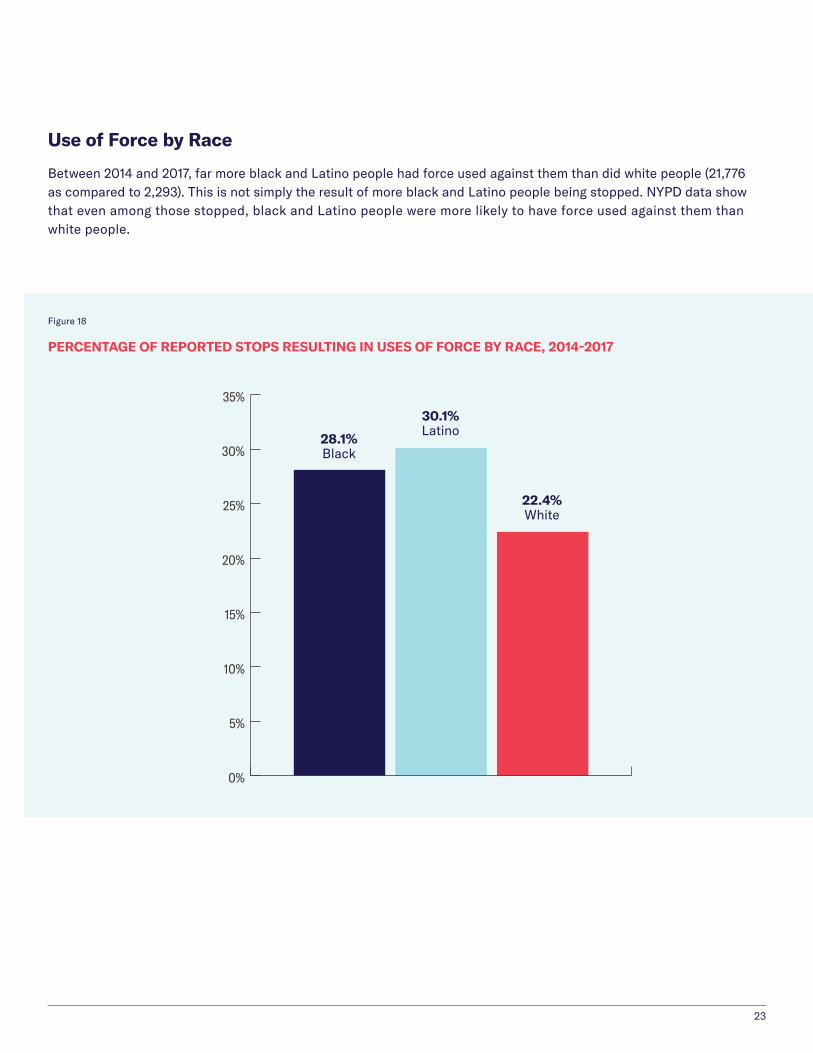
Between 2014 and 2017, far more black and Latino people had force used against them than did white people (21,776 as compared to 2,293). This is not simply the result of more black and Latino people being stopped. NYPD data show that even among those stopped, black and Latino people were more likely to have force used against them than white people.
PERCENTAGE OF REPORTED STOPS RESULTING IN USES OF FORCE BY RACE, 2014-2017
Figure 18
28.1% Black
30.1% Latino
22.4% White
0%
5%
10%
15%
20%
25%
30%
35%

STOPS OF INNOCENT PEOPLE
24

25
Of the 92,383 stops reported between 2014 and 2017, 73,055 (79 percent) were of people who had engaged in no unlawful behavior, as evidenced by the fact they were neither issued a summons nor arrested. More than half of the innocent people stopped were frisked (46,669, or 64 percent), and one-quarter had force used against them (17,641, or 24 percent).
Since the height of stop-and-frisk in 2011, the proportion of stops of innocent people has dropped 25 percent. From 2004 to 2013, between 86 and 90 percent of annual stops were of people who were innocent, compared with 67 percent in 2017. While this represents an improvement, still nearly seven of every 10 people stopped have committed no crime.
Innocent by Precinct
In addition to being the precinct with the most stops between 2014 and 2017, the 106th Precinct in Queens stopped the most innocent people, 4,672. By contrast, with the exception of the Central Park Precinct (with 177 innocent stops, 93 percent of all stop in that precinct), the smallest number of innocent people stopped was 177 in the 6th Precinct (Greenwich Village, SoHo in Manhattan). The top and bottom five precincts are as follows:
NUMBER OF REPORTED INNOCENT STOPS, 2014-2017
Figure 19
*Majority black and Latino precincts.
TOP 5
Precinct Neighborhoods Stops
106Ozone Park (south), Howard Beach
4,672
120West Brighton, Rosebank*
2,611
121New Springville, Elm Park
2,526
67 East Flatbush* 2,278
105Queens Village, Rosedale*
2,142
BOTTOM 5
Precinct Neighborhoods Stops
17Kipps Bay, Murray Hill, Turtle Bay
291
26 Morningside Heights 286
68Bay Ridge, Dyker Heights
258
1Financial District, TriBeCa
209
6Greenwich Village, SoHo
177
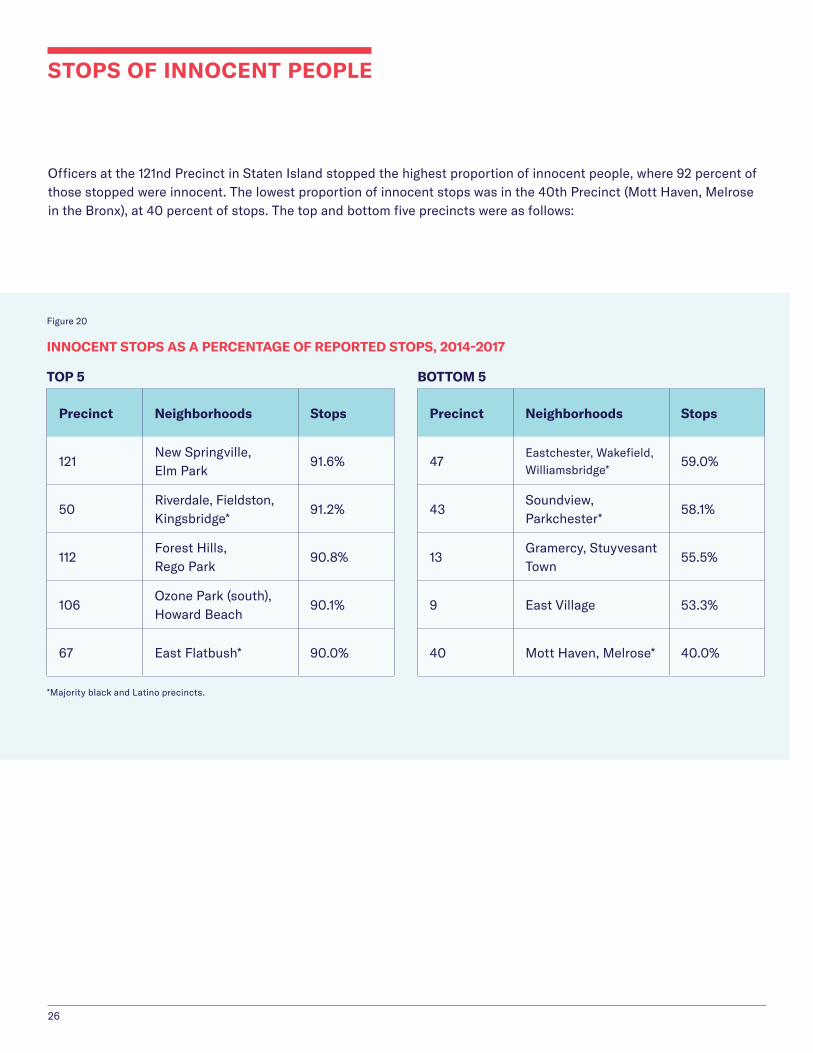
Officers at the 121nd Precinct in Staten Island stopped the highest proportion of innocent people, where 92 percent of those stopped were innocent. The lowest proportion of innocent stops was in the 40th Precinct (Mott Haven, Melrose in the Bronx), at 40 percent of stops. The top and bottom five precincts were as follows:
26
STOPS OF INNOCENT PEOPLE
INNOCENT STOPS AS A PERCENTAGE OF REPORTED STOPS, 2014-2017
Figure 20
*Majority black and Latino precincts.
TOP 5
Precinct Neighborhoods Stops
121New Springville, Elm Park
91.6%
50Riverdale, Fieldston, Kingsbridge*
91.2%
112Forest Hills, Rego Park
90.8%
106Ozone Park (south), Howard Beach
90.1%
67 East Flatbush* 90.0%
BOTTOM 5
Precinct Neighborhoods Stops
47Eastchester, Wakefield, Williamsbridge*
59.0%
43Soundview, Parkchester*
58.1%
13Gramercy, Stuyvesant Town
55.5%
9 East Village 53.3%
40 Mott Haven, Melrose* 40.0%

Of the 73,055 stops of innocent people between 2014 and 2017, 39,522 were of black people (54 percent), 19,641 of Latino people (27 percent), and 8,290 of white people (11 percent). Young black and Latino males between the ages of 14 and 24 accounted for 38 percent of innocent people stopped (27,810 stops).
27
Innocence by Race
INNOCENT STOPS BY RACE, 2014-2017
Figure 21
0
5,000
10,000
15,000
20,000
25,000
30,000
35,000
40,000
39,522 Black
19,641 Latino
8,290 White

28
In addition to accounting for the majority of innocent people stopped, black and Latino people who were innocent were also more likely to be frisked and have force used against them than white people who were innocent. Between 2014 and 2017, 66 percent of innocent black and Latino people were frisked compared with 51 percent of innocent white people, and 25 percent of innocent black and Latino people had force used against them compared with 19 percent of innocent white people.
Figure 22
PROPORTION INNOCENT BY RACE, 2014-2017
0%
20%
40%
60%
80%
100%
80.1%
67.9%
24.6%
81.1%
50.8%
18.6
%
75.0
%
63.1%
26.4%
Black Latino White
Proportion Stopped Innocent
Proportion Innocent Frisked
Proportion Innocent Experienced Force
STOPS OF INNOCENT PEOPLE

29
Additional stop-and-frisk statistics, including data by ranking and data for each precinct, are available at www.nyclu/SF2019.

30
Race data from 2010 Census. Blocks by precinct compiled by John Keefe. Precinct outline by Harry Levine, updated by John Paraskevopoulos.
APPENDIX: NYC PRECINCT MAP (BY RACE)

31
Majority black & Latino resident population
(38 precincts)
Manhattan (22 Precincts)1 Financial District, TriBeCa5 Chinatown, Little Italy6 Greenwich Village, SoHo7 Lower East Side9 East Village10 Chelsea13 Gramercy, Stuyvesant Town14 Midtown South, Times Square, Garment District17 Kipps Bay, Murray Hill, Turtle Bay18 Midtown, Theatre District19 Upper East Side20 Upper West Side (south)22 Central Park23 East Harlem (south)24 Upper West Side (north)25 East Harlem (north)26 Morningside Heights28 Central Harlem (south)30 Manhattanville, West Harlem, Hamilton Heights32 Central Harlem (north)33 Washington Heights (south)34 Washington Heights (north), Inwood
The Bronx (12 precincts) 40 Mott Haven, Melrose 41 Hunts Point42 Morrisania, Crotona Park East43 Soundview, Parkchester44 Concourse, Highbridge45 Throgs Neck, Co-op City, Pelham Bay46 University Heights, Morris Heights, Fordham (south)47 Eastchester, Wakefield, Williamsbridge48 East Tremont, Belmont49 Pelham Parkway, Morris Park, Bronxdale50 Riverdale, Fieldston, Kingsbridge52 Bedford Park, Fordham (north), Norwood
Staten Island (4 precincts) 120 West Brighton, Rosebank121 New Springville, Elm Park122 New Dorp, Great Kills123 Tottenville, Rossville
Not majority black & Latino resident population
(39 precincts)
Brooklyn (23 precincts) 60 Coney Island, Brighton Beach61 Sheepshead Bay62 Bensonhurst63 Mill Basin, Flatlands66 Borough Park, Kensington67 East Flatbush68 Bay Ridge, Dyker Heights69 Canarsie70 Flatbush, Ditmas Park71 Crown Heights (south), Lefferts Gardens72 Sunset Park, Windsor Terrace73 Brownsville, Ocean Hill75 East New York, Starret City76 Red Hook, Carroll Gardens77 Crown Heights (north), Prospect Heights78 Park Slope, Prospect Park79 BedStuy (west)81 BedStuy (east)83 Bushwick84 Brooklyn Heights, DUMBO, Boerum Hill88 Fort Greene, Clinton Hill90 Williamsburg94 Greenpoint
Queens (16 precincts) 100 Rockaway, Broad Channel101 Far Rockaway102 Richmond Hill, Woodhaven, Ozone Park (north)103 Jamaica (south), Hollis104 Ridgewood, Middle Village, Glendale105 Queens Village, Rosedale106 Ozone Park (south), Howard Beach107 Jamaica (north), Fresh Meadows, Hillcrest108 Long Island City (south), Sunnyside, Woodside109 Flushing, Bay Terrace110 Elmhurst, South Corona111 Bayside, Douglaston, Little Neck112 Forest Hills, Rego Park113 St. Albans, Springfield Gardens114 Astoria, Long Island City (north), Rikers Island115 Jackson Heights
Precincts with majority black and Latino residents are underlined.
NYPD Police Precincts

New York Civil Liberties Union
125 Broad St., 19th Floor, New York, NY 10004
(212) 607-3300
www.nyclu.org