
Stocks in Play Support and Resistance€¦ · 3. Manually found Support/Resistance lines...
49
Stocks in Play Support and Resistance ANDREW AZIZ SESSION 2
Transcript of Stocks in Play Support and Resistance€¦ · 3. Manually found Support/Resistance lines...

Stocks in PlaySupport and ResistanceANDREW AZIZ
SESSION 2

How to Find Stocks in PlayANDREW AZIZ

DisclaimerBearBullTraders.com employees, contractors, shareholders and affiliates, are NOT an investment advisory service,
a registered investment advisor or a broker-dealer and does not undertake to advise clients on which securities
they should buy or sell for themselves.
You understand that NO content published as part of the BearBullTraders Room and its Website constitutes a
recommendation that any particular investment, security, portfolio of securities, transaction or investment
strategy is suitable for any specific person.
You further understand that none of the creators or providers of our Services or their affiliates will advise you
personally concerning the nature, potential, value or suitability of any particular investment, security, portfolio of
securities, transaction, investment strategy or other matter.

What is a Stock in Play?
A stock with fresh news
A stock that is up or down more than 2% before the market Open in my Gappers watch list

Gapper Scanner April 17, 2017ATR at least 50 centPremarket volume at least 50,000 shFloat: Max 1B sharesGap up or down at least 2%.

What is a Stock in Play?
…Offers excellent risk/reward setup opportunities
…Is “readable” that is about to trade higher or lower.
…Moves, and moves are predictable, frequent, and catchable.
◦ They respect some indicators: VWAP and Moving Averages.

How to narrow them down?…stock in Gappers scanner that has high volume and clean pre-market activity
…stocks in Gappers scanner that develops important levels which we can trade off of.
Good pre-market volume
Good pre-market price

Good vs Bad Pre-Market Price action
• Good price action pre-market Bad price action pre-market
(looks like a buy-out)

Good vs Bad Pre-Market Price action
Good price action pre-market Bad price action pre-market
(looks like a buy-out)

Really bad price action in pre-market

Example at my DAS chartLet’s look at today’s scanner.

S&P500 ETF = SPY (market behavior)LB stock in play

Support and Resistance Levels
HOW TO F IND THEM

Support and Resistance LevelsI believe market doesn’t know diagonal price levels.
It remembers price levels only, which is why horizontal support or resistance lines make sense,
but diagonal trend lines are subjective and open to self-deception.

If you are in the mood of buying you can draw…

If you are in the mood of selling short you can draw…

What are support and resistance levels?
Support is a price level where buying is strong enough to interrupt or reverse a
downtrend
definition: a horizontal line connecting two or more bottoms (on daily chart).
Resistance is a price level where selling is strong enough to interrupt or reverse
an uptrend.
definition: a horizontal line connecting two or more tops (on daily chart).

How to find Support/Resistance lines?
1. Sophisticated software's like MarketDelta
2. Automatically by DAS for few important levels
3. Manually by traders by evaluating Pre-market and daily charts

1. SoftwaresThere are software to find levels in real time.
Color in time and sales shows traders psychology

OKE chart: Feb 1, 2017.
At support/resistance levels order flow increases, sellers and buyers become more active on bid/ask.Image courtesy of Tevor Harnett at MarketDelta

2. Automatic by DAS
Automatically plotted by DAS:
1. Previous day close
2. Previous days (Y and YY) high, low

PriceMarker: Y High, Y Low, YY High YY Low

From PriceMarker
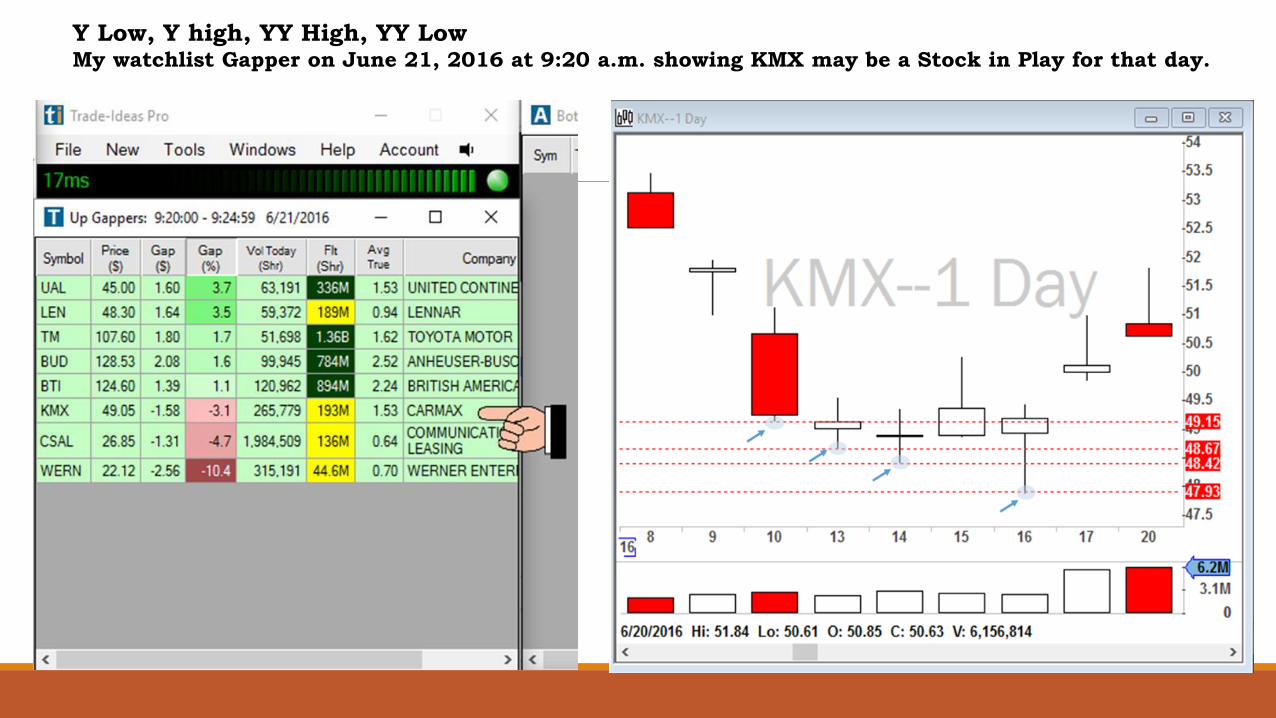
Y Low, Y high, YY High, YY LowMy watchlist Gapper on June 21, 2016 at 9:20 a.m. showing KMX may be a Stock in Play for that day.

Y Low, Y high, YY High, YY Low

Previous Day Closea very strong level.


3. Manually found Support/Resistance linesManually plotted by trader:
1. Clear pre-market levels
2. Moving Averages on 5 min and daily charts(Higher moving averages are stronger 200 >>50>>20>>9….)
(Higher time frames are stronger Daily >> 5min >> 1min)
3. Extreme prices (wicks) on daily chart where price bounced(More bounce from a level on daily chart, is stronger that level)

3.1. Pre-Market Levels

Same Pre-Market Levels after the Open
Market Open

3.1. Pre-Market Levels
Market Open

3.1. Pre-Market Levels

3.2. Daily Moving Averages
9 EMA
20 EMA
50 SMA

3.2. Daily Moving Averages


3.3. Manually by trader from Daily charts.
• Extreme price levels on daily chart that price reversed direction from that day.
• The price must have a clear bounce from that level. (If you are not certain, it is probably not a support or resistance level.)
• The more of a line that is touching extreme price lines, the more that the line is a better support or resistance and has more value. Give that line more emphasis.
• Support or resistance lines are actually an “area” and not exact numbers.
• You should always look at the recent data to draw lines.

3.3. Daily Levels from Chart
Extreme price level: for day trading
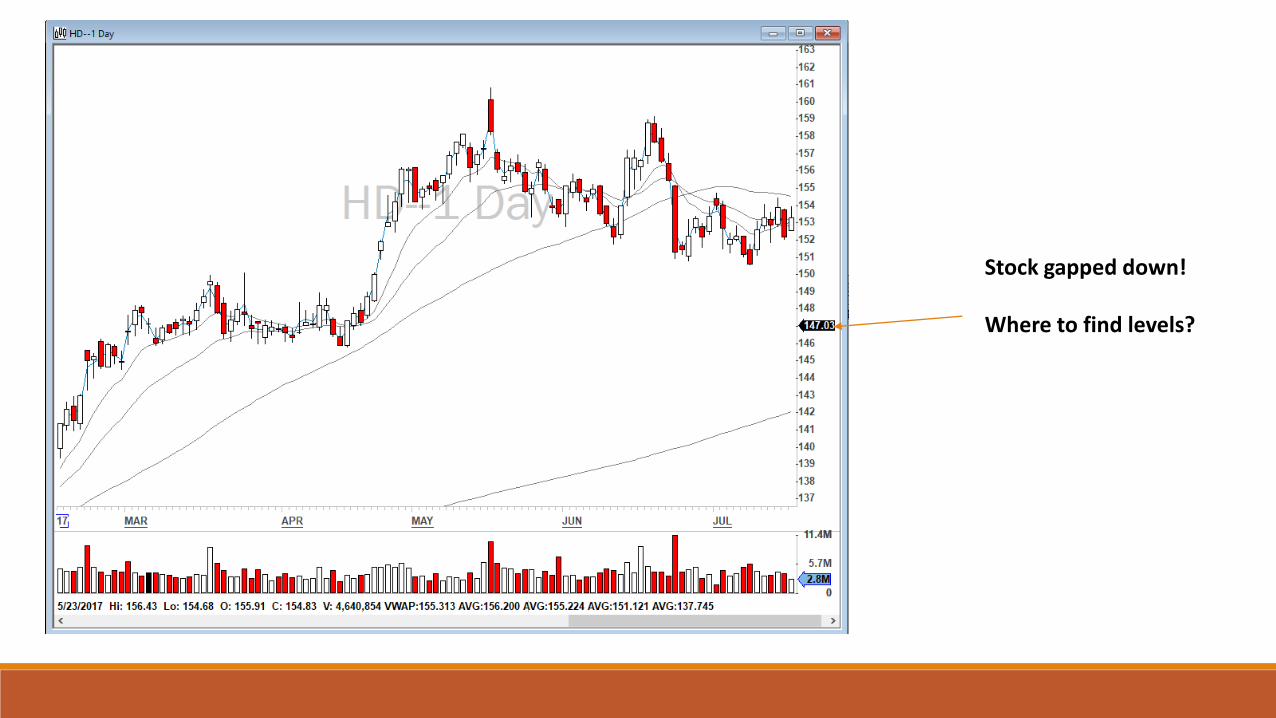
Stock gapped down!
Where to find levels?

Stock gapped down!
Where to find levels?


Examples live…

Thank you.


NOTE:
Important support or resistance levels on daily charts stand out. They shout at you: “grab me by the face”.
For day trading, it is better to draw support or resistance lines across the extreme prices or wicks on daily levels rather than across areas where the bulk of the bars stopped.

3. Manually found Support/Resistance lines
Half-dollars and whole dollars usually act at a support or resistance level, especially in lower than $10 stocks.
(If you don’t find a support or resistance line around these numbers on daily charts, remember that in day trading these numbers can act as an invisible support or resistance line.)
Important support or resistance levels on daily charts stand out. They shout at you: “grab me by the face”.
For day trading, it is better to draw support or resistance lines across the extreme prices or wicks on daily levels rather than across areas where the bulk of the bars stopped.

Minor support or resistance causes trends to pause
Major support or resistance causes them to reverse.
Traders buy at support and sell at resistance, making their effectiveness a self-fulfilling prophecy.
For example:
If you are a buyer, would you buy a stock that is selling off? NO!
◦ You wait until next level of support and then buy (to minimize the entry price)
If you are a seller, would you sell a stock that is rallying up? NO!
◦ You wait until next level of resistance and then sell (to maximize the exit price).


